Embed Size (px)
Citation preview
Please refer to Disclosures and Disclaimers at the end of the Research Report.
Pharmaceuticals Value growth ahead
27 November 2013PhillipCapital (India) Pvt. Ltd.
US generics to remain as important driver as earlier The Indian Pharma delivered a stellar growth performance led by robust US generics sales (>40% CAGR, 33% CAGR on constant currency) supported by the patent cliff and Rupee depreciation (18%) over last three years. Going ahead, the low market share of Indian pharma (~10%) in US generics despite dominant share in US fillings (~35% in DMFs and ~30% in ANDAs), improving prescription share and quality fillings will drive future growth. We estimate the US revenue (~ 36% of total sales) of our covered generics peers to see 24% CAGR over FY13‐15E.
Qualitative upgrade in US fillings is the key Post the patent cliff in 2012, we believe the enhanced R&D (22% CAGR in R&D spend over last three years by our covered stocks) focus of Indian peers towards differentiated generics and technology driven drugs covering – specialty/complex injectables, hormones, inhalers, biosimilars etc would ensure sustainable value growth in US generics.
Domestic formulations to maintain resilience We believe the adverse impact of new pricing policy on domestic formulations is momentary and would temporarily depress the growth momentum in FY14. However, we expect domestic formulations to show resilience Q4FY14 onwards and deliver an annual growth momentum of 15‐18% which will be led by a continued trend of new product introductions, enhanced focus towards chronic portfolio and therapeutic focused market.
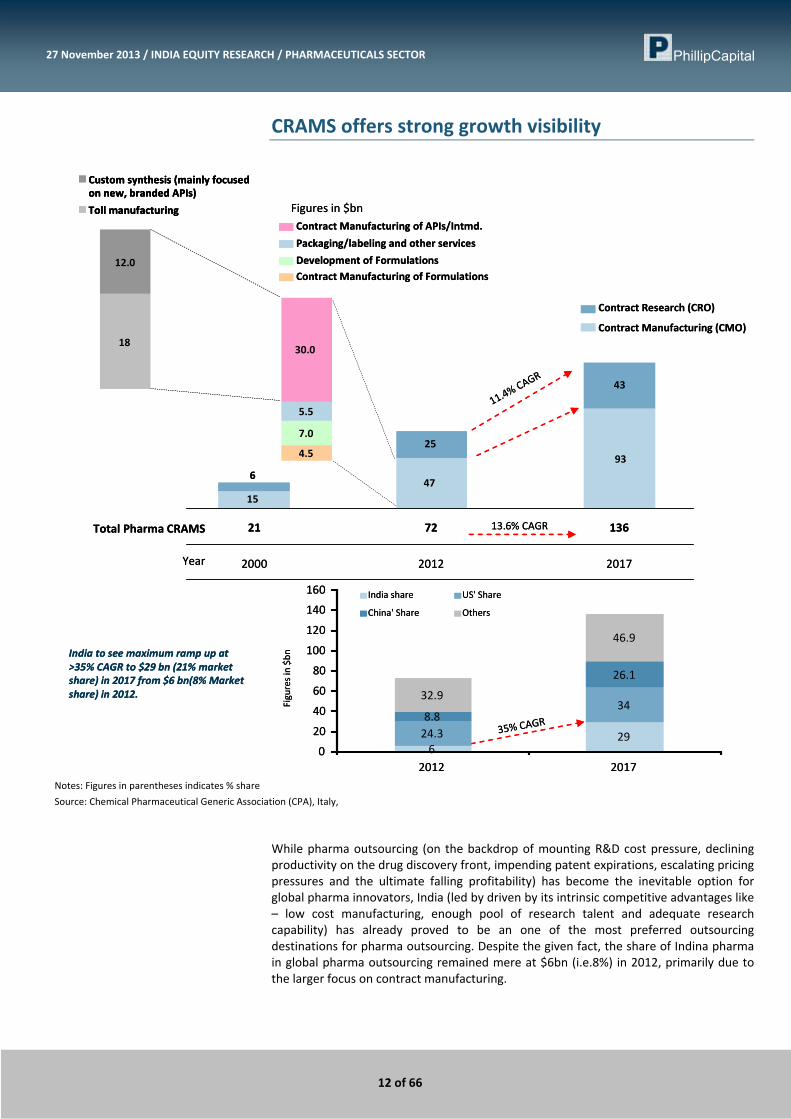
Opportunities in pharma CRAMS seems robust for Indian Pharma As per the study of Italy based Chemical Pharmaceutical Generic Association (CPA), the global pharma out sourcing to grow at 14% CAGR over FY12‐17 to $136bn and India to see maximum ramp up at >35% CAGR to $29bn (21% market share) in 2017 from $6 bn(8% Market share) in 2012. Divis, Dr Reddy and Biocon with a strong clientele are well placed to grab the benefits of this huge opportunity ahead.
Premium valuations for Indian Pharma to sustain led by value growth ahead Indian Pharma (BSE Healthcare index) currently trades at its historic average 1 year PE multiple of ~20x and ~40% premium to benchmark index. We believe the sector will continue to maintain its premium valuations led by continued visibility for healthy formulation exports growth, robust free cash flow generation and qualitative upgrade in R&D capabilities for product/service offerings.
Mid caps to outperform Sector leaders While we maintain our optimism on Indian Pharma Leaders backed by their expanded qualitative drug pipeline and balance sheet strength, multiple earning surprises in the recent past have stretched their valuations. Hence, we prefer Midcaps delivering steady progress in operational as well as financial performance.
Our sector top picks are Dr Reddy (+16%), Aurobindo Pharma (+55%) and Biocon (+28%). Other buy recommendations are Glenmark (+27%) and Divs (20%).
Companies Covered Aurobindo Pharma CMP Rs293Reco BUYTarget Price Rs455 Biocon CMP Rs372Reco BUYTarget Price Rs475 Cadila Healthcare CMP Rs742Reco NEUTRALTarget Price Rs761 Divi’s Lab CMP Rs1163Reco BUYTarget Price Rs1390 Dr Reddy CMP Rs2407Reco BUYTarget Price Rs2800 Glenmark Pharma CMP Rs504Reco BUYTarget Price Rs641 IPCA Lab CMP Rs681Reco NEUTRALTarget Price Rs752 Lupin CMP Rs864Reco NEUTRALTarget Price Rs923 Sun Pharma CMP Rs573Reco NEUTRALTarget Price Rs605 Report priced as of 26 November 2013 Surya Patra (+ 9122 6667 9768) [email protected]
2 of 66
27 November 2013 / INDIA EQUITY RESEARCH / PHARMACEUTICALS SECTOR
Table of Contents US generics to remain as important driver as earlier∙∙∙∙∙∙∙∙∙∙∙∙∙∙∙∙∙∙∙∙∙∙∙∙∙∙∙∙∙∙∙∙∙∙∙∙∙∙∙∙∙∙∙∙∙∙∙∙∙ 3
Strategic Shift in Fillings to improve the quality of income ∙∙∙∙∙∙∙∙∙∙∙∙∙∙∙∙∙∙∙∙∙∙∙∙∙∙∙∙∙∙∙∙∙ 5
US patent cliff is behind us but peak patent expiry opportunities in
advanced markets yet to follow ∙∙∙∙∙∙∙∙∙∙∙∙∙∙∙∙∙∙∙∙∙∙∙∙∙∙∙∙∙∙∙∙∙∙∙∙∙∙∙∙∙∙∙∙∙∙∙∙∙∙∙∙∙∙∙∙∙∙∙∙∙∙∙∙∙∙∙∙∙∙∙∙ 7
Domestic formulations to maintain its resilience ∙∙∙∙∙∙∙∙∙∙∙∙∙∙∙∙∙∙∙∙∙∙∙∙∙∙∙∙∙∙∙∙∙∙∙∙∙∙∙∙∙∙∙∙∙∙∙∙∙∙∙∙∙∙ 8
Emerging markets ‐ Offers growth visibility albeit diverse complexities ∙∙∙∙∙∙∙∙∙∙∙∙∙∙∙∙ 10
CRAMS offers strong growth visibility ∙∙∙∙∙∙∙∙∙∙∙∙∙∙∙∙∙∙∙∙∙∙∙∙∙∙∙∙∙∙∙∙∙∙∙∙∙∙∙∙∙∙∙∙∙∙∙∙∙∙∙∙∙∙∙∙∙∙∙∙∙∙∙∙∙∙∙∙∙∙ 12
Indian Pharma trades at historic average valuation multiples∙∙∙∙∙∙∙∙∙∙∙∙∙∙∙∙∙∙∙∙∙∙∙∙∙∙∙∙∙∙∙∙∙∙∙ 14
Companies Section Aurobindo Pharma ∙∙∙∙∙∙∙∙∙∙∙∙∙∙∙∙∙∙∙∙∙∙∙∙∙∙∙∙∙∙∙∙∙∙∙∙∙∙∙∙∙∙∙∙∙∙∙∙∙∙∙∙∙∙∙∙∙∙∙∙∙∙∙∙∙∙∙∙∙∙∙∙∙∙∙∙∙∙∙∙∙∙∙∙∙∙∙∙∙∙∙∙∙∙∙∙∙∙∙ 19
Biocon ∙∙∙∙∙∙∙∙∙∙∙∙∙∙∙∙∙∙∙∙∙∙∙∙∙∙∙∙∙∙∙∙∙∙∙∙∙∙∙∙∙∙∙∙∙∙∙∙∙∙∙∙∙∙∙∙∙∙∙∙∙∙∙∙∙∙∙∙∙∙∙∙∙∙∙∙∙∙∙∙∙∙∙∙∙∙∙∙∙∙∙∙∙∙∙∙∙∙∙∙∙∙∙∙∙∙∙∙∙∙∙∙∙∙∙∙∙∙∙ 24
Cadila ∙∙∙∙∙∙∙∙∙∙∙∙∙∙∙∙∙∙∙∙∙∙∙∙∙∙∙∙∙∙∙∙∙∙∙∙∙∙∙∙∙∙∙∙∙∙∙∙∙∙∙∙∙∙∙∙∙∙∙∙∙∙∙∙∙∙∙∙∙∙∙∙∙∙∙∙∙∙∙∙∙∙∙∙∙∙∙∙∙∙∙∙∙∙∙∙∙∙∙∙∙∙∙∙∙∙∙∙∙∙∙∙∙∙∙∙∙∙∙∙ 30
Divi’s Lab ∙∙∙∙∙∙∙∙∙∙∙∙∙∙∙∙∙∙∙∙∙∙∙∙∙∙∙∙∙∙∙∙∙∙∙∙∙∙∙∙∙∙∙∙∙∙∙∙∙∙∙∙∙∙∙∙∙∙∙∙∙∙∙∙∙∙∙∙∙∙∙∙∙∙∙∙∙∙∙∙∙∙∙∙∙∙∙∙∙∙∙∙∙∙∙∙∙∙∙∙∙∙∙∙∙∙∙∙∙∙∙∙∙∙∙ 35
Dr Reddy’s Lab ∙∙∙∙∙∙∙∙∙∙∙∙∙∙∙∙∙∙∙∙∙∙∙∙∙∙∙∙∙∙∙∙∙∙∙∙∙∙∙∙∙∙∙∙∙∙∙∙∙∙∙∙∙∙∙∙∙∙∙∙∙∙∙∙∙∙∙∙∙∙∙∙∙∙∙∙∙∙∙∙∙∙∙∙∙∙∙∙∙∙∙∙∙∙∙∙∙∙∙∙∙∙∙∙∙∙∙ 39
Glenmark ∙∙∙∙∙∙∙∙∙∙∙∙∙∙∙∙∙∙∙∙∙∙∙∙∙∙∙∙∙∙∙∙∙∙∙∙∙∙∙∙∙∙∙∙∙∙∙∙∙∙∙∙∙∙∙∙∙∙∙∙∙∙∙∙∙∙∙∙∙∙∙∙∙∙∙∙∙∙∙∙∙∙∙∙∙∙∙∙∙∙∙∙∙∙∙∙∙∙∙∙∙∙∙∙∙∙∙∙∙∙∙∙∙∙ 44
IPCA ∙∙∙∙∙∙∙∙∙∙∙∙∙∙∙∙∙∙∙∙∙∙∙∙∙∙∙∙∙∙∙∙∙∙∙∙∙∙∙∙∙∙∙∙∙∙∙∙∙∙∙∙∙∙∙∙∙∙∙∙∙∙∙∙∙∙∙∙∙∙∙∙∙∙∙∙∙∙∙∙∙∙∙∙∙∙∙∙∙∙∙∙∙∙∙∙∙∙∙∙∙∙∙∙∙∙∙∙∙∙∙∙∙∙∙∙∙∙∙∙∙∙ 49
Lupin ∙∙∙∙∙∙∙∙∙∙∙∙∙∙∙∙∙∙∙∙∙∙∙∙∙∙∙∙∙∙∙∙∙∙∙∙∙∙∙∙∙∙∙∙∙∙∙∙∙∙∙∙∙∙∙∙∙∙∙∙∙∙∙∙∙∙∙∙∙∙∙∙∙∙∙∙∙∙∙∙∙∙∙∙∙∙∙∙∙∙∙∙∙∙∙∙∙∙∙∙∙∙∙∙∙∙∙∙∙∙∙∙∙∙∙∙∙∙∙∙∙ 54
Sun Pharma ∙∙∙∙∙∙∙∙∙∙∙∙∙∙∙∙∙∙∙∙∙∙∙∙∙∙∙∙∙∙∙∙∙∙∙∙∙∙∙∙∙∙∙∙∙∙∙∙∙∙∙∙∙∙∙∙∙∙∙∙∙∙∙∙∙∙∙∙∙∙∙∙∙∙∙∙∙∙∙∙∙∙∙∙∙∙∙∙∙∙∙∙∙∙∙∙∙∙∙∙∙∙∙∙∙∙∙∙∙ 60

3 of 66
27 November 2013 / INDIA EQUITY RESEARCH / PHARMACEUTICALS SECTOR
US Generics to remain key growth driver as earlier Indian Pharma delivered a stellar growth performance led by robust US generics sales supported by the patent cliff over last three years. Additionally, the depreciating Rupee against US Dollar has further facilitated the growth momentum. In fact, our coverage stocks delivered a compounded annual growth of 40% over FY11‐FY13 to Rs 188bn.
Patent cliff coupled with Rupee depreciation strengthened Indian Pharma performance
64.1 68.192.6
128.9
188.5
0
40
80
120
160
200
FY2009 FY2010 FY2011 FY2012 FY2013
Gross US Generic Sales of our covered stocks (Rs Bn)
40%
4.3
40.8
30.7 30.4
6.2
36.039.2
46.2
‐10
0
10
20
30
40
50
FY2010 FY2011 FY2012 FY2013
% Growth in US Generic Sales in $ mn% Growth in US Generic Sales in Rs mn% of Re depreciation
Source: PhillipCapital India Research
US generics to remain a key growth driver despite Patent cliff: US Patent cliff during 2012 has certainly overpowered the growth of Indian Pharma in over last three years and there may be moderation in the patent expiry cycle. However, the relatively low share of Indian companies in the US generics market implies good long‐term potential. Patent Expiry trend of blockbuster drugs in US
1916
19 20
35
15
1922
17
0
5
10
15
20
25
30
35
40
2008 2009 2010 2011 2012 2013 2014 2015 2016
Gross value of patents expiries ($ bn)
Linear (Gross value of patents expiries ($ bn) )
Source: Company, USFDA
Despite having a dominant share in US DMFs fillings (~35%) and ANDA fillings (~30%) and most cost effective generic offering, the generic market share of Indian pharma is still low at ~10%.

4 of 66
27 November 2013 / INDIA EQUITY RESEARCH / PHARMACEUTICALS SECTOR
Steady rising dominance of Indian Pharma in US generics space both in terms of drug fillings and prescription market share
308.7
381.3450.1
534.2
644
0
100
200
300
400
500
600
700
2008 2009 2010 2011 2012
0
2
4
6
8
10
12
14
16
18
Cumulative Prescription count by top 8 Indian peers in US (M n Nos)
Share of top 8 Indian Peers in to tal Rx in US
425 433 437490
311
105 94 103 11484
0
100
200
300
400
500
600
2009 2010 2011 2012 YTD 2013
15
17
19
21
23
25
27
29
Total ANDA Approvals (Nos.)ANDA approvals for Indian peers(Nos.)% Share of India (RHS)
Source: USFDA, IMS Health, PhillipCapital India Research
Going ahead, we expect the strong ANDA pipeline as well as enhanced focus towards development and filling of niche/complex/differentiated generics by leading Indian pharma peers and increased demand for cost effective generics (forte of Indian peers) will drive increased generic market share and ultimate growth for Indian Pharma. Positioning of US generic players in terms of pending ANDA pipeline
325
190172
143 133110 99 91
72 62 53 44 41
0
50
100
150
200
250
300
350
Mylan
Actavis
Sandoz
Teva Su
n
Aurobindo
Cadila
Lupin
Par
Dr Reddy
Glenmark
Impax
Apotex
Source: Hikma presentation, PhillipCapital India Research
Strong Pipeline of ANDAs by Indian Peers Pending ANDA fillings Total ANDA Pending Para IV Target ANDA p.a. Remarks
Sun Pharma 453 133 30 25‐30 Majority of future pipeline is differentiated and technology driven drugs Dr Reddy 201 65 38 20 70% of future generic is differentiated Lupin 177 91 86 ~25 Majority of current and future pipeline is niche generics Cadila 160 89 12 30 ~20% of the pending fillings are differentiated Glenmark 140 53 26 20 Key focus being limited completion drugs in hormones, derma, Oncology Aurobindo 281 110 10 30‐35 30% of pending ANDAs are injectables and over 50% of future filling would
be injectables covering opthalmics, oncology and penems IPCA 37 20 0 12‐15 Complete backward integration & optimal process development is key
Source: Company, PhillipCapital India Research
5 of 66
27 November 2013 / INDIA EQUITY RESEARCH / PHARMACEUTICALS SECTOR
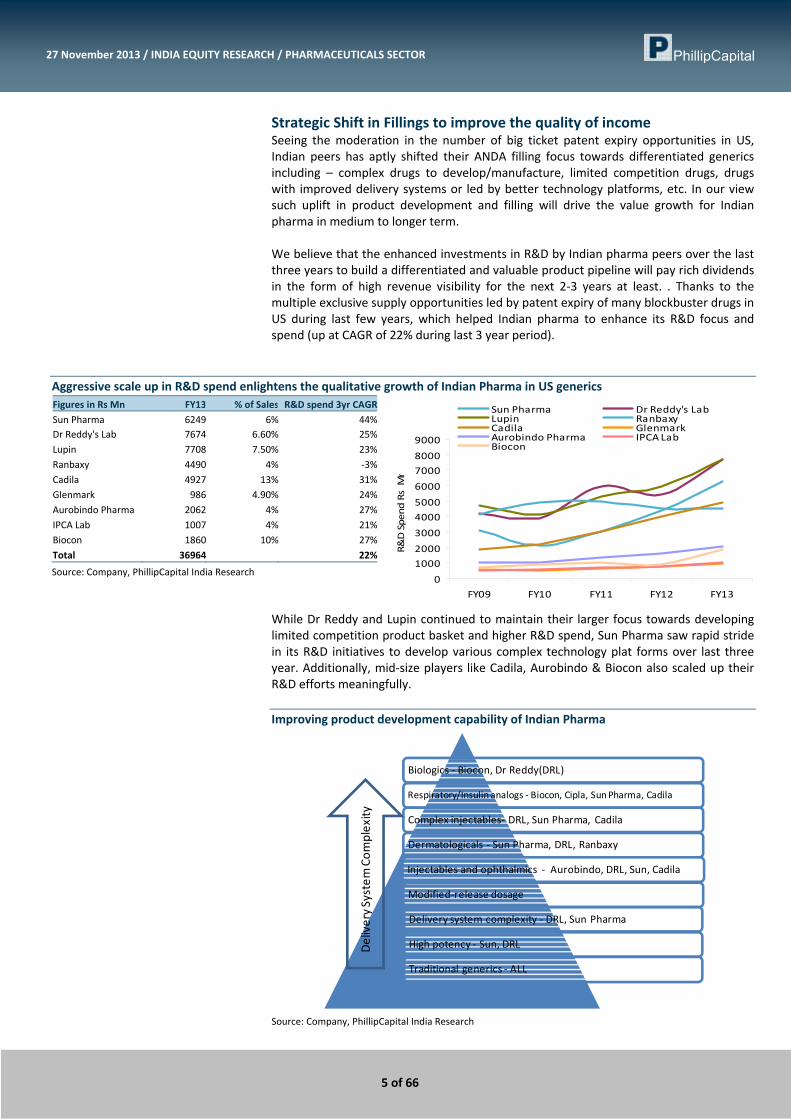
Strategic Shift in Fillings to improve the quality of income Seeing the moderation in the number of big ticket patent expiry opportunities in US, Indian peers has aptly shifted their ANDA filling focus towards differentiated generics including – complex drugs to develop/manufacture, limited competition drugs, drugs with improved delivery systems or led by better technology platforms, etc. In our view such uplift in product development and filling will drive the value growth for Indian pharma in medium to longer term. We believe that the enhanced investments in R&D by Indian pharma peers over the last three years to build a differentiated and valuable product pipeline will pay rich dividends in the form of high revenue visibility for the next 2‐3 years at least. . Thanks to the multiple exclusive supply opportunities led by patent expiry of many blockbuster drugs in US during last few years, which helped Indian pharma to enhance its R&D focus and spend (up at CAGR of 22% during last 3 year period).
Aggressive scale up in R&D spend enlightens the qualitative growth of Indian Pharma in US generics Figures in Rs Mn FY13 % of Sales R&D spend 3yr CAGRSun Pharma 6249 6% 44%Dr Reddy's Lab 7674 6.60% 25%Lupin 7708 7.50% 23%Ranbaxy 4490 4% ‐3%Cadila 4927 13% 31%Glenmark 986 4.90% 24%Aurobindo Pharma 2062 4% 27%IPCA Lab 1007 4% 21%Biocon 1860 10% 27%Total 36964 22%
Source: Company, PhillipCapital India Research
While Dr Reddy and Lupin continued to maintain their larger focus towards developing limited competition product basket and higher R&D spend, Sun Pharma saw rapid stride in its R&D initiatives to develop various complex technology plat forms over last three year. Additionally, mid‐size players like Cadila, Aurobindo & Biocon also scaled up their R&D efforts meaningfully. Improving product development capability of Indian Pharma
Biologics ‐ Biocon, Dr Reddy(DRL)
Respiratory/Insulin analogs ‐ Biocon, Cipla, Sun Pharma, Cadila
Complex injectables‐ DRL, Sun Pharma, Cadila
Dermatologicals ‐ Sun Pharma, DRL, Ranbaxy
Injectables and ophthalmics ‐ Aurobindo, DRL, Sun, Cadila
Modified‐release dosage
Delivery system complexity ‐ DRL, Sun Pharma
High potency ‐ Sun, DRL
Traditional generics ‐ ALL
Delivery System
Com
plexity
Source: Company, PhillipCapital India Research
0
1000
2000
3000
4000
5000
6000
7000
8000
9000
FY09 FY10 FY11 FY12 FY13
Sun Pharma Dr Reddy's LabLupin RanbaxyCadila GlenmarkAurobindo Pharma IPCA LabBiocon
R&D Spend Rs Mn

6 of 66
27 November 2013 / INDIA EQUITY RESEARCH / PHARMACEUTICALS SECTOR
Implementation of GDUFA in US could result in volume growth; Could lead to intense price competition for plain vanilla generics: US Food and Drug Administration has implemented the Generic Drug User Fee Act (GDUFA) On Oct. 1, 2012 with an objective of clearing the clearing the backlog of pending ANDA/drug approvals of over 2700 ANDAs and expediting the approval (both drug and facility) timeline.
Steady rising backlog of pending ANDAs… …extended ANDA Approval timeline beyond 30 months
891
1216 13091441
16301912
2500
29333054
0
500
1000
1500
2000
2500
3000
3500
2005 2006 2007 2008 2009 2010 2011 2012 2013
No of ANDAs
16 1719
22
27 2830
0
5
10
15
20
25
30
35
2006 2007 2008 2009 2010 2011 2012
Months
Source: USFDA
The set goal of GDUFA relating to ANDA backlog clearing Period of filling No of ANDAs Goal
Backlog till 1st Oct 2012 ~2700 90% (i.e.~ 2340)of backlog to be reviewed & approved by end of FY17
Filling during FY13 1013
Filling during FY14 1063
Focus is to expedite review of 1) Paragraph IV filed on the day 1 of NCE exclusivity,
2) Shortage based drugs applications
Filling during FY15 1063 60% (i.e. ~600) to be reviewed & approved in 15months period of submission
Filling during FY16 1010 75% (i.e. ~750) to be reviewed & approved in 15months period of submission
Filling during FY17 959 90% (i.e.~850) to be reviewed & approved in 10 months period of submission
Source: USFDA
As per the set GDUFA target, USFDA to clear 90% of pending ANDAs as of 1st Oct 2012 (i.e about 2700) and a majority of ANDA fillings over FY13‐17 will be reviewed and approved by FY17. This indicates over 5000 ANDAs will be reviewed and approved over a period of 5 years (i.e FY13 to FY17), which implys about over 1000 ANDAs per annum compared to about 450 annual ANDA approval over last five years. Thus the doubling rate of ANDA approvals could result in a substantial volume growth in plain vanilla US generics as we believe a major chunk of current ANDA back log is plain vanilla. This could result in more price competition. However, we believe the GDUFA implementation will favour Indian Pharma on two grounds like 1) it will reduce approval timeline of recently filled complex and limited competition drugs basket and 2) helps Indian pharma to grab better market share due to its cost competency and dominance in the share of fillings. Finally, We estimate our covered stocks would maintain a steady constant currency growth of 18% over FY13‐15 led by strong ANDA pipeline coupled with rising share of complex and differentiated generics despite a significantly high base. More specifically, we believe Sun Pharma, Dr Reddy, Lupin and Aurobindo would outpace the industry growth.
7 of 66
27 November 2013 / INDIA EQUITY RESEARCH / PHARMACEUTICALS SECTOR
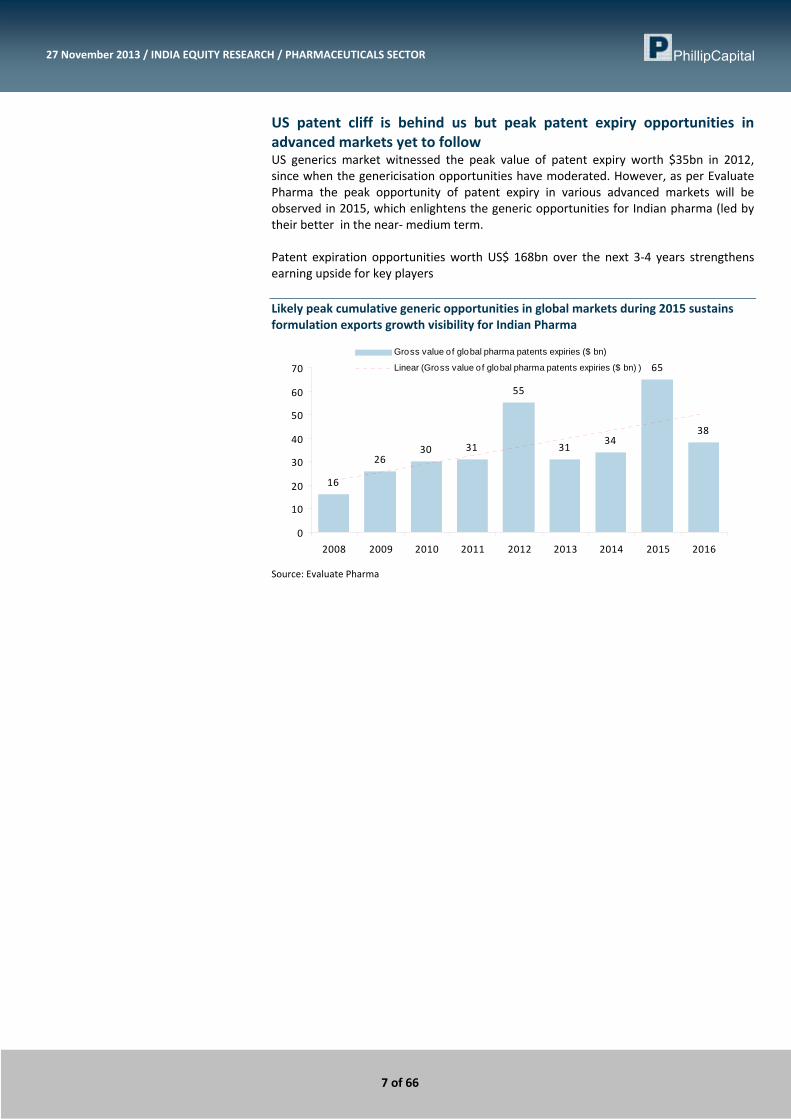
US patent cliff is behind us but peak patent expiry opportunities in advanced markets yet to follow US generics market witnessed the peak value of patent expiry worth $35bn in 2012, since when the genericisation opportunities have moderated. However, as per Evaluate Pharma the peak opportunity of patent expiry in various advanced markets will be observed in 2015, which enlightens the generic opportunities for Indian pharma (led by their better in the near‐ medium term. Patent expiration opportunities worth US$ 168bn over the next 3‐4 years strengthens earning upside for key players Likely peak cumulative generic opportunities in global markets during 2015 sustains formulation exports growth visibility for Indian Pharma
16
2630 31
55
3134
65
38
0
10
20
30
40
50
60
70
2008 2009 2010 2011 2012 2013 2014 2015 2016
Gross value of global pharma patents expiries ($ bn)
Linear (Gross value of global pharma patents expiries ($ bn) )
Source: Evaluate Pharma
8 of 66
27 November 2013 / INDIA EQUITY RESEARCH / PHARMACEUTICALS SECTOR
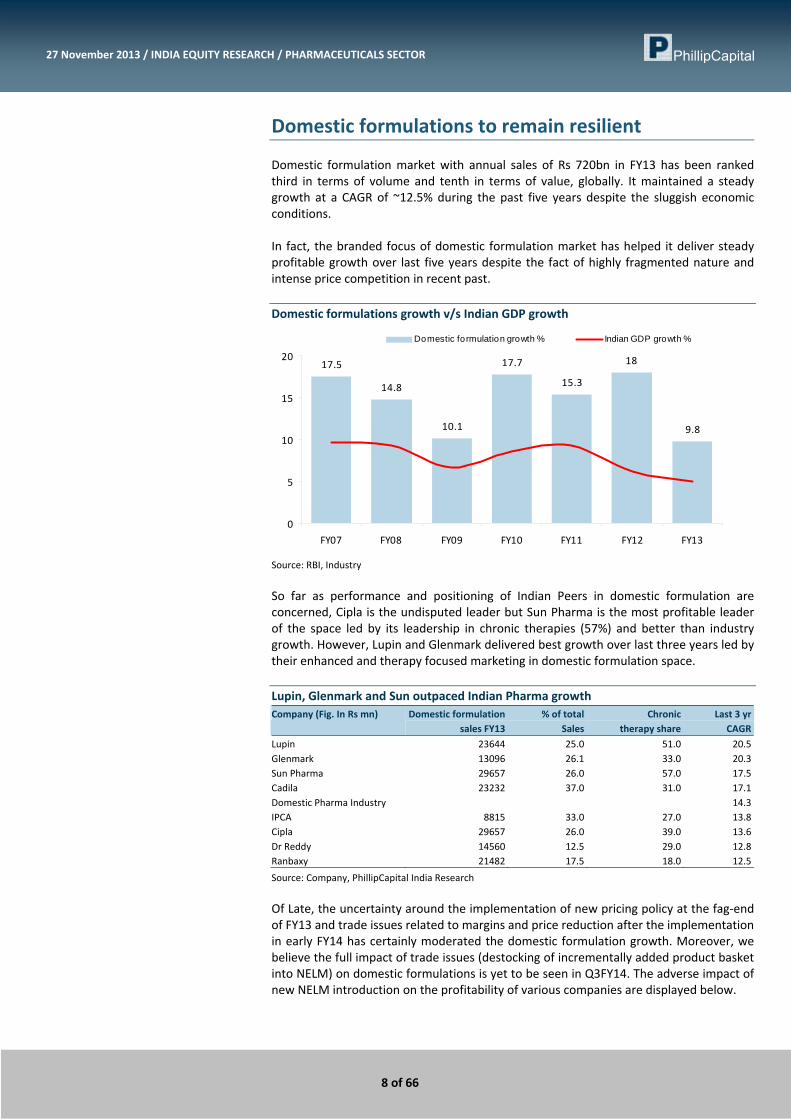
Domestic formulations to remain resilient Domestic formulation market with annual sales of Rs 720bn in FY13 has been ranked third in terms of volume and tenth in terms of value, globally. It maintained a steady growth at a CAGR of ~12.5% during the past five years despite the sluggish economic conditions. In fact, the branded focus of domestic formulation market has helped it deliver steady profitable growth over last five years despite the fact of highly fragmented nature and intense price competition in recent past. Domestic formulations growth v/s Indian GDP growth
17.5
14.8
10.1
17.7
15.3
18
9.8
0
5
10
15
20
FY07 FY08 FY09 FY10 FY11 FY12 FY13
Domestic formulation growth % Indian GDP growth %
Source: RBI, Industry
So far as performance and positioning of Indian Peers in domestic formulation are concerned, Cipla is the undisputed leader but Sun Pharma is the most profitable leader of the space led by its leadership in chronic therapies (57%) and better than industry growth. However, Lupin and Glenmark delivered best growth over last three years led by their enhanced and therapy focused marketing in domestic formulation space. Lupin, Glenmark and Sun outpaced Indian Pharma growth Company (Fig. In Rs mn) Domestic formulation
sales FY13% of total
Sales Chronic
therapy shareLast 3 yr
CAGR
Lupin 23644 25.0 51.0 20.5Glenmark 13096 26.1 33.0 20.3Sun Pharma 29657 26.0 57.0 17.5Cadila 23232 37.0 31.0 17.1Domestic Pharma Industry 14.3IPCA 8815 33.0 27.0 13.8Cipla 29657 26.0 39.0 13.6Dr Reddy 14560 12.5 29.0 12.8Ranbaxy 21482 17.5 18.0 12.5
Source: Company, PhillipCapital India Research
Of Late, the uncertainty around the implementation of new pricing policy at the fag‐end of FY13 and trade issues related to margins and price reduction after the implementation in early FY14 has certainly moderated the domestic formulation growth. Moreover, we believe the full impact of trade issues (destocking of incrementally added product basket into NELM) on domestic formulations is yet to be seen in Q3FY14. The adverse impact of new NELM introduction on the profitability of various companies are displayed below.

9 of 66
27 November 2013 / INDIA EQUITY RESEARCH / PHARMACEUTICALS SECTOR
Impact of new pricing policy on Indian Pharma Company Domestic formulation
sales FY13Price
impact %Absolute revenue
loss (Rs mn)Impact on FY14
Margin%
Cipla 36813 3.0 1104 130bpsCadila 23232 3.9 900 120bpsLupin 23644 2.0 470 50bpsIPCA 8815 1.7 150 50bpsDr Reddy 14560 3.0 440 40bpsSun Pharma 29657 1.7 500 30bpsGlenmark 13096 0.5 65 20bps
Source: Company, PhillipCapital India Research
In our view, Cipla and Cadila due to their relatively larger share of revenue from domestic formulation and that too from acute therapies would see maximum adverse impact on their profitability. Given the fact and relatively slow growth in acute therapy drug basket, we believe Cipla and Cadila might underperform the domestic formulation industry growth in near future. Chronic therapies outpace acute therapies in growth
18.9
15.814.5
12.9 12.7 12.6 12.6 11.6 11 10.4 9.9
02468
101214161820
Diabetes
Cardiac
Neuropathy
Derma
Gynaecology
Industry
Gastro
Anti invective
Pain Mgt.
Respiratory
Vitamins
Growth (%
)
Source: Sun Pharma AR
Sun leads in domestic pharma in terms of prescription share
Source: Sun Pharma AR
However, we believe the above mentioned adverse impact of new pricing policy is just a momentary for just FY14 and would depress the growth momentum of Indian Pharma in FY14. More specifically, we expect domestic formulations to show its resilience Q4FY14 onwards and deliver an annual growth momentum of 15‐18% which will be led by continued trend of new product introductions, enhanced focus towards chronic portfolio, therapeutic focused market. Also, the Indian macro factors like – 1) rising healthcare spend, 2) rising income levels, 3) rapid urbanisation and 4) steady progressing health insurance penetration would maintain the continued growth momentum.
10 of 66
27 November 2013 / INDIA EQUITY RESEARCH / PHARMACEUTICALS SECTOR
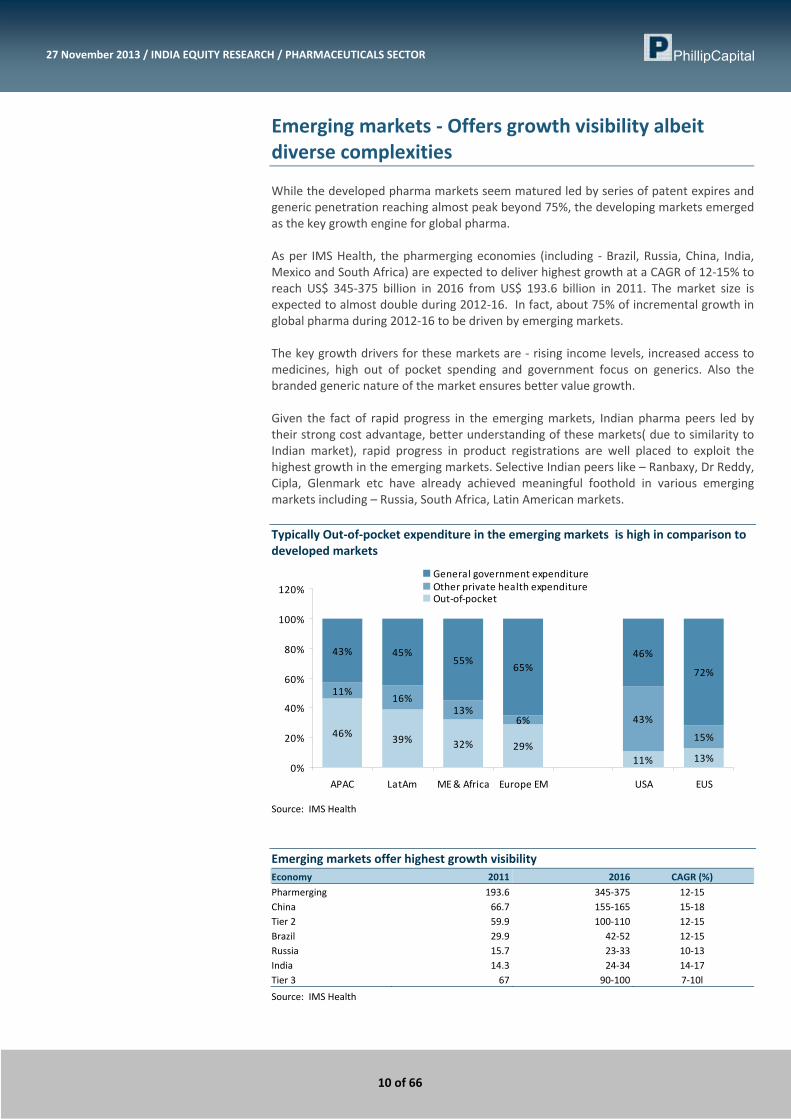
Emerging markets ‐ Offers growth visibility albeit diverse complexities While the developed pharma markets seem matured led by series of patent expires and generic penetration reaching almost peak beyond 75%, the developing markets emerged as the key growth engine for global pharma. As per IMS Health, the pharmerging economies (including ‐ Brazil, Russia, China, India, Mexico and South Africa) are expected to deliver highest growth at a CAGR of 12‐15% to reach US$ 345‐375 billion in 2016 from US$ 193.6 billion in 2011. The market size is expected to almost double during 2012‐16. In fact, about 75% of incremental growth in global pharma during 2012‐16 to be driven by emerging markets. The key growth drivers for these markets are ‐ rising income levels, increased access to medicines, high out of pocket spending and government focus on generics. Also the branded generic nature of the market ensures better value growth. Given the fact of rapid progress in the emerging markets, Indian pharma peers led by their strong cost advantage, better understanding of these markets( due to similarity to Indian market), rapid progress in product registrations are well placed to exploit the highest growth in the emerging markets. Selective Indian peers like – Ranbaxy, Dr Reddy, Cipla, Glenmark etc have already achieved meaningful foothold in various emerging markets including – Russia, South Africa, Latin American markets. Typically Out‐of‐pocket expenditure in the emerging markets is high in comparison to developed markets
46% 39% 32% 29%11% 13%
11%16%
13%6% 43%
15%
43% 45%55%
65%46%
72%
0%
20%
40%
60%
80%
100%
120%
APAC LatAm ME & Africa Europe EM USA EUS
General government expenditureOther private health expenditureOut‐of‐pocket
Source: IMS Health
Emerging markets offer highest growth visibility Economy 2011 2016 CAGR (%)
Pharmerging 193.6 345‐375 12‐15 China 66.7 155‐165 15‐18 Tier 2 59.9 100‐110 12‐15 Brazil 29.9 42‐52 12‐15 Russia 15.7 23‐33 10‐13 India 14.3 24‐34 14‐17 Tier 3 67 90‐100 7‐10l
Source: IMS Health
11 of 66
27 November 2013 / INDIA EQUITY RESEARCH / PHARMACEUTICALS SECTOR
While there is strong growth visibility for emerging markets, the varying business dynamics of different markets are the key challenge for pharma peers. Though, the local conditions vary by country, the core challenges remain broadly comparable: • understanding stakeholders and their changing needs • political, economic, and intellectual property risk • immature regulatory frameworks • launching new products • finding the right partners/distributors Hence, in order to tackle the unknown challenges and to capture the maximum growth opportunity in the emerging markets most of Indian peers have adopted partnership model. The key emerging market alliances by India pharma peers are – Dr Reddy‐Glaxo, Sun Pharma‐Merck, Cipla‐Dr Reddy, Cadila Healthcare – Abbott etc. Going ahead, we expect Indian pharma peers led by their cost competitiveness, rapid drug registrations and alliances to outpace industry growth and grow in the range on 18‐20% in near future.
12 of 66
27 November 2013 / INDIA EQUITY RESEARCH / PHARMACEUTICALS SECTOR
CRAMS offers strong growth visibility
2000 2012 2017
Contract Research (CRO)
Contract Manufacturing (CMO)
4.5
7.0
5.5
30.0
Contract Manufacturing of APIs/Intmd.
Packaging/labeling and other services
Development of FormulationsContract Manufacturing of Formulations
18
12.0
Custom synthesis (mainly focusedon new, branded APIs)
Toll manufacturing
1547
93
43
25
21 72 136Total Pharma CRAMS
11.4%
CAGR
35% CAGR
13.6% CAGR
Year
6
Figures in $bn
India to see maximum ramp up at >35% CAGR to $29 bn (21% market share) in 2017 from $6 bn(8% Market share) in 2012.
62924.3
348.8
26.1
32.9
46.9
0
20
40
60
80
100
120
140
160
2012 2017
India share US' Share
China' Share Others
Figures in $bn
2000 2012 2017
Contract Research (CRO)
Contract Manufacturing (CMO)
4.5
7.0
5.5
30.0
Contract Manufacturing of APIs/Intmd.
Packaging/labeling and other services
Development of FormulationsContract Manufacturing of Formulations
18
12.0
Custom synthesis (mainly focusedon new, branded APIs)
Toll manufacturing
18
12.0
Custom synthesis (mainly focusedon new, branded APIs)
Toll manufacturing
1547
93
43
25
21 72 136Total Pharma CRAMS
11.4%
CAGR
35% CAGR
13.6% CAGR
Year
6
Figures in $bn
India to see maximum ramp up at >35% CAGR to $29 bn (21% market share) in 2017 from $6 bn(8% Market share) in 2012.
62924.3
348.8
26.1
32.9
46.9
0
20
40
60
80
100
120
140
160
2012 2017
India share US' Share
China' Share Others
Figures in $bn
Notes: Figures in parentheses indicates % share
Source: Chemical Pharmaceutical Generic Association (CPA), Italy,
While pharma outsourcing (on the backdrop of mounting R&D cost pressure, declining productivity on the drug discovery front, impending patent expirations, escalating pricing pressures and the ultimate falling profitability) has become the inevitable option for global pharma innovators, India (led by driven by its intrinsic competitive advantages like – low cost manufacturing, enough pool of research talent and adequate research capability) has already proved to be an one of the most preferred outsourcing destinations for pharma outsourcing. Despite the given fact, the share of Indina pharma in global pharma outsourcing remained mere at $6bn (i.e.8%) in 2012, primarily due to the larger focus on contract manufacturing.

13 of 66
27 November 2013 / INDIA EQUITY RESEARCH / PHARMACEUTICALS SECTOR
However, with the improved focus on building R&D capability, enhanced and quality service offerings at competitive cost, Indian Pharma is well placed to grab a meaningful chunk of huge global pharma outsourcing opportunity. As per the study of Italy based Chemical Pharmaceutical Generic Association (CPA), the global pharma out sourcing to grow at 14% CAGR over FY12‐17 to $136bn and India to see maximum ramp up at >35% CAGR to $29 bn (21% market share) in 2017 from $6 bn(8% Market share) in 2012. Given the fact, we believe Indian peers like – Divi’s Lab, Dr Reddy, Biocon etc led by their research capability and strong clientele base are well positioned to make the maximum out of the huge foreseeable pharma outsourcing opportunity. Additionally, better execution track record by Indian pharma peers in contract manufacturing and recent quality concerns around Chinese (key competitor of Indian Pharma) pharma operation coupled with relatively higher service charges to lead Indian pharma outpace China.

14 of 66
27 November 2013 / INDIA EQUITY RESEARCH / PHARMACEUTICALS SECTOR
Indian Pharma trades at historic average valuation multiples Indian Pharma represented by BSE Healthcare Index saw its dream run and has grossly outperformed the benchmark index – SENSEX over last three year period. It has gradually raised its premium valuation to about 40% currently over SENSEX during the said period. In our view, 1) strong visibility of formulation exports especially to US led by patent cliff resulting in multiple exclusive supply opportunities, 2) powering free cashflow generation and 3) investment favour due to defensive nature helped Indian pharma to outbid the benchmark index. Additionally, the favouring Rupee depreciation against US Dollar further powered the earnings growth as the exports account over 50% of the gross Indian Pharma revenue.
Indian Pharma currently trades at historic average PE BSE Healthcare index trades at over 40% premium to SENSEX
10
15
20
25
30
35
Apr‐08Jul‐08
Oct‐08
Jan‐09
Apr‐09Jul‐09
Oct‐09
Jan‐10
Apr‐10Jul‐10
Oct‐10
Jan‐11
Apr‐11Jul‐11
Oct‐11
Jan‐12
Apr‐12Jul‐12
Oct‐12
Jan‐13
Apr‐13Jul‐13
Oct‐13
HC Index 1yr fwd PE Historic Avg PE
19.2x
‐
50
100
150
200
250
Jan‐08 Jan‐09 Jan‐10 Jan‐11 Jan‐12 Jan‐13
BSE_SENSEX BSE HC Index
Source: BSE, PhillipCapital India Research
At the current level the pharma index is trading at its historic average 1 year PE multiple of ~20x. We believe the sector should command its premium valuation multiples led by continued visibility for healthy formulation exports growth, robust free cash flow generation and enhanced build up in R&D capability over last couple of years. Thanks to the multiple exclusive supply opportunities led by patent expiry of many blockbuster drugs in US during last few years, which helped Indian pharma to enhance its R&D focus and spend.
15 of 66
27 November 2013 / INDIA EQUITY RESEARCH / PHARMACEUTICALS SECTOR
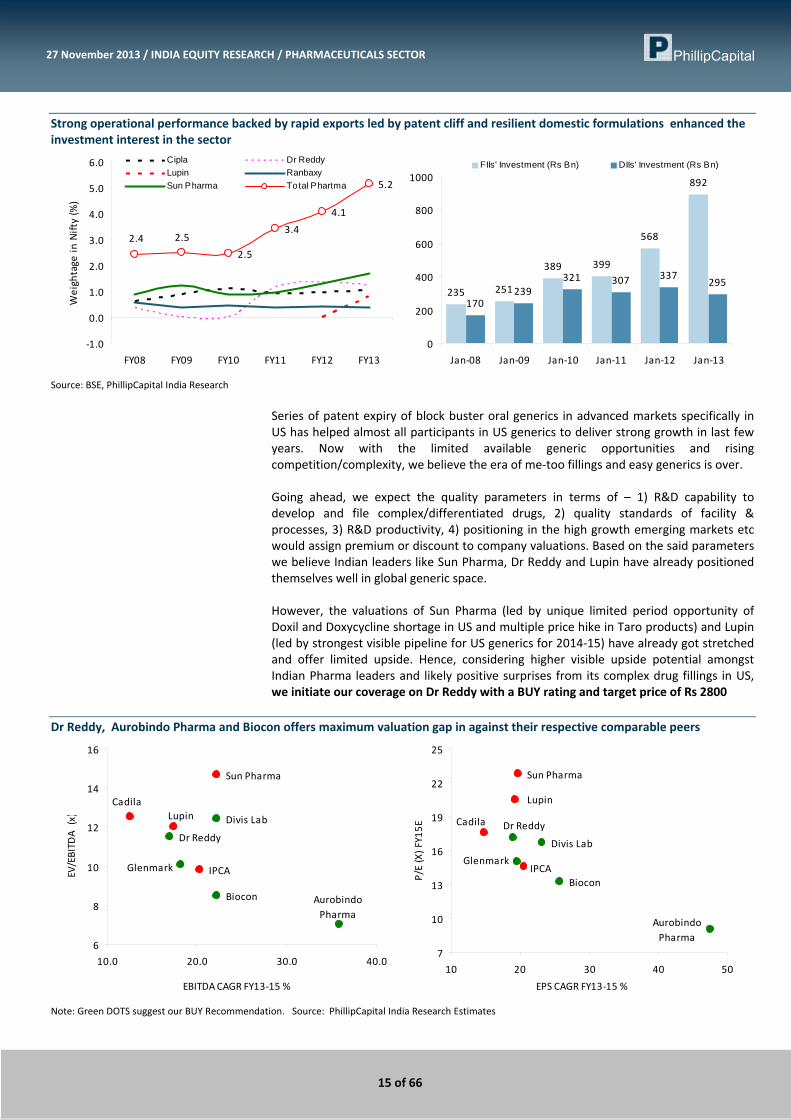
Strong operational performance backed by rapid exports led by patent cliff and resilient domestic formulations enhanced the investment interest in the sector
2.5
3.4
4.1
5.2
2.4 2.5
‐1.0
0.0
1.0
2.0
3.0
4.0
5.0
6.0
FY08 FY09 FY10 FY11 FY12 FY13
Weightage
in Nifty (%)
Cipla Dr ReddyLupin RanbaxySun Pharma Total Phartma
235 251
389 399
568
892
170239
321 307 337295
0
200
400
600
800
1000
Jan‐08 Jan‐09 Jan‐10 Jan‐11 Jan‐12 Jan‐13
FIIs' Investment (Rs Bn) DIIs' Investment (Rs Bn)
Source: BSE, PhillipCapital India Research
Series of patent expiry of block buster oral generics in advanced markets specifically in US has helped almost all participants in US generics to deliver strong growth in last few years. Now with the limited available generic opportunities and rising competition/complexity, we believe the era of me‐too fillings and easy generics is over. Going ahead, we expect the quality parameters in terms of – 1) R&D capability to develop and file complex/differentiated drugs, 2) quality standards of facility & processes, 3) R&D productivity, 4) positioning in the high growth emerging markets etc would assign premium or discount to company valuations. Based on the said parameters we believe Indian leaders like Sun Pharma, Dr Reddy and Lupin have already positioned themselves well in global generic space. However, the valuations of Sun Pharma (led by unique limited period opportunity of Doxil and Doxycycline shortage in US and multiple price hike in Taro products) and Lupin (led by strongest visible pipeline for US generics for 2014‐15) have already got stretched and offer limited upside. Hence, considering higher visible upside potential amongst Indian Pharma leaders and likely positive surprises from its complex drug fillings in US, we initiate our coverage on Dr Reddy with a BUY rating and target price of Rs 2800
Dr Reddy, Aurobindo Pharma and Biocon offers maximum valuation gap in against their respective comparable peers
Sun Pharma
Dr Reddy
IPCA
Divis Lab
Biocon
LupinCadila
Glenmark
Aurobindo Pharma
6
8
10
12
14
16
10.0 20.0 30.0 40.0
EBITDA CAGR FY13‐15 %
EV/EBITD
A (x)
Sun Pharma
Divis Lab
Biocon
Dr Reddy
Lupin
Cadila
GlenmarkIPCA
Aurobindo Pharma
7
10
13
16
19
22
25
10 20 30 40 50
EPS CAGR FY13‐15 %
P/E (X) FY15E
Note: Green DOTS suggest our BUY Recommendation. Source: PhillipCapital India Research Estimates
16 of 66
27 November 2013 / INDIA EQUITY RESEARCH / PHARMACEUTICALS SECTOR
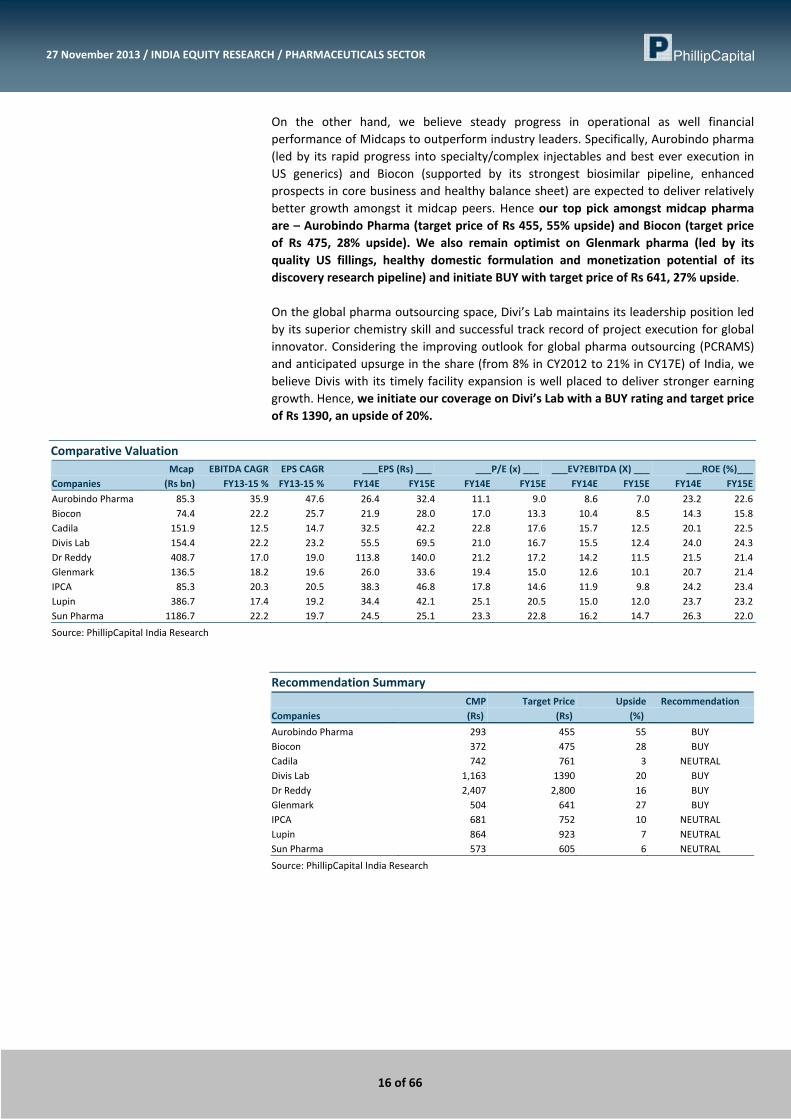
On the other hand, we believe steady progress in operational as well financial performance of Midcaps to outperform industry leaders. Specifically, Aurobindo pharma (led by its rapid progress into specialty/complex injectables and best ever execution in US generics) and Biocon (supported by its strongest biosimilar pipeline, enhanced prospects in core business and healthy balance sheet) are expected to deliver relatively better growth amongst it midcap peers. Hence our top pick amongst midcap pharma are – Aurobindo Pharma (target price of Rs 455, 55% upside) and Biocon (target price of Rs 475, 28% upside). We also remain optimist on Glenmark pharma (led by its quality US fillings, healthy domestic formulation and monetization potential of its discovery research pipeline) and initiate BUY with target price of Rs 641, 27% upside. On the global pharma outsourcing space, Divi’s Lab maintains its leadership position led by its superior chemistry skill and successful track record of project execution for global innovator. Considering the improving outlook for global pharma outsourcing (PCRAMS) and anticipated upsurge in the share (from 8% in CY2012 to 21% in CY17E) of India, we believe Divis with its timely facility expansion is well placed to deliver stronger earning growth. Hence, we initiate our coverage on Divi’s Lab with a BUY rating and target price of Rs 1390, an upside of 20%.
Comparative Valuation Mcap EBITDA CAGR EPS CAGR ___EPS (Rs) ___ ___P/E (x) ___ ___EV?EBITDA (X) ___ ___ROE (%)___Companies (Rs bn) FY13‐15 % FY13‐15 % FY14E FY15E FY14E FY15E FY14E FY15E FY14E FY15E
Aurobindo Pharma 85.3 35.9 47.6 26.4 32.4 11.1 9.0 8.6 7.0 23.2 22.6Biocon 74.4 22.2 25.7 21.9 28.0 17.0 13.3 10.4 8.5 14.3 15.8Cadila 151.9 12.5 14.7 32.5 42.2 22.8 17.6 15.7 12.5 20.1 22.5Divis Lab 154.4 22.2 23.2 55.5 69.5 21.0 16.7 15.5 12.4 24.0 24.3Dr Reddy 408.7 17.0 19.0 113.8 140.0 21.2 17.2 14.2 11.5 21.5 21.4Glenmark 136.5 18.2 19.6 26.0 33.6 19.4 15.0 12.6 10.1 20.7 21.4IPCA 85.3 20.3 20.5 38.3 46.8 17.8 14.6 11.9 9.8 24.2 23.4Lupin 386.7 17.4 19.2 34.4 42.1 25.1 20.5 15.0 12.0 23.7 23.2Sun Pharma 1186.7 22.2 19.7 24.5 25.1 23.3 22.8 16.2 14.7 26.3 22.0
Source: PhillipCapital India Research
Recommendation Summary CMP Target Price Upside Recommendation Companies (Rs) (Rs) (%)
Aurobindo Pharma 293 455 55 BUY Biocon 372 475 28 BUY Cadila 742 761 3 NEUTRAL Divis Lab 1,163 1390 20 BUY Dr Reddy 2,407 2,800 16 BUY Glenmark 504 641 27 BUY IPCA 681 752 10 NEUTRAL Lupin 864 923 7 NEUTRAL Sun Pharma 573 605 6 NEUTRAL
Source: PhillipCapital India Research

17 of 66
27 November 2013 / INDIA EQUITY RESEARCH / PHARMACEUTICALS SECTOR
This page is intentionally left blank.

18 of 66
27 November 2013 / INDIA EQUITY RESEARCH / PHARMACEUTICALS SECTOR
Compa
nies Section
– 19 of 66 –
Aurobindo Pharma Gaining ground in US generics
PHARMACEUTICALS: Initiating Coverage 27 November 2013
PhillipCapital (India) Pvt. Ltd.
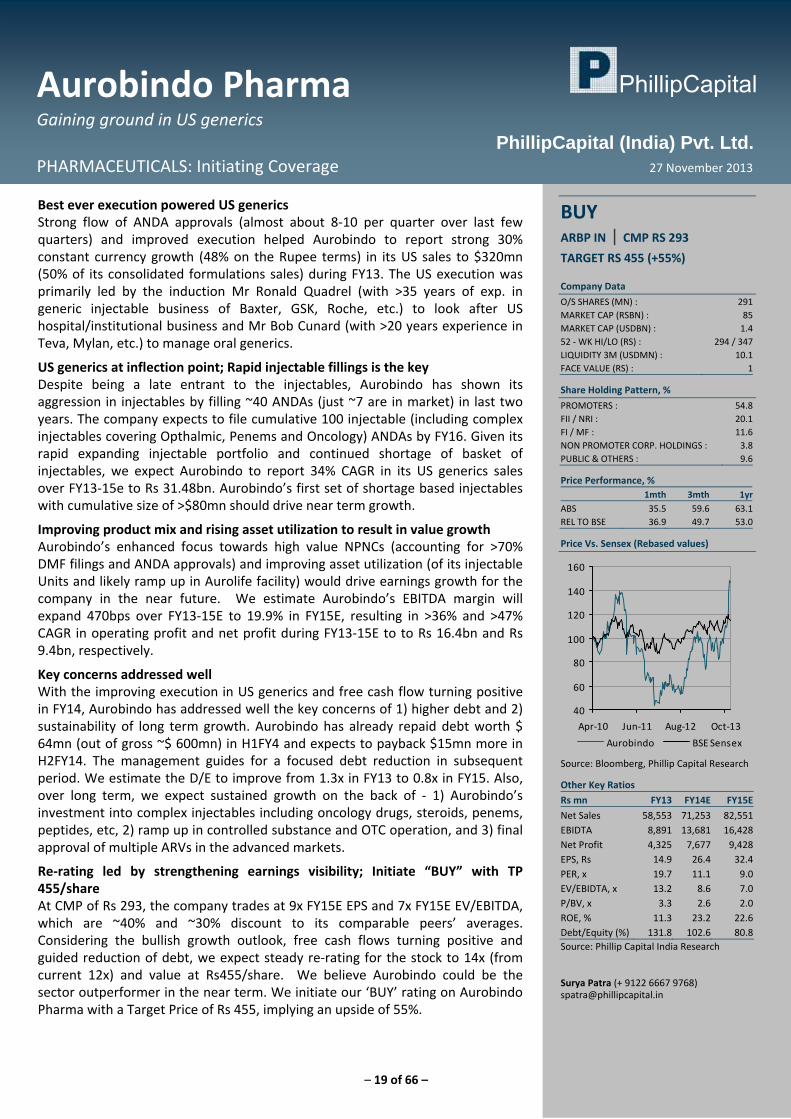
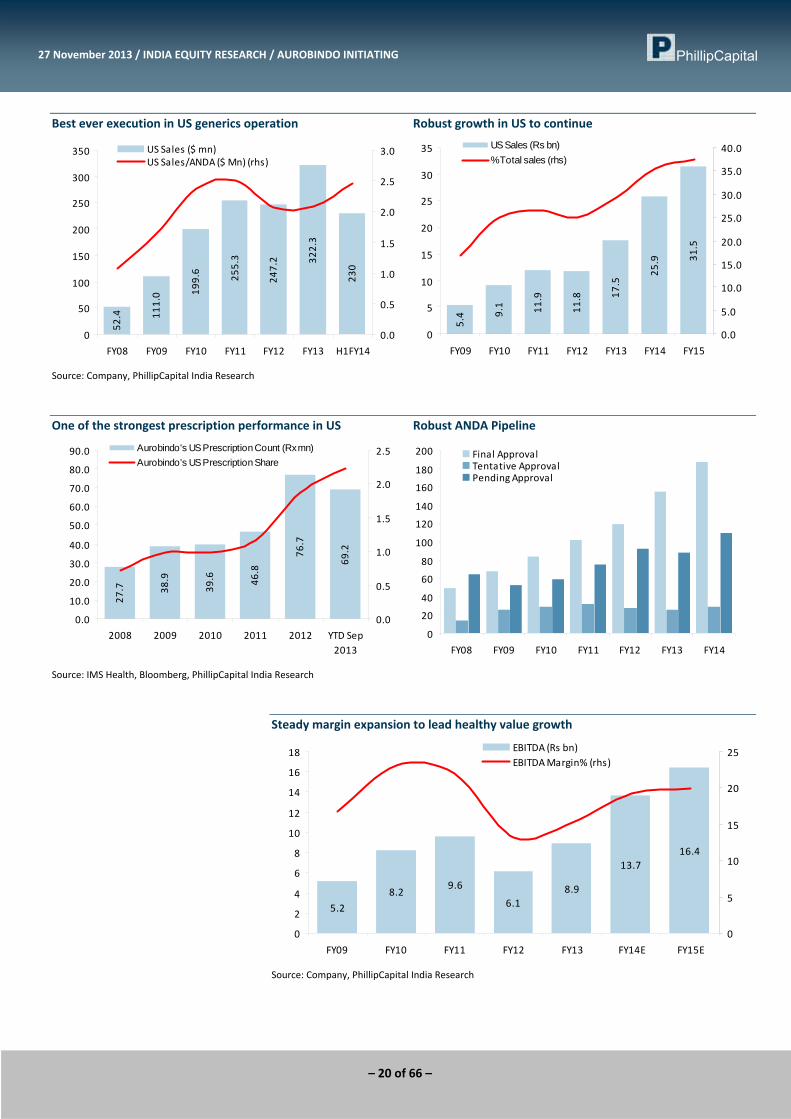
Best ever execution powered US generics Strong flow of ANDA approvals (almost about 8‐10 per quarter over last few quarters) and improved execution helped Aurobindo to report strong 30% constant currency growth (48% on the Rupee terms) in its US sales to $320mn (50% of its consolidated formulations sales) during FY13. The US execution was primarily led by the induction Mr Ronald Quadrel (with >35 years of exp. in generic injectable business of Baxter, GSK, Roche, etc.) to look after US hospital/institutional business and Mr Bob Cunard (with >20 years experience in Teva, Mylan, etc.) to manage oral generics.
US generics at inflection point; Rapid injectable fillings is the key Despite being a late entrant to the injectables, Aurobindo has shown its aggression in injectables by filling ~40 ANDAs (just ~7 are in market) in last two years. The company expects to file cumulative 100 injectable (including complex injectables covering Opthalmic, Penems and Oncology) ANDAs by FY16. Given its rapid expanding injectable portfolio and continued shortage of basket of injectables, we expect Aurobindo to report 34% CAGR in its US generics sales over FY13‐15e to Rs 31.48bn. Aurobindo’s first set of shortage based injectables with cumulative size of >$80mn should drive near term growth.
Improving product mix and rising asset utilization to result in value growth Aurobindo’s enhanced focus towards high value NPNCs (accounting for >70% DMF filings and ANDA approvals) and improving asset utilization (of its injectable Units and likely ramp up in Aurolife facility) would drive earnings growth for the company in the near future. We estimate Aurobindo’s EBITDA margin will expand 470bps over FY13‐15E to 19.9% in FY15E, resulting in >36% and >47% CAGR in operating profit and net profit during FY13‐15E to to Rs 16.4bn and Rs 9.4bn, respectively.
Key concerns addressed well With the improving execution in US generics and free cash flow turning positive in FY14, Aurobindo has addressed well the key concerns of 1) higher debt and 2) sustainability of long term growth. Aurobindo has already repaid debt worth $ 64mn (out of gross ~$ 600mn) in H1FY4 and expects to payback $15mn more in H2FY14. The management guides for a focused debt reduction in subsequent period. We estimate the D/E to improve from 1.3x in FY13 to 0.8x in FY15. Also, over long term, we expect sustained growth on the back of ‐ 1) Aurobindo’s investment into complex injectables including oncology drugs, steroids, penems, peptides, etc, 2) ramp up in controlled substance and OTC operation, and 3) final approval of multiple ARVs in the advanced markets.
Re‐rating led by strengthening earnings visibility; Initiate “BUY” with TP 455/share At CMP of Rs 293, the company trades at 9x FY15E EPS and 7x FY15E EV/EBITDA, which are ~40% and ~30% discount to its comparable peers’ averages. Considering the bullish growth outlook, free cash flows turning positive and guided reduction of debt, we expect steady re‐rating for the stock to 14x (from current 12x) and value at Rs455/share. We believe Aurobindo could be the sector outperformer in the near term. We initiate our ‘BUY’ rating on Aurobindo Pharma with a Target Price of Rs 455, implying an upside of 55%.
BUY ARBP IN | CMP RS 293
TARGET RS 455 (+55%) Company Data
O/S SHARES (MN) : 291MARKET CAP (RSBN) : 85MARKET CAP (USDBN) : 1.452 ‐ WK HI/LO (RS) : 294 / 347LIQUIDITY 3M (USDMN) : 10.1FACE VALUE (RS) : 1
Share Holding Pattern, %
PROMOTERS : 54.8FII / NRI : 20.1FI / MF : 11.6NON PROMOTER CORP. HOLDINGS : 3.8PUBLIC & OTHERS : 9.6
Price Performance, % 1mth 3mth 1yr
ABS 35.5 59.6 63.1REL TO BSE 36.9 49.7 53.0
Price Vs. Sensex (Rebased values)
40
60
80
100
120
140
160
Apr‐10 Jun‐11 Aug‐12 Oct‐13
Aurobindo BSE Sensex
Source: Bloomberg, Phillip Capital Research
Other Key Ratios
Rs mn FY13 FY14E FY15E
Net Sales 58,553 71,253 82,551EBIDTA 8,891 13,681 16,428Net Profit 4,325 7,677 9,428EPS, Rs 14.9 26.4 32.4PER, x 19.7 11.1 9.0EV/EBIDTA, x 13.2 8.6 7.0P/BV, x 3.3 2.6 2.0ROE, % 11.3 23.2 22.6Debt/Equity (%) 131.8 102.6 80.8Source: Phillip Capital India Research Surya Patra (+ 9122 6667 9768) [email protected]
– 20 of 66 –
27 November 2013 / INDIA EQUITY RESEARCH / AUROBINDO INITIATING
Best ever execution in US generics operation Robust growth in US to continue 52
.4 111.0 19
9.6
255.3
247.2 322.3
230
0
50
100
150
200
250
300
350
FY08 FY09 FY10 FY11 FY12 FY13 H1FY14
0.0
0.5
1.0
1.5
2.0
2.5
3.0US Sales ($ mn)US Sales/ANDA ($ Mn) (rhs)
5.4 9.1 11.9
11.8 17
.5
25.9 31
.5
0
5
10
15
20
25
30
35
FY09 FY10 FY11 FY12 FY13 FY14 FY15
0.0
5.0
10.0
15.0
20.0
25.0
30.0
35.0
40.0US Sales (Rs bn)% Total sales (rhs)
Source: Company, PhillipCapital India Research
One of the strongest prescription performance in US Robust ANDA Pipeline
27.7 38.9
39.6 46.8
76.7
69.2
0.0
10.0
20.0
30.0
40.0
50.0
60.0
70.0
80.0
90.0
2008 2009 2010 2011 2012 YTD Sep2013
0.0
0.5
1.0
1.5
2.0
2.5Aurobindo's US Prescription Count (Rx mn)Aurobindo's US Prescription Share
0
20
40
60
80
100
120
140
160
180
200
FY08 FY09 FY10 FY11 FY12 FY13 FY14
Final ApprovalTentative ApprovalPending Approval
Source: IMS Health, Bloomberg, PhillipCapital India Research
Steady margin expansion to lead healthy value growth
5.2
8.29.6
6.18.9
13.716.4
0
2
4
6
8
10
12
14
16
18
FY09 FY10 FY11 FY12 FY13 FY14E FY15E
0
5
10
15
20
25EBITDA (Rs bn)EBITDA Margin% (rhs)
Source: Company, PhillipCapital India Research
– 21 of 66 –
27 November 2013 / INDIA EQUITY RESEARCH / AUROBINDO INITIATING
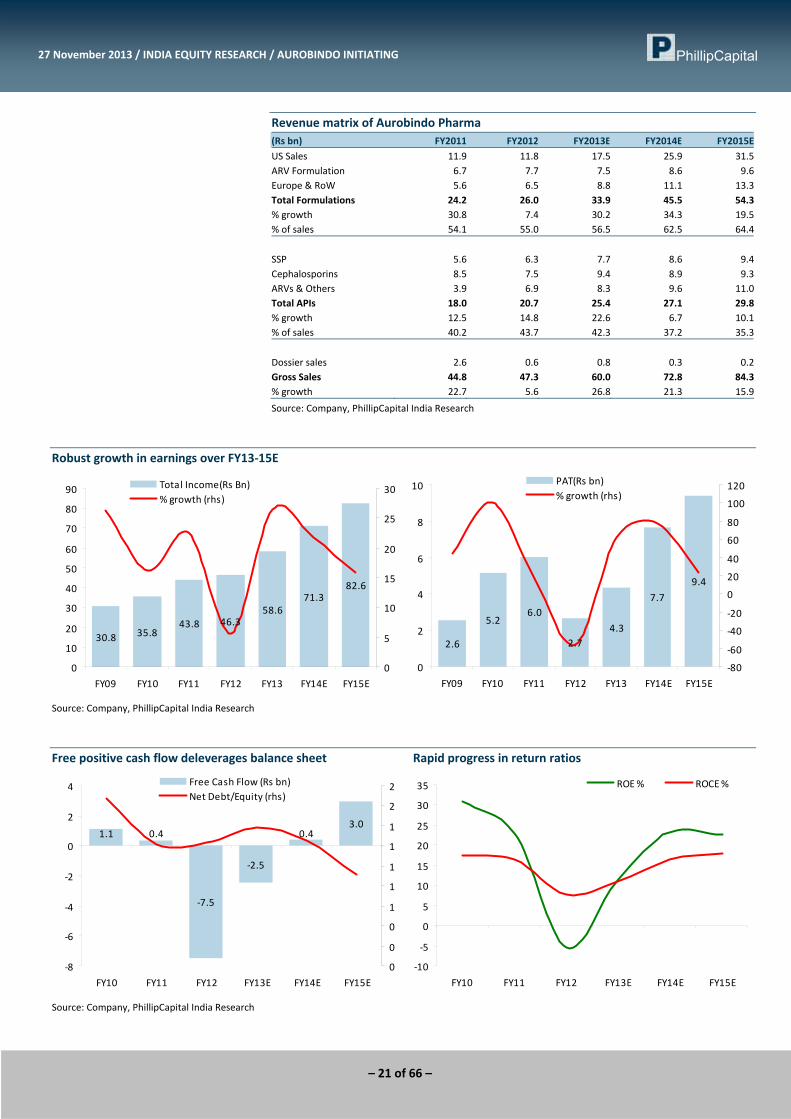
Revenue matrix of Aurobindo Pharma (Rs bn) FY2011 FY2012 FY2013E FY2014E FY2015E
US Sales 11.9 11.8 17.5 25.9 31.5ARV Formulation 6.7 7.7 7.5 8.6 9.6Europe & RoW 5.6 6.5 8.8 11.1 13.3Total Formulations 24.2 26.0 33.9 45.5 54.3% growth 30.8 7.4 30.2 34.3 19.5% of sales 54.1 55.0 56.5 62.5 64.4
SSP 5.6 6.3 7.7 8.6 9.4Cephalosporins 8.5 7.5 9.4 8.9 9.3ARVs & Others 3.9 6.9 8.3 9.6 11.0Total APIs 18.0 20.7 25.4 27.1 29.8% growth 12.5 14.8 22.6 6.7 10.1% of sales 40.2 43.7 42.3 37.2 35.3
Dossier sales 2.6 0.6 0.8 0.3 0.2Gross Sales 44.8 47.3 60.0 72.8 84.3% growth 22.7 5.6 26.8 21.3 15.9
Source: Company, PhillipCapital India Research
Robust growth in earnings over FY13‐15E
30.8 35.843.8 46.3
58.671.3
82.6
0
10
20
30
40
50
60
70
80
90
FY09 FY10 FY11 FY12 FY13 FY14E FY15E
0
5
10
15
20
25
30Total Income(Rs Bn)% growth (rhs)
2.6
5.26.0
2.74.3
7.7
9.4
0
2
4
6
8
10
FY09 FY10 FY11 FY12 FY13 FY14E FY15E
‐80
‐60
‐40
‐20
0
20
40
60
80
100
120PAT(Rs bn)% growth (rhs)
Source: Company, PhillipCapital India Research
Free positive cash flow deleverages balance sheet Rapid progress in return ratios
1.1 0.4
‐7.5
‐2.5
0.43.0
‐8
‐6
‐4
‐2
0
2
4
FY10 FY11 FY12 FY13E FY14E FY15E
0
0
0
1
1
1
1
1
2
2Free Cash Flow (Rs bn)Net Debt/Equity (rhs)
‐10
‐5
0
5
10
15
20
25
30
35
FY10 FY11 FY12 FY13E FY14E FY15E
ROE % ROCE %
Source: Company, PhillipCapital India Research
– 22 of 66 –
27 November 2013 / INDIA EQUITY RESEARCH / AUROBINDO INITIATING
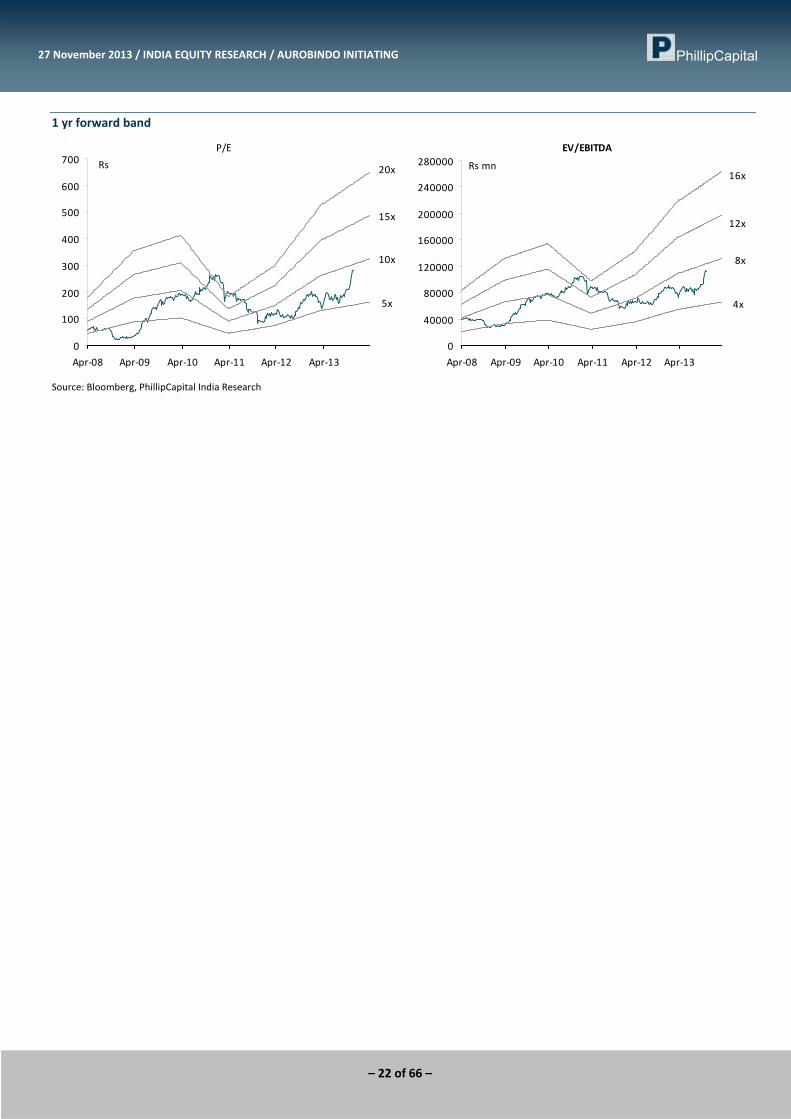
1 yr forward band
P/E
5x
10x
15x
20x
0
100
200
300
400
500
600
700
Apr‐08 Apr‐09 Apr‐10 Apr‐11 Apr‐12 Apr‐13
Rs
EV/EBITDA
4x
8x
12x
16x
0
40000
80000
120000
160000
200000
240000
280000
Apr‐08 Apr‐09 Apr‐10 Apr‐11 Apr‐12 Apr‐13
Rs mn
Source: Bloomberg, PhillipCapital India Research
– 23 of 66 –
27 November 2013 / INDIA EQUITY RESEARCH / AUROBINDO INITIATING
Financials
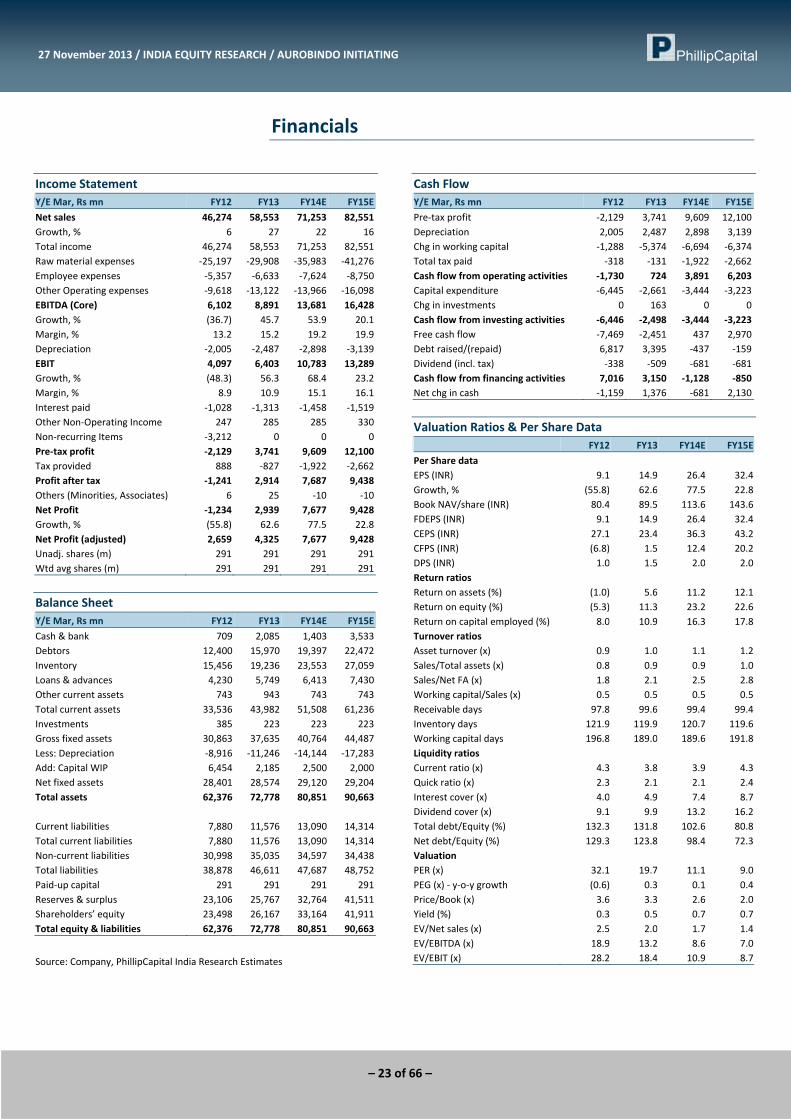
Income Statement Y/E Mar, Rs mn FY12 FY13 FY14E FY15E
Net sales 46,274 58,553 71,253 82,551Growth, % 6 27 22 16Total income 46,274 58,553 71,253 82,551Raw material expenses ‐25,197 ‐29,908 ‐35,983 ‐41,276Employee expenses ‐5,357 ‐6,633 ‐7,624 ‐8,750Other Operating expenses ‐9,618 ‐13,122 ‐13,966 ‐16,098EBITDA (Core) 6,102 8,891 13,681 16,428Growth, % (36.7) 45.7 53.9 20.1Margin, % 13.2 15.2 19.2 19.9Depreciation ‐2,005 ‐2,487 ‐2,898 ‐3,139EBIT 4,097 6,403 10,783 13,289Growth, % (48.3) 56.3 68.4 23.2Margin, % 8.9 10.9 15.1 16.1Interest paid ‐1,028 ‐1,313 ‐1,458 ‐1,519Other Non‐Operating Income 247 285 285 330Non‐recurring Items ‐3,212 0 0 0Pre‐tax profit ‐2,129 3,741 9,609 12,100Tax provided 888 ‐827 ‐1,922 ‐2,662Profit after tax ‐1,241 2,914 7,687 9,438Others (Minorities, Associates) 6 25 ‐10 ‐10Net Profit ‐1,234 2,939 7,677 9,428Growth, % (55.8) 62.6 77.5 22.8Net Profit (adjusted) 2,659 4,325 7,677 9,428Unadj. shares (m) 291 291 291 291Wtd avg shares (m) 291 291 291 291
Balance Sheet Y/E Mar, Rs mn FY12 FY13 FY14E FY15E
Cash & bank 709 2,085 1,403 3,533Debtors 12,400 15,970 19,397 22,472Inventory 15,456 19,236 23,553 27,059Loans & advances 4,230 5,749 6,413 7,430Other current assets 743 943 743 743Total current assets 33,536 43,982 51,508 61,236Investments 385 223 223 223Gross fixed assets 30,863 37,635 40,764 44,487Less: Depreciation ‐8,916 ‐11,246 ‐14,144 ‐17,283Add: Capital WIP 6,454 2,185 2,500 2,000Net fixed assets 28,401 28,574 29,120 29,204Total assets 62,376 72,778 80,851 90,663 Current liabilities 7,880 11,576 13,090 14,314Total current liabilities 7,880 11,576 13,090 14,314Non‐current liabilities 30,998 35,035 34,597 34,438Total liabilities 38,878 46,611 47,687 48,752Paid‐up capital 291 291 291 291Reserves & surplus 23,106 25,767 32,764 41,511Shareholders’ equity 23,498 26,167 33,164 41,911Total equity & liabilities 62,376 72,778 80,851 90,663
Source: Company, PhillipCapital India Research Estimates
Cash Flow Y/E Mar, Rs mn FY12 FY13 FY14E FY15E
Pre‐tax profit ‐2,129 3,741 9,609 12,100Depreciation 2,005 2,487 2,898 3,139Chg in working capital ‐1,288 ‐5,374 ‐6,694 ‐6,374Total tax paid ‐318 ‐131 ‐1,922 ‐2,662Cash flow from operating activities ‐1,730 724 3,891 6,203Capital expenditure ‐6,445 ‐2,661 ‐3,444 ‐3,223Chg in investments 0 163 0 0Cash flow from investing activities ‐6,446 ‐2,498 ‐3,444 ‐3,223Free cash flow ‐7,469 ‐2,451 437 2,970Debt raised/(repaid) 6,817 3,395 ‐437 ‐159Dividend (incl. tax) ‐338 ‐509 ‐681 ‐681Cash flow from financing activities 7,016 3,150 ‐1,128 ‐850Net chg in cash ‐1,159 1,376 ‐681 2,130
Valuation Ratios & Per Share Data FY12 FY13 FY14E FY15E
Per Share data EPS (INR) 9.1 14.9 26.4 32.4 Growth, % (55.8) 62.6 77.5 22.8 Book NAV/share (INR) 80.4 89.5 113.6 143.6 FDEPS (INR) 9.1 14.9 26.4 32.4 CEPS (INR) 27.1 23.4 36.3 43.2 CFPS (INR) (6.8) 1.5 12.4 20.2 DPS (INR) 1.0 1.5 2.0 2.0 Return ratios Return on assets (%) (1.0) 5.6 11.2 12.1 Return on equity (%) (5.3) 11.3 23.2 22.6 Return on capital employed (%) 8.0 10.9 16.3 17.8 Turnover ratios Asset turnover (x) 0.9 1.0 1.1 1.2 Sales/Total assets (x) 0.8 0.9 0.9 1.0 Sales/Net FA (x) 1.8 2.1 2.5 2.8 Working capital/Sales (x) 0.5 0.5 0.5 0.5 Receivable days 97.8 99.6 99.4 99.4 Inventory days 121.9 119.9 120.7 119.6 Working capital days 196.8 189.0 189.6 191.8 Liquidity ratios Current ratio (x) 4.3 3.8 3.9 4.3 Quick ratio (x) 2.3 2.1 2.1 2.4 Interest cover (x) 4.0 4.9 7.4 8.7 Dividend cover (x) 9.1 9.9 13.2 16.2 Total debt/Equity (%) 132.3 131.8 102.6 80.8 Net debt/Equity (%) 129.3 123.8 98.4 72.3 Valuation PER (x) 32.1 19.7 11.1 9.0 PEG (x) ‐ y‐o‐y growth (0.6) 0.3 0.1 0.4 Price/Book (x) 3.6 3.3 2.6 2.0 Yield (%) 0.3 0.5 0.7 0.7 EV/Net sales (x) 2.5 2.0 1.7 1.4 EV/EBITDA (x) 18.9 13.2 8.6 7.0 EV/EBIT (x) 28.2 18.4 10.9 8.7
– 24 of 66 –
Biocon Crowned with biologics
PHARMACEUTICALS: Initiating Coverage 27 November 2013
PhillipCapital (India) Pvt. Ltd.
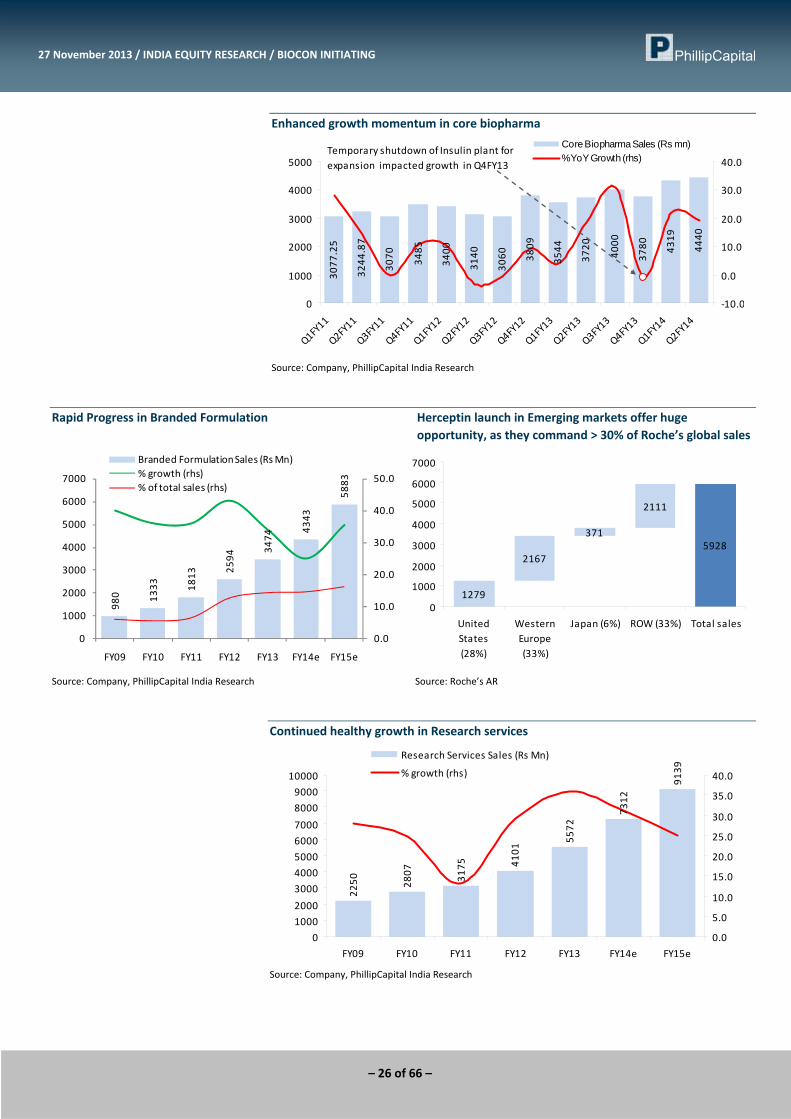
Enhanced growth momentum in core Biopharma Biocon’s core Biopharma business (62% of total sales) including – statins, insulin, immunosuppressant, Orlistat etc has already delivered strong growth of ~20% in FY13 (v/s historical growth trend of ~12‐15%) to Rs 14.9bn. Going forward, 1) the ramp up in insulin in emerging markets (led by capacity expansion effective from mid‐Q2FY14 and deeper geographic penetration into 45 emerging markets) and 2) continued limited competition in Tacrolimus coupled with likely launch of Sirolimus (company already has multiple supply tie‐ups) in Q3FY14 would drive steady growth of >18% CAGR over FY13‐15, despite the flattening sales of statins.
Herceptin launch could drive value growth in branded sales Biocon’s strategic focus on complex formulations, brand positioning and very selective product portfolio has helped its branded formulations (14% of sales) to report 37% CAGR over last five years. Going ahead, its continued focus on differentiated drugs and brand promotion will sustain its growth momentum. Also, the likely launch of world’s first biosimilar version of generic herceptin in India during Q4FY14 (Already got DCGI approval) could drive value growth for Biocon. We believe Biocon would be the only generic player for herceptin (Indian market size Rs 1300mn) for ~15‐18 months after its launch in India and estimate it to generate incremental domestic sales of Rs 600mn (PAT of Rs 160mn) in FY15. In Addition, the huge demand for biosimilar herceptin in emerging markets (valued >$ 2bn) would be the key opportunity for Biocon in medium term. We estimate domestic formulation to report 30% CAGR over FY13‐15 to Rs 5.9bn.
Fresh stream of manufacturing revenue powers Syngene growth Biocon’s Research services operation (Syngene) is the largest Indian CRO with 1500+ Scientists working for 16 of top 20 global innovators. With its continued client expansion (to about 150 now) and improving outlook of global pharma outsourcing, we expect the company to report a growth of 28% CAGR FY13‐15 to Rs 9.13bn. Additionally, a fresh high margin revenue stream of clinical material supply (for 6 Phase III compounds of its partners) commencing from H2FY14 would drive value growth for Syngene.
Harmonised dossier filling for Rh‐insulin in Europe and US seems strategically best as 1) the company expects to file from the new state of art facility of Malaysia (which is expected to commence in 2014 earlier than previously guided 2015), 2) the existing old facility can focus on meeting emerging market demand and 3) small delay in product launch in Europe will not erode the product opportunity like in any chemical based generic drug.
Unique biologic/biosimilar pipeline brightens longterm growth Biocon holds the strongest pipeline of of biosimilars (including Rh‐insulin, insulin analogues and five monoclonal antobodies) and biologics (including Itolizumab and IN‐105) amongst Indian peers. The said pipeline projects are in various stages of development and all of them are developed from internal accruals. We believe this pipeline could upgrade Biocon’s financial profile substantially FY16 onwards. In fact, the target opportunities for Biocon’s biosimilar insulin and MAB pipeline are $ 20bn and $35bn respectively.
We expect Biocon to see gradual re‐rating with improved core operating performance and rising visibility of biosimilars in advanced markets going forward. We initiate our coverage on Biocon with BUY rating and a price target of Rs 475 (17x FY15E).
BUY BIOS IN | CMP RS 372
TARGET RS 475 (+28%) Company Data
O/S SHARES (MN) : 200MARKET CAP (RSBN) : 74MARKET CAP (USDBN) : 1.252 ‐ WK HI/LO (RS) : 387 / 253LIQUIDITY 3M (USDMN) : 3.2FACE VALUE (RS) : 5
Share Holding Pattern, %
PROMOTERS : 61.0FII / NRI : 11.7FI / MF : 7.0NON PROMOTER CORP. HOLDINGS : 3.5PUBLIC & OTHERS : 17.0
Price Performance, % 1mth 3mth 1yr
ABS 11.9 8.9 34.3REL TO BSE 13.3 ‐1.0 24.2
Price Vs. Sensex (Rebased values)
60
80
100
120
140
160
Apr‐10 Jun‐11 Aug‐12 Oct‐13Biocon BSE Sensex
Source: Bloomberg, Phillip Capital Research
Other Key Ratios
Rs mn FY13 FY14E FY15E
Net Sales 24,263 29,824 36,446EBIDTA 5,701 6,875 8,513Net Profit 3,483 4,371 5,605EPS, Rs 17.4 21.9 28.0PER, x 21.4 17.0 13.3EV/EBIDTA, x 12.3 10.4 8.5P/BV, x 2.8 2.4 2.1ROE, % 18.9 14.3 15.8Debt/Equity (%) 9.9 11.6 12.9Source: Phillip Capital India Research Surya Patra (+ 9122 6667 9768) [email protected]
– 25 of 66 –
27 November 2013 / INDIA EQUITY RESEARCH / BIOCON INITIATING
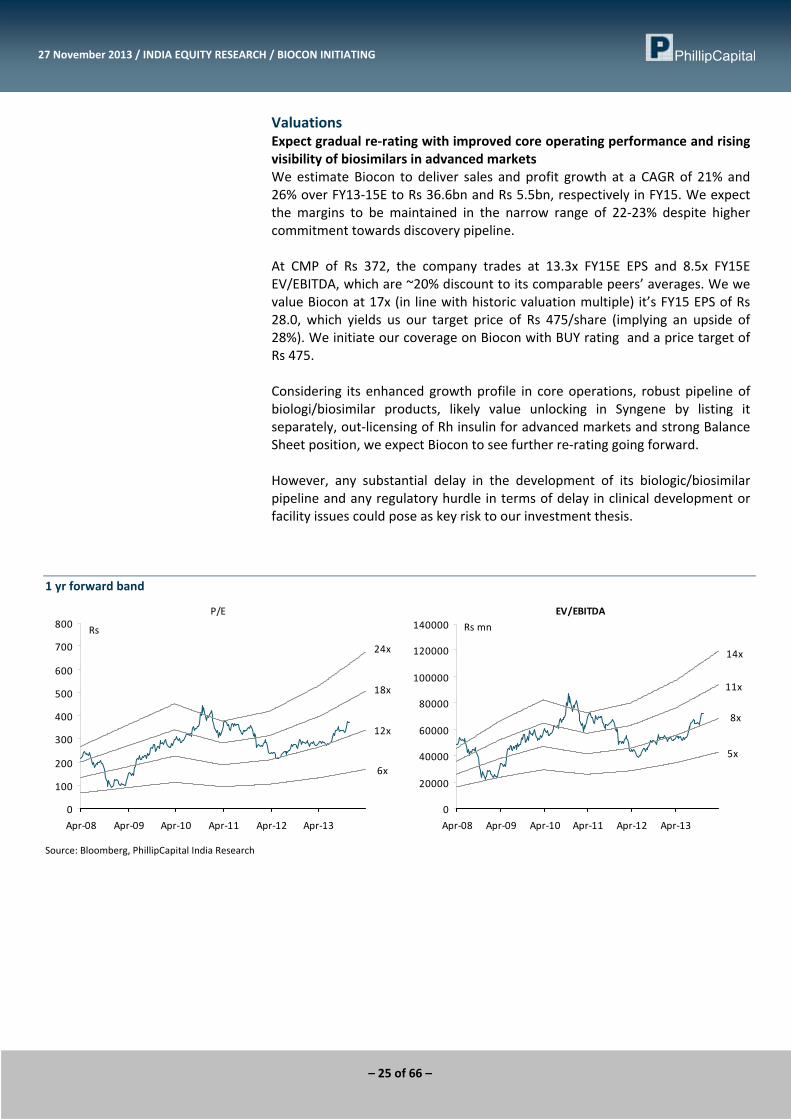
Valuations Expect gradual re‐rating with improved core operating performance and rising visibility of biosimilars in advanced markets We estimate Biocon to deliver sales and profit growth at a CAGR of 21% and 26% over FY13‐15E to Rs 36.6bn and Rs 5.5bn, respectively in FY15. We expect the margins to be maintained in the narrow range of 22‐23% despite higher commitment towards discovery pipeline. At CMP of Rs 372, the company trades at 13.3x FY15E EPS and 8.5x FY15E EV/EBITDA, which are ~20% discount to its comparable peers’ averages. We we value Biocon at 17x (in line with historic valuation multiple) it’s FY15 EPS of Rs 28.0, which yields us our target price of Rs 475/share (implying an upside of 28%). We initiate our coverage on Biocon with BUY rating and a price target of Rs 475. Considering its enhanced growth profile in core operations, robust pipeline of biologi/biosimilar products, likely value unlocking in Syngene by listing it separately, out‐licensing of Rh insulin for advanced markets and strong Balance Sheet position, we expect Biocon to see further re‐rating going forward. However, any substantial delay in the development of its biologic/biosimilar pipeline and any regulatory hurdle in terms of delay in clinical development or facility issues could pose as key risk to our investment thesis.
1 yr forward band
P/E
6x
12x
18x
24x
0
100
200
300
400
500
600
700
800
Apr‐08 Apr‐09 Apr‐10 Apr‐11 Apr‐12 Apr‐13
Rs
EV/EBITDA
5x
8x
11x
14x
0
20000
40000
60000
80000
100000
120000
140000
Apr‐08 Apr‐09 Apr‐10 Apr‐11 Apr‐12 Apr‐13
Rs mn
Source: Bloomberg, PhillipCapital India Research
– 26 of 66 –
27 November 2013 / INDIA EQUITY RESEARCH / BIOCON INITIATING
Enhanced growth momentum in core biopharma
3077
.25
3244
.87
3070 3485
3400
3140
3060 3809
3544
3720
4000
3780 4319
4440
0
1000
2000
3000
4000
5000
Q1FY11
Q2FY11
Q3FY11
Q4FY11
Q1FY12
Q2FY12
Q3FY12
Q4FY12
Q1FY13
Q2FY13
Q3FY13
Q4FY13
Q1FY14
Q2FY14
‐10.0
0.0
10.0
20.0
30.0
40.0
Core Biopharma Sales (Rs mn)% YoY Growth (rhs)
Temporary shutdown of Insulin plant for expansion impacted growth in Q4FY13
Source: Company, PhillipCapital India Research
Rapid Progress in Branded Formulation Herceptin launch in Emerging markets offer huge opportunity, as they command > 30% of Roche’s global sales
980 1333 1813 25
94
3474
4343
5883
0.0
10.0
20.0
30.0
40.0
50.0
0
1000
2000
3000
4000
5000
6000
7000
FY09 FY10 FY11 FY12 FY13 FY14e FY15e
Branded Formulation Sales (Rs Mn)% growth (rhs)% of total sales (rhs)
1279
2167
371
2111
5928
0
1000
2000
3000
4000
5000
6000
7000
UnitedStates(28%)
WesternEurope(33%)
Japan (6%) ROW (33%) Total sales
Source: Company, PhillipCapital India Research Source: Roche’s AR
Continued healthy growth in Research services
2250 2807 3175 41
01
5572
7312
9139
0
1000
2000
3000
4000
5000
6000
7000
8000
9000
10000
FY09 FY10 FY11 FY12 FY13 FY14e FY15e
0.0
5.0
10.0
15.0
20.0
25.0
30.0
35.0
40.0
Research Services Sales (Rs Mn)
% growth (rhs)
Source: Company, PhillipCapital India Research
– 27 of 66 –
27 November 2013 / INDIA EQUITY RESEARCH / BIOCON INITIATING
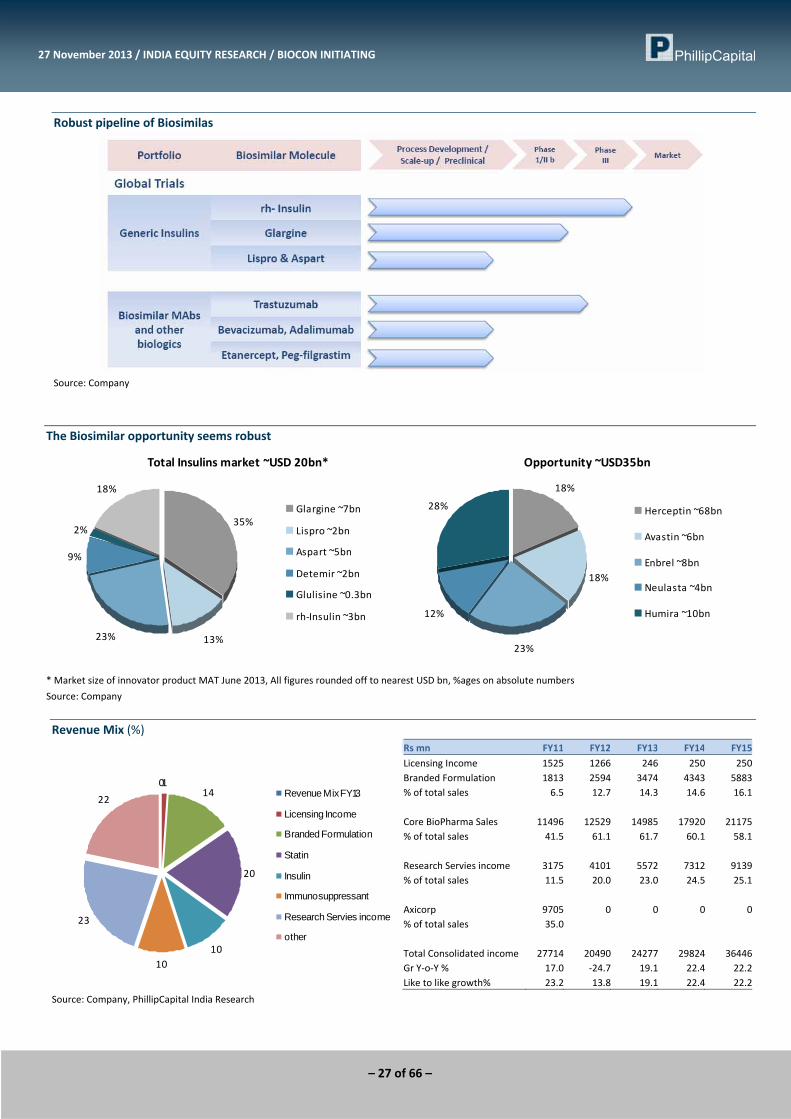
Robust pipeline of Biosimilas
Source: Company
The Biosimilar opportunity seems robust
Total Insulins market ~USD 20bn*
35%
13%23%
9%
2%
18%
Glargine ~7bn
Lispro ~2bn
Aspart ~5bn
Detemir ~2bn
Glulisine ~0.3bn
rh‐Insulin ~3bn
Opportunity ~USD35bn
18%
18%
23%
12%
28% Herceptin ~68bn
Avastin ~6bn
Enbrel ~8bn
Neulasta ~4bn
Humira ~10bn
* Market size of innovator product MAT June 2013, All figures rounded off to nearest USD bn, %ages on absolute numbers
Source: Company
Revenue Mix (%) Rs mn FY11 FY12 FY13 FY14 FY15
Licensing Income 1525 1266 246 250 250Branded Formulation 1813 2594 3474 4343 5883% of total sales 6.5 12.7 14.3 14.6 16.1 Core BioPharma Sales 11496 12529 14985 17920 21175% of total sales 41.5 61.1 61.7 60.1 58.1 Research Servies income 3175 4101 5572 7312 9139% of total sales 11.5 20.0 23.0 24.5 25.1 Axicorp 9705 0 0 0 0% of total sales 35.0 Total Consolidated income 27714 20490 24277 29824 36446Gr Y‐o‐Y % 17.0 ‐24.7 19.1 22.4 22.2Like to like growth% 23.2 13.8 19.1 22.4 22.2
Source: Company, PhillipCapital India Research
0114
20
1010
23
22Revenue Mix FY13
Licensing Income
Branded Formulation
Statin
Insulin
Immunosuppressant
Research Servies income
other

– 28 of 66 –
27 November 2013 / INDIA EQUITY RESEARCH / BIOCON INITIATING
Healthy progress in revenue and earnings over FY13‐15E 27
709
2086
5
2485
3
3042
0
3717
50.0
5.0
10.0
15.0
20.0
25.0
0
5000
10000
15000
20000
25000
30000
35000
40000
FY11 FY12 FY13 FY14 FY15
Net Sales (Rs mn)
% growth (Like to like) (rhs)
3756
3131
3483 43
71 5605
0
1000
2000
3000
4000
5000
6000
FY11 FY12 FY13 FY14 FY15
‐10
‐5
0
5
10
15
20
25
30
Adj. Net Profit (Rs mn)
% growth (Like to like) (rhs)
Source: Company, PhillipCapital India Research
Robust cash position despite rising R&D spend
‐569
‐567
6
‐822
5
‐992
2
2591
6723
2284 4046
2082
2429
‐107
54
‐119
23
‐15000
‐10000
‐5000
0
5000
10000
FY10 FY11 FY12 FY13 FY14 FY15
Rs m
n
Net Debt Free Cash flow
10.0
12.0
14.0
16.0
18.0
20.0
FY10 FY11 FY12 FY13 FY14 FY15
ROCE% ROE%
Source: Company, PhillipCapital India Research
– 29 of 66 –
27 November 2013 / INDIA EQUITY RESEARCH / BIOCON INITIATING
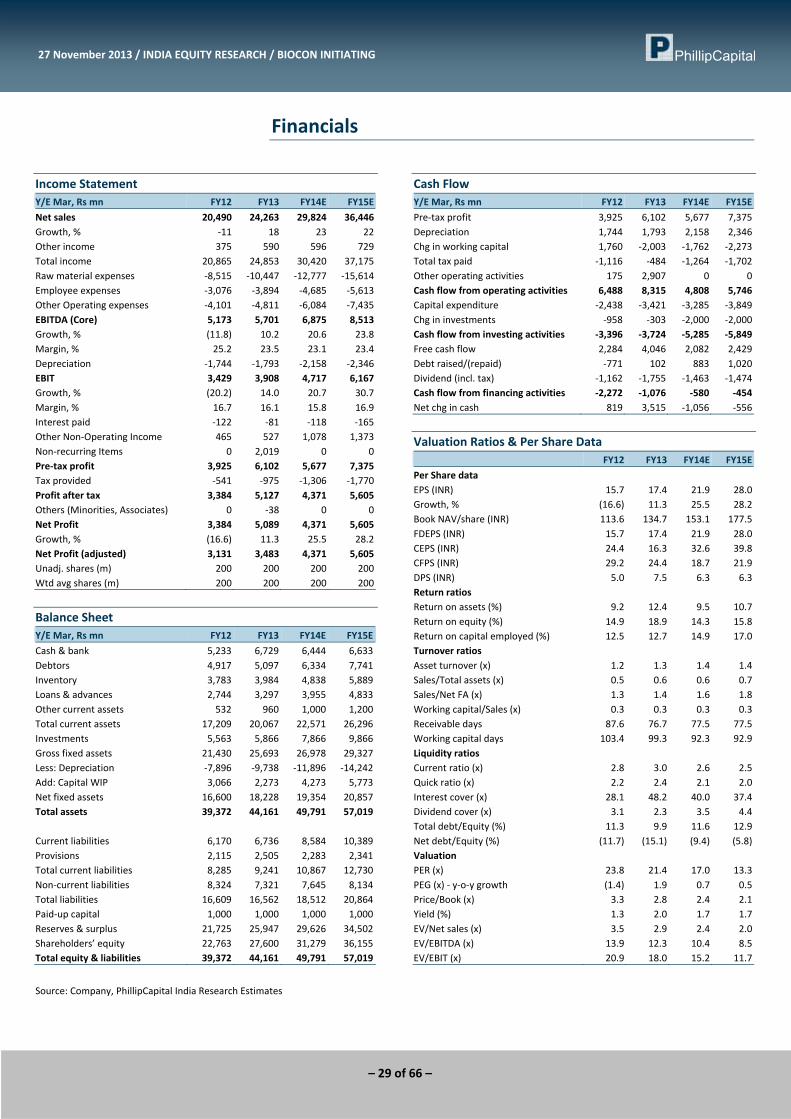
Financials
Income Statement Y/E Mar, Rs mn FY12 FY13 FY14E FY15E
Net sales 20,490 24,263 29,824 36,446Growth, % ‐11 18 23 22Other income 375 590 596 729Total income 20,865 24,853 30,420 37,175Raw material expenses ‐8,515 ‐10,447 ‐12,777 ‐15,614Employee expenses ‐3,076 ‐3,894 ‐4,685 ‐5,613Other Operating expenses ‐4,101 ‐4,811 ‐6,084 ‐7,435EBITDA (Core) 5,173 5,701 6,875 8,513Growth, % (11.8) 10.2 20.6 23.8Margin, % 25.2 23.5 23.1 23.4Depreciation ‐1,744 ‐1,793 ‐2,158 ‐2,346EBIT 3,429 3,908 4,717 6,167Growth, % (20.2) 14.0 20.7 30.7Margin, % 16.7 16.1 15.8 16.9Interest paid ‐122 ‐81 ‐118 ‐165Other Non‐Operating Income 465 527 1,078 1,373Non‐recurring Items 0 2,019 0 0Pre‐tax profit 3,925 6,102 5,677 7,375Tax provided ‐541 ‐975 ‐1,306 ‐1,770Profit after tax 3,384 5,127 4,371 5,605Others (Minorities, Associates) 0 ‐38 0 0Net Profit 3,384 5,089 4,371 5,605Growth, % (16.6) 11.3 25.5 28.2Net Profit (adjusted) 3,131 3,483 4,371 5,605Unadj. shares (m) 200 200 200 200Wtd avg shares (m) 200 200 200 200
Balance Sheet Y/E Mar, Rs mn FY12 FY13 FY14E FY15E
Cash & bank 5,233 6,729 6,444 6,633Debtors 4,917 5,097 6,334 7,741Inventory 3,783 3,984 4,838 5,889Loans & advances 2,744 3,297 3,955 4,833Other current assets 532 960 1,000 1,200Total current assets 17,209 20,067 22,571 26,296Investments 5,563 5,866 7,866 9,866Gross fixed assets 21,430 25,693 26,978 29,327Less: Depreciation ‐7,896 ‐9,738 ‐11,896 ‐14,242Add: Capital WIP 3,066 2,273 4,273 5,773Net fixed assets 16,600 18,228 19,354 20,857Total assets 39,372 44,161 49,791 57,019 Current liabilities 6,170 6,736 8,584 10,389Provisions 2,115 2,505 2,283 2,341Total current liabilities 8,285 9,241 10,867 12,730Non‐current liabilities 8,324 7,321 7,645 8,134Total liabilities 16,609 16,562 18,512 20,864Paid‐up capital 1,000 1,000 1,000 1,000Reserves & surplus 21,725 25,947 29,626 34,502Shareholders’ equity 22,763 27,600 31,279 36,155Total equity & liabilities 39,372 44,161 49,791 57,019
Source: Company, PhillipCapital India Research Estimates
Cash Flow Y/E Mar, Rs mn FY12 FY13 FY14E FY15E
Pre‐tax profit 3,925 6,102 5,677 7,375Depreciation 1,744 1,793 2,158 2,346Chg in working capital 1,760 ‐2,003 ‐1,762 ‐2,273Total tax paid ‐1,116 ‐484 ‐1,264 ‐1,702Other operating activities 175 2,907 0 0Cash flow from operating activities 6,488 8,315 4,808 5,746Capital expenditure ‐2,438 ‐3,421 ‐3,285 ‐3,849Chg in investments ‐958 ‐303 ‐2,000 ‐2,000Cash flow from investing activities ‐3,396 ‐3,724 ‐5,285 ‐5,849Free cash flow 2,284 4,046 2,082 2,429Debt raised/(repaid) ‐771 102 883 1,020Dividend (incl. tax) ‐1,162 ‐1,755 ‐1,463 ‐1,474Cash flow from financing activities ‐2,272 ‐1,076 ‐580 ‐454Net chg in cash 819 3,515 ‐1,056 ‐556
Valuation Ratios & Per Share Data FY12 FY13 FY14E FY15E
Per Share data EPS (INR) 15.7 17.4 21.9 28.0Growth, % (16.6) 11.3 25.5 28.2Book NAV/share (INR) 113.6 134.7 153.1 177.5FDEPS (INR) 15.7 17.4 21.9 28.0CEPS (INR) 24.4 16.3 32.6 39.8CFPS (INR) 29.2 24.4 18.7 21.9DPS (INR) 5.0 7.5 6.3 6.3Return ratios Return on assets (%) 9.2 12.4 9.5 10.7Return on equity (%) 14.9 18.9 14.3 15.8Return on capital employed (%) 12.5 12.7 14.9 17.0Turnover ratios Asset turnover (x) 1.2 1.3 1.4 1.4Sales/Total assets (x) 0.5 0.6 0.6 0.7Sales/Net FA (x) 1.3 1.4 1.6 1.8Working capital/Sales (x) 0.3 0.3 0.3 0.3Receivable days 87.6 76.7 77.5 77.5Working capital days 103.4 99.3 92.3 92.9Liquidity ratios Current ratio (x) 2.8 3.0 2.6 2.5Quick ratio (x) 2.2 2.4 2.1 2.0Interest cover (x) 28.1 48.2 40.0 37.4Dividend cover (x) 3.1 2.3 3.5 4.4Total debt/Equity (%) 11.3 9.9 11.6 12.9Net debt/Equity (%) (11.7) (15.1) (9.4) (5.8)Valuation PER (x) 23.8 21.4 17.0 13.3PEG (x) ‐ y‐o‐y growth (1.4) 1.9 0.7 0.5Price/Book (x) 3.3 2.8 2.4 2.1Yield (%) 1.3 2.0 1.7 1.7EV/Net sales (x) 3.5 2.9 2.4 2.0EV/EBITDA (x) 13.9 12.3 10.4 8.5EV/EBIT (x) 20.9 18.0 15.2 11.7

– 30 of 66 –
Cadila Healthcare US generics seems only sweet spot
PHARMACEUTICALS: Initiating Coverage 27 November 2013
PhillipCapital (India) Pvt. Ltd.
Improving visibility on ANDA approvals brightens FY15 US growth Cadila’s quality and cost effective generic drug offerings have made it the 10th largest US generic players and helped it deliver 40% revenue CAGR over the last five years to Rs 15.1bn in FY13. At the same time, the slowing ANDA approvals despite improved ANDA fillings has been the key concern for Cadila in recent past. However, the improved visibility on drug approvals after receipt of complete response from the FDA has brightened the US growth prospects in medium term. The management expects to launch more than 20 products (v/s 7 in FY13) over the next 12‐15 months in the US. We estimate Cadila’s US generics to deliver a compounded annual growth of 21% over FY13‐15 to Rs 22.2bn. Complex technology Initiatives ensures strong future growth but lacks visibility Cadila has rapidly increased it R&D spend at ~70% CAGR over last three years to Rs 4.7bn (7.4% of sales) in FY13, in order to upgrade its drug portfolio to complex technology class including – transdermal, inhalers, controlled release drugs, biologic/biosimilars and NCEs. Such initiatives has certainly enhanced the future growth visibility of Cadila but all those lacks commercial visibility. Domestic formulations to moderated growth despite Lipaglyn launch Cadila, with a strategy to widen its foot hold in domestic formulations acquired Biochem during late FY12, which sharply reduced the share of its chronic therapy from 58% of sales in FY11 to 31% in FY13. Given the fact of lower chronic sales contribution and adverse impact of new pricing policy (~Rs 900mn) we expect moderate revenue growth of 12% CAGR over FY13‐15 (v/s 16% CAGR over FY09‐13) to Rs 29.4bn in FY15. The launch of innovative drug Lipaglyn may not have any major play in near to medium term. Reducing profitability of JVs remain as a concern Super operational excellence and high profitability of its Hospira and Nycomed JV has certainly made Cadila a preffered partner for JVs. But the progressive decline in the cumulative profitability of its JVs, due to increased competition has been a a concern for Cadila in recent past. The cumulative EBITDA margin of its all JVs has, infact, declined from ~60% in FY11 to 45% in FY13. Moreover, the likely muted growth in the JV sales during FY13‐15 is further worrisome. Lacks key earning triggers in near term; Initiate with Neutral rating and target price of Rs 761 Despite improved visibility in US generic launches, we estimate Cadila’s revenue and profits to grow at a moderate CAGR of 15% and 14% over FY13‐15E. Our EPS estimates for FY14E and FY15E stands at Rs 32.5 and Rs 42.2 (against Rs 31.9 in FY13), respectively. At CMP of Rs 742, the stock trades at 17.6x FY15E EPS and 12.5x FY15E EV/EBITDA, which is ~10% discount to its peers. We believe the discount is justified considering no major earnings trigger and concerns over profitability in near term. We value Cadila at 18x FY15 EPS, giving us a price target of Rs 761, implying 3% upside from current levels. We initiate with a Neutral rating and target price of Rs 761/share.
NEUTRAL CDH IN | CMP RS 742
TARGET RS 761 (+3%) Company Data
O/S SHARES (MN) : 205MARKET CAP (RSBN) : 152MARKET CAP (USDBN) : 2.452 ‐ WK HI/LO (RS) : 925 / 631LIQUIDITY 3M (USDMN) : 1.5FACE VALUE (RS) : 5
Share Holding Pattern, %
PROMOTERS : 74.8FII / NRI : 6.0FI / MF : 9.0NON PROMOTER CORP. HOLDINGS : 4.6PUBLIC & OTHERS : 5.6
Price Performance, % 1mth 3mth 1yr
ABS 11.7 13.1 ‐9.6REL TO BSE 13.1 3.2 ‐19.7
Price Vs. Sensex (Rebased values)
50
100
150
200
Apr‐10 Jun‐11 Aug‐12 Oct‐13
Cadila BSE Sensex
Source: Bloomberg, Phillip Capital Research
Other Key Ratios
Rs mn FY13 FY14E FY15E
Net Sales 61,552 70,185 81,137EBIDTA 11,251 11,301 14,234Net Profit 6,701 6,664 8,635EPS, Rs 32.7 32.5 42.2PER, x 22.7 22.8 17.6EV/EBIDTA, x 15.6 15.7 12.5P/BV, x 5.2 4.6 4.0ROE, % 22.2 20.1 22.5Debt/Equity (%) 101.1 95.5 81.8Source: Phillip Capital India Research Surya Patra (+ 9122 6667 9768) [email protected]
– 31 of 66 –
27 November 2013 / INDIA EQUITY RESEARCH / CADILA HEALTHCARE INITIATING
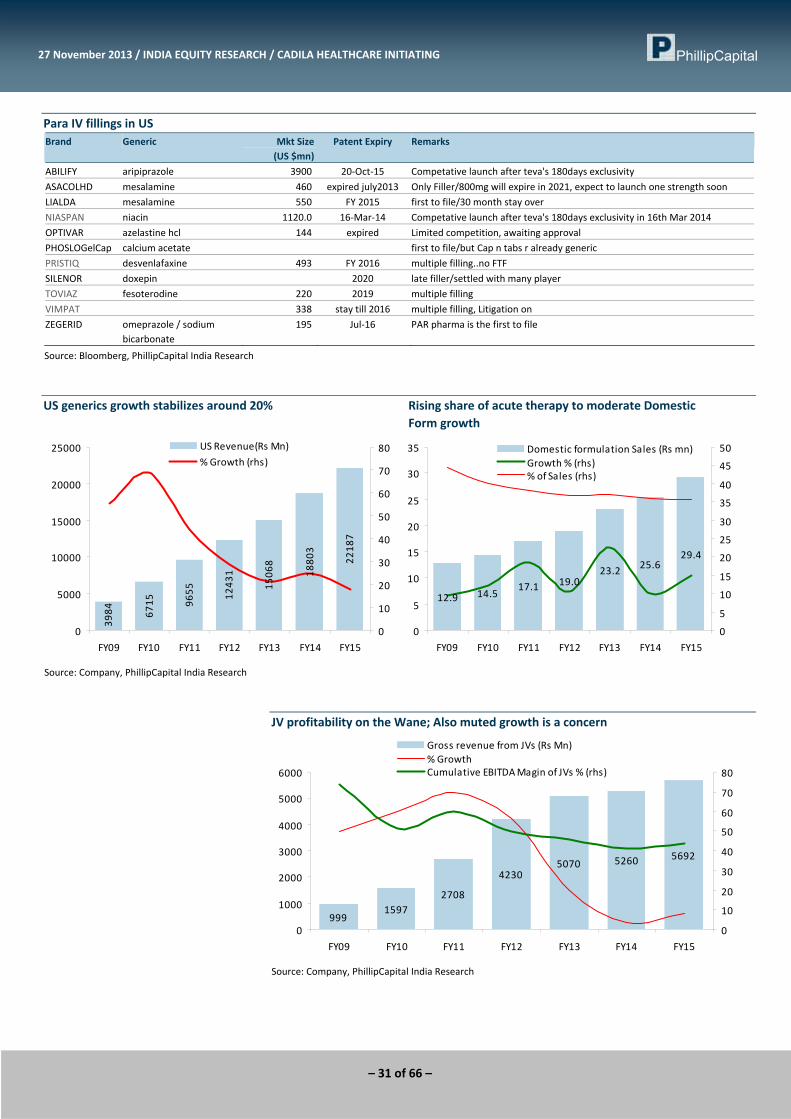
Para IV fillings in US Brand Generic Mkt Size
(US $mn) Patent Expiry Remarks
ABILIFY aripiprazole 3900 20‐Oct‐15 Competative launch after teva's 180days exclusivity
ASACOLHD mesalamine 460 expired july2013 Only Filler/800mg will expire in 2021, expect to launch one strength soon
LIALDA mesalamine 550 FY 2015 first to file/30 month stay over
NIASPAN niacin 1120.0 16‐Mar‐14 Competative launch after teva's 180days exclusivity in 16th Mar 2014
OPTIVAR azelastine hcl 144 expired Limited competition, awaiting approval
PHOSLOGelCap calcium acetate first to file/but Cap n tabs r already generic
PRISTIQ desvenlafaxine 493 FY 2016 multiple filling..no FTF
SILENOR doxepin 2020 late filler/settled with many player
TOVIAZ fesoterodine 220 2019 multiple filling
VIMPAT 338 stay till 2016 multiple filling, Litigation on
ZEGERID omeprazole / sodium bicarbonate
195 Jul‐16 PAR pharma is the first to file
Source: Bloomberg, PhillipCapital India Research
US generics growth stabilizes around 20% Rising share of acute therapy to moderate Domestic Form growth
3984 6715 9655 1243
1
1506
8
1880
3
2218
7
0
5000
10000
15000
20000
25000
FY09 FY10 FY11 FY12 FY13 FY14 FY15
0
10
20
30
40
50
60
70
80US Revenue(Rs Mn)
% Growth (rhs)
12.9 14.517.1 19.0
23.2 25.629.4
0
5
10
15
20
25
30
35
FY09 FY10 FY11 FY12 FY13 FY14 FY15
0
5
10
15
20
25
30
35
40
45
50Domestic formulation Sales (Rs mn)Growth % (rhs)% of Sales (rhs)
Source: Company, PhillipCapital India Research
JV profitability on the Wane; Also muted growth is a concern
9991597
2708
42305070 5260 5692
0
1000
2000
3000
4000
5000
6000
FY09 FY10 FY11 FY12 FY13 FY14 FY15
0
10
20
30
40
50
60
70
80
Gross revenue from JVs (Rs Mn)% GrowthCumulative EBITDA Magin of JVs % (rhs)
Source: Company, PhillipCapital India Research
– 32 of 66 –
27 November 2013 / INDIA EQUITY RESEARCH / CADILA HEALTHCARE INITIATING
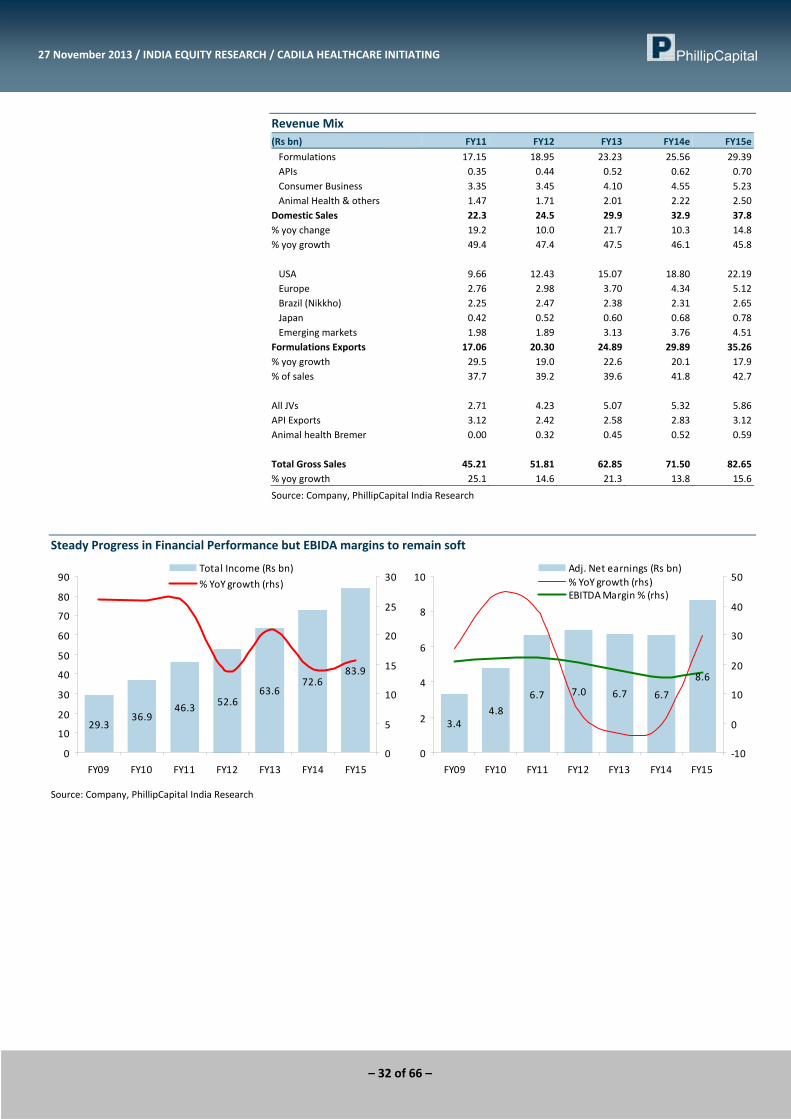
Revenue Mix (Rs bn) FY11 FY12 FY13 FY14e FY15e
Formulations 17.15 18.95 23.23 25.56 29.39 APIs 0.35 0.44 0.52 0.62 0.70 Consumer Business 3.35 3.45 4.10 4.55 5.23 Animal Health & others 1.47 1.71 2.01 2.22 2.50Domestic Sales 22.3 24.5 29.9 32.9 37.8% yoy change 19.2 10.0 21.7 10.3 14.8% yoy growth 49.4 47.4 47.5 46.1 45.8 USA 9.66 12.43 15.07 18.80 22.19 Europe 2.76 2.98 3.70 4.34 5.12 Brazil (Nikkho) 2.25 2.47 2.38 2.31 2.65 Japan 0.42 0.52 0.60 0.68 0.78 Emerging markets 1.98 1.89 3.13 3.76 4.51Formulations Exports 17.06 20.30 24.89 29.89 35.26% yoy growth 29.5 19.0 22.6 20.1 17.9% of sales 37.7 39.2 39.6 41.8 42.7 All JVs 2.71 4.23 5.07 5.32 5.86API Exports 3.12 2.42 2.58 2.83 3.12Animal health Bremer 0.00 0.32 0.45 0.52 0.59 Total Gross Sales 45.21 51.81 62.85 71.50 82.65% yoy growth 25.1 14.6 21.3 13.8 15.6
Source: Company, PhillipCapital India Research
Steady Progress in Financial Performance but EBIDA margins to remain soft
29.336.9
46.3 52.663.6
72.683.9
0
10
20
30
40
50
60
70
80
90
FY09 FY10 FY11 FY12 FY13 FY14 FY15
0
5
10
15
20
25
30Total Income (Rs bn)
% YoY growth (rhs)
3.44.8
6.7 7.0 6.7 6.7
8.6
0
2
4
6
8
10
FY09 FY10 FY11 FY12 FY13 FY14 FY15
‐10
0
10
20
30
40
50Adj. Net earnings (Rs bn)% YoY growth (rhs)EBITDA Margin % (rhs)
Source: Company, PhillipCapital India Research
– 33 of 66 –
27 November 2013 / INDIA EQUITY RESEARCH / CADILA HEALTHCARE INITIATING
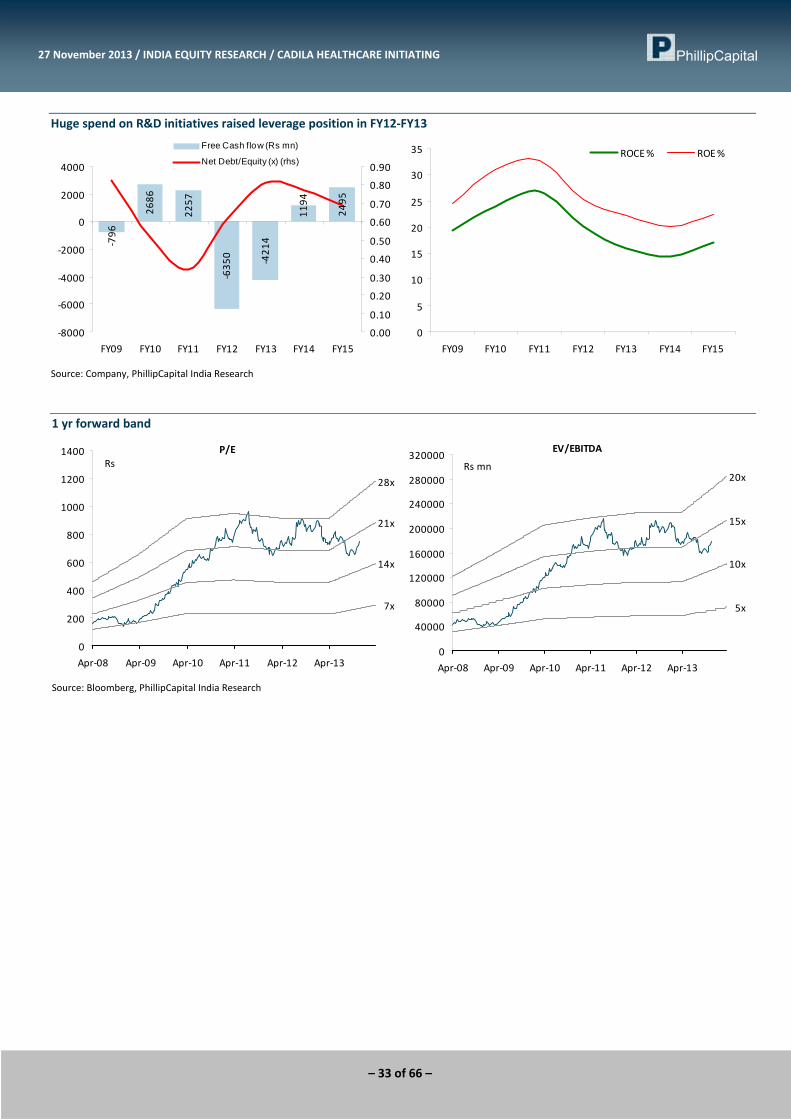
Huge spend on R&D initiatives raised leverage position in FY12‐FY13 ‐796
2686
2257
‐635
0 ‐421
4
1194
2495
‐8000
‐6000
‐4000
‐2000
0
2000
4000
FY09 FY10 FY11 FY12 FY13 FY14 FY15
0.00
0.10
0.20
0.30
0.40
0.50
0.60
0.70
0.80
0.90
Free Cash flow (Rs mn)
Net Debt/Equity (x) (rhs)
0
5
10
15
20
25
30
35
FY09 FY10 FY11 FY12 FY13 FY14 FY15
ROCE % ROE %
Source: Company, PhillipCapital India Research
1 yr forward band
P/E
7x
14x
21x
28x
0
200
400
600
800
1000
1200
1400
Apr‐08 Apr‐09 Apr‐10 Apr‐11 Apr‐12 Apr‐13
RsEV/EBITDA
5x
10x
15x
20x
0
40000
80000
120000
160000
200000
240000
280000
320000
Apr‐08 Apr‐09 Apr‐10 Apr‐11 Apr‐12 Apr‐13
Rs mn
Source: Bloomberg, PhillipCapital India Research

– 34 of 66 –
27 November 2013 / INDIA EQUITY RESEARCH / CADILA HEALTHCARE INITIATING
Financials
Income Statement Y/E Mar, Rs mn FY12 FY13 FY14E FY15E
Net sales 50,900 61,552 70,185 81,137Growth, % 14 21 14 16Other income 1,733 2,025 2,386 2,759Total income 52,633 63,577 72,571 83,895Raw material expenses ‐16,794 ‐23,202 ‐25,763 ‐29,363Employee expenses ‐7,512 ‐9,042 ‐10,398 ‐11,438Other Operating expenses ‐17,489 ‐20,082 ‐25,110 ‐28,860EBITDA (Core) 10,839 11,251 11,301 14,234Growth, % 5.6 3.8 0.4 26.0Margin, % 21.3 18.3 16.1 17.5Depreciation ‐1,579 ‐1,847 ‐2,132 ‐2,474EBIT 9,260 9,404 9,169 11,760Growth, % 3.0 1.6 (2.5) 28.3Margin, % 18.2 15.3 13.1 14.5Interest paid ‐1,069 ‐1,262 ‐1,424 ‐1,570Other Non‐Operating Income 532 370 508 503Pre‐tax profit 7,942 8,087 8,253 10,693Tax provided ‐1,130 ‐1,188 ‐1,238 ‐1,604Profit after tax 6,812 6,899 7,015 9,089Others (Minorities, Associates) ‐286 ‐364 ‐351 ‐454Net Profit 6,526 6,535 6,664 8,635Growth, % 4.2 (3.6) (0.6) 29.6Net Profit (adjusted) 6,954 6,701 6,664 8,635Unadj. shares (m) 205 205 205 205Wtd avg shares (m) 205 205 205 205
Balance Sheet Y/E Mar, Rs mn FY12 FY13 FY14E FY15E
Cash & bank 4,666 5,838 6,081 4,918Debtors 8,863 9,551 11,087 12,817Inventory 10,905 12,136 14,126 16,061Loans & advances 5,377 6,771 7,257 8,390Other current assets 421 669 750 850Total current assets 30,232 34,965 39,301 43,036Investments 242 1,145 1,145 1,145Gross fixed assets 40,229 43,762 51,993 57,533Less: Depreciation ‐11,750 ‐13,506 ‐15,638 ‐18,112Add: Capital WIP 4,839 7,356 4,500 4,500Net fixed assets 33,318 37,612 40,856 43,921Total assets 63,792 73,722 81,302 88,102 Current liabilities 12,379 9,313 11,087 12,817Provisions 3,037 3,118 3,211 3,304Total current liabilities 15,416 12,431 14,298 16,121Non‐current liabilities 21,705 30,711 32,655 32,404Total liabilities 37,121 43,142 46,953 48,526Paid‐up capital 1,024 1,024 1,024 1,024Reserves & surplus 24,712 28,363 32,132 37,360Shareholders’ equity 26,671 30,580 34,348 39,577Total equity & liabilities 63,792 73,722 81,302 88,102
Source: Company, PhillipCapital India Research Estimates
Cash Flow Y/E Mar, Rs mn FY12 FY13 FY14E FY15E
Pre‐tax profit 7,942 8,087 8,253 10,693Depreciation 1,579 1,847 2,132 2,474Chg in working capital ‐2,019 ‐6,546 ‐2,227 ‐3,074Total tax paid ‐1,072 ‐1,368 ‐1,238 ‐1,604Other operating activities ‐2,474 ‐2,915 0 0Cash flow from operating activities 3,956 ‐895 6,920 8,490Capital expenditure ‐12,261 ‐6,141 ‐5,375 ‐5,540Chg in investments ‐35 ‐903 0 0Cash flow from investing activities ‐12,296 ‐7,044 ‐5,375 ‐5,540Free cash flow ‐6,350 ‐4,214 1,194 2,495Debt raised/(repaid) 10,105 9,186 1,944 ‐251Cash flow from financing activities 10,054 9,111 1,594 ‐706Net chg in cash 1,714 1,172 3,138 2,244
Valuation Ratios & Per Share Data FY12 FY13 FY14E FY15E
Per Share data EPS (INR) 34.0 32.7 32.5 42.2Growth, % 4.2 (3.6) (0.6) 29.6Book NAV/share (INR) 125.9 143.5 161.9 187.5FDEPS (INR) 34.0 32.7 32.5 42.2CEPS (INR) 41.7 41.8 43.0 54.3CFPS (INR) 28.8 8.1 31.3 39.0Return ratios Return on assets (%) 13.6 11.2 10.2 11.9Return on equity (%) 25.3 22.2 20.1 22.5Return on capital employed (%) 20.3 15.9 14.4 17.0Turnover ratios Asset turnover (x) 1.3 1.2 1.2 1.2Sales/Total assets (x) 0.9 0.9 0.9 1.0Sales/Net FA (x) 1.8 1.7 1.8 1.9Working capital/Sales (x) 0.3 0.3 0.3 0.3Receivable days 63.6 56.6 57.7 57.7Working capital days 94.6 117.5 115.1 113.8Liquidity ratios Current ratio (x) 2.4 3.8 3.5 3.4Quick ratio (x) 1.6 2.5 2.3 2.1Interest cover (x) 8.7 7.5 6.4 7.5Total debt/Equity (%) 79.6 101.1 95.5 81.8Net debt/Equity (%) 61.5 81.2 77.1 69.0Valuation PER (x) 21.8 22.7 22.8 17.6PEG (x) ‐ y‐o‐y growth 5.2 (6.2) (41.3) 0.6Price/Book (x) 5.9 5.2 4.6 4.0EV/Net sales (x) 3.3 2.9 2.5 2.2EV/EBITDA (x) 15.5 15.6 15.7 12.5EV/EBIT (x) 18.1 18.7 19.4 15.2
– 35 of 66 –
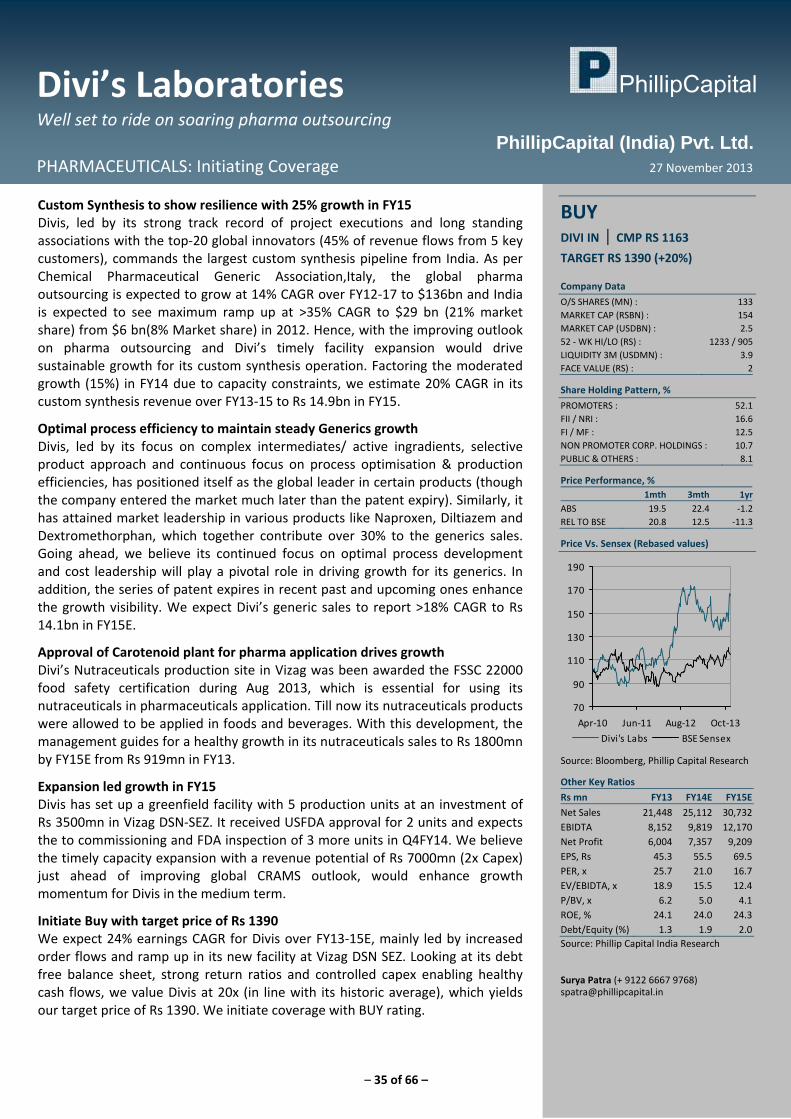
Divi’s Laboratories Well set to ride on soaring pharma outsourcing
PHARMACEUTICALS: Initiating Coverage 27 November 2013
PhillipCapital (India) Pvt. Ltd.
Custom Synthesis to show resilience with 25% growth in FY15 Divis, led by its strong track record of project executions and long standing associations with the top‐20 global innovators (45% of revenue flows from 5 key customers), commands the largest custom synthesis pipeline from India. As per Chemical Pharmaceutical Generic Association,Italy, the global pharma outsourcing is expected to grow at 14% CAGR over FY12‐17 to $136bn and India is expected to see maximum ramp up at >35% CAGR to $29 bn (21% market share) from $6 bn(8% Market share) in 2012. Hence, with the improving outlook on pharma outsourcing and Divi’s timely facility expansion would drive sustainable growth for its custom synthesis operation. Factoring the moderated growth (15%) in FY14 due to capacity constraints, we estimate 20% CAGR in its custom synthesis revenue over FY13‐15 to Rs 14.9bn in FY15.
Optimal process efficiency to maintain steady Generics growth Divis, led by its focus on complex intermediates/ active ingradients, selective product approach and continuous focus on process optimisation & production efficiencies, has positioned itself as the global leader in certain products (though the company entered the market much later than the patent expiry). Similarly, it has attained market leadership in various products like Naproxen, Diltiazem and Dextromethorphan, which together contribute over 30% to the generics sales. Going ahead, we believe its continued focus on optimal process development and cost leadership will play a pivotal role in driving growth for its generics. In addition, the series of patent expires in recent past and upcoming ones enhance the growth visibility. We expect Divi’s generic sales to report >18% CAGR to Rs 14.1bn in FY15E.
Approval of Carotenoid plant for pharma application drives growth Divi’s Nutraceuticals production site in Vizag was been awarded the FSSC 22000 food safety certification during Aug 2013, which is essential for using its nutraceuticals in pharmaceuticals application. Till now its nutraceuticals products were allowed to be applied in foods and beverages. With this development, the management guides for a healthy growth in its nutraceuticals sales to Rs 1800mn by FY15E from Rs 919mn in FY13.
Expansion led growth in FY15 Divis has set up a greenfield facility with 5 production units at an investment of Rs 3500mn in Vizag DSN‐SEZ. It received USFDA approval for 2 units and expects the to commissioning and FDA inspection of 3 more units in Q4FY14. We believe the timely capacity expansion with a revenue potential of Rs 7000mn (2x Capex) just ahead of improving global CRAMS outlook, would enhance growth momentum for Divis in the medium term.
Initiate Buy with target price of Rs 1390 We expect 24% earnings CAGR for Divis over FY13‐15E, mainly led by increased order flows and ramp up in its new facility at Vizag DSN SEZ. Looking at its debt free balance sheet, strong return ratios and controlled capex enabling healthy cash flows, we value Divis at 20x (in line with its historic average), which yields our target price of Rs 1390. We initiate coverage with BUY rating.
BUY DIVI IN | CMP RS 1163
TARGET RS 1390 (+20%) Company Data
O/S SHARES (MN) : 133MARKET CAP (RSBN) : 154MARKET CAP (USDBN) : 2.552 ‐ WK HI/LO (RS) : 1233 / 905LIQUIDITY 3M (USDMN) : 3.9FACE VALUE (RS) : 2
Share Holding Pattern, %
PROMOTERS : 52.1FII / NRI : 16.6FI / MF : 12.5NON PROMOTER CORP. HOLDINGS : 10.7PUBLIC & OTHERS : 8.1
Price Performance, % 1mth 3mth 1yr
ABS 19.5 22.4 ‐1.2REL TO BSE 20.8 12.5 ‐11.3
Price Vs. Sensex (Rebased values)
70
90
110
130
150
170
190
Apr‐10 Jun‐11 Aug‐12 Oct‐13
Divi's Labs BSE Sensex
Source: Bloomberg, Phillip Capital Research
Other Key Ratios
Rs mn FY13 FY14E FY15E
Net Sales 21,448 25,112 30,732EBIDTA 8,152 9,819 12,170Net Profit 6,004 7,357 9,209EPS, Rs 45.3 55.5 69.5PER, x 25.7 21.0 16.7EV/EBIDTA, x 18.9 15.5 12.4P/BV, x 6.2 5.0 4.1ROE, % 24.1 24.0 24.3Debt/Equity (%) 1.3 1.9 2.0Source: Phillip Capital India Research Surya Patra (+ 9122 6667 9768) [email protected]
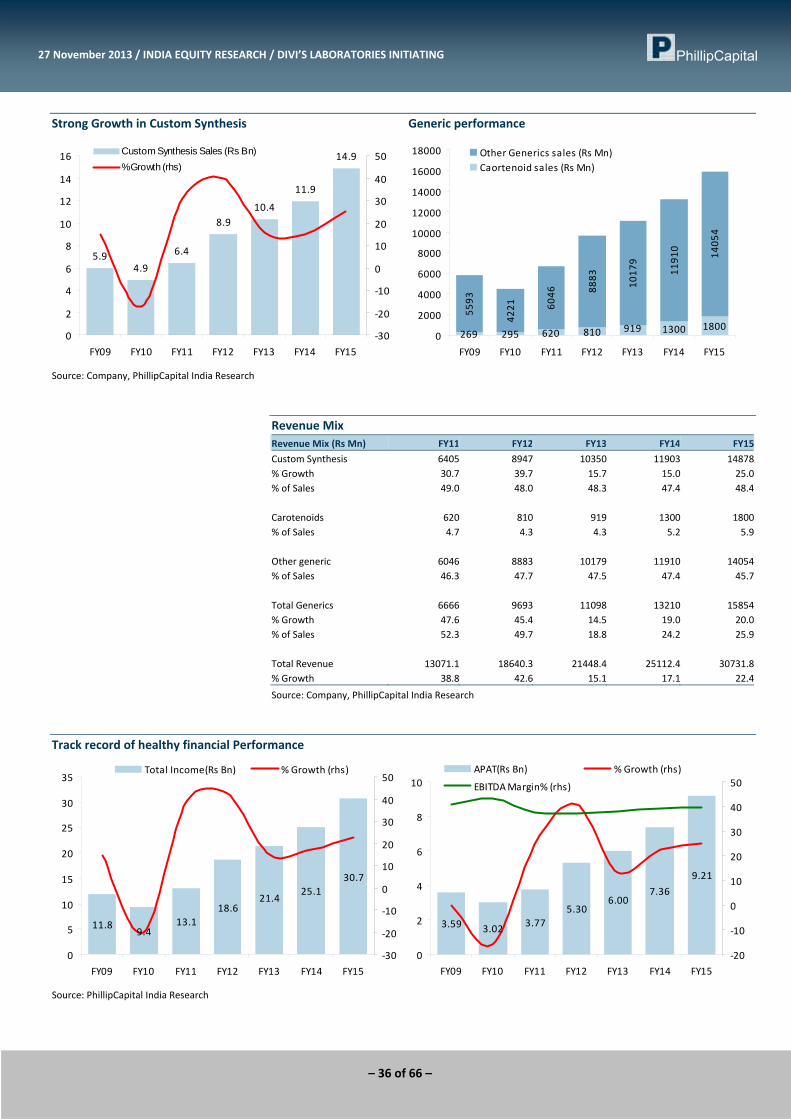
– 36 of 66 –
27 November 2013 / INDIA EQUITY RESEARCH / DIVI’S LABORATORIES INITIATING
Strong Growth in Custom Synthesis Generic performance
5.94.9
6.4
8.910.4
11.9
14.9
0
2
4
6
8
10
12
14
16
FY09 FY10 FY11 FY12 FY13 FY14 FY15
‐30
‐20
‐10
0
10
20
30
40
50Custom Synthesis Sales (Rs Bn)% Growth (rhs)
269 295 620 810 1300 1800
5593
4221 60
46 8883
1017
9
1191
0
1405
4
9190
2000
4000
6000
8000
10000
12000
14000
16000
18000
FY09 FY10 FY11 FY12 FY13 FY14 FY15
Other Generics sales (Rs Mn)Caortenoid sales (Rs Mn)
Source: Company, PhillipCapital India Research
Revenue Mix Revenue Mix (Rs Mn) FY11 FY12 FY13 FY14 FY15
Custom Synthesis 6405 8947 10350 11903 14878% Growth 30.7 39.7 15.7 15.0 25.0% of Sales 49.0 48.0 48.3 47.4 48.4 Carotenoids 620 810 919 1300 1800% of Sales 4.7 4.3 4.3 5.2 5.9 Other generic 6046 8883 10179 11910 14054% of Sales 46.3 47.7 47.5 47.4 45.7 Total Generics 6666 9693 11098 13210 15854% Growth 47.6 45.4 14.5 19.0 20.0% of Sales 52.3 49.7 18.8 24.2 25.9 Total Revenue 13071.1 18640.3 21448.4 25112.4 30731.8% Growth 38.8 42.6 15.1 17.1 22.4
Source: Company, PhillipCapital India Research
Track record of healthy financial Performance
11.89.4
13.118.6
25.130.7
21.4
0
5
10
15
20
25
30
35
FY09 FY10 FY11 FY12 FY13 FY14 FY15
‐30
‐20
‐10
0
10
20
30
40
50Total Income(Rs Bn) % Growth (rhs)
3.59 3.02 3.775.30
7.36
9.21
6.00
0
2
4
6
8
10
FY09 FY10 FY11 FY12 FY13 FY14 FY15
‐20
‐10
0
10
20
30
40
50APAT(Rs Bn) % Growth (rhs)
EBITDA Margin% (rhs)
Source: PhillipCapital India Research
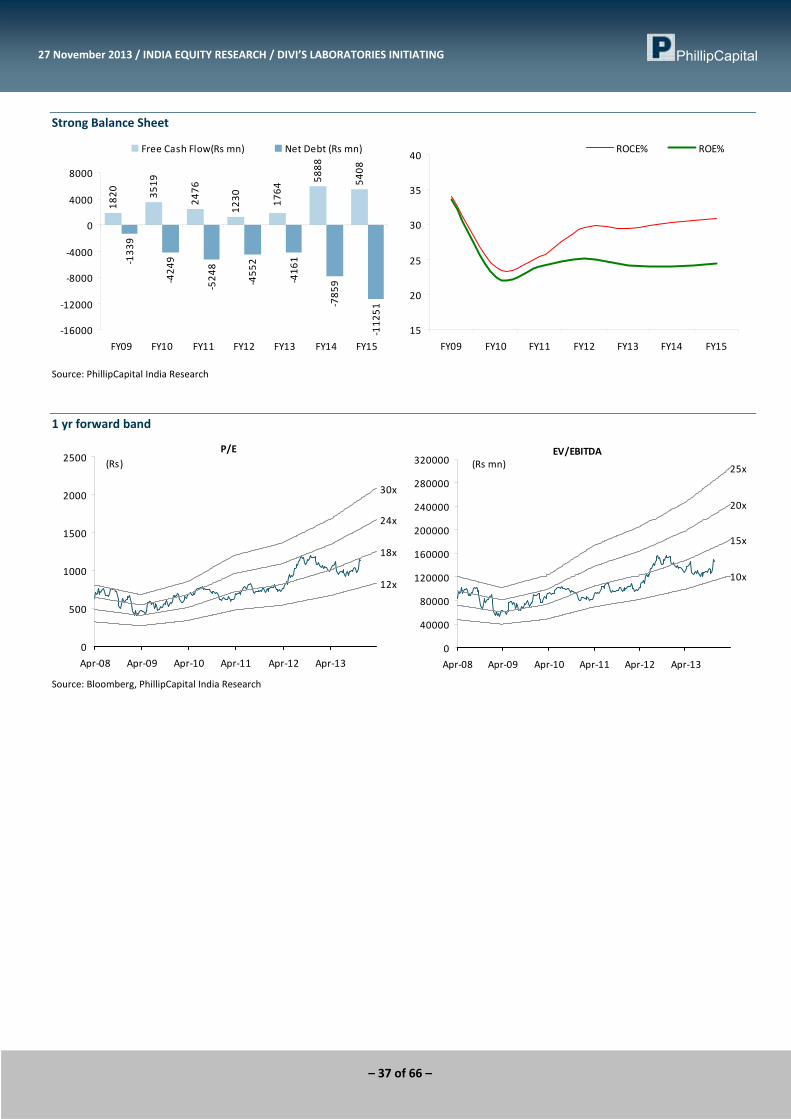
– 37 of 66 –
27 November 2013 / INDIA EQUITY RESEARCH / DIVI’S LABORATORIES INITIATING
Strong Balance Sheet 18
20 3519
2476
1230
5888
5408
‐133
9
‐424
9
‐524
8
‐455
2
‐416
1
‐785
9
‐112
51
1764
‐16000
‐12000
‐8000
‐4000
0
4000
8000
FY09 FY10 FY11 FY12 FY13 FY14 FY15
Free Cash Flow(Rs mn) Net Debt (Rs mn)
15
20
25
30
35
40
FY09 FY10 FY11 FY12 FY13 FY14 FY15
ROCE% ROE%
Source: PhillipCapital India Research
1 yr forward band
P/E
12x
18x
24x
30x
0
500
1000
1500
2000
2500
Apr‐08 Apr‐09 Apr‐10 Apr‐11 Apr‐12 Apr‐13
(Rs)
EV/EBITDA
10x
15x
20x
25x
0
40000
80000
120000
160000
200000
240000
280000
320000
Apr‐08 Apr‐09 Apr‐10 Apr‐11 Apr‐12 Apr‐13
(Rs mn)
Source: Bloomberg, PhillipCapital India Research

– 38 of 66 –
27 November 2013 / INDIA EQUITY RESEARCH / DIVI’S LABORATORIES INITIATING
Financials
Income Statement Y/E Mar, Rs mn FY12 FY13 FY14E FY15E
Net sales 18,640 21,448 25,112 30,732Growth, % 43 15 17 22Total income 18,640 21,448 25,112 30,732Raw material expenses ‐7,616 ‐7,986 ‐8,814 ‐10,756Employee expenses ‐1,509 ‐1,977 ‐2,536 ‐2,981Other Operating expenses ‐2,611 ‐3,333 ‐3,943 ‐4,825EBITDA (Core) 6,904 8,152 9,819 12,170Growth, % 40.5 18.1 20.5 23.9Margin, % 37.0 38.0 39.1 39.6Depreciation ‐621 ‐769 ‐932 ‐1,108EBIT 6,283 7,382 8,887 11,062Growth, % 43.4 17.5 20.4 24.5Margin, % 33.7 34.4 35.4 36.0Interest paid ‐37 ‐18 ‐35 ‐50Other Non‐Operating Income 382 334 703 947Pre‐tax profit 6,806 7,812 9,555 11,959Tax provided ‐1,474 ‐1,792 ‐2,198 ‐2,751Profit after tax 5,333 6,020 7,357 9,209Net Profit 5,333 6,020 7,357 9,209Growth, % 40.7 13.2 22.5 25.2Net Profit (adjusted) 5,302 6,004 7,357 9,209Unadj. shares (m) 133 133 133 133Wtd avg shares (m) 133 133 133 133
Balance Sheet Y/E Mar, Rs mn FY12 FY13 FY14E FY15E
Cash & bank 309 409 2,359 3,941Debtors 4,956 5,120 6,627 8,110Inventory 6,790 8,357 8,496 10,312Loans & advances 1,469 1,236 1,909 2,336Other current assets 68 67 90 90Total current assets 13,592 15,188 19,481 24,789Investments 4,770 4,078 6,078 8,078Gross fixed assets 10,921 13,383 16,953 19,101Less: Depreciation ‐3,536 ‐4,296 ‐5,229 ‐6,337Add: Capital WIP 1,820 3,034 500 500Net fixed assets 9,204 12,121 12,224 13,264Total assets 27,567 31,388 37,783 46,131 Current liabilities 3,016 2,905 4,185 5,122Provisions 2,099 2,358 2,054 2,083Total current liabilities 5,115 5,263 6,240 7,205Non‐current liabilities 1,136 1,118 904 1,094Total liabilities 6,251 6,382 7,143 8,299Paid‐up capital 265 265 265 265Reserves & surplus 21,050 24,741 30,374 37,567Shareholders’ equity 21,315 25,006 30,640 37,832Total equity & liabilities 27,567 31,388 37,783 46,131
Source: Company, PhillipCapital India Research Estimates
Cash Flow Y/E Mar, Rs mn FY12 FY13 FY14E FY15E
Pre‐tax profit 6,806 7,812 9,555 11,959Depreciation 621 769 932 1,108Chg in working capital ‐1,883 ‐1,348 ‐1,366 ‐2,761Total tax paid ‐1,365 ‐1,609 ‐2,664 ‐2,751Other operating activities ‐2,016 ‐2,330 0 0Cash flow from operating activities 2,163 3,295 6,457 7,556Capital expenditure ‐2,882 ‐3,687 ‐1,035 ‐2,148Chg in investments 486 692 ‐2,000 ‐2,000Cash flow from investing activities ‐2,396 ‐2,994 ‐3,035 ‐4,148Free cash flow 1,230 1,764 5,888 5,408Equity raised/(repaid) 24 0 0 0Debt raised/(repaid) 342 ‐201 251 191Cash flow from financing activities 366 ‐201 251 191Net chg in cash 133 99 3,673 3,599
Valuation Ratios & Per Share Data FY12 FY13 FY14E FY15E
Per Share data EPS (INR) 40.0 45.3 55.5 69.5Growth, % 40.7 13.2 22.5 25.2Book NAV/share (INR) 160.8 188.7 231.2 285.4FDEPS (INR) 40.0 45.3 55.5 69.5CEPS (INR) 44.7 51.1 62.5 77.8CFPS (INR) 28.6 39.9 43.4 49.9Return ratios Return on assets (%) 21.3 20.5 21.3 22.0Return on equity (%) 25.0 24.1 24.0 24.3Return on capital employed (%) 29.7 29.5 30.4 30.9Turnover ratios Asset turnover (x) 1.1 1.0 1.0 1.1Sales/Total assets (x) 0.7 0.7 0.7 0.7Sales/Net FA (x) 2.3 2.0 2.1 2.4Working capital/Sales (x) 0.6 0.6 0.5 0.5Receivable days 97.0 87.1 96.3 96.3Working capital days 201.0 202.1 188.0 186.8Liquidity ratios Current ratio (x) 4.5 5.2 4.7 4.8Quick ratio (x) 2.3 2.4 2.6 2.8Interest cover (x) 168.0 415.5 256.4 221.5Total debt/Equity (%) 2.5 1.3 1.9 2.0Net debt/Equity (%) 1.0 (0.3) (5.8) (8.4)Valuation PER (x) 29.1 25.7 21.0 16.7PEG (x) ‐ y‐o‐y growth 0.7 1.9 0.9 0.7Price/Book (x) 7.2 6.2 5.0 4.1EV/Net sales (x) 8.3 7.2 6.1 4.9EV/EBITDA (x) 22.4 18.9 15.5 12.4EV/EBIT (x) 24.6 20.9 17.1 13.6
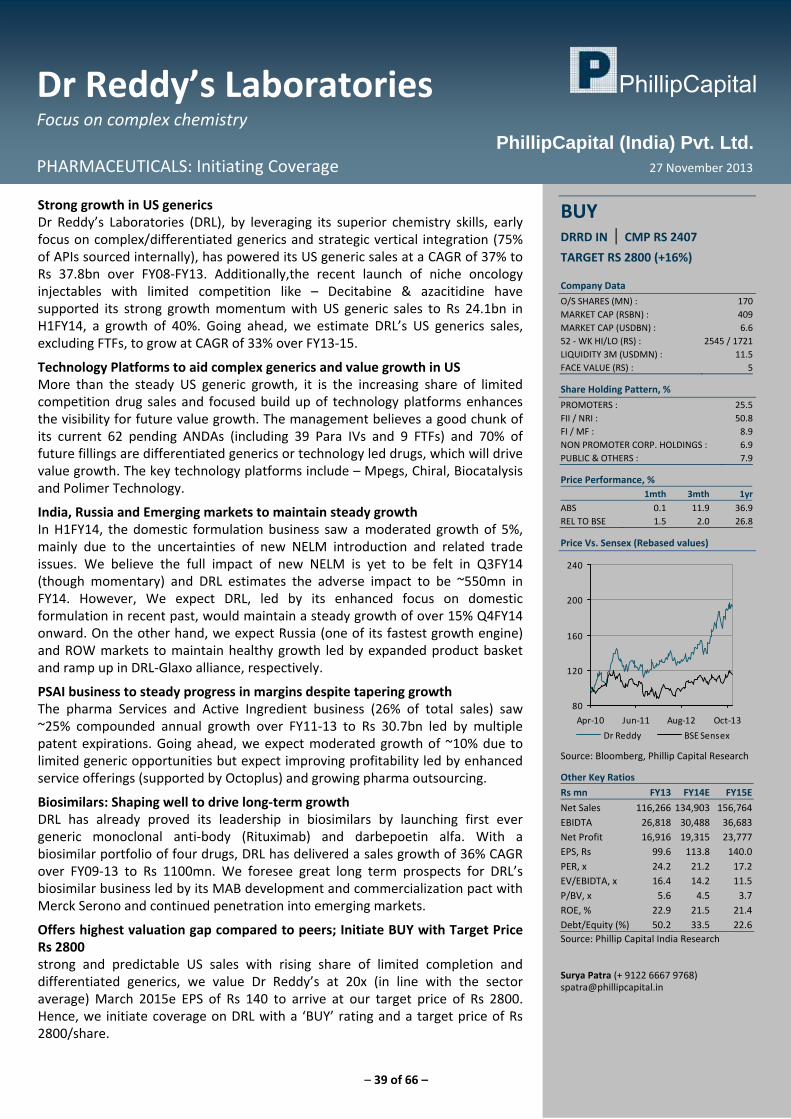
– 39 of 66 –
Dr Reddy’s Laboratories Focus on complex chemistry
PHARMACEUTICALS: Initiating Coverage 27 November 2013
PhillipCapital (India) Pvt. Ltd.
Strong growth in US generics Dr Reddy’s Laboratories (DRL), by leveraging its superior chemistry skills, early focus on complex/differentiated generics and strategic vertical integration (75% of APIs sourced internally), has powered its US generic sales at a CAGR of 37% to Rs 37.8bn over FY08‐FY13. Additionally,the recent launch of niche oncology injectables with limited competition like – Decitabine & azacitidine have supported its strong growth momentum with US generic sales to Rs 24.1bn in H1FY14, a growth of 40%. Going ahead, we estimate DRL’s US generics sales, excluding FTFs, to grow at CAGR of 33% over FY13‐15.
Technology Platforms to aid complex generics and value growth in US More than the steady US generic growth, it is the increasing share of limited competition drug sales and focused build up of technology platforms enhances the visibility for future value growth. The management believes a good chunk of its current 62 pending ANDAs (including 39 Para IVs and 9 FTFs) and 70% of future fillings are differentiated generics or technology led drugs, which will drive value growth. The key technology platforms include – Mpegs, Chiral, Biocatalysis and Polimer Technology.
India, Russia and Emerging markets to maintain steady growth In H1FY14, the domestic formulation business saw a moderated growth of 5%, mainly due to the uncertainties of new NELM introduction and related trade issues. We believe the full impact of new NELM is yet to be felt in Q3FY14 (though momentary) and DRL estimates the adverse impact to be ~550mn in FY14. However, We expect DRL, led by its enhanced focus on domestic formulation in recent past, would maintain a steady growth of over 15% Q4FY14 onward. On the other hand, we expect Russia (one of its fastest growth engine) and ROW markets to maintain healthy growth led by expanded product basket and ramp up in DRL‐Glaxo alliance, respectively.
PSAI business to steady progress in margins despite tapering growth The pharma Services and Active Ingredient business (26% of total sales) saw ~25% compounded annual growth over FY11‐13 to Rs 30.7bn led by multiple patent expirations. Going ahead, we expect moderated growth of ~10% due to limited generic opportunities but expect improving profitability led by enhanced service offerings (supported by Octoplus) and growing pharma outsourcing.
Biosimilars: Shaping well to drive long‐term growth DRL has already proved its leadership in biosimilars by launching first ever generic monoclonal anti‐body (Rituximab) and darbepoetin alfa. With a biosimilar portfolio of four drugs, DRL has delivered a sales growth of 36% CAGR over FY09‐13 to Rs 1100mn. We foresee great long term prospects for DRL’s biosimilar business led by its MAB development and commercialization pact with Merck Serono and continued penetration into emerging markets.
Offers highest valuation gap compared to peers; Initiate BUY with Target Price Rs 2800 strong and predictable US sales with rising share of limited completion and differentiated generics, we value Dr Reddy’s at 20x (in line with the sector average) March 2015e EPS of Rs 140 to arrive at our target price of Rs 2800. Hence, we initiate coverage on DRL with a ‘BUY’ rating and a target price of Rs 2800/share.
BUY DRRD IN | CMP RS 2407
TARGET RS 2800 (+16%) Company Data
O/S SHARES (MN) : 170MARKET CAP (RSBN) : 409MARKET CAP (USDBN) : 6.652 ‐ WK HI/LO (RS) : 2545 / 1721LIQUIDITY 3M (USDMN) : 11.5FACE VALUE (RS) : 5
Share Holding Pattern, %
PROMOTERS : 25.5FII / NRI : 50.8FI / MF : 8.9NON PROMOTER CORP. HOLDINGS : 6.9PUBLIC & OTHERS : 7.9
Price Performance, % 1mth 3mth 1yr
ABS 0.1 11.9 36.9REL TO BSE 1.5 2.0 26.8
Price Vs. Sensex (Rebased values)
80
120
160
200
240
Apr‐10 Jun‐11 Aug‐12 Oct‐13
Dr Reddy BSE Sensex
Source: Bloomberg, Phillip Capital Research
Other Key Ratios
Rs mn FY13 FY14E FY15E
Net Sales 116,266 134,903 156,764EBIDTA 26,818 30,488 36,683Net Profit 16,916 19,315 23,777EPS, Rs 99.6 113.8 140.0PER, x 24.2 21.2 17.2EV/EBIDTA, x 16.4 14.2 11.5P/BV, x 5.6 4.5 3.7ROE, % 22.9 21.5 21.4Debt/Equity (%) 50.2 33.5 22.6Source: Phillip Capital India Research Surya Patra (+ 9122 6667 9768) [email protected]
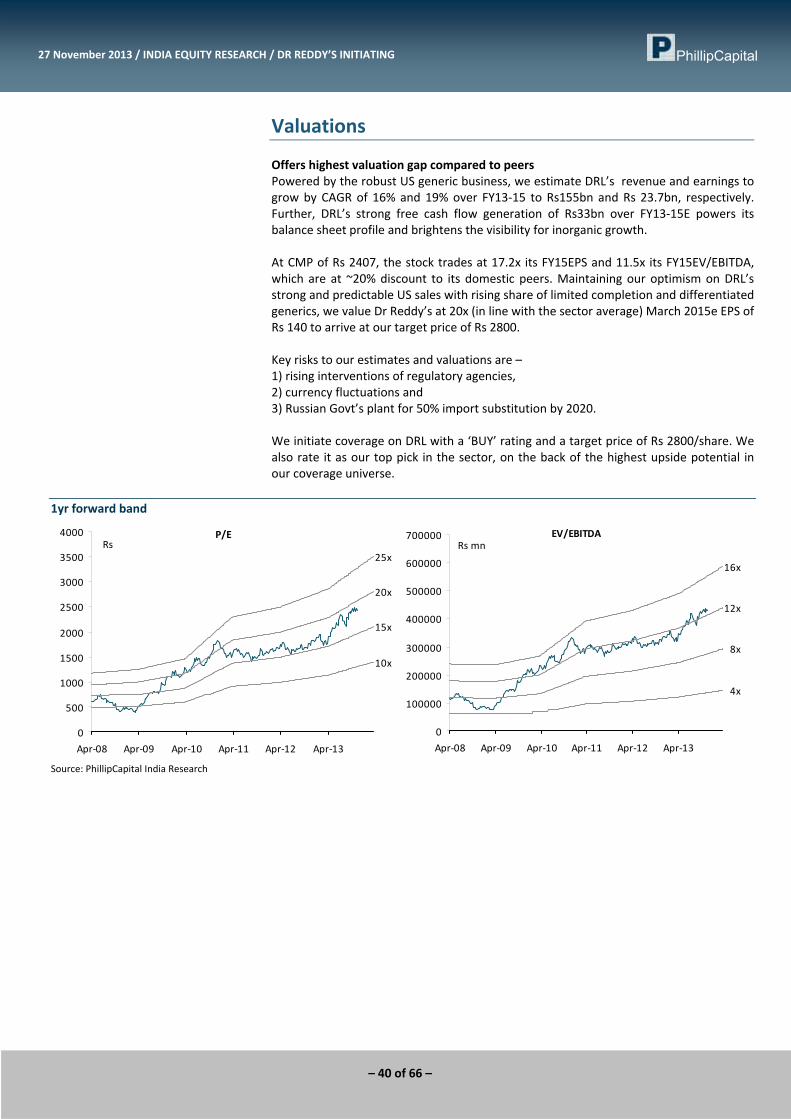
– 40 of 66 –
27 November 2013 / INDIA EQUITY RESEARCH / DR REDDY’S INITIATING
Valuations Offers highest valuation gap compared to peers Powered by the robust US generic business, we estimate DRL’s revenue and earnings to grow by CAGR of 16% and 19% over FY13‐15 to Rs155bn and Rs 23.7bn, respectively. Further, DRL’s strong free cash flow generation of Rs33bn over FY13‐15E powers its balance sheet profile and brightens the visibility for inorganic growth. At CMP of Rs 2407, the stock trades at 17.2x its FY15EPS and 11.5x its FY15EV/EBITDA, which are at ~20% discount to its domestic peers. Maintaining our optimism on DRL’s strong and predictable US sales with rising share of limited completion and differentiated generics, we value Dr Reddy’s at 20x (in line with the sector average) March 2015e EPS of Rs 140 to arrive at our target price of Rs 2800. Key risks to our estimates and valuations are – 1) rising interventions of regulatory agencies, 2) currency fluctuations and 3) Russian Govt’s plant for 50% import substitution by 2020. We initiate coverage on DRL with a ‘BUY’ rating and a target price of Rs 2800/share. We also rate it as our top pick in the sector, on the back of the highest upside potential in our coverage universe.
1yr forward band
P/E
10x
15x
20x
25x
0
500
1000
1500
2000
2500
3000
3500
4000
Apr‐08 Apr‐09 Apr‐10 Apr‐11 Apr‐12 Apr‐13
RsEV/EBITDA
4x
8x
12x
16x
0
100000
200000
300000
400000
500000
600000
700000
Apr‐08 Apr‐09 Apr‐10 Apr‐11 Apr‐12 Apr‐13
Rs mn
Source: PhillipCapital India Research
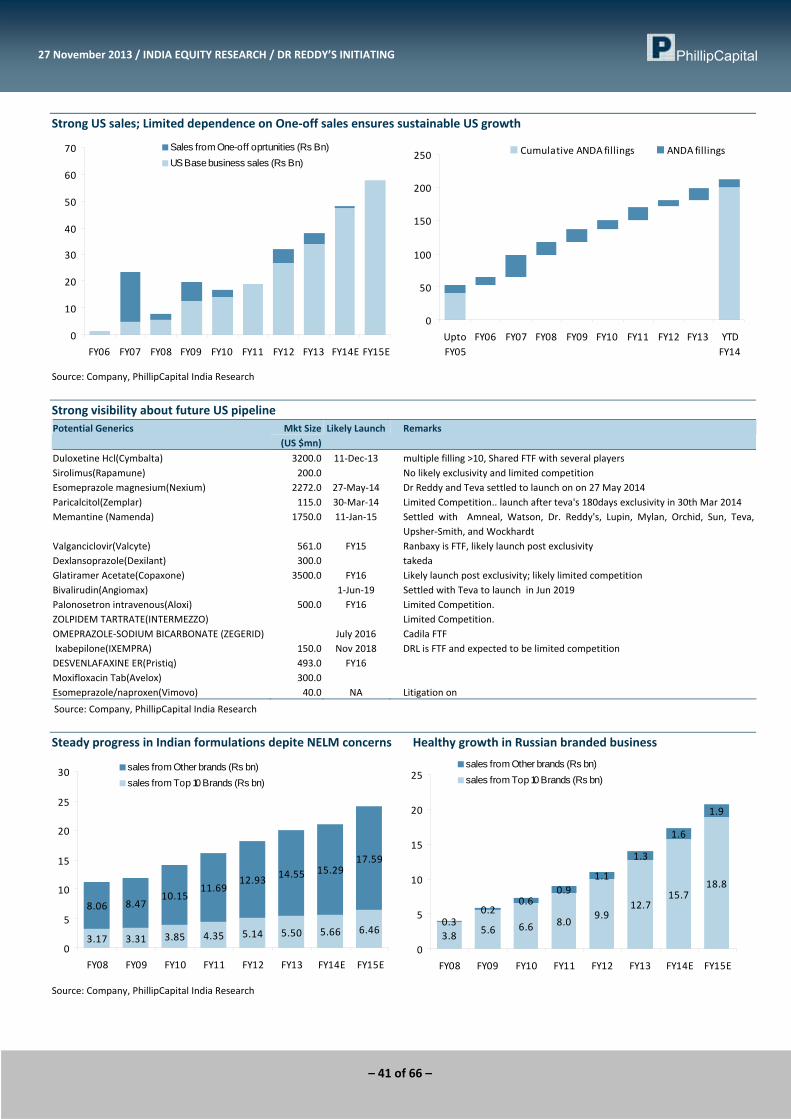
– 41 of 66 –
27 November 2013 / INDIA EQUITY RESEARCH / DR REDDY’S INITIATING
Strong US sales; Limited dependence on One‐off sales ensures sustainable US growth
0
10
20
30
40
50
60
70
FY06 FY07 FY08 FY09 FY10 FY11 FY12 FY13 FY14E FY15E
Sales from One-off oprtunities (Rs Bn)US Base business sales (Rs Bn)
0
50
100
150
200
250
UptoFY05
FY06 FY07 FY08 FY09 FY10 FY11 FY12 FY13 YTDFY14
Cumulative ANDA fillings ANDA fillings
Source: Company, PhillipCapital India Research
Strong visibility about future US pipeline Potential Generics Mkt Size
(US $mn) Likely Launch Remarks
Duloxetine Hcl(Cymbalta) 3200.0 11‐Dec‐13 multiple filling >10, Shared FTF with several players Sirolimus(Rapamune) 200.0 No likely exclusivity and limited competition Esomeprazole magnesium(Nexium) 2272.0 27‐May‐14 Dr Reddy and Teva settled to launch on on 27 May 2014 Paricalcitol(Zemplar) 115.0 30‐Mar‐14 Limited Competition.. launch after teva's 180days exclusivity in 30th Mar 2014 Memantine (Namenda) 1750.0 11‐Jan‐15 Settled with Amneal, Watson, Dr. Reddy's, Lupin, Mylan, Orchid, Sun, Teva,
Upsher‐Smith, and Wockhardt Valganciclovir(Valcyte) 561.0 FY15 Ranbaxy is FTF, likely launch post exclusivity Dexlansoprazole(Dexilant) 300.0 takeda Glatiramer Acetate(Copaxone) 3500.0 FY16 Likely launch post exclusivity; likely limited competition Bivalirudin(Angiomax) 1‐Jun‐19 Settled with Teva to launch in Jun 2019 Palonosetron intravenous(Aloxi) 500.0 FY16 Limited Competition. ZOLPIDEM TARTRATE(INTERMEZZO) Limited Competition. OMEPRAZOLE‐SODIUM BICARBONATE (ZEGERID) July 2016 Cadila FTF Ixabepilone(IXEMPRA) 150.0 Nov 2018 DRL is FTF and expected to be limited competition DESVENLAFAXINE ER(Pristiq) 493.0 FY16 Moxifloxacin Tab(Avelox) 300.0 Esomeprazole/naproxen(Vimovo) 40.0 NA Litigation on
Source: Company, PhillipCapital India Research
Steady progress in Indian formulations depite NELM concerns Healthy growth in Russian branded business
3.17 3.31 3.85 4.35 5.14 5.50 5.66 6.46
8.06 8.4710.15
11.6912.93 14.55 15.29
17.59
0
5
10
15
20
25
30
FY08 FY09 FY10 FY11 FY12 FY13 FY14E FY15E
sales from Other brands (Rs bn)sales from Top 10 Brands (Rs bn)
3.8 5.6 6.6 8.09.9
12.715.7
18.8
0.30.2
0.60.9
1.1
1.3
1.6
1.9
0
5
10
15
20
25
FY08 FY09 FY10 FY11 FY12 FY13 FY14E FY15E
sales from Other brands (Rs bn)sales from Top 10 Brands (Rs bn)
Source: Company, PhillipCapital India Research
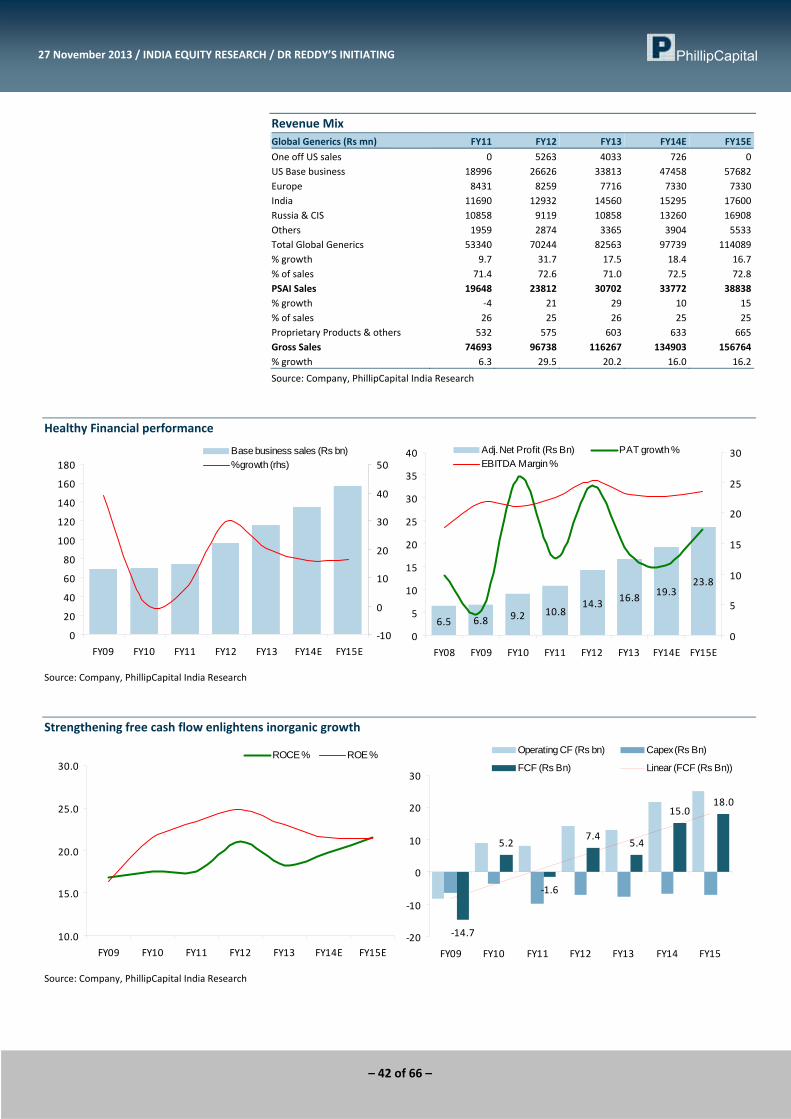
– 42 of 66 –
27 November 2013 / INDIA EQUITY RESEARCH / DR REDDY’S INITIATING
Revenue Mix Global Generics (Rs mn) FY11 FY12 FY13 FY14E FY15E
One off US sales 0 5263 4033 726 0US Base business 18996 26626 33813 47458 57682Europe 8431 8259 7716 7330 7330India 11690 12932 14560 15295 17600Russia & CIS 10858 9119 10858 13260 16908Others 1959 2874 3365 3904 5533Total Global Generics 53340 70244 82563 97739 114089% growth 9.7 31.7 17.5 18.4 16.7% of sales 71.4 72.6 71.0 72.5 72.8PSAI Sales 19648 23812 30702 33772 38838% growth ‐4 21 29 10 15% of sales 26 25 26 25 25Proprietary Products & others 532 575 603 633 665Gross Sales 74693 96738 116267 134903 156764% growth 6.3 29.5 20.2 16.0 16.2
Source: Company, PhillipCapital India Research
Healthy Financial performance
0
20
40
60
80
100
120
140
160
180
FY09 FY10 FY11 FY12 FY13 FY14E FY15E
‐10
0
10
20
30
40
50Base business sales (Rs bn)% growth (rhs)
6.5 6.8 9.2 10.814.3 16.8 19.3
23.8
0
5
10
15
20
25
30
35
40
FY08 FY09 FY10 FY11 FY12 FY13 FY14E FY15E
0
5
10
15
20
25
30Adj. Net Profit (Rs Bn) PAT growth %EBITDA Margin %
Source: Company, PhillipCapital India Research
Strengthening free cash flow enlightens inorganic growth
10.0
15.0
20.0
25.0
30.0
FY09 FY10 FY11 FY12 FY13 FY14E FY15E
ROCE % ROE %
‐14.7
5.2
‐1.6
7.45.4
15.018.0
‐20
‐10
0
10
20
30
FY09 FY10 FY11 FY12 FY13 FY14 FY15
Operating CF (Rs bn) Capex (Rs Bn)
FCF (Rs Bn) Linear (FCF (Rs Bn))
Source: Company, PhillipCapital India Research
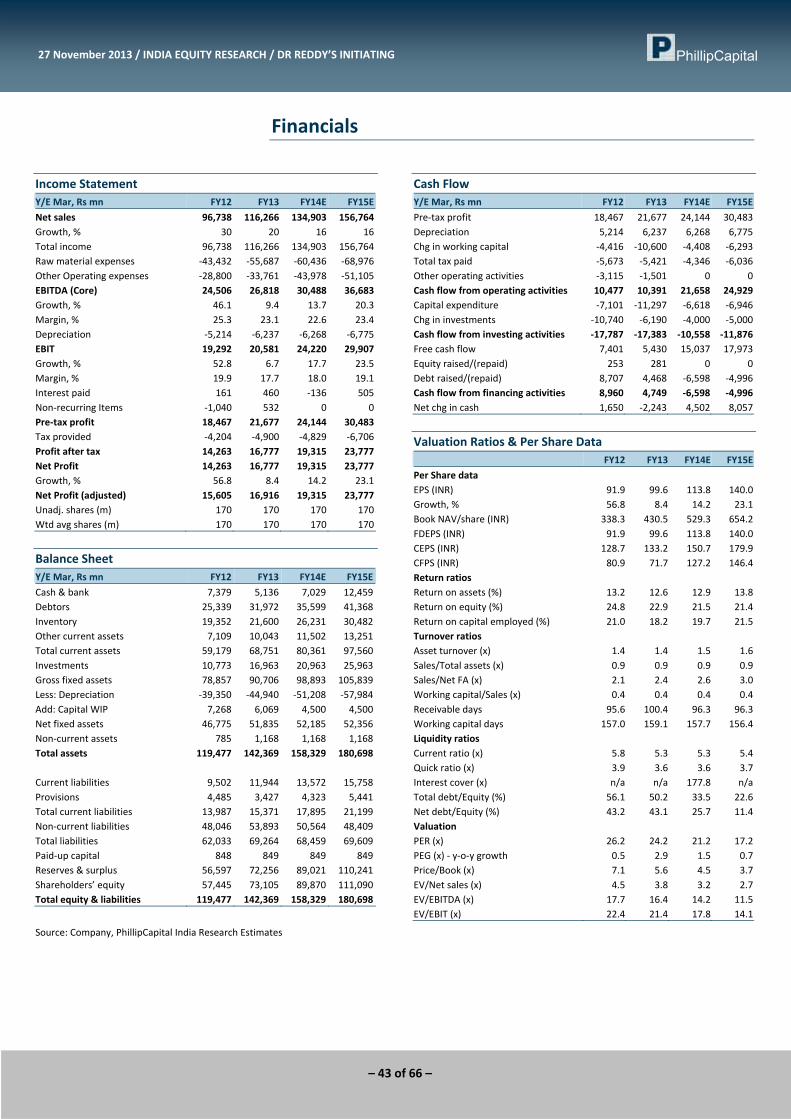
– 43 of 66 –
27 November 2013 / INDIA EQUITY RESEARCH / DR REDDY’S INITIATING
Financials
Income Statement Y/E Mar, Rs mn FY12 FY13 FY14E FY15E
Net sales 96,738 116,266 134,903 156,764Growth, % 30 20 16 16Total income 96,738 116,266 134,903 156,764Raw material expenses ‐43,432 ‐55,687 ‐60,436 ‐68,976Other Operating expenses ‐28,800 ‐33,761 ‐43,978 ‐51,105EBITDA (Core) 24,506 26,818 30,488 36,683Growth, % 46.1 9.4 13.7 20.3Margin, % 25.3 23.1 22.6 23.4Depreciation ‐5,214 ‐6,237 ‐6,268 ‐6,775EBIT 19,292 20,581 24,220 29,907Growth, % 52.8 6.7 17.7 23.5Margin, % 19.9 17.7 18.0 19.1Interest paid 161 460 ‐136 505Non‐recurring Items ‐1,040 532 0 0Pre‐tax profit 18,467 21,677 24,144 30,483Tax provided ‐4,204 ‐4,900 ‐4,829 ‐6,706Profit after tax 14,263 16,777 19,315 23,777Net Profit 14,263 16,777 19,315 23,777Growth, % 56.8 8.4 14.2 23.1Net Profit (adjusted) 15,605 16,916 19,315 23,777Unadj. shares (m) 170 170 170 170Wtd avg shares (m) 170 170 170 170
Balance Sheet Y/E Mar, Rs mn FY12 FY13 FY14E FY15E
Cash & bank 7,379 5,136 7,029 12,459Debtors 25,339 31,972 35,599 41,368Inventory 19,352 21,600 26,231 30,482Other current assets 7,109 10,043 11,502 13,251Total current assets 59,179 68,751 80,361 97,560Investments 10,773 16,963 20,963 25,963Gross fixed assets 78,857 90,706 98,893 105,839Less: Depreciation ‐39,350 ‐44,940 ‐51,208 ‐57,984Add: Capital WIP 7,268 6,069 4,500 4,500Net fixed assets 46,775 51,835 52,185 52,356Non‐current assets 785 1,168 1,168 1,168Total assets 119,477 142,369 158,329 180,698 Current liabilities 9,502 11,944 13,572 15,758Provisions 4,485 3,427 4,323 5,441Total current liabilities 13,987 15,371 17,895 21,199Non‐current liabilities 48,046 53,893 50,564 48,409Total liabilities 62,033 69,264 68,459 69,609Paid‐up capital 848 849 849 849Reserves & surplus 56,597 72,256 89,021 110,241Shareholders’ equity 57,445 73,105 89,870 111,090Total equity & liabilities 119,477 142,369 158,329 180,698
Source: Company, PhillipCapital India Research Estimates
Cash Flow Y/E Mar, Rs mn FY12 FY13 FY14E FY15E
Pre‐tax profit 18,467 21,677 24,144 30,483Depreciation 5,214 6,237 6,268 6,775Chg in working capital ‐4,416 ‐10,600 ‐4,408 ‐6,293Total tax paid ‐5,673 ‐5,421 ‐4,346 ‐6,036Other operating activities ‐3,115 ‐1,501 0 0Cash flow from operating activities 10,477 10,391 21,658 24,929Capital expenditure ‐7,101 ‐11,297 ‐6,618 ‐6,946Chg in investments ‐10,740 ‐6,190 ‐4,000 ‐5,000Cash flow from investing activities ‐17,787 ‐17,383 ‐10,558 ‐11,876Free cash flow 7,401 5,430 15,037 17,973Equity raised/(repaid) 253 281 0 0Debt raised/(repaid) 8,707 4,468 ‐6,598 ‐4,996Cash flow from financing activities 8,960 4,749 ‐6,598 ‐4,996Net chg in cash 1,650 ‐2,243 4,502 8,057
Valuation Ratios & Per Share Data FY12 FY13 FY14E FY15E
Per Share data EPS (INR) 91.9 99.6 113.8 140.0Growth, % 56.8 8.4 14.2 23.1Book NAV/share (INR) 338.3 430.5 529.3 654.2FDEPS (INR) 91.9 99.6 113.8 140.0CEPS (INR) 128.7 133.2 150.7 179.9CFPS (INR) 80.9 71.7 127.2 146.4Return ratios Return on assets (%) 13.2 12.6 12.9 13.8Return on equity (%) 24.8 22.9 21.5 21.4Return on capital employed (%) 21.0 18.2 19.7 21.5Turnover ratios Asset turnover (x) 1.4 1.4 1.5 1.6Sales/Total assets (x) 0.9 0.9 0.9 0.9Sales/Net FA (x) 2.1 2.4 2.6 3.0Working capital/Sales (x) 0.4 0.4 0.4 0.4Receivable days 95.6 100.4 96.3 96.3Working capital days 157.0 159.1 157.7 156.4Liquidity ratios Current ratio (x) 5.8 5.3 5.3 5.4Quick ratio (x) 3.9 3.6 3.6 3.7Interest cover (x) n/a n/a 177.8 n/aTotal debt/Equity (%) 56.1 50.2 33.5 22.6Net debt/Equity (%) 43.2 43.1 25.7 11.4Valuation PER (x) 26.2 24.2 21.2 17.2PEG (x) ‐ y‐o‐y growth 0.5 2.9 1.5 0.7Price/Book (x) 7.1 5.6 4.5 3.7EV/Net sales (x) 4.5 3.8 3.2 2.7EV/EBITDA (x) 17.7 16.4 14.2 11.5EV/EBIT (x) 22.4 21.4 17.8 14.1

– 44 of 66 –
Glenmark Pharma Right blend of innovative R&D and global generics
PHARMACEUTICALS: Initiating Coverage 27 November 2013
PhillipCapital (India) Pvt. Ltd.
Quality fillings ensures US generics growth Glenmark’s focus on complex generics and limited competition helped it deliver 23% CAGR in its US generics sales to 16.9bn (34% of total sales) in FY13. Going ahead, we expect Glenmark’s quality ANDA pipeline (53 pending approvals including 17 Para IVs) covering hormones, derma, oncology injectables etc to drive 24% revenue CAGR over FY13‐15 to Rs 25.9bn. The key product opportunities in US include – generic Locoid Lipocream, fluocinonide and Lunesta. Also, the likely launch of multiple Para IV opportunities (including – Welchol, Coreg CR & Orthotri‐Cyclen) in FY16 provides enough US generic visibility.
Sustained growth in domestic formulations Glenmark’s domestic formulations business (26% of total sales) with 21% CAGR over last five years has outpaced Indian pharma growth of 14%. We believe Glenmarks’s focused marketing of Derma, respiratory, Cardiac and gynaecology drugs would help it grow ahead of industry growth. We estimate the domestic formulation sales of Glenmark to report a compounded annual growth of 17% over FY13‐15 to Rs 17.9bn. We expect marginal impact of new pricing policy in FY14 on the company.
Monetisation of R&D pipeline could provide further upside Glenmark has already set a strong track record of monetizing its R&D pipeline by signing 7 out‐licensing deals, which have earned cumulative milestone receipts worth $ 206mn since 2004. Currently it stands at the forefront of discovery research in India with a promising R&D pipeline of 5 novel molecules (3 NCEs and 2 NBEs) at various stages of development and any progress in its R&D pipeline could potentially trigger further milestone receipts in near to medium term.
Steady progress in financial health Glenmark reported a healthy growth of 24% and 33% CAGR in its sales and net earnings over last five years to Rs 50.14bn and Rs 6.3bn respectively in FY13. We expect the company to post revenue CAGR of 19% and PAT CAGR of 20% over FY13‐15E on the back of quality ANDA pipeline and sustained growth in the domestic formulations. At the same time, we expect FCF generation from the core business to continue to increase over FY13E‐FY15E, given limited capex and sustained profit growth.
Initiate BUY with target price of Rs 641 At the CMP of RS 504, the stock trades at 15.0x its FY15E EPS and 10.1x its FY15 EV/EBITDA, which was about >15% discount to its peers. We believe the discount is largely due to limited visibility of big ticket US launches and milestone from R&D pipeline.
However, considering its continued focus on quality product pipeline (over 60% of its pending ANDAs are differentiated generics) we value Glenmark’s core business at Rs 604 (18x its FY15 EPS) and its R&D pipeline of Crofelemer and GRC 15300 at Rs 37/share. Our target price of Rs 641 implyes upside of 27% from current levels. Additionally, any out‐licensing development of its R&D pipeline would enhance the upside further.
BUY GNP IN | CMP RS 504
TARGET RS 641 (+27%) Company Data
O/S SHARES (MN) : 271MARKET CAP (RSBN) : 137MARKET CAP (USDBN) : 2.252 ‐ WK HI/LO (RS) : 612 / 418LIQUIDITY 3M (USDMN) : 5.1FACE VALUE (RS) : 1
Share Holding Pattern, %
PROMOTERS : 48.3FII / NRI : 34.0FI / MF : 7.4NON PROMOTER CORP. HOLDINGS : 1.4PUBLIC & OTHERS : 9.0
Price Performance, % 1mth 3mth 1yr
ABS ‐8.1 ‐7.4 12.6REL TO BSE ‐6.8 ‐17.4 2.5
Price Vs. Sensex (Rebased values)
50
100
150
200
250
Apr‐10 Jun‐11 Aug‐12 Oct‐13Glenmark BSE Sensex
Source: Bloomberg, Phillip Capital Research
Other Key Ratios
Rs mn FY13 FY14E FY15E
Net Sales 50,123 60,033 70,941EBIDTA 10,620 12,190 14,830Net Profit 6,349 7,047 9,089EPS, Rs 23.4 26.0 33.6PER, x 21.5 19.4 15.0EV/EBIDTA, x 14.9 12.7 10.1P/BV, x 4.9 4.0 3.2ROE, % 23.0 20.7 21.4Debt/Equity (%) 100.1 68.1 46.3Source: Phillip Capital India Research Surya Patra (+ 9122 6667 9768) [email protected]
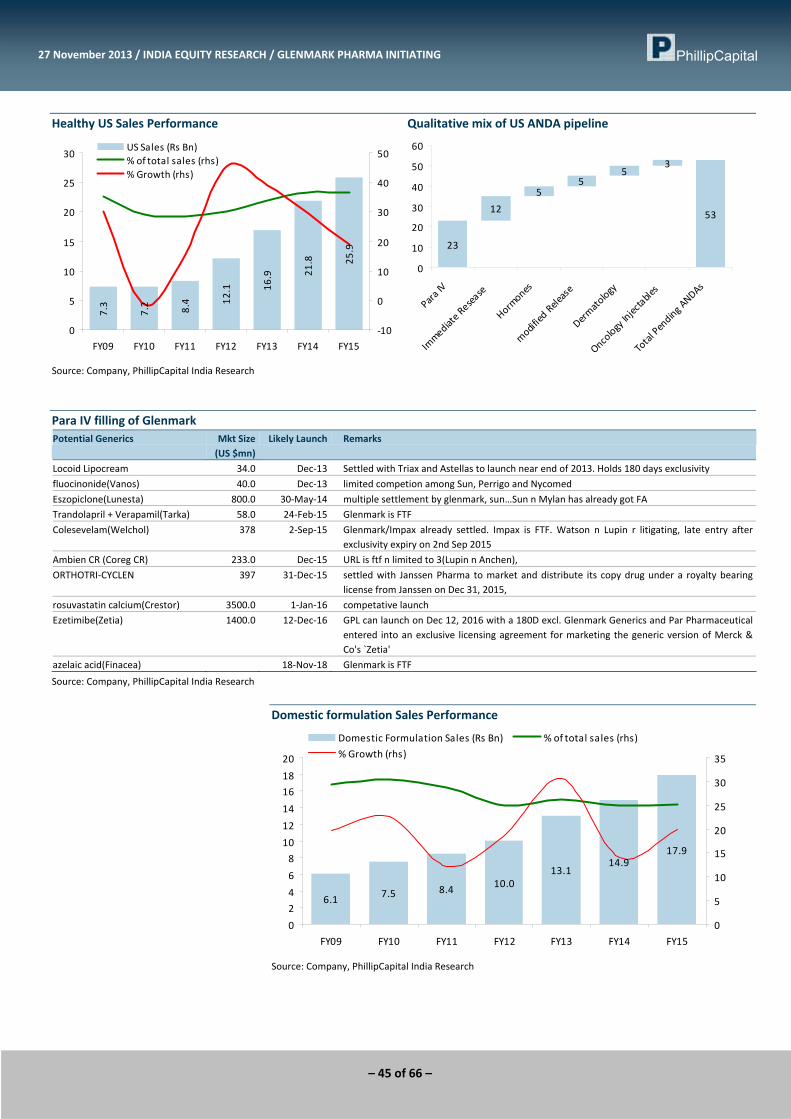
– 45 of 66 –
27 November 2013 / INDIA EQUITY RESEARCH / GLENMARK PHARMA INITIATING
Healthy US Sales Performance Qualitative mix of US ANDA pipeline
7.3
7.2 8.4 12
.1 16.9 21
.8 25.9
0
5
10
15
20
25
30
FY09 FY10 FY11 FY12 FY13 FY14 FY15
‐10
0
10
20
30
40
50US Sales (Rs Bn)% of total sales (rhs)% Growth (rhs)
23
12
55
53
53
0
10
20
30
40
50
60
Para IV
Immediate Resease
Hormones
modified Release
Dermatology
Oncology Injectables
Total Pending ANDAs
Source: Company, PhillipCapital India Research
Para IV filling of Glenmark Potential Generics Mkt Size
(US $mn) Likely Launch Remarks
Locoid Lipocream 34.0 Dec‐13 Settled with Triax and Astellas to launch near end of 2013. Holds 180 days exclusivity
fluocinonide(Vanos) 40.0 Dec‐13 limited competion among Sun, Perrigo and Nycomed
Eszopiclone(Lunesta) 800.0 30‐May‐14 multiple settlement by glenmark, sun…Sun n Mylan has already got FA
Trandolapril + Verapamil(Tarka) 58.0 24‐Feb‐15 Glenmark is FTF
Colesevelam(Welchol) 378 2‐Sep‐15 Glenmark/Impax already settled. Impax is FTF. Watson n Lupin r litigating, late entry after exclusivity expiry on 2nd Sep 2015
Ambien CR (Coreg CR) 233.0 Dec‐15 URL is ftf n limited to 3(Lupin n Anchen),
ORTHOTRI‐CYCLEN 397 31‐Dec‐15 settled with Janssen Pharma to market and distribute its copy drug under a royalty bearing license from Janssen on Dec 31, 2015,
rosuvastatin calcium(Crestor) 3500.0 1‐Jan‐16 competative launch
Ezetimibe(Zetia) 1400.0 12‐Dec‐16 GPL can launch on Dec 12, 2016 with a 180D excl. Glenmark Generics and Par Pharmaceutical entered into an exclusive licensing agreement for marketing the generic version of Merck & Co's `Zetia'
azelaic acid(Finacea) 18‐Nov‐18 Glenmark is FTF
Source: Company, PhillipCapital India Research Domestic formulation Sales Performance
6.1 7.5 8.4 10.013.1
14.917.9
0
2
4
6
8
10
12
14
16
18
20
FY09 FY10 FY11 FY12 FY13 FY14 FY15
0
5
10
15
20
25
30
35
Domestic Formulation Sales (Rs Bn) % of total sales (rhs)
% Growth (rhs)
Source: Company, PhillipCapital India Research

– 46 of 66 –
27 November 2013 / INDIA EQUITY RESEARCH / GLENMARK PHARMA INITIATING
Revenue Mix (Rs bn) FY11 FY12 FY13 FY14e FY15e
India 8.45 10.02 13.10 14.93 17.92 Semiregulated Market 4.07 5.93 8.12 9.34 11.21 Latin America 1.92 2.87 3.28 3.94 4.72 Europe 1.53 1.98 2.02 2.22 2.44 Out‐Licensing Revenue 0.90 2.54 0.49 0.45 0.45Total Speciality Business 16.86 23.33 27.01 30.87 36.74% of Total Revenue 57.2 58.0 53.9 51.4 51.8% Ch. YoY 17.5 38.4 15.8 14.3 19.0 US (Rs mn) 8.35 12.14 16.89 21.84 25.94 Europe 0.54 1.03 1.71 2.13 2.56 Latin America(oncology) 0.97 0.14 0.19 0.24 0.28 API 2.77 3.09 3.98 4.57 5.03Total Generic Business 12.63 16.41 22.76 28.78 33.81% of Total Revenue 42.8 40.8 45.4 47.9 47.7% Ch. YoY 20.3 29.9 38.7 26.5 17.5Other 0.00 0.47 0.36 0.37 0.39Gross Revenue 29.49 40.21 50.12 60.03 70.94% Ch. YoY 18.7 36.3 24.7 19.8 18.2
Source: Company, PhillipCapital India Research
Best model of discovery research from India Year Molecule out‐licensed Deal with Milestone received
2004 Oglemilast Forest Labs $35Mn 2005 Oglemilast Teijin Pharma $6Mn 2006 Melogliptin Merck KGaA $31 Mn 2007 GRC 6211 Eli Lilly $45 mn 2010 GRC 15300 Sanofi‐Aventis $25 Mn 2011 GBR ‐ 500 Sanofi‐Aventis $50 Mn 2012 mPGES‐1 Inhibitors Forest Labs $9 Mn
Source: Company, PhillipCapital India Research
Glenmark expects multiple Monetization activity over 12‐18 months from its R&D Pipeline NCE Indication licensed Current Status Remarks
Crofelemer Anti‐diarrheal Partner Salix got USFDA approval and launched in US. Glenmark progresses its filling in 140 emerging markets.
Expect launch in emerging market during early FY15
GRC 15300 Osteoarthritis pain, Neuropathic pain
Sanofi‐Aventis Completed Phase I trials in the UK, A PhIIa proof of concept study in neuropathic pain, initiated in Q1 FY 2013, has completed recruitment.
Globally, this is the only reported TRPV3 specific antagonist molecule to enter clinical trials
GRC 17536 Neuropathic pain, Respiratory disorders
Glenmark is currently recruiting patients for a Phase II proof of concept study in pain indication in Europe and India. Additionally, Glenmark has completed recruitment for a Phase I/IIa study for respiratory indications in the UK (MHRA) and expects topline data in Q3 FY 2014. Glenmark has also obtained regulatory approval from MHRA, UK, for the conduct of a Phase IIa study in patients with chronic cough.
Expects topline data in Q3/Q4 FY 2014
GBR 500 Crohn's Disease, Multiple Sclerosis, Inflammatory Disorders
Sanofi‐Aventis Phase I studies completed in US. A PhII proof of concept study in ulcerative colitis has been initiated in Q2 FY 2012‐13 and is currently ongoing.
Expect data outcomes in Q1FY15
GBR 900 Pain Phase 1 enabling toxicity studies for GBR 900 have been completed successfully. Plans to file for a Phase I study in the current financial year.
m‐PGES‐1 inhibitor
Chronic inflammatory conditions including pain
Forest Lab Glenmark has identified clinical candidates and is currently conducting pre‐clinical studies and other development activities required to support the initiation of first‐in‐human dosing
Source: Company
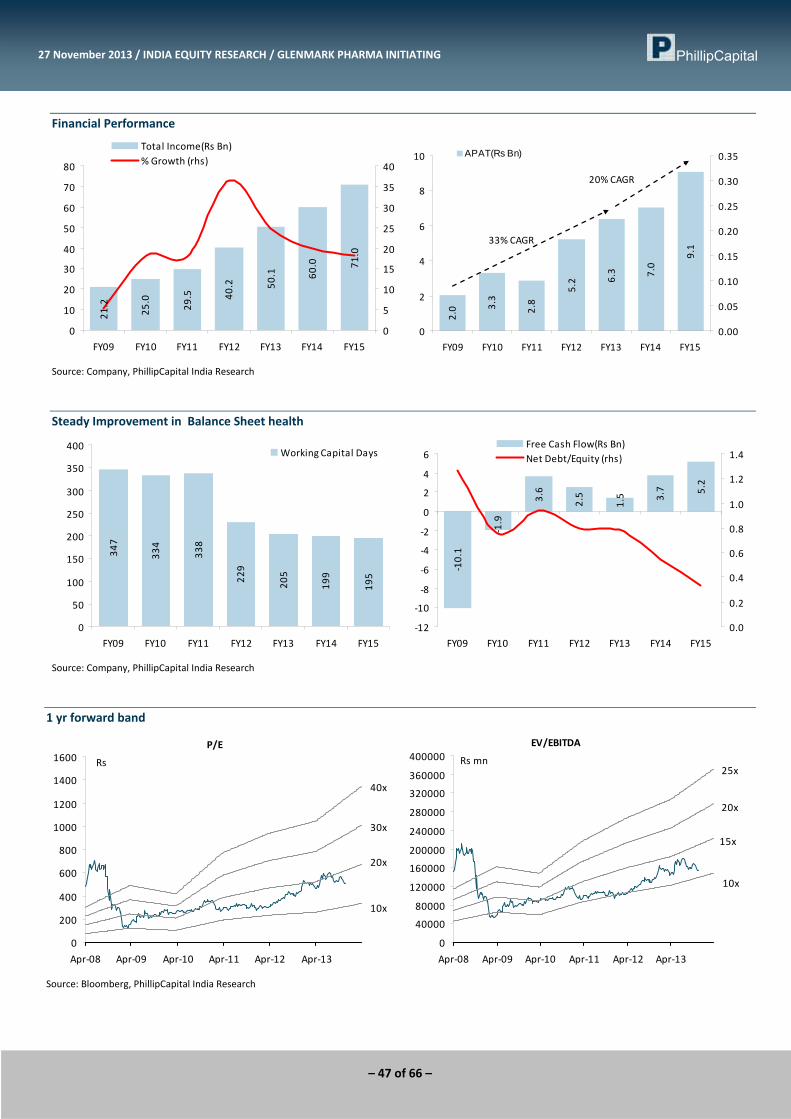
– 47 of 66 –
27 November 2013 / INDIA EQUITY RESEARCH / GLENMARK PHARMA INITIATING
Financial Performance
21.2
25.0
29.5 40.2 50.1 60.0 71.0
0
10
20
30
40
50
60
70
80
FY09 FY10 FY11 FY12 FY13 FY14 FY15
0
5
10
15
20
25
30
35
40
Total Income(Rs Bn)% Growth (rhs)
2.0 3.3
2.8
5.2 6.3 7.0
9.1
0
2
4
6
8
10
FY09 FY10 FY11 FY12 FY13 FY14 FY15
0.00
0.05
0.10
0.15
0.20
0.25
0.30
0.35APAT(Rs Bn)
33% CAGR
20% CAGR
Source: Company, PhillipCapital India Research
Steady Improvement in Balance Sheet health
347
334
338
229
205
199
195
0
50
100
150
200
250
300
350
400
FY09 FY10 FY11 FY12 FY13 FY14 FY15
Working Capital Days
‐10.1
‐1.9
3.6
2.5
1.5 3.7 5.2
‐12
‐10
‐8
‐6
‐4
‐2
0
2
4
6
FY09 FY10 FY11 FY12 FY13 FY14 FY15
0.0
0.2
0.4
0.6
0.8
1.0
1.2
1.4Free Cash Flow(Rs Bn)Net Debt/Equity (rhs)
Source: Company, PhillipCapital India Research
1 yr forward band
P/E
10x
20x
30x
40x
0
200
400
600
800
1000
1200
1400
1600
Apr‐08 Apr‐09 Apr‐10 Apr‐11 Apr‐12 Apr‐13
Rs
EV/EBITDA
10x
15x
20x
25x
0
40000
80000
120000
160000
200000
240000
280000
320000
360000
400000
Apr‐08 Apr‐09 Apr‐10 Apr‐11 Apr‐12 Apr‐13
Rs mn
Source: Bloomberg, PhillipCapital India Research
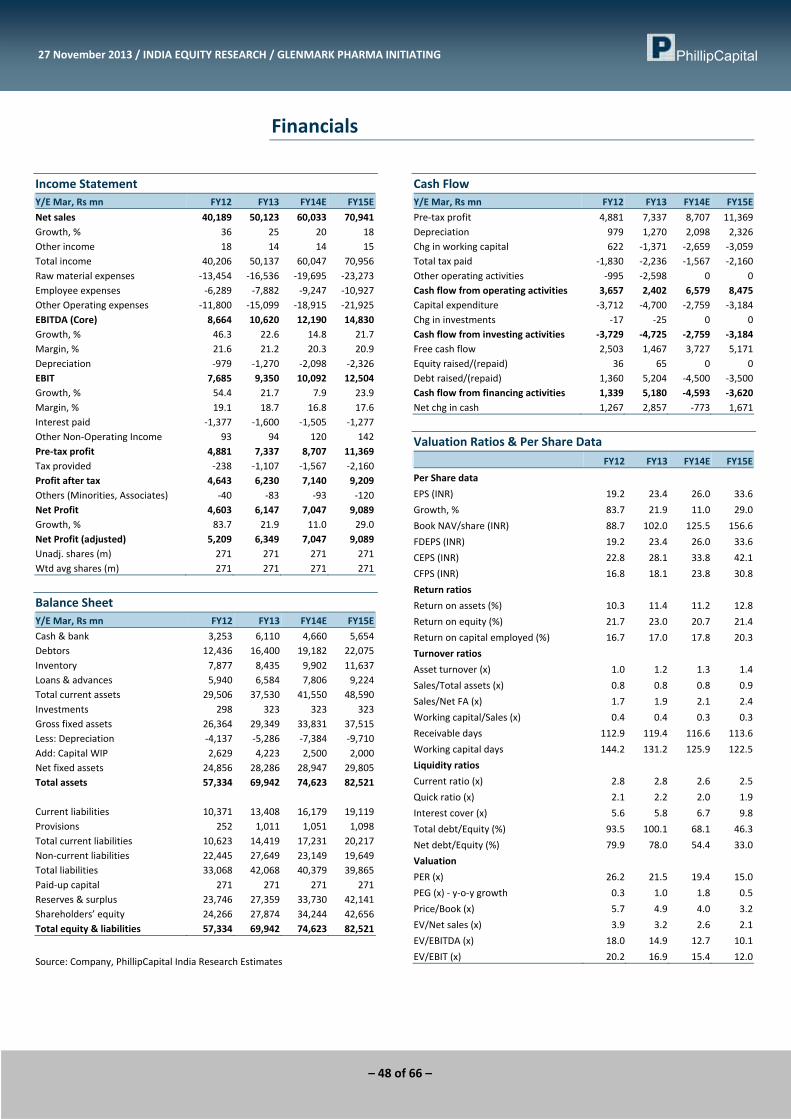
– 48 of 66 –
27 November 2013 / INDIA EQUITY RESEARCH / GLENMARK PHARMA INITIATING
Financials
Income Statement Y/E Mar, Rs mn FY12 FY13 FY14E FY15E
Net sales 40,189 50,123 60,033 70,941Growth, % 36 25 20 18Other income 18 14 14 15Total income 40,206 50,137 60,047 70,956Raw material expenses ‐13,454 ‐16,536 ‐19,695 ‐23,273Employee expenses ‐6,289 ‐7,882 ‐9,247 ‐10,927Other Operating expenses ‐11,800 ‐15,099 ‐18,915 ‐21,925EBITDA (Core) 8,664 10,620 12,190 14,830Growth, % 46.3 22.6 14.8 21.7Margin, % 21.6 21.2 20.3 20.9Depreciation ‐979 ‐1,270 ‐2,098 ‐2,326EBIT 7,685 9,350 10,092 12,504Growth, % 54.4 21.7 7.9 23.9Margin, % 19.1 18.7 16.8 17.6Interest paid ‐1,377 ‐1,600 ‐1,505 ‐1,277Other Non‐Operating Income 93 94 120 142Pre‐tax profit 4,881 7,337 8,707 11,369Tax provided ‐238 ‐1,107 ‐1,567 ‐2,160Profit after tax 4,643 6,230 7,140 9,209Others (Minorities, Associates) ‐40 ‐83 ‐93 ‐120Net Profit 4,603 6,147 7,047 9,089Growth, % 83.7 21.9 11.0 29.0Net Profit (adjusted) 5,209 6,349 7,047 9,089Unadj. shares (m) 271 271 271 271Wtd avg shares (m) 271 271 271 271
Balance Sheet Y/E Mar, Rs mn FY12 FY13 FY14E FY15E
Cash & bank 3,253 6,110 4,660 5,654Debtors 12,436 16,400 19,182 22,075Inventory 7,877 8,435 9,902 11,637Loans & advances 5,940 6,584 7,806 9,224Total current assets 29,506 37,530 41,550 48,590Investments 298 323 323 323Gross fixed assets 26,364 29,349 33,831 37,515Less: Depreciation ‐4,137 ‐5,286 ‐7,384 ‐9,710Add: Capital WIP 2,629 4,223 2,500 2,000Net fixed assets 24,856 28,286 28,947 29,805Total assets 57,334 69,942 74,623 82,521 Current liabilities 10,371 13,408 16,179 19,119Provisions 252 1,011 1,051 1,098Total current liabilities 10,623 14,419 17,231 20,217Non‐current liabilities 22,445 27,649 23,149 19,649Total liabilities 33,068 42,068 40,379 39,865Paid‐up capital 271 271 271 271Reserves & surplus 23,746 27,359 33,730 42,141Shareholders’ equity 24,266 27,874 34,244 42,656Total equity & liabilities 57,334 69,942 74,623 82,521
Source: Company, PhillipCapital India Research Estimates
Cash Flow Y/E Mar, Rs mn FY12 FY13 FY14E FY15E
Pre‐tax profit 4,881 7,337 8,707 11,369Depreciation 979 1,270 2,098 2,326Chg in working capital 622 ‐1,371 ‐2,659 ‐3,059Total tax paid ‐1,830 ‐2,236 ‐1,567 ‐2,160Other operating activities ‐995 ‐2,598 0 0Cash flow from operating activities 3,657 2,402 6,579 8,475Capital expenditure ‐3,712 ‐4,700 ‐2,759 ‐3,184Chg in investments ‐17 ‐25 0 0Cash flow from investing activities ‐3,729 ‐4,725 ‐2,759 ‐3,184Free cash flow 2,503 1,467 3,727 5,171Equity raised/(repaid) 36 65 0 0Debt raised/(repaid) 1,360 5,204 ‐4,500 ‐3,500Cash flow from financing activities 1,339 5,180 ‐4,593 ‐3,620Net chg in cash 1,267 2,857 ‐773 1,671
Valuation Ratios & Per Share Data FY12 FY13 FY14E FY15E
Per Share data
EPS (INR) 19.2 23.4 26.0 33.6
Growth, % 83.7 21.9 11.0 29.0
Book NAV/share (INR) 88.7 102.0 125.5 156.6
FDEPS (INR) 19.2 23.4 26.0 33.6
CEPS (INR) 22.8 28.1 33.8 42.1
CFPS (INR) 16.8 18.1 23.8 30.8
Return ratios
Return on assets (%) 10.3 11.4 11.2 12.8
Return on equity (%) 21.7 23.0 20.7 21.4
Return on capital employed (%) 16.7 17.0 17.8 20.3
Turnover ratios
Asset turnover (x) 1.0 1.2 1.3 1.4
Sales/Total assets (x) 0.8 0.8 0.8 0.9
Sales/Net FA (x) 1.7 1.9 2.1 2.4
Working capital/Sales (x) 0.4 0.4 0.3 0.3
Receivable days 112.9 119.4 116.6 113.6
Working capital days 144.2 131.2 125.9 122.5
Liquidity ratios
Current ratio (x) 2.8 2.8 2.6 2.5
Quick ratio (x) 2.1 2.2 2.0 1.9
Interest cover (x) 5.6 5.8 6.7 9.8
Total debt/Equity (%) 93.5 100.1 68.1 46.3
Net debt/Equity (%) 79.9 78.0 54.4 33.0
Valuation
PER (x) 26.2 21.5 19.4 15.0
PEG (x) ‐ y‐o‐y growth 0.3 1.0 1.8 0.5
Price/Book (x) 5.7 4.9 4.0 3.2
EV/Net sales (x) 3.9 3.2 2.6 2.1
EV/EBITDA (x) 18.0 14.9 12.7 10.1
EV/EBIT (x) 20.2 16.9 15.4 12.0
– 49 of 66 –
IPCA Laboratories All‐round growth; lacks earning surprise
PHARMACEUTICALS: Initiating Coverage 27 November 2013
PhillipCapital (India) Pvt. Ltd.
Steady growth in domestic formulations despite concerns of new pricing policy IPCA’s Domestic formulations operation (33% of total sales) holds leadership in anti‐malarial (34% market share) and rheumatoid arthritis. Over last five years, it has outpaced industry growth by delivering 16.6% CAGR over FY09‐13 to Rs 8.8bn in FY13 vs. industry growth rate of 14.1% over the same period. Going ahead, we expect this segment to continue its formulation growth momentum led by deeper market penetration, new product introduction, and improvement in field force productivity. We expect minimal impact of pricing policy on IPCA as it has already taken price hike in non‐NELM products and weexpect it to maintain better than industry growth. Factoring the momentary impact of NELM introduction in FY14, we estimate >14% CAGR for IPCA domestic formulations over FY13‐FY15 to Rs 11.5bn.
FDA clearance of its green field Indore facility to boost US generics IPCA’s US generic sales, led by its complete vertical integration and optimal cost offerings, jumped 8‐fold over last five years to Rs1.91bn in FY13, despite its partnership model. Now, with the approval of its its greenfield Indore facility (with peak potential of Rs 4.0bn) by USFDA and expanded ANDA pipeline (pending ANDA of 20 v/s currently marketed 9 ANDAs), we forecast US generics sales to grow at 32% CAGR to Rs3.35bn over FY13‐15E. In fact, the management expects first shipment from Indore facility in Q4FY14 (for 3 approved drugs) and 6‐7 more drug launches in FY15. Additionally, the company has guided for aggressive ANDA filing plans of 12‐15 ANDAs per annum.
Anti‐malarial business: strong visibility despite concerns of declined funding IPCA is one of the top five suppliers of anti‐malaria drugs in the world having WHO pre‐qualification for Artemether‐Lumfantrine (AL) and Artemether‐Amodiquine (AA). Supported by its vertically integrated operation, the company has rapidly enhanced its market share to ~20% for AL with sales of Rs 3.6bn in FY13, implying a CAGR 60% over FY09‐13. Going ahead, we believe IPCA will grab 25% market share led by its cost leadership and ramp up in AA (market potential of $50mn). Also the company’s initiatives to develop malaria injectable will help it grow further. We estimate IPCA’s anti‐malarial institutional business to deliver a CAGR of 18% over FY13‐15 to Rs 5.05bn
Limited valuation gap; Initiate with Neutral rating and Target Price of Rs 752 With steadily progressive and predictable financial performance (sales CAGR 22% and profit CAGR 25%), cash flow turning positive, healthy balance sheet and strong return ratios, IPCA valuations have seen gradual re‐rating over last three years from 8x 1‐year forward earnings in FY11 to the current 15x.
At CMP of Rs 681, IPCA trades at 14.6x FY15E EPS, which we believe factors almost all visible earning triggers and we don’t expect further re‐rating in near future. However, considering its sound operational and financial performance track record, we are valuing IPCA at Rs 752 (16x its FY15E EPS), implying a limited upside of 10%. Hence, we initiate coverage on IPCA with a ‘Neutral’ rating and a one‐year Target Price of Rs 752.
NEUTRAL IPCA IN | CMP RS 681
TARGET RS 752 (+10%) Company Data
O/S SHARES (MN) : 126MARKET CAP (RSBN) : 86MARKET CAP (USDBN) : 1.452 ‐ WK HI/LO (RS) : 744 / 443LIQUIDITY 3M (USDMN) : 2.1FACE VALUE (RS) : 2
Share Holding Pattern, %
PROMOTERS : 45.9FII / NRI : 25.6FI / MF : 12.4NON PROMOTER CORP. HOLDINGS : 5.2PUBLIC & OTHERS : 11.0
Price Performance, % 1mth 3mth 1yr
ABS ‐1.2 8.8 51.2REL TO BSE 0.2 ‐1.1 41.2
Price Vs. Sensex (Rebased values)
60
100
140
180
220
260
300
Apr‐10 Jun‐11 Aug‐12 Oct‐13
IPCA BSE Sensex
Source: Bloomberg, Phillip Capital Research
Other Key Ratios
Rs mn FY13 FY14E FY15E
Net Sales 27,537 31,632 36,848EBIDTA 6,232 7,614 9,020Net Profit 3,932 4,799 5,853EPS, Rs 31.4 38.3 46.8PER, x 21.7 17.8 14.6EV/EBIDTA, x 14.6 11.9 9.8P/BV, x 5.5 4.3 3.4ROE, % 25.3 24.2 23.4Debt/Equity (%) 39.7 34.7 23.3Source: Phillip Capital India Research Surya Patra (+ 9122 6667 9768) [email protected]
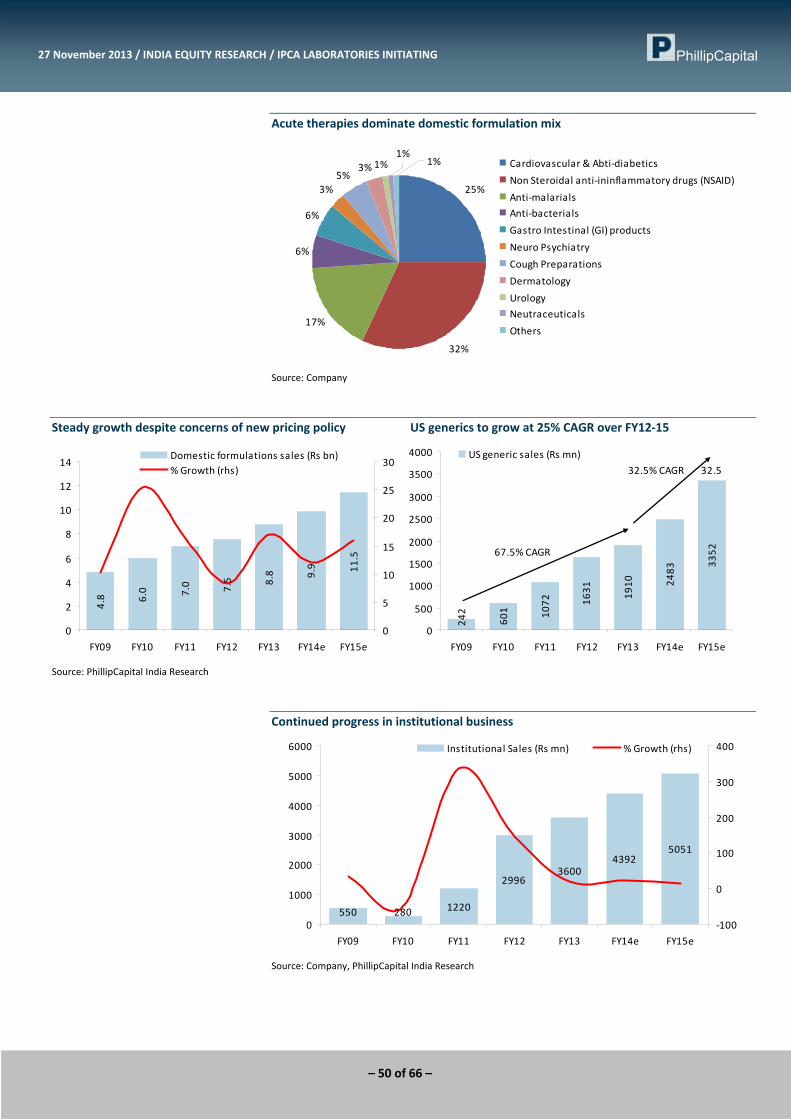
– 50 of 66 –
27 November 2013 / INDIA EQUITY RESEARCH / IPCA LABORATORIES INITIATING
Acute therapies dominate domestic formulation mix
25%
32%
17%
6%
6%
3%5%
3% 1%1%
1% Cardiovascular & Abti‐diabetics
Non Steroidal anti‐ininflammatory drugs (NSAID)
Anti‐malarials
Anti‐bacterials
Gastro Intestinal (GI) products
Neuro Psychiatry
Cough Preparations
Dermatology
Urology
Neutraceuticals
Others
Source: Company
Steady growth despite concerns of new pricing policy US generics to grow at 25% CAGR over FY12‐15
4.8 6.0 7.0 7.5 8.8 9.9 11.5
0
2
4
6
8
10
12
14
FY09 FY10 FY11 FY12 FY13 FY14e FY15e
0
5
10
15
20
25
30Domestic formulations sales (Rs bn)% Growth (rhs)
242
601 1072 16
31 1910 24
83
3352
0
500
1000
1500
2000
2500
3000
3500
4000
FY09 FY10 FY11 FY12 FY13 FY14e FY15e
US generic sales (Rs mn)
67.5% CAGR
32.532.5% CAGR
Source: PhillipCapital India Research
Continued progress in institutional business
550 280 1220
29963600
43925051
0
1000
2000
3000
4000
5000
6000
FY09 FY10 FY11 FY12 FY13 FY14e FY15e
‐100
0
100
200
300
400Institutional Sales (Rs mn) % Growth (rhs)
Source: Company, PhillipCapital India Research

– 51 of 66 –
27 November 2013 / INDIA EQUITY RESEARCH / IPCA LABORATORIES INITIATING
Sales Mix of IPCA Laboratories (Rs Mn) FY11 FY12 FY13 FY14E FY15E
Domestic formulations 6957 7534 8815 9873 11452Growth % 16.4 8.3 17.0 12.0 16.0% of sales 37.3 32.8 33.0 31.2 31.1 Branded Formulation Exports 1583 2095 2683 3222 3797Growth % 12.5 32.3 28.1 20.1 17.8% of sales 8.5 9.1 10.1 10.2 10.3Institutional Sales (Africa) 1220 2996 3600 4392 5051Growth % 335.7 145.6 20.1 22.0 15.0% of sales 6.5 13.0 13.5 13.9 13.7Generic Formulation Exports 4114 4870 4995 6208 7506Growth % 28.4 18.4 2.6 24.3 20.9% of sales 22.0 21.2 18.7 19.6 20.4Total Formulation Exports 6917 9961 11279 13823 16354Growth % 41.4 44.0 13.2 22.6 18.3% of sales 37.1 43.3 42.3 43.7 44.4 Gross APIs 4786 5497 6589 7937 9042Growth % 4.4 14.9 19.9 20.5 13.9% of sales 25.6 23.9 24.7 25.1 24.5 TOTAL 18659 22992 26683 31632 36848Growth % 20.7 23.2 16.1 18.5 16.5
Source: Company, PhillipCapital India Research
Predictably steady progressive financial Performance
12.8
15.6 18.8 23.1 27.5 31.6 36.8
0
5
10
15
20
25
30
35
40
FY09 FY10 FY11 FY12 FY13 FY14 FY15
0
5
10
15
20
25Total Income(Rs Bn) % Growth (rhs)
1528 2002
2289 3170 3932 4799 58
53
0
1000
2000
3000
4000
5000
6000
7000
FY09 FY10 FY11 FY12 FY13 FY14 FY15
0
5
10
15
20
25
30
35
40
45APAT(Rs Bn) % CAGR (rhs)
Source: Company, PhillipCapital India Research
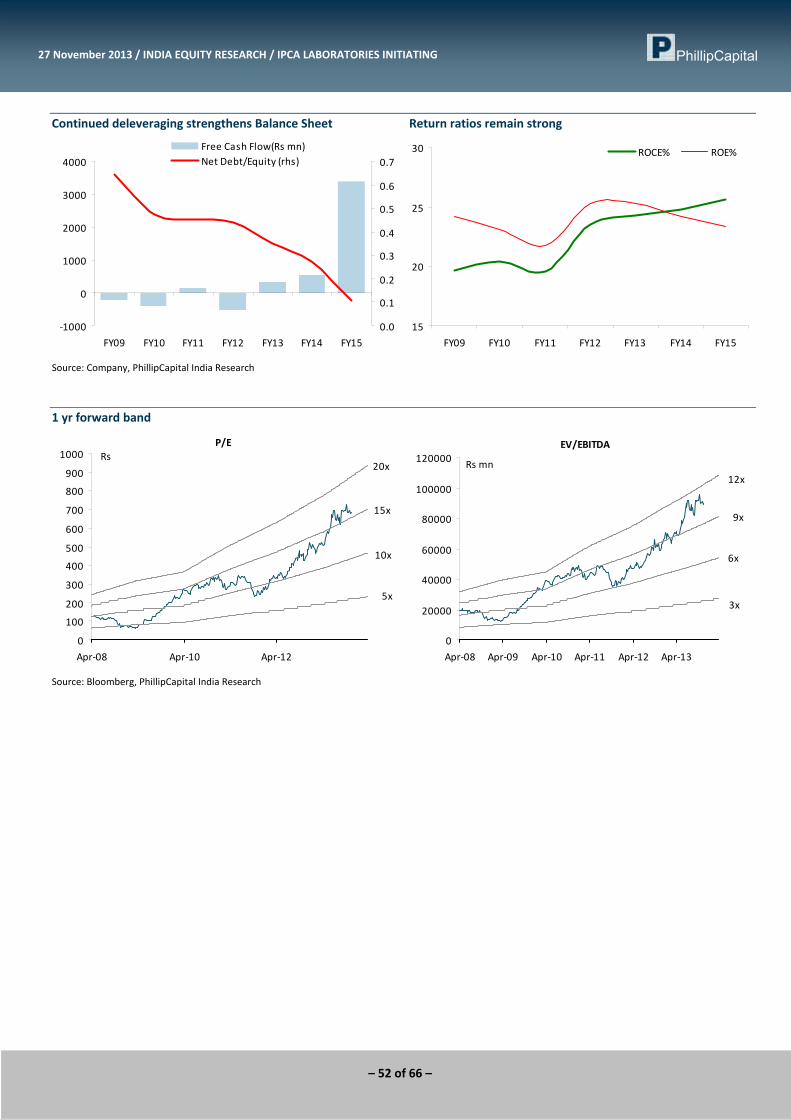
– 52 of 66 –
27 November 2013 / INDIA EQUITY RESEARCH / IPCA LABORATORIES INITIATING
Continued deleveraging strengthens Balance Sheet Return ratios remain strong
‐1000
0
1000
2000
3000
4000
FY09 FY10 FY11 FY12 FY13 FY14 FY15
0.0
0.1
0.2
0.3
0.4
0.5
0.6
0.7
Free Cash Flow(Rs mn)Net Debt/Equity (rhs)
15
20
25
30
FY09 FY10 FY11 FY12 FY13 FY14 FY15
ROCE% ROE%
Source: Company, PhillipCapital India Research
1 yr forward band
P/E
5x
10x
15x
20x
0
100
200
300
400
500
600
700
800
900
1000
Apr‐08 Apr‐10 Apr‐12
Rs
EV/EBITDA
3x
6x
9x
12x
0
20000
40000
60000
80000
100000
120000
Apr‐08 Apr‐09 Apr‐10 Apr‐11 Apr‐12 Apr‐13
Rs mn
Source: Bloomberg, PhillipCapital India Research
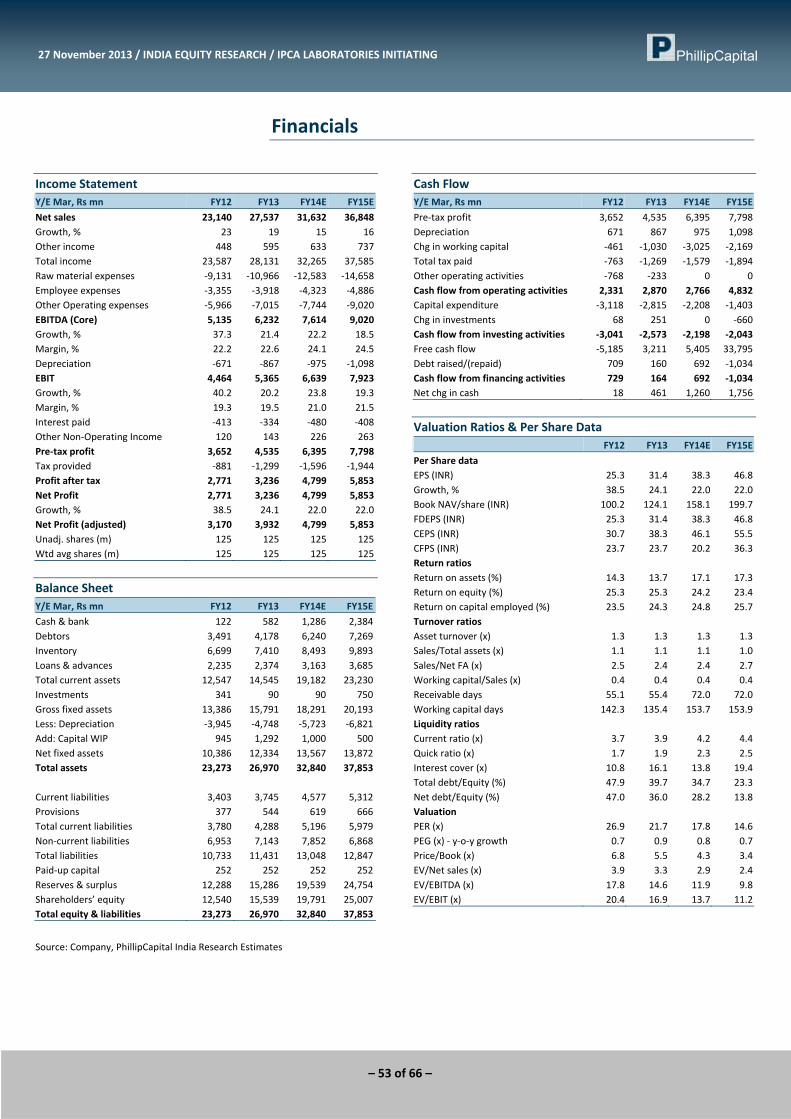
– 53 of 66 –
27 November 2013 / INDIA EQUITY RESEARCH / IPCA LABORATORIES INITIATING
Financials
Income Statement Y/E Mar, Rs mn FY12 FY13 FY14E FY15E
Net sales 23,140 27,537 31,632 36,848Growth, % 23 19 15 16Other income 448 595 633 737Total income 23,587 28,131 32,265 37,585Raw material expenses ‐9,131 ‐10,966 ‐12,583 ‐14,658Employee expenses ‐3,355 ‐3,918 ‐4,323 ‐4,886Other Operating expenses ‐5,966 ‐7,015 ‐7,744 ‐9,020EBITDA (Core) 5,135 6,232 7,614 9,020Growth, % 37.3 21.4 22.2 18.5Margin, % 22.2 22.6 24.1 24.5Depreciation ‐671 ‐867 ‐975 ‐1,098EBIT 4,464 5,365 6,639 7,923Growth, % 40.2 20.2 23.8 19.3Margin, % 19.3 19.5 21.0 21.5Interest paid ‐413 ‐334 ‐480 ‐408Other Non‐Operating Income 120 143 226 263Pre‐tax profit 3,652 4,535 6,395 7,798Tax provided ‐881 ‐1,299 ‐1,596 ‐1,944Profit after tax 2,771 3,236 4,799 5,853Net Profit 2,771 3,236 4,799 5,853Growth, % 38.5 24.1 22.0 22.0Net Profit (adjusted) 3,170 3,932 4,799 5,853Unadj. shares (m) 125 125 125 125Wtd avg shares (m) 125 125 125 125
Balance Sheet Y/E Mar, Rs mn FY12 FY13 FY14E FY15E
Cash & bank 122 582 1,286 2,384Debtors 3,491 4,178 6,240 7,269Inventory 6,699 7,410 8,493 9,893Loans & advances 2,235 2,374 3,163 3,685Total current assets 12,547 14,545 19,182 23,230Investments 341 90 90 750Gross fixed assets 13,386 15,791 18,291 20,193Less: Depreciation ‐3,945 ‐4,748 ‐5,723 ‐6,821Add: Capital WIP 945 1,292 1,000 500Net fixed assets 10,386 12,334 13,567 13,872Total assets 23,273 26,970 32,840 37,853 Current liabilities 3,403 3,745 4,577 5,312Provisions 377 544 619 666Total current liabilities 3,780 4,288 5,196 5,979Non‐current liabilities 6,953 7,143 7,852 6,868Total liabilities 10,733 11,431 13,048 12,847Paid‐up capital 252 252 252 252Reserves & surplus 12,288 15,286 19,539 24,754Shareholders’ equity 12,540 15,539 19,791 25,007Total equity & liabilities 23,273 26,970 32,840 37,853
Source: Company, PhillipCapital India Research Estimates
Cash Flow Y/E Mar, Rs mn FY12 FY13 FY14E FY15E
Pre‐tax profit 3,652 4,535 6,395 7,798Depreciation 671 867 975 1,098Chg in working capital ‐461 ‐1,030 ‐3,025 ‐2,169Total tax paid ‐763 ‐1,269 ‐1,579 ‐1,894Other operating activities ‐768 ‐233 0 0Cash flow from operating activities 2,331 2,870 2,766 4,832Capital expenditure ‐3,118 ‐2,815 ‐2,208 ‐1,403Chg in investments 68 251 0 ‐660Cash flow from investing activities ‐3,041 ‐2,573 ‐2,198 ‐2,043Free cash flow ‐5,185 3,211 5,405 33,795Debt raised/(repaid) 709 160 692 ‐1,034Cash flow from financing activities 729 164 692 ‐1,034Net chg in cash 18 461 1,260 1,756
Valuation Ratios & Per Share Data FY12 FY13 FY14E FY15E
Per Share data EPS (INR) 25.3 31.4 38.3 46.8Growth, % 38.5 24.1 22.0 22.0Book NAV/share (INR) 100.2 124.1 158.1 199.7FDEPS (INR) 25.3 31.4 38.3 46.8CEPS (INR) 30.7 38.3 46.1 55.5CFPS (INR) 23.7 23.7 20.2 36.3Return ratios Return on assets (%) 14.3 13.7 17.1 17.3Return on equity (%) 25.3 25.3 24.2 23.4Return on capital employed (%) 23.5 24.3 24.8 25.7Turnover ratios Asset turnover (x) 1.3 1.3 1.3 1.3Sales/Total assets (x) 1.1 1.1 1.1 1.0Sales/Net FA (x) 2.5 2.4 2.4 2.7Working capital/Sales (x) 0.4 0.4 0.4 0.4Receivable days 55.1 55.4 72.0 72.0Working capital days 142.3 135.4 153.7 153.9Liquidity ratios Current ratio (x) 3.7 3.9 4.2 4.4Quick ratio (x) 1.7 1.9 2.3 2.5Interest cover (x) 10.8 16.1 13.8 19.4Total debt/Equity (%) 47.9 39.7 34.7 23.3Net debt/Equity (%) 47.0 36.0 28.2 13.8Valuation PER (x) 26.9 21.7 17.8 14.6PEG (x) ‐ y‐o‐y growth 0.7 0.9 0.8 0.7Price/Book (x) 6.8 5.5 4.3 3.4EV/Net sales (x) 3.9 3.3 2.9 2.4EV/EBITDA (x) 17.8 14.6 11.9 9.8EV/EBIT (x) 20.4 16.9 13.7 11.2
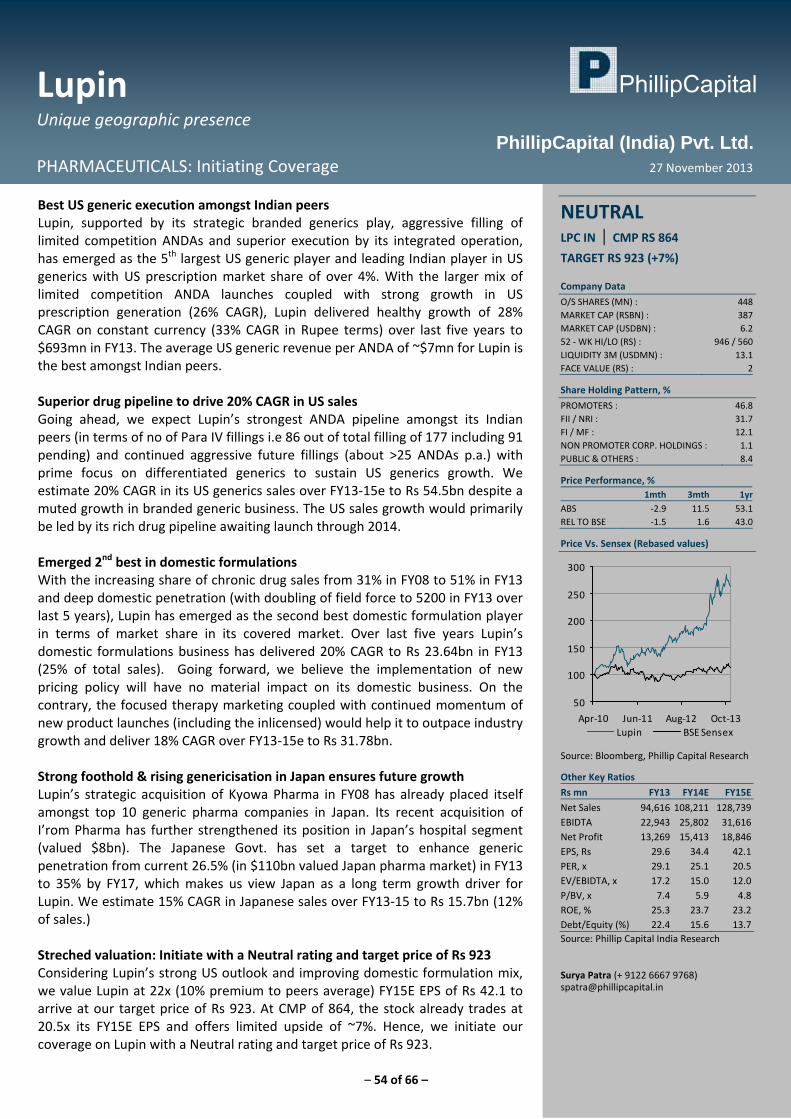
– 54 of 66 –
Lupin Unique geographic presence
PHARMACEUTICALS: Initiating Coverage 27 November 2013
PhillipCapital (India) Pvt. Ltd.
Best US generic execution amongst Indian peers Lupin, supported by its strategic branded generics play, aggressive filling of limited competition ANDAs and superior execution by its integrated operation, has emerged as the 5th largest US generic player and leading Indian player in US generics with US prescription market share of over 4%. With the larger mix of limited competition ANDA launches coupled with strong growth in US prescription generation (26% CAGR), Lupin delivered healthy growth of 28% CAGR on constant currency (33% CAGR in Rupee terms) over last five years to $693mn in FY13. The average US generic revenue per ANDA of ~$7mn for Lupin is the best amongst Indian peers. Superior drug pipeline to drive 20% CAGR in US sales Going ahead, we expect Lupin’s strongest ANDA pipeline amongst its Indian peers (in terms of no of Para IV fillings i.e 86 out of total filling of 177 including 91 pending) and continued aggressive future fillings (about >25 ANDAs p.a.) with prime focus on differentiated generics to sustain US generics growth. We estimate 20% CAGR in its US generics sales over FY13‐15e to Rs 54.5bn despite a muted growth in branded generic business. The US sales growth would primarily be led by its rich drug pipeline awaiting launch through 2014. Emerged 2nd best in domestic formulations With the increasing share of chronic drug sales from 31% in FY08 to 51% in FY13 and deep domestic penetration (with doubling of field force to 5200 in FY13 over last 5 years), Lupin has emerged as the second best domestic formulation player in terms of market share in its covered market. Over last five years Lupin’s domestic formulations business has delivered 20% CAGR to Rs 23.64bn in FY13 (25% of total sales). Going forward, we believe the implementation of new pricing policy will have no material impact on its domestic business. On the contrary, the focused therapy marketing coupled with continued momentum of new product launches (including the inlicensed) would help it to outpace industry growth and deliver 18% CAGR over FY13‐15e to Rs 31.78bn. Strong foothold & rising genericisation in Japan ensures future growth Lupin’s strategic acquisition of Kyowa Pharma in FY08 has already placed itself amongst top 10 generic pharma companies in Japan. Its recent acquisition of I’rom Pharma has further strengthened its position in Japan’s hospital segment (valued $8bn). The Japanese Govt. has set a target to enhance generic penetration from current 26.5% (in $110bn valued Japan pharma market) in FY13 to 35% by FY17, which makes us view Japan as a long term growth driver for Lupin. We estimate 15% CAGR in Japanese sales over FY13‐15 to Rs 15.7bn (12% of sales.) Streched valuation: Initiate with a Neutral rating and target price of Rs 923 Considering Lupin’s strong US outlook and improving domestic formulation mix, we value Lupin at 22x (10% premium to peers average) FY15E EPS of Rs 42.1 to arrive at our target price of Rs 923. At CMP of 864, the stock already trades at 20.5x its FY15E EPS and offers limited upside of ~7%. Hence, we initiate our coverage on Lupin with a Neutral rating and target price of Rs 923.
NEUTRAL LPC IN | CMP RS 864
TARGET RS 923 (+7%) Company Data
O/S SHARES (MN) : 448MARKET CAP (RSBN) : 387MARKET CAP (USDBN) : 6.252 ‐ WK HI/LO (RS) : 946 / 560LIQUIDITY 3M (USDMN) : 13.1FACE VALUE (RS) : 2
Share Holding Pattern, %
PROMOTERS : 46.8FII / NRI : 31.7FI / MF : 12.1NON PROMOTER CORP. HOLDINGS : 1.1PUBLIC & OTHERS : 8.4
Price Performance, % 1mth 3mth 1yr
ABS ‐2.9 11.5 53.1REL TO BSE ‐1.5 1.6 43.0
Price Vs. Sensex (Rebased values)
50
100
150
200
250
300
Apr‐10 Jun‐11 Aug‐12 Oct‐13Lupin BSE Sensex
Source: Bloomberg, Phillip Capital Research
Other Key Ratios
Rs mn FY13 FY14E FY15E
Net Sales 94,616 108,211 128,739EBIDTA 22,943 25,802 31,616Net Profit 13,269 15,413 18,846EPS, Rs 29.6 34.4 42.1PER, x 29.1 25.1 20.5EV/EBIDTA, x 17.2 15.0 12.0P/BV, x 7.4 5.9 4.8ROE, % 25.3 23.7 23.2Debt/Equity (%) 22.4 15.6 13.7Source: Phillip Capital India Research Surya Patra (+ 9122 6667 9768) [email protected]

– 55 of 66 –
27 November 2013 / INDIA EQUITY RESEARCH / LUPIN INITIATING
Strong visibility of US pipeline for FY15 stretched Valuations Supported by its aggressive US fillings coupled with continued focus on branded play and rising contribution from domestic chronic segments, Lupin has delivered compounded annual growth of 26% and 27% in sales and net profits over last five years to Rs 96.4bn and Rs 13.27bn, respectively in FY13. Going ahead, we expect Lupin’s strengthening US pipeline (despite the high base of US operation), its continued steady progress in domestic formulation and the Japanese generics will drive 17% and 19% CAGR in sales and net earnings over FY13‐15E to Rs131.2bn and Rs 18.8bn, respectively. Considering Lupin’s strong US outlook and improving domestic formulation mix, we value Lupin at 22x (10% premium to peers average) FY15E EPS of Rs 42.1 to arrive at our target price of Rs 923. At CMP of 864, the stock trades at 20.5x FY15E EPS and offers limited upside of ~7%. We initiate our coverage on Lupin with a Neutral rating and target price of Rs 923. Key downside risk to our estimates include – 1) early generic competition in Suprax, 2) regulatory hurdles in terms of delay in approvals and facility issues and 3)adverse currency fluctuation. However, the continued inorganic efforts of the company in US branded business and ROW market supported by strong free cash flow generation (estimated to Rs 38.6bn over FY13‐15) and healthy 0.2x D/E position pose an upside risk to our estimates.
Strongest pipeline of ANDAs amongst Indian Peers Potential Generics Mkt Size
(US $mn) Likely Launch Remarks
Duloxetine Hcl(Cymbalta) 3200.0 11‐Dec‐13 multiple filling >10, Shared FTF with several players
Choline fenofibrate(Triplix) 549.0 1‐Jan‐14 Mylan launched in 15th July 2013 n Impax was Authorised generic but will be limited competion
Telmisartan; amlodipine(Twynsta) NA 16‐Jan‐14
Niacin(Niaspan) 1120.0 16‐Mar‐14 Competative launch after teva's 180days exclusivity in 16th Mar 2014
Esomeprazole magnesium(Nexium) 2272.0 27‐May‐14 Ranbaxy is FTF,Dr Reddy and Teva settled to launch on on 27 May 2014
Eszopiclone(Lunesta) 800.0 30‐May‐14 multiple settlement by glenmark, sun…Sun n Mylan has already got FA
YAZ 347.0 30‐Jun‐14 Likely competing launch by Watson, Sandoz, Lupin, Sun n Femycare on patent expiry in Jun 2014.
Bimatoprost (Lumigan) 400 19‐Aug‐14 LPC is sole FTF for 0.01% formulation
Memantine (Namenda) 1750.0 11‐Jan‐15 Settled with Amneal, Watson, Dr. Reddy's, Lupin, Mylan, Orchid, Sun, Teva, Upsher‐Smith, and Wockhardt
Colesevelam(Welchol) 378 2‐Sep‐15 Glenmark/Impax already settled. Impax is FTF. Watson n Lupin r litigating, late entry after exclusivity expiry on 2nd Sep 2015
Celecoxib(Celebrex) 1750.0 2‐Dec‐15 multiple filling >10, Teva, Mylan, Watson, Apotex etc
Amlodp+Valsartan+Hclthzde(Exforge HCT) 321.0
Asacol (mesalamine). Cadila is FTF
Darunavir(Prezista) 450 Lupin has joint FTF with Mylan may be in 2019
Naproxen+ Esomeprazole(Vimovo) DRL FTF
Gatifloxacin(Zymaxid)
Moxifloxacin(Vigamox)
estradiol valerate and dienogest(Natazia)
armodafinil(Nuvigil) 291
Source: Company, PhillipCapital India Research
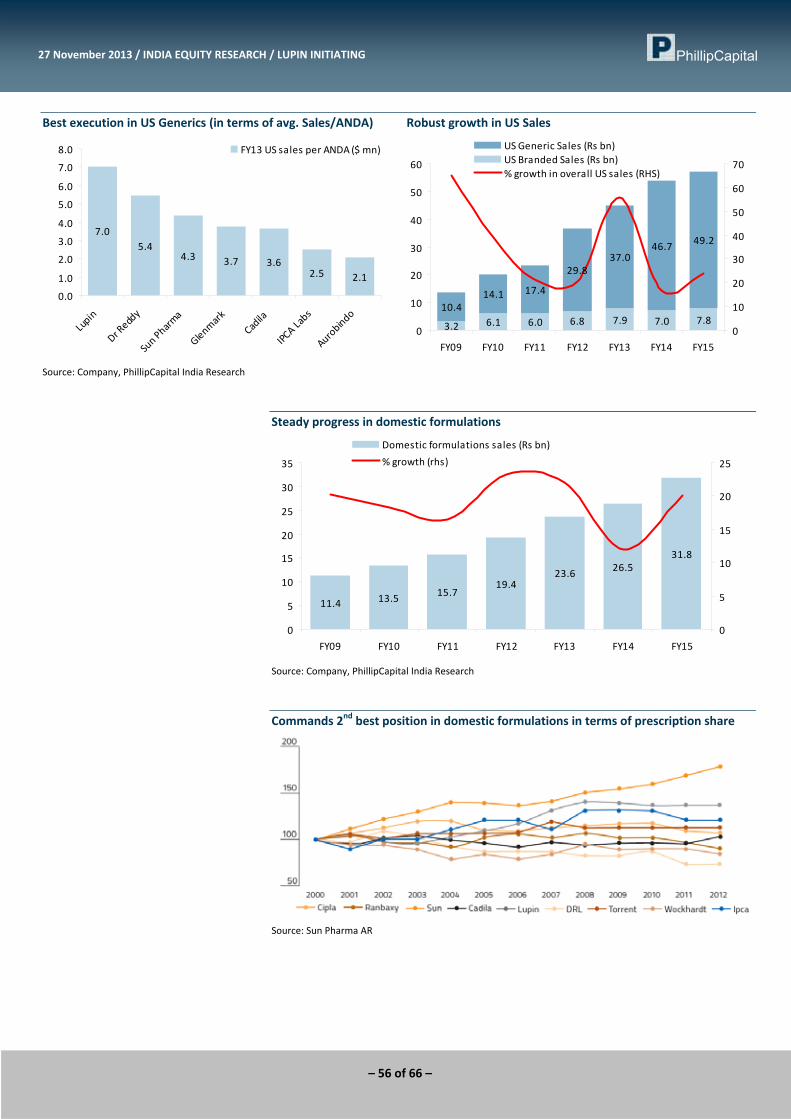
– 56 of 66 –
27 November 2013 / INDIA EQUITY RESEARCH / LUPIN INITIATING
Best execution in US Generics (in terms of avg. Sales/ANDA) Robust growth in US Sales
7.05.4
4.3 3.7 3.62.5 2.1
0.0
1.0
2.0
3.0
4.0
5.0
6.0
7.0
8.0
Lupin
Dr Reddy
Sun Pharma
Glenmark
Cadila
IPCA Labs
Aurobindo
FY13 US sales per ANDA ($ mn)
3.2 6.1 6.0 6.8 7.9 7.0 7.810.4
14.1 17.4
29.837.0
46.7 49.2
0
10
20
30
40
50
60
FY09 FY10 FY11 FY12 FY13 FY14 FY15
0
10
20
30
40
50
60
70
US Generic Sales (Rs bn)US Branded Sales (Rs bn)% growth in overall US sales (RHS)
Source: Company, PhillipCapital India Research
Steady progress in domestic formulations
11.4 13.5 15.719.4
23.6 26.531.8
0
5
10
15
20
25
30
35
FY09 FY10 FY11 FY12 FY13 FY14 FY15
0
5
10
15
20
25
Domestic formulations sales (Rs bn)
% growth (rhs)
Source: Company, PhillipCapital India Research
Commands 2nd best position in domestic formulations in terms of prescription share
Source: Sun Pharma AR

– 57 of 66 –
27 November 2013 / INDIA EQUITY RESEARCH / LUPIN INITIATING
Revenue Mix Rs bn) FY11 FY12 FY13 FY14 FY15
Branded Sales (Rs Mn) 6.0 6.8 7.9 7.0 7.8US generic sales (Rs mn) 14.1 17.4 29.8 37.0 46.7Total US Sales (Rs Mn) 20.1 24.2 37.7 44.1 54.5% of Total sales 36.3 35.2 39.8 40.7 42.3 Europe 1.8 2.0 2.4 2.8 3.3Japan ‐ Kywoa (Rs mn) 7.0 8.6 13.0 13.7 15.7SA ‐ Pharma Dynamics 1.8 2.6 3.2 4.0 4.8ROW 0.4 3.6 5.2 6.7 7.4 India formulations Sales 15.7 19.4 23.6 26.5 31.8% of Total sales 28.5 28.1 25.0 24.5 24.7 APIs 8.4 8.5 9.5 10.4 11.3Gross Sales 55.3 68.8 94.6 108.2 128.7
Source: Company, PhillipCapital India Research
Strong financial performance
48.5 58.270.8
96.4110.3
131.2
0
20
40
60
80
100
120
140
FY10 FY11 FY12 FY13 FY14e FY15e
0
5
10
15
20
25
30
35
40
Total Income (Rs bn)% YoY growth (rhs)
6.8 7.9 8.9
13.315.4
18.8
0
2
4
6
8
10
12
14
16
18
20
FY10 FY11 FY12 FY13 FY14e FY15e
0
10
20
30
40
50
60
Adj. Net earnings (Rs bn)EBITDA Margin % (rhs)% YoY growth (rhs)
Source: Company, PhillipCapital India Research
Strong free cash flow powers balance sheet health Return ratios remain strong
9.713.2
15.9 14.318.7 20.0
0
5
10
15
20
25
FY10 FY11 FY12 FY13 FY14e FY15e
‐0.20
‐0.10
0.00
0.10
0.20
0.30
0.40
Free Cash flow (Rs Bn)Net Debt/Equity (x) (rhs)
15
20
25
30
35
FY10 FY11 FY12 FY13 FY14e FY15e
ROCE % ROE %
Source: Company, PhillipCapital India Research
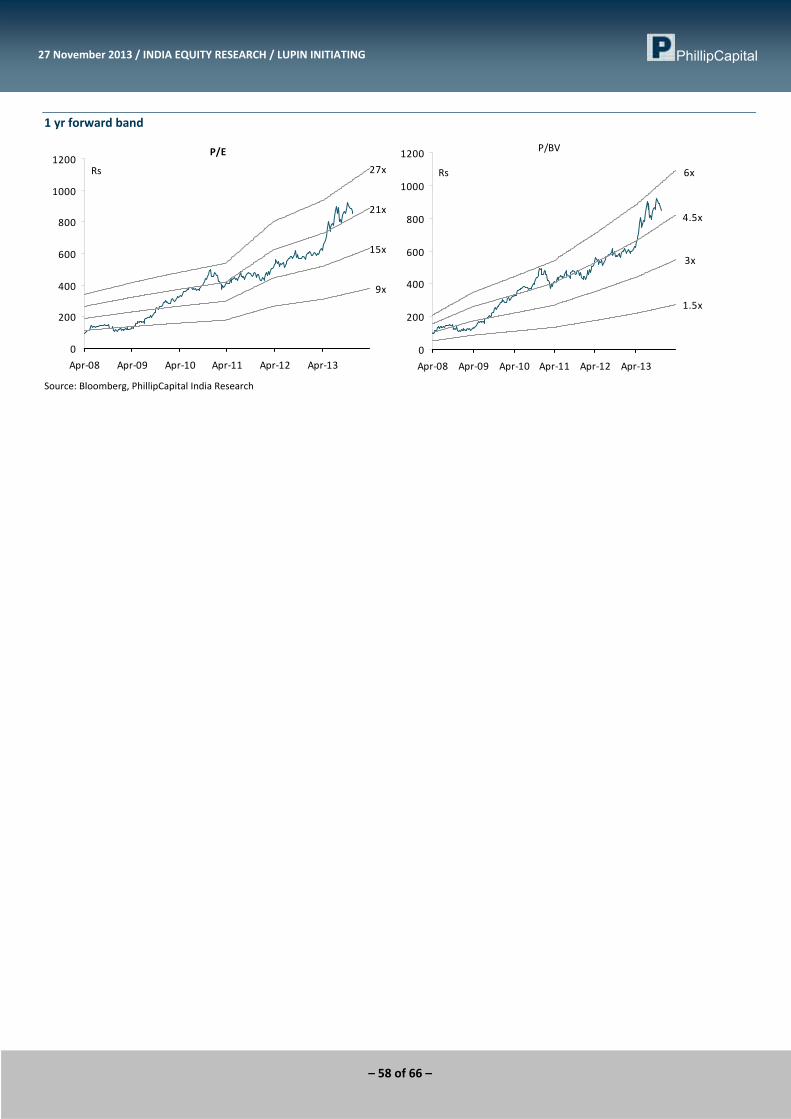
– 58 of 66 –
27 November 2013 / INDIA EQUITY RESEARCH / LUPIN INITIATING
1 yr forward band
P/E
9x
15x
21x
27x
0
200
400
600
800
1000
1200
Apr‐08 Apr‐09 Apr‐10 Apr‐11 Apr‐12 Apr‐13
Rs
P/BV
1.5x
3x
4.5x
6x
0
200
400
600
800
1000
1200
Apr‐08 Apr‐09 Apr‐10 Apr‐11 Apr‐12 Apr‐13
Rs
Source: Bloomberg, PhillipCapital India Research
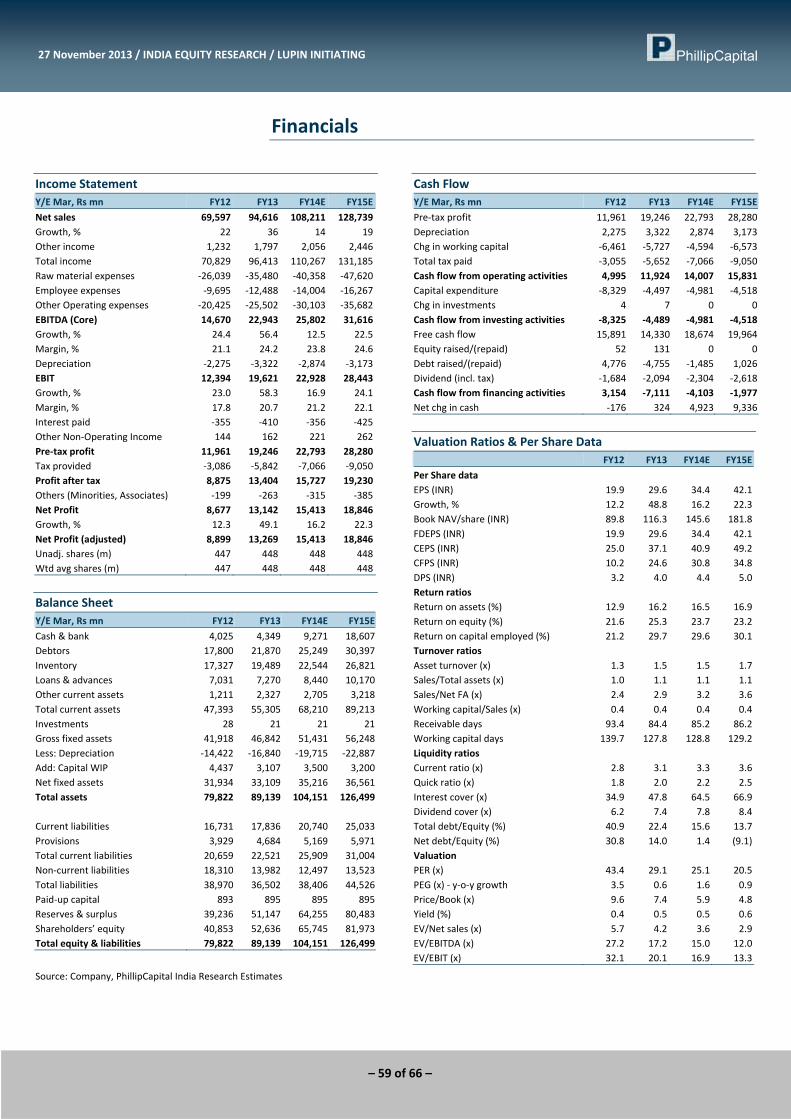
– 59 of 66 –
27 November 2013 / INDIA EQUITY RESEARCH / LUPIN INITIATING
Financials
Income Statement Y/E Mar, Rs mn FY12 FY13 FY14E FY15E
Net sales 69,597 94,616 108,211 128,739Growth, % 22 36 14 19Other income 1,232 1,797 2,056 2,446Total income 70,829 96,413 110,267 131,185Raw material expenses ‐26,039 ‐35,480 ‐40,358 ‐47,620Employee expenses ‐9,695 ‐12,488 ‐14,004 ‐16,267Other Operating expenses ‐20,425 ‐25,502 ‐30,103 ‐35,682EBITDA (Core) 14,670 22,943 25,802 31,616Growth, % 24.4 56.4 12.5 22.5Margin, % 21.1 24.2 23.8 24.6Depreciation ‐2,275 ‐3,322 ‐2,874 ‐3,173EBIT 12,394 19,621 22,928 28,443Growth, % 23.0 58.3 16.9 24.1Margin, % 17.8 20.7 21.2 22.1Interest paid ‐355 ‐410 ‐356 ‐425Other Non‐Operating Income 144 162 221 262Pre‐tax profit 11,961 19,246 22,793 28,280Tax provided ‐3,086 ‐5,842 ‐7,066 ‐9,050Profit after tax 8,875 13,404 15,727 19,230Others (Minorities, Associates) ‐199 ‐263 ‐315 ‐385Net Profit 8,677 13,142 15,413 18,846Growth, % 12.3 49.1 16.2 22.3Net Profit (adjusted) 8,899 13,269 15,413 18,846Unadj. shares (m) 447 448 448 448Wtd avg shares (m) 447 448 448 448
Balance Sheet Y/E Mar, Rs mn FY12 FY13 FY14E FY15E
Cash & bank 4,025 4,349 9,271 18,607Debtors 17,800 21,870 25,249 30,397Inventory 17,327 19,489 22,544 26,821Loans & advances 7,031 7,270 8,440 10,170Other current assets 1,211 2,327 2,705 3,218Total current assets 47,393 55,305 68,210 89,213Investments 28 21 21 21Gross fixed assets 41,918 46,842 51,431 56,248Less: Depreciation ‐14,422 ‐16,840 ‐19,715 ‐22,887Add: Capital WIP 4,437 3,107 3,500 3,200Net fixed assets 31,934 33,109 35,216 36,561Total assets 79,822 89,139 104,151 126,499 Current liabilities 16,731 17,836 20,740 25,033Provisions 3,929 4,684 5,169 5,971Total current liabilities 20,659 22,521 25,909 31,004Non‐current liabilities 18,310 13,982 12,497 13,523Total liabilities 38,970 36,502 38,406 44,526Paid‐up capital 893 895 895 895Reserves & surplus 39,236 51,147 64,255 80,483Shareholders’ equity 40,853 52,636 65,745 81,973Total equity & liabilities 79,822 89,139 104,151 126,499
Source: Company, PhillipCapital India Research Estimates
Cash Flow Y/E Mar, Rs mn FY12 FY13 FY14E FY15E
Pre‐tax profit 11,961 19,246 22,793 28,280Depreciation 2,275 3,322 2,874 3,173Chg in working capital ‐6,461 ‐5,727 ‐4,594 ‐6,573Total tax paid ‐3,055 ‐5,652 ‐7,066 ‐9,050Cash flow from operating activities 4,995 11,924 14,007 15,831Capital expenditure ‐8,329 ‐4,497 ‐4,981 ‐4,518Chg in investments 4 7 0 0Cash flow from investing activities ‐8,325 ‐4,489 ‐4,981 ‐4,518Free cash flow 15,891 14,330 18,674 19,964Equity raised/(repaid) 52 131 0 0Debt raised/(repaid) 4,776 ‐4,755 ‐1,485 1,026Dividend (incl. tax) ‐1,684 ‐2,094 ‐2,304 ‐2,618Cash flow from financing activities 3,154 ‐7,111 ‐4,103 ‐1,977Net chg in cash ‐176 324 4,923 9,336
Valuation Ratios & Per Share Data FY12 FY13 FY14E FY15E
Per Share data EPS (INR) 19.9 29.6 34.4 42.1Growth, % 12.2 48.8 16.2 22.3Book NAV/share (INR) 89.8 116.3 145.6 181.8FDEPS (INR) 19.9 29.6 34.4 42.1CEPS (INR) 25.0 37.1 40.9 49.2CFPS (INR) 10.2 24.6 30.8 34.8DPS (INR) 3.2 4.0 4.4 5.0Return ratios Return on assets (%) 12.9 16.2 16.5 16.9Return on equity (%) 21.6 25.3 23.7 23.2Return on capital employed (%) 21.2 29.7 29.6 30.1Turnover ratios Asset turnover (x) 1.3 1.5 1.5 1.7Sales/Total assets (x) 1.0 1.1 1.1 1.1Sales/Net FA (x) 2.4 2.9 3.2 3.6Working capital/Sales (x) 0.4 0.4 0.4 0.4Receivable days 93.4 84.4 85.2 86.2Working capital days 139.7 127.8 128.8 129.2Liquidity ratios Current ratio (x) 2.8 3.1 3.3 3.6Quick ratio (x) 1.8 2.0 2.2 2.5Interest cover (x) 34.9 47.8 64.5 66.9Dividend cover (x) 6.2 7.4 7.8 8.4Total debt/Equity (%) 40.9 22.4 15.6 13.7Net debt/Equity (%) 30.8 14.0 1.4 (9.1)Valuation PER (x) 43.4 29.1 25.1 20.5PEG (x) ‐ y‐o‐y growth 3.5 0.6 1.6 0.9Price/Book (x) 9.6 7.4 5.9 4.8Yield (%) 0.4 0.5 0.5 0.6EV/Net sales (x) 5.7 4.2 3.6 2.9EV/EBITDA (x) 27.2 17.2 15.0 12.0EV/EBIT (x) 32.1 20.1 16.9 13.3
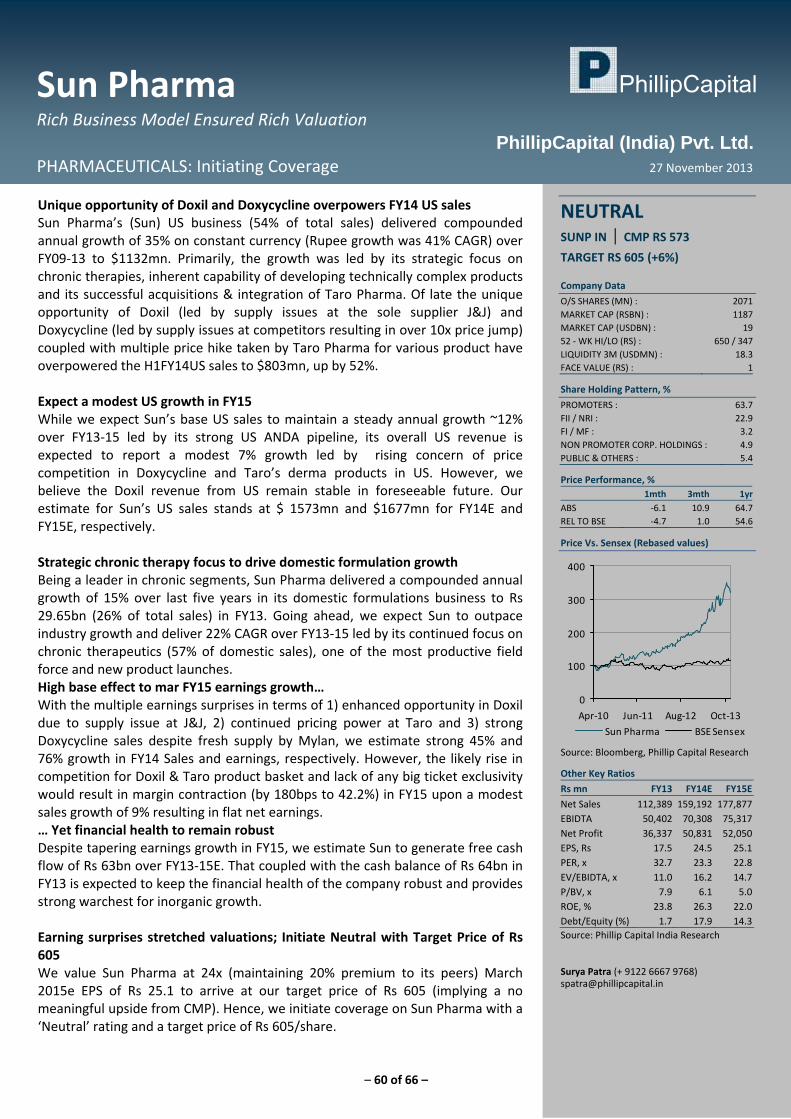
– 60 of 66 –
Sun Pharma Rich Business Model Ensured Rich Valuation
PHARMACEUTICALS: Initiating Coverage 27 November 2013
PhillipCapital (India) Pvt. Ltd.
Unique opportunity of Doxil and Doxycycline overpowers FY14 US sales Sun Pharma’s (Sun) US business (54% of total sales) delivered compounded annual growth of 35% on constant currency (Rupee growth was 41% CAGR) over FY09‐13 to $1132mn. Primarily, the growth was led by its strategic focus on chronic therapies, inherent capability of developing technically complex products and its successful acquisitions & integration of Taro Pharma. Of late the unique opportunity of Doxil (led by supply issues at the sole supplier J&J) and Doxycycline (led by supply issues at competitors resulting in over 10x price jump) coupled with multiple price hike taken by Taro Pharma for various product have overpowered the H1FY14US sales to $803mn, up by 52%. Expect a modest US growth in FY15 While we expect Sun’s base US sales to maintain a steady annual growth ~12% over FY13‐15 led by its strong US ANDA pipeline, its overall US revenue is expected to report a modest 7% growth led by rising concern of price competition in Doxycycline and Taro’s derma products in US. However, we believe the Doxil revenue from US remain stable in foreseeable future. Our estimate for Sun’s US sales stands at $ 1573mn and $1677mn for FY14E and FY15E, respectively. Strategic chronic therapy focus to drive domestic formulation growth Being a leader in chronic segments, Sun Pharma delivered a compounded annual growth of 15% over last five years in its domestic formulations business to Rs 29.65bn (26% of total sales) in FY13. Going ahead, we expect Sun to outpace industry growth and deliver 22% CAGR over FY13‐15 led by its continued focus on chronic therapeutics (57% of domestic sales), one of the most productive field force and new product launches. High base effect to mar FY15 earnings growth… With the multiple earnings surprises in terms of 1) enhanced opportunity in Doxil due to supply issue at J&J, 2) continued pricing power at Taro and 3) strong Doxycycline sales despite fresh supply by Mylan, we estimate strong 45% and 76% growth in FY14 Sales and earnings, respectively. However, the likely rise in competition for Doxil & Taro product basket and lack of any big ticket exclusivity would result in margin contraction (by 180bps to 42.2%) in FY15 upon a modest sales growth of 9% resulting in flat net earnings. … Yet financial health to remain robust Despite tapering earnings growth in FY15, we estimate Sun to generate free cash flow of Rs 63bn over FY13‐15E. That coupled with the cash balance of Rs 64bn in FY13 is expected to keep the financial health of the company robust and provides strong warchest for inorganic growth. Earning surprises stretched valuations; Initiate Neutral with Target Price of Rs 605 We value Sun Pharma at 24x (maintaining 20% premium to its peers) March 2015e EPS of Rs 25.1 to arrive at our target price of Rs 605 (implying a no meaningful upside from CMP). Hence, we initiate coverage on Sun Pharma with a ‘Neutral’ rating and a target price of Rs 605/share.
NEUTRAL SUNP IN | CMP RS 573
TARGET RS 605 (+6%) Company Data
O/S SHARES (MN) : 2071MARKET CAP (RSBN) : 1187MARKET CAP (USDBN) : 1952 ‐ WK HI/LO (RS) : 650 / 347LIQUIDITY 3M (USDMN) : 18.3FACE VALUE (RS) : 1
Share Holding Pattern, %
PROMOTERS : 63.7FII / NRI : 22.9FI / MF : 3.2NON PROMOTER CORP. HOLDINGS : 4.9PUBLIC & OTHERS : 5.4
Price Performance, % 1mth 3mth 1yr
ABS ‐6.1 10.9 64.7REL TO BSE ‐4.7 1.0 54.6
Price Vs. Sensex (Rebased values)
0
100
200
300
400
Apr‐10 Jun‐11 Aug‐12 Oct‐13
Sun Pharma BSE Sensex
Source: Bloomberg, Phillip Capital Research
Other Key Ratios
Rs mn FY13 FY14E FY15E
Net Sales 112,389 159,192 177,877EBIDTA 50,402 70,308 75,317Net Profit 36,337 50,831 52,050EPS, Rs 17.5 24.5 25.1PER, x 32.7 23.3 22.8EV/EBIDTA, x 11.0 16.2 14.7P/BV, x 7.9 6.1 5.0ROE, % 23.8 26.3 22.0Debt/Equity (%) 1.7 17.9 14.3Source: Phillip Capital India Research Surya Patra (+ 9122 6667 9768) [email protected]
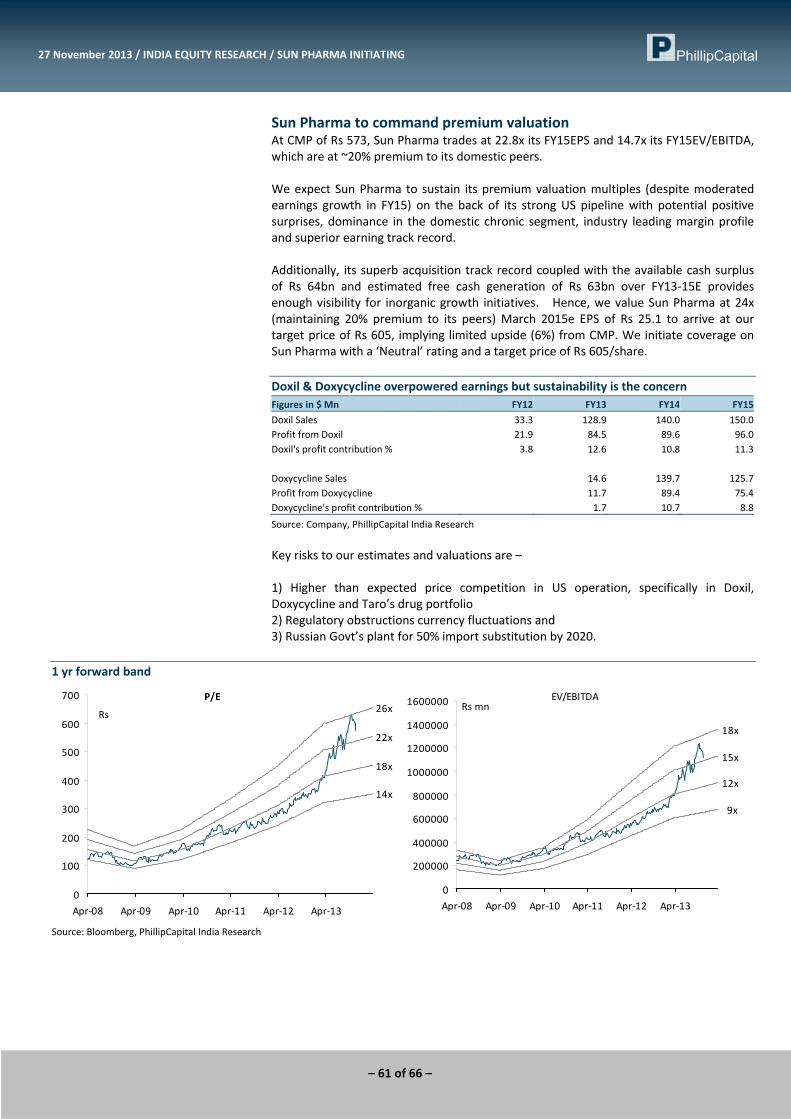
– 61 of 66 –
27 November 2013 / INDIA EQUITY RESEARCH / SUN PHARMA INITIATING
Sun Pharma to command premium valuation At CMP of Rs 573, Sun Pharma trades at 22.8x its FY15EPS and 14.7x its FY15EV/EBITDA, which are at ~20% premium to its domestic peers. We expect Sun Pharma to sustain its premium valuation multiples (despite moderated earnings growth in FY15) on the back of its strong US pipeline with potential positive surprises, dominance in the domestic chronic segment, industry leading margin profile and superior earning track record. Additionally, its superb acquisition track record coupled with the available cash surplus of Rs 64bn and estimated free cash generation of Rs 63bn over FY13‐15E provides enough visibility for inorganic growth initiatives. Hence, we value Sun Pharma at 24x (maintaining 20% premium to its peers) March 2015e EPS of Rs 25.1 to arrive at our target price of Rs 605, implying limited upside (6%) from CMP. We initiate coverage on Sun Pharma with a ‘Neutral’ rating and a target price of Rs 605/share. Doxil & Doxycycline overpowered earnings but sustainability is the concern Figures in $ Mn FY12 FY13 FY14 FY15
Doxil Sales 33.3 128.9 140.0 150.0Profit from Doxil 21.9 84.5 89.6 96.0Doxil's profit contribution % 3.8 12.6 10.8 11.3 Doxycycline Sales 14.6 139.7 125.7Profit from Doxycycline 11.7 89.4 75.4Doxycycline's profit contribution % 1.7 10.7 8.8
Source: Company, PhillipCapital India Research
Key risks to our estimates and valuations are – 1) Higher than expected price competition in US operation, specifically in Doxil, Doxycycline and Taro’s drug portfolio 2) Regulatory obstructions currency fluctuations and 3) Russian Govt’s plant for 50% import substitution by 2020.
1 yr forward band
P/E
14x
18x
22x
26x
0
100
200
300
400
500
600
700
Apr‐08 Apr‐09 Apr‐10 Apr‐11 Apr‐12 Apr‐13
Rs
EV/EBITDA
9x
12x
15x
18x
0
200000
400000
600000
800000
1000000
1200000
1400000
1600000
Apr‐08 Apr‐09 Apr‐10 Apr‐11 Apr‐12 Apr‐13
Rs mn
Source: Bloomberg, PhillipCapital India Research

– 62 of 66 –
27 November 2013 / INDIA EQUITY RESEARCH / SUN PHARMA INITIATING
Inorganic move coupled with unique opportunity of Doxil & Doxycycline overpowered US performance
337 234 320 269494 557 621
175457
588617
64818
6575
33
338334
0
200
400
600
800
1000
1200
1400
1600
1800
FY09 FY10 FY11 FY12 FY13 FY14e FY15e
US$
mn
Sun's own US sales Taro's US salesDUSA US sales URL's US sales
35% CAGR
337 234495
692989
1298 1402
00
0
33
129
140150
00
0
0
15
140126
0
200
400
600
800
1000
1200
1400
1600
1800
FY09 FY10 FY11 FY12 FY13 FY14e FY15e
US$
mn
5
7
9
11
13
15
17
19
Doxicycline salesDoxil SalesOther US Sales Share of Doxil & Doxycycline in Over US sales %
Source: Company, PhillipCapital India Research
Strong product pipeline for US generics Potential Generics Mkt Size
(US $mn) Likely Launch Remarks
Duloxetine Hcl(Cymbalta) 3200.0 11‐Dec‐13 multiple filling >10, Shared FTF with several players Nexium IV 45.4 1‐Jan‐14 Settled with AstraZencea Temozolomide(Temodar) 425.0 12‐Feb‐14 Limited Competition.. launch after teva's 180days exclusivity in 12th Mar 2014 Niacin(Niaspan) 1120.0 16‐Mar‐14 Competative launch after teva's 180days exclusivity in 16th Mar 2014 Paricalcitol(Zemplar) 115.0 30‐Mar‐14 Limited Competition.. launch after teva's 180days exclusivity in 30th Mar 2014 Esomeprazole magnesium(Nexium) 2272.0 27‐May‐14 Dr Reddy and Teva settled to launch on on 27 May 2014 Eszopiclone(Lunesta) 800.0 30‐May‐14 multiple settlement by glenmark, sun…Sun n Mylan has already got FA risedronate sodium(Actonel) 1030.0 10‐Dec‐14 Competative launch after teva's 180days exclusivity in Dec 2014 Memantine (Namenda) 1750.0 11‐Jan‐15 Settled with Amneal, Watson, Dr. Reddy's, Lupin, Mylan, Orchid, Sun, Teva, Upsher‐Smith,
and Wockhardt Aripiprazole(Abilify) 3900.0 20‐Oct‐15 Competative launch after teva's 180days exclusivity rosuvastatin calcium(Crestor) 3500.0 1‐Jan‐16 competative launch Imatinib mesylate(Gleevec) 1698.0 Jul‐15 Sun is the FTF n already have TA Atomoxetine(Strattera) 580.0 May‐17 Sun has FTF with multiple players‐ all have approvals from FDA Ambien CR (Coreg CR) 233.0 Dec‐15 URL is ftf n limited to 3(Lupin n Anchen),
Source: Bloomberg, Company, PhillipCapital India Research
Revenue Matrix of Sun Pharma (Rs mn) FY10 FY11 FY12 FY13 FY14e FY15e
Sun's Own US sales 10750 14581 12862 26836 34003 37852Taro's US sales 7957 21854 31956 37652 39534DUSA US sales 977 3988 4586URL's US sales 1769 20598 20350Gross US sales 10750 22538 34716 61537 96240 102322% YoY growth ‐28.4 103.7 54.0 77.3 56.4 6.3% of total sales 27.0 38.8 42.8 53.9 59.9 56.9
Domestic formulations 19333 23801 29154 29657 34995 42694% YoY growth ‐6.4 23.1 22.5 1.7 18.0 22.0% of total sales 48.6 41.0 35.9 26.0 21.8 23.8
Sun's own ROW sales 4885 4455 6962 10753 14601 18251Taro's ROW sales 0 1989 4163 4518 5678 6529ROW sales 4885 6444 11124 15271 20278 24780% YoY growth 28.7 31.9 72.6 37.3 32.8 22.2% of total sales 12.3 11.1 13.7 13.4 12.6 13.8
Total Formulations 34968 52783 74995 106465 151514 169797APIs & Other 4848 5282 6178 7622 9218 9958
Total Sales 39816 58066 81173 114087 160732 179755% YoY growth 45.8 39.8 40.5 40.9 11.8
Source: Company, PhillipCapital India Research
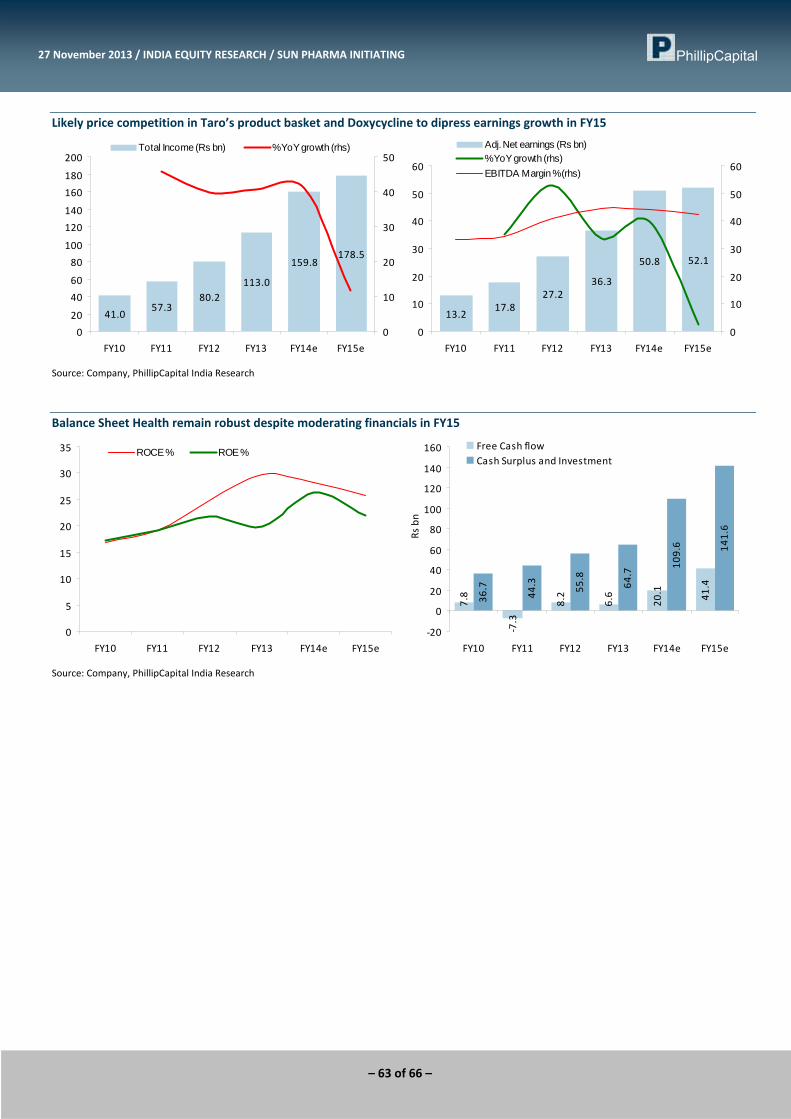
– 63 of 66 –
27 November 2013 / INDIA EQUITY RESEARCH / SUN PHARMA INITIATING
Likely price competition in Taro’s product basket and Doxycycline to dipress earnings growth in FY15
41.057.3
80.2113.0
159.8178.5
0
20
40
60
80
100
120
140
160
180
200
FY10 FY11 FY12 FY13 FY14e FY15e
0
10
20
30
40
50Total Income (Rs bn) % YoY growth (rhs)
13.217.8
27.236.3
50.8 52.1
0
10
20
30
40
50
60
FY10 FY11 FY12 FY13 FY14e FY15e
0
10
20
30
40
50
60
Adj. Net earnings (Rs bn)% YoY growth (rhs)EBITDA Margin % (rhs)
Source: Company, PhillipCapital India Research
Balance Sheet Health remain robust despite moderating financials in FY15
0
5
10
15
20
25
30
35
FY10 FY11 FY12 FY13 FY14e FY15e
ROCE % ROE %
7.8
‐7.3
8.2
6.6
20.1 41.4
36.7
44.3 55.8
64.7
109.6 141.6
‐20
0
20
40
60
80
100
120
140
160
FY10 FY11 FY12 FY13 FY14e FY15e
Rs bn
Free Cash flowCash Surplus and Investment
Source: Company, PhillipCapital India Research
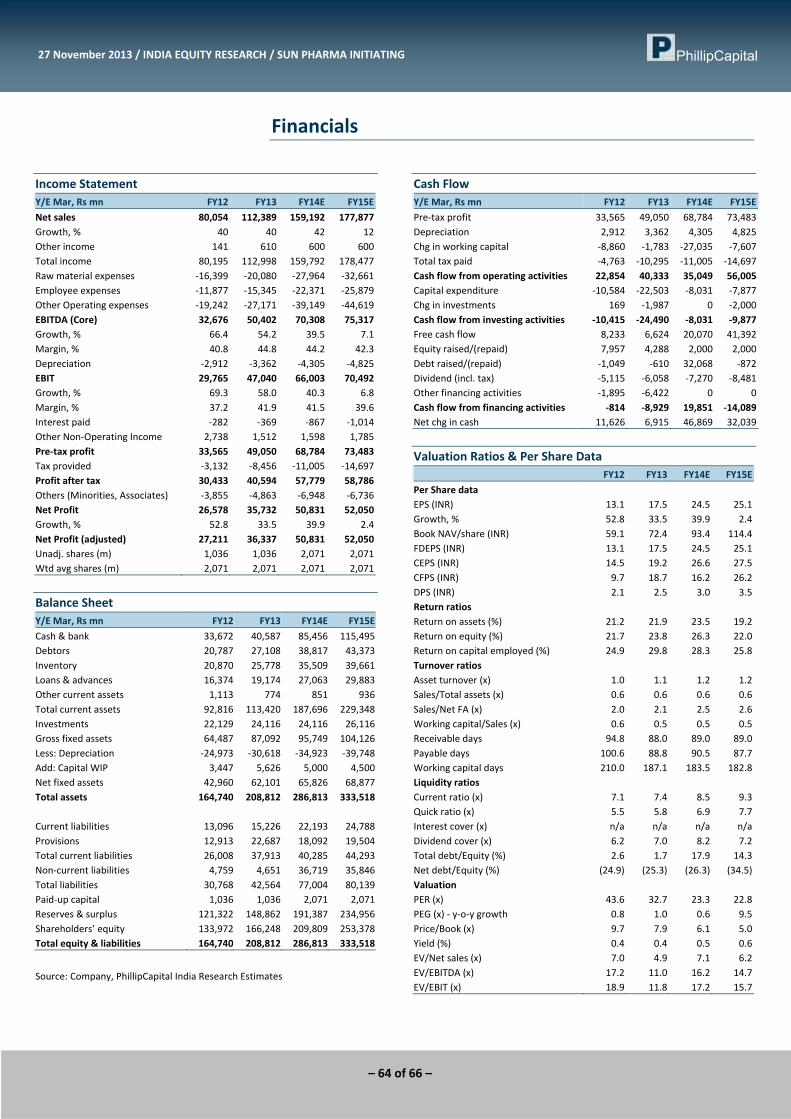
– 64 of 66 –
27 November 2013 / INDIA EQUITY RESEARCH / SUN PHARMA INITIATING
Financials
Income Statement Y/E Mar, Rs mn FY12 FY13 FY14E FY15E
Net sales 80,054 112,389 159,192 177,877Growth, % 40 40 42 12Other income 141 610 600 600Total income 80,195 112,998 159,792 178,477Raw material expenses ‐16,399 ‐20,080 ‐27,964 ‐32,661Employee expenses ‐11,877 ‐15,345 ‐22,371 ‐25,879Other Operating expenses ‐19,242 ‐27,171 ‐39,149 ‐44,619EBITDA (Core) 32,676 50,402 70,308 75,317Growth, % 66.4 54.2 39.5 7.1Margin, % 40.8 44.8 44.2 42.3Depreciation ‐2,912 ‐3,362 ‐4,305 ‐4,825EBIT 29,765 47,040 66,003 70,492Growth, % 69.3 58.0 40.3 6.8Margin, % 37.2 41.9 41.5 39.6Interest paid ‐282 ‐369 ‐867 ‐1,014Other Non‐Operating Income 2,738 1,512 1,598 1,785Pre‐tax profit 33,565 49,050 68,784 73,483Tax provided ‐3,132 ‐8,456 ‐11,005 ‐14,697Profit after tax 30,433 40,594 57,779 58,786Others (Minorities, Associates) ‐3,855 ‐4,863 ‐6,948 ‐6,736Net Profit 26,578 35,732 50,831 52,050Growth, % 52.8 33.5 39.9 2.4Net Profit (adjusted) 27,211 36,337 50,831 52,050Unadj. shares (m) 1,036 1,036 2,071 2,071Wtd avg shares (m) 2,071 2,071 2,071 2,071
Balance Sheet Y/E Mar, Rs mn FY12 FY13 FY14E FY15E
Cash & bank 33,672 40,587 85,456 115,495Debtors 20,787 27,108 38,817 43,373Inventory 20,870 25,778 35,509 39,661Loans & advances 16,374 19,174 27,063 29,883Other current assets 1,113 774 851 936Total current assets 92,816 113,420 187,696 229,348Investments 22,129 24,116 24,116 26,116Gross fixed assets 64,487 87,092 95,749 104,126Less: Depreciation ‐24,973 ‐30,618 ‐34,923 ‐39,748Add: Capital WIP 3,447 5,626 5,000 4,500Net fixed assets 42,960 62,101 65,826 68,877Total assets 164,740 208,812 286,813 333,518 Current liabilities 13,096 15,226 22,193 24,788Provisions 12,913 22,687 18,092 19,504Total current liabilities 26,008 37,913 40,285 44,293Non‐current liabilities 4,759 4,651 36,719 35,846Total liabilities 30,768 42,564 77,004 80,139Paid‐up capital 1,036 1,036 2,071 2,071Reserves & surplus 121,322 148,862 191,387 234,956Shareholders’ equity 133,972 166,248 209,809 253,378Total equity & liabilities 164,740 208,812 286,813 333,518
Source: Company, PhillipCapital India Research Estimates
Cash Flow Y/E Mar, Rs mn FY12 FY13 FY14E FY15E
Pre‐tax profit 33,565 49,050 68,784 73,483Depreciation 2,912 3,362 4,305 4,825Chg in working capital ‐8,860 ‐1,783 ‐27,035 ‐7,607Total tax paid ‐4,763 ‐10,295 ‐11,005 ‐14,697Cash flow from operating activities 22,854 40,333 35,049 56,005Capital expenditure ‐10,584 ‐22,503 ‐8,031 ‐7,877Chg in investments 169 ‐1,987 0 ‐2,000Cash flow from investing activities ‐10,415 ‐24,490 ‐8,031 ‐9,877Free cash flow 8,233 6,624 20,070 41,392Equity raised/(repaid) 7,957 4,288 2,000 2,000Debt raised/(repaid) ‐1,049 ‐610 32,068 ‐872Dividend (incl. tax) ‐5,115 ‐6,058 ‐7,270 ‐8,481Other financing activities ‐1,895 ‐6,422 0 0Cash flow from financing activities ‐814 ‐8,929 19,851 ‐14,089Net chg in cash 11,626 6,915 46,869 32,039
Valuation Ratios & Per Share Data FY12 FY13 FY14E FY15E
Per Share data EPS (INR) 13.1 17.5 24.5 25.1Growth, % 52.8 33.5 39.9 2.4Book NAV/share (INR) 59.1 72.4 93.4 114.4FDEPS (INR) 13.1 17.5 24.5 25.1CEPS (INR) 14.5 19.2 26.6 27.5CFPS (INR) 9.7 18.7 16.2 26.2DPS (INR) 2.1 2.5 3.0 3.5Return ratios Return on assets (%) 21.2 21.9 23.5 19.2Return on equity (%) 21.7 23.8 26.3 22.0Return on capital employed (%) 24.9 29.8 28.3 25.8Turnover ratios Asset turnover (x) 1.0 1.1 1.2 1.2Sales/Total assets (x) 0.6 0.6 0.6 0.6Sales/Net FA (x) 2.0 2.1 2.5 2.6Working capital/Sales (x) 0.6 0.5 0.5 0.5Receivable days 94.8 88.0 89.0 89.0Payable days 100.6 88.8 90.5 87.7Working capital days 210.0 187.1 183.5 182.8Liquidity ratios Current ratio (x) 7.1 7.4 8.5 9.3Quick ratio (x) 5.5 5.8 6.9 7.7Interest cover (x) n/a n/a n/a n/aDividend cover (x) 6.2 7.0 8.2 7.2Total debt/Equity (%) 2.6 1.7 17.9 14.3Net debt/Equity (%) (24.9) (25.3) (26.3) (34.5)Valuation PER (x) 43.6 32.7 23.3 22.8PEG (x) ‐ y‐o‐y growth 0.8 1.0 0.6 9.5Price/Book (x) 9.7 7.9 6.1 5.0Yield (%) 0.4 0.4 0.5 0.6EV/Net sales (x) 7.0 4.9 7.1 6.2EV/EBITDA (x) 17.2 11.0 16.2 14.7EV/EBIT (x) 18.9 11.8 17.2 15.7
– 65 of 66 –
27 November 2013 / INDIA EQUITY RESEARCH / PHARMACEUTICALS SECTOR
Management (91 22) 2300 2999(91 22) 6667 9735
Research
Deepak Jain (9122) 6667 9758 Ankur Sharma (9122) 6667 9759 Surya Patra (9122) 6667 9768Priya Ranjan (9122) 6667 9965 Aditya Bahety (9122) 6667 9986
Infrastructure & IT Services Abhishek Ranganathan, CFA (9122) 6667 9952Manish Agarwalla (9122) 6667 9962 Vibhor Singhal (9122) 6667 9949 Neha Garg (9122) 6667 9996Sachit Motwani, CFA, FRM (9122) 6667 9953 Varun Vijayan (9122) 6667 9992
Metals Shikha Khurana (9122) 6667 9948Naveen Kulkarni, CFA, FRM (9122) 6667 9947 Dhawal Doshi (9122) 6667 9769Ennette Fernandes (9122) 6667 9764 Dharmesh Shah (9122) 6667 9974Vivekanand Subbaraman (9122) 6667 9766 Vishal Randive (9122) 6667 9944
Oil&Gas, Agri InputsGauri Anand (9122) 6667 9943
Vaibhav Agarwal (9122) 6667 9967 Deepak Pareek (9122) 6667 9950 Rosie Ferns (9122) 6667 9971Saurabh Rathi (9122) 6667 9951
Anjali Verma (9122) 6667 9969
Sales & Distribution Kinshuk Tiwari (9122) 6667 9946 Sales Trader ExecutionAshvin Patil (9122) 6667 9991 Dilesh Doshi (9122) 6667 9747 Mayur Shah (9122) 6667 9945Shubhangi Agrawal (9122) 6667 9964 Suniil Pandit (9122) 6667 9745Kishor Binwal (9122) 6667 9989Sidharth Agrawal (9122) 6667 9934Dipesh Sohani (9122) 6667 9756
Vineet Bhatnagar (Managing Director)Jignesh Shah (Head – Equity Derivatives)
Automobiles
Banking, NBFCs
Consumer, Media, Telecom
Cement
Economics
Engineering, Capital Goods
Sr. Manager – Equities Support
Pharma
Retail, Real Estate
Quant
Database Manager
Contact Information (Regional Member Companies)
SINGAPORE
Phillip Securities Pte Ltd 250 North Bridge Road, #06‐00 Raffles City Tower,
Singapore 179101 Tel : (65) 6533 6001 Fax: (65) 6535 3834
www.phillip.com.sg
MALAYSIA Phillip Capital Management Sdn Bhd B‐3‐6 Block B Level 3, Megan Avenue II,
No. 12, Jalan Yap Kwan Seng, 50450 Kuala Lumpur Tel (60) 3 2162 8841 Fax (60) 3 2166 5099
www.poems.com.my
HONG KONG Phillip Securities (HK) Ltd
11/F United Centre 95 Queensway Hong Kong Tel (852) 2277 6600 Fax: (852) 2868 5307
www.phillip.com.hk
JAPAN Phillip Securities Japan, Ltd
4‐2 Nihonbashi Kabutocho, Chuo‐ku Tokyo 103‐0026
Tel: (81) 3 3666 2101 Fax: (81) 3 3664 0141 www.phillip.co.jp
INDONESIA PT Phillip Securities Indonesia
ANZ Tower Level 23B, Jl Jend Sudirman Kav 33A, Jakarta 10220, Indonesia
Tel (62) 21 5790 0800 Fax: (62) 21 5790 0809 www.phillip.co.id
CHINA Phillip Financial Advisory (Shanghai) Co. Ltd.
No 550 Yan An East Road, Ocean Tower Unit 2318 Shanghai 200 001
Tel (86) 21 5169 9200 Fax: (86) 21 6351 2940 www.phillip.com.cn
THAILAND Phillip Securities (Thailand) Public Co. Ltd.
15th Floor, Vorawat Building, 849 Silom Road, Silom, Bangrak, Bangkok 10500 Thailand
Tel (66) 2 2268 0999 Fax: (66) 2 2268 0921 www.phillip.co.th
FRANCE King & Shaxson Capital Ltd.
3rd Floor, 35 Rue de la Bienfaisance 75008 Paris France
Tel (33) 1 4563 3100 Fax : (33) 1 4563 6017 www.kingandshaxson.com
UNITED KINGDOM King & Shaxson Ltd.
6th Floor, Candlewick House, 120 Cannon Street London, EC4N 6AS
Tel (44) 20 7929 5300 Fax: (44) 20 7283 6835 www.kingandshaxson.com
UNITED STATES Phillip Futures Inc.
141 W Jackson Blvd Ste 3050 The Chicago Board of Trade Building
Chicago, IL 60604 USA Tel (1) 312 356 9000 Fax: (1) 312 356 9005
AUSTRALIA PhillipCapital Australia
Level 37, 530 Collins Street Melbourne, Victoria 3000, Australia
Tel: (61) 3 9629 8380 Fax: (61) 3 9614 8309 www.phillipcapital.com.au
SRI LANKA Asha Phillip Securities Limited
Level 4, Millennium House, 46/58 Navam Mawatha, Colombo 2, Sri Lanka
Tel: (94) 11 2429 100 Fax: (94) 11 2429 199 www.ashaphillip.net/home.htm
INDIA PhillipCapital (India) Private Limited
No. 1, C‐Block, 2nd Floor, Modern Center , Jacob Circle, K. K. Marg, Mahalaxmi Mumbai 400011 Tel: (9122) 2300 2999 Fax: (9122) 6667 9955 www.phillipcapital.in
– 66 of 66 –
27 November 2013 / INDIA EQUITY RESEARCH / PHARMACEUTICALS SECTOR
Disclosures and Disclaimers PhillipCapital (India) Pvt. Ltd. has three independent equity research groups: Institutional Equities, Institutional Equity Derivatives and Private Client Group. This report has been prepared by Institutional Equities Group. The views and opinions expressed in this document may or may not match or may be contrary at times with the views, estimates, rating, target price of the other equity research groups of PhillipCapital (India) Pvt. Ltd. This report is issued by PhillipCapital (India) Pvt. Ltd. which is regulated by SEBI. PhillipCapital (India) Pvt. Ltd. is a subsidiary of Phillip (Mauritius) Pvt. Ltd. References to "PCIPL" in this report shall mean PhillipCapital (India) Pvt. Ltd unless otherwise stated. This report is prepared and distributed by PCIPL for information purposes only and neither the information contained herein nor any opinion expressed should be construed or deemed to be construed as solicitation or as offering advice for the purposes of the purchase or sale of any security, investment or derivatives. The information and opinions contained in the Report were considered by PCIPL to be valid when published. The report also contains information provided to PCIPL by third parties. The source of such information will usually be disclosed in the report. Whilst PCIPL has taken all reasonable steps to ensure that this information is correct, PCIPL does not offer any warranty as to the accuracy or completeness of such information. Any person placing reliance on the report to undertake trading does so entirely at his or her own risk and PCIPL does not accept any liability as a result. Securities and Derivatives markets may be subject to rapid and unexpected price movements and past performance is not necessarily an indication to future performance. This report does not have regard to the specific investment objectives, financial situation and the particular needs of any specific person who may receive this report. Investors must undertake independent analysis with their own legal, tax and financial advisors and reach their own regarding the appropriateness of investing in any securities or investment strategies discussed or recommended in this report and should understand that statements regarding future prospects may not be realized. In no circumstances it be used or considered as an offer to sell or a solicitation of any offer to buy or sell the Securities mentioned in it. The information contained in the research reports may have been taken from trade and statistical services and other sources, which we believe are reliable. PhillipCapital (India) Pvt. Ltd. or any of its group/associate/affiliate companies do not guarantee that such information is accurate or complete and it should not be relied upon as such. Any opinions expressed reflect judgments at this date and are subject to change without notice Important: These disclosures and disclaimers must be read in conjunction with the research report of which it forms part. Receipt and use of the research report is subject to all aspects of these disclosures and disclaimers. Additional information about the issuers and securities discussed in this research report is available on request. Certifications: The research analyst(s) who prepared this research report hereby certifies that the views expressed in this research report accurately reflect the research analyst’s personal views about all of the subject issuers and/or securities, that the analyst have no known conflict of interest and no part of the research analyst’s compensation was, is or will be, directly or indirectly, related to the specific views or recommendations contained in this research report. The Research Analyst certifies that he /she or his / her family members does not own the stock(s) covered in this research report. Independence: PhillipCapital (India) Pvt. Ltd. has not had an investment banking relationship with, and has not received any compensation for investment banking services from, the subject issuers in the past twelve (12) months, and PhillipCapital (India) Pvt. Ltd does not anticipate receiving or intend to seek compensation for investment banking services from the subject issuers in the next three (3) months. PhillipCapital (India) Pvt. Ltd is not a market maker in the securities mentioned in this research report, although it or its affiliates may hold either long or short positions in such securities. PhillipCapital (India) Pvt. Ltd does not hold more than 1% of the shares of the company(ies) covered in this report. Suitability and Risks: This research report is for informational purposes only and is not tailored to the specific investment objectives, financial situation or particular requirements of any individual recipient hereof. Certain securities may give rise to substantial risks and may not be suitable for certain investors. Each investor must make its own determination as to the appropriateness of any securities referred to in this research report based upon the legal, tax and accounting considerations applicable to such investor and its own investment objectives or strategy, its financial situation and its investing experience. The value of any security may be positively or adversely affected by changes in foreign exchange or interest rates, as well as by other financial, economic or political factors. Past performance is not necessarily indicative of future performance or results. Sources, Completeness and Accuracy: The material herein is based upon information obtained from sources that PCIPL and the research analyst believe to be reliable, but neither PCIPL nor the research analyst represents or guarantees that the information contained herein is accurate or complete and it should not be relied upon as such. Opinions expressed herein are current opinions as of the date appearing on this material and are subject to change without notice. Furthermore, PCIPL is under no obligation to update or keep the information current. Copyright: The copyright in this research report belongs exclusively to PCIPL. All rights are reserved. Any unauthorized use or disclosure is prohibited. No reprinting or reproduction, in whole or in part, is permitted without the PCIPL’s prior consent, except that a recipient may reprint it for internal circulation only and only if it is reprinted in its entirety. Caution: Risk of loss in trading in can be substantial. You should carefully consider whether trading is appropriate for you in light of your experience, objectives, financial resources and other relevant circumstances. For U.S. persons only: This research report is a product of PhillipCapital (India) Pvt Ltd. which is the employer of the research analyst(s) who has prepared the research report. The research analyst(s) preparing the research report is/are resident outside the United States (U.S.) and are not associated persons of any U.S. regulated broker‐dealer and therefore the analyst(s) is/are not subject to supervision by a U.S. broker‐dealer, and is/are not required to satisfy the regulatory licensing requirements of FINRA or required to otherwise comply with U.S. rules or regulations regarding, among other things, communications with a subject company, public appearances and trading securities held by a research analyst account. This report is intended for distribution by PhillipCapital (India) Pvt Ltd. only to "Major Institutional Investors" as defined by Rule 15a‐6(b)(4) of the U.S. Securities andExchange Act, 1934 (the Exchange Act) and interpretations thereof by U.S. Securities and Exchange Commission (SEC) in reliance on Rule 15a 6(a)(2). If the recipient of this report is not a Major Institutional Investor as specified above, then it should not act upon this report and return the same to the sender. Further, this report may not be copied, duplicated and/or transmitted onward to any U.S. person, which is not the Major Institutional Investor. In reliance on the exemption from registration provided by Rule 15a‐6 of the Exchange Act and interpretations thereof by the SEC in order to conduct certain business with Major Institutional Investors, PhillipCapital (India) Pvt Ltd. has entered into an agreement with a U.S. registered broker‐dealer, Marco Polo Securities Inc. ("Marco Polo").Transactions in securities discussed in this research report should be effected through Marco Polo or another U.S. registered broker dealer PhillipCapital (India) Pvt. Ltd. Registered office: 2nd Floor, C‐Block, Modern Centre, Mahalaxmi, Mumbai – 400011