Embed Size (px)
Citation preview
Pharmacological and biochemicalinvestigations of methanolic extract of
Myristica fragrans seeds
A dissertation submitted to the Department of Clinical Pharmacy and Pharmacology,Faculty of Pharmacy, University of Dhaka, for the partial fulfillment of the requirements
for M. Phil. degree
Submitted By
Examination Roll: 02Registration No.: 275
Session: 2011 – 12
Department of Clinical Pharmacy and PharmacologyUniversity of Dhaka
Dhaka University Institutional Repository
Declaration
Not any portion of this thesis paper entitled “Pharmacological and biochemicalinvestigations of methanolic extract of Myristica fragrans seeds” has been submitted foranother degree or qualification of University of Dhaka.
Researcher
Md. Shaiful Alam BhuiyanExamination Roll: 02Registration No.: 275Session: 2011 – 12Department of Clinical Pharmacy and PharmacologyUniversity of Dhaka
Supervisor
Professor Dr. Md. Saiful IslamDepartment of Clinical Pharmacy and PharmacologyFaculty of PharmacyUniversity of Dhaka
Dhaka University Institutional Repository
Acknowledgements
First of all, I would like to express my heartiest gratitude to almighty for enabling me to
complete this wonderful thesis work that is helpful as well as time demanding in many
aspects of Clinical Pharmacy and Pharmacology.
I want to express my gratitude to erudite supervisor, Professor Dr. Md. Saiful Islam,
Department of Clinical Pharmacy and Pharmacology, Faculty of Pharmacy, University of
Dhaka, for his excellent supervision, constant encouragement, sympathetic co-operation as
well as enthusiastic guidance at all stages of this thesis work.
I am very much grateful to previous chairman Professor Bilkis Begum, Department of
Clinical Pharmacy and Pharmacology, Faculty of Pharmacy, University of Dhaka, for
permitting me all the facilities to carry out the research work.
I am also grateful to Professor Dr. Mohammad Mehedi Masud, Chairman, Department
of Pharmaceutical Chemistry, Faculty of Pharmacy, University of Dhaka, for permitting
me to continue my lab work in pharmacognosy lab.
I am profoundly indebted to Md. Zobaer Al-Mahmud, Assistant Professor and Amlan
Ganguly, Lecturer, Department of Clinical Pharmacy and Pharmacology, Faculty of
Pharmacy, University of Dhaka, who had been guiding me for reaching the goal. They
helped me time to time with valuable advice and proper guidelines.
I am also very much grateful to the Institution of Nutrition and Food Science, University
of Dhaka, for giving me the permission of using animal facility of the institution.
I wish to convey my thanks and heartiest regards to the university and Faculty authorities
and entire laboratory attendants for providing me full support during my thesis work.
I am also grateful to my parents for their care, support and encouragement. My special
heartfelt thanks extend to Md. Mamunur Rashid, Md. Salehuddin Ayubee and Farhana
Akhter for their co-operations and occasional helps during the course of my research.
Dhaka University Institutional Repository
Abstract
The methanolic extract of Myristicafragransseeds and fractions of petroleum ether,
n-hexane and chloroform screened for phytochemical analysis and revealed the presence of
alkaloids, flavonoids, carbohydrates, glycosides, proteins and tannins. Methanolic extract
and fractions hadinvestigated for its antioxidant, cytotoxic and anti-microbialproperties.
Myristicafragrans had remarkable antioxidant property, where IC50 value of chloroform
fraction was 16.879 µg/ml. In the cytotoxic assay,they tested for brine shrimp lethality
bioassay using brine shrimp nauplii and LC50 value of petroleum ether fraction was 0.098
µg/ml. Theantimicrobial screening was done against 16 microorganisms including gram-
positive, gramnegative bacteria and fungi by the disc diffusion method. The chloroform
fraction showed little antimicrobial activity with average zone of inhibition 9.5 mm at a
concentration of 400μg/disc.Methanolic extract and fractions of Myristicafragransseeds
also investigated for peripheral analgesic, anti-hyperglycaemic and anti-diarrhoeal activities
on swiss albino mice and anti-inflammatory and anti-pyretic activities on long evans rats at
doses of 200 and 400 mg/kg/p.o.The methanolic extract showed significant anti-
inflammatory, peripheral analgesic and anti-pyreticactivitiesin carrageenan induced paw
edema, intraperitoneallyacetic acid injected writhingand subcutaneously brewer yeast
injectedpyrexia models respectivelywhen compared to the control. The results were found
comparable to those of diclofenac sodium and paracetamol respectively, reference drugs
used in the study. In the streptozotocin induced diabetic model, chloroform fraction showed
significant anti-diabetic effect characterized by reduction of blood sugar when compared to
the control. The results were comparable to those of glibenclamide, a reference drug used in
the study. In the castor oilswalloweddiarrhoeal model, the n-hexane fraction showed
significant anti-diarrhoeal effect characterized by reduction in the number of faeces when
compared to the control. The results were comparable to those of loperamideHCl, a
reference drug used in the study.
Dhaka University Institutional Repository
Pharmacological and biochemical investigations of methanolic extract ofMyristicafragrans seeds
Researcher:Muhammad ShaifulAlamBhuiyanExamination Roll: 02Registration No.: 275Session: 2011 – 12Department of Clinical Pharmacy and PharmacologyUniversity of Dhaka.
Abstract
The methanolic extract of Myristicafragransseeds and fractions of petroleum ether, n-
hexane and chloroform screened for phytochemical analysis and revealed the presence of
alkaloids, flavonoids, carbohydrates, glycosides, proteins and tannins. Methanolic extract
and fractions had investigated for its antioxidant, cytotoxic and anti-microbial properties.
Myristicafragrans had remarkable antioxidant property, where IC50 value of chloroform
fraction was 16.879 µg/ml. In the cytotoxic assay,they tested for brine shrimp lethality
bioassay using brine shrimp nauplii and LC50 value of petroleum ether fraction was 0.098
µg/ml. The antimicrobial screening was done against 16 microorganisms including gram-
positive, gram negative bacteria and fungi by the disc diffusion method. The chloroform
fraction showed little antimicrobial activity with average zone of inhibition 9.5 mm at a
concentration of 400 μg/disc.Methanolic extract and fractions of Myristicafragrans seeds
also investigated for peripheral analgesic, anti-hyperglycaemic and anti-diarrhoeal activities
on swiss albino mice and anti-inflammatory and anti-pyretic activities on long evans rats at
doses of 200 and 400 mg/kg/p.o. The methanolic extract showed significant anti-
inflammatory, peripheral analgesic and anti-pyreticactivitiesin carrageenan induced paw
edema, intraperitoneally acetic acid injected writhingand subcutaneously brewer yeast
injectedpyrexia models respectively when compared to the control. The results were found
comparable to those of diclofenac sodium and paracetamol respectively, reference drugs
used in the study. In the streptozotocin induced diabetic model, chloroform fraction showed
significant anti-diabetic effect characterized by reduction of blood sugar when compared to
the control. The results were comparable to those of glibenclamide, a reference drug used in
the study. In the castor oil swallowed diarrhoeal model, the n-hexane fraction showed
significant anti-diarrhoeal effect characterized by reduction in the number of faeces when
compared to the control. The results were comparable to those of loperamideHCl, a
reference drug used in the study.
Dhaka University Institutional Repository
Page | I
Contents
Chapter Topics Page No.
Chapter 1
1.1
1.2
1.3
1.4
1.5
1.5.1
1.5.2
Introduction
History of medicinal plants
Contribution of the medicinal plants in modern medicine
Prospect of herbal drug research in Bangladesh
Role of herbs in modern human society
The study protocol
Chemical investigation
Pharmacological investigation
1-7
1
3
5
6
7
7
7
Chapter 2
2.1
2.2
2.3
2.4
2.5
2.6
Plant preview
A brief overview of the plant Myristica fragrans
Geographical distribution
Classification of the plant
Medicinal activities of the various parts of the plants
Uses of Myristica fragrans
Literature review
8-13
8
9
9
10
10
11
Chapter 3
3.1
3.2
3.3
3.4
3.5
3.6
3.7
3.8
3.9
3.10
Design of biological investigation
Experimental design
Laboratory animals
Preparation of methanolic extract from Myristica fragrans seed
Phytochemical screening
Antioxidant activity
Brine shrimp lethality bioassay
In-vitro antimicrobial study
Anti-inflammatory activity
Anti-pyretic activity
Peripheral analgesic activity
14-16
14
14
14
14
14
14
15
15
15
15
Dhaka University Institutional Repository
Page | II
Chapter Topics Page No.
3.11
3.12
Anti-diabetic activity
Anti-diarrhoeal activity
16
16
Chapter 4
4.1
4.1.1
4.1.2
4.1.3
4.2
4.3
4.4
4.5
4.6
4.7
Preparation of the crude extract and the partitioningof the crude extract by different solvents
Materials used
Glass wares
Filter aids
Equipments
Solvents
Collection and preparation of the plant material
Extraction of the plant material
Yield determination
Solvent-solvent partitioning
Preservation and storage
17-20
17
17
17
17
17
17
18
18
18
19
Chapter 5
5.1
5.2
5.2.1
5.2.2
5.3
5.4
5.5
Phytochemical screening
Phytochemical screening
Materials used for screening
Equipment
Reagents and chemicals
Test compounds
Preparation of sample solution
Phytochemical tests
21-24
21
21
21
21
21
22
22
Chapter 6
6.1
6.2
6.3
6.3.1
Evaluation of the antioxidant activity
Introduction
Principle
Materials and method
Materials
25-34
25
25
26
26
Dhaka University Institutional Repository
Page | III
Chapter Topics Page No.
6.3.2
6.4
6.5
Methods
Analytical data
Results and discussion
[
26
28
34
Chapter 7
7.1
7.2
7.3
7.4
7.4.1
7.4.2
7.4.3
7.4.4
7.4.5
7.4.6
7.5
7.6
Brine shrimp lethality bioassay
Objective of brine shrimp lethality bioassay
Principle
Materials
Experimental procedure
Preparation of seawater
Hatching of brine shrimps
Preparation of the test sample
Preparation of the positive control group
Preparation of the negative control
Counting of nauplii
Analytical data
Results and discussion
35-43
35
35
35
36
36
36
37
37
37
38
43
Chapter 8
8.1
8.2
8.3
8.3.1
8.3.2
8.3.3
8.3.4
8.3.5
8.3.6
8.3.7
Antimicrobial screening by disc diffusion method
Introduction
Principle of disc diffusion method
Materials and methods
Apparatus and reagent
Test organisms
Composition of culture medium
Preparation of the medium
Sterilization procedure
Preparation of subculture
Preparation of the test plate
44-49
44
44
45
45
45
46
46
46
47
47
Dhaka University Institutional Repository
Page | IV
Chapter Topics Page No.
8.3.8
8.3.9
8.3.10
8.4
Preparation of discs
Diffusion and incubation
Determination of the zone of inhibition
Results and discussion
47
47
48
49
Chapter 9
9.1
9.2
9.3
9.4
9.5
9.6
9.7
Evaluation of anti-inflammatory activity bycarrageenan induced rat’s paw edemaPrinciple
Experimental animal
Preparation of test materials
Procedure
Evaluation of anti-inflammatory activity
Statistical evaluation of data
Results and discussion
50-57
50
50
50
50
52
57
57
Chapter 10
10.1
10.2
10.3
10.4
10.5
10.6
10.7
Evaluation of antipyretic activity by yeast inducedpyresis
Introduction
Experimental animal
Preparation of test materials
Pyresis induced by brewer’s yeast suspensions in rats
Analytical data
Statistical analysis
Results and discussion
58-65
58
58
59
59
60
64
65
Chapter 11
11.1
11.2
11.3
Evaluation of peripheral analgesic activity by aceticacid induced writhing
Principle
Experimental animal
Experimental design
66-72
66
66
66
Dhaka University Institutional Repository
Page | V
Chapter Topics Page No.
11.4
11.5
11.6
11.7
11.8
Preparation of test materials
Procedure
Counting of writhing
Statistical analysis
Results and discussion
67
69
69
71
72
Chapter 12
12.1
12.2
12.3
12.4
12.5
12.6
12.7
12.8
Evaluation of anti-diabetic activity by streptozotocininduced mice
Principle
Experimental animal
Experimental design
Preparation of test materials
Oral glucose tolerance test in Swiss albino mice
Procedure
Statistical analysis
Results and discussion
73-80
73
73
73
74
75
76
79
80
Chapter 13
13.1
13.2
13.3
13.4
13.5
13.6
13.7
13.8
Evaluation of anti-diarrhoeal activity by castor oilinduced mice
Principle
Experimental animal
Experimental design
Preparation of test materials
Procedure
Evaluation of anti-diarrhoeal activity
Statistical analysis
Results and discussion
81-85
81
81
81
82
82
83
84
85
Conclusion 86
Reference 87-90
Dhaka University Institutional Repository
Page | VI
List of Tables
Table No. Topic Page No.
Table 5.1 Results of Myristica fragrans Seed extract and fractions 24
Table 6.1 IC50 value of tert-butyl-1-hydroxytoluene (BHT) 28Table 6.2 IC50 value of Ascorbic Acid 29Table 6.3 IC50 value of Methanolic extract of Myristica fragrans 30Table 6.4 IC50 value of Petroleum Ether fraction of Myristica fragrans 31Table 6.5 IC50 value of n-Hexane fraction of Myristica fragrans 32Table 6.6 IC50 value of Chloroform fraction of Myristica fragrans 33Table 6.7 IC50 values of standard and different fractions of Myristica fragrans 34
Table 7.1 Test samples for the experiment 35Table 7.2 Test sample concentration after dilution 37Table 7.3 Effect of Vincristine Sulphate (Positive Control) on Shrimp nauplii 38Table 7.4 Effect of crude methanolic extract of Myristica fragrans on shrimp
nauplii39
Table 7.5 Effect of Petroleum Ether fraction of Myristica fragrans on shrimpnauplii
40
Table 7.6 Effect of n-Hexane fraction of Myristica fragrans on shrimp nauplii 41Table 7.7 Effect of Chloroform fraction of Myristica fragrans on shrimp nauplii 42Table 7.8 A brief overview of the cytotoxic activity of the different fractions of
Methanolic extract of Myristica fragrans43
Table 8.1 List of Gram positive and Gram negative bacteria and fungi 45Table 8.2 Test samples for the experiment 46Table 8.3 Preparation of sample Discs 47Table 8.4 Antimicrobial activity of test samples of Myristica fragrans 49
Table 9.1 Test samples used for the experiment 51Table 9.2 Paw volume of rats receiving control (Normal saline) at different time
intervals52
Table 9.3 Paw volume of Standard group of rats at different time intervals 52Table 9.4 Paw volume of rats receiving the Crude Methanolic extract (Single
Dose) III (A) of Myristica fragrans at different time intervals53
Table 9.5 Paw volume of rats receiving the crude Methanolic extract (DoubleDose) III (B) of Myristica fragrans at different time intervals
53
Table 9.6 Paw volumes of rats receiving the Petroleum ether fraction (SingleDose) IV (A) of Myristica fragrans at different time intervals
53
Table 9.7 Paw volumes of rats receiving Petroleum ether fraction (DoubleDose) IV (B) of Myristica fragrans at different time intervals
54
[
Dhaka University Institutional Repository
Page | VII
Table No. Topic Page No.
Table 9.8 Paw volumes of rats receiving n-Hexane fraction (Single Dose) V (A)of Myristica fragrans at different time intervals
54
Table 9.9 Paw volumes of rats receiving n-Hexane fraction (Double Dose) V(B) of Myristica fragrans at different time intervals
54
Table 9.10 Paw volumes of rats receiving Chloroform fraction (Single Dose) VI(A) of Myristica fragrans at different time intervals
55
Table 9.11 Paw volumes of rats receiving Chloroform fraction (Double Dose) VI(B) of Myristica fragrans at different time intervals
55
Table 9.12 Mean paw volume of rats receiving different extracts of Myristicafragrans
55
Table 9.13 Paw edema and percent inhibition of paw edema at different timeintervals
56
Table 10.1 Test materials used in the evaluation of analgesic activity of crudeextract and its different fractions of Myristica fragrans.
60
Table 10.2 Effect of normal saline (control) on yeast-induced pyrexia in rats atdifferent time intervals
60
Table 10.3 Effect of paracetamol (standard) on yeast-induced pyrexia in rats atdifferent time intervals.
60
Table 10.4 Effect of methanolic extract (200 mg/kg body weight) on yeastinduced pyrexia in rats at different time intervals.
61
Table 10.5 Effect of methanolic extract (400 mg/kg body weight) on yeastinduced pyrexia in rats at different time intervals.
61
Table 10.6 Effect of Petroleum Ether fraction (200 mg/kg body weight) on yeastinduced pyrexia in rats at different time intervals.
61
Table 10.7 Effect of Petroleum Ether fraction (400 mg/kg body weight) on yeastinduced pyrexia in rats at different time intervals.
62
Table 10.8 Effect of n-Hexane fraction (200 mg/kg body weight) on yeastinduced pyrexia in rats at different time intervals.
62
Table 10.9 Effect of n-Hexane fraction (400 mg/kg body weight) on yeastinduced pyrexia in rats at different time intervals.
62
Table 10.10 Effect of Chloroform fraction (200 mg/kg body weight) on yeastinduced pyrexia in rats at different time intervals.
63
Table 10.11 Effect of Chloroform fraction (400 mg/kg body weight) on yeastinduced pyrexia in rats at different time intervals.
63
Table 10.12 Antipyretic effect of Myristica fragrans on Long evans rats 64
Table 11.1 Test materials used in the evaluation of analgesic activity of crudeextract and its different fractions of Myristica fragrans.
68
Table 11.2 Screening of analgesic activity by counting the number of writhingafter intraperitoneal administration of 0.7% glacial acetic acid
70
Dhaka University Institutional Repository
Page | VIII
Table No. Topic Page No.
Table 11.3 Analgesic activity of crude methanolic extract and its differentfractions of Myristica fragrans
70
Table 12.1 Test materials used in the evaluation of analgesic activity of crudeextract and its different fractions of Myristica fragrans.
75
Table 12.2 Screening of Anti-diabetic activity by different test samples 78Table 12.3 Anti-diabetic activity of crude methanolic extract and its different
fractions of Myristica fragrans79
Table 13.1 Test samples used for the experiment 82Table 13.2 Evaluation of different test samples and Diarrhoeal activity 83Table 13.3 Effect of Methanol extract and different fractions on castor oil
induced diarrhoea in mice84

Dhaka University Institutional Repository
Page | IX
List of Figures
Figure No. Topic Page No.
Figure 2.1 Myristica leaf and seed 8Figure 2.2 Nutmegs 10
Figure 4.1 A schematic representation of the partitioning process 19Figure 4.2 A. Methanolic extract of Myristica fragrans seed
B. Partioning the extractC. Rota evaporatorD. Dried extract
20
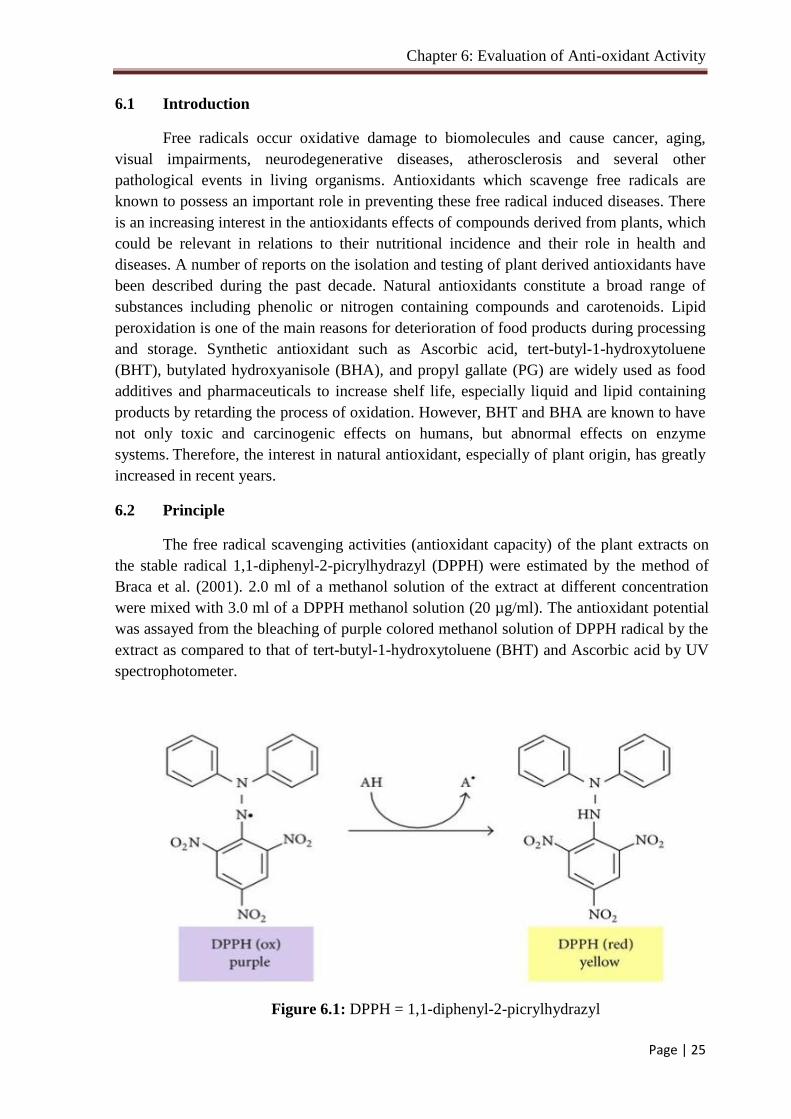
Figure 6.1 DPPH = 1,1-diphenyl-2-picrylhydrazyl 25
Figure 6.2 Schematic representation of the method of assaying free radicalscavenging activity
27
Figure 6.3 Plot of inhibition percentage vs Concentration of BHT 28Figure 6.4 Plot of inhibition percentage vs Concentration of Ascorbic acid 29Figure 6.5 Plot of inhibition percentage vs Concentration of Methanolic extract
of Myristica fragrans30
Figure 6.6 Plot of inhibition percentage vs Concentration of Petroleum Etherfraction
31
Figure 6.7 Plot of inhibition percentage vs Concentration of n-Hexane fraction 32Figure 6.8 Plot of inhibition percentage vs Concentration of Chloroform
fraction33
Figure 6.9 Plot of comparing IC50 values 34
Figure 7.1 Brine shrimp Hatchery 36Figure 7.2 % Mortality vs. Log C for Vincristine sulfate 38Figure 7.3 % Mortality vs Log C for the crude methanolic extract 39Figure 7.4 % Mortality vs Log C for the Petroleum Ether fraction 40Figure 7.5 % Mortality vs Log C for the n-Hexane fraction 41Figure 7.6 % Mortality vs Log C for the Chloroform fraction 42Figure 7.7 Comparison of LC50 values of the Test samples 43
Figure 8.1 Clear zone of inhibition 48Figure 8.2 Determination of clear zone of inhibition 48
Figure 9.1 Use of plethysmometer 51Figure 9.2 Long evans rat 51Figure 9.3 Comparison of % inhibition of paw edema in different groups 57
Figure 10.1 Long evans rat 58Figure 10.2 Comparison of Rectal temperature (0F) after 18 hours of yeast
injection65
Dhaka University Institutional Repository
Page | X
Figure No. Topic Page No.
Figure 11.1 Swiss albino mice 66Figure 11.2 Numbering of mice 67Figure 11.3 Oral administration of the drug 68Figure 11.4 Schematic diagram of the induction and counting of writhing. The
different test samples were subjected to screening for analgesicactivity by glacial acetic acid induced writhing inhibition method.The test was performed by taking samples at doses 200 mg/kg and400 mg/kg body weight.
69
Figure 11.5 Comparison of % inhibition of writhing by different samples 71
Figure 12.1 Swiss albino mice 73Figure 12.2 Numbering of mice 74Figure 12.3 Oral administration of the drug 75Figure 12.4 (A) Housing of test animals, (B) Holdling of test animal, (C) Oral
administration of test sample and (D) Estimation of blood glucoselevel
77
Figure 12.5 Comparison of % lowering of blood glucose level 80
Figure 13.1 Numbering of mice 81Figure 13.2 Comparison of % reduction of diarrhea in different groups 85
Chapter 1: Introduction
Page | 1
The practice of herbal medicine begins from the very ancient periods of knownhuman history. There is evidence of herbs having been used in the treatment of diseases andfor revitalizing body systems in almost all ancient civilizations---the Indian, the Egyptian,the Chinese and even the Greek and Roman civilizations. Herbs act in almost magical andastonishing ways - spasms may relax, pains vanish, constipation overcome, nervousnessrecede, headaches disappear, colds be banished, allergies counteracted, fevers controlled,blood flow arrested.
The active constituents of the herb can enter the body in several ways. These includeconsuming the herb orally so as to be absorbed by the digestive system, application on theskin through medicinal poultices as well as cosmetics for being absorbed in the bodythrough the pores, application on eyes through lotions and compresses; smelling the aromathrough nose to enable the essential oil being absorbed in the bloodstream.
Finally, a word of caution that most herbs have little or no harmful side effects,some herbs may cause slightly undesirable reactions in some persons. Therefore, try onlyone herb at a time, beginning in small doses and wait and watch for side effects. If there arenone, increase the use or dosage cautiously. Also, not all herbal applications are effective inevery case in every person.
1.1 History of medicinal plants
Since disease, decay and death have always co-existed with life, the study of diseaseand their treatment must also have been contemporaneous with the dawn of the humanintellect. The primitive man must have used as therapeutical agents and remedial measuresthose things which he was able to procure most easily. There is no authentic record ofmedicines used by the primitive man (Kirtikar & Bashu, 1987).
Illness, physical discomfort, injuries, wounds and fear of death had forced early manto use any natural substance that he could lay his hand on, without any resistance, for livingthe pains and sufferings caused by these abnormal conditions and for preserving his healthagainst disease and death (Ghoni, 1998).
Primitive peoples in all ages have had some knowledge of medicinal plants, derivedas the result of trial and error. There primitive attempts at medicine were based on intuitionguess work, superstition or trial or error. Most savage people have believed that disease wasdue to the presence of evil spirits in the body and could be driven out by the use ofpoisonous or disagreeable substances calculated to make the body an unpleasant place inwhich to remain. The knowledge regarding the source and the use of the various productssuitable for this purpose is usually restricted to the medicine men of the tribe. Ascivilization progressed the early physicians were guided in great part by these observations(Albert, 1972).
Rigveda (4500-1600 B.C.), which is the oldest book in the library of man suppliesvarious informations on the medicinal use of the plants in the Indian subcontinent. It notedthat Indo-Aryans used the Soma plant (Amanita muscaria, a narcotic and hallucinogenicmushroom) as medicinal agent. It is unfortunate that the Ayur Veda is no more available in
Chapter 1: Introduction
Page | 2
its original form but the most authentic and original texts considered as the renownedrepresentatives of the original Ayur Veda, are the encyclopedic Agnivesha or CharakaSamhita and Sushruta Samhita (Mukherjee, 1992). The Sushruta Samhita attributed toSushruta in the 6th century BC describes 700 medicinal plants, 64 preparations frommineral sources, and 57 preparations based on animal sources (Dwivedi, 2007).
The Indo-Aryans used the plant for sacrificial purposes and its juice is described inthe ancient Aryan literature as stimulating beverage. The word oushadhi literally means heatproducer. When the Indo-Aryans came to use the Soma plants for therapeutical purposes,they came to possess knowledge of the medicinal properties and uses of herbs and plants.Hence, Oushadhi applied to all herbs and medicinal plants. The Vedas made manyreferences to healing plants including Sarpagondha (Rauwolfia serpentine), while acomprehensive Indian herbal, the Charaka Samhita, cites more than 500 medicinal plants(Kirtiker & Basu, 1987).
As far as records go, it appears that Babylonians (about 3000 years B.C.) were awareof a large number of medicinal plants and their properties. As evident from the PapyrusEbers (about 1500 B.C.), the ancient Egyptians possessed a good knowledge of themedicinal properties of hundreds of plants. Many of the present day important plant drugslike henbane (Hyoscyamus spp.), mandrake (Mandragora officinarum), opium (latex ofPapaver somniferum fruit), pomegranate (Punica granatum), castor oil (oil of Riccinuscommunis seeds), aloe (Juice of Aloe spp.), onion (Allium cepa) and many others were incommon use in Egypt about 4500 years ago.
The first Chinese herbal book the Shennong Bencao Jing was compiled during theHan Dynasty but dates back to a much earlier date, possibly 2700 B.C. It lists 365 medicinalplants and their uses - including ma-Huang, the shrub that introduced the drug ephedrine tomodern medicine. Succeeding generations augmented on the Shennong Bencao Jing, as inthe Yaoxing Lun (Treatise on the Nature of Medicinal Herbs), a 7th century Tang Dynastytreatise on herbal medicine. The ancient Greeks and Romans made medicinal use of plants.Greek and Roman medicinal practices, as preserved in the writings of Hippocrates and -especially -Galen, provided the pattern for later western medicine. Hippocrates advocatedthe use of a few simple herbal drugs - along with fresh air, rest, and proper diet. Galen, onthe other hand, recommended large doses of drug mixtures - including plant, animal, andmineral ingredients. The uses of plants for medicine and other purposes changed little inearly medieval Europe. Many Greek and Roman writings on medicine, as on other subjects,were preserved by hand copying of manuscripts in monasteries. At the same time, folkmedicine in the home and village continued uninterrupted, supporting numerous wanderingand settled herbalists Avicenna's The Canon of Medicine (1025A.D.) lists 800 tested drugs,plants and minerals. Book Two is devoted to a discussion of the healing properties of herbs,including nutmeg, senna, sandalwood, rhubarb, myrrh, cinnamon, and rosewater. Baghdadwas an important center for Arab herbalism, as was Al-Andalus between 800 and 1400(Tapsell et al., 2006) (Castleman, 2002).
The Pen Tsao, the earliest known Chinease pharmacopoeia, appeared around 1122B.C. attributed to the legendary Emperor Shen Nung, this authoritative work described the
Chapter 1: Introduction
Page | 3
use of Chaulmoogra oil (from the seed of Hydnocarpus kurzii) to treat leprosy (Ghoni,1998).
The continuing importance of herbs for the centuries following the Middle Ages isindicated by the hundreds of herbals published after the invention of printing in the fifteenthcentury. Theophrastus’ Historia Plantarum was one of the first books to be printed, butDioscorides’ De Materia Medica, Avicenna's Canon of Medicine and Avenzoar'spharmacopoeia were not far behind.
The practice of herbal medicine flourished most during the Greek civilization. Whenhistorical personalities, like Hippocrates (born in 460 B.C.) and Theophrastus (born in 370B.C.) were practiced herbal medicine; Hippocrates is regarded as the father of medicine ashe was distinguished physician, practicing and researching into herbal medicine. HisMateria medica consists of some 300 – 400 medicinal plants. The far ranging scientificwork of Aristotol (384-322 B.C.); a Greek philosopher, included an effort to catalog theproperties of the various medicinal herbs known at that time. The Greek writer- physicianDioscorides (60 A.D.) who wrote the famous treatise De Materia Medica (published in 78A.D.) which contained the description of 600 medicinal plants. Two of the 37 volumes ofbooks were written by Pliny De Elder (23 - 70 A.D.), which included a large number ofmedicinal plants. Galen (131 - 200 A.D.) was the great Greek pharmacist and physician,who wrote about 500 volumes of books describing hundreds of recipes and formulations ofmedicinal preparations containing both plant and animal origin.
Allopathic and homeopathic systems of medicine today are based doctrineexpatiated by Galen (Sofowora, 1982).
After the dark ages were over, there came the period of herbalists' and encyclopedistand the monasteries of Northern Europe produced vast compendiums of true and falseinformation regarding plants, stressing in particular the medicinal value and folklore. It wasabout this time that the curious "Doctrine of Signatures" came into being. It was developedby Paracelsus (1490-1541 A.D.), a Swiss alchemist and physician. According to thissuperstitious doctrine all plants possessed some sign given by the Creator, which indicatedthe use for which they were intended. Thus a plant with heart shaped leaves should be heartailments, the liver leaf with its three-logged leaves for liver troubles and so on. Many of thecommon names of our plants of today owe their origin this curious belief. Such names asheartsease, Solomon's seal, dogtooth violet and liverwort carry on the old superstition.
From this crude beginning the study of drug and drug plants has progressed untilnow pharmacognosy and pharmacology are essential branches of medicine (Albert, 1972).
1.2 Contribution of the medicinal plants to modern medicine
Plants remain the primary source of supply of many important drugs used in modernmedicine. Modifications, improvements, sophistication and newer discoveries arecontinuously changing the type, quality, presentation and concept of medicinal preparations.The real changes that have taken place and taking place in medicines are those in theiractive ingredients, excipients and form of preparation. And these are the areas where plants

Chapter 1: Introduction
Page | 4
have been contributing enormously since the human race first discovered medicine toensure its existence on earth.
Continued use of many plants from the progress of civilization and development ofhuman knowledge, scientists promoted phytochemical and pharmacological research intothem which resulted in the discovery, isolation and in many cases subsequent synthesis of alarge number of modern medicinal substances. Some examples are - Ergot alkaloids, thepopular oxytocic and antimigraine agents of modern medicine, were first isolated from theergot of rye. The midwives of ancient Europe used ergot in childbirth to promote andstrengthen uterine contractions (Taylor, 1965; Le Strange, 1977).
a) Morphine and other opium alkaloids, which are most potent analgesics and sedativesof modern medicine, are now commercially obtained from the capsules of Opiumpoppy, Papaver somniferum. Opium as a pain-killer and sleep inducing drug waswell-known to the ancient (Taylor, 1965).
b) Atropine, hyoscyamine, hyoscine and other tropane alkaloids, which are used assedative, anti-spasmodic, mydriatic and parasympatholytic agents in modernmedicine, were isolated and are now produced from Atropa,, Dhatura and Duboisiaspp. The plants have long been used in traditional medicine as pain killers andhypnotics.
c) Sennosides and other anthracene derivatives used in modern medicine as laxativesand purgatives are obtained from the leaves of Cassia senna (Sona pata), rhizomesof Rheum and barks of Rhamnus species. These plant parts have long been used intraditional medicine for their purgative properties.
d) Digoxin, digitoxin and some other most potent cardio tonic glycosides used inmodern medicine were isolated and are now commercially produced from the leavesof Digitalis purpurea. The plant was traditionally used in the treatment of dropsy.
e) Vinblastine and vincristine, the most potent highly esteemed and most expensiveanti-leukaemic drugs of modern anti-cancer therapy are obtained from theornamental plant Madagascar periwinkle, Catharanthus roseus (Nayantara). Theresearch into this plant was however promoted by its long use in traditional medicinefor the treatment of diabetes.
f) Quinine, quinidine and other cinchona alkaloids, which are the most commonly usedantimalarial substances of modern medicine, were isolated and ate nowcommercially produced from the barks of cinchona trees. Cinchona barks weretraditionally used in the treatment of fevers long before their chemical constituentswere discovered.
g) Reserpine, rescinnamine and other similar hypotensive and sedative substances nowused in modern medicine were isolated and now produced from the roots of variousRauwolfia species. The roots have long been used in traditional medicine in thetreatment of mental illness, insanity and insomnia.
There are many other such examples, which were results of research prompted byuses of medicinal plants in traditional medicine. This is how medicinal plant has contributedenormously over the years to the gradual development of modern medicine. This process of
Chapter 1: Introduction
Page | 5
contribution is still continuing significantly. Some of the plant-derived drugs of modernmedicine are listed in the following table with their plant sources and therapeutic uses.
But don't have Herbal remedies and Home comforts until illness strikes. It alsosuggests preventive measures and recommends herbals to ward off illness, as well as givinginstructions for making delightful herbal preparations that will scent and purify the home toensure a healthy atmosphere.
1.3 Prospects of herbal drug research in Bangladesh
Herbs play a significant role, especially in modern times, when the damaging effectsof food processing and over-medication have assumed alarming proportions. They are nowbeing increasingly used in cosmetics, foods and teas as well as alternative medicines. Thegrowing interest in herbs is a part of the movement toward change in life styles. Thismovement is based on the belief that the plants have a vast potential for their use as acurative medicine.
In Bangladesh, 5000 species of angiosperms are reported to occur (IUCN, 2003).The number of medicinal plants included in “Materia medica” of traditional medicine in thissubcontinent at present stands as about 2,000. Since Bangladesh has an enormous resourceof medicinal plants, majority of our population has to rely upon indigenous system ofmedication. The high cost of imported conventional drugs and inaccessibility to westernhealth care facility, imply that traditional mode of health care is the only form of health carethat is affordable and available to the rural people. On the other hand, even when westernhealth facilities are available, traditional medicine is viewed as an efficient and anacceptable system from a cultural perspective and as a result, traditional medicines usuallyexist side by side with western forms of health care.
Bioactive compounds deposited in medicinal plants can serve as important rawmaterials for pharmaceutical manufacturing. Therefore, well-judged and scientificinvestigation of this wealth can significantly contribute to the public health. Again, it wasobserved that developed countries mostly imports raw materials of valuable medicinalplants from developing countries. Where they are screened, analyzed and used in drugpreparations, and returned as high priced medicines to developing countries. Thus, beingavailable commodity of commerce, a country can also earn a good amount of foreigncurrency by exporting this natural wealth to other countries (Ghani et al., 2003).
The ancients knew that apple cleansed the blood, controlled high blood pressure andstimulated the flow of urine. Now, science has shown how apples lower sodium chloride,while increasing potassium and alkaline reserves.
Recent medical research has established onion as an effective preventive foodagainst heart attack. They correct thrombosis and reduce blood cholesterol. Garlic juicedissolves accumulation of mucous in the sinus cavities, bronchial tubes, lungs and reducesthe severity of asthmatic attacks. Blood sugar is controlled by amla. It stimulates productionof hormone insulin. Scurvy resists treatment with synthetic vitamin C, yet responds quicklyto certain vegetables and fruits like cabbage, lemon and amla.
Chapter 1: Introduction
Page | 6
Traditional herbal remedies have led scientists to the development of numerous'Modern' drugs; from aspirin, tranquillizers and chywanprash to heart saving digitalis,establishing beyond doubt the efficacy of 'herbal medicine'.
Through herbal drug research we obtain their specific healing properties, how theherbs are useful in alleviating or preventing specific ailments; in most cases, the method ofusing and making herbal preparations.
1.4 Role of herbs in modern human society
The use of herbs to treat disease is almost universal among human societies. Anumber of traditions came to dominate the practice of herbal medicine at the end of thetwentieth century:
1) The "classical" herbal medicine system, based on Greek and Roman sources
2) The Siddha and Ayurvedic medicine systems from various South Asian Countries
3) Chinese herbal medicine (Chinese herbalogy)
4) Traditional African medicine
5) Unani-Tibb medicine
6) Shamanic herbalism: a catch-all phrase for information mostly supplied from
South America and the Himalayas
7) Native American medicine.
Many of the pharmaceuticals currently available to physicians have a long history ofuse as herbal remedies, including opium, aspirin, digitalis, and quinine. The World HealthOrganization (WHO) estimates that 80 percent of the world's population presently usesherbal medicine for some aspect of primary health care (Fabricant and Farnsworth, 2001).
In addition to the use in the developing world, herbal medicine is used inindustrialized nations by alternative medicine practitioners such as naturopaths. A 1998survey of herbalists in the UK found that many of the herbs recommended by them wereused traditionally but had not been evaluated in clinical trials. In Australia, a 2007 surveyfound that these Western herbalists tend to prescribe liquid herbal combinations of herbsrather than tablets of single herbs.
The use of, and search for, drugs and dietary supplements derived from plants haveaccelerated in recent years. Pharmacologists, microbiologists, botanists, and natural-products chemists are combing the Earth for phytochemicals and leads that could bedeveloped for treatment of various diseases. In fact, according to the World HealthOrganization, approximately 25% of modern drugs used in the United States have beenderived from plants (Barnes and Edzard, 1998).
Chapter 1: Introduction
Page | 7
The uses of plant species and herbs to treat medicine have made their lives easierbecause these types of medicine are cheap and also easy to obtain.
1.5 The study protocol
Our present study was designed to observe pharmacological activities of the crudeextracts and their different partitioning fractions of the Myristica fragrans seeds. Itconsisted of the following steps:
1.5.1 Chemical investigation
1. Extraction of the plant Myristica fragrans for fifteen days with methanol.
2. Filtration of the crude methanolic extract by using the Markin cotton cloth andsubsequently through the filter paper and solvent evaporation.
3. Fractionation of methanolic crude extract with Petroleum ether, n-Hexane andChloroform by partition method.
4. Phytochemical screening for alkaloids, glycosides, tannins, flavonoids, fixed oils,steroids and volatile oils.
1.5.2 Pharmacological investigation
1. Evaluation of antioxidant activity of crude extract and different fractions byDPPH free radical scavenging method.
2. Brine shrimp lethality bioassay and determination of LC50 of crude extract anddifferent fractions of Myristica fragrans.
3. Investigation of in-vitro antimicrobial activity of crude extract and differentfractions of Myristica fragrans by Disc diffusion method.
4. Screening of anti-inflammatory activity of crude extract and different fractions ofMyristica fragrans by Carrageenan induced inflammation on Long evans rat model.
5. Screening of anti-pyretic activity by Yeast induced fever on Long evans ratmodel.
6. Screening of peripheral analgesic activity of crude extract and different fractionsof Myristica fragrans on Swiss albino mice model by acetic acid induced writhingmethod.
7. Screening of anti-hyperglycaemic activity by streptozotocin induced diabetes.
8. Screening of anti-diarrhoeal activity by castor oil induced diarrhoea.
Chapter 2: Plant Preview
Page | 8
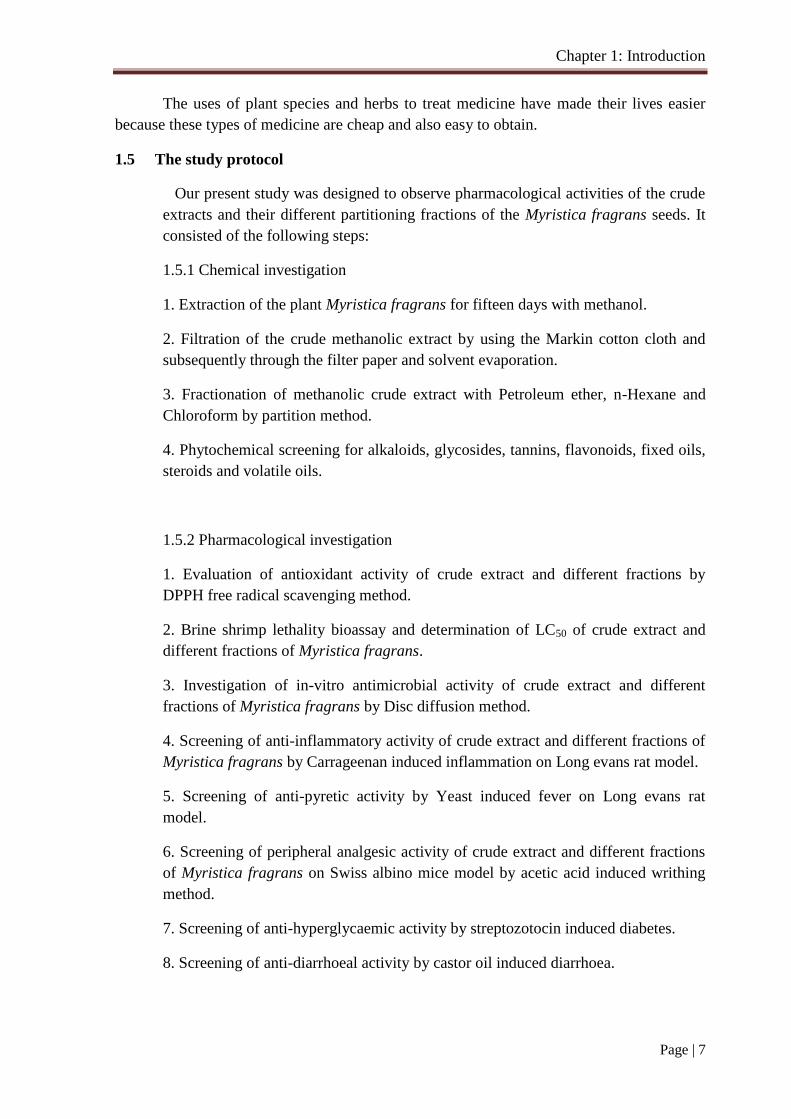
2.1. A brief overview of the plant Myristica fragrans
Myristica fragrans is a small evergreen tree, usually 5–13 m (16–43 ft) tall, butoccasionally reaching 20 m (66 ft). The alternately arranged leaves are dark green, 5–15 cm(2.0–5.9 in) long by 2–7 cm (0.8–2.8 in) wide with petioles about 1 cm (0.4 in) long. Thespecies is dioecious, i.e. "male" or staminate flowers and "female" or carpellate flowers areborne on different plants, although occasional individuals produce both kinds of flower. Theflowers are bell-shaped, pale yellow and somewhat waxy and fleshy. Staminate flowers arearranged in groups of one to ten, each 5–7 mm (0.2–0.3 in) long; carpellate flowers are insmaller groups, one to three, and somewhat longer, up to 10 mm (0.4 in) long.
Carpellate trees produce smooth yellow ovoid or pear-shaped fruits, 6–9 cm (2.4–3.5 in) long with a diameter of 3.5–5 cm (1.4–2.0 in). The fruit has a fleshy husk. When ripethe husk splits into two halves along a ridge running the length of the fruit. Inside is apurple-brown shiny seed, 2–3 cm (0.8–1.2 in) long by about 2 cm (0.8 in) across, with a redor crimson covering (an aril).
The seed of the plant is known as “nutmeg” and the arillus of the seed is called“mace”. Both nutmeg and mace contain many volatile oils. These oil constituents have avariety of individual pharmacological effects. The fruit contains ethereal oil-cells often withphenolic and myristicin; the seed and the aril are used for flavouring food.
Figure-2.1: Myristica leaf and seed
Chapter 2: Plant Preview
Page | 9
The Myristicaceae are a family of flowering plants. It is sometimes called the"nutmeg family", after its most famous member, Myristica fragrans, the source of the spicesnutmeg and mace. The best known genera are Myristica and Virola.
The family consists of about 20 genera, with about 440 species of trees and shrubsfound in tropical areas across the world. Most of the species are large trees that are valuedin the timber industry. Other species include Myristica argentea (Papua), and Myristicamalabarica in India, both used as adulterants in trade.
The nutmeg tree bears fruits which contain egg-shaped seeds wrapped in a red cover(aril), all year. The red cover is mace, which is another spice with a similar, but slightlymore delicate flavour. Mace and its extract (oleoresin) are not a subject of this study. Thisstudy covers the aforementioned egg-shaped seed (nutmeg), in whole, broken or groundform.
2.2 Geographical distribution
Global distribution: The family is present in Europe, Asia, and the Americas.
Local distribution: Native of the Eastern Moluccas, Endemic to Indonesia and othercountries in the South Pacific. Caribbean islands, India, Kerala, Tamil Nadu, Karnataka, SriLanka and Malaysia.
2.3 Classification of the plant
Taxonomical Hierarchy of Myristica fragrans
Rank Scientific and common name
Kingdom Plantae – Plants
Subkingdom Tracheobionta – Vascular plants
Superdivision Spermatophyta – Seed plants
Division Magnoliophyta – Flowering plants
Class Magnoliopsida – Dicotyledons
Subclass Magnoliidae
Order Magnoliales
Family Myristicaceae – Nutmeg family
Genus Myristica Gronov. – nutmeg
Species Myristica fragrans Houtt. – nutmeg
Chapter 2: Plant Preview
Page | 10
2.4 Medicinal activities of the various parts of the plants
Common names: Jaiphol (Bengali)
Leaf: Less used in herbal medicine.
Bark: Less used in herbal medicine.
Flower: Dried flowers are used as antispasmodic, antiparasitic, anti-emetic, antioxidant,antirheumatic, carminative and antiseptic etc.
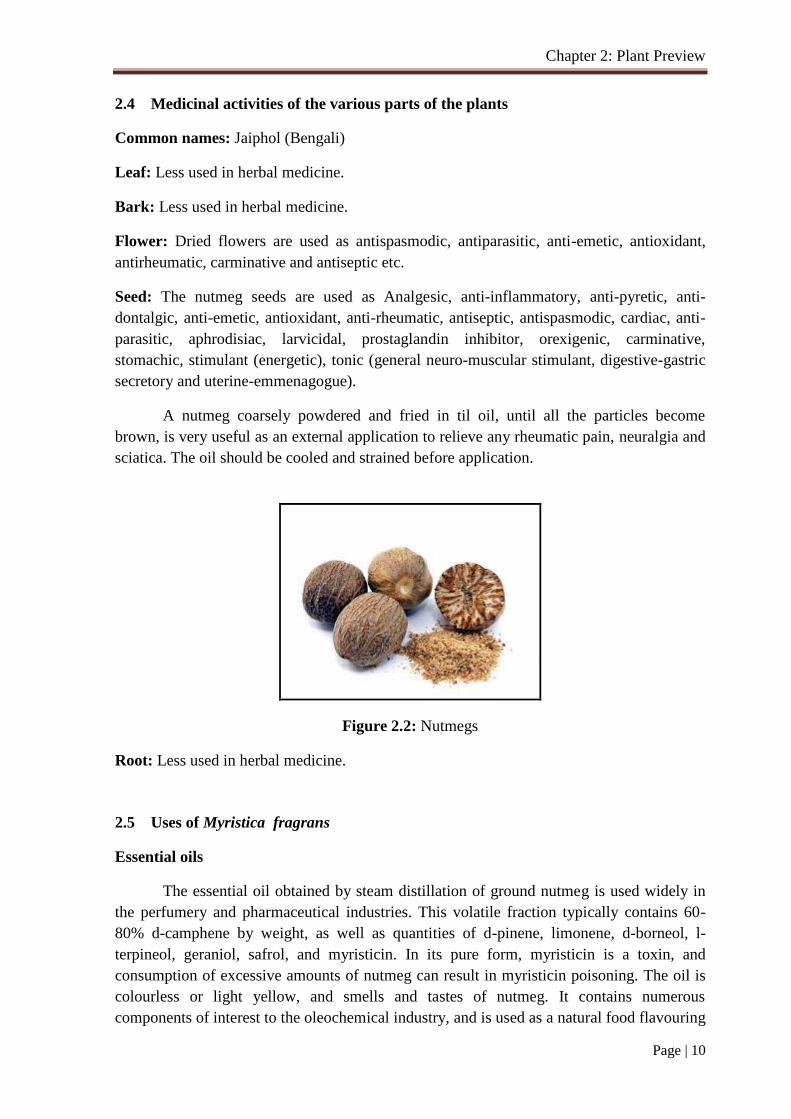
Seed: The nutmeg seeds are used as Analgesic, anti-inflammatory, anti-pyretic, anti-dontalgic, anti-emetic, antioxidant, anti-rheumatic, antiseptic, antispasmodic, cardiac, anti-parasitic, aphrodisiac, larvicidal, prostaglandin inhibitor, orexigenic, carminative,stomachic, stimulant (energetic), tonic (general neuro-muscular stimulant, digestive-gastricsecretory and uterine-emmenagogue).
A nutmeg coarsely powdered and fried in til oil, until all the particles becomebrown, is very useful as an external application to relieve any rheumatic pain, neuralgia andsciatica. The oil should be cooled and strained before application.
Figure 2.2: Nutmegs
Root: Less used in herbal medicine.
2.5 Uses of Myristica fragrans
Essential oils
The essential oil obtained by steam distillation of ground nutmeg is used widely inthe perfumery and pharmaceutical industries. This volatile fraction typically contains 60-80% d-camphene by weight, as well as quantities of d-pinene, limonene, d-borneol, l-terpineol, geraniol, safrol, and myristicin. In its pure form, myristicin is a toxin, andconsumption of excessive amounts of nutmeg can result in myristicin poisoning. The oil iscolourless or light yellow, and smells and tastes of nutmeg. It contains numerouscomponents of interest to the oleochemical industry, and is used as a natural food flavouring
Chapter 2: Plant Preview
Page | 11
in baked goods, syrups, beverages, and sweets. It is used to replace ground nutmeg, as itleaves no particles in the food. The essential oil is also used in the cosmetic andpharmaceutical industries, for instance, in toothpaste, and as a major ingredient in somecough syrups. In traditional medicine, nutmeg and nutmeg oil were used for disordersrelated to the nervous and digestive systems.
[[[Culinary uses
Nutmeg and mace have similar sensory qualities, with nutmeg having a slightlysweeter and mace a more delicate flavour. Mace is often preferred in light dishes for thebright orange, saffron-like hue it imparts. Nutmeg is used for flavouring many dishes,usually in ground or grated form, and is best grated fresh in a nutmeg grater.
2.6 Literature review
Methanolic extract have cytotoxic properties. From Iiterature review it hasanalgesic, anti-inflammatory and anti-pyretic properties. So, there is a strong reason ofhaving anti-rheumatic activities are specifying below----
Three active components myristicin, licarin B and dehydrodiisoeugenol wereisolated as active principles that have CNS depressant effects. In 400 mg doses, myristicinproduced mild cerebral stimulation in human subjects. This effect is much less than thatproduced by 15 gm. of nutmeg powder, which was taken by people in order to describe itspsychopharmacologic action. Removal of the volatile components of nutmeg eliminates thepsychic action but not all of the side effects. It appears that myristicin does not reproducethe entire activities of whole nutmeg.
The isolation of 2 antimicrobial resorcinols, malabaricone B and malabaricone C,from the dried seeds of Myristica fragrans is described. Both compounds exhibited strongantifungal and antibacterial activities. Structure modification by methylation or reductionresulted in diminished activity. Nematicidal activity of Myristica fragrans oil is foundagainst Meloidogyne incognita.
The seed contains myristicin, geraniol, diterpene, d-linalol, p-cymene, β- pinene,carotene as Vitamin-A, starch, reducing sugar. Seeds are rich in fatty acids -- lauric 4%;myristic 71.8%; palmitic, stearic 1.2% and linoleic 1.5%. The leaf, bark and flowerscontain---- light brown volatile oil and stem contains a tannin mucilage complex.
Essential oils of Myristicaceae have antifungal action and antimicrobial activityagainst Streptococcus mutans. The dark-red resin of the tree bark in some genera, such asVirola, contains several hallucinogenic alkaloids. Myristicin poisoning can induceconvulsions, palpitations, nausea, eventual dehydration, and generalized body pain. It is alsoreputed to be a strong deliriant, and some fatal myristicin poisonings in humans haveoccurred.
Nutmegs have a strong, peculiar and delightful fragrance and a very strong bitterwarm aromatic taste. During extraction deep yellowish fatty or waxy substances were found
Chapter 2: Plant Preview
Page | 12
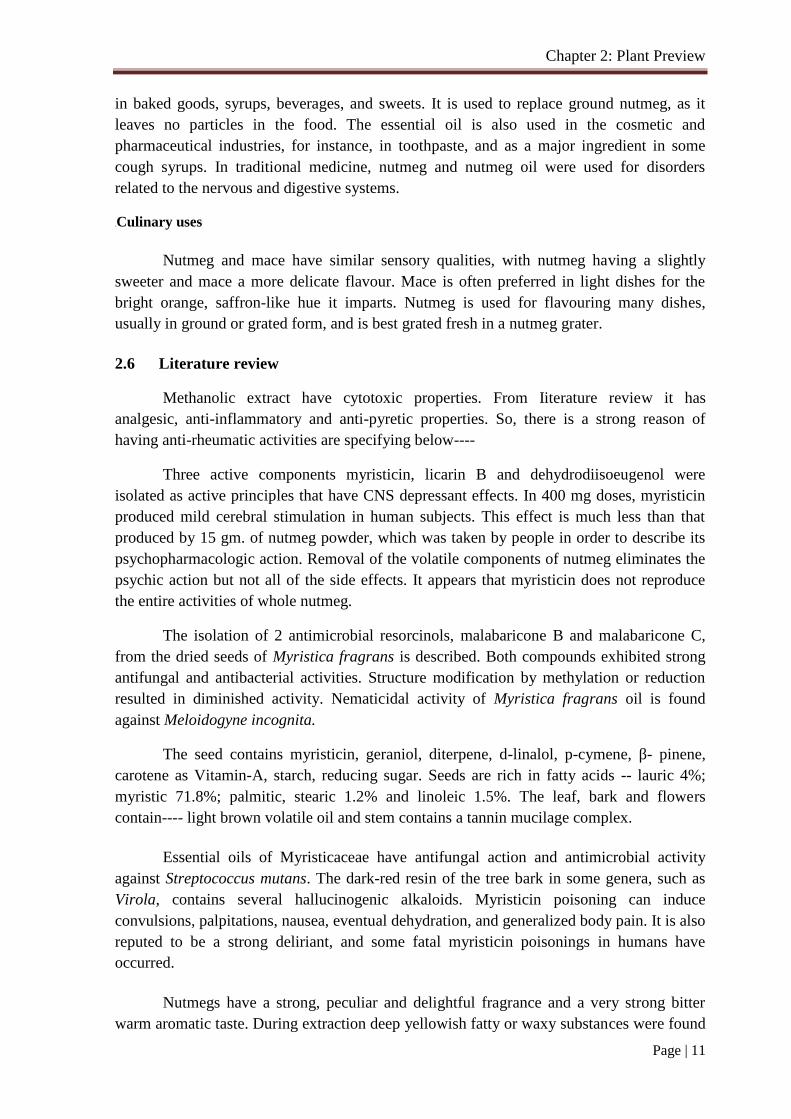
which removed through charcoal filtration. So from the data table, it is clear that volatileoils cannot saponify through alkaline potassium hydroxide but alkaline hydroxide saponifiesfixed oils during saponification process.
Active chemical constituents provide anti-inflammatory and analgesic propertiesinhibiting prostaglandin synthesis and the symptomatic relief of rheumatoid arthritis isachieved. Myristicin, eugenol, borneol and elmicin are the constituents of oil produce sucheffect. But still unknown, if there is any effect to fight against the immune systems andprovide remedy to such autoimmune disease.
Dried nutmeg and mace are used as spices. The essential oil (also called volatile oil)and the oleoresin are the major products of interest from the spice. Nutmeg is a stimulant,carminative, astringent and aphrodisiac. It is used in tonics and electuaries; and forms aconstituent of preparations for dysentery, stomachache, flatulence, nausea, vomiting,malaria, rheumatism, sciatica and early stages of leprosy. Higher doses have a narcoticeffect. Delirium and epileptic convulsions are found to occur. Mace is also used similarly. Itis chewed for masking foul breath. It also prevents dental caries. Nutmeg has the followingcomposition. 14.3% moisture, 7.5% protein, 36.4% ether extracts, 28.5% carbohydrates and11.6% fibre. Mace, on the other hand, has following composition: 15.9% moisture, 6.5%protein, 24.4% ether extract, 47.8% carbohydrate and 3.8% fibre. It has 1.6% of mineralcontent with 0.18% calcium, 0.10% phosphorous and 12.6% of iron. It has 4 to15% ofessential oil, 25% amylodextrin, reducing sugars, pectin and resins. The mace oil resemblesnutmeg oil in odour, flavor and composition. Thus no distinction is made between them intrade (Anonymous, 1962).
Chapter 2: Plant Preview
Page | 13
Nutmegs contain 25-40 % of fixed oil, otherwise called oleum myristiceaeexpressum. It is a highly aromatic, orange-yellow coloured fat with the consistency of fat atroom temperature. It has the odour and taste of nutmeg. It is composed of mainly trimyristinwith a high proportion of essential oil. It is an ester of glycerol and tetradecanoic acid(myristic acid).
The other major sources of trimyristin are coconut oil and palm kernel oil. (Purseglove et al., 1981, Anonymous, 1962). Studies by various groups have given differentaccounts regarding the proportion of fatty acids in cultivated and wild taxa of nutmeg.Similarly very little information is available on the proportion of amino acids in the leavesof cultivated and wild taxa. Maya et al., (2004) has reported variability in the concentrationof essential oil constituents of East Indian and West Indian nutmeg. This has prompted foran in- depth study on the fatty acid and amino acid profile of cultivated and wild taxa ofnutmeg.
Nutmeg was once considered an abortifacient, but may be safe for culinary useduring pregnancy. However, it inhibits prostaglandin production and contains hallucinogensthat may affect the fetus if consumed in large quantities.
Chapter 3: Design of Biological Investigation
Page | 14
3.1 Experimental design
Eight biological tests will be performed using the obtained plant extracts andfractions. The brief descriptions of the biological tests that will be performed are givenbelow:
3.2 Laboratory animals
Swiss albino mice and Long evans rats will be used as model animal.
3.3 Preparation of methanolic extract from Myristica fragrans seed
The seed would be grinded to a fine powder and will be placed in a round bottomedflask (5 Litre). Sufficient quantity of solvent will be added to submerge the plant material.The container with its content was sealed by foil and kept for a period of 15 daysaccompanying occasional shaking and stirring. The methanolic extract will be evaporated todryness with rota evaporator. The extract will be transferred to glass container ofappropriate size. This will form the stock methanolic extract.
3.4 Phytochemical screening
Phytochemical screening will reveal the presence of alkaloids, glycosides,flavonoids, tannins, sterols, carbohydrates, amino acids, fixed oils, fats and volatile oils inthe methanolic extract of the Myristica fragrans seed. (Ghani, 1997)
3.5 Antioxidant activity
The free radical scavenging activity of the extracts, based on the scavenging activityof the stable 1, 1-diphenyl-2- picrylhydrazyl (DPPH) free radical will be determined by themethod described by Braca et. al. (2001). Plant extract (0.1 ml) will be added to 3 ml of0.004% methanolic solution of DPPH. Absorbance at 517nm will be determined after 30minutes and the percentage inhibition activity will be calculated from the followingequation:
% Inhibition = [(A0–A1)/A0] x 100
where A0 is the absorbance of the control, and
A1 is the absorbance of the extract or standard
The inhibition curves will be prepared and IC50 values will be obtained.
3.6 Brine shrimp lethality bioassay
Brine shrimp lethality test is a rapid and comprehensive bioassay for the bioactivecompounds of natural and synthetic origin and is considered a useful tool for primaryassessment of toxicity (Meyer et. al., 1982).
Chapter 3: Design of Biological Investigation
Page | 15
3.7 The in-vitro antimicrobial study
This study will be designed to investigate the anti-bacterial as well as anti-fungalspectrum of the crude extract and different fractions by observing the growth response.Minimum inhibitory concentration (MIC) required to kill the susceptible microbial strain isused to determine and to evaluate the extracts as potential source of antibiotic. The MIC testwill not be performed as the anti-microbial activity of the plant extracts is mild. (Bauer et.al., 1966)
3.8 Anti-Inflammatory activity
Long evans rats weighing 50-100 gm would be fasted 16 hr prior to experiments, butwill be supplied with water ad libitum. Carrageenan will be suspended in saline to make a 1% (w/v) suspension. The suspension of carrageenan will be injected subcutaneously into theright hind paw 30 min after the test solutions has been administered orally. The inhibitorypotency will be determined by 200 mg/kg and 400 mg/kg of the extract of Myristicacomparing with 100 mg/kg of diclofenac sodium.
The volume of hind paw will be measured before the test solutions have beenadministered by insulin syringe and will be measured with a plethysmometer. The swellinghind paw volumes will be measured 30 min after the suspension of carrageenan has beenadministered and then up to 4 hr at intervals of 1 hr.
Control rats will be treated similarly receiving an oral dose of tween 80 and DMSOsolution. The results will be expressed as the percent increase in hind paw volume due toswelling, as compared with the initial hind paw volume. (Ozaki et. al., 1988)
3.9 Anti-pyretic activity
The antipyretic efficacy of methanolic extract will be assessed using brewer’s yeastinduced pyrexia method in Long evans rats weighing 50-100 gm. Pyrexia will be inducedby subcutaneous injection of 15 % w/v of brewer’s yeast (10 ml/kg) in distilled water. Thesubcutaneous yeast injection will be given 30 min after the test solutions have beenadministered orally. Basal rectal temperature will be measured before the injection of yeast,by inserting digital clinical thermometer to a depth of 2 cm into the rectum. The rise inrectal temperature will be recorded 18 hr after yeast injection. Paracetamol 150 mg/kg bodyweight will be used as the standard antipyretic drug. Rectal temperature of animals will benoted at regular intervals following the respective treatments. The temperature will bemeasured at 1st, 2nd, 3rd and 4th hour after 18 hr of drug administration. (Amit Jaiswal et. al.,2011)
3.10 Peripheral analgesic activity
Mice would be randomly divided into ten groups of five animals that receive: (1)Tween 80 and DMSO solution orally; (2) diclofenac sodium (100 mg/kg) orally; (3)Myristica fragrans seed extract and different fractions of 200 mg/kg and 400 mg/kg orally.
Chapter 3: Design of Biological Investigation
Page | 16
Animals would be placed separately into a cage and allowed to acclimate for at leastseven days. Mice will be given vehicle, diclofenac, methanolic extract and differentfractions 40 minutes prior to induction of visceral pain. Visceral pain will be induced byintraperitoneal injection of 0.6 - 0.7% volume per volume (10 mL/kg) glacial acetic acidsolution in normal saline. Animals will be returned to their cages and observed for writhingbehavior, indicated by stretching of the abdomen with simultaneous stretching. The numberof writhing responses will be counted for 15 minutes, starting directly after the acidinjection. (Hayfaa et. al., 2013)
3.11 Anti-diabetic activity
Anti-hyperglycaemic activities of methanolic extract and different fractions of theMyristica fragrans seed will be tested in normoglycemic and streptozotocin induceddiabetic mice.
Glucose tolerance property of methanol extract of Myristica fragrans seed would bedetermined as per the procedure previously described by Joy and Kuttan (1999) with minormodifications. In brief, fasted mice will be grouped into ten groups of five mice each. Thevarious groups received different treatments like Group 1 will receive vehicle (3-4 drops ofTween 80 and few drops of DMSO in normal saline) that served as control, group 2 willreceive standard drug (glibenclamide, 10 mg/kg body weight). Groups 3-10 will receivemethanol extract and different fractions of Myristica fragrans seed at doses of 200 and 400mg per kg body weight. Each mouse will be weighed and doses adjusted accordingly priorto administration of vehicle, standard drug and test samples. Then the animals were givenglucose load orally (2 g/kg of body weight) at a certain dose 30 minutes after administrationof crude extracts and their fractions, standard and control samples. Blood samples will becollected 30, 90 and 150 minutes after the glucose administration from tail vein. Bloodglucose levels will be measured by glucose oxidase method (Venkatesh et. al., 2004).
3.12 Anti-diarrhoeal activity
The antidiarrhoeal activity of Myristica fragrans will be evaluated using castor oilinduced diarrhoea in mice.
In overnight fasted mice that will induce diarrhoea by oral administration of castoroil (0.6 ml/mice). Test extracts will be given orally 30 minutes prior to castor oiladministration. After 30 min administration of castor oil the diarrhoea will clinicallyapparent in all the animals of control, standard and test groups, for the next 4 hr.
Control mice will be treated similarly that they received an oral dose of tween 80and DMSO solution. This will markedly reduce by 10 mg/ kg Loperamide. A similarmarked reduction in the number of defecations over four hours will be tested with Myristicafragrans at the doses of 200 and 400 mg/kg. (Bass et. al., 1972)
Statistical analysis
Data would be presented as Mean ± SEM and analyzed by one way ANOVAfollowed by Dunnets t- test to determine the level of significance (Dunnet, 1987).

Chapter 4: Preparation of Crude Extract And Partitioning
Page | 17
Methanol as solvent
Methanol is a kind of alcohols. Alcohol is a good solvent for many organic substances, both
natural and synthetic. It dissolves important plant constituents such as resins, volatile oils,
alkaloids, glycosides and neutral principles. They do not dissolve therapeutically inert plant
materials like gums and starches.
4.1 Materials used
4.1.1 Glass wares
Materials Source
Conical flasks (250 ml) BDH Laboratory EquipmentsBeakers (100 ml, 500 ml) BDH Laboratory EquipmentsTest tubes BDH Laboratory EquipmentsFunnels BDH Laboratory EquipmentsMeasuring cylinders BDH Laboratory EquipmentsPipettes BDH Laboratory EquipmentsAutomatic pipette puller Bel-Art Products, USA
4.1.2 Filter aids
1. Filter Paper (Whitman no. 1)
2. Normal Cotton
4.1.3 Equipments
Equipments SourceMechanical grinderOven MemmertSpatulaElectronic balance Denver Instruments M-220Refrigerator Rangs electronics
4.2 Solvents
MethanolPetroleum Ethern-HexaneChloroform
4.3 Collection and preparation of the plant material
Myristica fragrans seeds were collected from herbal shop in Khilgaon at Dhaka. The
seeds were washed properly and then air dried for several days. The pieces were then
Chapter 4: Preparation of Crude Extract And Partitioning
Page | 18
ground into coarse powder in the Phytochemical Research Laboratory, Pharmacy
Department, University of Dhaka, using high capacity grinding machine.
4.4 Extraction of the plant material
Preparation of the plant sample
The collected and identified Myristica fragrans seeds were dried in the sun. After
complete drying, the sample was reduced to coarse powder separately with the help of a
mechanical grinder and the powder was stored in a suitable container for extraction. The
dried grinded powder weighed by rough balance.
Extraction of the plant material by methanol
About 800 gm. of the powdered material was taken in a clean, round bottomed flask
(5 liters) and soaked in 2.5 liter of methanol. The container with its content was sealed by
foil and kept for a period of 15 days accompanying occasional shaking and stirring. The
whole mixture was then filtered through cloth filter and finally with a Whitman No.1 filter
paper. The volume of the filtrate was then reduced using Rota evaporator at low temperature
and pressure. The weight of the crude extract was 160 gm.
4.5 Yield determination
The dried extracts were weighed separately with the help of a digital balance and
their yield was determined by using the following formula:
Wt. of particular extract% Yield = ---------------------------------------------- x 100
Total amount of coarse powder
Total amount of coarse powder = 800 g
Weight of particular extract = 160 g
160Yield = ------------- X 100 = 20 %
800
4.6 Solvent-solvent partitioning
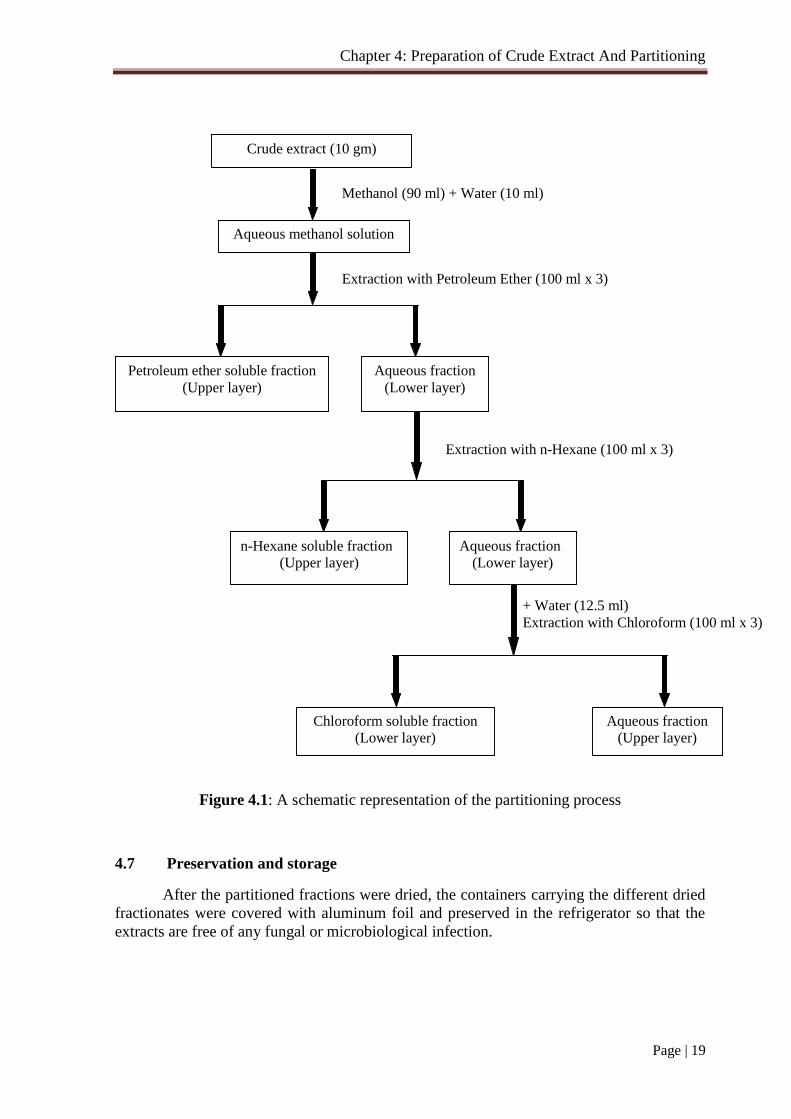
Solvent-solvent partitioning was done using the protocol designed by Kupchan(Beckett et al., 1986). and modified by Van Wagenen. The crude extract (10 gm) wasdissolved in 10% aqueous methanol. It was extracted with Petroleum Ether, then with n-Hexane and finally with Chloroform.
Chapter 4: Preparation of Crude Extract And Partitioning
Page | 19
Figure 4.1: A schematic representation of the partitioning process
4.7 Preservation and storage
After the partitioned fractions were dried, the containers carrying the different driedfractionates were covered with aluminum foil and preserved in the refrigerator so that theextracts are free of any fungal or microbiological infection.
Crude extract (10 gm)
Aqueous methanol solution
Methanol (90 ml) + Water (10 ml)
Aqueous fraction(Lower layer)
Extraction with Petroleum Ether (100 ml x 3)
Petroleum ether soluble fraction(Upper layer)
Aqueous fraction(Lower layer)
Extraction with n-Hexane (100 ml x 3)
n-Hexane soluble fraction(Upper layer)
Aqueous fraction(Upper layer)
Chloroform soluble fraction(Lower layer)
+ Water (12.5 ml)Extraction with Chloroform (100 ml x 3)
Chapter 4: Preparation of Crude Extract And Partitioning
Page | 20
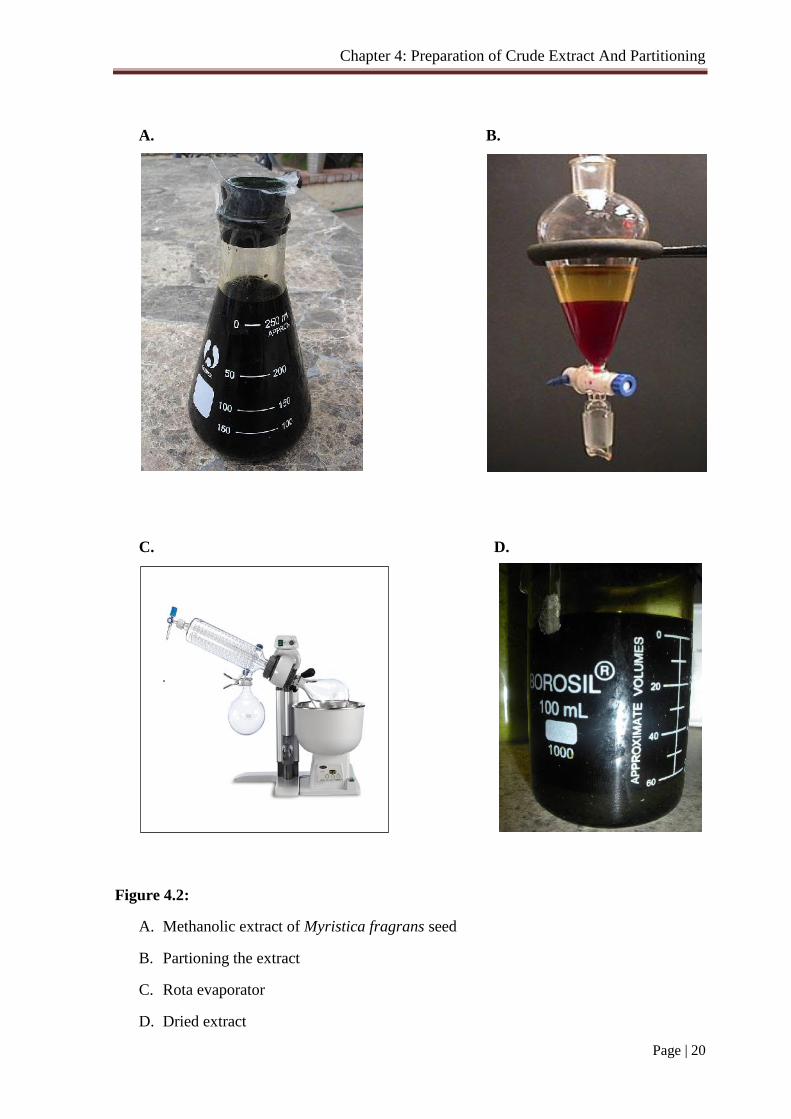
A. B.
C. D.
Figure 4.2:
A. Methanolic extract of Myristica fragrans seed
B. Partioning the extract
C. Rota evaporator
D. Dried extract
Chapter 5: Phytochemical Screening
Page | 21
5.1Phytochemical screening
The Phytochemical investigation or screening is a process for the detection andevaluation of plant constituents through chemical analysis; phytochemical screening is co-related with phytochemical study. The compounds isolated through phytochemical study areapplied on treated animal to find the pharmacological effects either beneficial or toxicmaterial separated from the plant parts (Journal of pharmaceutical science, 1966).
In this research work, methanol extracts and different fractions of Myristicafragransseeds were screened for carbohydrates, glycosides, saponins, flavonoids, tannins, steroids,alkaloids that have pronounced medicinal values.
5.2 Materials used for screening
5.2.1 Equipment
1. Test tube2. Watch glass3. Holder4. Burner5. Wood rack6. Glass rod
5.2.2 Reagents and chemicals
1. Molisch's reagents (l0% napthol in alcohol) - for carbohydrate test.2. Aqueous sodium hydroxide solution - for glycoside test.3. Dilute sulfuric acid and sodium hydroxide solution - for glycoside test.4. Fehling’s solution - for glycoside test.5. 10% ammonia solution - for anthraquinone glycoside test.6. Mayer's reagent (Potassium mercuric iodide solution) - for alkaloid tests.7. Wagner's reagent (Solution of Iodine in KI) - for alkaloid tests.8. Hagar's reagent (Saturated solution of picric acid) - for alkaloid tests.9. Dragendorff's reagent (Bismuth subnitrate and acetic acid solution) – foralkaloid
tests.10. Tannic acid solution ( l0%) - for alkaloid tests.11. Conc. Hydrochloric acid - For flavonoid test.12. Conc. Sulfuric acid - For steroid tests.13. FeCl3 (5%) - For tannin test.14. Solvents – Methanol, Petroleum ether, n-Hexane and Chloroform.
5.3 Test compounds
1. Methanol extract of Myristicafragransseeds.
2. Fractions of Petroleum ether, n-Hexane and Chloroform.

Chapter 5: Phytochemical Screening
Page | 22
5.4 Preparation of sample solution
Small amounts of dried extracts were appropriately treated to prepare samplesolution and then subjected to various phytochemical tests.
5.5 Phytochemical tests
Various phytochemical tests were performed for proper phytochemical screening.Those are mentioned below:
I. Molisch'stest for carbohydrates: Two drops of Molisch’s reagent were added to about5 mg of the extract in 5ml aqueous solution in a test tube. 1 ml of concentrate H2SO4
was allowed to flow down the side of the identical test tube so that the acid formed alayer beneath the aqueous solution without mixing it. A red ring was formed at thecommon surface of the two liquids; this indicated the presence of carbohydrate. Onstanding or shaking a solution was formed. Then the mixture was shaken and dilutedwith 5ml of distilled water. Dull violet precipitate was formed immediately.
II. Fehling's test: To 2 ml of extract of the equal volumes of Fehling’s solutions A and Bwere added. Boiled for few minutes. A red or brick red precipitate was developed. It isthe standard test for reducing sugars.
III. Barfoed'stest: 1 ml of extract of the plant material was taken in a test tube. 1ml ofBarfoed’s reagent was added and heated in a beaker of boiling water. Red ppt. ofcuprous oxide was formed within two minutes if a monosaccharide was present.
IV. Test for alkaloids: A small volume of each extract was neutralized by adding 1 or 2drops of dilute H2SO4 .This neutralized solution was treated with a very small amountof the following reagents and the respective color and / or precipitate formation wasobserved.
a) Mayer's reagent: Formation of white or cream color precipitate indicatedthe presence of alkaloids.
b) Wagner's reagent: Formation of brownish black ppt. indicated the presenceof alkaloids.
c) Hager's reagent: Formation of yellow crystalline ppt. indicates the presenceof alkaloids.
d) Dragendorff's reagent: Formation of orange or orange red ppt. indicates thepresence of alkaloids.
e) Tannic acid solution (10%): production of a dirty white or Blackish ppt.indicates the presence of alkaloids.
V. General test for glycosides: A small amount of extract was dissolved in 1ml of distilledwater, and then few drops of aqueous Sodium hydroxide solution were added. A yellowcolor was developed in the presence of glycosides.
Chapter 5: Phytochemical Screening
Page | 23
VI. Test for glucosides: A small amount of extract was dissolved in 1 ml of distilled waterand alcohol then boiled with Fehling's solution. Any brick red precipitation was noted.Another portion of the extract was dissolved in water and alcohol then boiled with afew drops of dilute sulfuric acid. The acid was neutralized with sodium hydroxidesolution and boiled with Fehling's solution. A brick red ppt. was produced in thisexperiment, which showed the presence of glucosides the extract.
VII. Borntrager'stest of anthraquinoneglycosides: 1 ml of sample solution was shakenwith 5ml of chloroform in a test tube for at least 5 minutes then again shaken with anequal volume of 10% ammonia solution. A bright pink, red or violet color wasdeveloped in the aqueous (upper) layer in the presence of free anthraquinones.
VIII.Test for saponins: About 0.5 ml of extract was shaken vigorously with water in a testtube. If a frothing was produced and it was stable for 1 - 2 minutes and persisted onwarming, it was taken as preliminary evidence for the saponin.
IX. Test for flavonoids: A few drops of conc. hydrochloric acid were added to smallamount of extract. Immediate development of a red color indicated the presence offlavonoids.
X. Test for steroids: A small amount of extract was added with 2 ml of chloroform andthen 1 ml of conc. sulfuric acid was carefully added from the side of the test tube. Inpresence of steroids, a reddish color was produced in chloroform layer.
XI. FeCl3 (5%) test for tannins: About 0.5 ml of extracts was stirred with 10 ml distilledwater. Production of a blue, blue-black, green or blue-green coloration or ppt. on theaddition of FeCl3 (5%) reagent was taken as evidence for the presence of tannins.
XII. Lead subacetatetest for tannins: 5 ml of sample solution of the plant material wastaken in a test tube and few drops of a 1% solution of lead subacetate were added. Ared or yellow ppt. was formed if tannin was present.
XIII. Biuret's test for proteins: To 1 ml of hot extract of the plant material 5-8 drops of10% sodium hydroxide solution and 1-2 drops of 3% copper sulfate solution wereadded. A red or violet color was present if a protein was present.
XIV. Saponification test for volatile oils, fixed oils and fats: 0.2 g of sample was takenin a test tube. 3 ml of 5% potassium hydroxide solution was added. The tube washeated in a boiling water bath, shaking at frequent Intervals, for at least 45 to 60minutes. A solution was formed, which on cooling becomes viscous, indicatingpositive saponification test for fixed oils. But formation of non-viscous emulsion wasindicating negative saponification test for volatile oils.
XV. Paper spot test for volatile oils and fixed oils: One drop of oil was taken on a filterpaper. Fixed oils form permanent staining upon the paper but volatile oils do notstain.
Chapter 5: Phytochemical Screening
Page | 24
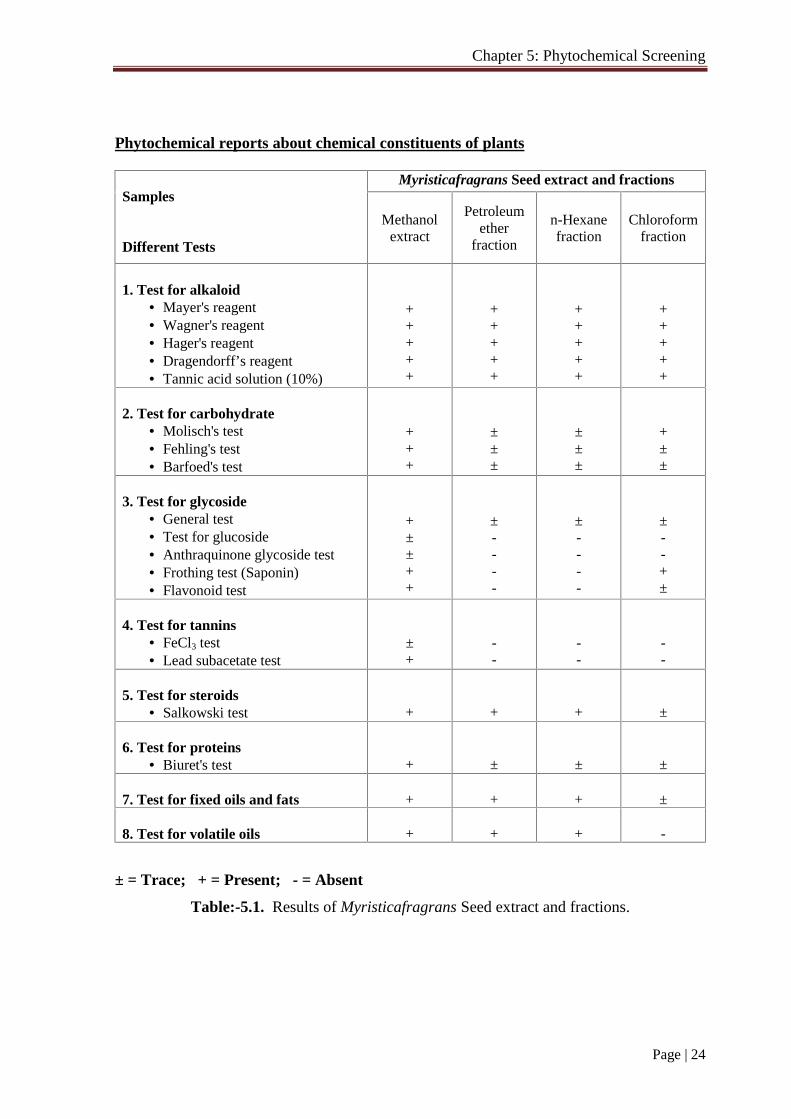
Phytochemical reports about chemical constituents of plants
Samples
Different Tests
Myristicafragrans Seed extract and fractions
Methanolextract
Petroleumether
fraction
n-Hexanefraction
Chloroformfraction
1. Test for alkaloid Mayer's reagent Wagner's reagent Hager's reagent Dragendorff’s reagent Tannic acid solution (10%)
+++++
+++++
+++++
+++++
2. Test for carbohydrate Molisch's test Fehling's test Barfoed's test
+++
±±±
±±±
+±±
3. Test for glycoside General test Test for glucoside Anthraquinone glycoside test Frothing test (Saponin) Flavonoid test
+±±++
±----
±----
±--+±
4. Test for tannins FeCl3 test Lead subacetate test
±+
--
--
--
5. Test for steroids Salkowski test + + + ±
6. Test for proteins Biuret's test + ± ± ±
7. Test for fixed oils and fats + + + ±
8. Test for volatile oils + + + -
± = Trace; + = Present; - = Absent
Table:-5.1. Results of Myristicafragrans Seed extract and fractions.
Chapter 6: Evaluation of Anti-oxidant Activity
Page | 25
6.1 Introduction
Free radicals occur oxidative damage to biomolecules and cause cancer, aging,visual impairments, neurodegenerative diseases, atherosclerosis and several otherpathological events in living organisms. Antioxidants which scavenge free radicals areknown to possess an important role in preventing these free radical induced diseases. Thereis an increasing interest in the antioxidants effects of compounds derived from plants, whichcould be relevant in relations to their nutritional incidence and their role in health anddiseases. A number of reports on the isolation and testing of plant derived antioxidants havebeen described during the past decade. Natural antioxidants constitute a broad range ofsubstances including phenolic or nitrogen containing compounds and carotenoids. Lipidperoxidation is one of the main reasons for deterioration of food products during processingand storage. Synthetic antioxidant such as Ascorbic acid, tert-butyl-1-hydroxytoluene(BHT), butylated hydroxyanisole (BHA), and propyl gallate (PG) are widely used as foodadditives and pharmaceuticals to increase shelf life, especially liquid and lipid containingproducts by retarding the process of oxidation. However, BHT and BHA are known to havenot only toxic and carcinogenic effects on humans, but abnormal effects on enzymesystems. Therefore, the interest in natural antioxidant, especially of plant origin, has greatlyincreased in recent years.
6.2 Principle
The free radical scavenging activities (antioxidant capacity) of the plant extracts onthe stable radical 1,1-diphenyl-2-picrylhydrazyl (DPPH) were estimated by the method ofBraca et al. (2001). 2.0 ml of a methanol solution of the extract at different concentrationwere mixed with 3.0 ml of a DPPH methanol solution (20 µg/ml). The antioxidant potentialwas assayed from the bleaching of purple colored methanol solution of DPPH radical by theextract as compared to that of tert-butyl-1-hydroxytoluene (BHT) and Ascorbic acid by UVspectrophotometer.
Figure 6.1: DPPH = 1,1-diphenyl-2-picrylhydrazyl

Chapter 6: Evaluation of Anti-oxidant Activity
Page | 26
6.3 Materials and methods
DPPH was used to evaluate the free radical scavenging activity (antioxidant
potential) of methanolic extract and various fractions of Myristica fragrans.
6.3.1 Materials
1) 1,1-diphenyl-2-picrylhydrazyl
2) Tert-butyl-1-hydroxytoluene
3) Distilled water
4) Methanol
5) UV-spectrophotometer
5) Beaker (100 ml and 200 ml)
6) Test tube
7) Light proof box
8) Pipette
9) Micropipette (50-200 µl)
10) Amber reagent bottle
6.3.2 Methods
2.0 ml of a methanol solution of the extract at different concentration (500 to 0.977 μg/ml)were mixed with 3.0 ml of a DPPH methanol solution (20 μg/ml).
After 30 min reaction period at room temperature in dark place the absorbance wasmeasured against at 517 nm against methanol as blank by UV spectrophotometer.
Inhibition free radical DPPH in percent (I %) was calculated as follows:
(I %) = (1 – Asample/Ablank) X 100
Where Ablank is the absorbance of the control reaction (containing all reagents exceptthe test material).
Extract concentration providing 50% inhibition (IC50) was calculated from the graphplotted inhibition percentage against extract concentration.
BHT and Ascorbic acid were used as positive control.
The entire procedure of the experiment is explained on figure 6.2 in the next page.

Chapter 6: Evaluation of Anti-oxidant Activity
Page | 27
+
Figure 6.2: Schematic representation of the method ofassaying free radical scavenging activity
DPPH in methanol-3.0 ml
(conc.- 20 μg/ml)
Purple color
Extract in methanol-2.0 ml
(conc.- 500 to 0.977 μg/ml)
Reaction allowed for 30
minutes in absence of light
at room temperature
Decolorization of
purple color of DPPH
Absorbance measured at
517 nm using methanol as
blank
Calculation of IC50 value from
the graph plotted inhibition
percentage against extract
concentration
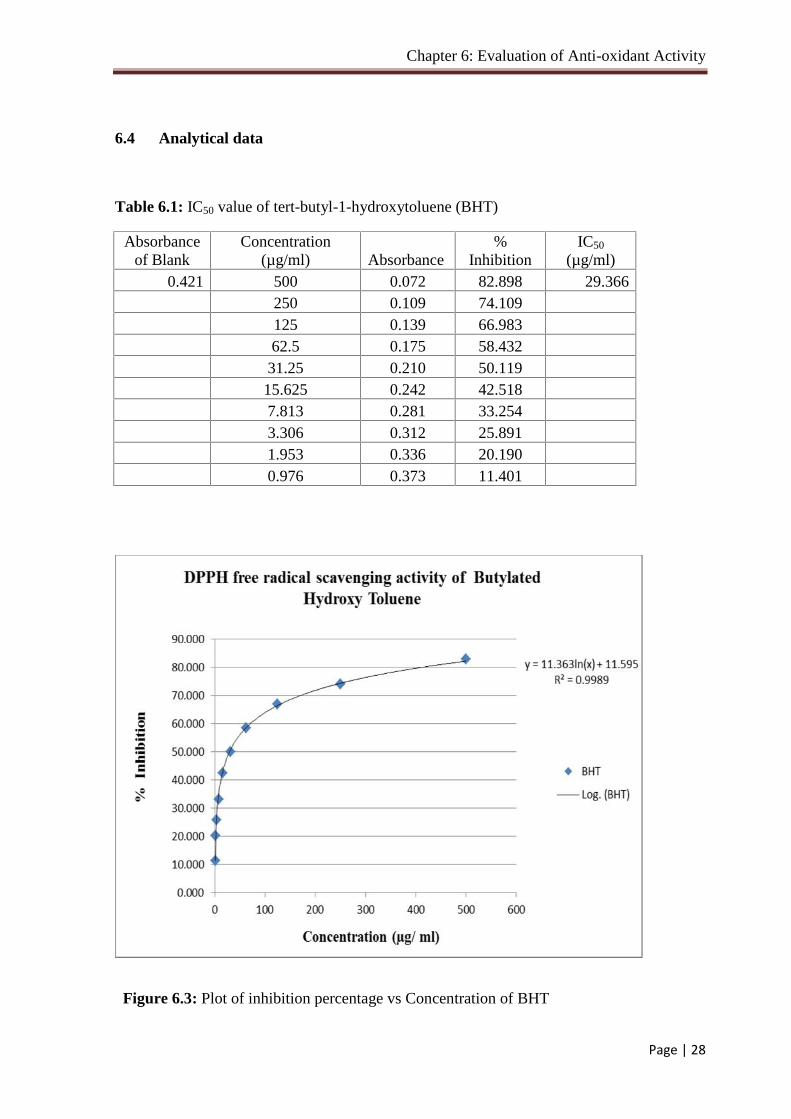
Chapter 6: Evaluation of Anti-oxidant Activity
Page | 28
6.4 Analytical data
Table 6.1: IC50 value of tert-butyl-1-hydroxytoluene (BHT)
Absorbanceof Blank
Concentration(µg/ml) Absorbance
%Inhibition
IC50
(µg/ml)0.421 500 0.072 82.898 29.366
250 0.109 74.109125 0.139 66.98362.5 0.175 58.43231.25 0.210 50.11915.625 0.242 42.5187.813 0.281 33.2543.306 0.312 25.8911.953 0.336 20.1900.976 0.373 11.401
Figure 6.3: Plot of inhibition percentage vs Concentration of BHT
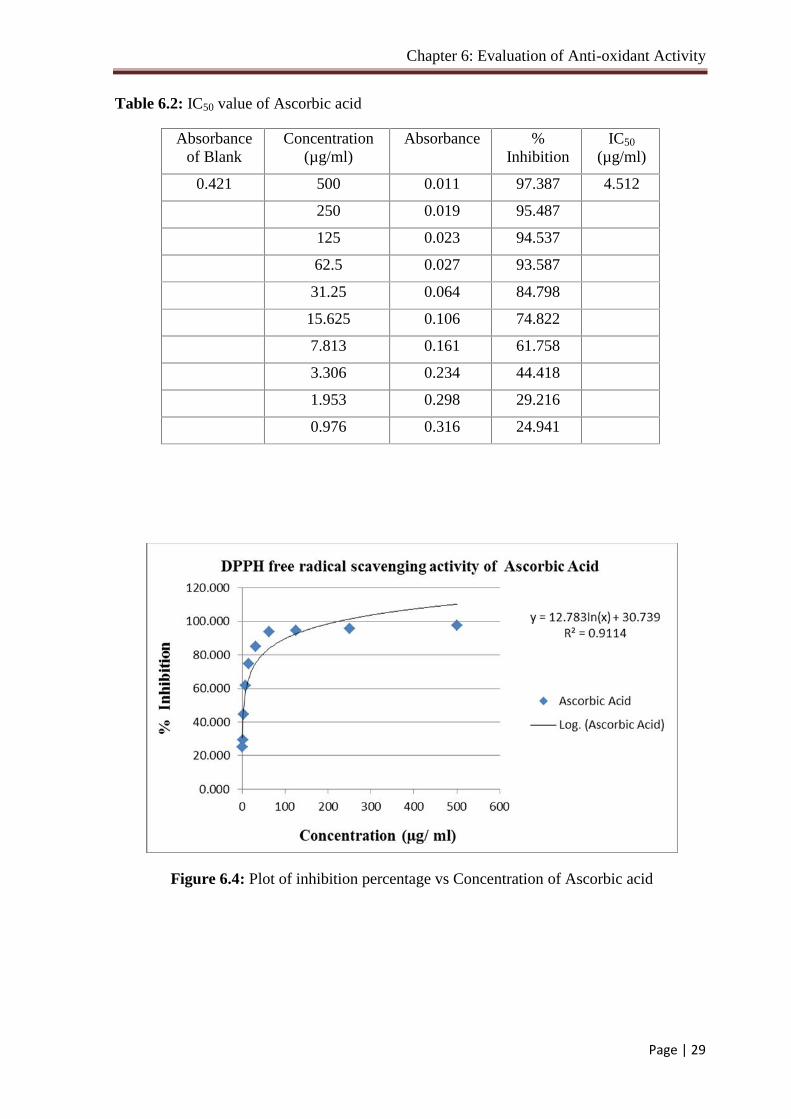
Chapter 6: Evaluation of Anti-oxidant Activity
Page | 29
Table 6.2: IC50 value of Ascorbic acid
Absorbanceof Blank
Concentration(µg/ml)
Absorbance %Inhibition
IC50
(µg/ml)
0.421 500 0.011 97.387 4.512
250 0.019 95.487
125 0.023 94.537
62.5 0.027 93.587
31.25 0.064 84.798
15.625 0.106 74.822
7.813 0.161 61.758
3.306 0.234 44.418
1.953 0.298 29.216
0.976 0.316 24.941
Figure 6.4: Plot of inhibition percentage vs Concentration of Ascorbic acid
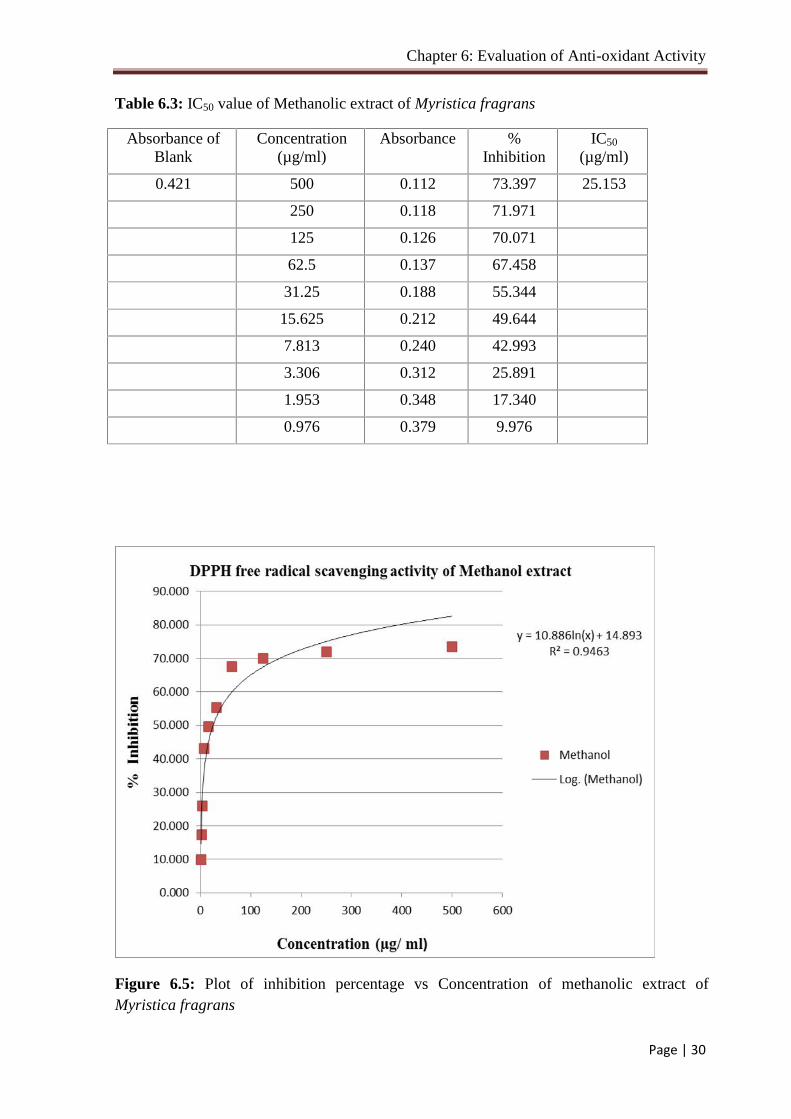
Chapter 6: Evaluation of Anti-oxidant Activity
Page | 30
Table 6.3: IC50 value of Methanolic extract of Myristica fragrans
Absorbance ofBlank
Concentration(µg/ml)
Absorbance %Inhibition
IC50
(µg/ml)
0.421 500 0.112 73.397 25.153
250 0.118 71.971
125 0.126 70.071
62.5 0.137 67.458
31.25 0.188 55.344
15.625 0.212 49.644
7.813 0.240 42.993
3.306 0.312 25.891
1.953 0.348 17.340
0.976 0.379 9.976
Figure 6.5: Plot of inhibition percentage vs Concentration of methanolic extract ofMyristica fragrans
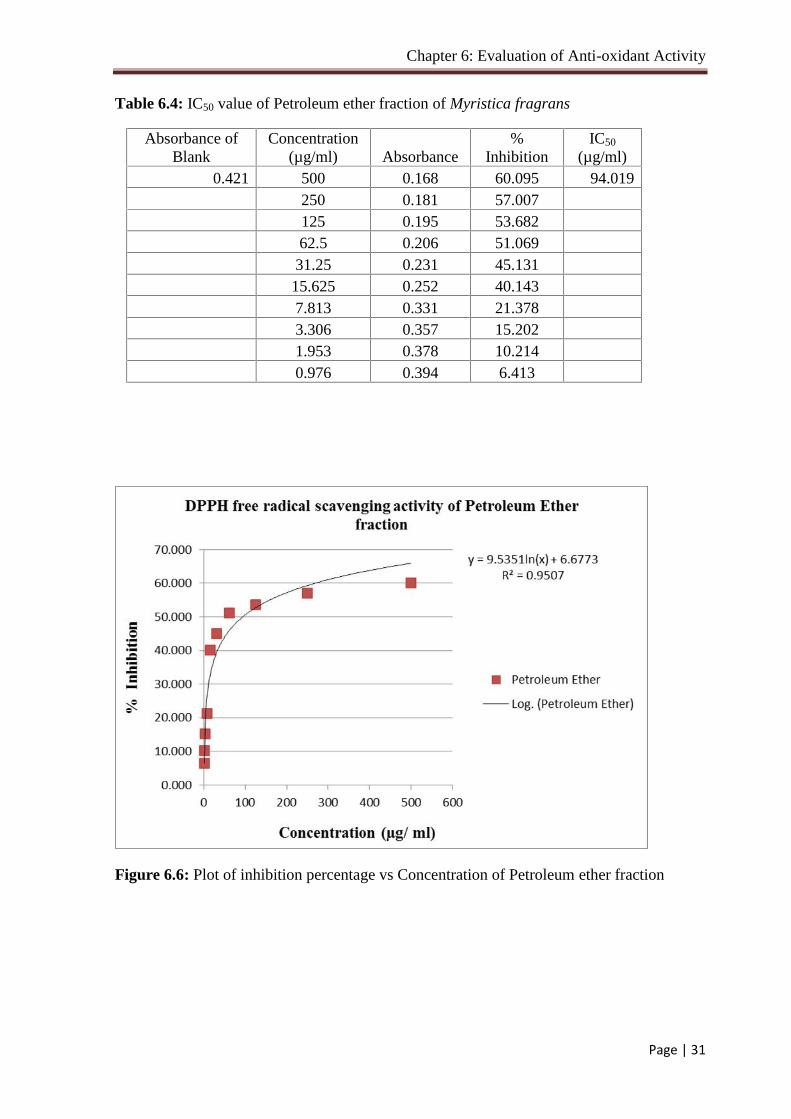
Chapter 6: Evaluation of Anti-oxidant Activity
Page | 31
Table 6.4: IC50 value of Petroleum ether fraction of Myristica fragrans
Absorbance ofBlank
Concentration(µg/ml) Absorbance
%Inhibition
IC50
(µg/ml)0.421 500 0.168 60.095 94.019
250 0.181 57.007125 0.195 53.68262.5 0.206 51.06931.25 0.231 45.13115.625 0.252 40.1437.813 0.331 21.3783.306 0.357 15.2021.953 0.378 10.2140.976 0.394 6.413
Figure 6.6: Plot of inhibition percentage vs Concentration of Petroleum ether fraction
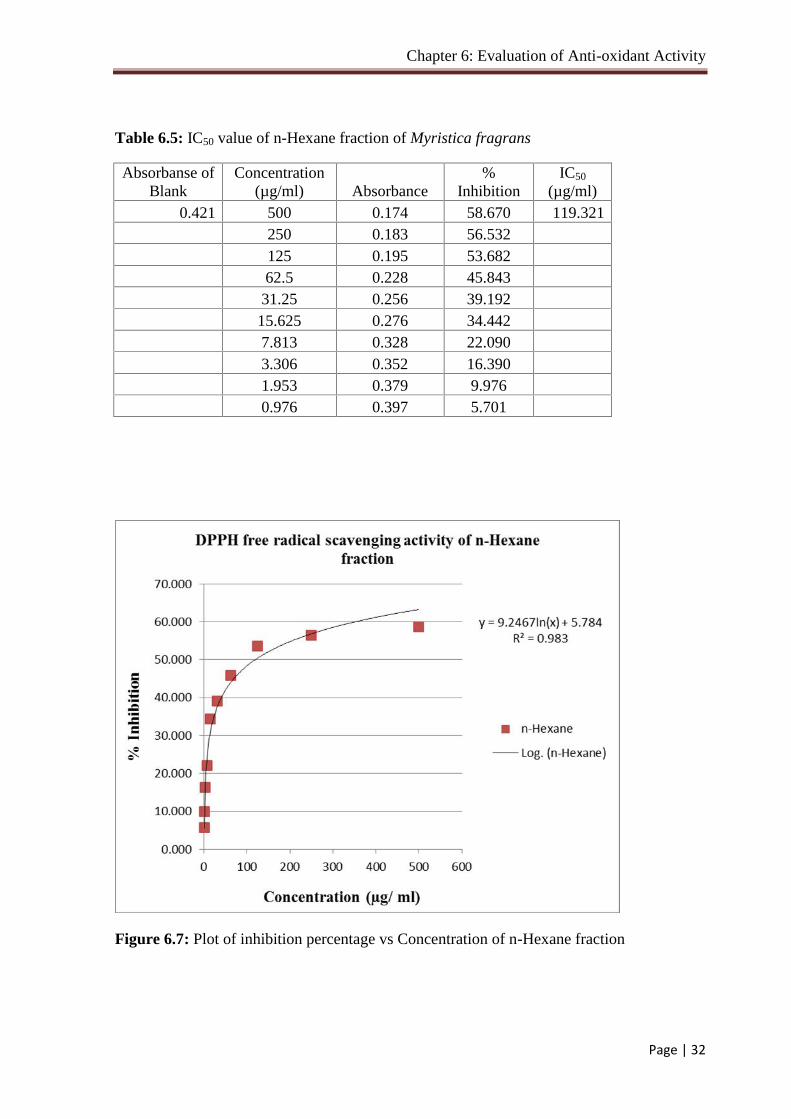
Chapter 6: Evaluation of Anti-oxidant Activity
Page | 32
Table 6.5: IC50 value of n-Hexane fraction of Myristica fragrans
Absorbanse ofBlank
Concentration(µg/ml) Absorbance
%Inhibition
IC50
(µg/ml)0.421 500 0.174 58.670 119.321
250 0.183 56.532125 0.195 53.68262.5 0.228 45.84331.25 0.256 39.19215.625 0.276 34.4427.813 0.328 22.0903.306 0.352 16.3901.953 0.379 9.9760.976 0.397 5.701
Figure 6.7: Plot of inhibition percentage vs Concentration of n-Hexane fraction
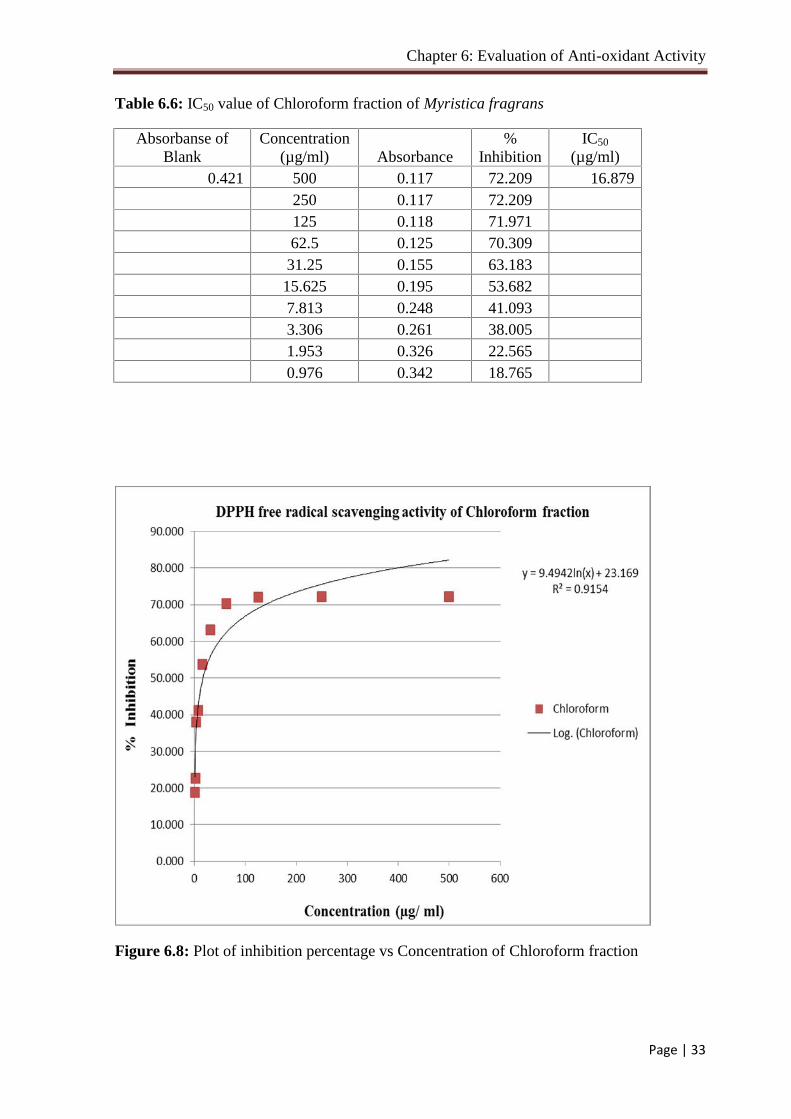
Chapter 6: Evaluation of Anti-oxidant Activity
Page | 33
Table 6.6: IC50 value of Chloroform fraction of Myristica fragrans
Absorbanse ofBlank
Concentration(µg/ml) Absorbance
%Inhibition
IC50
(µg/ml)0.421 500 0.117 72.209 16.879
250 0.117 72.209125 0.118 71.97162.5 0.125 70.30931.25 0.155 63.18315.625 0.195 53.6827.813 0.248 41.0933.306 0.261 38.0051.953 0.326 22.5650.976 0.342 18.765
Figure 6.8: Plot of inhibition percentage vs Concentration of Chloroform fraction
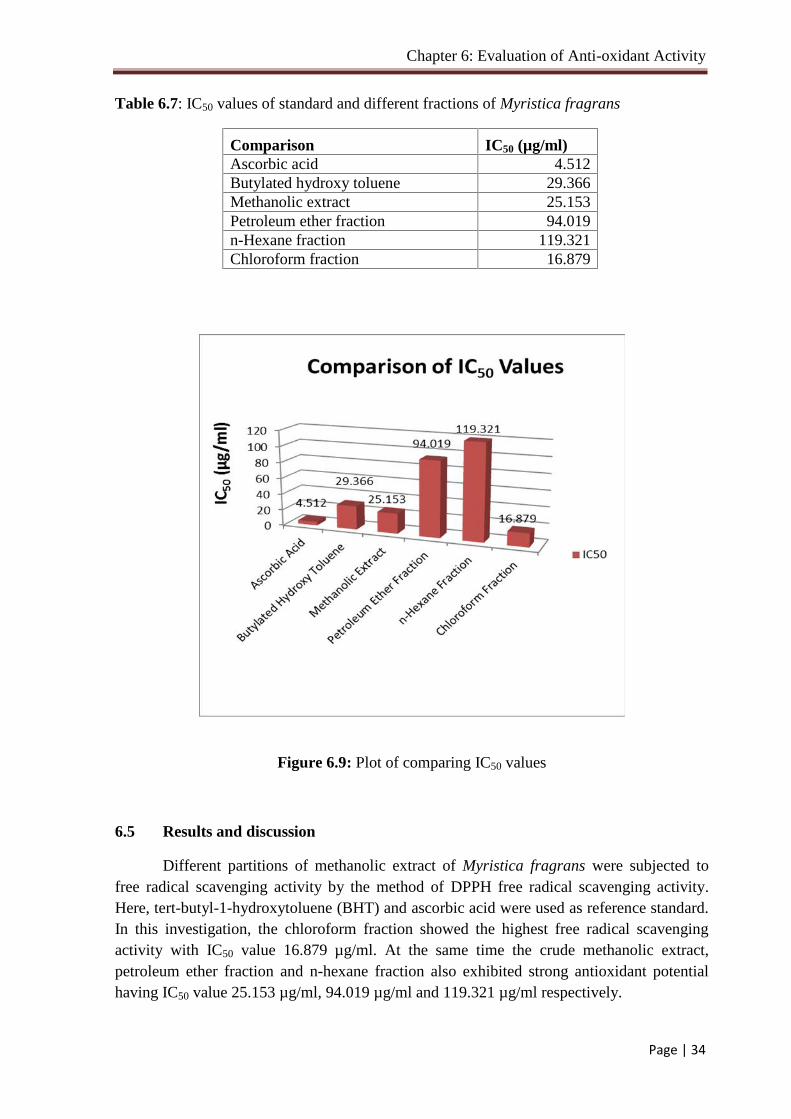
Chapter 6: Evaluation of Anti-oxidant Activity
Page | 34
Table 6.7: IC50 values of standard and different fractions of Myristica fragrans
Comparison IC50 (µg/ml)Ascorbic acid 4.512Butylated hydroxy toluene 29.366Methanolic extract 25.153Petroleum ether fraction 94.019n-Hexane fraction 119.321Chloroform fraction 16.879
Figure 6.9: Plot of comparing IC50 values
6.5 Results and discussion
Different partitions of methanolic extract of Myristica fragrans were subjected tofree radical scavenging activity by the method of DPPH free radical scavenging activity.Here, tert-butyl-1-hydroxytoluene (BHT) and ascorbic acid were used as reference standard.In this investigation, the chloroform fraction showed the highest free radical scavengingactivity with IC50 value 16.879 µg/ml. At the same time the crude methanolic extract,petroleum ether fraction and n-hexane fraction also exhibited strong antioxidant potentialhaving IC50 value 25.153 µg/ml, 94.019 µg/ml and 119.321 µg/ml respectively.
Chapter 7: Brine Shrimp Lethality Bioassay
Page | 35
7.1 Objective of brine shrimp lethality bioassay
Bioactive compounds are always toxic to living body at some higher doses and itjustifies the statement that ‘Pharmacology is simply toxicology at some lower doses andtoxicology is simply pharmacology at some higher doses.’ Brine Shrimp Lethality Bioassay(Meyer et al., 1982) is a rapid and comprehensive bioassay for the bioactive compounds ofnatural and synthetic origin. By this method, natural product extracts, fractions as well aspure compounds can be tested for their bioactivity. In this method, in vivo lethality in asimple zoological organism (Brine shrimp nauplii) is used as a favorable monitor forscreening and fractionation in the discovery of new bioactive natural products. Thisbioassay indicates cytotoxicity as well as a wide range of pharmacological activities such asantimicrobial, antiviral, pesticidal and anti-tumor etc. of the compounds (Meyer et al.,1982).
Brine Shrimp Lethality Bioassay technique stands superior to other cytotoxicitytesting procedures because it is rapid in process, inexpensive and requires no specialequipment or aseptic technique. It utilizes a large numbers of organisms for statisticalvalidation and a relatively small amount of sample. Furthermore, unlike other methods, itdoes not require animal serum.
7.2 Principle
Brine shrimp eggs are hatched in simulated sea water to get nauplii. By the additionof calculated amount of Dimethyl sulfoxide (DMSO), desired concentrations of the testsample is prepared. The nauplii are counted by visual inspection and are taken in vialscontaining 5 ml of simulated sea water. Then samples of different concentrations are addedto pre-marked vials using micropipettes. Then the vials are left for 24 hour. Survivors arecounted after 24 hours. These data are processed in Microsoft Excel to estimate LC50
values.
7.3 Materials
Artemia salina leach (brine shrimp eggs) Sea salt (NaCl) Small tank with perforated dividing dam to hatch the shrimp Lamp to attract shrimps Pipettes, Micropipette Glass vials Test samples of experimental plants
Table 7.1: Test samples for the experiment
Code no. Test sample Amount (mg)1 Crude methanolic extract of Myristica fragrans 4 mg2 Petroleum ether fraction of Myristica fragrans 4 mg3 n-Hexane fraction of Myristica fragrans 4 mg4 Chloroform fraction of Myristica fragrans 4 mg
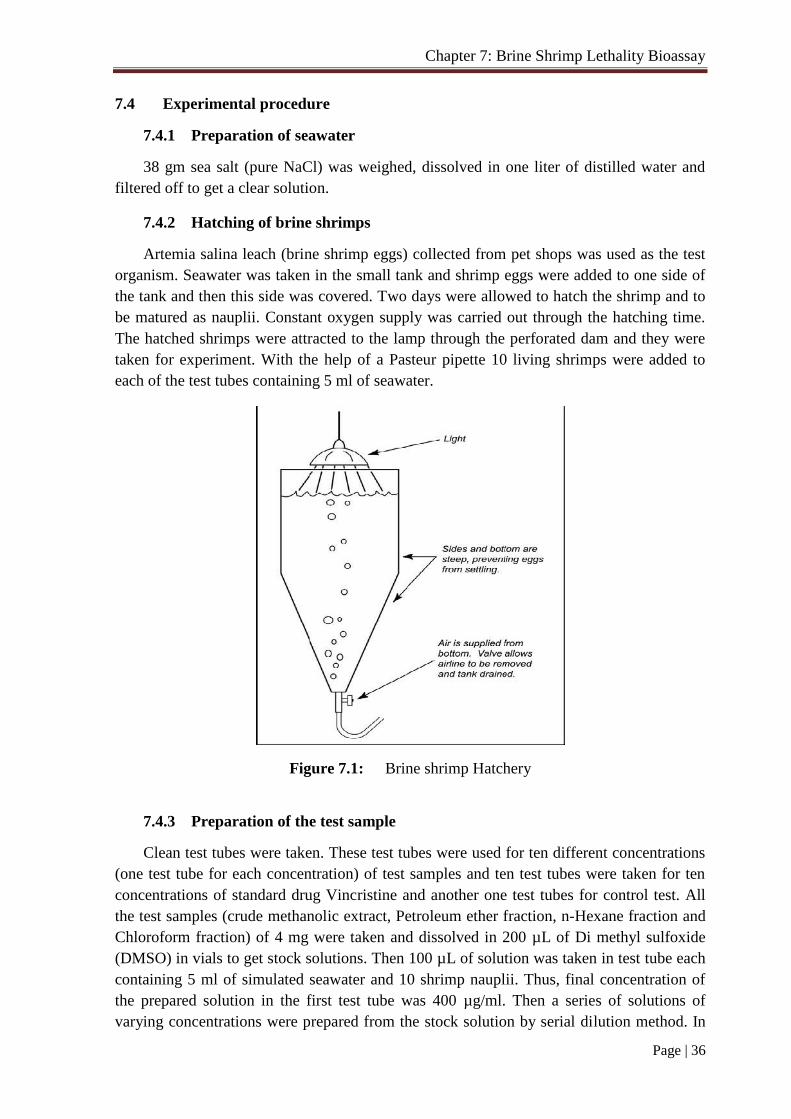
Chapter 7: Brine Shrimp Lethality Bioassay
Page | 36
7.4 Experimental procedure
7.4.1 Preparation of seawater
38 gm sea salt (pure NaCl) was weighed, dissolved in one liter of distilled water andfiltered off to get a clear solution.
7.4.2 Hatching of brine shrimps
Artemia salina leach (brine shrimp eggs) collected from pet shops was used as the testorganism. Seawater was taken in the small tank and shrimp eggs were added to one side ofthe tank and then this side was covered. Two days were allowed to hatch the shrimp and tobe matured as nauplii. Constant oxygen supply was carried out through the hatching time.The hatched shrimps were attracted to the lamp through the perforated dam and they weretaken for experiment. With the help of a Pasteur pipette 10 living shrimps were added toeach of the test tubes containing 5 ml of seawater.
Figure 7.1: Brine shrimp Hatchery
7.4.3 Preparation of the test sample
Clean test tubes were taken. These test tubes were used for ten different concentrations(one test tube for each concentration) of test samples and ten test tubes were taken for tenconcentrations of standard drug Vincristine and another one test tubes for control test. Allthe test samples (crude methanolic extract, Petroleum ether fraction, n-Hexane fraction andChloroform fraction) of 4 mg were taken and dissolved in 200 µL of Di methyl sulfoxide(DMSO) in vials to get stock solutions. Then 100 µL of solution was taken in test tube eachcontaining 5 ml of simulated seawater and 10 shrimp nauplii. Thus, final concentration ofthe prepared solution in the first test tube was 400 µg/ml. Then a series of solutions ofvarying concentrations were prepared from the stock solution by serial dilution method. In
Chapter 7: Brine Shrimp Lethality Bioassay
Page | 37
each case 100 µL sample was added to test tube and fresh 100 µL DMSO was added to vial.Thus different concentrations were found in the different test tubes.
Table 7.2: Test sample concentration after dilution
Test tube Concentration (µg/ml) Test tube Concentration (µg/ml)
1
2
3
4
5
400
200
100
50
25
6
7
8
9
10
12.5
6.25
3.125
1.563
0.781
7.4.4 Preparation of the positive control group
Positive control in a cytotoxicity study is a widely accepted cytotoxic agent and theresult of the test agent is compared with the result obtained for the positive control. In thepresent study Vincristine sulphate used as the positive control. Measured amount of theVincristine sulphate dissolved in DMSO to get an initial concentration of 400 µg/ml fromwhich serial dilutions made using DMSO. Then the positive control solutions added to thepre marked vials containing ten living brine shrimp nauplii in 5 ml simulated sea water toget the positive control groups.
7.4.5 Preparation of the negative control
100 µL of DMSO was added to each of four pre marked glass vials containing 5 mlof simulated sea water and 10 shrimp nauplii to use as control groups. If the brine shrimpsin these vials show a rapid mortality rate, then the test is considered as invalid as the naupliidied due to some reason other than the cytotoxicity of the compounds.
7.4.6 Counting of nauplii
After 24 hours, the vials were inspected using a magnifying glass and the number ofsurvivors were counted. The percent (%) mortality was calculated for each dilution. Theconcentration- mortality data were analyzed statistically by using Microsoft Excel program.The effectiveness or the concentration mortality relationship of plant product is usuallyexpressed as a median lethal concentration (LC50) value. This represents the concentrationof the chemical that produces death in half of the test subjects after a certain exposureperiod.

Chapter 7: Brine Shrimp Lethality Bioassay
Page | 38
7.5 Analytical data
Table 7.3: Effect of Vincristine Sulphate (Positive Control) on Shrimp nauplii
Concentration Log C Alive Death % Mortality LC 50 (µg/ ml)400 2.602 0 10 100 0.510
200 2.301 0 10 100
100 2.000 0 10 100
50 1.699 0 10 100
25 1.398 0 10 100
12.5 1.097 0 10 100
6.25 0.796 0 10 100
3.125 0.495 2 8 80
1.5625 0.194 3 7 70
0.78125 -0.107 4 6 60
Figure 7.2: % Mortality vs. Log C for Vincristine sulfate
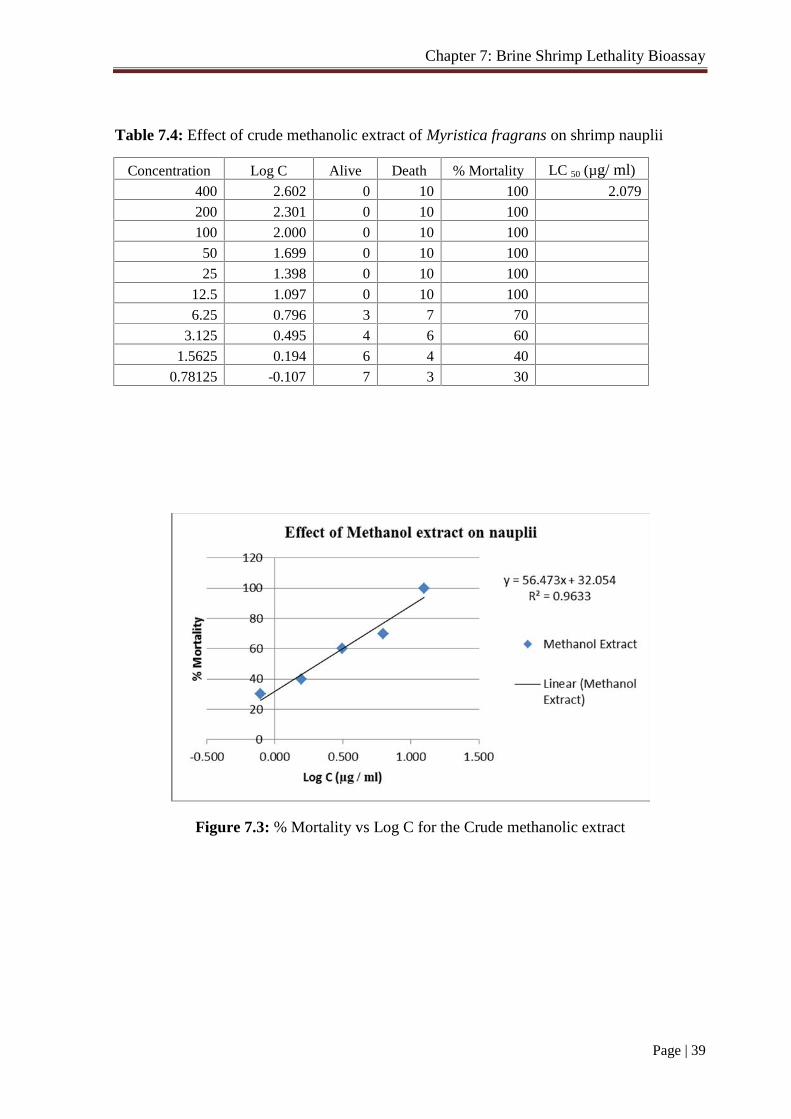
Chapter 7: Brine Shrimp Lethality Bioassay
Page | 39
Table 7.4: Effect of crude methanolic extract of Myristica fragrans on shrimp nauplii
Concentration Log C Alive Death % Mortality LC 50 (µg/ ml)400 2.602 0 10 100 2.079
200 2.301 0 10 100
100 2.000 0 10 100
50 1.699 0 10 100
25 1.398 0 10 100
12.5 1.097 0 10 100
6.25 0.796 3 7 70
3.125 0.495 4 6 60
1.5625 0.194 6 4 40
0.78125 -0.107 7 3 30
Figure 7.3: % Mortality vs Log C for the Crude methanolic extract

Chapter 7: Brine Shrimp Lethality Bioassay
Page | 40
Table 7.5: Effect of Petroleum Ether fraction of Myristica fragrans on shrimp nauplii
Concentration Log C Alive Death % Mortality LC 50 (µg/ ml)400 2.602 0 10 100 0.098
200 2.301 0 10 100
100 2.000 0 10 100
50 1.699 0 10 100
25 1.398 0 10 100
12.5 1.097 0 10 100
6.25 0.796 0 10 100
3.125 0.495 0 10 100
1.5625 0.194 1 9 90
0.78125 -0.107 2 8 80
Figure 7.4: % Mortality vs Log C for the Petroleum ether fraction
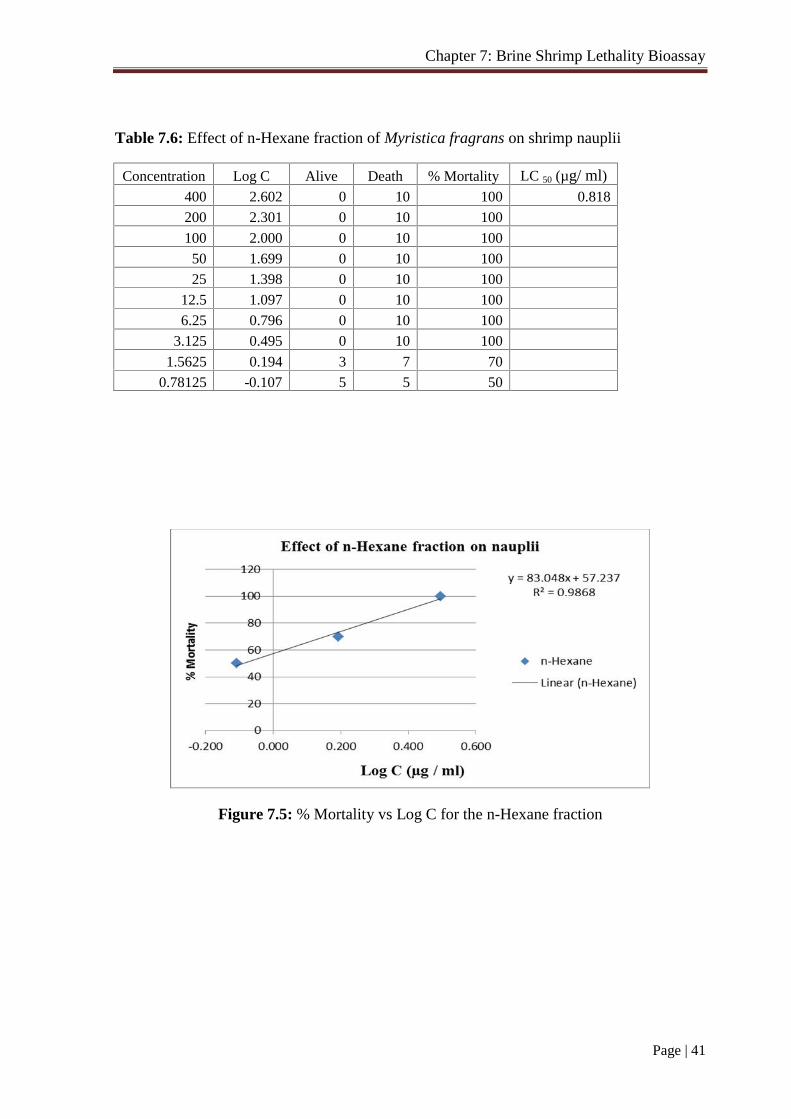
Chapter 7: Brine Shrimp Lethality Bioassay
Page | 41
Table 7.6: Effect of n-Hexane fraction of Myristica fragrans on shrimp nauplii
Concentration Log C Alive Death % Mortality LC 50 (µg/ ml)400 2.602 0 10 100 0.818
200 2.301 0 10 100
100 2.000 0 10 100
50 1.699 0 10 100
25 1.398 0 10 100
12.5 1.097 0 10 100
6.25 0.796 0 10 100
3.125 0.495 0 10 100
1.5625 0.194 3 7 70
0.78125 -0.107 5 5 50
Figure 7.5: % Mortality vs Log C for the n-Hexane fraction
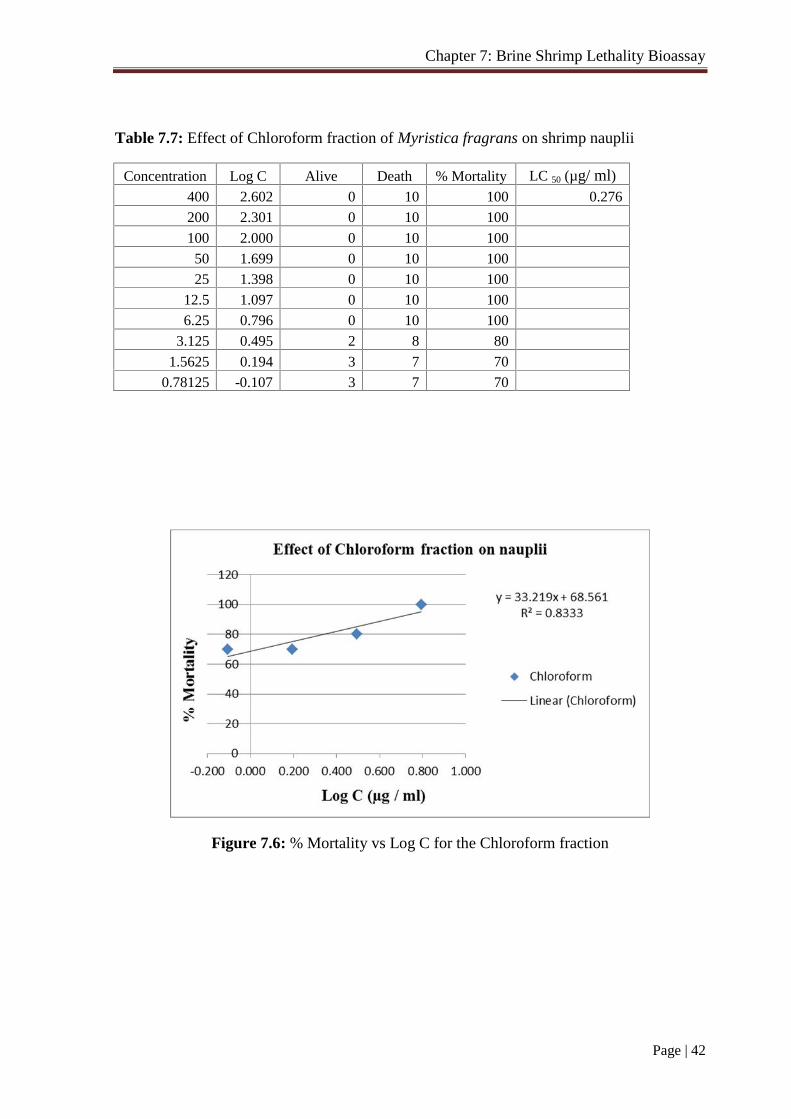
Chapter 7: Brine Shrimp Lethality Bioassay
Page | 42
Table 7.7: Effect of Chloroform fraction of Myristica fragrans on shrimp nauplii
Concentration Log C Alive Death % Mortality LC 50 (µg/ ml)400 2.602 0 10 100 0.276
200 2.301 0 10 100
100 2.000 0 10 100
50 1.699 0 10 100
25 1.398 0 10 100
12.5 1.097 0 10 100
6.25 0.796 0 10 100
3.125 0.495 2 8 80
1.5625 0.194 3 7 70
0.78125 -0.107 3 7 70
Figure 7.6: % Mortality vs Log C for the Chloroform fraction

Chapter 7: Brine Shrimp Lethality Bioassay
Page | 43
Table 7.8: A brief overview of the cytotoxic activity of the different fractions of Methanolicextract of Myristica fragrans
Figure 7.7: Comparison of LC50 values of the Test samples
7.6 Results and discussion
The different extracts of Myristica fragrans were subjected to brine shrimp lethalitybioassay following the procedure of Meyer et al, (1982). The lethal concentration (LC50) ofthe test samples after 24 hours was obtained by a plot of percentage of the shrimps diedagainst the logarithm of the sample concentration (toxicant concentration) and the best fitline was obtained from the curve data by means of regression analysis. Vincristine sulphate(VS) was used as positive control and the LC50 was found as 0.510 µg/ml. Comparing withthe positive control, test samples gave significant mortality and the LC50 values of thedifferent fractions were significant. The crude methanolic extract, petroleum ether fraction,n-hexane fraction and chloroform fraction showed cytotoxic activity and LC50 wererespectively 2.079 µg/ml, 0.098 µg/ml, 0.818 µg/ml and 0.276 µg/ml. Petroleum ether andchloroform fractions have more cytotoxic property than Vincristine sulphate.
Test Samples LC 50 (µg/ ml)Vincristine sulphate 0.510Methanol extract 2.079Petroleum ether fraction 0.098n-Hexane fraction 0.818Chloroform fraction 0.276
Chapter 8: Antimicrobial Screening by Disc Diffusion Method
Page | 44
8.1 Introduction
Infectious disease is one of main causes of death accounting for approximately one-half of all deaths in tropical countries. Perhaps it is not surprising to see these statistics thatthe infectious disease mortality rates are actually increasing in developing countries, such asBangladesh. This is alarming and it was once believed that we would eliminate infectiousdisease by the end of the millennium. The increases are attributed to increases in differentinfectious diseases. Other contributing factors are an increase in antibiotic resistance innosocomial and community acquired infections. Furthermore, the most dramatic increasesare occurring in the 25–45 year old age group.
These negative health trends call for a renewed interest in infectious disease in themedical and public health communities and renewed strategies on treatment and prevention.It is the last solution that would encompass the development of new antimicrobials.
The antimicrobial screening which is the first stage of antimicrobial drug research isperformed to ascertain the susceptibility of various fungi and bacteria to any agent. This testmeasures the ability of each test sample to inhibit the in vitro fungal and bacterial growth.This ability may be estimated by any of the following three methods.
i) Disc diffusion methodii) Serial dilution methodiii) Bioautographic method
But there is no standardized method for expressing the results of antimicrobialScreening. Some investigators use the diameter of zone of inhibition and/or the minimumweight of extract to inhibit the growth of microorganisms. However, a great number offactors viz., the extraction methods, inoculum volume, culture medium composition, pH,and incubation temperature can influence the results. Among the above mentionedtechniques the disc diffusion is a widely accepted in vitro investigation for preliminaryscreening of test agents which may possess antimicrobial activity (Bauer et al., 1966). It isessentially a quantitative or qualitative test indicating the sensitivity or resistance of themicroorganisms to the test materials.
8.2 Principle of disc diffusion method
In this classical method, antibiotics diffuse from a confined source through thenutrient agar gel and create a concentration gradient. Dried and sterilized filter paper discs (6mm diameter) containing the test samples of known amounts are placed on nutrient agarmedium uniformly seeded with the test microorganisms. Standard antibiotic (Ciprofloxacin)discs and blank discs are used as positive and negative control. These plates are kept at lowtemperature (4°C) for 24 hours to allow maximum diffusion of the test materials to thesurrounding media (Barry, 1976). The plates are then inverted and incubated at 37°C for 24hours for optimum growth of the organisms. The test materials having antimicrobialproperty inhibit microbial growth in the media surrounding the discs and thereby yield aclear, distinct area defined as zone of inhibition. The antimicrobial activity of the test agent
Chapter 8: Antimicrobial Screening by Disc Diffusion Method
Page | 45
is then determined by measuring the diameter of zone of inhibition expressed in millimeter(Barry, 1976).
In the present study the crude extracts as well as fractions were tested forantimicrobial activity by disc diffusion method. The experiment is carried out more thanonce and the mean of the readings is required (Bauer et al., 1966).
8.3 Materials and methods
8.3.1 Apparatus and reagents
Refrigerator
Incubator
Laminar air flow hood
Autoclave
Spirit burner
Inoculating loop
Petridishes
Screw cap test tubes
Sterile forceps
Nose mask, Hand gloves
Filter paper discs
Nutrient agar medium
Sterile cotton
Micropipette
Chloroform
Ethanol
8.3.2 Test organisms
A variety of microbiological organisms were used for the experiment. Theseincluded both gram positive and gram negative bacteria and also fungi. In fact five strains ofgram positive bacteria, eight strains of gram-negative bacteria and three strains of fungi wasused for the experiment. The strains used for the experiment must be of pure culture.Otherwise the validity of the experiment will be under question. The bacterial and fungalstrains used for the experiment were collected as pure cultures from the Institute of Nutritionand Food Science (INFS), University of Dhaka. The gram-positive, gram negative bacteriaand the fungal strains used for the experiment are listed down in the table no 8.1.
Table 8.1: List of gram positive, gram negative bacteria and fungi
Gram positive bacteria Gram negative Bacteria Fungi1. Bacillus cereus2. Bacillus megaterium3. Bacillus subtilis4. Sarcina lutea5. Staphylococcus aureus
1. Escherichia coli2. Pseudomonas aeruginosa3. Salmonella paratyphi4. Salmonella typhi5. Shigella boydii6. Shigella dysenteriae7. Vibrio mimicus8. Vibrio parahemolyticus
1. Aspergillus niger2. Sacharomyces cerevacae3. Candida albicans
Chapter 8: Antimicrobial Screening by Disc Diffusion Method
Page | 46
Table 8.2: Test samples for the experiment
Code no. Test sample Amount (mg)1 Crude methanolic extract of Myristica fragrans 8 mg2 Petroleum ether fraction of Myristica fragrans 8 mg3 n-Hexane fraction of Myristica fragrans 8 mg4 Chloroform fraction of Myristica fragrans 8 mg
8.3.3 Composition of culture medium
Nutrient agar medium (DIFCO) was used in the present study for testing thesensitivity of the organisms to the test materials and to prepare fresh cultures.
Composition of nutrient agar medium (pH 7.2 -7.6 at 25º C)
Ingredients AmountBacto peptone
Sodium chlorideBacto yeast extract
Bacto agarDistilled water
0.5 gm0.5 gm1.0 gm2.0 gm
q.s. - 100 ml
8.3.4 Preparation of the medium
To prepare required volume of this medium, calculated amount of each of theconstituents was taken in a conical flask and distilled water was added to it to make therequired volume. The contents were heated in a water bath to make a clear solution. The pH(at 25º C) was adjusted at 7.2-7.6 using NaOH or HCl. 10 ml and 5 ml of the medium wasthen transferred in screw cap test tubes to prepare plates and slants respectively. The testtubes were then capped and sterilized by autoclaving at 15-lbs. pressure at 121º C for 20minutes. The slants were used for making fresh culture of bacteria and fungi that were inturn used for sensitivity study.
8.3.5 Sterilization procedure
In order to avoid any type of contamination and cross contamination by the testorganisms the antimicrobial screening was done in Laminar Hood and all types ofprecautions were highly maintained. UV light was switched on one hour before working inthe Laminar Hood. Petridishes and other glassware were sterilized by autoclaving at atemperature of 121º C and a pressure of 15 lbs/sq. inch for 20 minutes. Micropipette tips,cotton, forceps, blank discs etc. were also sterilized by UV light.
Chapter 8: Antimicrobial Screening by Disc Diffusion Method
Page | 47
8.3.6 Preparation of subculture
In an aseptic condition under laminar air cabinet, the test organisms were transferredfrom the pure cultures to the agar slants with the help of a transfer loop to have fresh purecultures. The inoculated strains were then incubated for 24 hours at 37º C for their optimumgrowth. These fresh cultures were used for the sensitivity test.
8.3.7 Preparation of the test plate
The test organisms were transferred from the subculture to the test tubes containingabout 10 ml of melted and sterilized agar medium with the help of a sterilized transfer loopin an aseptic area. The test tubes were shaken by rotation to get a uniform suspension of theorganisms. The bacterial and fungal suspension was immediately transferred to the sterilizedpetridishes. The petridishes were rotated several times clockwise and anticlockwise to assurehomogenous distribution of the test organisms in the media.
8.3.8 Preparation of discs
Measured amount of each test sample (specified in table 8.3) was dissolved inspecific volume of solvent (Chloroform or methanol) to obtain the desired concentrations inan aseptic condition. Sterilized metrical (BBL, Cocksville, USA) filter paper discs weretaken in a blank petridish under the laminar hood. Then discs were soaked with solutions oftest samples and dried.
Table 8.3: Preparation of sample discs
Test samples Dose (µg/disc) Total amount (mg)Crude methanolic extracts 400 8.0Petroleum ether fraction 400 8.0
n-Hexane fraction 400 8.0
Chloroform fraction 400 8.0
Standard Ciprofloxacin (5 Pg/disc) discs were used as positive control to ensure theactivity of standard antibiotic against the test organisms as well as for comparison of theresponse produced by the known antimicrobial agent with that of produced by the testsample. Blank discs were used as negative controls which ensure that the residual solvents(left over the discs even after air-drying) and the filter paper were not active themselves.
8.3.9 Diffusion and incubation
The sample discs, the standard antibiotic discs and the control discs were placedgently on the previously marked zones in the agar plates pre-inoculated with test bacteriaand fungi. The plates were then kept in a refrigerator at 4º C for about 24 hours upside downto allow sufficient diffusion of the materials from the discs to the surrounding agar medium.The plates were then inverted and kept in an incubator at 37º C for 24 hours.
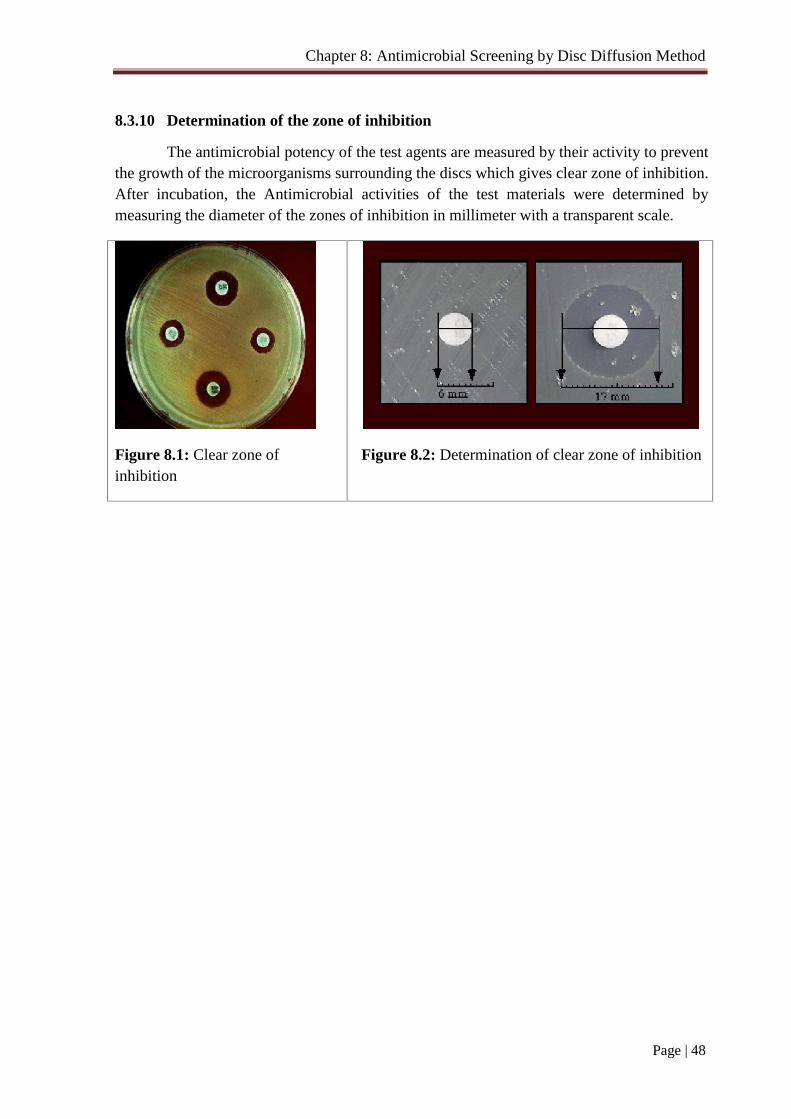
Chapter 8: Antimicrobial Screening by Disc Diffusion Method
Page | 48
8.3.10 Determination of the zone of inhibition
The antimicrobial potency of the test agents are measured by their activity to preventthe growth of the microorganisms surrounding the discs which gives clear zone of inhibition.After incubation, the Antimicrobial activities of the test materials were determined bymeasuring the diameter of the zones of inhibition in millimeter with a transparent scale.
Figure 8.1: Clear zone ofinhibition
Figure 8.2: Determination of clear zone of inhibition
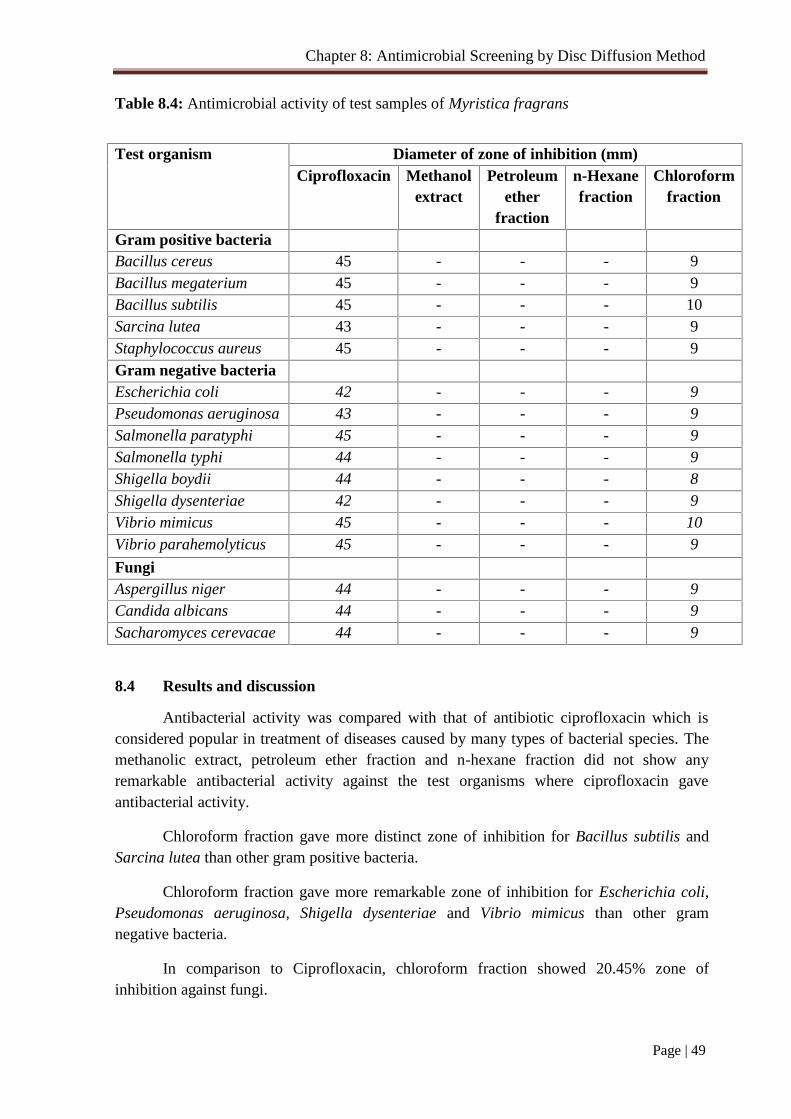
Chapter 8: Antimicrobial Screening by Disc Diffusion Method
Page | 49
Table 8.4: Antimicrobial activity of test samples of Myristica fragrans
Test organism Diameter of zone of inhibition (mm)Ciprofloxacin Methanol
extractPetroleum
etherfraction
n-Hexanefraction
Chloroformfraction
Gram positive bacteriaBacillus cereus 45 - - - 9Bacillus megaterium 45 - - - 9Bacillus subtilis 45 - - - 10Sarcina lutea 43 - - - 9Staphylococcus aureus 45 - - - 9Gram negative bacteriaEscherichia coli 42 - - - 9Pseudomonas aeruginosa 43 - - - 9Salmonella paratyphi 45 - - - 9Salmonella typhi 44 - - - 9Shigella boydii 44 - - - 8Shigella dysenteriae 42 - - - 9Vibrio mimicus 45 - - - 10Vibrio parahemolyticus 45 - - - 9
FungiAspergillus niger 44 - - - 9Candida albicans 44 - - - 9Sacharomyces cerevacae 44 - - - 9
8.4 Results and discussion
Antibacterial activity was compared with that of antibiotic ciprofloxacin which isconsidered popular in treatment of diseases caused by many types of bacterial species. Themethanolic extract, petroleum ether fraction and n-hexane fraction did not show anyremarkable antibacterial activity against the test organisms where ciprofloxacin gaveantibacterial activity.
Chloroform fraction gave more distinct zone of inhibition for Bacillus subtilis andSarcina lutea than other gram positive bacteria.
Chloroform fraction gave more remarkable zone of inhibition for Escherichia coli,Pseudomonas aeruginosa, Shigella dysenteriae and Vibrio mimicus than other gramnegative bacteria.
In comparison to Ciprofloxacin, chloroform fraction showed 20.45% zone ofinhibition against fungi.
Chapter 9: Evaluation of Anti-inflammatory Activity
Page | 50
9.1 Principle
In this experiment, carrageenan-induced rat hind paw edema was used as the animalmodel of acute inflammation. Administration of Carrageenan in the sub-plantar region ofrat’s hind paw leads to the formation of edema in situ due to localized inflammation. Aboutone hour prior to the administration of Carrageenan solution, experimental animals receivedtest materials and standard anti-inflammatory drug at appropriate doses. The volume of rat’spaw was measured each hour up to four hours by plethysmometer (Ugo Basile, Italy). Theaverage percentage of increase in paw volume with time was calculated and comparedagainst the control group. Percent inhibition was calculated using the formula-
100% xVc
VtVcinhibition
Where, Vc and Vt represent the average edema volume of control and treated animals
respectively. (Ozaki et. al., 1988)
9.2 Experimental animal
Long-Evans rats (Rattus sp.) of either sex, weighing 50-100 gm were used. Theywere obtained from the ICDDR,B animal house. The animals were acclimatized in theenvironmental condition in the Animal House of Nutrition and Food Department of theUniversity of Dhaka for three days providing rat food and water ad-libitum.
9.3 Preparation of test materials
9.3.1 Carrageenan solution (1%): Carrageenan (50 mg) was accurately weighed and thenit was dissolved in WFI (Water for Injection) by gentle heating in a water bath. Finally thevolume was adjusted up to 5 ml with WFI.
9.3.2 Control solution: 3-4 drops of Tween 80 and few drops of DMSO were mixedproperly in the normal saline and the volume was made upto 4.0 ml.
9.3.3 Standard solution: Diclofenac sodium (100 mg) was accurately weighed and then itwas dissolved in 5 ml normal saline (0.9% NaCl solution). Few drops of Tween 80 andDMSO were mixed in solution.
9.3.4 Test solutions: In order to obtain the dose of 200 mg/kg and 400 mg/kg body weight,300 mg of the test samples were taken separately and each was finally made 8 mlsuspension by means of Tween 80 and DMSO with normal saline.
9.4 Procedure
The animals were weighed and randomly divided into 5 groups of 5 rats in eachgroup. Each group received a particular treatment as mentioned in the Table- 9.1.Diclofenac sodium at 100 mg/kg body wt. was used as standard anti-inflammatory agent.After 30 minutes of oral administration of test materials, 0.1 ml of 1% Carrageenan solutionwas injected into the sub-plantar surface of the right hind paw of each rat of every group.The paw volume was measured by plethysmometer (Ugo Basile, Italy) at 1, 2, 3 and 4 hours
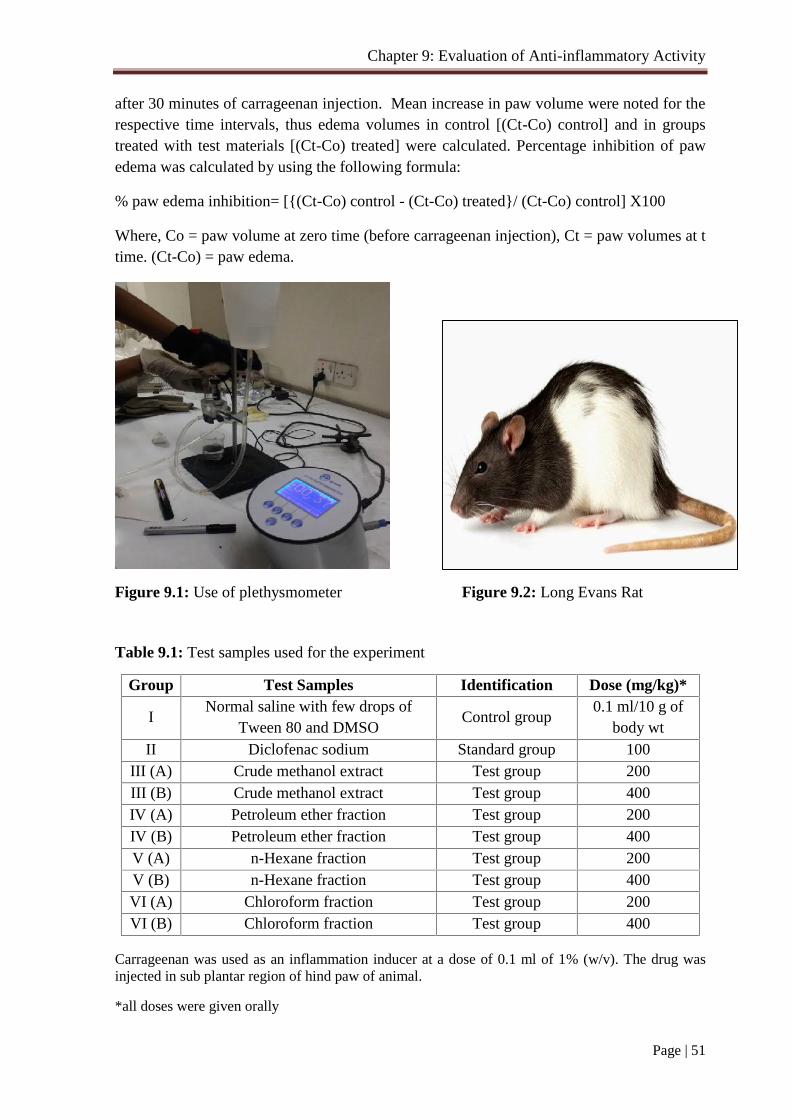
Chapter 9: Evaluation of Anti-inflammatory Activity
Page | 51
after 30 minutes of carrageenan injection. Mean increase in paw volume were noted for therespective time intervals, thus edema volumes in control [(Ct-Co) control] and in groupstreated with test materials [(Ct-Co) treated] were calculated. Percentage inhibition of pawedema was calculated by using the following formula:
% paw edema inhibition= [{(Ct-Co) control - (Ct-Co) treated}/ (Ct-Co) control] X100
Where, Co = paw volume at zero time (before carrageenan injection), Ct = paw volumes at ttime. (Ct-Co) = paw edema.
Figure 9.1: Use of plethysmometer Figure 9.2: Long Evans Rat
Table 9.1: Test samples used for the experiment
Group Test Samples Identification Dose (mg/kg)*
INormal saline with few drops of
Tween 80 and DMSOControl group
0.1 ml/10 g ofbody wt
II Diclofenac sodium Standard group 100III (A) Crude methanol extract Test group 200III (B) Crude methanol extract Test group 400IV (A) Petroleum ether fraction Test group 200IV (B) Petroleum ether fraction Test group 400V (A) n-Hexane fraction Test group 200V (B) n-Hexane fraction Test group 400VI (A) Chloroform fraction Test group 200VI (B) Chloroform fraction Test group 400
Carrageenan was used as an inflammation inducer at a dose of 0.1 ml of 1% (w/v). The drug wasinjected in sub plantar region of hind paw of animal.
*all doses were given orally
Chapter 9: Evaluation of Anti-inflammatory Activity
Page | 52
9.5: Evaluation of anti-inflammatory activity
Table 9.2: Paw volume of rats receiving control (Normal saline) at different time intervals
Rat No. Paw Volume (ml)0 hour 1st hour 2nd hour 3rd hour 4th hour
1 0.25 0.38 0.56 0.62 0.642 0.24 0.39 0.57 0.64 0.663 0.29 0.46 0.64 0.72 0.734 0.27 0.39 0.59 0.64 0.675 0.26 0.43 0.57 0.66 0.69
Mean 0.262 0.410 0.586 0.656 0.678Paw
edema Co = 0.262 0.148 0.324 0.394 0.416(Ct-Co)
** Where, Co= paw volume at zero time (before carrageenan injection),Ct=paw volumes at t time. (Ct-Co)= paw edema
Table 9.3: Paw volume of standard group of rats at different time intervals
Rat No. Paw Volume (ml)0 hour 1st hour 2nd hour 3rd hour 4th hour
1 0.29 0.35 0.41 0.49 0.312 0.24 0.37 0.41 0.32 0.273 0.26 0.34 0.39 0.36 0.284 0.28 0.39 0.40 0.38 0.325 0.26 0.37 0.38 0.33 0.31
Mean 0.266 0.364 0.398 0.376 0.298Paw
edema Co = 0.266 0.098 0.132 0.110 0.032(Ct-Co)
Chapter 9: Evaluation of Anti-inflammatory Activity
Page | 53
Table 9.4: Paw volume of rats receiving the crude methanolic extract (Single dose) III (A)of Myristica fragrans at different time intervals
Rat No. Paw Volume (ml)0 hour 1st hour 2nd hour 3rd hour 4th hour
1 0.29 0.36 0.43 0.49 0.412 0.24 0.32 0.34 0.31 0.253 0.25 0.37 0.46 0.41 0.374 0.26 0.36 0.45 0.36 0.295 0.25 0.34 0.29 0.25 0.20
Mean 0.258 0.350 0.394 0.364 0.304Paw edema
Co =0.258 0.092 0.136 0.106 0.046(Ct-Co)
Table 9.5: Paw volume of rats receiving the crude methanolic extract (Double dose) III (B)of Myristica fragrans at different time intervals
Rat No. Paw Volume (ml)0 hour 1st hour 2nd hour 3rd hour 4th hour
1 0.22 0.33 0.36 0.30 0.312 0.24 0.33 0.38 0.31 0.283 0.30 0.38 0.41 0.35 0.324 0.28 0.37 0.40 0.34 0.305 0.27 0.35 0.41 0.33 0.29
Mean 0.262 0.352 0.392 0.326 0.300Paw edema
Co = 0.262 0.090 0.130 0.064 0.038(Ct-Co)
Table 9.6: Paw volumes of rats receiving the petroleum ether fraction (Single dose) IV (A)of Myristica fragrans at different time intervals
Rat No. Paw Volume (ml)0 hour 1st hour 2nd hour 3rd hour 4th hour
1 0.29 0.35 0.43 0.51 0.432 0.24 0.38 0.41 0.40 0.323 0.33 0.42 0.46 0.41 0.374 0.31 0.41 0.45 0.42 0.335 0.28 0.37 0.41 0.39 0.36
Mean 0.290 0.386 0.432 0.426 0.362Paw edema
Co = 0.290 0.096 0.142 0.136 0.072(Ct-Co)
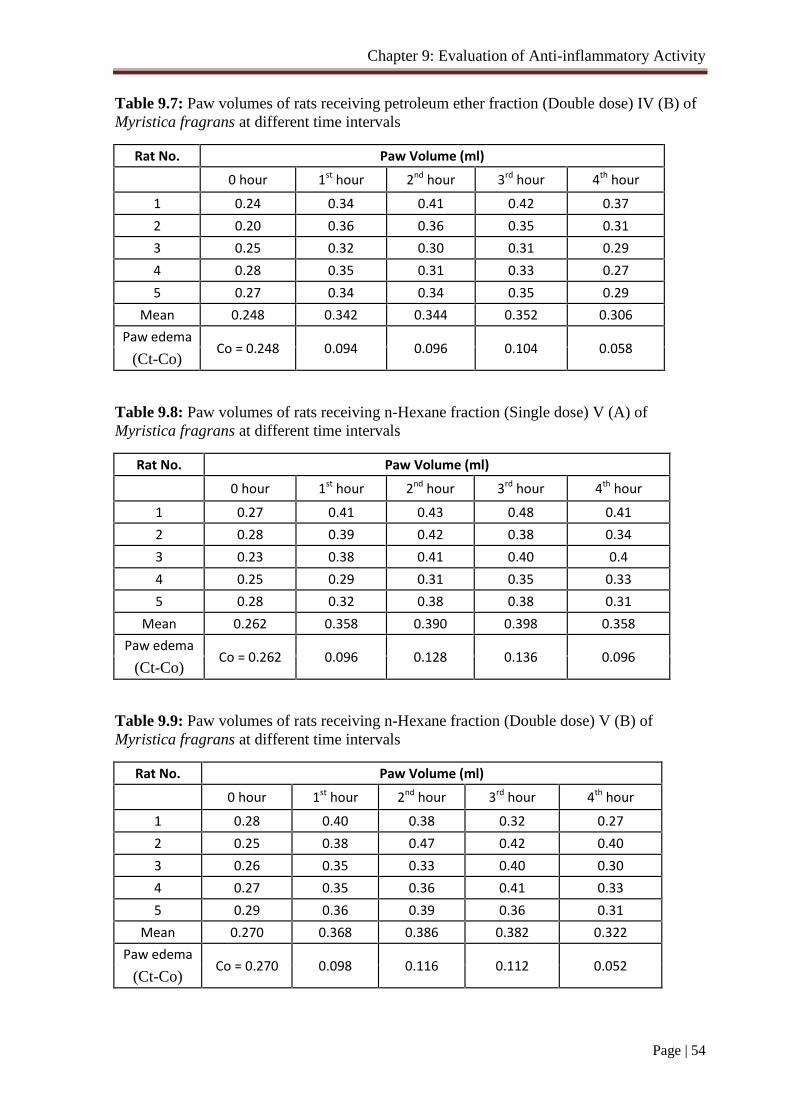
Chapter 9: Evaluation of Anti-inflammatory Activity
Page | 54
Table 9.7: Paw volumes of rats receiving petroleum ether fraction (Double dose) IV (B) ofMyristica fragrans at different time intervals
Rat No. Paw Volume (ml)0 hour 1st hour 2nd hour 3rd hour 4th hour
1 0.24 0.34 0.41 0.42 0.372 0.20 0.36 0.36 0.35 0.313 0.25 0.32 0.30 0.31 0.294 0.28 0.35 0.31 0.33 0.275 0.27 0.34 0.34 0.35 0.29
Mean 0.248 0.342 0.344 0.352 0.306Paw edema
Co = 0.248 0.094 0.096 0.104 0.058(Ct-Co)
Table 9.8: Paw volumes of rats receiving n-Hexane fraction (Single dose) V (A) ofMyristica fragrans at different time intervals
Rat No. Paw Volume (ml)0 hour 1st hour 2nd hour 3rd hour 4th hour
1 0.27 0.41 0.43 0.48 0.412 0.28 0.39 0.42 0.38 0.343 0.23 0.38 0.41 0.40 0.44 0.25 0.29 0.31 0.35 0.335 0.28 0.32 0.38 0.38 0.31
Mean 0.262 0.358 0.390 0.398 0.358Paw edema
Co = 0.262 0.096 0.128 0.136 0.096(Ct-Co)
Table 9.9: Paw volumes of rats receiving n-Hexane fraction (Double dose) V (B) ofMyristica fragrans at different time intervals
Rat No. Paw Volume (ml)0 hour 1st hour 2nd hour 3rd hour 4th hour
1 0.28 0.40 0.38 0.32 0.272 0.25 0.38 0.47 0.42 0.403 0.26 0.35 0.33 0.40 0.304 0.27 0.35 0.36 0.41 0.335 0.29 0.36 0.39 0.36 0.31
Mean 0.270 0.368 0.386 0.382 0.322Paw edema
Co = 0.270 0.098 0.116 0.112 0.052(Ct-Co)
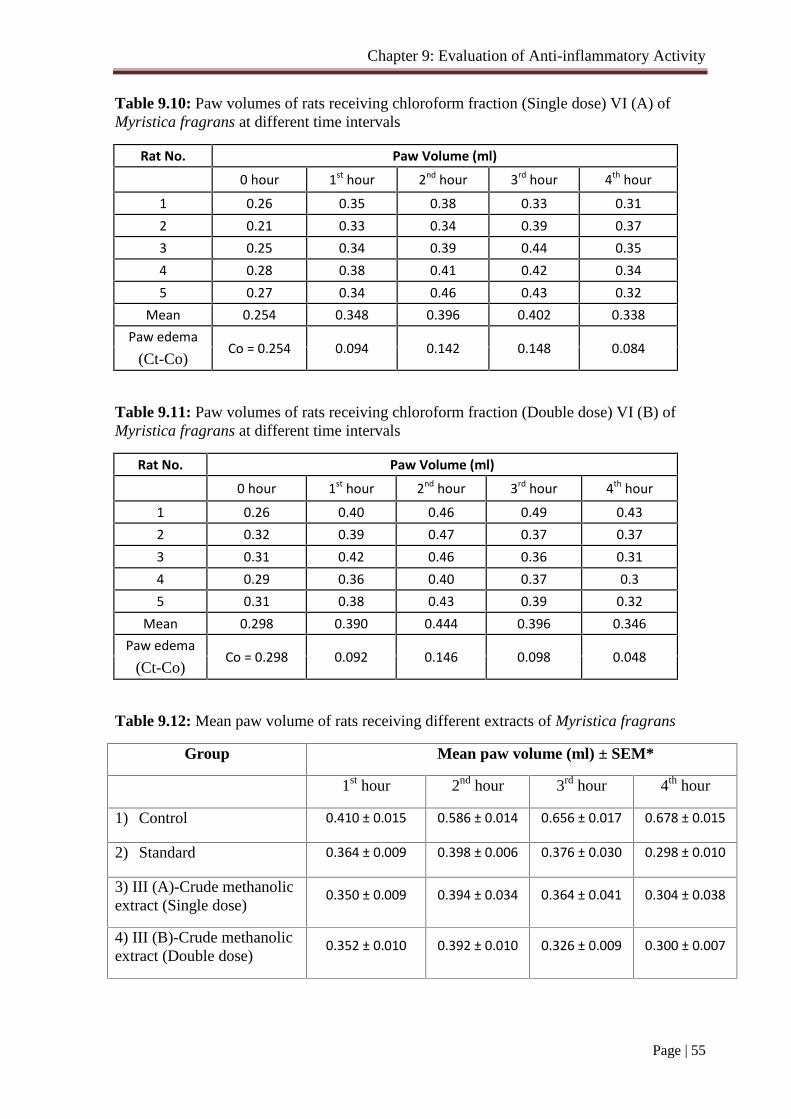
Chapter 9: Evaluation of Anti-inflammatory Activity
Page | 55
Table 9.10: Paw volumes of rats receiving chloroform fraction (Single dose) VI (A) ofMyristica fragrans at different time intervals
Rat No. Paw Volume (ml)0 hour 1st hour 2nd hour 3rd hour 4th hour
1 0.26 0.35 0.38 0.33 0.312 0.21 0.33 0.34 0.39 0.373 0.25 0.34 0.39 0.44 0.354 0.28 0.38 0.41 0.42 0.345 0.27 0.34 0.46 0.43 0.32
Mean 0.254 0.348 0.396 0.402 0.338Paw edema
Co = 0.254 0.094 0.142 0.148 0.084(Ct-Co)
Table 9.11: Paw volumes of rats receiving chloroform fraction (Double dose) VI (B) ofMyristica fragrans at different time intervals
Rat No. Paw Volume (ml)0 hour 1st hour 2nd hour 3rd hour 4th hour
1 0.26 0.40 0.46 0.49 0.432 0.32 0.39 0.47 0.37 0.373 0.31 0.42 0.46 0.36 0.314 0.29 0.36 0.40 0.37 0.35 0.31 0.38 0.43 0.39 0.32
Mean 0.298 0.390 0.444 0.396 0.346Paw edema
Co = 0.298 0.092 0.146 0.098 0.048(Ct-Co)
Table 9.12: Mean paw volume of rats receiving different extracts of Myristica fragrans
Group Mean paw volume (ml) ± SEM*
1st hour 2nd hour 3rd hour 4th hour
1) Control 0.410 ± 0.015 0.586 ± 0.014 0.656 ± 0.017 0.678 ± 0.015
2) Standard 0.364 ± 0.009 0.398 ± 0.006 0.376 ± 0.030 0.298 ± 0.010
3) III (A)-Crude methanolicextract (Single dose)
0.350 ± 0.009 0.394 ± 0.034 0.364 ± 0.041 0.304 ± 0.038
4) III (B)-Crude methanolicextract (Double dose)
0.352 ± 0.010 0.392 ± 0.010 0.326 ± 0.009 0.300 ± 0.007
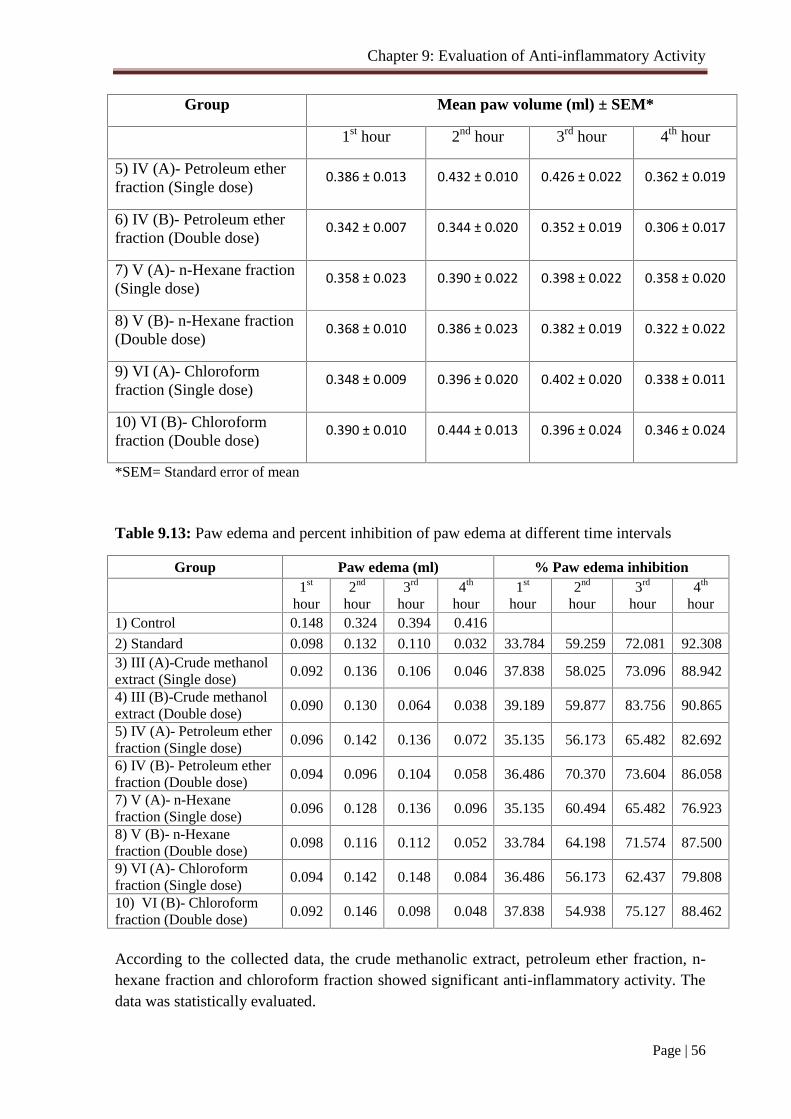
Chapter 9: Evaluation of Anti-inflammatory Activity
Page | 56
Group Mean paw volume (ml) ± SEM*
1st hour 2nd hour 3rd hour 4th hour
5) IV (A)- Petroleum etherfraction (Single dose)
0.386 ± 0.013 0.432 ± 0.010 0.426 ± 0.022 0.362 ± 0.019
6) IV (B)- Petroleum etherfraction (Double dose)
0.342 ± 0.007 0.344 ± 0.020 0.352 ± 0.019 0.306 ± 0.017
7) V (A)- n-Hexane fraction(Single dose)
0.358 ± 0.023 0.390 ± 0.022 0.398 ± 0.022 0.358 ± 0.020
8) V (B)- n-Hexane fraction(Double dose)
0.368 ± 0.010 0.386 ± 0.023 0.382 ± 0.019 0.322 ± 0.022
9) VI (A)- Chloroformfraction (Single dose)
0.348 ± 0.009 0.396 ± 0.020 0.402 ± 0.020 0.338 ± 0.011
10) VI (B)- Chloroformfraction (Double dose)
0.390 ± 0.010 0.444 ± 0.013 0.396 ± 0.024 0.346 ± 0.024
*SEM= Standard error of mean
Table 9.13: Paw edema and percent inhibition of paw edema at different time intervals
Group Paw edema (ml) % Paw edema inhibition1st
hour2nd
hour3rd
hour4th
hour1st
hour2nd
hour3rd
hour4th
hour1) Control 0.148 0.324 0.394 0.416
2) Standard 0.098 0.132 0.110 0.032 33.784 59.259 72.081 92.3083) III (A)-Crude methanolextract (Single dose)
0.092 0.136 0.106 0.046 37.838 58.025 73.096 88.942
4) III (B)-Crude methanolextract (Double dose)
0.090 0.130 0.064 0.038 39.189 59.877 83.756 90.865
5) IV (A)- Petroleum etherfraction (Single dose)
0.096 0.142 0.136 0.072 35.135 56.173 65.482 82.692
6) IV (B)- Petroleum etherfraction (Double dose)
0.094 0.096 0.104 0.058 36.486 70.370 73.604 86.058
7) V (A)- n-Hexanefraction (Single dose)
0.096 0.128 0.136 0.096 35.135 60.494 65.482 76.923
8) V (B)- n-Hexanefraction (Double dose)
0.098 0.116 0.112 0.052 33.784 64.198 71.574 87.500
9) VI (A)- Chloroformfraction (Single dose)
0.094 0.142 0.148 0.084 36.486 56.173 62.437 79.808
10) VI (B)- Chloroformfraction (Double dose)
0.092 0.146 0.098 0.048 37.838 54.938 75.127 88.462
According to the collected data, the crude methanolic extract, petroleum ether fraction, n-hexane fraction and chloroform fraction showed significant anti-inflammatory activity. Thedata was statistically evaluated.
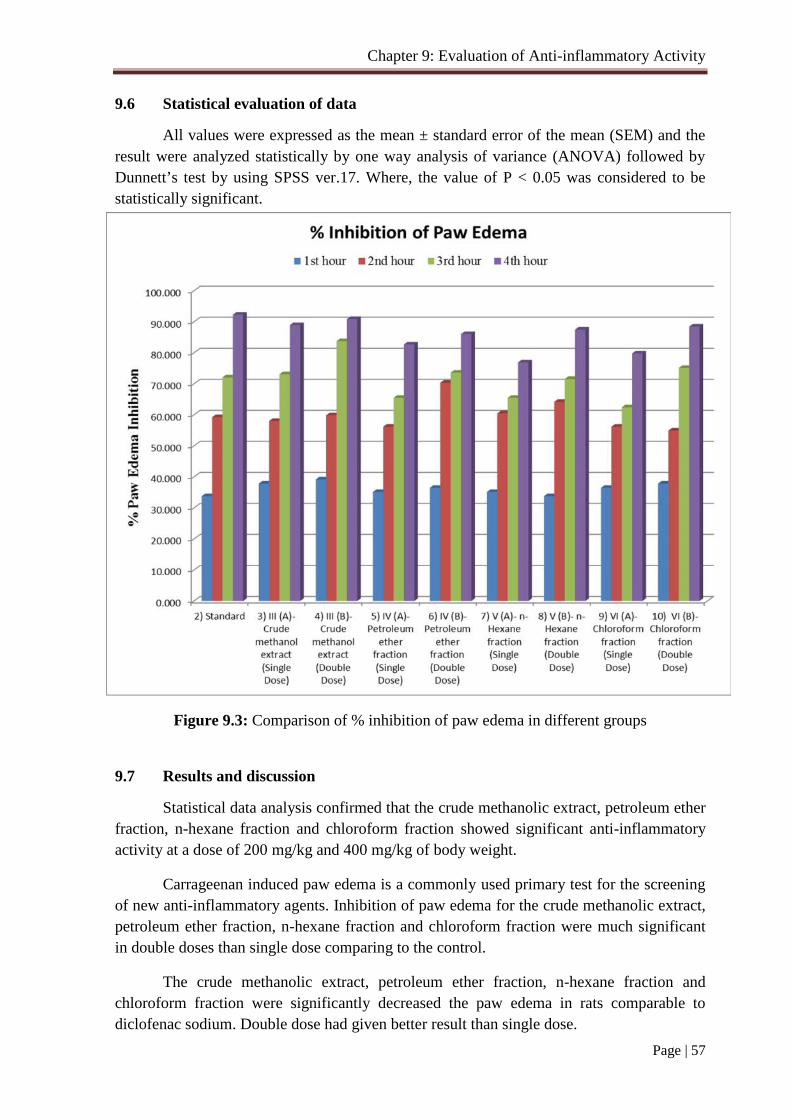
Chapter 9: Evaluation of Anti-inflammatory Activity
Page | 57
9.6 Statistical evaluation of data
All values were expressed as the mean ± standard error of the mean (SEM) and theresult were analyzed statistically by one way analysis of variance (ANOVA) followed byDunnett’s test by using SPSS ver.17. Where, the value of P < 0.05 was considered to bestatistically significant.
Figure 9.3: Comparison of % inhibition of paw edema in different groups
9.7 Results and discussion
Statistical data analysis confirmed that the crude methanolic extract, petroleum etherfraction, n-hexane fraction and chloroform fraction showed significant anti-inflammatoryactivity at a dose of 200 mg/kg and 400 mg/kg of body weight.
Carrageenan induced paw edema is a commonly used primary test for the screeningof new anti-inflammatory agents. Inhibition of paw edema for the crude methanolic extract,petroleum ether fraction, n-hexane fraction and chloroform fraction were much significantin double doses than single dose comparing to the control.
The crude methanolic extract, petroleum ether fraction, n-hexane fraction andchloroform fraction were significantly decreased the paw edema in rats comparable todiclofenac sodium. Double dose had given better result than single dose.
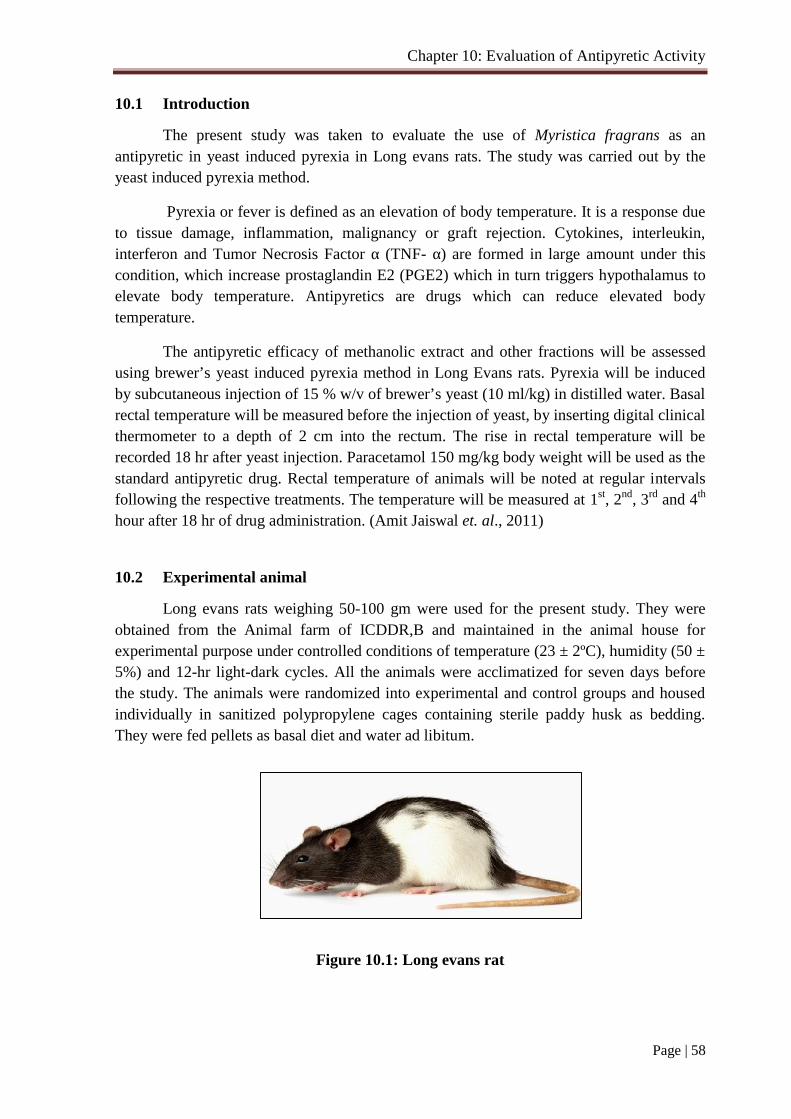
Chapter 10: Evaluation of Antipyretic Activity
Page | 58
10.1 Introduction
The present study was taken to evaluate the use of Myristica fragrans as anantipyretic in yeast induced pyrexia in Long evans rats. The study was carried out by theyeast induced pyrexia method.
Pyrexia or fever is defined as an elevation of body temperature. It is a response dueto tissue damage, inflammation, malignancy or graft rejection. Cytokines, interleukin,interferon and Tumor Necrosis Factor α (TNF- α) are formed in large amount under thiscondition, which increase prostaglandin E2 (PGE2) which in turn triggers hypothalamus toelevate body temperature. Antipyretics are drugs which can reduce elevated bodytemperature.
The antipyretic efficacy of methanolic extract and other fractions will be assessedusing brewer’s yeast induced pyrexia method in Long Evans rats. Pyrexia will be inducedby subcutaneous injection of 15 % w/v of brewer’s yeast (10 ml/kg) in distilled water. Basalrectal temperature will be measured before the injection of yeast, by inserting digital clinicalthermometer to a depth of 2 cm into the rectum. The rise in rectal temperature will berecorded 18 hr after yeast injection. Paracetamol 150 mg/kg body weight will be used as thestandard antipyretic drug. Rectal temperature of animals will be noted at regular intervalsfollowing the respective treatments. The temperature will be measured at 1st, 2nd, 3rd and 4th
hour after 18 hr of drug administration. (Amit Jaiswal et. al., 2011)
10.2 Experimental animal
Long evans rats weighing 50-100 gm were used for the present study. They wereobtained from the Animal farm of ICDDR,B and maintained in the animal house forexperimental purpose under controlled conditions of temperature (23 ± 2ºC), humidity (50 ±5%) and 12-hr light-dark cycles. All the animals were acclimatized for seven days beforethe study. The animals were randomized into experimental and control groups and housedindividually in sanitized polypropylene cages containing sterile paddy husk as bedding.They were fed pellets as basal diet and water ad libitum.
Figure 10.1: Long evans rat
Chapter 10: Evaluation of Antipyretic Activity
Page | 59
10.3 Preparation of test materials
10.3.1 Test solutions: In order to administer the crude extract at doses of 200 mg/kg bodywt and 400 mg/kg body wt of rat, 300 mg of the extracts were measured respectively andtriturated in unidirectional way by adding of 3-4 drops of Tween 80 and few drops ofDMSO. After proper mixing of extract, suspending agent and DMSO, normal saline wasslowly added. The final volume of the suspension was made up to 8.0 ml. To stabilize thesuspension, it was stirred well by vortex mixture.
10.3.2 Control solution: For the preparation of control, 3-4 drops of Tween 80 and fewdrops of DMSO were mixed in normal saline. The final volume of the suspension was madeup to 4.0 ml.
10.3.3 Standard solution: For the preparation of paracetamol at the dose of 150 mg/kgbody weight, 500 mg of paracetamol tablet was dissolved in 40.0 ml normal saline. Fewdrops of Tween 80 and DMSO were mixed in solution.
10.3.4 Brewer’s yeast suspension: 15 gm of brewer’s yeast were suspended in 100 ml ofhot distilled water.
10.4 Pyrexia induced by Brewer’s yeast suspensions in rats
Antipyretic activity on rats was studied with fever induced by 15% brewer’s yeast.Healthy Long evans rats weighing about 50-100 gm were taken. They were fastedovernight with water ad libitum before inducing pyrexia and just before induce pyrexiaanimals were allowed to stay in the cage for some time and after that their basal rectaltemperature were measured by using a clinical digital thermometer by insertion ofthermometer to a depth of 2 cm into the rectum. After taking the temperature Pyrexia wasinduced by injecting subcutaneously 15% w/v suspension of Brewer’s yeast in distilledwater at a dose of 10 ml/kg body weight in the back below the nape of the neck. The site ofinjection was massaged in order to spread the suspension beneath the skin and returned totheir cage and allowed to feed. After 18 hrs of Brewer’s yeast injection the rise in rectaltemperature was recorded. Only rats which were shown an increase in temperature, at least0.6º C (or 1º F), was used for further experiment. The animals were divided into 10 groups,each group contain five animals. The control, standard and test extracts were administeredorally to the animals before 30 minutes of yeast injection. After the drug was administered,the temperature of all the rats in each group was recorded at 1 hr, 2 hr, 3 hr and 4 hr. Themean temperature was found out for each group and compared with the value of standarddrug. The obtained data were statistically evaluated and the P value elucidated to determinethe statistical significance.

Chapter 10: Evaluation of Antipyretic Activity
Page | 60
10.5 Analytical data
Table 10.1: Test materials used in the evaluation of analgesic activity of crude extract andits different fractions of Myristica fragrans.
Group Test Samples Identification Dose (mg/kg)*
INormal saline with 3-4 drops of
Tween-80 and few drops of DMSOControl group
0.1ml/10 g of bodywt
II Paracetamol Standard group 150III (A) Crude methanolic extract Test group 200III (B) Crude methanolic extract Test group 400IV (A) Petroleum ether fraction Test group 200IV (B) Petroleum ether fraction Test group 400V (A) n-Hexane fraction Test group 200V (B) n-Hexane fraction Test group 400VI (A) Chloroform fraction Test group 200VI (B) Chloroform fraction Test group 400*All doses were given orally.
Rectal temperature determination
Table 10.2: Effect of normal saline (control) on yeast induced pyrexia in rats at differenttime intervals
Rat No.
RectalTemperature (0F)
Before YeastInjection
Rectal Temperature (0F) After 18 hours of YeastInjection
0 hour 1st hour 2nd hour 3rd hour 4th hour
1 99.3 101.6 101.8 101.7 101.7 101.6
2 98.7 100.9 101.3 101.5 101.4 101.4
3 96.7 99.4 100.8 100.6 100.5 100.3
4 98.5 99.7 101.6 101.2 101.2 101.0
5 99.1 100.8 101.7 101.6 101.3 101.1
Mean 98.46 100.48 101.44 101.32 101.22 101.08
Table 10.3: Effect of paracetamol (standard) on yeast induced pyrexia in rats at differenttime intervals.
Rat No.
RectalTemperature (0F)
Before YeastInjection
Rectal Temperature (0F) After 18 hours of YeastInjection
0 hour 1st hour 2nd hour 3rd hour 4th hour
1 94.8 98.1 98.0 97.8 97.5 97.4
2 94.5 99.5 99.2 98.9 95.6 95.8
3 99.5 100.4 100.1 98.8 96.4 96.3
4 98.6 99.4 99.2 99.1 98.9 98.7
5 97.8 98.5 98.5 98.4 98.1 97.7
Mean 97.04 99.18 99.00 98.60 97.3 97.18

Chapter 10: Evaluation of Antipyretic Activity
Page | 61
Table 10.4: Effect of methanolic extract (200 mg/kg body weight) on yeast induced pyrexiain rats at different time intervals.
Rat No.
RectalTemperature (0F)
Before YeastInjection
Rectal Temperature (0F) After 18 hours of YeastInjection
0 hour 1st hour 2nd hour 3rd hour 4th hour
1 96.2 98.2 98.2 98.1 95.4 95.5
2 94.7 94.6 95.3 97.8 97.4 97.5
3 94.9 94.7 95.8 98.3 96.7 96.6
4 98.2 98.4 98.6 98.5 97.5 97.5
5 98.4 98.6 98.7 97.9 98.3 98.4
Mean 96.48 96.9 97.32 98.12 97.06 97.10
Table 10.5: Effect of methanolic extract (400 mg/kg body weight) on yeast induced pyrexiain rats at different time intervals.
Rat No.
RectalTemperature (0F)
Before YeastInjection
Rectal Temperature (0F) After 18 hours of YeastInjection
0 hour 1st hour 2nd hour 3rd hour 4th hour
1 98.2 98.9 98.8 98.7 97.5 96.2
2 99.8 100.5 100.6 99.9 98.3 97.9
3 97.5 98.4 97.9 97.9 98.2 95.7
4 97.8 98.7 98.6 98.7 98.6 96.8
5 98.3 99.2 99.3 99.4 99.5 99.5
Mean 98.32 99.14 99.04 98.92 98.42 97.22
Table 10.6: Effect of petroleum ether fraction (200 mg/kg body weight) on yeast inducedpyrexia in rats at different time intervals.
Rat No.
RectalTemperature (0F)
Before YeastInjection
Rectal Temperature (0F) After 18 hours of YeastInjection
0 hour 1st hour 2nd hour 3rd hour 4th hour
1 97.9 96.9 96.8 96.7 96.9 96.7
2 99.4 98.7 98.5 97.8 97.9 97.8
3 98.7 99.8 99.7 99.3 99.4 99.1
4 99.5 99.7 99.7 99.8 99.7 99.5
5 98.6 98.7 98.6 98.4 98.8 98.7
Mean 98.82 98.76 98.66 98.40 98.54 98.36
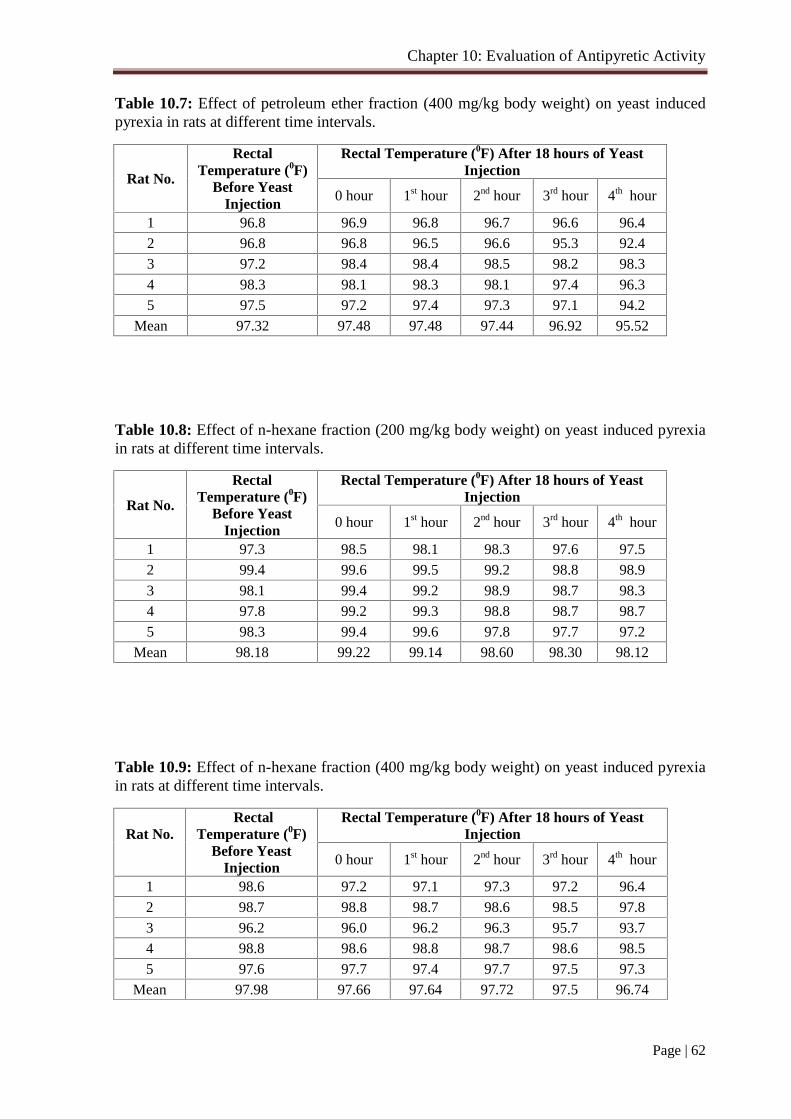
Chapter 10: Evaluation of Antipyretic Activity
Page | 62
Table 10.7: Effect of petroleum ether fraction (400 mg/kg body weight) on yeast inducedpyrexia in rats at different time intervals.
Rat No.
RectalTemperature (0F)
Before YeastInjection
Rectal Temperature (0F) After 18 hours of YeastInjection
0 hour 1st hour 2nd hour 3rd hour 4th hour
1 96.8 96.9 96.8 96.7 96.6 96.4
2 96.8 96.8 96.5 96.6 95.3 92.4
3 97.2 98.4 98.4 98.5 98.2 98.3
4 98.3 98.1 98.3 98.1 97.4 96.3
5 97.5 97.2 97.4 97.3 97.1 94.2
Mean 97.32 97.48 97.48 97.44 96.92 95.52
Table 10.8: Effect of n-hexane fraction (200 mg/kg body weight) on yeast induced pyrexiain rats at different time intervals.
Rat No.
RectalTemperature (0F)
Before YeastInjection
Rectal Temperature (0F) After 18 hours of YeastInjection
0 hour 1st hour 2nd hour 3rd hour 4th hour
1 97.3 98.5 98.1 98.3 97.6 97.5
2 99.4 99.6 99.5 99.2 98.8 98.9
3 98.1 99.4 99.2 98.9 98.7 98.3
4 97.8 99.2 99.3 98.8 98.7 98.7
5 98.3 99.4 99.6 97.8 97.7 97.2
Mean 98.18 99.22 99.14 98.60 98.30 98.12
Table 10.9: Effect of n-hexane fraction (400 mg/kg body weight) on yeast induced pyrexiain rats at different time intervals.
Rat No.Rectal
Temperature (0F)Before Yeast
Injection
Rectal Temperature (0F) After 18 hours of YeastInjection
0 hour 1st hour 2nd hour 3rd hour 4th hour
1 98.6 97.2 97.1 97.3 97.2 96.4
2 98.7 98.8 98.7 98.6 98.5 97.8
3 96.2 96.0 96.2 96.3 95.7 93.7
4 98.8 98.6 98.8 98.7 98.6 98.5
5 97.6 97.7 97.4 97.7 97.5 97.3
Mean 97.98 97.66 97.64 97.72 97.5 96.74
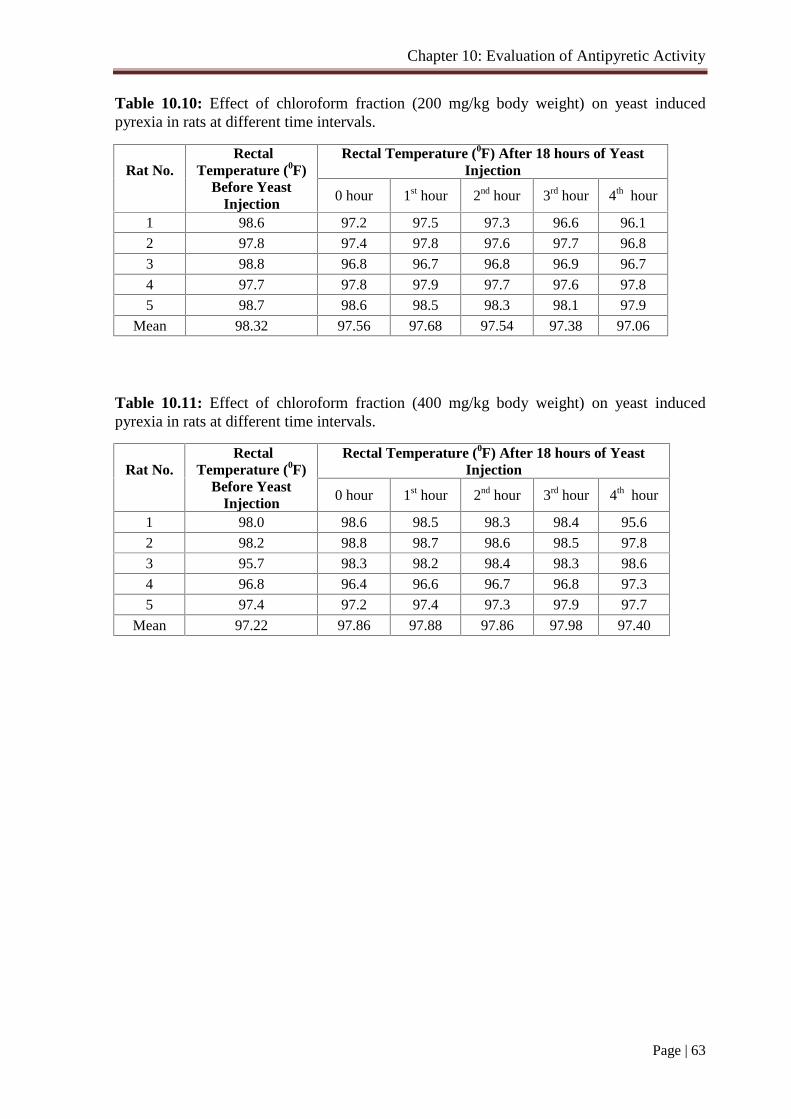
Chapter 10: Evaluation of Antipyretic Activity
Page | 63
Table 10.10: Effect of chloroform fraction (200 mg/kg body weight) on yeast inducedpyrexia in rats at different time intervals.
Rat No.Rectal
Temperature (0F)Before Yeast
Injection
Rectal Temperature (0F) After 18 hours of YeastInjection
0 hour 1st hour 2nd hour 3rd hour 4th hour
1 98.6 97.2 97.5 97.3 96.6 96.1
2 97.8 97.4 97.8 97.6 97.7 96.8
3 98.8 96.8 96.7 96.8 96.9 96.7
4 97.7 97.8 97.9 97.7 97.6 97.8
5 98.7 98.6 98.5 98.3 98.1 97.9
Mean 98.32 97.56 97.68 97.54 97.38 97.06
Table 10.11: Effect of chloroform fraction (400 mg/kg body weight) on yeast inducedpyrexia in rats at different time intervals.
Rat No.Rectal
Temperature (0F)Before Yeast
Injection
Rectal Temperature (0F) After 18 hours of YeastInjection
0 hour 1st hour 2nd hour 3rd hour 4th hour
1 98.0 98.6 98.5 98.3 98.4 95.6
2 98.2 98.8 98.7 98.6 98.5 97.8
3 95.7 98.3 98.2 98.4 98.3 98.6
4 96.8 96.4 96.6 96.7 96.8 97.3
5 97.4 97.2 97.4 97.3 97.9 97.7
Mean 97.22 97.86 97.88 97.86 97.98 97.40
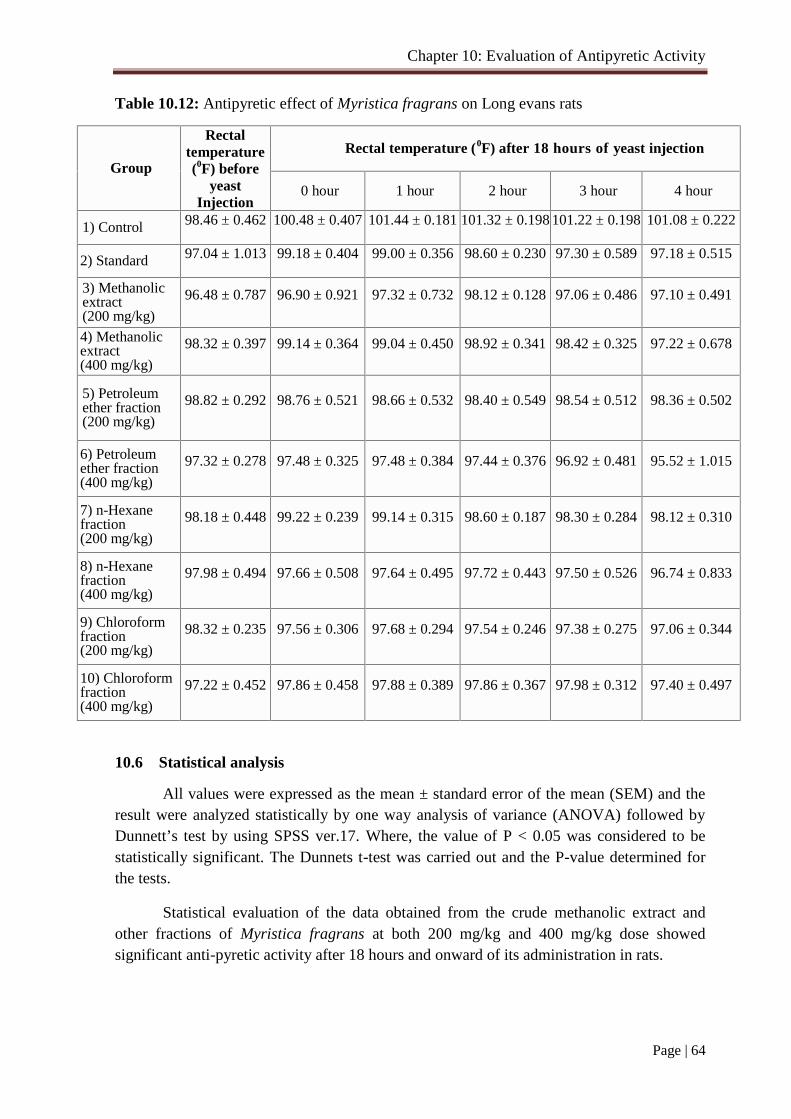
Chapter 10: Evaluation of Antipyretic Activity
Page | 64
Table 10.12: Antipyretic effect of Myristica fragrans on Long evans rats
Group
Rectaltemperature(0F) before
yeastInjection
Rectal temperature (0F) after 18 hours of yeast injection
0 hour 1 hour 2 hour 3 hour 4 hour
1) Control 98.46 ± 0.462 100.48 ± 0.407 101.44 ± 0.181 101.32 ± 0.198 101.22 ± 0.198 101.08 ± 0.222
2) Standard 97.04 ± 1.013 99.18 ± 0.404 99.00 ± 0.356 98.60 ± 0.230 97.30 ± 0.589 97.18 ± 0.515
3) Methanolicextract(200 mg/kg)
96.48 ± 0.787 96.90 ± 0.921 97.32 ± 0.732 98.12 ± 0.128 97.06 ± 0.486 97.10 ± 0.491
4) Methanolicextract(400 mg/kg)
98.32 ± 0.397 99.14 ± 0.364 99.04 ± 0.450 98.92 ± 0.341 98.42 ± 0.325 97.22 ± 0.678
5) Petroleumether fraction(200 mg/kg)
98.82 ± 0.292 98.76 ± 0.521 98.66 ± 0.532 98.40 ± 0.549 98.54 ± 0.512 98.36 ± 0.502
6) Petroleumether fraction(400 mg/kg)
97.32 ± 0.278 97.48 ± 0.325 97.48 ± 0.384 97.44 ± 0.376 96.92 ± 0.481 95.52 ± 1.015
7) n-Hexanefraction(200 mg/kg)
98.18 ± 0.448 99.22 ± 0.239 99.14 ± 0.315 98.60 ± 0.187 98.30 ± 0.284 98.12 ± 0.310
8) n-Hexanefraction(400 mg/kg)
97.98 ± 0.494 97.66 ± 0.508 97.64 ± 0.495 97.72 ± 0.443 97.50 ± 0.526 96.74 ± 0.833
9) Chloroformfraction(200 mg/kg)
98.32 ± 0.235 97.56 ± 0.306 97.68 ± 0.294 97.54 ± 0.246 97.38 ± 0.275 97.06 ± 0.344
10) Chloroformfraction(400 mg/kg)
97.22 ± 0.452 97.86 ± 0.458 97.88 ± 0.389 97.86 ± 0.367 97.98 ± 0.312 97.40 ± 0.497
10.6 Statistical analysis
All values were expressed as the mean ± standard error of the mean (SEM) and theresult were analyzed statistically by one way analysis of variance (ANOVA) followed byDunnett’s test by using SPSS ver.17. Where, the value of P < 0.05 was considered to bestatistically significant. The Dunnets t-test was carried out and the P-value determined forthe tests.
Statistical evaluation of the data obtained from the crude methanolic extract andother fractions of Myristica fragrans at both 200 mg/kg and 400 mg/kg dose showedsignificant anti-pyretic activity after 18 hours and onward of its administration in rats.
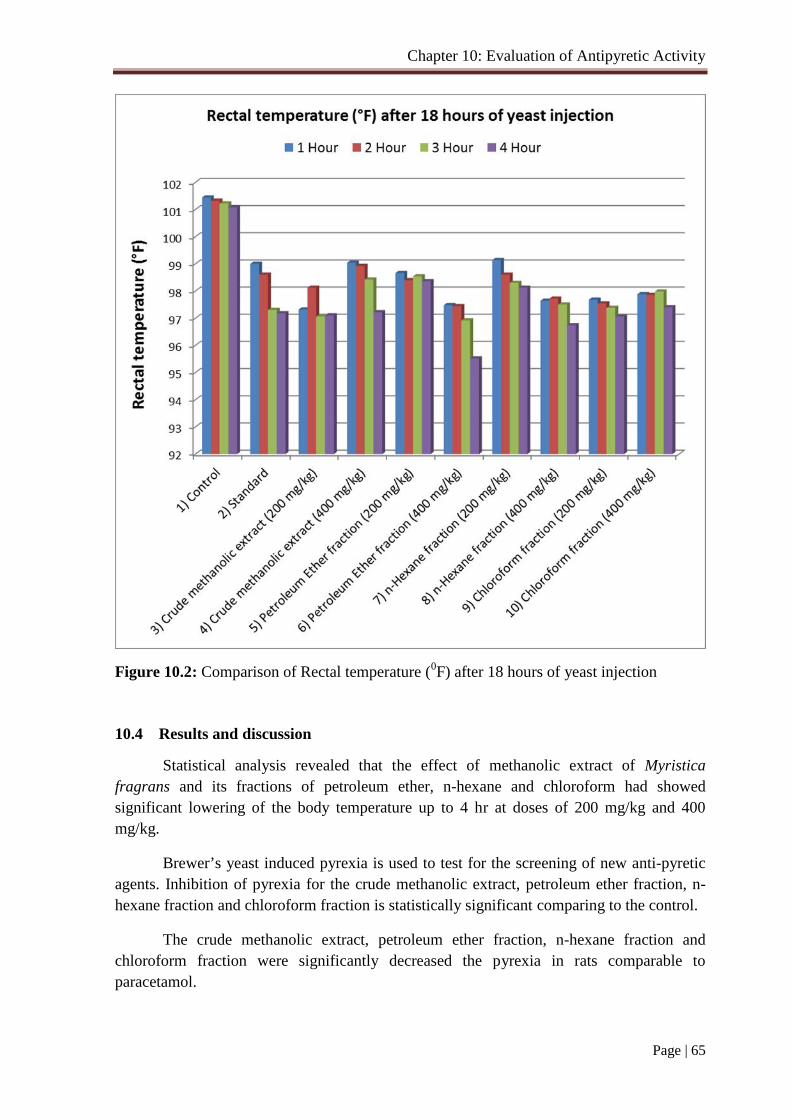
Chapter 10: Evaluation of Antipyretic Activity
Page | 65
Figure 10.2: Comparison of Rectal temperature (0F) after 18 hours of yeast injection
10.4 Results and discussion
Statistical analysis revealed that the effect of methanolic extract of Myristicafragrans and its fractions of petroleum ether, n-hexane and chloroform had showedsignificant lowering of the body temperature up to 4 hr at doses of 200 mg/kg and 400mg/kg.
Brewer’s yeast induced pyrexia is used to test for the screening of new anti-pyreticagents. Inhibition of pyrexia for the crude methanolic extract, petroleum ether fraction, n-hexane fraction and chloroform fraction is statistically significant comparing to the control.
The crude methanolic extract, petroleum ether fraction, n-hexane fraction andchloroform fraction were significantly decreased the pyrexia in rats comparable toparacetamol.
Chapter 11: Evaluation of Peripheral Analgesic Activity
Page | 66
11.1 Principle
Analgesic activity was evaluated by acetic acid induced Writhing method. Visceralpain will be induced by intraperitoneal injection of 0.7% volume per volume (10 mL/kg)glacial acetic acid solution in normal saline. As a result, the animals squirms their body atregular interval out of pain. This squirm or contraction of the body is termed as “writhing”.As long as the animals feel pain, they continue to give writhing. Each writhing is countedand taken as an indication of pain sensation. Any substance that has got analgesic activity issupposed to lessen the number of writhing of animals within a given time frame and withrespect to the control group. The writhing inhibition of positive control was taken asstandard and compared with test samples and control. Mice will be given vehicle, diclofenacsodium, crude methanolic extract and fractions of extract, 40 minutes prior to induction ofvisceral pain. According to this principle crude methanolic extract, petroleum ether fraction,n-hexane fraction and chloroform fraction were introduced to analgesic testing at twodifferent doses: Dose 200 mg/kg and 400 mg/kg of body weight.
Animals in the cages were observed for writhing behavior, indicated by stretching ofthe abdomen with simultaneous stretching. The number of writhing responses will becounted for 15 minutes, starting directly after the acid injection. (Hayfaa et al., 2013)
11.2 Experimental animal
Swiss albino mice of either sex, aged 4-5 weeks and weighed 30-35 gm, obtainedfrom the Animal farm of ICDDR,B. They were kept in suitable environmental condition andfed mice food and water ad-libitum in the Animal House of Nutrition and Food Departmentof the University of Dhaka. As these animals are very sensitive to environmental changes,they were acclimatized before the test for at least 3-4 days in the environment where theexperiment will take place.
Figure 11.1: Swiss albino mice
11.3 Experimental design
50 experimental animals were randomly selected, weighed and divided into tengroups denoted as group-I, group-II, group-III(A-B), group- IV(A-B), group- V(A-B), andgroup VI(A-B), consisting of 5 mice in each group. Each group received a particular
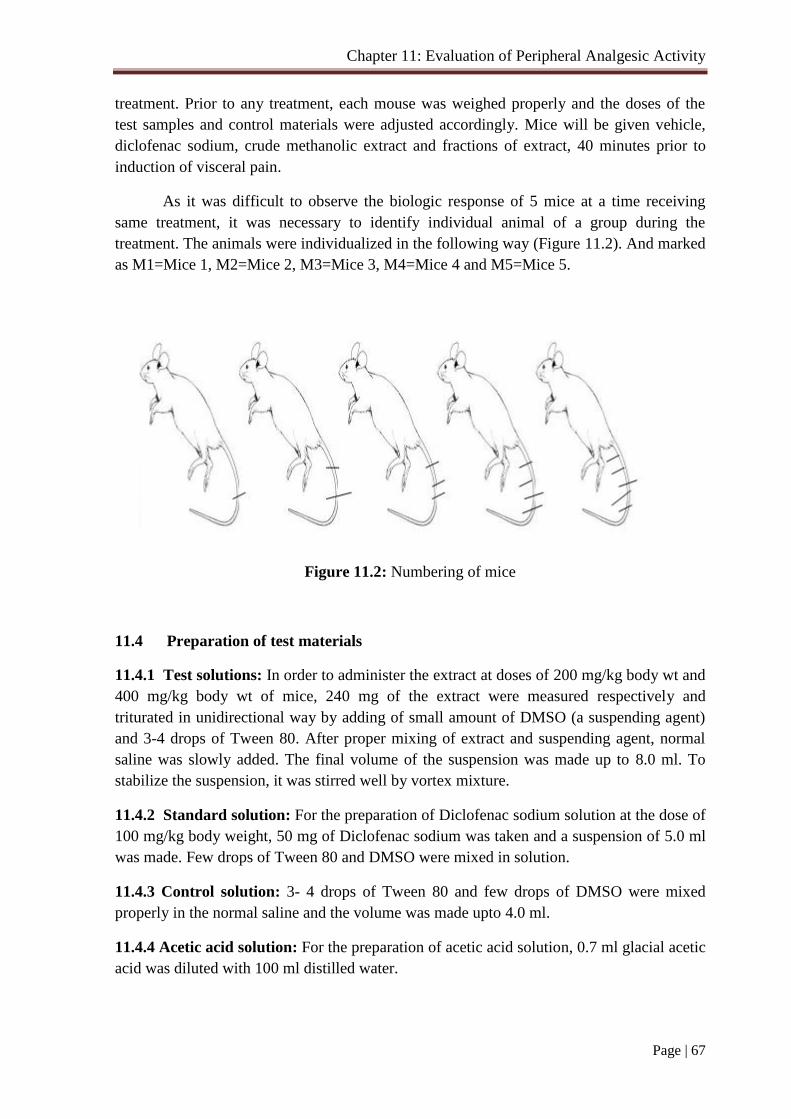
Chapter 11: Evaluation of Peripheral Analgesic Activity
Page | 67
treatment. Prior to any treatment, each mouse was weighed properly and the doses of thetest samples and control materials were adjusted accordingly. Mice will be given vehicle,diclofenac sodium, crude methanolic extract and fractions of extract, 40 minutes prior toinduction of visceral pain.
As it was difficult to observe the biologic response of 5 mice at a time receivingsame treatment, it was necessary to identify individual animal of a group during thetreatment. The animals were individualized in the following way (Figure 11.2). And markedas M1=Mice 1, M2=Mice 2, M3=Mice 3, M4=Mice 4 and M5=Mice 5.
Figure 11.2: Numbering of mice
11.4 Preparation of test materials
11.4.1 Test solutions: In order to administer the extract at doses of 200 mg/kg body wt and400 mg/kg body wt of mice, 240 mg of the extract were measured respectively andtriturated in unidirectional way by adding of small amount of DMSO (a suspending agent)and 3-4 drops of Tween 80. After proper mixing of extract and suspending agent, normalsaline was slowly added. The final volume of the suspension was made up to 8.0 ml. Tostabilize the suspension, it was stirred well by vortex mixture.
11.4.2 Standard solution: For the preparation of Diclofenac sodium solution at the dose of100 mg/kg body weight, 50 mg of Diclofenac sodium was taken and a suspension of 5.0 mlwas made. Few drops of Tween 80 and DMSO were mixed in solution.
11.4.3 Control solution: 3- 4 drops of Tween 80 and few drops of DMSO were mixedproperly in the normal saline and the volume was made upto 4.0 ml.
11.4.4 Acetic acid solution: For the preparation of acetic acid solution, 0.7 ml glacial aceticacid was diluted with 100 ml distilled water.
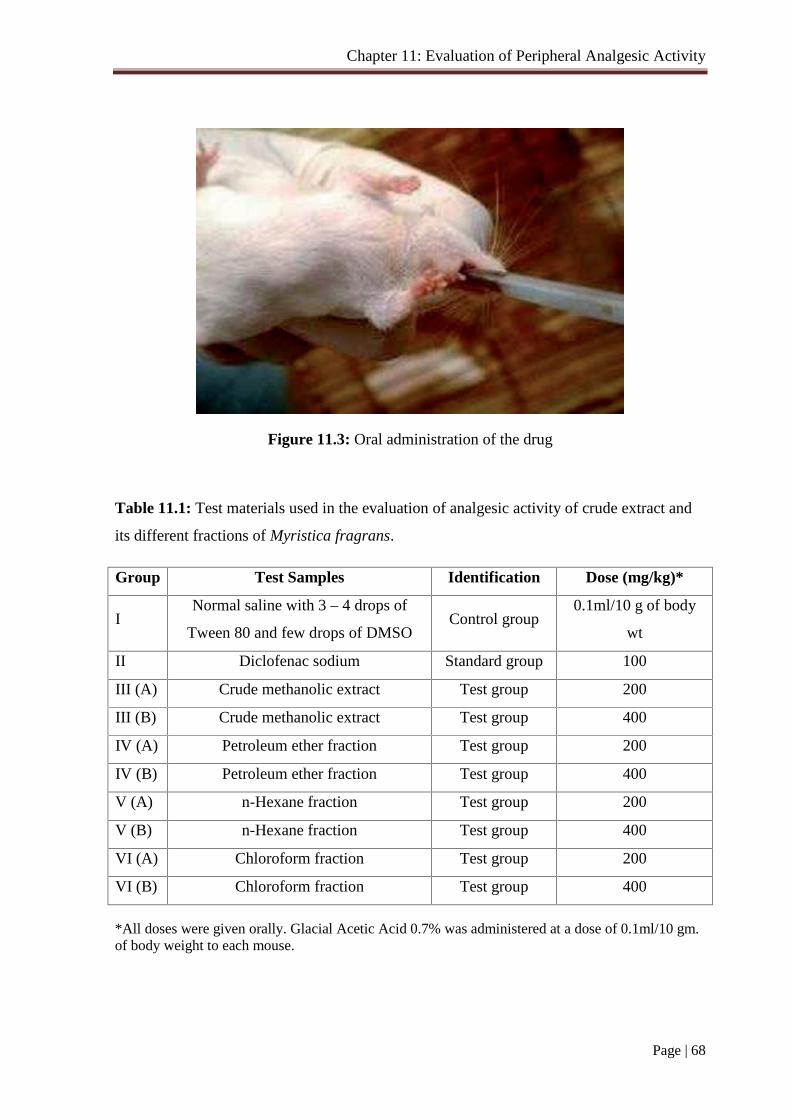
Chapter 11: Evaluation of Peripheral Analgesic Activity
Page | 68
Figure 11.3: Oral administration of the drug
Table 11.1: Test materials used in the evaluation of analgesic activity of crude extract and
its different fractions of Myristica fragrans.
Group Test Samples Identification Dose (mg/kg)*
INormal saline with 3 – 4 drops of
Tween 80 and few drops of DMSOControl group
0.1ml/10 g of body
wt
II Diclofenac sodium Standard group 100
III (A) Crude methanolic extract Test group 200
III (B) Crude methanolic extract Test group 400
IV (A) Petroleum ether fraction Test group 200
IV (B) Petroleum ether fraction Test group 400
V (A) n-Hexane fraction Test group 200
V (B) n-Hexane fraction Test group 400
VI (A) Chloroform fraction Test group 200
VI (B) Chloroform fraction Test group 400
*All doses were given orally. Glacial Acetic Acid 0.7% was administered at a dose of 0.1ml/10 gm.of body weight to each mouse.
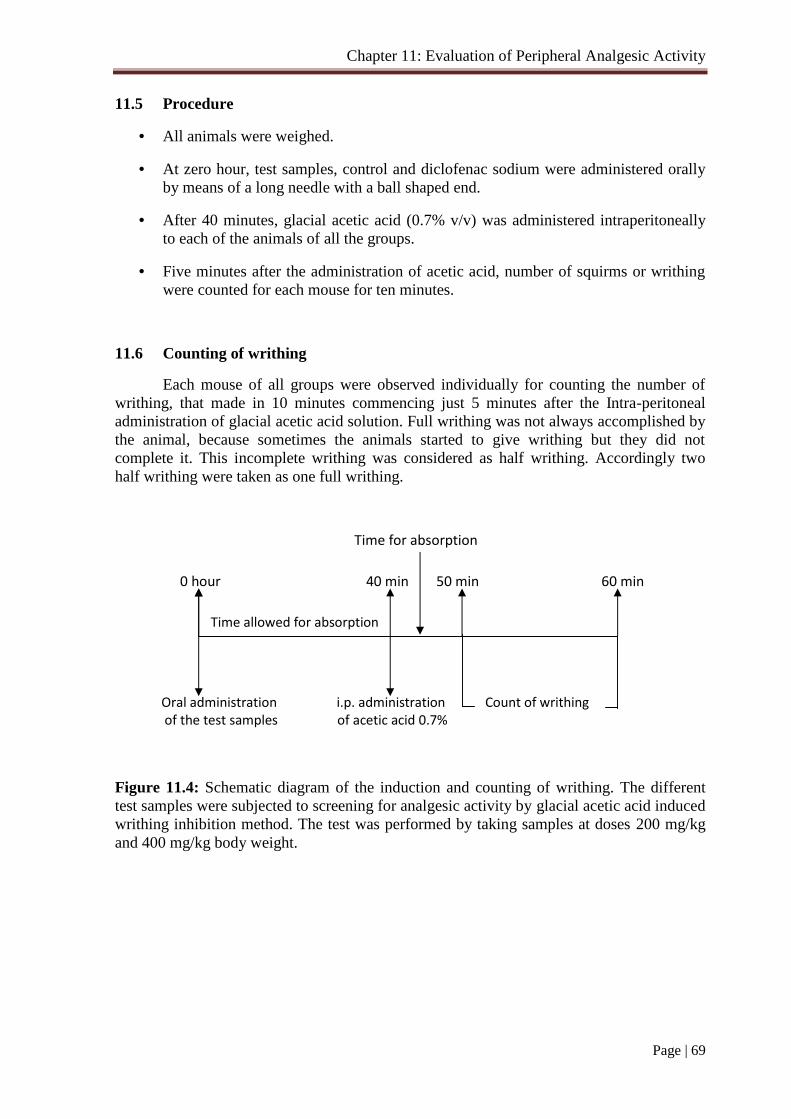
Chapter 11: Evaluation of Peripheral Analgesic Activity
Page | 69
11.5 Procedure
All animals were weighed.
At zero hour, test samples, control and diclofenac sodium were administered orallyby means of a long needle with a ball shaped end.
After 40 minutes, glacial acetic acid (0.7% v/v) was administered intraperitoneallyto each of the animals of all the groups.
Five minutes after the administration of acetic acid, number of squirms or writhingwere counted for each mouse for ten minutes.
11.6 Counting of writhing
Each mouse of all groups were observed individually for counting the number ofwrithing, that made in 10 minutes commencing just 5 minutes after the Intra-peritonealadministration of glacial acetic acid solution. Full writhing was not always accomplished bythe animal, because sometimes the animals started to give writhing but they did notcomplete it. This incomplete writhing was considered as half writhing. Accordingly twohalf writhing were taken as one full writhing.
Time for absorption
0 hour 40 min 50 min 60 min
Time allowed for absorption
Oral administration i.p. administration Count of writhingof the test samples of acetic acid 0.7%
Figure 11.4: Schematic diagram of the induction and counting of writhing. The differenttest samples were subjected to screening for analgesic activity by glacial acetic acid inducedwrithing inhibition method. The test was performed by taking samples at doses 200 mg/kgand 400 mg/kg body weight.

Chapter 11: Evaluation of Peripheral Analgesic Activity
Page | 70
Table 11.2: Screening of analgesic activity by counting the number of writhing afterintraperitoneal administration of 0.7% glacial acetic acid
Animal Group Writhing count Average %Writhing
%Inhibition
M-1 M-2 M-3 M-4 M-5Control 26 28 25 27 29 27 100
Standard 6 5 8 6 7 6.4 23.70 76.30
Crude methanolic extract(Dose- 200 mg/kg)
10 12 12 14 16 12.8 47.41 52.59
Crude methanolic extract(Dose- 400 mg/kg)
12 8 10 14 13 11.4 42.22 57.78
Petroleum ether fraction(Dose- 200 mg/kg)
10 11 12 10 13 11.2 41.48 58.52
Petroleum ether fraction(Dose- 400 mg/kg)
9 10 10 11 13 10.6 39.26 60.74
n-Hexane fraction(Dose- 200 mg/kg)
10 11 14 13 12 16 59.26 40.74
n-Hexane fraction(Dose- 400 mg/kg)
13 9 10 11 15 11.6 42.96 57.04
Chloroform fraction(Dose- 200 mg/kg)
12 16 17 13 14 14.4 53.33 46.67
Chloroform fraction(Dose- 400 mg/kg)
11 14 10 16 12 12.6 46.67 53.33
Table 11.3: Analgesic activity of crude methanolic extract and its different fractions ofMyristica fragrans
Group
Number of Writhing(Mean ± SEM)
% ofInhibition of
WrithingI. Control 100 ± 0.707 00.00
II. Standard 23.70 ± 0.509 76.30
III (A). Crude methanolic extract (Dose- 200 mg/kg) 47.41 ± 1.019 52.59
III (B). Crude methanolic extract (Dose- 400 mg/kg) 42.22 ± 1.077 57.78
IV (A). Petroleum ether fraction (Dose- 200 mg/kg) 41.48 ± 0.583 58.52
IV (B). Petroleum ether fraction (Dose- 400 mg/kg) 39.26 ± 0.678 60.74
V (A). n-Hexane soluble fraction (Dose- 200 mg/kg) 59.26 ± 0.707 40.74
V (B). n-Hexane soluble fraction (Dose- 400 mg/kg) 42.96 ± 1.077 57.04
VI (A). Chloroform soluble fraction (Dose- 200 mg/kg) 53.33 ± 0.927 46.67
VI (B). Chloroform soluble fraction (Dose- 400 mg/kg) 46.67 ± 1.077 53.33
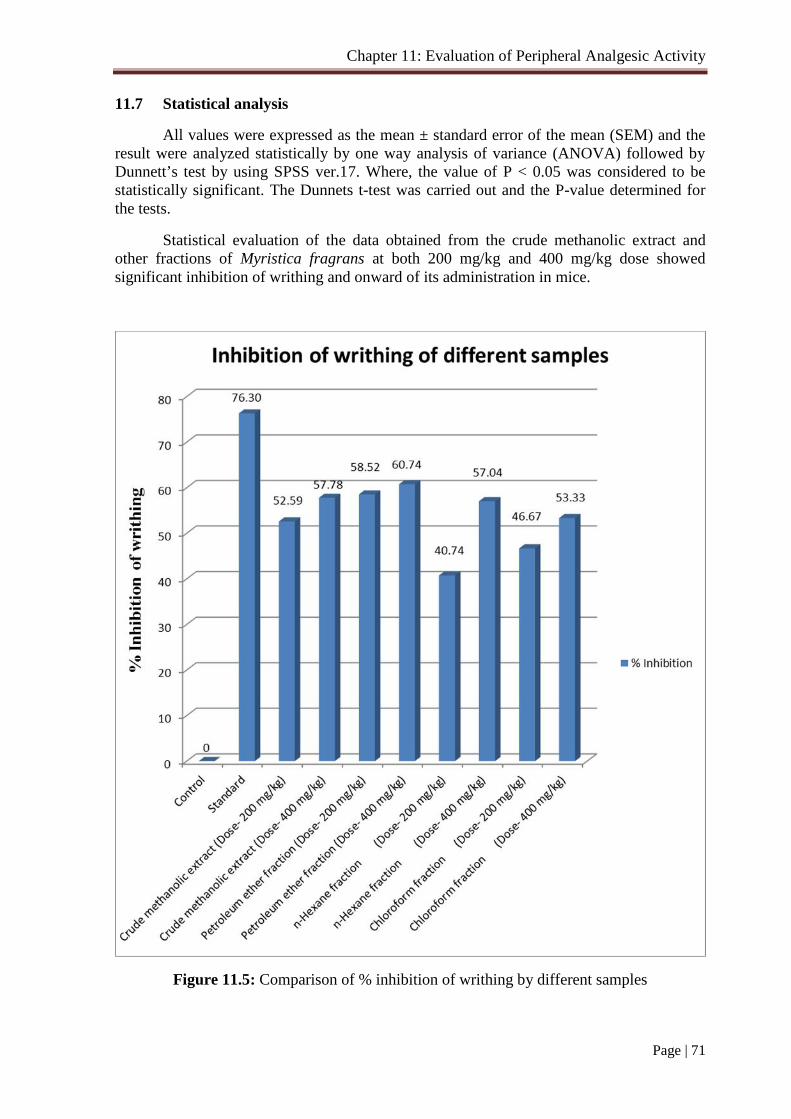
Chapter 11: Evaluation of Peripheral Analgesic Activity
Page | 71
11.7 Statistical analysis
All values were expressed as the mean ± standard error of the mean (SEM) and theresult were analyzed statistically by one way analysis of variance (ANOVA) followed byDunnett’s test by using SPSS ver.17. Where, the value of P < 0.05 was considered to bestatistically significant. The Dunnets t-test was carried out and the P-value determined forthe tests.
Statistical evaluation of the data obtained from the crude methanolic extract andother fractions of Myristica fragrans at both 200 mg/kg and 400 mg/kg dose showedsignificant inhibition of writhing and onward of its administration in mice.
Figure 11.5: Comparison of % inhibition of writhing by different samples
Chapter 11: Evaluation of Peripheral Analgesic Activity
Page | 72
11.8 Results and discussion
The effect of methanolic extract of Myristica fragrans and its fractions of petroleumether, n-hexane and chloroform on mice had showed that the extract at doses of 200 mg/kgand 400 mg/kg given significant writhing according to statistical analysis.
Acetic acid induced writhing is used to test for the screening of new analgesicagents. Inhibition of writhing for the crude methanolic extract, petroleum ether fraction, n-hexane fraction and chloroform fraction is statistically significant in double doses thansingle dose comparing to the control.
The crude methanolic extract, petroleum ether fraction, n-hexane fraction andchloroform fraction were significantly decreased the writhing in mice comparable todiclofenac sodium. Double dose had given better result than single dose.

Chapter 12: Evaluation of Anti-diabetic Activity
Page | 73
12.1 Principle
Anti-hyperglycaemic activities of methanolic extracts of the Myristica fragrans seedwill be tested in normoglycemic and streptozotocin induced diabetic mice.
Glucose tolerance property of methanol extract of Myristica fragrans seed would bedetermined as per the procedure previously described by Joy and Kuttan (1999) with minormodifications. In brief, fasted mice will be grouped into ten groups of five mice each. Thevarious groups received different treatments like Group 1 will receive vehicle (3-4 drops ofTween 80 and few drops of DMSO in normal saline) that served as control, group 2 willreceive standard drug (glibenclamide, 10 mg/kg body weight). Groups 3-10 will receivemethanol extract of Myristica fragrans seed and other fractions at doses of 200 and 400 mgper kg body weight. Each mouse will be weighed and doses adjusted accordingly prior toadministration of vehicle, standard drug, and test samples. All mice will be orallyadministered 2 g glucose/kg of body weight after 30 minutes of oral administration of testsolutions. Blood samples will be collected 30, 90 and 150 minutes after the glucoseadministration from tail vein. Blood glucose levels will be measured by glucose oxidasemethod (Venkatesh et al., 2004).
12.2 Experimental animal
Swiss-albino mice of either sex, aged 4-5 weeks and weighed 30-35 gm, obtainedfrom the Animal farm of ICDDR,B. They were kept in suitable environmental condition andfed formulated rodent food and water (ad-libitum) in the Animal House of Nutrition andFood Department of the University of Dhaka. As these animals are very sensitive toenvironmental changes, they are kept before the test for at least 3-4 days in the environmentwhere the experiment will take place.
Figure 12.1: Swiss albino mice
12.3 Experimental design
50 experimental animals were randomly selected and divided into ten groupsdenoted as group-I, group-II, group-III(A-B), group- IV(A-B), group- V(A-B), and groupVI(A-B), consisting of 5 mice in each group. Each group received a particular treatment.Prior to any treatment, each mouse was weighed properly and the doses of the test samplesand control materials were adjusted accordingly. As it was difficult to observe the biologic

Chapter 12: Evaluation of Anti-diabetic Activity
Page | 74
response of 5 mice at a time receiving same treatment, it was necessary to identifyindividual animal of a group during the treatment. The animals were individualized in thefollowing way (Figure 12.2). And marked as M1=Mice 1, M2=Mice 2, M3=Mice 3,M4=Mice 4 and M5=Mice 5.
Figure 12.2: Numbering of mice
12.4 Preparation of test materials
12.4.1 Test solutions: In order to administer the extract at doses of 200 mg/kg body wt and400 mg/kg body wt of mice, 240 mg of the extract were measured respectively andtriturated in unidirectional way by adding of small amount of DMSO (a suspending agent)and 3 -4 drops of Tween 80. After proper mixing of extract and suspending agent, normalsaline was slowly added. The final volume of the suspension was made up to 8.0 ml. Tostabilize the suspension, it was stirred well by vortex mixture.
12.4.2 Standard solution: For the preparation of Glibenclamide solution at the dose of 10mg/kg body weight, 10 mg of Glibenclamide was taken and a suspension of 4.0 ml wasmade. Few drops of Tween 80 and DMSO were mixed in solution.
12.4.3 Control solution: 3-4 drops of Tween 80 and few drops of DMSO were mixedproperly in the normal saline and the volume was made upto 4.0 ml.
12.4.4 Glucose solution: For the preparation of glucose solution at the dose of 2 g/kg bodyweight, 10 g glucose was dissolved in 100 ml of distilled water.
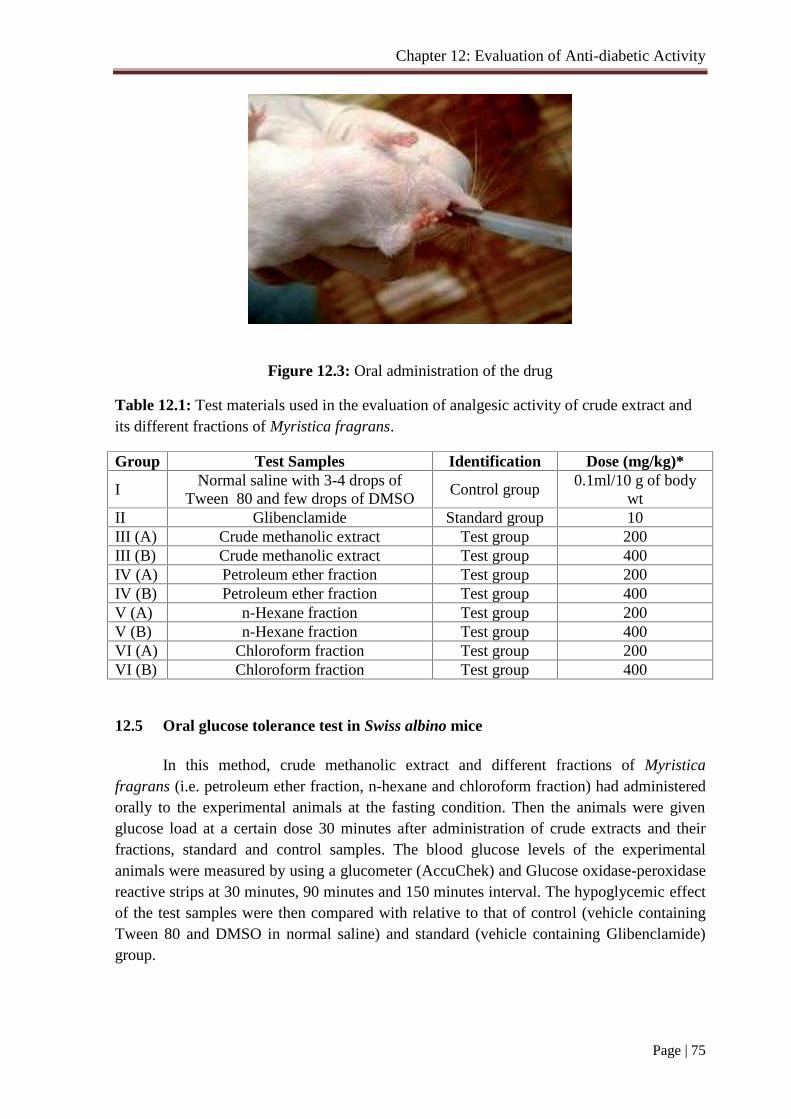
Chapter 12: Evaluation of Anti-diabetic Activity
Page | 75
Figure 12.3: Oral administration of the drug
Table 12.1: Test materials used in the evaluation of analgesic activity of crude extract andits different fractions of Myristica fragrans.
Group Test Samples Identification Dose (mg/kg)*
INormal saline with 3-4 drops of
Tween 80 and few drops of DMSOControl group
0.1ml/10 g of bodywt
II Glibenclamide Standard group 10III (A) Crude methanolic extract Test group 200III (B) Crude methanolic extract Test group 400IV (A) Petroleum ether fraction Test group 200IV (B) Petroleum ether fraction Test group 400V (A) n-Hexane fraction Test group 200V (B) n-Hexane fraction Test group 400VI (A) Chloroform fraction Test group 200VI (B) Chloroform fraction Test group 400
12.5 Oral glucose tolerance test in Swiss albino mice
In this method, crude methanolic extract and different fractions of Myristicafragrans (i.e. petroleum ether fraction, n-hexane and chloroform fraction) had administeredorally to the experimental animals at the fasting condition. Then the animals were givenglucose load at a certain dose 30 minutes after administration of crude extracts and theirfractions, standard and control samples. The blood glucose levels of the experimentalanimals were measured by using a glucometer (AccuChek) and Glucose oxidase-peroxidasereactive strips at 30 minutes, 90 minutes and 150 minutes interval. The hypoglycemic effectof the test samples were then compared with relative to that of control (vehicle containingTween 80 and DMSO in normal saline) and standard (vehicle containing Glibenclamide)group.
Chapter 12: Evaluation of Anti-diabetic Activity
Page | 76
Bloodglucose levelat fastingcondition
TreatmentGiven
GlucoseloadGiven
Blood glucose determination afterglucose load
0 min 30 min 1 hr 30 min 90 min 150 min
30 min 60 min
12.6: Procedure
1. The animals were weighed and randomly divided into ten groups consisting of 5mice in each group.
2. To perform the glucose tolerance test, mice were kept fasting overnight.3. Blood glucose level of each mouse under fasting condition was measured using
glucometer and glucose oxidase-peroxidase reactive strips and it was denoted as 0min record.
4. Blood sample were collected by cutting the tail tips with a sharp scissor.5. Blood samples were exposed to glucose test strips and blood glucose level was
visualized in the glucometer.6. After collection of blood the tail tips were exposed to Povidone iodine solution to
counteract the possibility of infection and inflammation.7. Among the mice groups, group I was considered as control receiving 0.30 ml of
Tween 80 and DMSO in normal saline each, group II was considered as standardreceiving 0.12 ml glibenclamide each, group III-VI was kept as test groups receivingcrude methanolic extract, petroleum ether fraction, n-hexane fraction and chloroformfraction of 200 mg/kg and 400 mg/kg of each respectively.
8. The extracts, standard and control samples were given orally with the help offeeding needle.
9. All the groups were administered 2g/kg body weight of glucose solution orally after30 minutes of receiving the test samples.
10. Blood glucose levels were again measured using glucometer at 30 min, 90 min and150 min after glucose administration.
11. Then the result of hypoglycemic effects of the test sample is compared in relativeto control and standard groups.
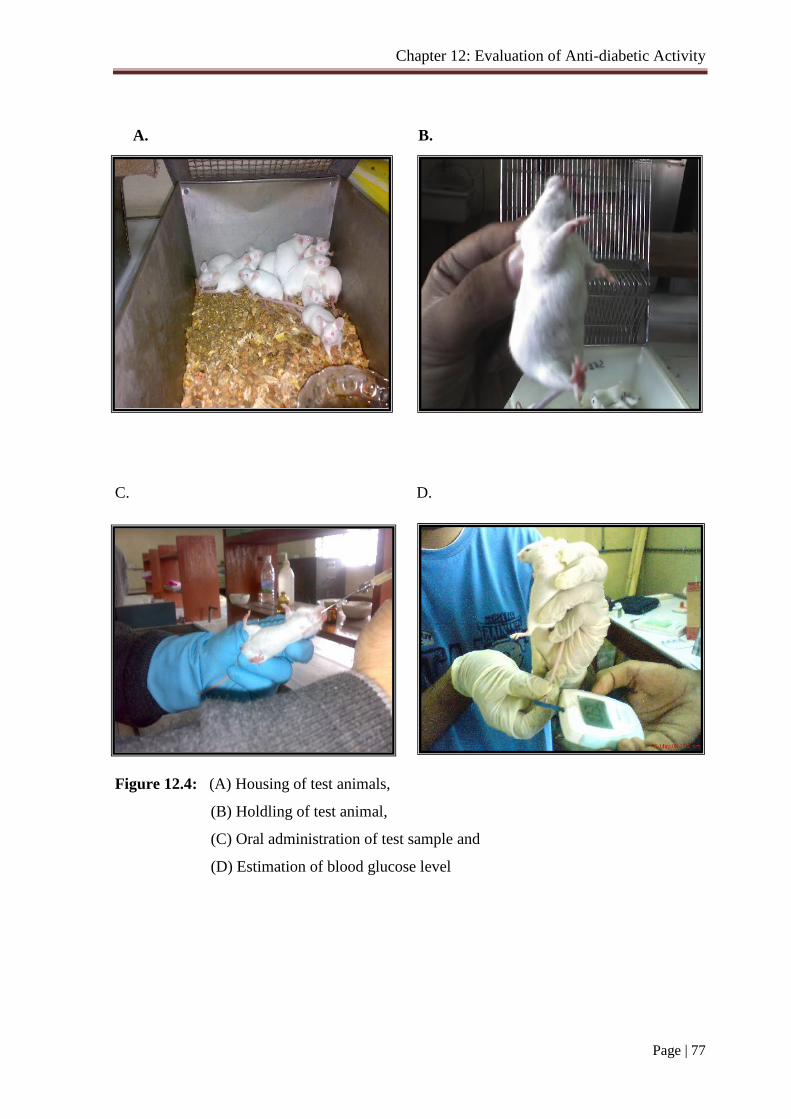
Chapter 12: Evaluation of Anti-diabetic Activity
Page | 77
A. B.
C. D.
Figure 12.4: (A) Housing of test animals,
(B) Holdling of test animal,
(C) Oral administration of test sample and
(D) Estimation of blood glucose level
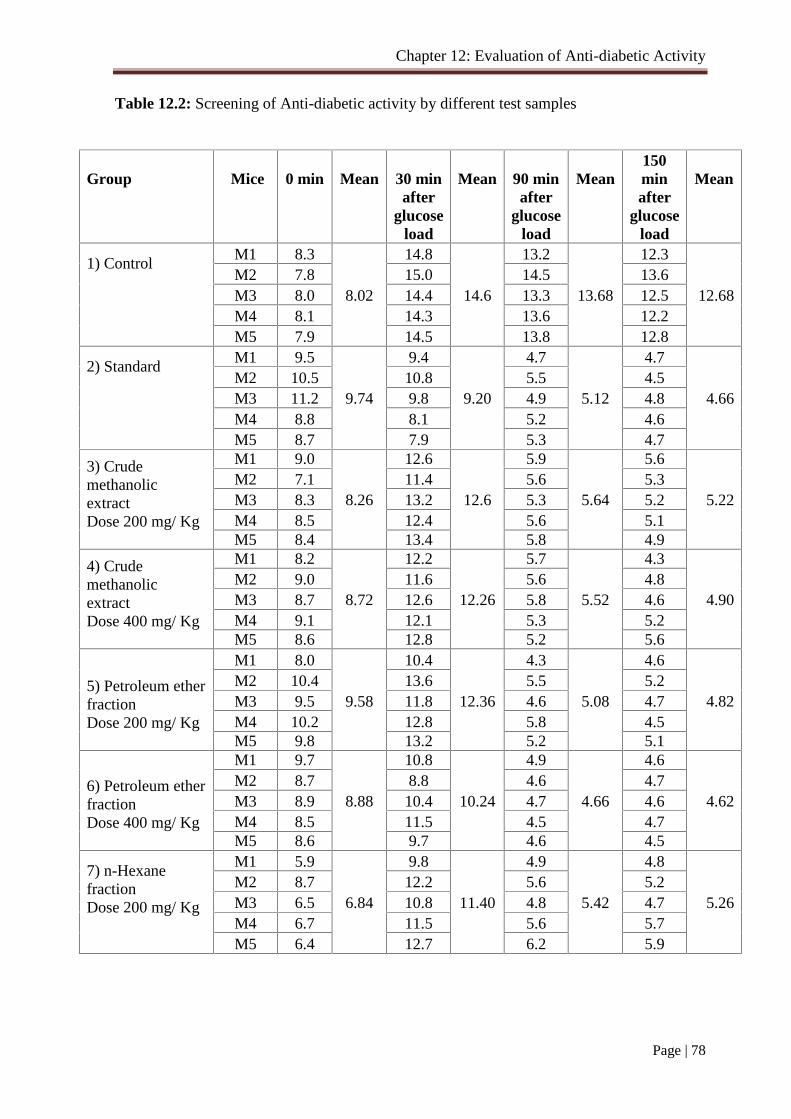
Chapter 12: Evaluation of Anti-diabetic Activity
Page | 78
Table 12.2: Screening of Anti-diabetic activity by different test samples
Group Mice 0 min Mean 30 minafter
glucoseload
Mean 90 minafter
glucoseload
Mean150minafter
glucoseload
Mean
1) ControlM1 8.3 14.8 13.2 12.3M2 7.8 15.0 14.5 13.6M3 8.0 8.02 14.4 14.6 13.3 13.68 12.5 12.68M4 8.1 14.3 13.6 12.2M5 7.9 14.5 13.8 12.8
2) StandardM1 9.5 9.4 4.7 4.7M2 10.5 10.8 5.5 4.5M3 11.2 9.74 9.8 9.20 4.9 5.12 4.8 4.66M4 8.8 8.1 5.2 4.6M5 8.7 7.9 5.3 4.7
3) CrudemethanolicextractDose 200 mg/ Kg
M1 9.0 12.6 5.9 5.6M2 7.1 11.4 5.6 5.3M3 8.3 8.26 13.2 12.6 5.3 5.64 5.2 5.22M4 8.5 12.4 5.6 5.1M5 8.4 13.4 5.8 4.9
4) CrudemethanolicextractDose 400 mg/ Kg
M1 8.2 12.2 5.7 4.3M2 9.0 11.6 5.6 4.8M3 8.7 8.72 12.6 12.26 5.8 5.52 4.6 4.90M4 9.1 12.1 5.3 5.2M5 8.6 12.8 5.2 5.6
5) Petroleum etherfractionDose 200 mg/ Kg
M1 8.0 10.4 4.3 4.6M2 10.4 13.6 5.5 5.2M3 9.5 9.58 11.8 12.36 4.6 5.08 4.7 4.82M4 10.2 12.8 5.8 4.5M5 9.8 13.2 5.2 5.1
6) Petroleum etherfractionDose 400 mg/ Kg
M1 9.7 10.8 4.9 4.6M2 8.7 8.8 4.6 4.7M3 8.9 8.88 10.4 10.24 4.7 4.66 4.6 4.62M4 8.5 11.5 4.5 4.7M5 8.6 9.7 4.6 4.5
7) n-HexanefractionDose 200 mg/ Kg
M1 5.9 9.8 4.9 4.8M2 8.7 12.2 5.6 5.2M3 6.5 6.84 10.8 11.40 4.8 5.42 4.7 5.26M4 6.7 11.5 5.6 5.7M5 6.4 12.7 6.2 5.9
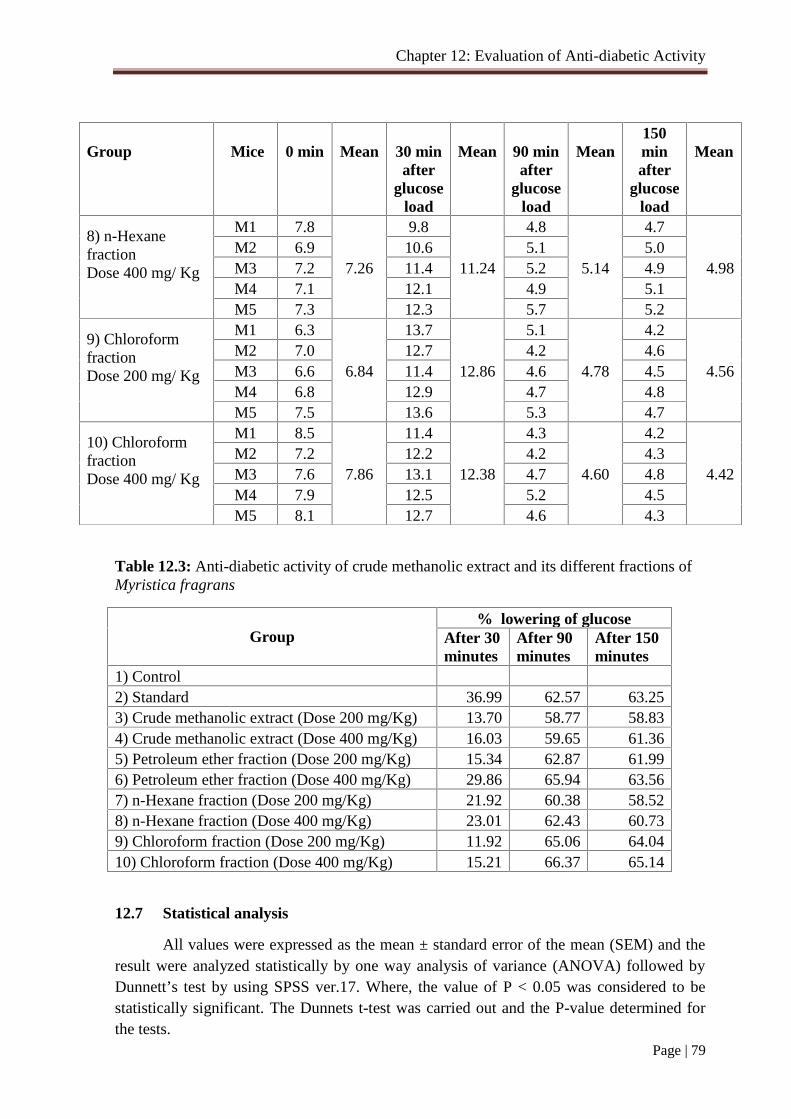
Chapter 12: Evaluation of Anti-diabetic Activity
Page | 79
Table 12.3: Anti-diabetic activity of crude methanolic extract and its different fractions ofMyristica fragrans
Group% lowering of glucose
After 30minutes
After 90minutes
After 150minutes
1) Control2) Standard 36.99 62.57 63.253) Crude methanolic extract (Dose 200 mg/Kg) 13.70 58.77 58.834) Crude methanolic extract (Dose 400 mg/Kg) 16.03 59.65 61.365) Petroleum ether fraction (Dose 200 mg/Kg) 15.34 62.87 61.996) Petroleum ether fraction (Dose 400 mg/Kg) 29.86 65.94 63.567) n-Hexane fraction (Dose 200 mg/Kg) 21.92 60.38 58.528) n-Hexane fraction (Dose 400 mg/Kg) 23.01 62.43 60.739) Chloroform fraction (Dose 200 mg/Kg) 11.92 65.06 64.0410) Chloroform fraction (Dose 400 mg/Kg) 15.21 66.37 65.14
12.7 Statistical analysis
All values were expressed as the mean ± standard error of the mean (SEM) and theresult were analyzed statistically by one way analysis of variance (ANOVA) followed byDunnett’s test by using SPSS ver.17. Where, the value of P < 0.05 was considered to bestatistically significant. The Dunnets t-test was carried out and the P-value determined forthe tests.
Group Mice 0 min Mean 30 minafter
glucoseload
Mean 90 minafter
glucoseload
Mean150minafter
glucoseload
Mean
8) n-HexanefractionDose 400 mg/ Kg
M1 7.8 9.8 4.8 4.7M2 6.9 10.6 5.1 5.0M3 7.2 7.26 11.4 11.24 5.2 5.14 4.9 4.98M4 7.1 12.1 4.9 5.1M5 7.3 12.3 5.7 5.2
9) ChloroformfractionDose 200 mg/ Kg
M1 6.3 13.7 5.1 4.2M2 7.0 12.7 4.2 4.6M3 6.6 6.84 11.4 12.86 4.6 4.78 4.5 4.56M4 6.8 12.9 4.7 4.8M5 7.5 13.6 5.3 4.7
10) ChloroformfractionDose 400 mg/ Kg
M1 8.5 11.4 4.3 4.2M2 7.2 12.2 4.2 4.3M3 7.6 7.86 13.1 12.38 4.7 4.60 4.8 4.42M4 7.9 12.5 5.2 4.5M5 8.1 12.7 4.6 4.3
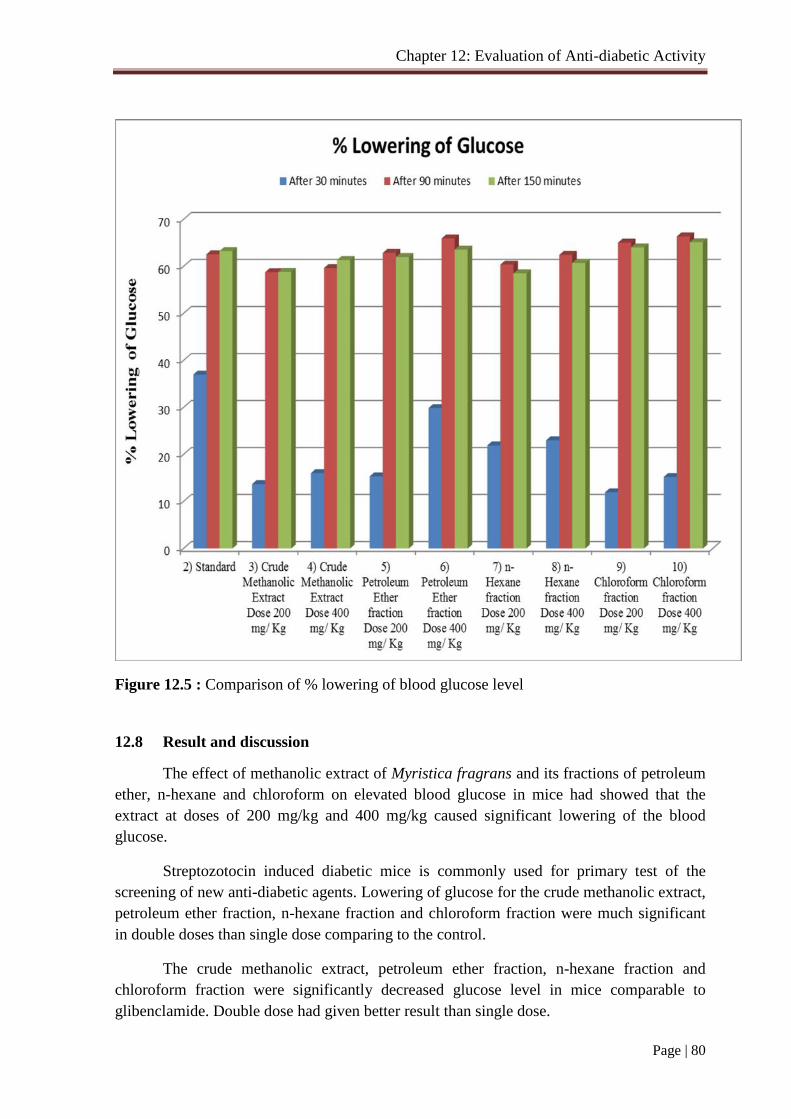
Chapter 12: Evaluation of Anti-diabetic Activity
Page | 80
Figure 12.5 : Comparison of % lowering of blood glucose level
12.8 Result and discussion
The effect of methanolic extract of Myristica fragrans and its fractions of petroleumether, n-hexane and chloroform on elevated blood glucose in mice had showed that theextract at doses of 200 mg/kg and 400 mg/kg caused significant lowering of the bloodglucose.
Streptozotocin induced diabetic mice is commonly used for primary test of thescreening of new anti-diabetic agents. Lowering of glucose for the crude methanolic extract,petroleum ether fraction, n-hexane fraction and chloroform fraction were much significantin double doses than single dose comparing to the control.
The crude methanolic extract, petroleum ether fraction, n-hexane fraction andchloroform fraction were significantly decreased glucose level in mice comparable toglibenclamide. Double dose had given better result than single dose.
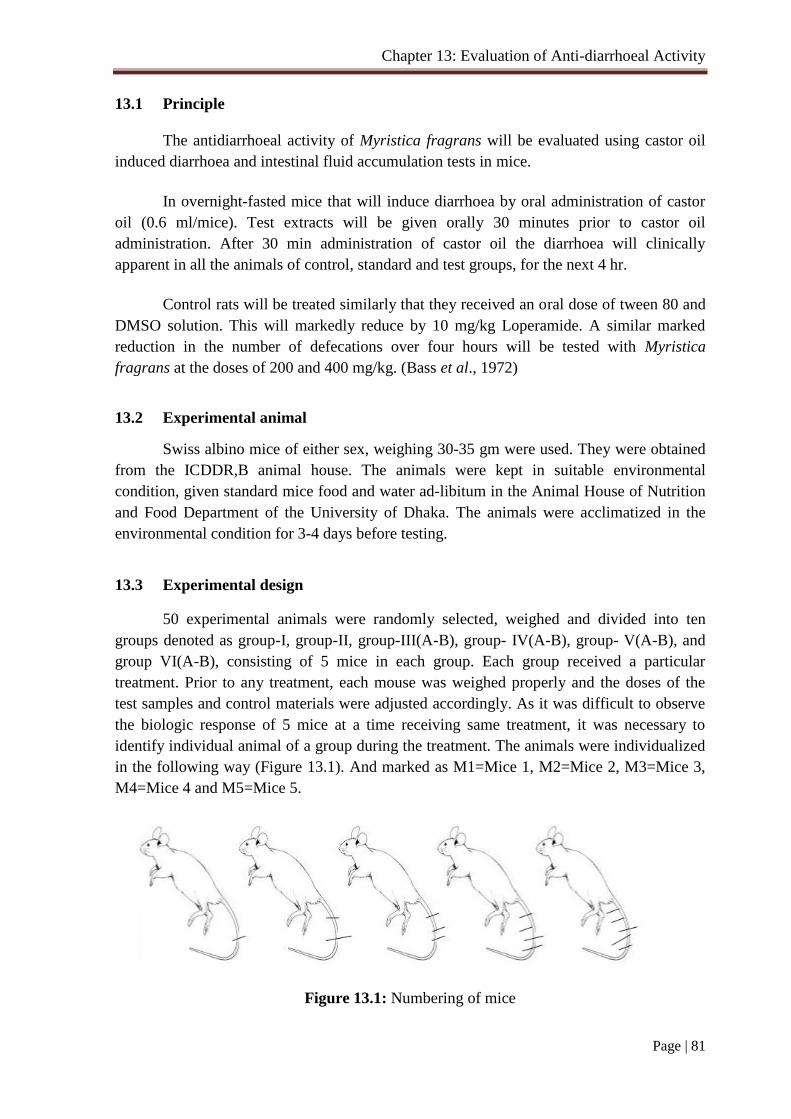
Chapter 13: Evaluation of Anti-diarrhoeal Activity
Page | 81
13.1 Principle
The antidiarrhoeal activity of Myristica fragrans will be evaluated using castor oilinduced diarrhoea and intestinal fluid accumulation tests in mice.
In overnight-fasted mice that will induce diarrhoea by oral administration of castoroil (0.6 ml/mice). Test extracts will be given orally 30 minutes prior to castor oiladministration. After 30 min administration of castor oil the diarrhoea will clinicallyapparent in all the animals of control, standard and test groups, for the next 4 hr.
Control rats will be treated similarly that they received an oral dose of tween 80 andDMSO solution. This will markedly reduce by 10 mg/kg Loperamide. A similar markedreduction in the number of defecations over four hours will be tested with Myristicafragrans at the doses of 200 and 400 mg/kg. (Bass et al., 1972)
13.2 Experimental animal
Swiss albino mice of either sex, weighing 30-35 gm were used. They were obtainedfrom the ICDDR,B animal house. The animals were kept in suitable environmentalcondition, given standard mice food and water ad-libitum in the Animal House of Nutritionand Food Department of the University of Dhaka. The animals were acclimatized in theenvironmental condition for 3-4 days before testing.
13.3 Experimental design
50 experimental animals were randomly selected, weighed and divided into tengroups denoted as group-I, group-II, group-III(A-B), group- IV(A-B), group- V(A-B), andgroup VI(A-B), consisting of 5 mice in each group. Each group received a particulartreatment. Prior to any treatment, each mouse was weighed properly and the doses of thetest samples and control materials were adjusted accordingly. As it was difficult to observethe biologic response of 5 mice at a time receiving same treatment, it was necessary toidentify individual animal of a group during the treatment. The animals were individualizedin the following way (Figure 13.1). And marked as M1=Mice 1, M2=Mice 2, M3=Mice 3,M4=Mice 4 and M5=Mice 5.
Figure 13.1: Numbering of mice

Chapter 13: Evaluation of Anti-diarrhoeal Activity
Page | 82
13.4 Preparation of test materials
13.4.1 Control solution: 3-4 drops of Tween 80 and few drops of DMSO were mixedproperly in the normal saline and the volume was made upto 4.0 ml.
13.4.2 Standard solution: Loperamide HCl (10 mg) was accurately weighed and then itwas dissolved in 5 ml normal saline (0.9% NaCl solution). Few drops of Tween 80 andDMSO were mixed in solution.
13.4.3 Test solutions: In order to obtain the dose of 200 mg/kg and 400 mg/kg bodyweight, 240 mg of the test samples were taken separately and each was finally made into 8ml suspension by means of few drops of Tween 80, DMSO and normal saline. To stabilizethe suspension, it was stirred well by vortex mixture.
13.5 Procedure
1. The animals were numbered, weighed and randomly divided into ten groups of 5mice in each group.
2. To perform the anti-diarrhoeal test, mice were kept fasting overnight.3. The crude methanolic extract, different fractions of the extract, standard and control
samples were given orally. Each group received a particular treatment as mentionedin the Table- 13.1. Loperamide at 10 mg/kg body wt. was used as standard anti-diarrhoeal agent.
4. Each mouse of all the groups were administered 0.6 ml castor oil orally 40 minutesafter receiving the treatment.
5. Faecal output was counted of each mouse at 1st hr, 2nd hr, 3rd hr and 4th hr.
Table 13.1: Test samples used for the experiment
Group Test Samples Identification Dose (mg/kg)*
INormal saline with few drops of
Tween 80 and DMSOControl group
0.1ml/10 g ofbody wt
II Loperamide HCl Standard group 10III (A) Crude methanolic extract Test group 200III (B) Crude methanolic extract Test group 400IV (A) Petroleum ether fraction Test group 200IV (B) Petroleum ether fraction Test group 400V (A) n-Hexane fraction Test group 200V (B) n-Hexane fraction Test group 400VI (A) Chloroform fraction Test group 200VI (B) Chloroform fraction Test group 400
[
Castor oil was used as a purgative at a dose of 0.6 ml
*all doses were given orally
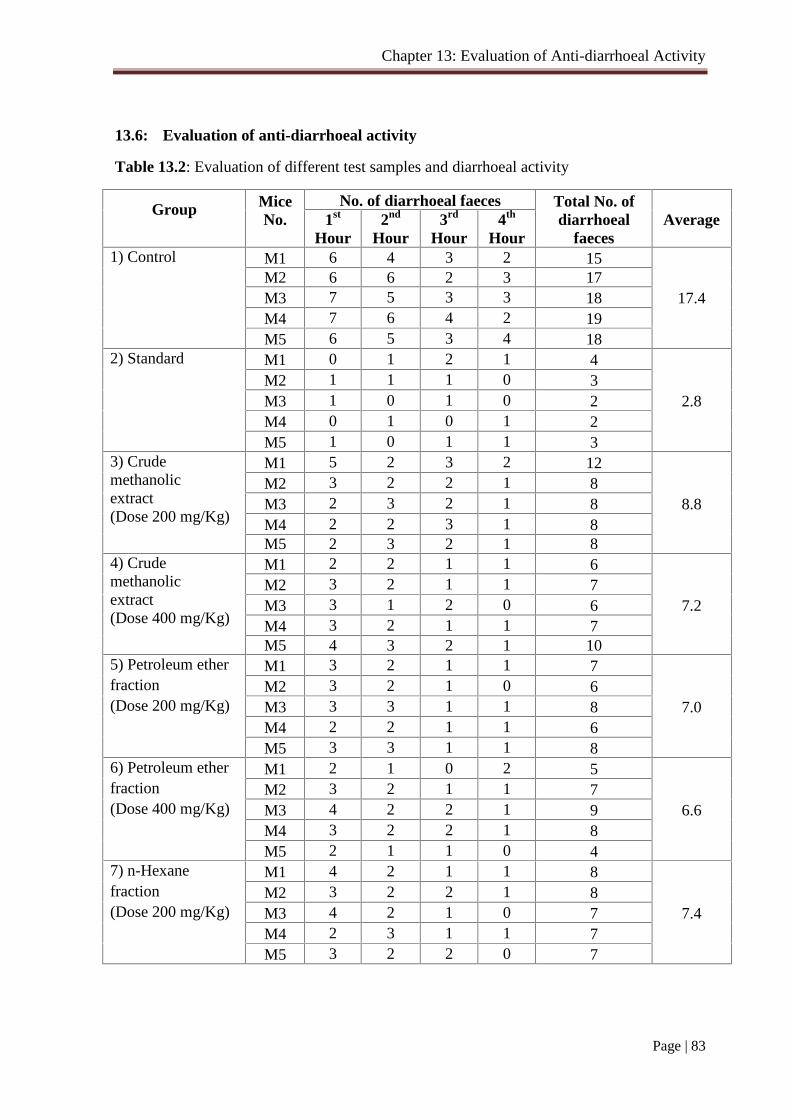
Chapter 13: Evaluation of Anti-diarrhoeal Activity
Page | 83
13.6: Evaluation of anti-diarrhoeal activity
Table 13.2: Evaluation of different test samples and diarrhoeal activity
Group MiceNo.
No. of diarrhoeal faeces Total No. ofdiarrhoeal
faecesAverage1st
Hour2nd
Hour3rd
Hour4th
Hour1) Control M1 6 4 3 2 15
M2 6 6 2 3 17M3 7 5 3 3 18 17.4M4 7 6 4 2 19M5 6 5 3 4 18
2) Standard M1 0 1 2 1 4M2 1 1 1 0 3M3 1 0 1 0 2 2.8M4 0 1 0 1 2M5 1 0 1 1 3
3) Crudemethanolicextract(Dose 200 mg/Kg)
M1 5 2 3 2 12M2 3 2 2 1 8M3 2 3 2 1 8 8.8M4 2 2 3 1 8M5 2 3 2 1 8
4) Crudemethanolicextract(Dose 400 mg/Kg)
M1 2 2 1 1 6M2 3 2 1 1 7M3 3 1 2 0 6 7.2M4 3 2 1 1 7M5 4 3 2 1 10
5) Petroleum ether M1 3 2 1 1 7fraction M2 3 2 1 0 6(Dose 200 mg/Kg) M3 3 3 1 1 8 7.0
M4 2 2 1 1 6M5 3 3 1 1 8
6) Petroleum ether M1 2 1 0 2 5fraction M2 3 2 1 1 7(Dose 400 mg/Kg) M3 4 2 2 1 9 6.6
M4 3 2 2 1 8M5 2 1 1 0 4
7) n-Hexane M1 4 2 1 1 8fraction M2 3 2 2 1 8(Dose 200 mg/Kg) M3 4 2 1 0 7 7.4
M4 2 3 1 1 7M5 3 2 2 0 7
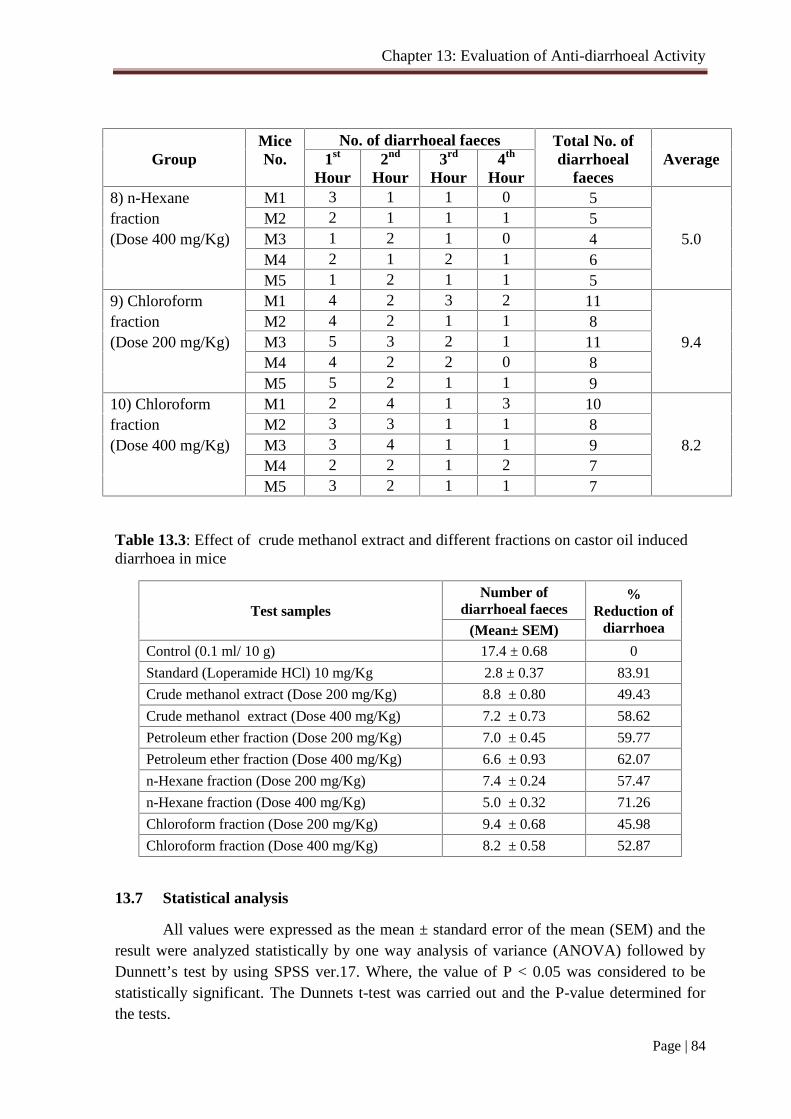
Chapter 13: Evaluation of Anti-diarrhoeal Activity
Page | 84
GroupMiceNo.
No. of diarrhoeal faeces Total No. ofdiarrhoeal
faecesAverage1st
Hour2nd
Hour3rd
Hour4th
Hour8) n-Hexane M1 3 1 1 0 5fraction M2 2 1 1 1 5(Dose 400 mg/Kg) M3 1 2 1 0 4 5.0
M4 2 1 2 1 6M5 1 2 1 1 5
9) Chloroform M1 4 2 3 2 11fraction M2 4 2 1 1 8(Dose 200 mg/Kg) M3 5 3 2 1 11 9.4
M4 4 2 2 0 8M5 5 2 1 1 9
10) Chloroform M1 2 4 1 3 10fraction M2 3 3 1 1 8(Dose 400 mg/Kg) M3 3 4 1 1 9 8.2
M4 2 2 1 2 7M5 3 2 1 1 7
Table 13.3: Effect of crude methanol extract and different fractions on castor oil induceddiarrhoea in mice
Test samplesNumber of
diarrhoeal faeces%
Reduction ofdiarrhoea(Mean± SEM)
Control (0.1 ml/ 10 g) 17.4 ± 0.68 0
Standard (Loperamide HCl) 10 mg/Kg 2.8 ± 0.37 83.91
Crude methanol extract (Dose 200 mg/Kg) 8.8 ± 0.80 49.43
Crude methanol extract (Dose 400 mg/Kg) 7.2 ± 0.73 58.62
Petroleum ether fraction (Dose 200 mg/Kg) 7.0 ± 0.45 59.77
Petroleum ether fraction (Dose 400 mg/Kg) 6.6 ± 0.93 62.07
n-Hexane fraction (Dose 200 mg/Kg) 7.4 ± 0.24 57.47
n-Hexane fraction (Dose 400 mg/Kg) 5.0 ± 0.32 71.26
Chloroform fraction (Dose 200 mg/Kg) 9.4 ± 0.68 45.98
Chloroform fraction (Dose 400 mg/Kg) 8.2 ± 0.58 52.87
13.7 Statistical analysis
All values were expressed as the mean ± standard error of the mean (SEM) and theresult were analyzed statistically by one way analysis of variance (ANOVA) followed byDunnett’s test by using SPSS ver.17. Where, the value of P < 0.05 was considered to bestatistically significant. The Dunnets t-test was carried out and the P-value determined forthe tests.
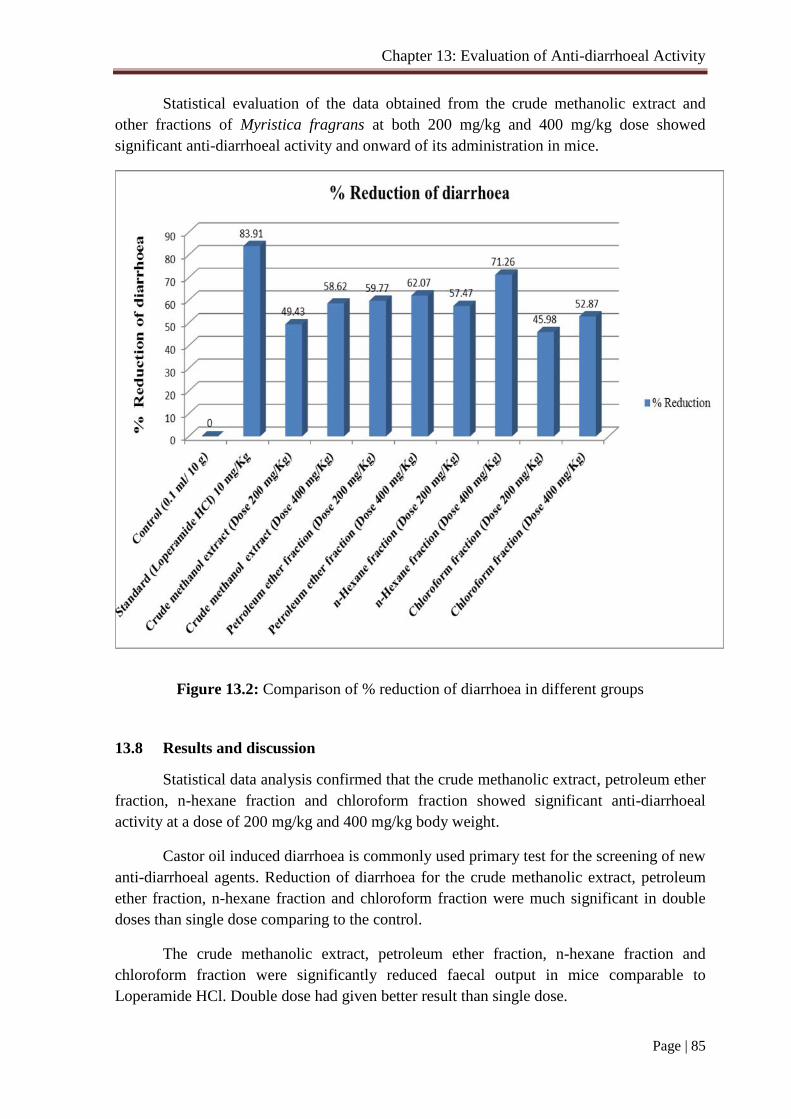
Chapter 13: Evaluation of Anti-diarrhoeal Activity
Page | 85
Statistical evaluation of the data obtained from the crude methanolic extract andother fractions of Myristica fragrans at both 200 mg/kg and 400 mg/kg dose showedsignificant anti-diarrhoeal activity and onward of its administration in mice.
Figure 13.2: Comparison of % reduction of diarrhoea in different groups
13.8 Results and discussion
Statistical data analysis confirmed that the crude methanolic extract, petroleum etherfraction, n-hexane fraction and chloroform fraction showed significant anti-diarrhoealactivity at a dose of 200 mg/kg and 400 mg/kg body weight.
Castor oil induced diarrhoea is commonly used primary test for the screening of newanti-diarrhoeal agents. Reduction of diarrhoea for the crude methanolic extract, petroleumether fraction, n-hexane fraction and chloroform fraction were much significant in doubledoses than single dose comparing to the control.
The crude methanolic extract, petroleum ether fraction, n-hexane fraction andchloroform fraction were significantly reduced faecal output in mice comparable toLoperamide HCl. Double dose had given better result than single dose.

Conclusion
Page | 86
Bangladesh is a developing country with a very poor health care system. Less than50% of the populations have access to basic health care services and the utilization ofGovernment health care facilities are very poor. So, the introduction of herbal medicine inthe national health care system may help the nation.
Plants are most valuable sources of biologically active products, which couldprovide main chemical constituents that are of prime importance in the fight againstdiseases, pain, inflammation, infections, fever, diarrhoea and diabetes etc. The seed ofMyristica fragrans has many pharmacological properties, which are directly related to thechemical constituent of the plant. Thus, the selected plants analyzed under this researchwork have some direct therapeutic effects. In that contrast, an attempt was made toinvestigate the phytochemical constituents, biological as well as pharmacological properties.
The hexane fraction contains myristicin, an anti-inflammatory principle, licarin-Band dehydro diisoeugenol which exhibited CNS depressant properties. The extracts ofnutmeg decreased kidney prostaglandin levels in rats. They also inhibited plateletaggregation (due to eugenol and isoeugenol). The anti-inflammatory activity observed incarrageenan- induced oedema in rats and enhanced vascular permeability in mice, areattributed to myristicin. It also gives anti-pyretic property.
Mace also activates hepatic detoxification process. Monomeric and dimeric phenylpropanoids (myristicin, dehydro diisoeugenol) from mace, on p.o. administration in mice,produced suppression of lipid peroxidation in liver.
The seed of Myristica fragrans possesses antioxidant, cytotoxic, anti-microbialeffect as well as other beneficial pharmacological potentialities, the disease related to theseproperties can be cured by the proper utilization of the plant that would be very muchbeneficial to our country people.
References
Dhaka University Institutional Repository Page | 87
A Al-Shammary Hayfaa, AA Malik Al-Saadi Sahar and M Al-Saeidy Awatif, Evaluation of
analgesic activity and toxicity of alkaloids in Myristica fragrans seeds in mice,
Journal of Pain Research, July 2013 Volume 2013:6, Pages 611—615
Ahmed M1, Shikha HA, Sadhu SK, Rahman MT, Datta BK. Analgesic, diuretic, and anti-
inflammatory principle from Scoparia dulcis. Pharmazie. 2001 Aug; 56(8):657-660.
A. Kumar1*, R. Ilavarasan2, T. Jayachandran1, M. Deecaraman1, P. Aravindan1, N.
Padmanabhan1 and M. R. V.Krishan1, Anti-diabetic activity of Syzygium cumini
and its isolated compound against streptozotocin induced diabetic rats, Journal of
Medicinal Plants Research Vol. 2(9), pp. 246-249, September, 2008.
Albert, V. & Struwe, L., Journal of Medicinal and Aromatic Plant Sciences, 20 (3): 740–
741.
Alluri V. Krishnaraju1, Tayi V. N. Rao1, Dodda Sundararaju1, Mulabagal Vanisree2, Hsin-
Sheng Tsay2, and Gottumukkala V. Subbaraju1*, Biological Screening of Medicinal
Plants Collected from Eastern Ghats of India Using Artemia salina (Brine Shrimp
Test), International Journal of Applied Science and Engineering, 2006. 4, 2: 115-125
Amit Jaiswal*1, Rajesh Kumar1, Kumar Abhinav1, Avanish Kumar2, Antipyretic Activity
Of Platycladus Orieantalis Leaves Extract In Rat, International Journal of Applied
Biology and Pharmaceutical Technology, Volume: 2: 250- 252, Issue-1: Jan-Mar -2011
Apurba Sarker Apu, Shakhawat Hossan Bhuyan, Shamina Saiyara Prova, and Md. Abdul
Muhit, Anti-inflammatory activity of medicinal plants native to Bangladesh: A
review, Journal of Applied Pharmaceutical Science 02 (02); 2012, 07-10
Bakhru.H.K. Herbs That Heal, Orient paper Backs (a division of vision books pvt. ltd.)
Bakhru.H.K. Foods That Heal, Orient paper Backs (a division of vision books pvt. ltd.)
Bauer AW, Kirby WMM, Sherris JC & Turck M. Antibiotic susceptibility testing by a
standardized single Disk method. Amer. I. Clin. Pathol. 45:493-6, 1966.
Barry AL. Principles and Practice of Microbiology. 3rd ed. Philadelphia: Lea & Fabiger;
1976.
Beckett. M. and Stenlake, O.I. Modified Kupchan Partition. J Med Chem. 52: 1525-1529.
Brady & Taylor, 1988, Pharmacognosy, 9th edition, Lea & Febiser, Philadelphia.
B. Mahesh and S. Satish, Antimicrobial Activity of Some Important Medicinal Plant
Against Plant and Human Pathogens, World Journal of Agricultural Sciences 4 (S):
839-843, 2008
References
Dhaka University Institutional Repository Page | 88
Chitme HR1, Chandra M, Kaushik S. Studies on anti-diarrhoeal activity of Calotropis
gigantea R.Br. in experimental animals. , 2004 Feb 25; 7(1):70-75.
Chung-Tei Chou, The Anti-inflammatory Effect of an Extract of Tripterygium wilfordii
Hook F on Adjuvant-induced Paw Oedema in Rats and Inflammatory Mediators
Release, Phytotherapy Research, Volume 11, Issue 2, pages 152–154, March 1997.
C.P. Khare, Indian Medicinal Plants, Springer, page:429
Drabu S1,Chaturvedi S1 and Sharma M2, Analgesic Activity of Methanolic Extract from
the Fruits of Trichosanthus Dioica, International Journal of Research in
Pharmaceutical and Biomedical Sciences , Vol. 3 (1) ,Jan – Mar 2012
Fatope , M.O. , Ibrahim, H, Takeda, Y. Screening of Higher Plants Reputed as Pesticides
Using the Brine Shrimp Lethality Assay, Pharmaceutical Biology, 31(4):250-
254 · January 1993.
Forrest, J.E. & Heacock, R.A. (1972), Nutmeg and mace, the psychotropic spices from
Myritica fragrans, Lloydia, 35(4), 440 – 449.
G.E.Trease and W.C.Evans, 1972, Pharmacognosy, Bailliere Tindall, London.
Ghani, A, 2012, Medicinal plants of Bangladesh with Chemical Constituents and Uses,
Asiatic society of Bangladesh, Dhaka.
Ghani, A, 1997, Practical Phytochemistry, Jahangirnagar University, Savar, Dhaka.
Ghani, A, 1990, Traditional Medicine, Jahangirnagar University, Savar, Dhaka.
Ghani, A, 1976, Practical Phytochemistry, Adeyl Brothers, Banglabazar, Dhaka.
Joy, K.L., and R.J. Kuttan, 1999., Anti-diabetic activity of Picrorrhiza kurroa extract.
Journal of Ethnopharmacology, 67: 143-148.
Kadhim M. Ibrahim, Rana K. Naem* and Amaal S. Abd-Sahib, Antibacterial Activity of
Nutmeg (Myristica fragrans) Seed Extracts Against Some Pathogenic Bacteria,
Journal of Al-Nahrain University, Vol.16 (2), July, 2013, pp.188-192.
Katiyar et al., Evaluation Of Anti-Diarrhoeal Potential Of Leaf Extracts Of Ocimum
Sanctum Linn. In Expetimental Rats, International Journal of Pharmaceutical
Sciences and Research (IJPSR), 2015; Vol. 6(11): 4804-4809.
Kirtikar KR, Basu BD, Indian Medicinal Plants. 2nd ed. Vol 1-IV, Deharadun; 1987
LIU Xin1, TANG Yu-Ping1∗, LIU Rui1, JIN Yi1, GUO Jian-Ming1, ZHAO Jin-
Long1,DING Shao-Xiong2, LIN Xiang-Zhi3, LIN Ru-Rong3, DUAN Jin-Ao1∗,Antipyretic and anti-inflammatory activities of Thais luteostoma extracts and
underlying mechanisms, Chinese Journal of Natural Medicines, 2015, 13(3):
192−198.

References
Dhaka University Institutional Repository Page | 89
M Gupta, UK Mazumdar, T Sivahkumar, MLM Vamis, S Karki, R Sambathkumar, L
Manikandan, Antioxidant And Anti-Inflammatory Activities Of Acalypha
Fruticosa, Nigerian Journal of Natural Products and Medicine Vol.7 2003: 25-29.
Matthews, W.S.A., Pickering, G.R. & Robinson, F.U. (1974), The distillation and
composition of nutmeg oils, VI. Proc. Int. Congr. Essential Oils, San Francisco, CA.
Meyer BN1, Ferrigni NR, Putnam JE, Jacobsen LB, Nichols DE, McLaughlin JL. Brine
shrimp: a convenient general bioassay for active plant constituents. Planta Med.
1982 May;45(5):31-34.
Monic shah, Pradeep Kumar Reddy P, Yerram raju Behara, Anti-diarrhoeal activity of
Toddalia asiatica (l) in castor oil induced diarrhoea in rats, International Journal of
Research in Pharmacology and Pharmacotherapeutics, Vol 1 (1), 2012, 5-9.
Muhammad Shaiful Alam Bhuiyan1, Md. Sohel Rana2, Mohammed Rahmatullah1*,
Preliminary phytochemical screening of five plant parts used in Bangladesh for
treatment of rheumatoid arthritis, Advances in Natural and Applied Sciences, 9(13)
September 2015, Pages: 15-21
N. R. Pillai And L. Lillykutty, Anti-diarrhoeal potential of Myristica fragrans seed
extracts, Ancient Science of Life, Vol No. XI No.1 & 2, July & October 1991, Pages
74- 77.
Panda, S.K., Screening Methods In The Study Of Antimicrobial Properties Of
Medicinal Plants, International Journal of Bio-Technology and Research (IJBTR)
06/2012; 2(2):1-35.
Rancy Ann Thomas, Krishnakumari, Phytochemical profiling of Myristica fragrans seed
extract with different organic solvents, Asian J Pharm Clin Res, Vol 8, Issue 1, 2015,
303-307.
S. M. Raquibul Hasan1, Md. Mokarram Hossain1, Raushanara Akter2, Mariam Jamila3, Md.
Ehsanul Hoque Mazumder1* and Shafiqur Rahman4, DPPH free radical scavenging
activity of some Bangladeshi medicinal plants, Journal of Medicinal Plants
Research, Vol. 3(11), pp. 875-879, November, 2009.
Shanthun-Al-Arefin, Shahnaz Rahman, Shiblur Rahman, Mahfuza Akter, Mahmuda
Munmun, Marjina Akter Kalpana, Sharmin Jahan, Md. Shaiful Alam Bhuiyan,
Mohammed Rahmatullah, Scientific validation of folk medicinal uses in Bangladesh
of Piper betle L. leaves to alleviate pain and lower blood sugar. Advances in Natural
and Applied Sciences, 6(8): 1496-1502, 2012.
References
Dhaka University Institutional Repository Page | 90
Sarder Fahim Hossain1, Md. Siddiqul Islam2, Salma Parvin2, Tahiatul Shams1,Mohammad
Fahim Kadir1, S. M. Ashraful Islam3, A. G. M. Mostofa4, Muhammad Shahdaat Bin
Sayeed4, Antimicrobial Screening and Brine Shrimp Lethality Bioassay of
Calotropis gigantea (Fam: Asclepiadaceae) , J. Nat. Prod. Plant Resour., 2012, 2 (1):
49-59 .
Sofowara, A. 1982, Medicinal Plants and Traditional Medicine in Africa, John Wiley and
Sons Ltd., New York, USA.
Sonali Phulsagar1, Manjunath Dundi2 , Shalini Bhagwat3, Yogesh Girigaon, An Inside
Review Of Myristica Fragrans Houtt. , A Potential Medicinal Plant Of India;
Valley International Journals, Vol 1| Issue 09 | Pg: 500-513, 2014.
Truitt, Jr., E.B. The pharmacology of myristicin and nutmeg, Ethnopharmacol. Search
Psychoact. Drugs (Proc. Symp.), 1979, pp. 215-229.
Vasundra Devi , Divya Priya , Antipyretic activity of ethanol and aqueous extract of root
of Asparagus racemosus in yeast induced pyrexia, Asian J Pharm Clin Res, Vol 6,
Suppl 3, 2013, 190-193.
Venkatesh, S., G.D. Reddy, Y.S.R. Reddy, D. Sathyavathy and B.M. Reddy, 2004. Effect of
Helicteres isora root extracts on glucose tolerance in glucose induced
hyperglycemic rats. Fitoterapia, 75: 364-367.
Venkatesan N1, Thiyagarajan V, Narayanan S, Arul A, Raja S, Vijaya Kumar SG, Rajarajan
T, Perianayagam JB., Anti-diarrhoeal potential of Asparagus racemosus wild root
extracts in laboratory animals. J Pharm Pharm Sci, 2005 Feb 25; 8(1):39-46.
Websites www. Plantillustrations.org
www. Wikipedia.com
Yukihiro Ozaki, Soekeni Soedigdo, Yoke Rosina Wattimena And Asep Gana Suganda, Anti-
inflammatory Effect of Mace, Aril of Myristica fragrans HOUTT., and Its Active
Principles, Jpn J Pharmacol. 1989 Feb; 49 (2):155-163.