Embed Size (px)
Citation preview

1
PharmaSUG 2015 Paper- IB08
Improving Data Quality - Missing Data Can Be Your Friend!
Julie Chen, United BioSource Corporation, Blue Bell, Pennsylvania
ABSTRACT
In daily clinical programming work, we always have a good chance of meeting missing data. Missing data can be found anywhere, in a dataset, listing, or table. Missing data could be generated in every step from data collection, to SDTM / ADaM dataset creation, and table/listing production. In some cases, the existence of missing data is the sign of poor data quality. However, if we find missing data and determine where it comes from, then this can be a very good source of information and actually help us to improve data quality. This paper will demonstrate how missing data could be generated, where it is most likely to occur, and present some strategies which can help us to find missing data. The most important thing is that missing data can be informative and investigating it can improve data quality.
INTRODUCTION
In general, clinical data processing begins with original data that is collected by a data collection system which is then used to create a series of datasets. If based on CDISC guidelines, we will create SDTM datasets and analysis ADaM datasets. SDTM datasets convert original data to a standard format; ADaM datasets will convert the SDTM data into standardized analytical datasets. Next we use the ADaM data to create tables, listings, and figures (TLFs). Those TLFs will be a powerful source to demonstrate whether your new drugs, new medical instruments, or new medical therapy approaches are safe and effective. As we process clinical data, there is always a good chance of encountering missing data. Dealing with this missing data is an extremely important part of validation. Missing data could mean that information is missing, lost, not available, not entered properly or misinterpreted.
Sometimes missing data is obvious and can be seen by visual inspection. But some missing data is not obvious, and you have to use good strategies to find it.
Some data is missing because it is not collected. However, some missing data is created in data processing steps. In some cases, the existence of missing data is the sign of poor data quality and is not acceptable. However, missing data is part of data processing. We have to find it, understand how and where it comes about, and let the missing data become a source of information to help us improve overall data quality. To better understand missing data, we will go through SAS data processing steps to help understand where missing data is most likely to occur and present some useful strategies on how to find it.
MISSING DATA CAN BE FOUND ANYWHERE
Datasets, listings, tables, and figures are the primary products of clinical data processing.
Datasets store the information about your study. “Original” or ‘raw’ datasets come directly from whatever tool was used to enter/collect the clinical data. When programmers receive original datasets, it is very common to find some missing data because some data may be not collected. This could be due to a situation limitation or study design. In addition some data, such as treatment groups, may be blinded and subsequently hidden due to security reasons or study schedules. These missing data values will remain in all the datasets that are derived from those original datasets.
Today, most studies follow CDISC standards to store data. To meet this requirement, Standard Data Tabulation Model (SDTM) datasets need to be created directly from original datasets. Some studies may follow proprietary company standards, which also require new, standardized datasets be created. These datasets, whether they follow

IB08- Improving Data Quality - Missing Data Can Be Your Friend, continued
2
SDTM or some other standard, are intended to store the original data in a standardized format. For ease of reference in this paper, these standardized datasets will be referred to as SDTM datasets.
Once data is collected and stored in a standard format, analysis needs to be done so sponsors and regulatory agencies can determine whether the medical product can be approved to go to market. To facilitate this process, analysis datasets are created. Following CDISC Analysis Dataset Model (ADaM) or other guidelines, analysis datasets can be created either from original datasets or from standardized SDTM datasets.
From original datasets to SDTM to ADaM datasets, SAS data steps can pass missing data from dataset to dataset. At the beginning of the data step, SAS sets the value of each variable to missing in the Program Data Vector (PDV), no matter whether the variable comes from an existing dataset or was newly created by you. Then SAS replaces these missing values as it encounters values that are assigned to the variables.
All newly created SDTM and ADaM datasets will have missing data if data is missing in the original datasets. However, during the process of transforming original datasets to SDTM datasets to ADaM datasets, a lot of new variables will be created. These variables are derived from the study protocol and statistical analysis plan. As we will discuss in the rest of the paper, a lot of data processing steps may create missing data as well.
Another area where missing data can be created is in data listings. Creating a data listing involves pulling data from an analysis or original dataset and displaying the original collection value. As a result, missing data in the original pull-in dataset will present as missing in the listing. The listing is the first window to show you some missing data from the pulled-in dataset. When creating a listing, we may also need to create some new variables. Sometimes we need to concatenate different variables to make them display in one column for the listing, produce a date conversion to let the date display in a specific date format, or change the data structure to display some special test results based on each record date/visit. All those transformations involve multiple SAS procedures and each step will have a chance to create new missing data.
It is common to find a category missing in the table output if a variable used to make table categories has missing data.
A. Missing data found in a dataset B. Missing data found in a listing
C. Missing data found in a table
Figure1. Missing data can be found in dataset (A), listing (B) and Table (C).
IB08- Improving Data Quality - Missing Data Can Be Your Friend, continued
3
MISSING DATA CAN BE GENERATED IN EVERY STEP DURING THE DATA PROCESSING
As stated earlier, the SAS data processing starts from missing values for newly created variables. SAS sets the value of each newly created variable to missing in PDV, and then replaces the missing value with the values that you assign to the variable. When a new variable is created, if for any reason the assignment statement is not appropriate, the newly created variable may be created as missing data.
The following steps will show you how easy it is to create missing data when a new variable is created in programming.
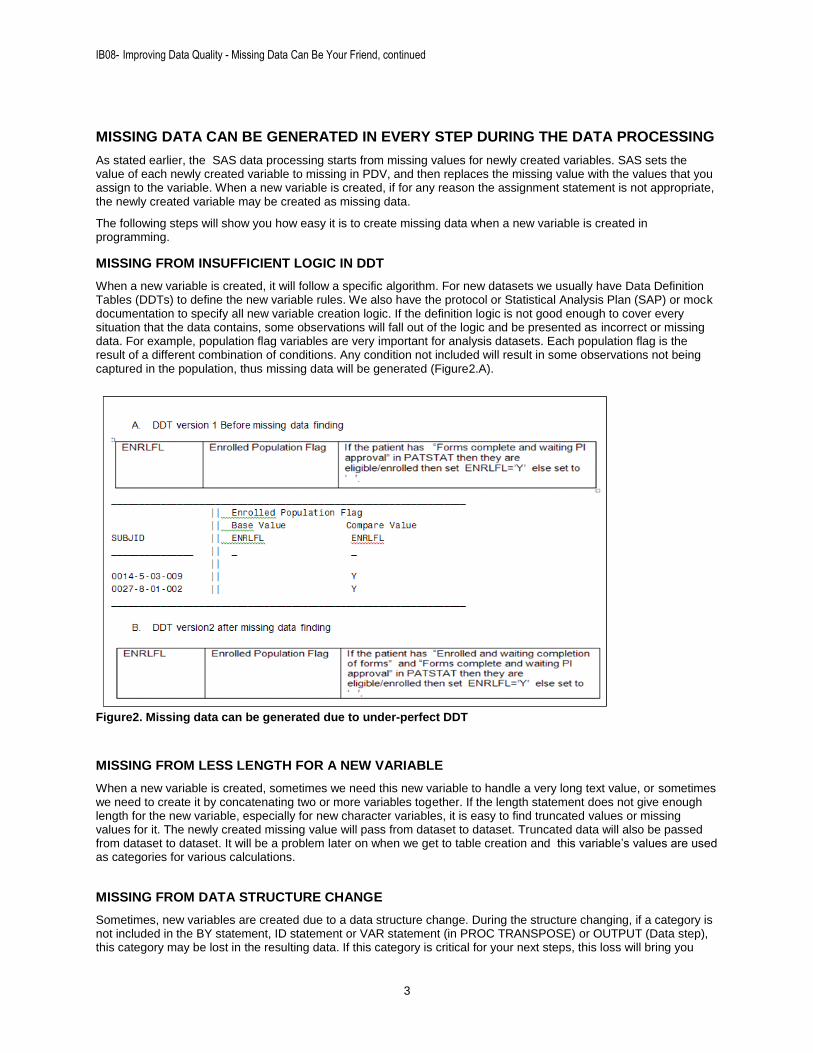
MISSING FROM INSUFFICIENT LOGIC IN DDT
When a new variable is created, it will follow a specific algorithm. For new datasets we usually have Data Definition Tables (DDTs) to define the new variable rules. We also have the protocol or Statistical Analysis Plan (SAP) or mock documentation to specify all new variable creation logic. If the definition logic is not good enough to cover every situation that the data contains, some observations will fall out of the logic and be presented as incorrect or missing data. For example, population flag variables are very important for analysis datasets. Each population flag is the result of a different combination of conditions. Any condition not included will result in some observations not being captured in the population, thus missing data will be generated (Figure2.A).
Figure2. Missing data can be generated due to under-perfect DDT
MISSING FROM LESS LENGTH FOR A NEW VARIABLE
When a new variable is created, sometimes we need this new variable to handle a very long text value, or sometimes we need to create it by concatenating two or more variables together. If the length statement does not give enough length for the new variable, especially for new character variables, it is easy to find truncated values or missing values for it. The newly created missing value will pass from dataset to dataset. Truncated data will also be passed from dataset to dataset. It will be a problem later on when we get to table creation and this variable’s values are used as categories for various calculations.
MISSING FROM DATA STRUCTURE CHANGE
Sometimes, new variables are created due to a data structure change. During the structure changing, if a category is not included in the BY statement, ID statement or VAR statement (in PROC TRANSPOSE) or OUTPUT (Data step), this category may be lost in the resulting data. If this category is critical for your next steps, this loss will bring you

IB08- Improving Data Quality - Missing Data Can Be Your Friend, continued
4
trouble later. Figure3 is one example. The PROC TRANSPOSE procedure can make the original dataset change from a vertical structure to a horizontal structure (Figure3.C). If we only use SUBJID, VSDT and ACYCLE in the BY statement, we will get the new dataset shown in Figure3.A, Note the variable TRTPN is lost. If we use SUBJID, VSDT, TRTPN and ACYCLE in the BY statement, the new dataset will retain the TRTPN variable (Figure3.B).
A. Original dataset
B. Transposed without TRTPN
C. Transposed with TPTP
Figure3. Variable lost during data structure change (A) original dataset, (B) transposed by variables excluding TRTPN, (C) transposed by variables including TRTPN.
MISSING FROM IMPROPER ELIMINATING DUPLICATED RECORDS
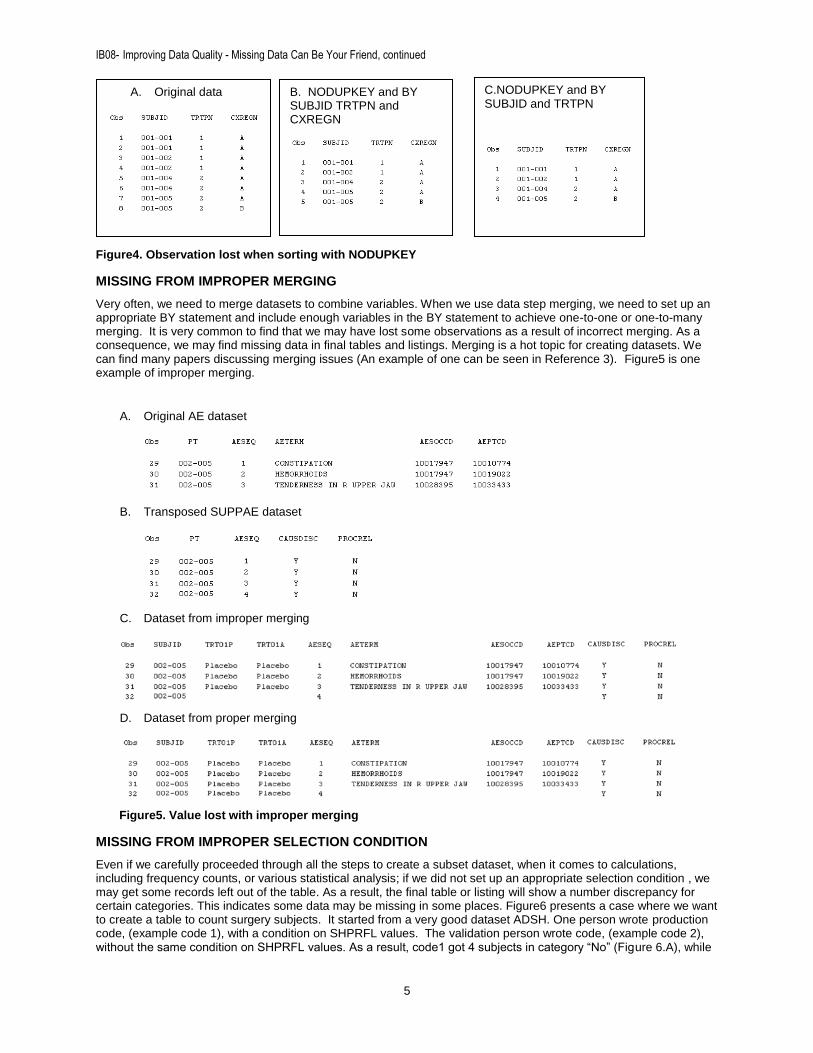
Sometimes we may have duplicate records that need to be removed. In order to accomplish this, we might carefully use the NODUPKEY option in the PROC SORT procedure or the FIRST.var / LAST.var in a data step. The most tricky part to be aware of, is the BY statement. If variables in the BY statement are not sufficient, it is possible to eliminate observations in error from the new dataset. As a result, missing data is created and will be passed to new generations of datasets and/or TLFs that you did not intend. As you can see in Figure4.C, if variables in the BY statement only contain SUBJID and TRTPN, 001-005 will lose one observation with CXREGN = A. If in the final table this category is used to count subject number for CXREGN = A, 001-005 will be missed for the CXREGN = A category in the table (Figure4.B).
IB08- Improving Data Quality - Missing Data Can Be Your Friend, continued
5
Figure4. Observation lost when sorting with NODUPKEY
MISSING FROM IMPROPER MERGING
Very often, we need to merge datasets to combine variables. When we use data step merging, we need to set up an appropriate BY statement and include enough variables in the BY statement to achieve one-to-one or one-to-many merging. It is very common to find that we may have lost some observations as a result of incorrect merging. As a consequence, we may find missing data in final tables and listings. Merging is a hot topic for creating datasets. We can find many papers discussing merging issues (An example of one can be seen in Reference 3). Figure5 is one example of improper merging.
A. Original AE dataset
B. Transposed SUPPAE dataset
C. Dataset from improper merging
D. Dataset from proper merging
Figure5. Value lost with improper merging
MISSING FROM IMPROPER SELECTION CONDITION
Even if we carefully proceeded through all the steps to create a subset dataset, when it comes to calculations, including frequency counts, or various statistical analysis; if we did not set up an appropriate selection condition , we may get some records left out of the table. As a result, the final table or listing will show a number discrepancy for certain categories. This indicates some data may be missing in some places. Figure6 presents a case where we want to create a table to count surgery subjects. It started from a very good dataset ADSH. One person wrote production code, (example code 1), with a condition on SHPRFL values. The validation person wrote code, (example code 2), without the same condition on SHPRFL values. As a result, code1 got 4 subjects in category “No” (Figure 6.A), while
A. Original data
B. NODUPKEY and BY SUBJID TRTPN and CXREGN
C.NODUPKEY and BY SUBJID and TRTPN

IB08- Improving Data Quality - Missing Data Can Be Your Friend, continued
6
code 2 only got 3 subjects in category “No” (Figure 6.B). Obviously one subject 001-007 with the category “No” was missing from code 2.
Code1:
data surg ;
length psbflc $50 ;
set adslib.adsh (where = (saffl = 'Y')) ;
if shprfl = "Y" then
do ;
if upcase(shtum) = "TUMOR BIOPSIED NOT RESECTED" then
psbflc = "Tumor Biopsied Not Resected" ;
else if upcase(shtum) ^= "TUMOR BIOPSIED NOT RESECTED" and
shtum ^= "NA"
then psbflc = "Yes" ;
else if upcase(shtum) = "NA" then psbflc = "No" ;
end ;
else psbflc = "No" ;
run ;
Code2:
data surg ;
length psbflc $50 ;
set adslib.adsh (where = (saffl = 'Y')) ;
if upcase(shtum) = "TUMOR BIOPSIED NOT RESECTED" then
psbflc = "Tumor Biopsied Not Resected" ;
else if upcase(shtum) ^= "TUMOR BIOPSIED NOT RESECTED" and
shtum ^= "NA" then psbflc = "Yes" ;
else if upcase(shtum) = "NA" then psbflc = "No" ;
run ;
A. Result of code1:
B. Result of code2:
Figure6. Missing data created due to selection not being complete to cover all conditions.
HOW TO FIND MISSING DATA
As we discussed above, some missing data may be passed from the original collected data and some missing data may be generated from data steps. Any missing data may bring some trouble for data processing. Most SAS procedures use their own special way to present missing data. Whenever missing data happens, we can find convenient, effective and simple strategy to confirm the missing data. Then we can decide what to do next: either

IB08- Improving Data Quality - Missing Data Can Be Your Friend, continued
7
resolve the missing issue or move forward with good strategy to avoid the missing data trouble.
Any of the following SAS techniques can help to find missing data whenever it is convenient.
PROC FREQ
Whenever we suspect that a variable may have missing value, PROC FREQ may be the first SAS procedure that most people like to use. PROC FREQ, along with the missing option, can provide counts for all values of the tested variable included in the TABLE statement, including the missing value.
As the example in Figure7 shows, some observations have a missing value for the variable EPIREAS. The PROC FREQ result can tell you exactly 261 records have missing values for this variable. If you set up a cross-tabulation test in PROC FREQ, you will find more tested variables may have some missing data.
PROC FREQ can also give you a quick view for all values of the variable tested in the TABLE statement. If those values will be used for some categories in a table, any truncated value may be hiding missing data. PROC FREQ will help to find it. This is extremely useful for character variables.
The following little macro can be your handy tool to use PROC FREQ to check any variable missing data (results in Figure7 indicate there are 261 missing observations for the variable EPIREAS).
%macro frqchk(dsn=, dovar=) ;
proc freq data = &dsn nlevels noprint ;
tables &dovar /nocum nopercent list missing
out = &dovar (drop = percent) ;
run ;
proc print data = &dovar (where = (&printme)) ;
title "%UPCASE(&DSN &DOVAR) INFORMATION" ;
run ;
%mend frqchk ;
%frqchk(dsn=adsl, dovar=epireas) ;
Figure7. PROC FREQ checked missing data for one specific character variable
PROC SORT PLUS PROC PRINT
PROC SORT plus PROC PRINT with a where statement is one handy simple way to check for missing values for a variable. Sorting by a specific variable in ascending order, results in all missing values showing up first in the output (as variable EPOCH shown in Figure8). The where operator in PROC SORT and PROC PRINT gives you more flexibility to subset a small scale dataset to help you reach the checkpoint. Meanwhile the VAR statement can help you focus on target variable (s).
proc sort data = adeg out = eg ;
by epoch ;
run ;
proc print data = eg (where = (&printme)) ;
title "%UPCASE(&PROGNAME: EPOCH MISSING CASE CHECKING" ;
run ;

IB08- Improving Data Quality - Missing Data Can Be Your Friend, continued
8
Figure8. PROC SORT + PROC PRINT checks missing data for a target variable
DATA STRUCTURE CHANGE
Data structure changes may also help find missing data. For some dataset, like a lab dataset, we may find the PROC PRINT and PROC FREQ techniques are not be able to find missing data at all, even if there are some missing tests. In this case, it is better to change the dataset structure first, so the original one record per visit structure is switched to one record per test structure. Then the PROC FREQ or PROC PRINT output can help to find which test result is missing, or which test is missing. PROC TRANSPOSE is one way to help you to change data structure. Figure9 can show how the transposed data structure easily presents missing data in this case. With a little more work we can also use a data step as the alternative way to change dataset structure to check missing data.
A. Original dataset
B. Code: proc transpose data= advs out= final
(drop = _name_ _label_) ;
by &pat vsdt ;
id vstestcd ;
var vsorresn ;
run ;
C. Transposed dataset
Figure9. Check missing data by PROC TRANSPOSE.
DATA STEP TECHNIQUES
In a data step, other techniques can also be used to check missing data. N and NMISS functions can return the number of non-missing and missing values, respectively, from a list of numeric arguments.
Code similar to the following can help you check for both ordinary missing and special missing values for numeric variables:
if numvar = . or numvar <= .z then do;

IB08- Improving Data Quality - Missing Data Can Be Your Friend, continued
9
The following code can help you check missing value for character variables.
if charvar = “” then do;
The following code can help you check missing value for both character and numeric variables.
if missing(var) then do;
For numeric variables, arithmetic calculation approaches are also useful to find missing data. Within SAS, if you use a missing value in an arithmetic calculation, SAS automatically sets the result of that calculation to missing. If you use that result in another calculation, the next result is also missing. SAS prints notes in the log to notify you which arithmetic expression has missing values while processing continues. As a result, you will find that a new variable has missing data. The log message also tells us when the missing data is generated. Based on missing data in the new variable and our log message, it is not too hard to find out where the original missing data occurred.
SAS VIEWTABLE WINDOW
SAS displays missing numeric data as simple period (.) or “special” missing value (._, or .A – .Z). SAS displays missing character data as a blank. Within SAS, a missing value for a numeric variable is smaller than all numbers (negative number, 0, positive number). A Missing value of a character variable is smaller than any printable character value.
The basic way to check whether there is missing data is to inspect the dataset in SAS Universal Viewer or in a ViewTable window. If you suspect a variable may have missing data, you can check that variable’s values by sorting in ascending order in SAS viewer. This way can fully take advantage of SAS missing data handling rules. Any missing data in numeric variable or in character variable will display first by ascending sorting.
TABLE CATEGORY FREQUENCY NUMBER MISMATCHING
Tables present summary analysis of the data, including frequency or summary statistics or any other calculation of results for some important categories in the study. Having the best quality data, the summary numbers in each category of the table will match very well with the dataset specific subset. It should also match with listing results as well. Very often, some investigators like to put one category into a different topic to make various comparisons. As a result, we will find this category is displayed in different tables. Good data quality will make this category number consistent from table to table.
Using table outputs, if you find a number discrepancy for one specific category between table and dataset, or between table and listing, or among different tables, it is a clue that there is a missing issue on either the table side or the dataset side.
HOW TO USE MISSING DATA TO IMPROVE DATA QUALITY
Any missing data found in a dataset, listing, or table means something. It is an important issue that arises for any study. Missing data cannot be ignored!
To make sure data quality is good, it is important to have appropriate answers for each missing data value. Understanding whether the missing data should be presented is important for having confidence in the data quality.
If missing data is generated at the data collection site, it must be presented in original dataset and only the investigator can confirm whether it is reasonable to be missing or not. Such missing data will pass from dataset to dataset, and be reflected in any listing or table, until the investigator makes any updates.
If missing data is generated after data collection, it may also represent nature of the data collected and may be validly missing. This will be passed to newly generated datasets and TLFs. On the other hand, if the newly generated missing data should not be missing, we have to find solution to fix the missing issue.
If the newly created missing data is found to be a programming issue, such as a variable length issue, merging issue, data structure changing issue, or any unexpected programming issues, you must update the program to correct any programming issue. If the missing data is not due to programming issues, it is good time to consider whether there is a variable definition issue. For some complicated studies, we may have to go through multiple rounds of updates until we capture all the conditions in one variable definition to make it perfect and clean up the missing issue. If the missing data is a dataset issue, then we need to contact the dataset production side to inform them of your finding. Any of your findings will be valuable for dataset improvement. What often happens when you create dataset downstream products, TLFs, you realize some data is missing in original input dataset. Therefore any feedback from downstream of datasets, especially missing data issues will be a very good source for dataset updates, and will be highly appreciated in a good data processing team.

IB08- Improving Data Quality - Missing Data Can Be Your Friend, continued
10
It is also not strange to find out that some newly created missing data is neither a programming issue nor a current DDT issue. Everything may perfectly match with the current SAP/CRF/protocol, but only thing we know for sure are those missing data values should not appear here. In this situation, it may be a good time for study design level to consider whether any possible improvements need to be made to protocol, SAP, CRF.
As summarized in Figure10, missing data can guide you to go back to check any potential issues which may impact data quality.
Figure10. Missing data helps to check potential issues critical for data quality
In the clinical data industry, time is always a scarce commodity. We cannot wait for all missing data issues to be resolved before we start data processing. In many cases, we have to process the data we have to work with, even with some missing data. Finding missing data is very important at this stage so you will understand why the missing data exists here; and you will know whether it impacts your data quality and you can move forward with good programming strategies. Missing data investigation will give you a chance to review the entire data processing.
You can try any of these techniques to find missing data and use good strategy to avoid the bad consequences caused by missing data to keep your data processing moving forward.
Code like the following can do multiple functions:
(1) Find missing data (2) Write a log message if a missing data is found in order to keep track whether the missing issue is resolved in
the near future (3) Replace the missing data with a special value so you can keep your data processing moving forward without
the missing data trouble. The special value for the missing data will be the good alarm in the near future if the missing issue is not resolved.
%macro findmis (inset=, chkcond=, chkvar=, makeup=, trsvar=) ;
Data &inset ;
set &inset ;
if &chkcond then
do ;
&makeup ;
put "%upcase(WARNING: MISSING &CHKVAR IN DATASET &INSET, REPLACED WITH
&MAKEUP )" &trsvar ;
end ;
run ;
%mend findmis ;
%findmis (inset = cm,
chkcond = %str(cmdecod = ""),
chkvar = cmdecod,
makeup = %str(cmdecod = 'NON-CODED'),
trsvar = %str(&upat= cmtrt= cmstdtc= cmendtc= cmdecod= )) ;
IB08- Improving Data Quality - Missing Data Can Be Your Friend, continued
11
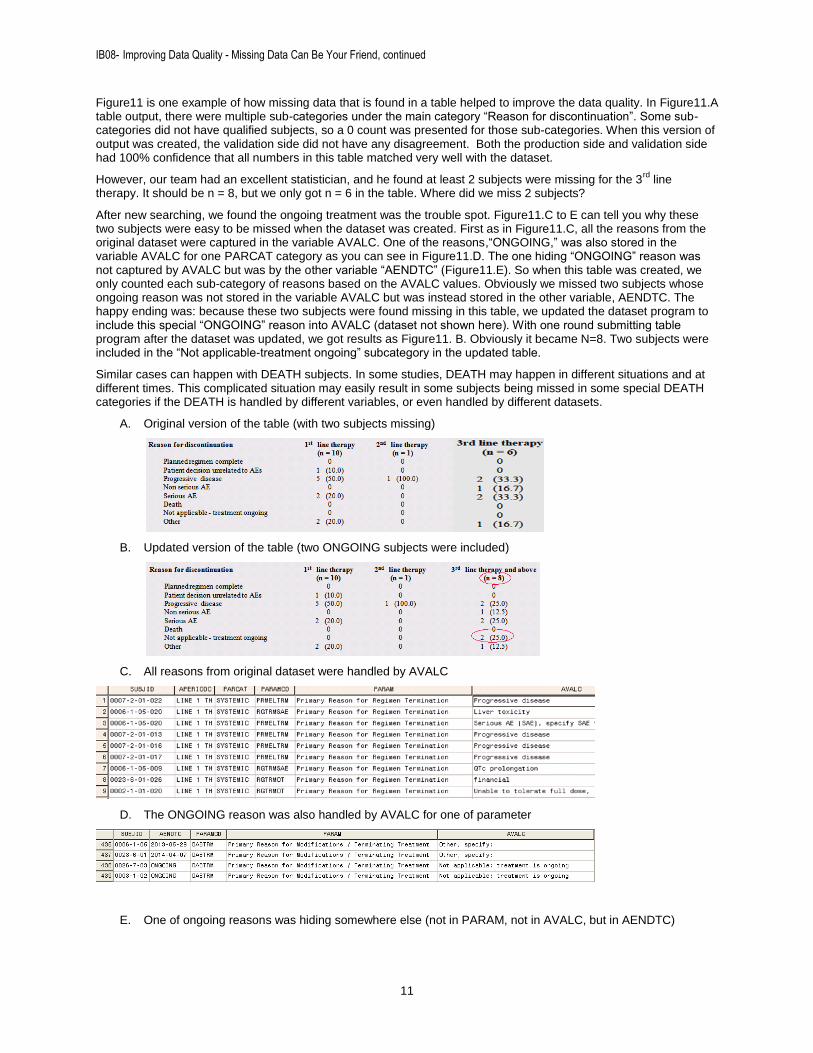
Figure11 is one example of how missing data that is found in a table helped to improve the data quality. In Figure11.A table output, there were multiple sub-categories under the main category “Reason for discontinuation”. Some sub-categories did not have qualified subjects, so a 0 count was presented for those sub-categories. When this version of output was created, the validation side did not have any disagreement. Both the production side and validation side had 100% confidence that all numbers in this table matched very well with the dataset.
However, our team had an excellent statistician, and he found at least 2 subjects were missing for the 3rd
line therapy. It should be n = 8, but we only got n = 6 in the table. Where did we miss 2 subjects?
After new searching, we found the ongoing treatment was the trouble spot. Figure11.C to E can tell you why these two subjects were easy to be missed when the dataset was created. First as in Figure11.C, all the reasons from the original dataset were captured in the variable AVALC. One of the reasons,“ONGOING,” was also stored in the variable AVALC for one PARCAT category as you can see in Figure11.D. The one hiding “ONGOING” reason was not captured by AVALC but was by the other variable “AENDTC” (Figure11.E). So when this table was created, we only counted each sub-category of reasons based on the AVALC values. Obviously we missed two subjects whose ongoing reason was not stored in the variable AVALC but was instead stored in the other variable, AENDTC. The happy ending was: because these two subjects were found missing in this table, we updated the dataset program to include this special “ONGOING” reason into AVALC (dataset not shown here). With one round submitting table program after the dataset was updated, we got results as Figure11. B. Obviously it became N=8. Two subjects were included in the “Not applicable-treatment ongoing” subcategory in the updated table.
Similar cases can happen with DEATH subjects. In some studies, DEATH may happen in different situations and at different times. This complicated situation may easily result in some subjects being missed in some special DEATH categories if the DEATH is handled by different variables, or even handled by different datasets.
A. Original version of the table (with two subjects missing)
B. Updated version of the table (two ONGOING subjects were included)
C. All reasons from original dataset were handled by AVALC
D. The ONGOING reason was also handled by AVALC for one of parameter
E. One of ongoing reasons was hiding somewhere else (not in PARAM, not in AVALC, but in AENDTC)
IB08- Improving Data Quality - Missing Data Can Be Your Friend, continued
12
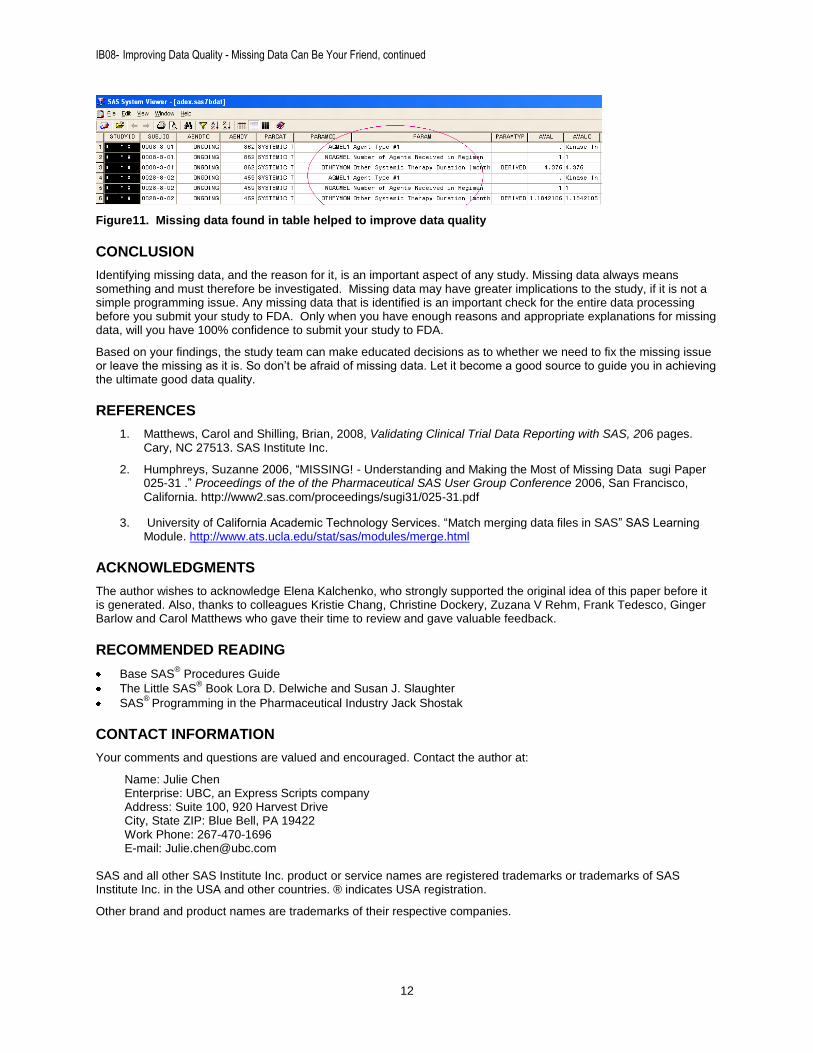
Figure11. Missing data found in table helped to improve data quality
CONCLUSION
Identifying missing data, and the reason for it, is an important aspect of any study. Missing data always means something and must therefore be investigated. Missing data may have greater implications to the study, if it is not a simple programming issue. Any missing data that is identified is an important check for the entire data processing before you submit your study to FDA. Only when you have enough reasons and appropriate explanations for missing data, will you have 100% confidence to submit your study to FDA.
Based on your findings, the study team can make educated decisions as to whether we need to fix the missing issue or leave the missing as it is. So don’t be afraid of missing data. Let it become a good source to guide you in achieving the ultimate good data quality.
REFERENCES
1. Matthews, Carol and Shilling, Brian, 2008, Validating Clinical Trial Data Reporting with SAS, 206 pages. Cary, NC 27513. SAS Institute Inc.
2. Humphreys, Suzanne 2006, “MISSING! - Understanding and Making the Most of Missing Data sugi Paper 025-31 .” Proceedings of the of the Pharmaceutical SAS User Group Conference 2006, San Francisco,
California. http://www2.sas.com/proceedings/sugi31/025-31.pdf
3. University of California Academic Technology Services. “Match merging data files in SAS” SAS Learning Module. http://www.ats.ucla.edu/stat/sas/modules/merge.html
ACKNOWLEDGMENTS
The author wishes to acknowledge Elena Kalchenko, who strongly supported the original idea of this paper before it is generated. Also, thanks to colleagues Kristie Chang, Christine Dockery, Zuzana V Rehm, Frank Tedesco, Ginger Barlow and Carol Matthews who gave their time to review and gave valuable feedback.
RECOMMENDED READING
Base SAS® Procedures Guide
The Little SAS® Book Lora D. Delwiche and Susan J. Slaughter
SAS®
Programming in the Pharmaceutical Industry Jack Shostak
CONTACT INFORMATION
Your comments and questions are valued and encouraged. Contact the author at:
Name: Julie Chen Enterprise: UBC, an Express Scripts company Address: Suite 100, 920 Harvest Drive City, State ZIP: Blue Bell, PA 19422 Work Phone: 267-470-1696 E-mail: [email protected]
SAS and all other SAS Institute Inc. product or service names are registered trademarks or trademarks of SAS Institute Inc. in the USA and other countries. ® indicates USA registration.
Other brand and product names are trademarks of their respective companies.