Embed Size (px)
Citation preview
1
PharmaSUG 2016 - Paper IB11
AE: An Essential Part of Safety Summary Table Creation.
Rucha Landge, Inventiv International Pharma Services Pvt. Ltd., Pune, India
ABSTRACT
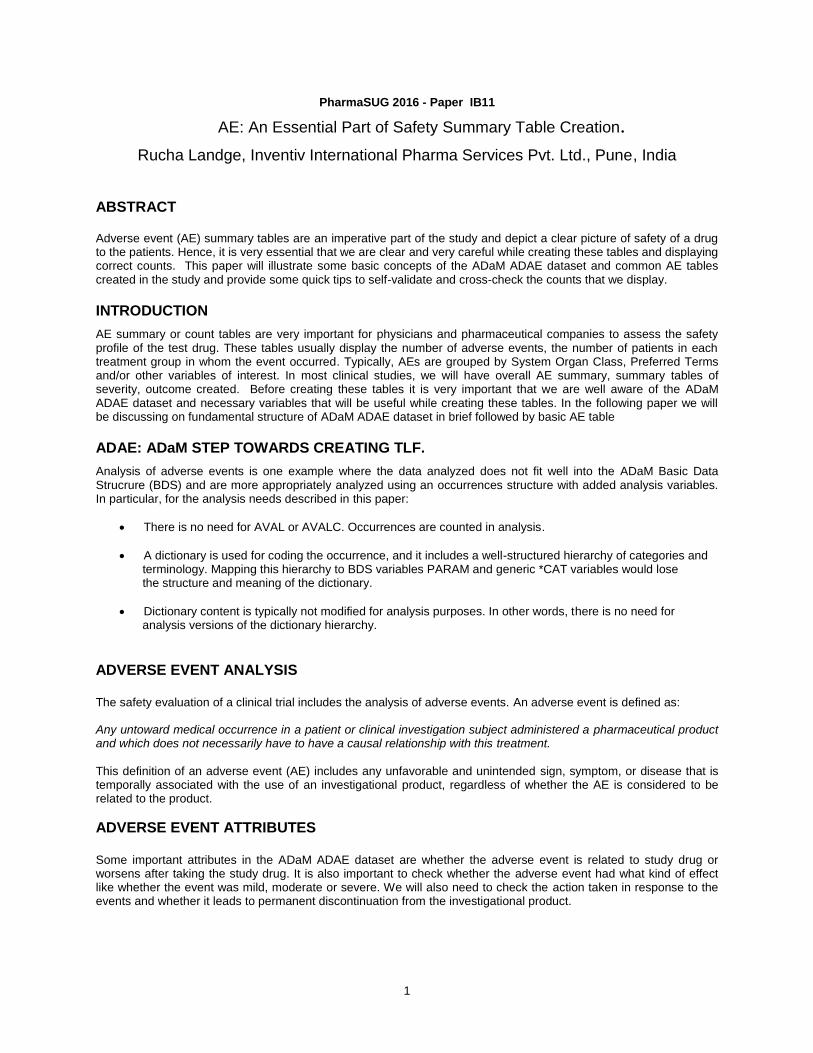
Adverse event (AE) summary tables are an imperative part of the study and depict a clear picture of safety of a drug to the patients. Hence, it is very essential that we are clear and very careful while creating these tables and displaying correct counts. This paper will illustrate some basic concepts of the ADaM ADAE dataset and common AE tables created in the study and provide some quick tips to self-validate and cross-check the counts that we display.
INTRODUCTION
AE summary or count tables are very important for physicians and pharmaceutical companies to assess the safety profile of the test drug. These tables usually display the number of adverse events, the number of patients in each treatment group in whom the event occurred. Typically, AEs are grouped by System Organ Class, Preferred Terms and/or other variables of interest. In most clinical studies, we will have overall AE summary, summary tables of severity, outcome created. Before creating these tables it is very important that we are well aware of the ADaM ADAE dataset and necessary variables that will be useful while creating these tables. In the following paper we will be discussing on fundamental structure of ADaM ADAE dataset in brief followed by basic AE table
ADAE: ADaM STEP TOWARDS CREATING TLF.
Analysis of adverse events is one example where the data analyzed does not fit well into the ADaM Basic Data Strucrure (BDS) and are more appropriately analyzed using an occurrences structure with added analysis variables. In particular, for the analysis needs described in this paper:
There is no need for AVAL or AVALC. Occurrences are counted in analysis.
A dictionary is used for coding the occurrence, and it includes a well-structured hierarchy of categories and terminology. Mapping this hierarchy to BDS variables PARAM and generic *CAT variables would lose the structure and meaning of the dictionary.
Dictionary content is typically not modified for analysis purposes. In other words, there is no need for analysis versions of the dictionary hierarchy.
ADVERSE EVENT ANALYSIS The safety evaluation of a clinical trial includes the analysis of adverse events. An adverse event is defined as: Any untoward medical occurrence in a patient or clinical investigation subject administered a pharmaceutical product and which does not necessarily have to have a causal relationship with this treatment.
This definition of an adverse event (AE) includes any unfavorable and unintended sign, symptom, or disease that is temporally associated with the use of an investigational product, regardless of whether the AE is considered to be related to the product.
ADVERSE EVENT ATTRIBUTES Some important attributes in the ADaM ADAE dataset are whether the adverse event is related to study drug or worsens after taking the study drug. It is also important to check whether the adverse event had what kind of effect like whether the event was mild, moderate or severe. We will also need to check the action taken in response to the events and whether it leads to permanent discontinuation from the investigational product.
AE as essential part of summary table creation, continued
2
CODING OF ADVERSE EVENTS
Medical Dictionary for Regulatory Activities (MedDRA) is a widely used global standard for coding of adverse events. A few other coding dictionaries include WHO Adverse Reaction Terminology (WHO-ART), Coding Symbols for a Thesaurus of Adverse Reaction Terms (COSTART), International Classification of Disease (ICD). Each coding dictionary is characterized by classifying each verbatim term into a hierarchy of medical granularity. For example, if a verbatim term was recorded as ‘Obstipation’, using MedDRA V19.0, this verbatim term would result in a System Organ Class (SOC) of ‘Gastrointestinal Disorders’ and a preferred term (PT) of ‘Constipation’. It is also recommended that all levels of terms in the MedDRA: System Organ Class (SOC), High Level Group Term (HLGT), High Level Term (HLT), Lowest Level Term (LLT), and Preferred Term (PT) are represented, as these are frequently useful in further analyses of AEs.
STATISTICAL ANALYSIS The most frequently used method for the comparison of adverse events between treatment groups is the summarization of the number of subjects who experienced a given adverse event at least once by the dictionary derived term. These counts and related percentages are presented for levels of the System Organ Class and preferred term. The denominator used for the calculation of the percentages is often determined by a population flag, such as the total number of subjects at risk or total number of subjects exposed to each treatment (e.g. SAFFL=’Y’). Note that some subjects exposed to treatment may not have any adverse events, and therefore these subjects would not be represented in the SDTM AE domain and ADaM ADAE analysis dataset. Thus, the values of the denominator usually need to be obtained from ADSL (subject level analysis dataset) rather than directly from ADAE.
ADAE VARIABLES:
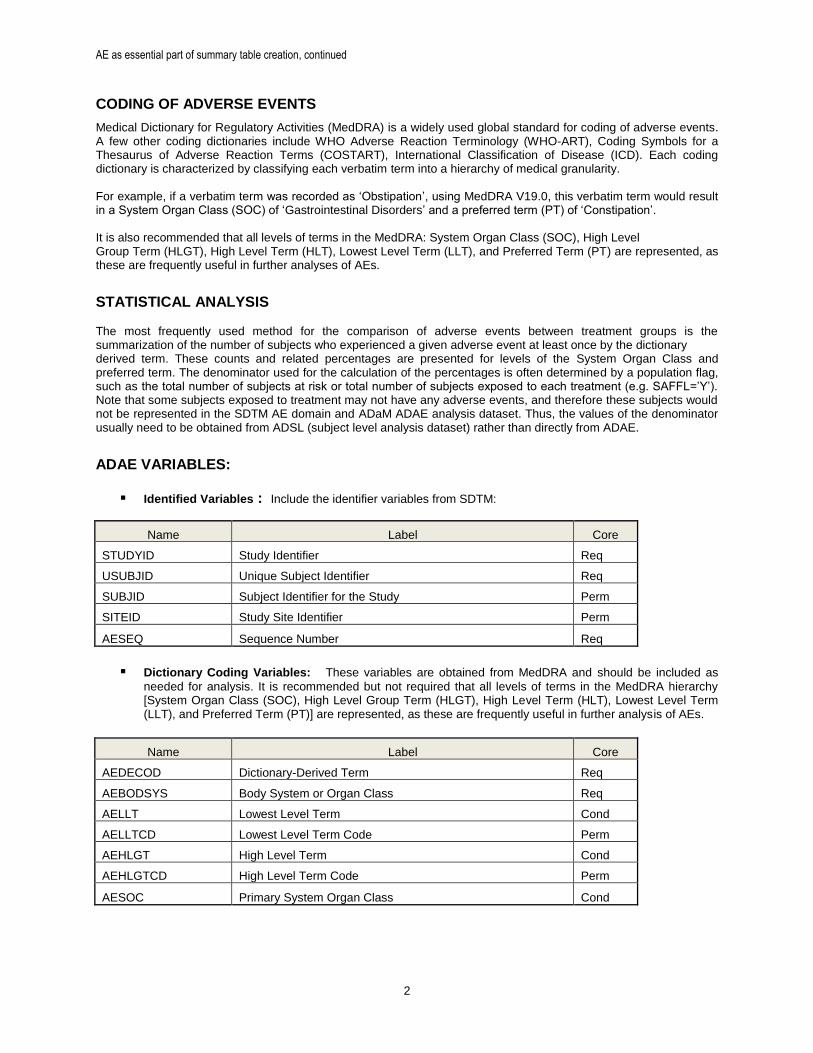
Identified Variables : Include the identifier variables from SDTM:
Name Label Core
STUDYID Study Identifier Req
USUBJID Unique Subject Identifier Req
SUBJID Subject Identifier for the Study Perm
SITEID Study Site Identifier Perm
AESEQ Sequence Number Req
Dictionary Coding Variables: These variables are obtained from MedDRA and should be included as
needed for analysis. It is recommended but not required that all levels of terms in the MedDRA hierarchy [System Organ Class (SOC), High Level Group Term (HLGT), High Level Term (HLT), Lowest Level Term (LLT), and Preferred Term (PT)] are represented, as these are frequently useful in further analysis of AEs.
Name Label Core
AEDECOD Dictionary-Derived Term Req
AEBODSYS Body System or Organ Class Req
AELLT Lowest Level Term Cond
AELLTCD Lowest Level Term Code Perm
AEHLGT High Level Term Cond
AEHLGTCD High Level Term Code Perm
AESOC Primary System Organ Class Cond
AE as essential part of summary table creation, continued
3
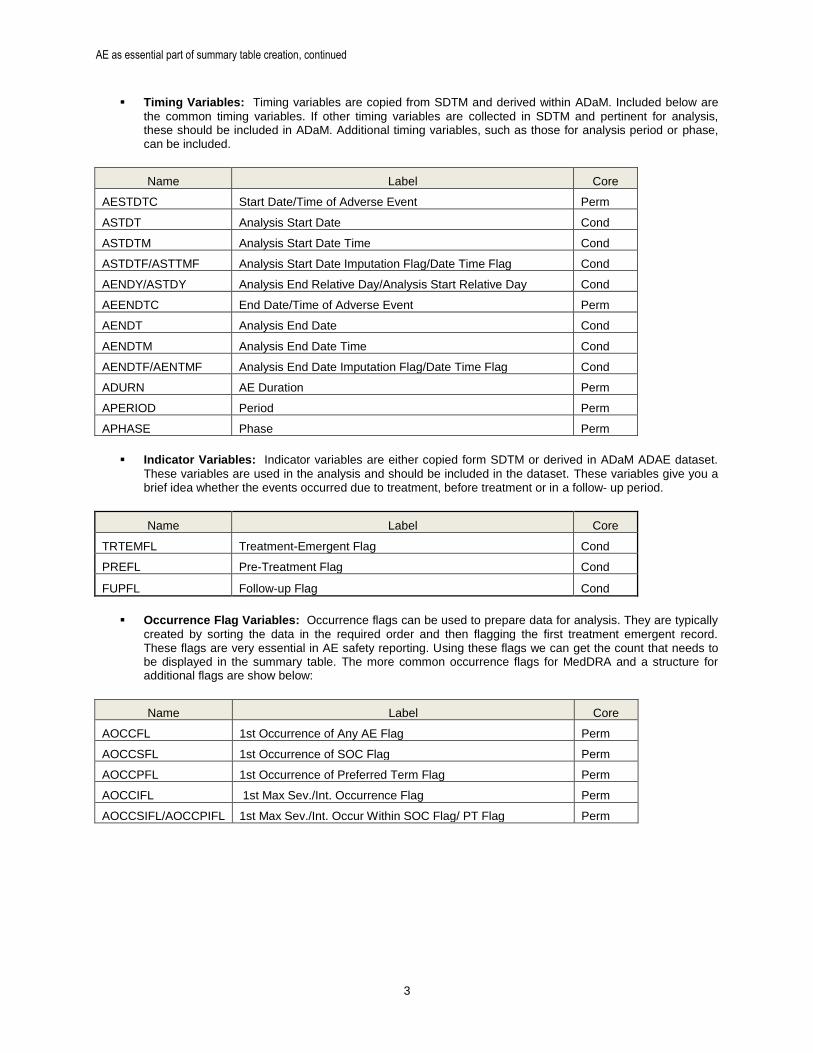
Timing Variables: Timing variables are copied from SDTM and derived within ADaM. Included below are
the common timing variables. If other timing variables are collected in SDTM and pertinent for analysis, these should be included in ADaM. Additional timing variables, such as those for analysis period or phase, can be included.
Name Label Core
AESTDTC Start Date/Time of Adverse Event Perm
ASTDT Analysis Start Date Cond
ASTDTM Analysis Start Date Time Cond
ASTDTF/ASTTMF Analysis Start Date Imputation Flag/Date Time Flag Cond
AENDY/ASTDY Analysis End Relative Day/Analysis Start Relative Day Cond
AEENDTC End Date/Time of Adverse Event Perm
AENDT Analysis End Date Cond
AENDTM Analysis End Date Time Cond
AENDTF/AENTMF Analysis End Date Imputation Flag/Date Time Flag Cond
ADURN AE Duration Perm
APERIOD Period Perm
APHASE Phase Perm
Indicator Variables: Indicator variables are either copied form SDTM or derived in ADaM ADAE dataset.
These variables are used in the analysis and should be included in the dataset. These variables give you a brief idea whether the events occurred due to treatment, before treatment or in a follow- up period.
Name Label Core
TRTEMFL Treatment-Emergent Flag Cond
PREFL Pre-Treatment Flag Cond
FUPFL Follow-up Flag Cond
Occurrence Flag Variables: Occurrence flags can be used to prepare data for analysis. They are typically
created by sorting the data in the required order and then flagging the first treatment emergent record. These flags are very essential in AE safety reporting. Using these flags we can get the count that needs to be displayed in the summary table. The more common occurrence flags for MedDRA and a structure for additional flags are show below:
Name Label Core
AOCCFL 1st Occurrence of Any AE Flag Perm
AOCCSFL 1st Occurrence of SOC Flag Perm
AOCCPFL 1st Occurrence of Preferred Term Flag Perm
AOCCIFL 1st Max Sev./Int. Occurrence Flag Perm
AOCCSIFL/AOCCPIFL 1st Max Sev./Int. Occur Within SOC Flag/ PT Flag Perm
AE as essential part of summary table creation, continued
4
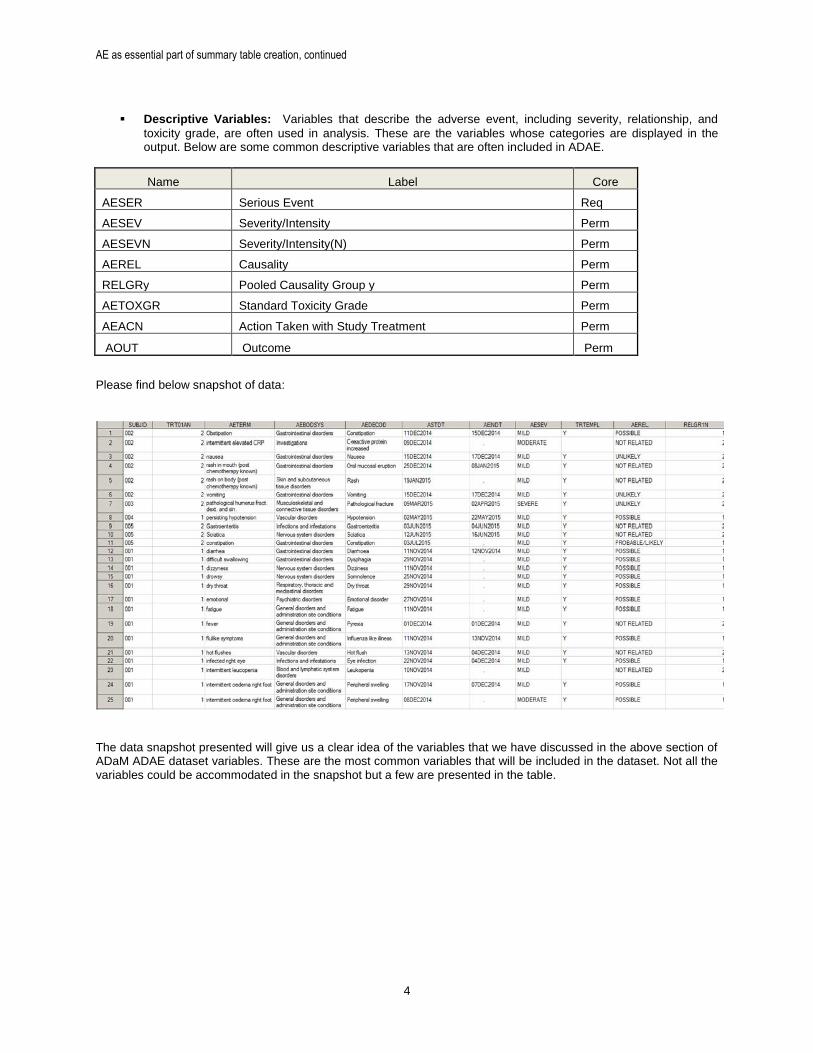
Descriptive Variables: Variables that describe the adverse event, including severity, relationship, and
toxicity grade, are often used in analysis. These are the variables whose categories are displayed in the output. Below are some common descriptive variables that are often included in ADAE.
Name Label Core
AESER Serious Event Req
AESEV Severity/Intensity Perm
AESEVN Severity/Intensity(N) Perm
AEREL Causality Perm
RELGRy Pooled Causality Group y Perm
AETOXGR Standard Toxicity Grade Perm
AEACN Action Taken with Study Treatment Perm
AOUT Outcome Perm
Please find below snapshot of data:
The data snapshot presented will give us a clear idea of the variables that we have discussed in the above section of ADaM ADAE dataset variables. These are the most common variables that will be included in the dataset. Not all the variables could be accommodated in the snapshot but a few are presented in the table.
AE as essential part of summary table creation, continued
5
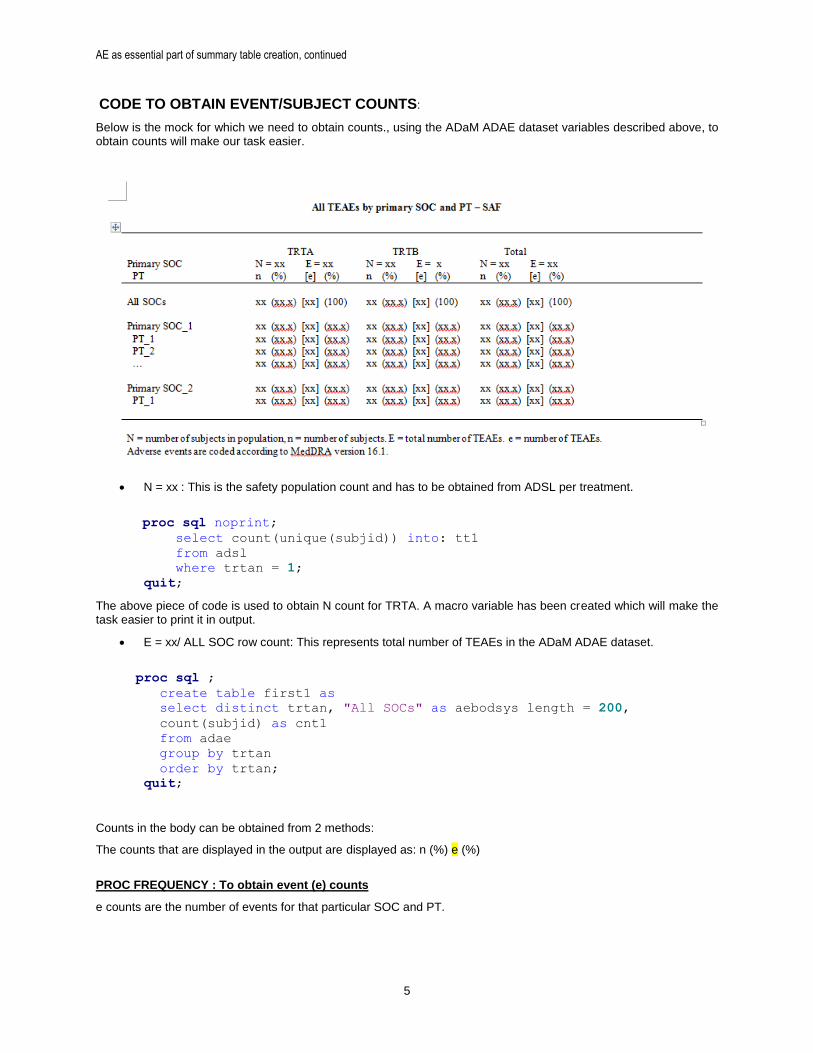
CODE TO OBTAIN EVENT/SUBJECT COUNTS:
Below is the mock for which we need to obtain counts., using the ADaM ADAE dataset variables described above, to obtain counts will make our task easier.
N = xx : This is the safety population count and has to be obtained from ADSL per treatment.
proc sql noprint;
select count(unique(subjid)) into: tt1
from adsl
where trtan = 1;
quit;
The above piece of code is used to obtain N count for TRTA. A macro variable has been created which will make the task easier to print it in output.
E = xx/ ALL SOC row count: This represents total number of TEAEs in the ADaM ADAE dataset.
proc sql ;
create table first1 as
select distinct trtan, "All SOCs" as aebodsys length = 200,
count(subjid) as cnt1
from adae
group by trtan
order by trtan;
quit;
Counts in the body can be obtained from 2 methods:
The counts that are displayed in the output are displayed as: n (%) e (%)
PROC FREQUENCY : To obtain event (e) counts
e counts are the number of events for that particular SOC and PT.
AE as essential part of summary table creation, continued
6
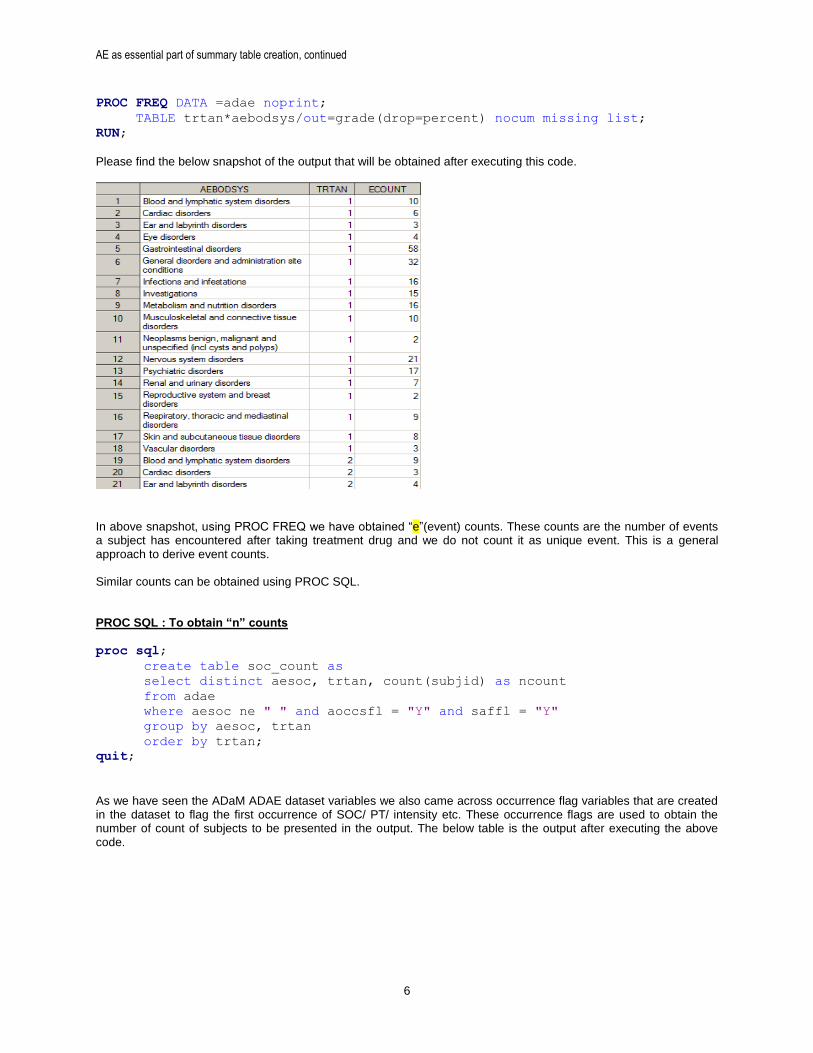
PROC FREQ DATA =adae noprint;
TABLE trtan*aebodsys/out=grade(drop=percent) nocum missing list;
RUN;
Please find the below snapshot of the output that will be obtained after executing this code.
In above snapshot, using PROC FREQ we have obtained “e”(event) counts. These counts are the number of events a subject has encountered after taking treatment drug and we do not count it as unique event. This is a general approach to derive event counts. Similar counts can be obtained using PROC SQL. PROC SQL : To obtain “n” counts proc sql;
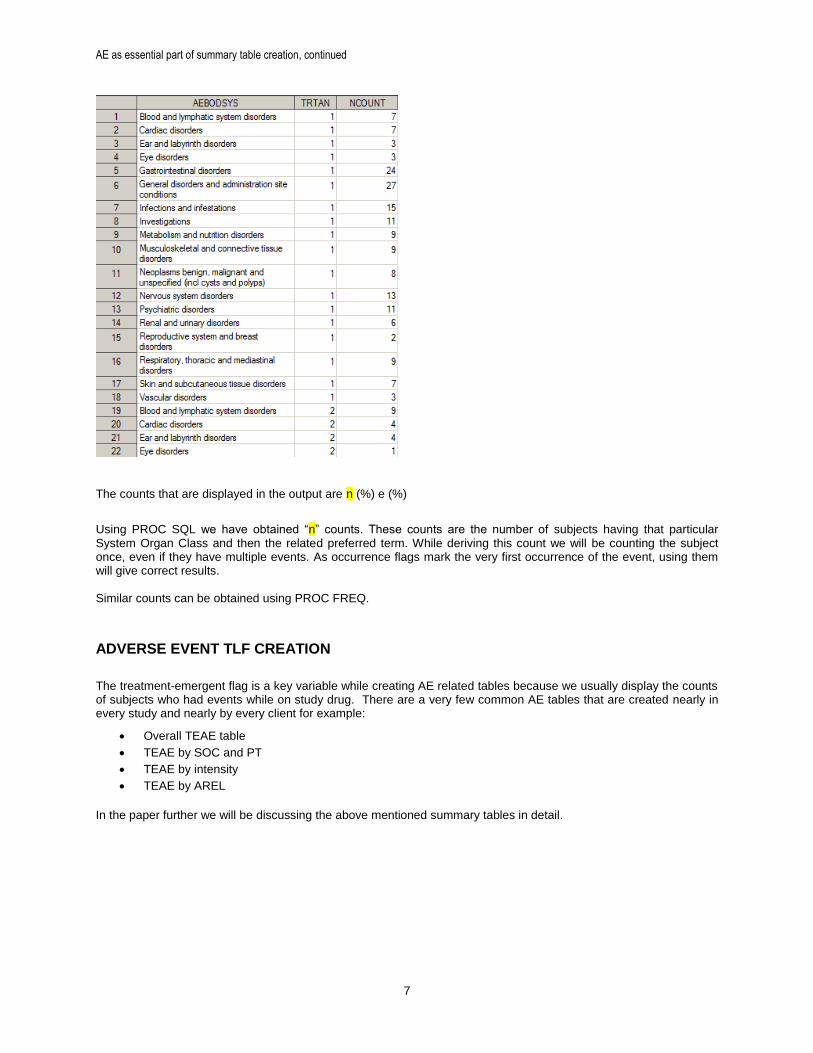
create table soc_count as
select distinct aesoc, trtan, count(subjid) as ncount
from adae
where aesoc ne " " and aoccsfl = "Y" and saffl = "Y"
group by aesoc, trtan
order by trtan;
quit;
As we have seen the ADaM ADAE dataset variables we also came across occurrence flag variables that are created in the dataset to flag the first occurrence of SOC/ PT/ intensity etc. These occurrence flags are used to obtain the number of count of subjects to be presented in the output. The below table is the output after executing the above code.
AE as essential part of summary table creation, continued
7
The counts that are displayed in the output are n (%) e (%)
Using PROC SQL we have obtained “n” counts. These counts are the number of subjects having that particular System Organ Class and then the related preferred term. While deriving this count we will be counting the subject once, even if they have multiple events. As occurrence flags mark the very first occurrence of the event, using them will give correct results. Similar counts can be obtained using PROC FREQ.
ADVERSE EVENT TLF CREATION
The treatment-emergent flag is a key variable while creating AE related tables because we usually display the counts of subjects who had events while on study drug. There are a very few common AE tables that are created nearly in every study and nearly by every client for example:
Overall TEAE table
TEAE by SOC and PT
TEAE by intensity
TEAE by AREL
In the paper further we will be discussing the above mentioned summary tables in detail.
AE as essential part of summary table creation, continued
8
OVERALL TEAE TABLE
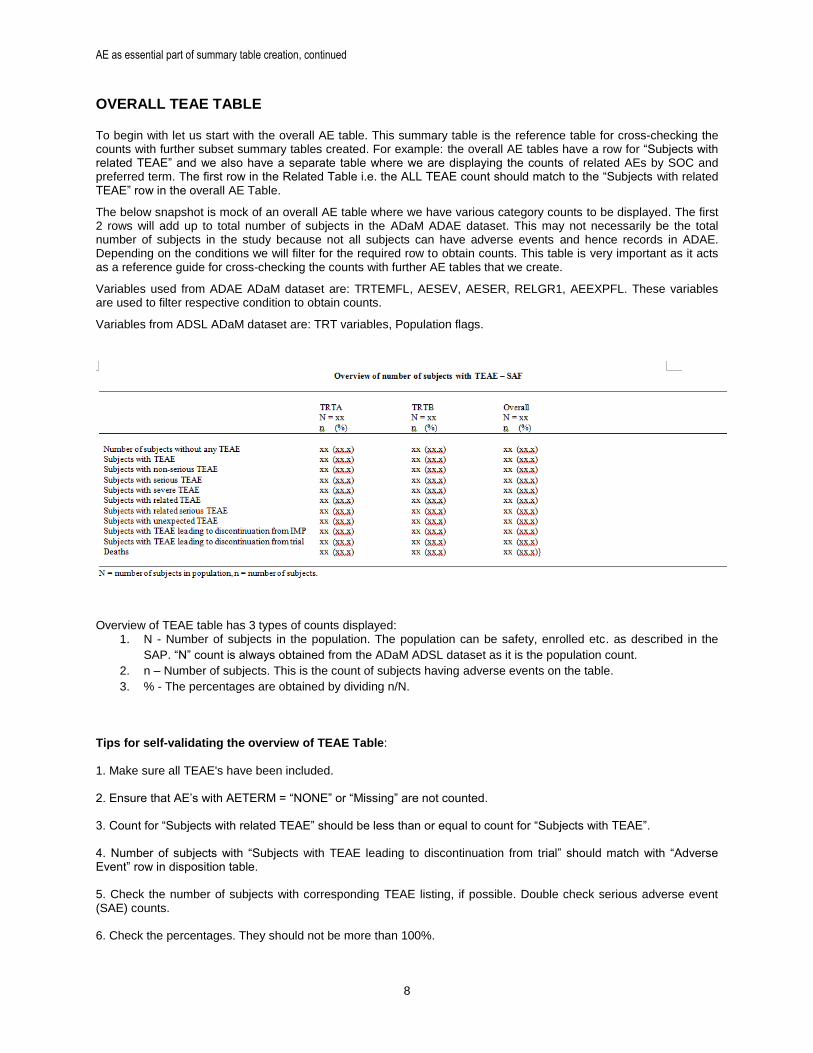
To begin with let us start with the overall AE table. This summary table is the reference table for cross-checking the counts with further subset summary tables created. For example: the overall AE tables have a row for “Subjects with related TEAE” and we also have a separate table where we are displaying the counts of related AEs by SOC and preferred term. The first row in the Related Table i.e. the ALL TEAE count should match to the “Subjects with related TEAE” row in the overall AE Table.
The below snapshot is mock of an overall AE table where we have various category counts to be displayed. The first 2 rows will add up to total number of subjects in the ADaM ADAE dataset. This may not necessarily be the total number of subjects in the study because not all subjects can have adverse events and hence records in ADAE. Depending on the conditions we will filter for the required row to obtain counts. This table is very important as it acts as a reference guide for cross-checking the counts with further AE tables that we create.
Variables used from ADAE ADaM dataset are: TRTEMFL, AESEV, AESER, RELGR1, AEEXPFL. These variables are used to filter respective condition to obtain counts.
Variables from ADSL ADaM dataset are: TRT variables, Population flags.
Overview of TEAE table has 3 types of counts displayed:
1. N - Number of subjects in the population. The population can be safety, enrolled etc. as described in the
SAP. “N” count is always obtained from the ADaM ADSL dataset as it is the population count.
2. n – Number of subjects. This is the count of subjects having adverse events on the table.
3. % - The percentages are obtained by dividing n/N.
Tips for self-validating the overview of TEAE Table:
1. Make sure all TEAE's have been included.
2. Ensure that AE’s with AETERM = “NONE” or “Missing” are not counted.
3. Count for “Subjects with related TEAE” should be less than or equal to count for “Subjects with TEAE”.
4. Number of subjects with “Subjects with TEAE leading to discontinuation from trial” should match with “Adverse Event” row in disposition table.
5. Check the number of subjects with corresponding TEAE listing, if possible. Double check serious adverse event (SAE) counts. 6. Check the percentages. They should not be more than 100%.
AE as essential part of summary table creation, continued
9
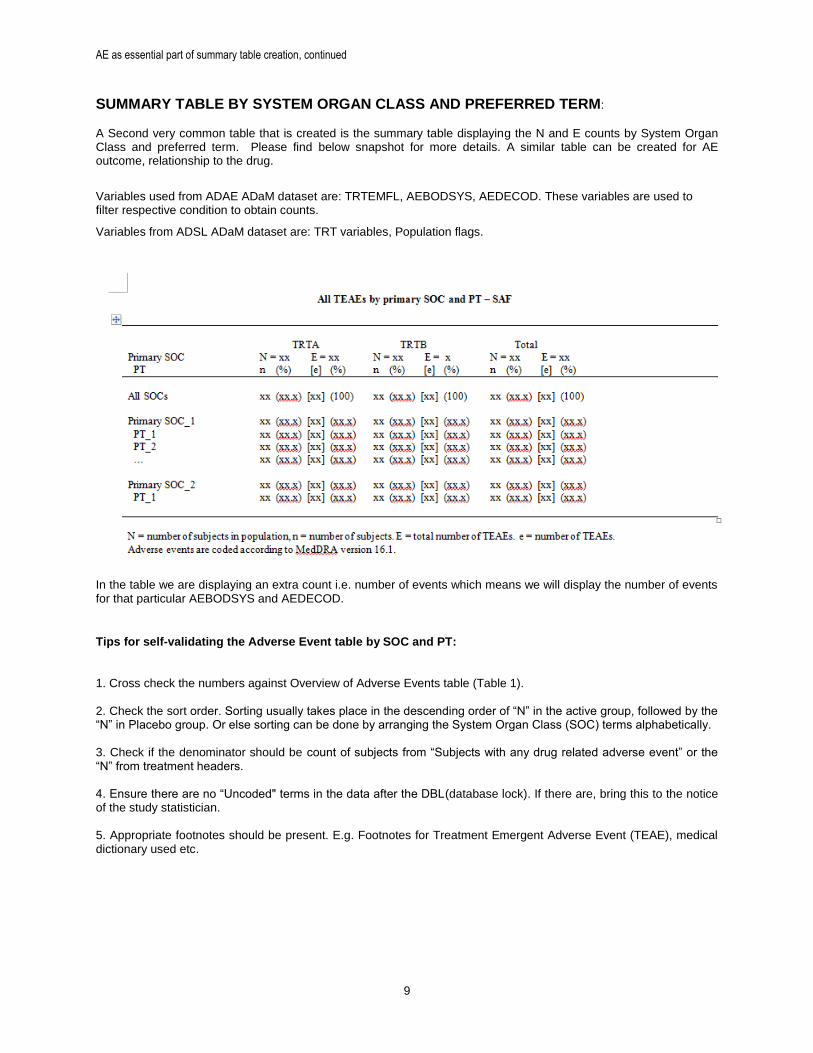
SUMMARY TABLE BY SYSTEM ORGAN CLASS AND PREFERRED TERM:
A Second very common table that is created is the summary table displaying the N and E counts by System Organ Class and preferred term. Please find below snapshot for more details. A similar table can be created for AE outcome, relationship to the drug.
Variables used from ADAE ADaM dataset are: TRTEMFL, AEBODSYS, AEDECOD. These variables are used to filter respective condition to obtain counts.
Variables from ADSL ADaM dataset are: TRT variables, Population flags.
In the table we are displaying an extra count i.e. number of events which means we will display the number of events for that particular AEBODSYS and AEDECOD.
Tips for self-validating the Adverse Event table by SOC and PT:
1. Cross check the numbers against Overview of Adverse Events table (Table 1).
2. Check the sort order. Sorting usually takes place in the descending order of “N” in the active group, followed by the “N” in Placebo group. Or else sorting can be done by arranging the System Organ Class (SOC) terms alphabetically.
3. Check if the denominator should be count of subjects from “Subjects with any drug related adverse event” or the “N” from treatment headers.
4. Ensure there are no “Uncoded" terms in the data after the DBL(database lock). If there are, bring this to the notice of the study statistician.
5. Appropriate footnotes should be present. E.g. Footnotes for Treatment Emergent Adverse Event (TEAE), medical dictionary used etc.
AE as essential part of summary table creation, continued
10
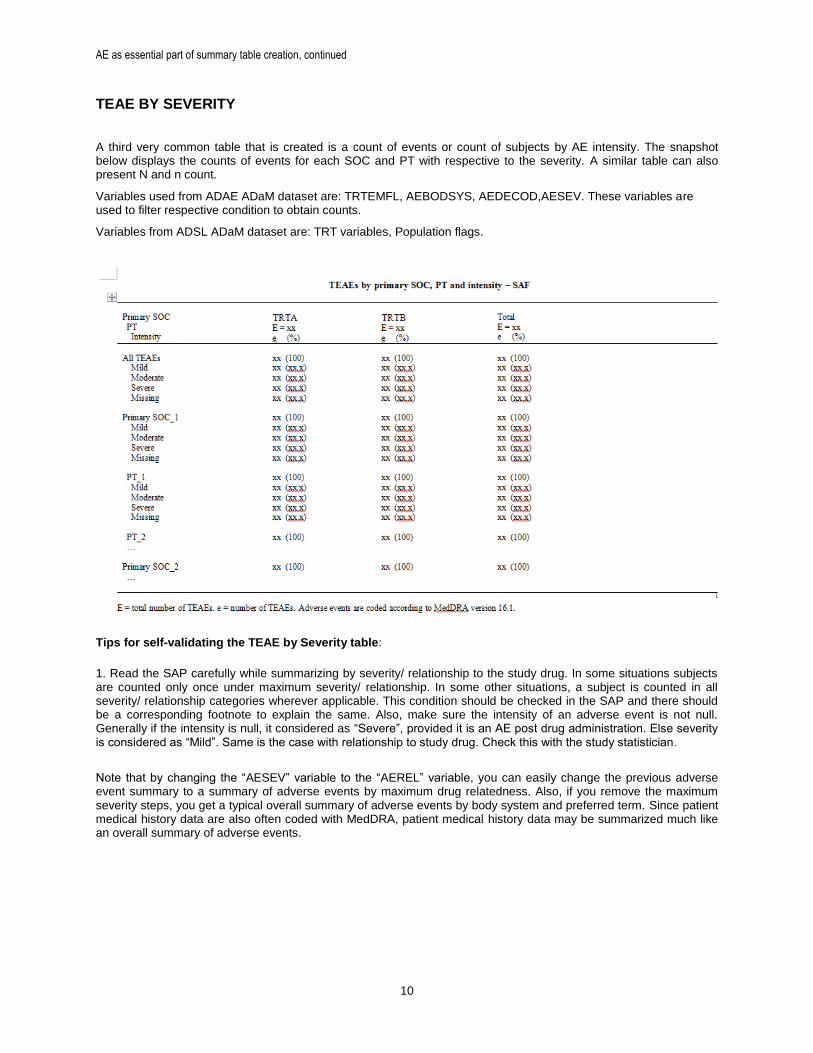
TEAE BY SEVERITY A third very common table that is created is a count of events or count of subjects by AE intensity. The snapshot below displays the counts of events for each SOC and PT with respective to the severity. A similar table can also present N and n count.
Variables used from ADAE ADaM dataset are: TRTEMFL, AEBODSYS, AEDECOD,AESEV. These variables are used to filter respective condition to obtain counts.
Variables from ADSL ADaM dataset are: TRT variables, Population flags.
Tips for self-validating the TEAE by Severity table:
1. Read the SAP carefully while summarizing by severity/ relationship to the study drug. In some situations subjects are counted only once under maximum severity/ relationship. In some other situations, a subject is counted in all severity/ relationship categories wherever applicable. This condition should be checked in the SAP and there should be a corresponding footnote to explain the same. Also, make sure the intensity of an adverse event is not null. Generally if the intensity is null, it considered as “Severe”, provided it is an AE post drug administration. Else severity is considered as “Mild”. Same is the case with relationship to study drug. Check this with the study statistician.
Note that by changing the “AESEV” variable to the “AEREL” variable, you can easily change the previous adverse event summary to a summary of adverse events by maximum drug relatedness. Also, if you remove the maximum severity steps, you get a typical overall summary of adverse events by body system and preferred term. Since patient medical history data are also often coded with MedDRA, patient medical history data may be summarized much like an overall summary of adverse events.
AE as essential part of summary table creation, continued
11
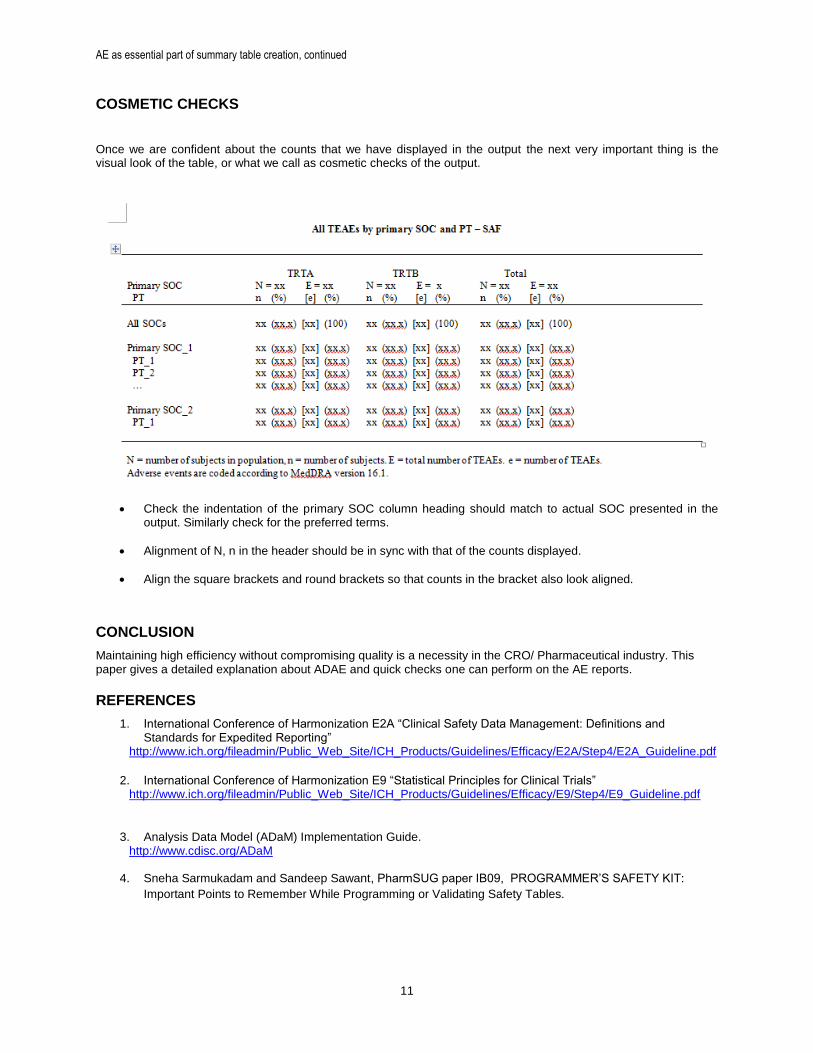
COSMETIC CHECKS
Once we are confident about the counts that we have displayed in the output the next very important thing is the visual look of the table, or what we call as cosmetic checks of the output.
Check the indentation of the primary SOC column heading should match to actual SOC presented in the output. Similarly check for the preferred terms.
Alignment of N, n in the header should be in sync with that of the counts displayed.
Align the square brackets and round brackets so that counts in the bracket also look aligned.
CONCLUSION
Maintaining high efficiency without compromising quality is a necessity in the CRO/ Pharmaceutical industry. This paper gives a detailed explanation about ADAE and quick checks one can perform on the AE reports.
REFERENCES
1. International Conference of Harmonization E2A “Clinical Safety Data Management: Definitions and Standards for Expedited Reporting”
http://www.ich.org/fileadmin/Public_Web_Site/ICH_Products/Guidelines/Efficacy/E2A/Step4/E2A_Guideline.pdf
2. International Conference of Harmonization E9 “Statistical Principles for Clinical Trials”
http://www.ich.org/fileadmin/Public_Web_Site/ICH_Products/Guidelines/Efficacy/E9/Step4/E9_Guideline.pdf
3. Analysis Data Model (ADaM) Implementation Guide.
http://www.cdisc.org/ADaM
4. Sneha Sarmukadam and Sandeep Sawant, PharmSUG paper IB09, PROGRAMMER’S SAFETY KIT:
Important Points to Remember While Programming or Validating Safety Tables.
AE as essential part of summary table creation, continued
12
ACKNOWLEDGMENTS
I would like to thank my colleagues and friends for their valuable feedback in improvising the paper. Last but not the least my family who has been my support system throughout.
CONTACT INFORMATION
Name: Rucha Sanjay Landge Enterprise: Inventiv Health International Pharma Services Pvt. Ltd. Address: Commerzone building no – 6 floor no – 6 Yerwada Pune. City, State ZIP: Pune - 411006 Work Phone: 91- 020- 30569353 E-mail: [email protected]
SAS and all other SAS Institute Inc. product or service names are registered trademarks or trademarks of SAS Institute Inc. in the USA and other countries. ® indicates USA registration.
Other brand and product names are trademarks of their respective companies.