Embed Size (px)
Citation preview
Pharming Group NVHalf Year Results 2018
Sijmen de VriesChief Executive Officer
Robin Wright Chief Financial officer
26 July 2018
1
Safe harbour statementThe information contained in this document and communicated verbally to you (together the "Presentation") is being supplied to yousolely for your information and may not be copied, reproduced or further distributed to any person or published, in whole or in part, forany purpose.
The Presentation does not form any part of an offer of, or invitation to apply for, securities in Pharming Group N.V. (the "Company").
The Presentation speaks as of the date shown on the front cover. The Company assumes no obligation to notify or inform the recipientof any developments or changes occurring after the date of this document that might render the contents of the Presentation untrue orinaccurate in whole or in part. In addition, no representation or warranty, express or implied, is given as to the accuracy of theinformation or opinions contained in the Presentation and no liability is accepted for any use of any such information or opinions givenby the Company or by any of its directors, members, officers, employees, agents or advisers.
The Presentation contains forward-looking statements, including statements about our beliefs and expectations. These statements arebased on our current plans, estimates and projections, as well as our expectations of external conditions and events. Forward-lookingstatements involve inherent risks and uncertainties and speak only as of the date they are made. The Company undertakes no duty toupdate these and will not necessarily update any of them in light of new information or future events, except to the extent required byapplicable law.
The Company's securities have not been and will not be registered under the U.S. Securities Act of 1933, as amended (the "SecuritiesAct"), and may not be offered or sold in the United States absent registration under the Securities Act or an available exemption from, ortransaction not subject to, the registration requirements of the Securities Act.
2
Half year results 2018
3
4
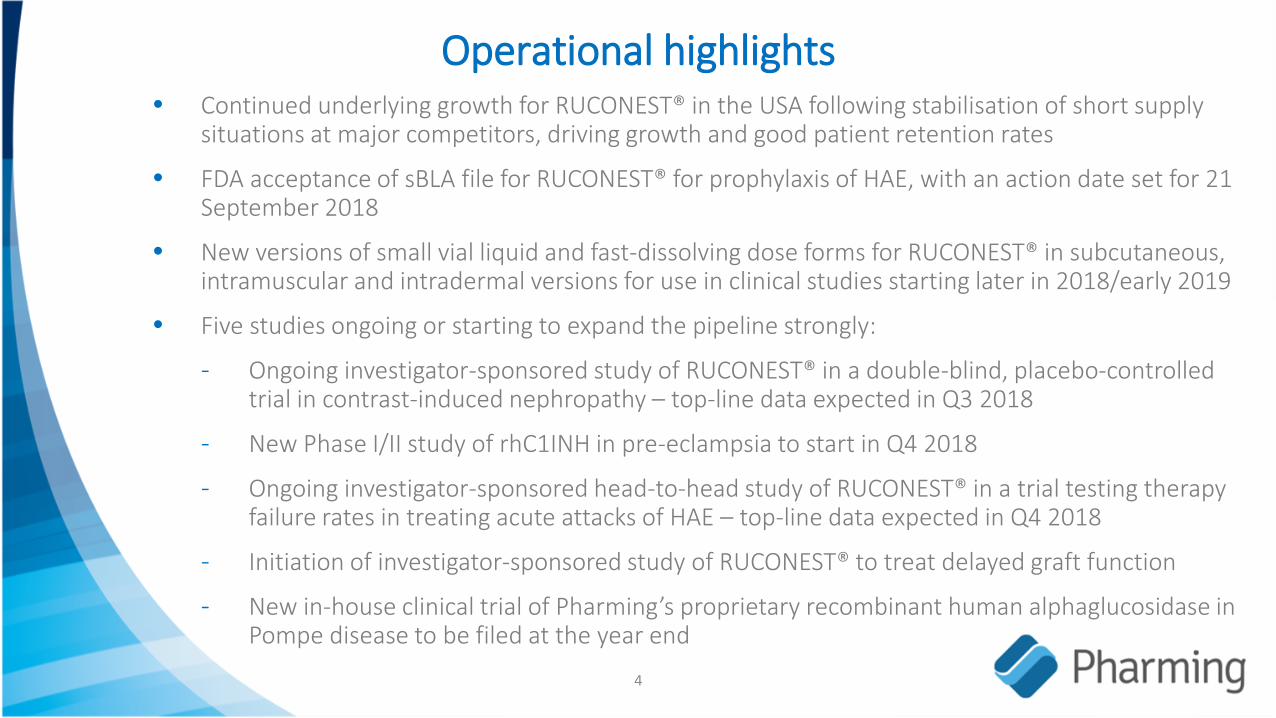
• Continued underlying growth for RUCONEST® in the USA following stabilisation of short supply situations at major competitors, driving growth and good patient retention rates
• FDA acceptance of sBLA file for RUCONEST® for prophylaxis of HAE, with an action date set for 21 September 2018
• New versions of small vial liquid and fast-dissolving dose forms for RUCONEST® in subcutaneous, intramuscular and intradermal versions for use in clinical studies starting later in 2018/early 2019
• Five studies ongoing or starting to expand the pipeline strongly:
- Ongoing investigator-sponsored study of RUCONEST® in a double-blind, placebo-controlled trial in contrast-induced nephropathy – top-line data expected in Q3 2018
- New Phase I/II study of rhC1INH in pre-eclampsia to start in Q4 2018
- Ongoing investigator-sponsored head-to-head study of RUCONEST® in a trial testing therapy failure rates in treating acute attacks of HAE – top-line data expected in Q4 2018
- Initiation of investigator-sponsored study of RUCONEST® to treat delayed graft function
- New in-house clinical trial of Pharming’s proprietary recombinant human alphaglucosidase in Pompe disease to be filed at the year end
Operational highlights
5
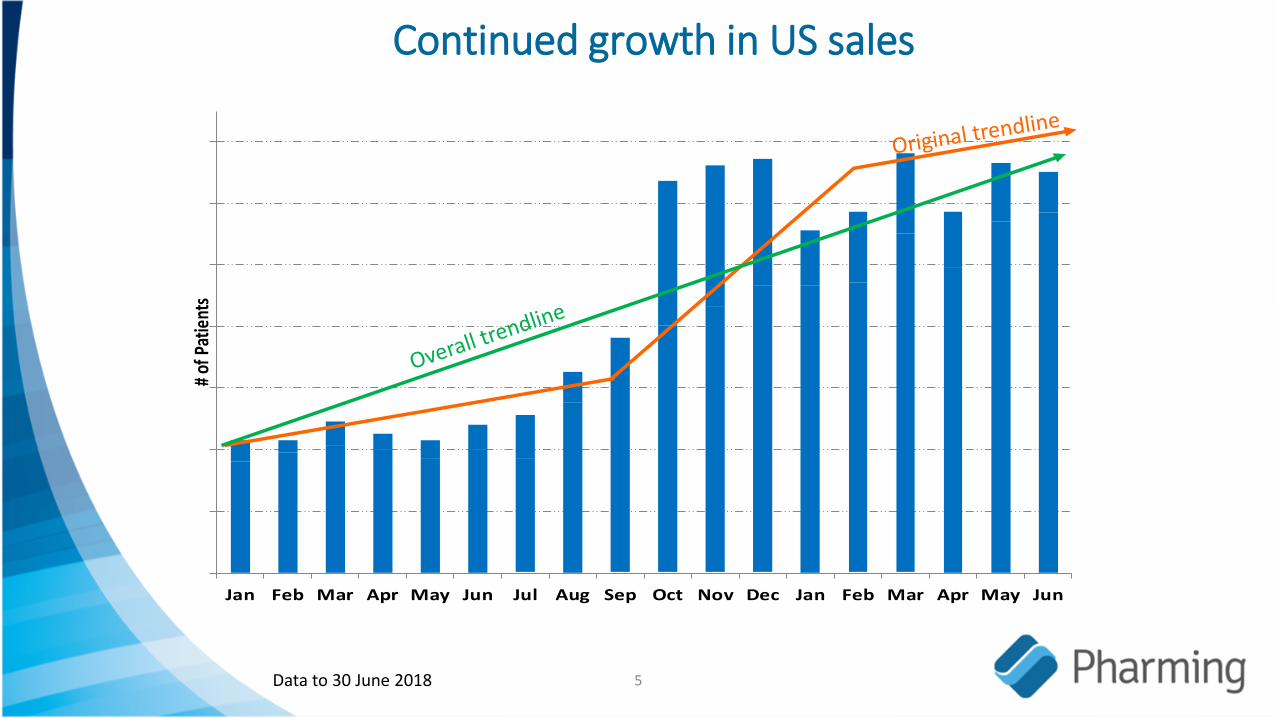
Continued growth in US sales
Data to 30 June 2018
Jan Feb Mar Apr May Jun Jul Aug Sep Oct Nov Dec Jan Feb Mar Apr May Jun
# of P
atien
ts
6
• Delivered net profitability for the half year
• Revenues from product sales for the half year increased by 96% to €59.1 million (HY 2017: €30.1 million), as a result of the continued increasing patient numbers
• Operating results improved by 288% to a profit of €16.3 million from €4.2 million in 2017, despite an increase in manfacturing and clinical activities related to the new indications
• The net result was a profit of €6.4 million (2017: loss of €30.2 million)
• The company’s cash position increased 12% from €60.0 million at the year end 2017 (31 March 2018 : €60.0 million and 30 June 2017: €25.2 million) to €66.9 million at 30 June 2018, largely due to the high sales level and improved gross margin
Financial highlights
Investing for Long-term Growth
7
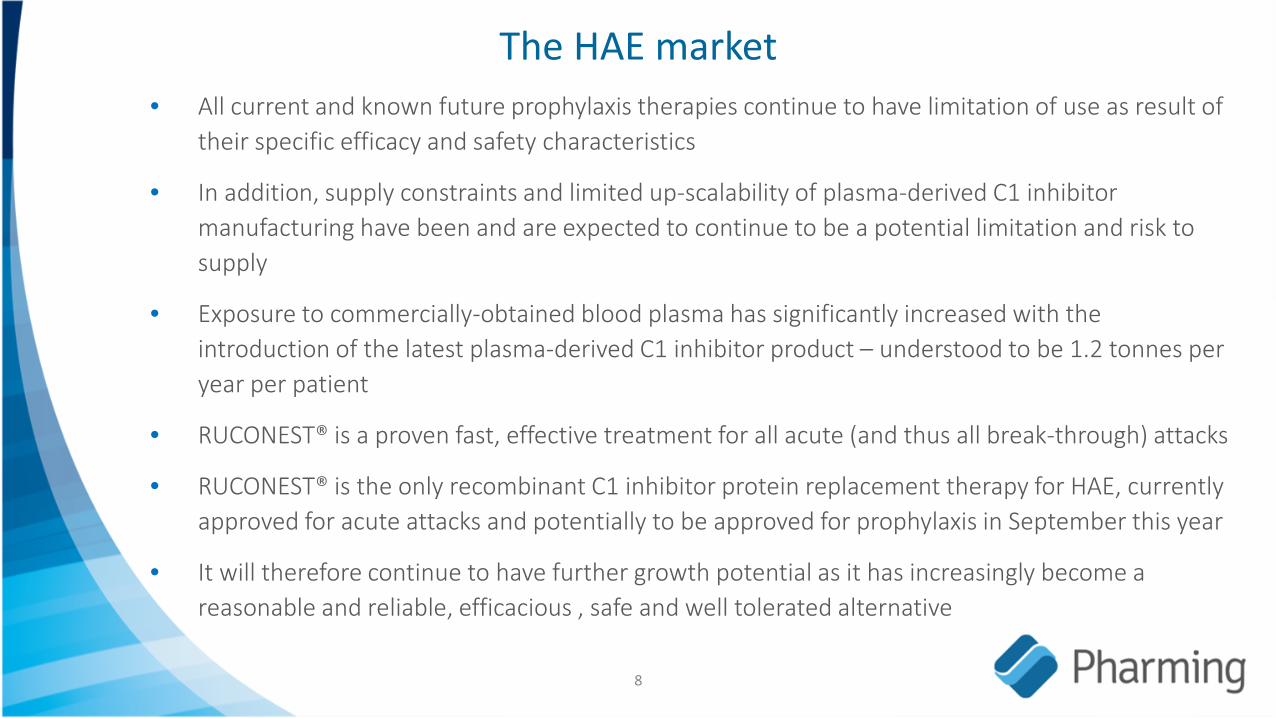
The HAE market• All current and known future prophylaxis therapies continue to have limitation of use as result of
their specific efficacy and safety characteristics
• In addition, supply constraints and limited up-scalability of plasma-derived C1 inhibitor manufacturing have been and are expected to continue to be a potential limitation and risk to supply
• Exposure to commercially-obtained blood plasma has significantly increased with the introduction of the latest plasma-derived C1 inhibitor product – understood to be 1.2 tonnes per year per patient
• RUCONEST® is a proven fast, effective treatment for all acute (and thus all break-through) attacks
• RUCONEST® is the only recombinant C1 inhibitor protein replacement therapy for HAE, currently approved for acute attacks and potentially to be approved for prophylaxis in September this year
• It will therefore continue to have further growth potential as it has increasingly become a reasonable and reliable, efficacious , safe and well tolerated alternative
8
Label expansion and improving patient convenience
9
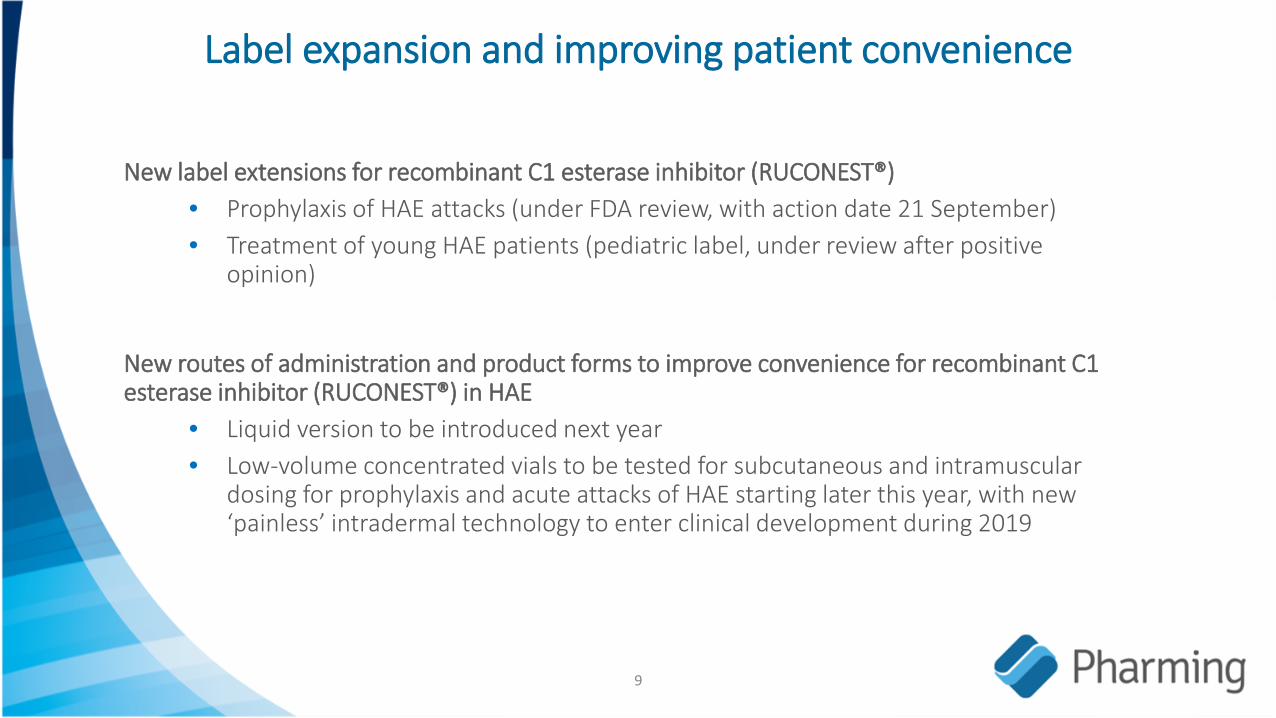
New label extensions for recombinant C1 esterase inhibitor (RUCONEST®)• Prophylaxis of HAE attacks (under FDA review, with action date 21 September)• Treatment of young HAE patients (pediatric label, under review after positive
opinion)
New routes of administration and product forms to improve convenience for recombinant C1 esterase inhibitor (RUCONEST®) in HAE
• Liquid version to be introduced next year• Low-volume concentrated vials to be tested for subcutaneous and intramuscular
dosing for prophylaxis and acute attacks of HAE starting later this year, with new ‘painless’ intradermal technology to enter clinical development during 2019
New indications to drive long-term value
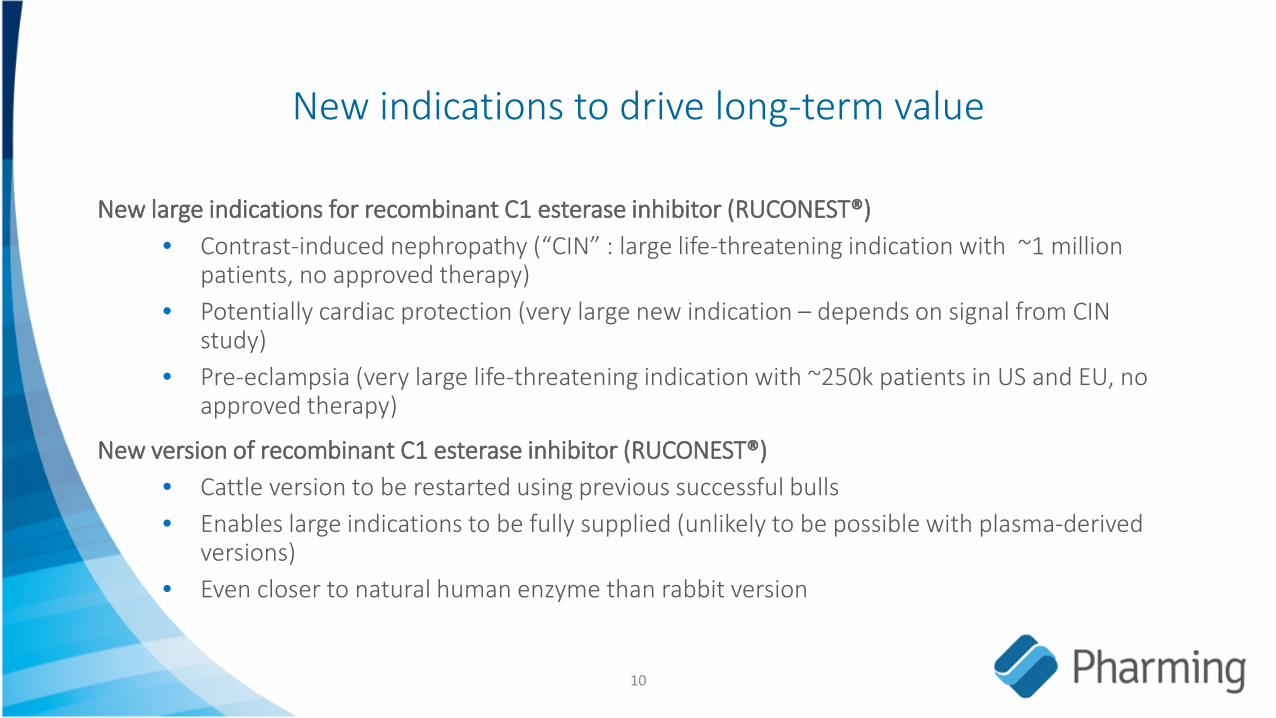
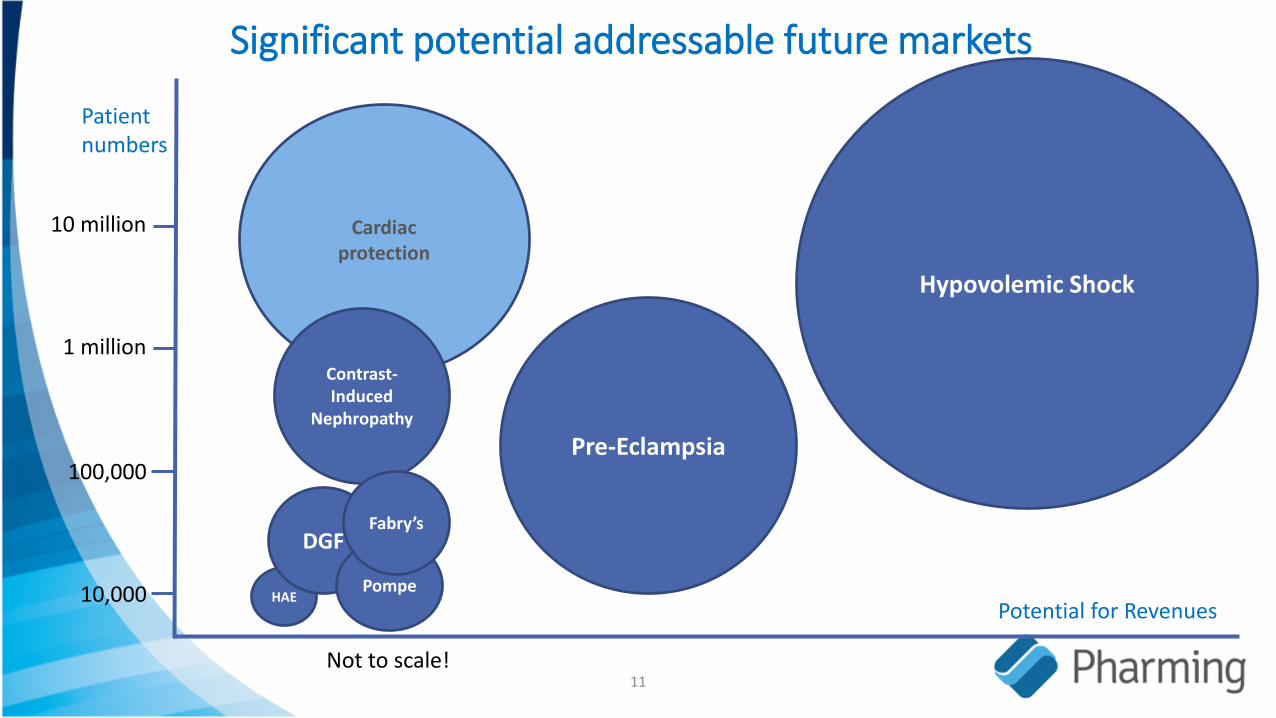
New large indications for recombinant C1 esterase inhibitor (RUCONEST®)• Contrast-induced nephropathy (“CIN” : large life-threatening indication with ~1 million
patients, no approved therapy)• Potentially cardiac protection (very large new indication – depends on signal from CIN
study)• Pre-eclampsia (very large life-threatening indication with ~250k patients in US and EU, no
approved therapy)
New version of recombinant C1 esterase inhibitor (RUCONEST®)• Cattle version to be restarted using previous successful bulls• Enables large indications to be fully supplied (unlikely to be possible with plasma-derived
versions)• Even closer to natural human enzyme than rabbit version
10
11
Significant potential addressable future markets
Potential for Revenues
Patientnumbers
HAE
Cardiacprotection
Contrast-Induced
Nephropathy
10,000
100,000
1 million
10 million
Pre-Eclampsia
Hypovolemic Shock
DGF
Not to scale!
Pompe
Fabry’s
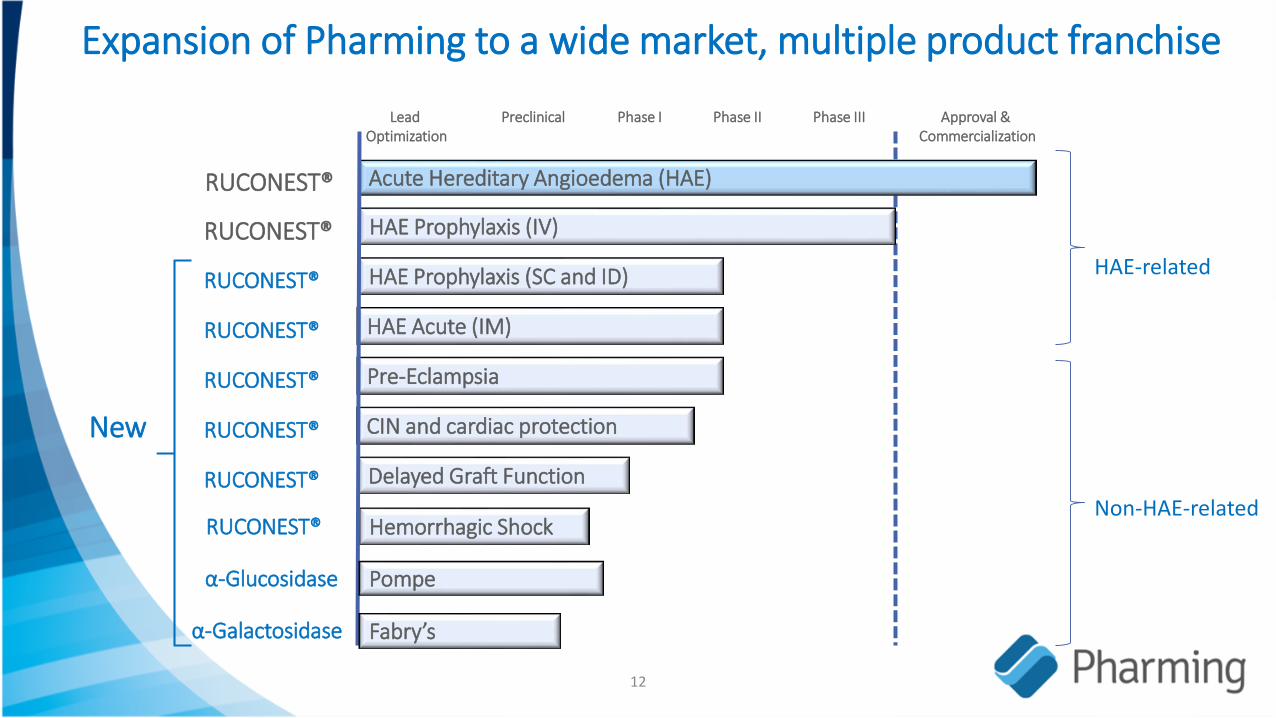
Expansion of Pharming to a wide market, multiple product franchise
Lead Optimization
Phase I Phase II Phase III Approval & Commercialization
Preclinical
Acute Hereditary Angioedema (HAE)RUCONEST®
12
RUCONEST® HAE Prophylaxis (SC and ID)
RUCONEST® HAE Prophylaxis (IV)
CIN and cardiac protectionRUCONEST®
Delayed Graft FunctionRUCONEST®
Hemorrhagic ShockRUCONEST®
RUCONEST® Pre-Eclampsia
RUCONEST® HAE Acute (IM)
New
HAE-related
Non-HAE-related
Pompeα-Glucosidase
Fabry’sα-Galactosidase
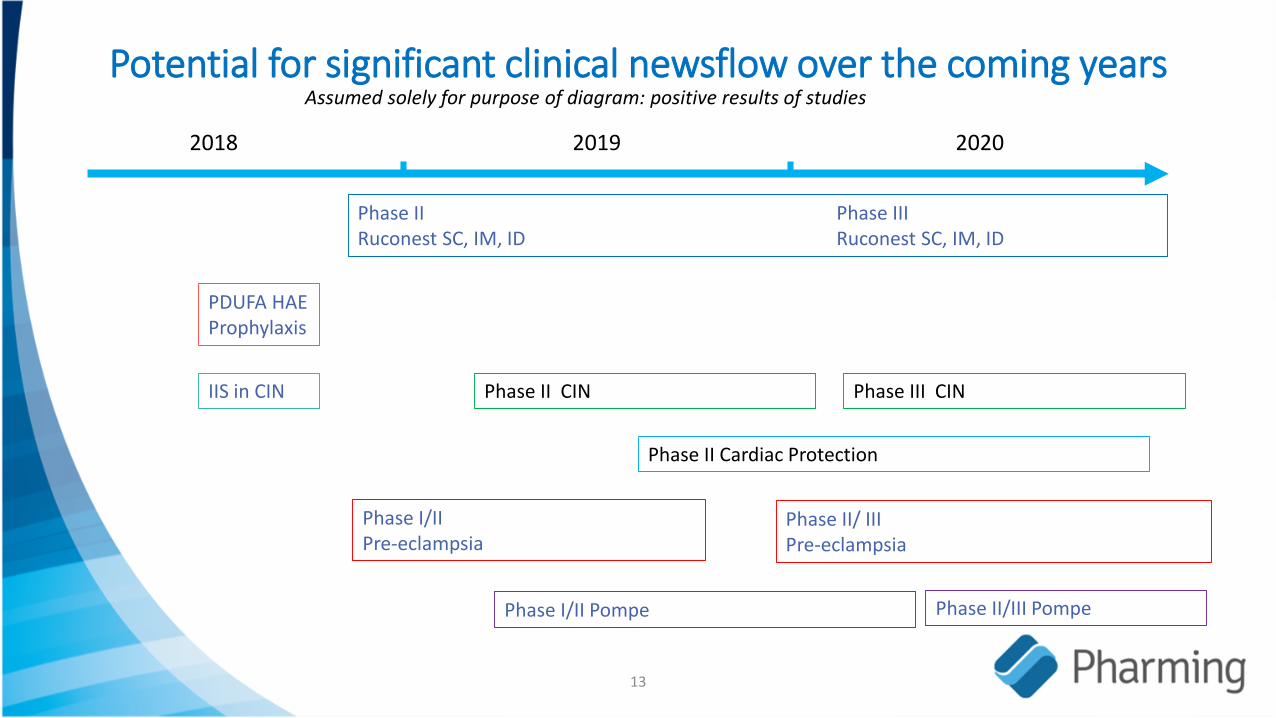
Potential for significant clinical newsflow over the coming years
13
2018 2019 2020
PDUFA HAE Prophylaxis
Assumed solely for purpose of diagram: positive results of studies
Phase II Phase IIIRuconest SC, IM, ID Ruconest SC, IM, ID
Phase II Cardiac Protection
Phase II/ IIIPre-eclampsia
Phase I/II Pre-eclampsia
Phase I/II Pompe Phase II/III Pompe
Phase II CIN Phase III CINIIS in CIN
Financial information & statements
14
Income statement
15
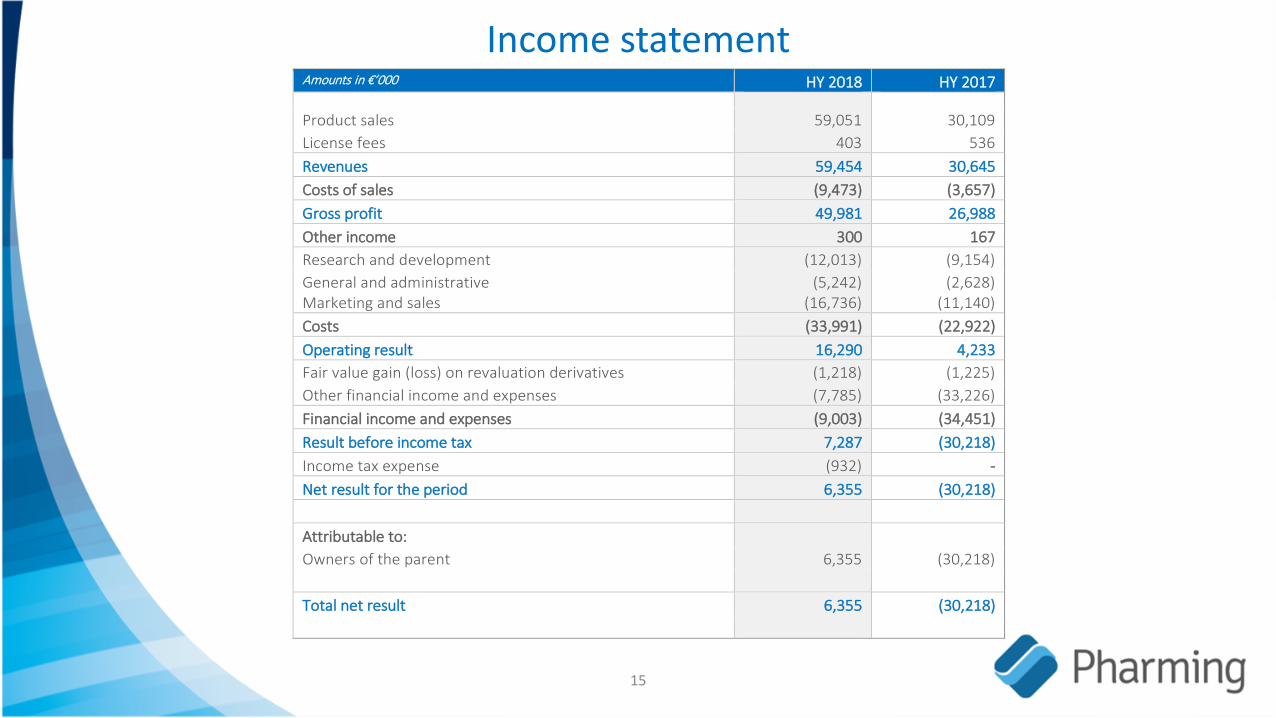
Amounts in €’000 HY 2018 HY 2017
Product sales 59,051 30,109 License fees 403 536 Revenues 59,454 30,645 Costs of sales (9,473) (3,657) Gross profit 49,981 26,988 Other income 300 167 Research and development (12,013) (9,154) General and administrative Marketing and sales
(5,242) (16,736)
(2,628) (11,140)
Costs (33,991) (22,922) Operating result 16,290 4,233 Fair value gain (loss) on revaluation derivatives (1,218) (1,225) Other financial income and expenses (7,785) (33,226) Financial income and expenses (9,003) (34,451) Result before income tax 7,287 (30,218) Income tax expense (932) - Net result for the period 6,355 (30,218) Attributable to: Owners of the parent 6,355 (30,218) Total net result 6,355 (30,218)
Balance sheet - Assets
16
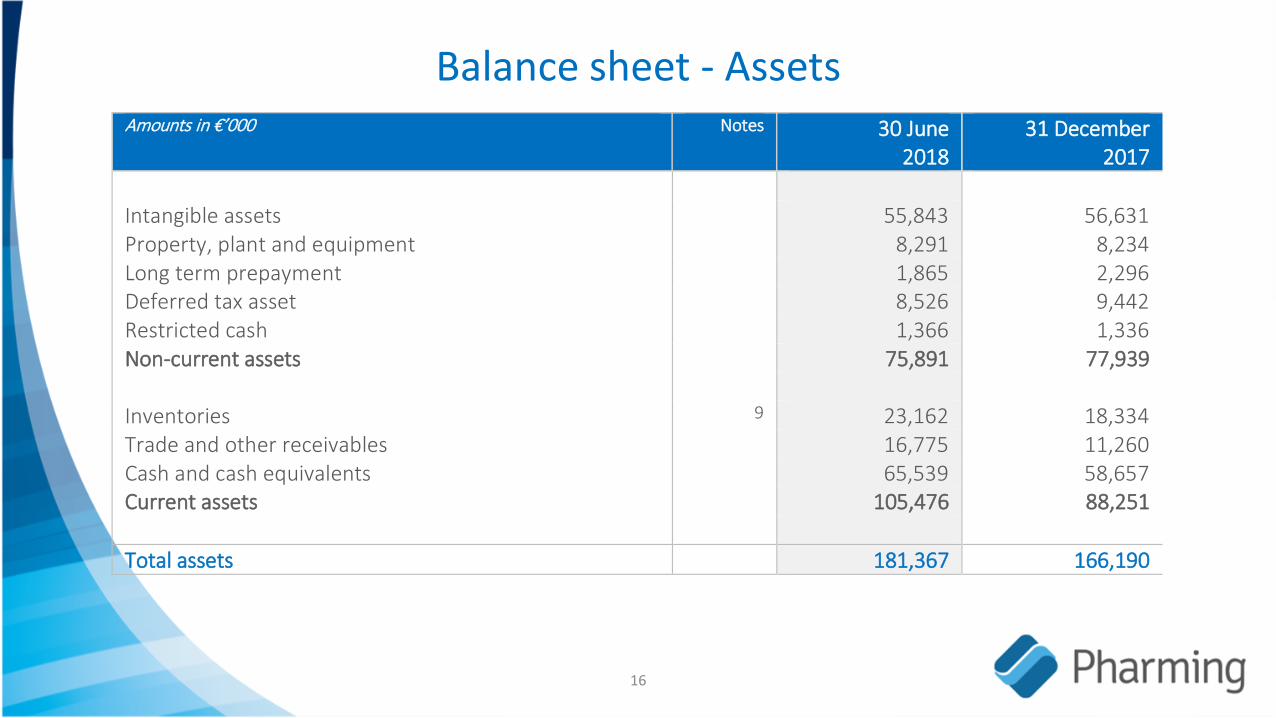
Amounts in €’000
Notes
30 June 2018
31 December 2017
Intangible assets 55,843 56,631 Property, plant and equipment 8,291 8,234 Long term prepayment 1,865 2,296 Deferred tax asset 8,526 9,442 Restricted cash 1,366 1,336 Non-current assets 75,891 77,939 Inventories 9 23,162 18,334 Trade and other receivables 16,775 11,260 Cash and cash equivalents 65,539 58,657 Current assets 105,476 88,251 Total assets 181,367 166,190
Balance Sheet - Liabilities
17
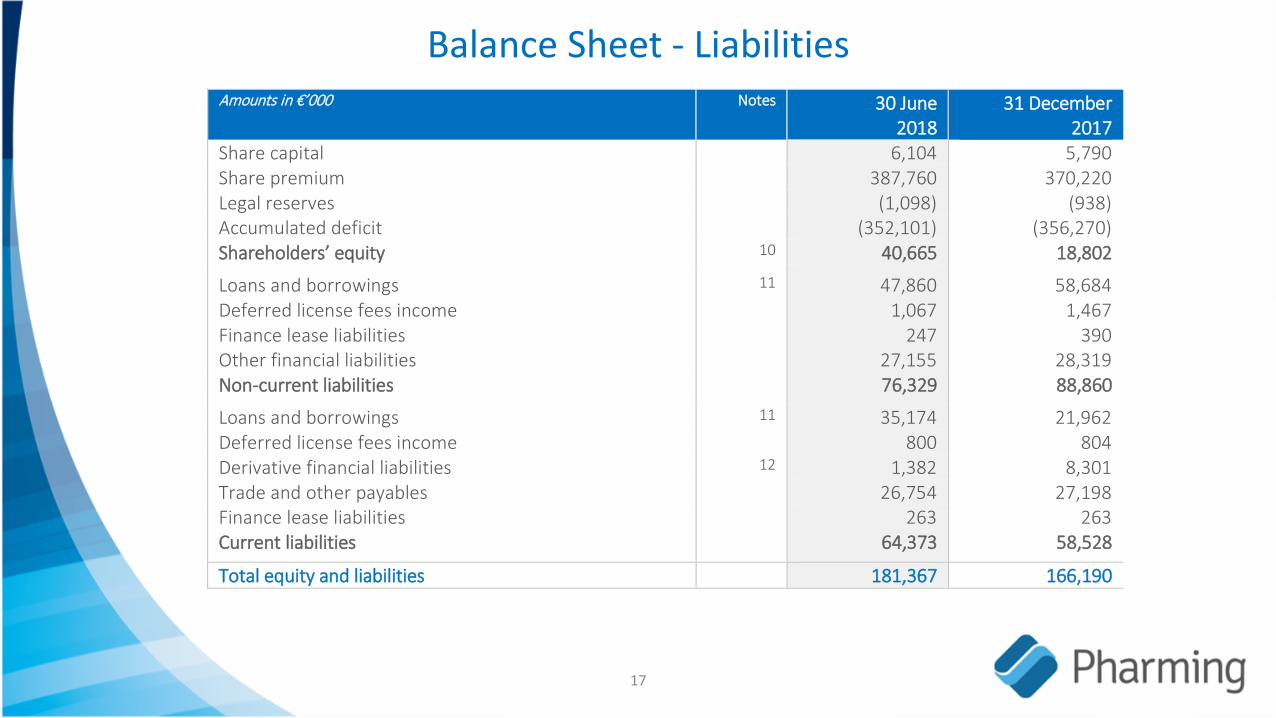
Amounts in €’000
Notes
30 June 2018
31 December 2017
Share capital 6,104 5,790 Share premium 387,760 370,220 Legal reserves (1,098) (938) Accumulated deficit (352,101) (356,270) Shareholders’ equity 10 40,665 18,802
Loans and borrowings 11 47,860 58,684 Deferred license fees income 1,067 1,467 Finance lease liabilities 247 390 Other financial liabilities 27,155 28,319 Non-current liabilities 76,329 88,860
Loans and borrowings 11 35,174 21,962 Deferred license fees income 800 804 Derivative financial liabilities 12 1,382 8,301 Trade and other payables 26,754 27,198 Finance lease liabilities 263 263 Current liabilities 64,373 58,528
Total equity and liabilities 181,367 166,190
Cash flow - Operating Activities
18
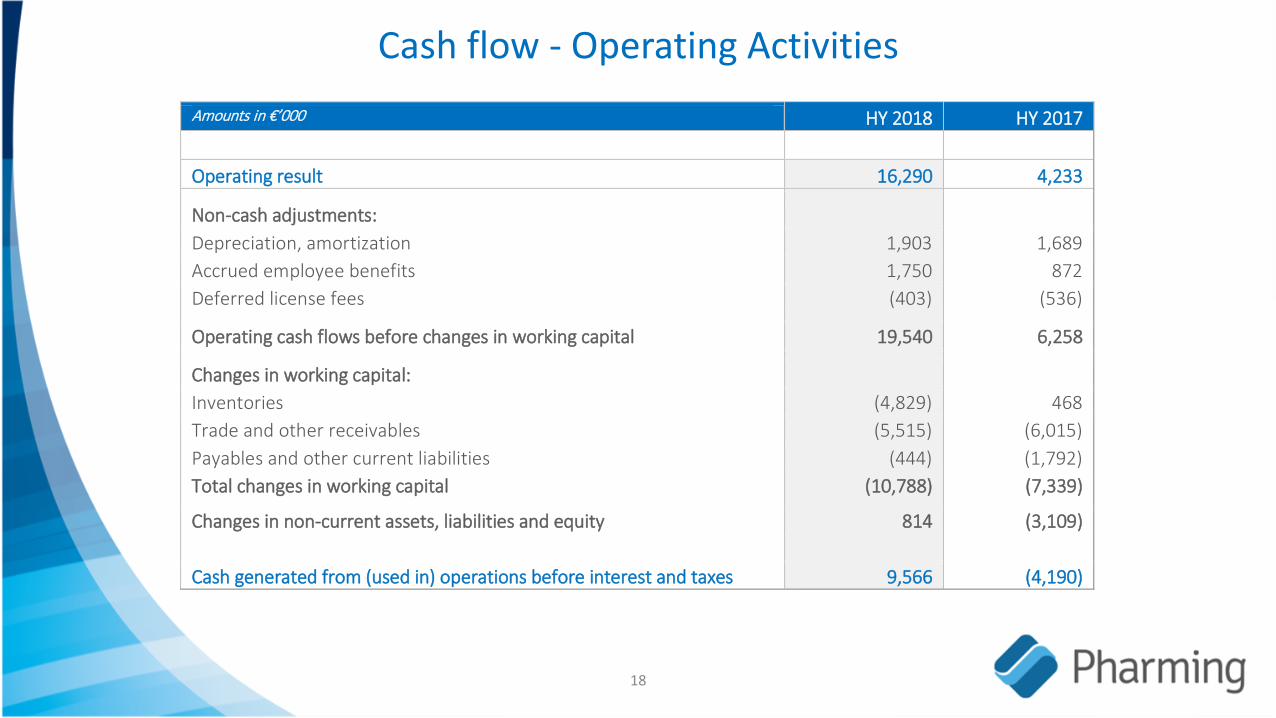
Amounts in €’000 HY 2018 HY 2017 Operating result 16,290 4,233
Non-cash adjustments: Depreciation, amortization 1,903 1,689 Accrued employee benefits 1,750 872 Deferred license fees (403) (536)
Operating cash flows before changes in working capital 19,540 6,258
Changes in working capital: Inventories (4,829) 468 Trade and other receivables (5,515) (6,015) Payables and other current liabilities (444) (1,792) Total changes in working capital
(10,788) (7,339)
Changes in non-current assets, liabilities and equity 814 (3,109) Cash generated from (used in) operations before interest and taxes 9,566 (4,190)
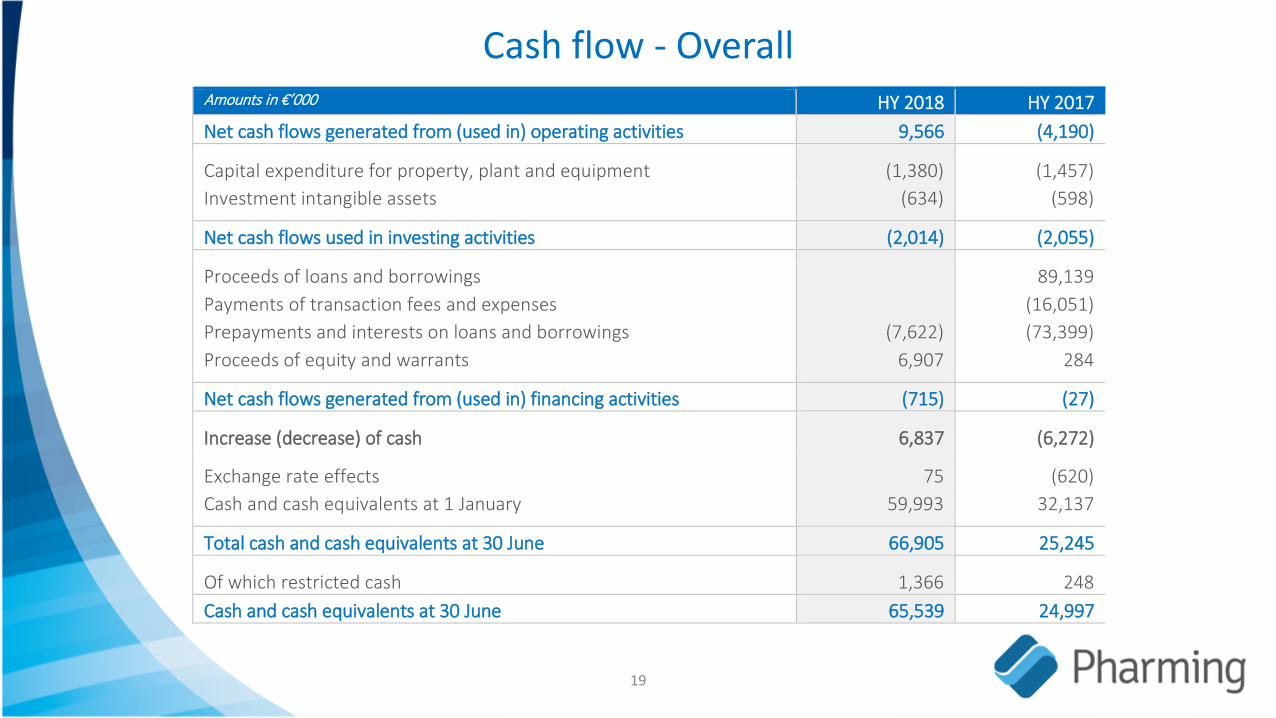
Cash flow - Overall
19
Amounts in €’000 HY 2018 HY 2017 Net cash flows generated from (used in) operating activities 9,566 (4,190)
Capital expenditure for property, plant and equipment (1,380) (1,457) Investment intangible assets (634) (598)
Net cash flows used in investing activities (2,014) (2,055)
Proceeds of loans and borrowings 89,139 Payments of transaction fees and expenses (16,051) Prepayments and interests on loans and borrowings (7,622) (73,399) Proceeds of equity and warrants 6,907 284
Net cash flows generated from (used in) financing activities (715) (27)
Increase (decrease) of cash 6,837 (6,272)
Exchange rate effects 75 (620) Cash and cash equivalents at 1 January 59,993 32,137
Total cash and cash equivalents at 30 June 66,905 25,245
Of which restricted cash 1,366 248 Cash and cash equivalents at 30 June 65,539 24,997
Outlook 2018
20
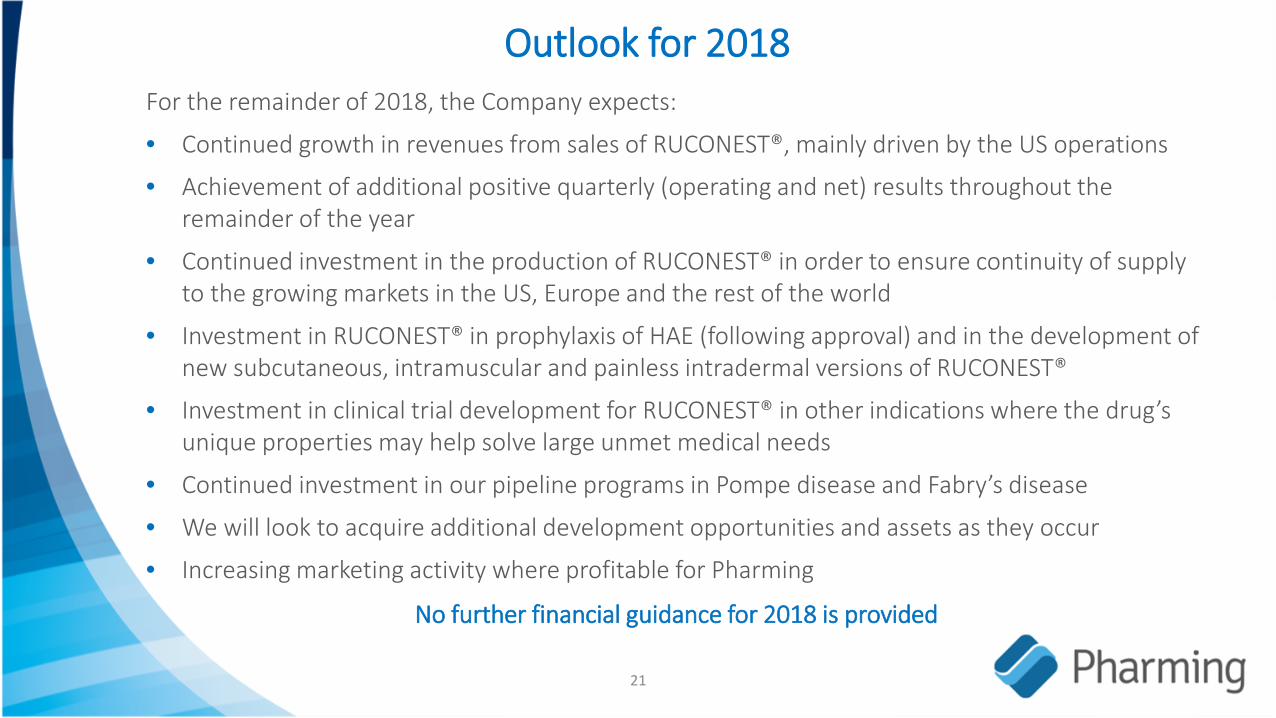
Outlook for 2018
21
For the remainder of 2018, the Company expects:
• Continued growth in revenues from sales of RUCONEST®, mainly driven by the US operations
• Achievement of additional positive quarterly (operating and net) results throughout the remainder of the year
• Continued investment in the production of RUCONEST® in order to ensure continuity of supply to the growing markets in the US, Europe and the rest of the world
• Investment in RUCONEST® in prophylaxis of HAE (following approval) and in the development of new subcutaneous, intramuscular and painless intradermal versions of RUCONEST®
• Investment in clinical trial development for RUCONEST® in other indications where the drug’s unique properties may help solve large unmet medical needs
• Continued investment in our pipeline programs in Pompe disease and Fabry’s disease
• We will look to acquire additional development opportunities and assets as they occur
• Increasing marketing activity where profitable for Pharming
No further financial guidance for 2018 is provided
Tickers: ENXTAM: PHARM
Bloomberg: PHAR.AS
22