Embed Size (px)
Citation preview
Molecular Genetics and Metabolism 100 (2010) 221–228
Contents lists available at ScienceDirect
Molecular Genetics and Metabolism
journal homepage: www.elsevier .com/locate /ymgme
Phase 2 comparison of a novel ammonia scavenging agent with sodiumphenylbutyrate in patients with urea cycle disorders: Safety, pharmacokineticsand ammonia control
Brendan Lee a,b,*, William Rhead c, George A. Diaz d, Bruce F. Scharschmidt e, Asad Mian a,Oleg Shchelochkov a, J.F. Marier f, Martin Beliveau f, Joseph Mauney g, Klara Dickinson e, Antonia Martinez e,Sharron Gargosky e, Masoud Mokhtarani e, Susan A. Berry h
a Baylor College of Medicine, One Baylor Plaza Rm R814, Houston, TX, United Statesb Howard Hughes Medical Institute, TX, United Statesc Pediatrics, Medical College of Wisconsin, 8701 Watertown Plank Rd., Milwaukee, WI, United Statesd Mount Sinai School of Medicine, One Gustave L. Levy Place, New York, NY, United Statese Hyperion Therapeutics, Inc., 601 Gateway Blvd., Ste. 200, South San Francisco, CA, United Statesf Pharsight Corp., Montreal, 2000 Peel St., Suite 570, Quebec, Canadag Chiltern, 2520 Independence Blvd., Ste. 202, Wilmington, NC, United Statesh Division of Genetics and Metabolism, University of Minnesota, 420 Delaware Str., SE, Minneapolis, MN, United States
a r t i c l e i n f o a b s t r a c t
Article history:Received 11 February 2010Received in revised form 18 March 2010Accepted 18 March 2010Available online 23 March 2010
Keywords:AmmoniaClinical trialPhenylacetylglutaminePhenylbutyrateUrea cycle disorders
1096-7192/$ - see front matter � 2010 Elsevier Inc. Adoi:10.1016/j.ymgme.2010.03.014
Abbreviations: ASS, arginosuccinate synthetase deunder the curve; Glycerol phenylbutyrate, generiphenylbutyrate); GPB, glycerol phenylbutyrate; HHHciency; NaPBA, sodium phenylbutyrate; PAA, phenylaglycine; PAGN, phenylacetylglutamine; PBA, phenylburyl glycine; PBGN, phenylbutyryl glutamine; PK, phanormalized area under the curve; UCD, urea cycle dnormal.
* Corresponding author at: Department of MoleculaCollege of Medicine, One Baylor Plaza Rm R814, HousFax: +1 713 798 5168.
E-mail address: [email protected] (B. Lee).
Glycerol phenylbutyrate (glyceryl tri (4-phenylbutyrate)) (GPB) is being studied as an alternative tosodium phenylbutyrate (NaPBA) for the treatment of urea cycle disorders (UCDs). This phase 2 studyexplored the hypothesis that GPB offers similar safety and ammonia control as NaPBA, which is currentlyapproved as adjunctive therapy in the chronic management of UCDs, and examined correlates of 24-hblood ammonia.Methods: An open-label, fixed sequence switch-over study was conducted in adult UCD patients takingmaintenance NaPBA. Blood ammonia and blood and urine metabolites were compared after 7 days (steadystate) of TID dosing on either drug, both dosed to deliver the same amount of phenylbutyric acid (PBA).Results: Ten subjects completed the study. Adverse events were comparable for the two drugs; 2 subjectsexperienced hyperammonemic events on NaPBA while none occurred on GPB. Ammonia values on GPBwere �30% lower than on NaPBA (time-normalized AUC = 26.2 vs. 38.4 lmol/L; Cmax = 56.3 vs.79.1 lmol/L; not statistically significant), and GPB achieved non-inferiority to NaPBA with respect toammonia (time-normalized AUC) by post hoc analysis. Systemic exposure (AUC0–24) to PBA on GPB was27% lower than on NaPBA (540 vs. 739 lg h/mL), whereas exposure to phenylacetic acid (PAA) (575 vs.596 lg h/mL) and phenylacetylglutamine (PAGN) (1098 vs. 1133 lg h/mL) were similar. Urinary PAGNexcretion accounted for �54% of PBA administered for both NaPBA and GPB; other metabolites accountedfor <1%. Intact GPB was generally undetectable in blood and urine. Blood ammonia correlated strongly andinversely with urinary PAGN (r = �0.82; p < 0.0001) but weakly or not at all with blood metabolite levels.Conclusions: Safety and ammonia control with GPB appear at least equal to NaPBA. Urinary PAGN, which isstoichiometrically related to nitrogen scavenging, may be a useful biomarker for both dose selection andadjustment for optimal control of venous ammonia.
� 2010 Elsevier Inc. All rights reserved.
ll rights reserved.
ficiency; AUC0–24, 24-h areac name for glyceryl tri (4-, ornithine translocase defi-cetic acid; PAG, phenylacetyltyric acid; PBG, phenylbuty-
rmacokinetic; TNAUC, time-isorder; ULN, upper limit of
r and Human Genetics, Baylorton, TX 77030, United States.
Introduction
Urea cycle disorders (UCDs) comprise several inherited defi-ciencies of enzymes or transporters necessary for the synthesis ofurea from ammonia [1–3]. UCDs result in the accumulation of toxiclevels of ammonia in the blood and brain of affected patients andcan present in the neonatal period or later in life depending onthe severity and type of defect. UCD incidence is estimated to be�1:8200 live births [1]. Hyperammonemia is the major cause ofmorbidity and mortality in UCD patients, and outcome during
222 B. Lee et al. / Molecular Genetics and Metabolism 100 (2010) 221–228
hyperammonemic crises correlates with blood ammonia levels [4].Control of blood ammonia levels is the main objective of both acuteand chronic management of UCD patients.
Sodium phenylbutyrate (NaPBA) (US trade name: BUPHENYL�,
EU: AMMONAPS�) is approved for the chronic adjunctive treatment
of certain UCDs and lowers ammonia by enhancing excretion ofwaste nitrogen. It is a pro-drug that undergoes rapid beta-oxida-tion to phenylacetate, (PAA), a metabolically active compound thatconjugates with glutamine via acetylation to form phenylacetyl-glutamine (PAGN) which is then excreted in the urine. PAGN, likeurea, contains two molecules of nitrogen and therefore representsan alternate to urea for excretion of waste nitrogen [5]. The maxi-mum approved dose of 20 NaPBA grams per day (40 tablets perday) contains approximately 2363 mg of sodium, and current ‘‘Die-tary Guidelines for Americans 2005” recommends a sodium intakeof 2300 mg/day for the general population and 1500 mg/day forindividuals with hypertension and selected groups at risk forhypertension [6]. Some UCD patients may be at increased risk forhypertension, and a sodium-free oral treatment option would beespecially beneficial for these patients [7,8].
Glycerol phenylbutyrate (GPB) is an investigational agent beingstudied as an alternative therapy to NaPBA in UCD patients. It con-sists of a glycerol backbone with three molecules of PBA joined viaester linkage and is a pale yellow nearly odorless and tasteless oil.17.4 mL of GPB [�1 tsp TID] delivers an amount of PBA equivalentto 20 g of NaPBA [40 tablets]).
The safety and pharmacokinetic (PK) characteristics of GPBhave been evaluated in pre-clinical models and in two prior clini-cal studies, including a randomized, crossover, open-label study in24 healthy male subjects administered a single oral dose of NaPBAand GPB (equivalent to 3 g/m2 of PBA), and an open-label study in32 adults, including 8 healthy adults and 24 adults with Child-Pugh grade A, B, or C cirrhosis (8 each), each of whom receiveda single 100 mg/kg dose of GPB followed by 1 week of BIDdosing at 100 mg/kg per dose [9]. Collectively, these prior studiessuggest that GPB exhibits satisfactory safety, achieves steadystate within 4 days or less, and exhibits slow release characteris-tics. The present phase 2 study, the first in UCD patients, was de-signed to compare safety, PK and ammonia control of GPB withNaPBA.
Materials and methods
Study design and treatments
This was a phase 2, open-label, fixed sequence, switch-overstudy in patients being treated with NaPBA for a UCD (confirmedvia enzymatic, biochemical or genetic testing). Subjects 18 yearsold or older who had been treated with NaPBA for P2 weeks wereeligible. Liver transplant, hypersensitivity to PBA, PAA or PAGN,clinically significant laboratory abnormalities or ECG findings, orany condition such as infection or medications that could affectammonia levels were major exclusion criteria.
After enrollment, subjects received NaPBA for at least 7 days,TID with meals at the dose level prescribed by the investigator.On the last day of NaPBA treatment they were admitted to an inpa-tient research unit for 24-h PK and ammonia monitoring. Depend-ing on dose, subjects were then either switched directly to 100%GPB, or GPB was introduced in step-wise weekly increments equiv-alent to 650 mg/kg/day of NaPBA, with the remainder of the PBAequivalent dose administered as corresponding weekly decre-ments in the dose of NaPBA. Initiation or increases in GPB dosingwere done under observation in an appropriately monitored set-ting, and subjects were discharged after they were deemed clini-cally stable and after at least 48 h of observation. After at least7 days on 100% GPB administered TID at a dose equivalent to their
prescribed dose of NaPBA in terms of PBA delivered, subjects werere-admitted to the research unit for 24-h PK and ammonia assess-ment, after which they were switched back to NaPBA.
Subjects remained on their prescribed amount of dietary pro-tein throughout the study, received dietary counseling, were in-structed to record their diet for at least 3 days prior to each visitand were queried at the end of the study with respect to their pref-erence for NaPBA or GPB. Compliance was assessed by monitoringdrug accountability records and inspection of the returned bottlesand vials. Safety was assessed through standard safety laboratorytests, physical exams, serial triplicate ECG, and collection of ad-verse events. Efficacy was assessed by serial measurement of ve-nous ammonia. An independent Data and Safety MonitoringBoard (DSMB) was chartered to oversee the conduct of the studyand an interim analysis of safety, ammonia, and PK data wasplanned after 3 subjects completed the study.
Pharmacokinetic and ammonia sampling
Blood samples for analysis of intact GPB, for NaPBA and GPBmetabolites including PBA, PAA, PAGN, phenylacetyl glycine(PAG), phenylbutyryl glycine (PBG) and phenylbutyryl glutamine(PBGN), as well as for venous ammonia were collected on the lastday of dosing with either NaPBA or GPB at the following timepoints: at pre-first dose and at 30 min and 1, 2, 4, 5, 6, 8, 10, 12,and 24 h post-first dose. Urine was collected and analyzed for thesesame drug metabolites and collected in aliquots of 0–6 h (begin-ning with the time of the first dose of the day), 6–12 h and 12–24 h.
Pharmacokinetic, pharmacodynamic and statistical analyses
PK parameters for PBA, PAA, and PAGN in plasma, PAGN in ur-ine, as well as pharmacodynamic parameters for venous ammoniawere calculated with non-compartmental methods using a vali-dated version of WinNonlin Enterprise (version 5.2). Individualplasma concentrations, urinary amounts and volumes were sum-marized with descriptive statistics (e.g. number of patients [n],mean, standard deviation [SD], median, minimum, and maximum).
The following plasma PK parameters were calculated for PBA,PAA and PAGN using actual time–concentration profiles for eachsubject: area under the concentration versus time curve from time0 (pre-dose) to 24 h, calculated using the linear trapezoid rule(AUC0–24), maximum plasma concentration at steady state(Cmaxss), minimum plasma concentration at steady state (Cminss),time maximum plasma concentration at steady state (Tmaxss), andapparent clearance at steady state (CLss/F) (calculated as Dose/AUC0–24). The terminal elimination half-life of PBA and PAA couldnot be calculated due to the limited number of samples availableafter the last dose of GPB and NaPBA. The amount of PAGNexcreted in urine over 24 h was calculated from urinary concentra-tion (by multiplying the urinary volume with urinary concentra-tions). The time-normalized area under the curve (TNAUC) andCmaxss were calculated for venous ammonia, a pharmacodynamicmarker. TNAUC was calculated as the AUC divided by the timespanned by the actual sampling period.
Ammonia TNAUC and urinary excretion of PAGN were assessedusing an ANOVA model with 90% CI for the difference in the means.The 90% CI were constructed from the analysis of variance in thelogarithmic scale and back-transformed to the original scale. In-tra-patient coefficient of variability for PK and PD parameters werederived from the ANOVA model. Statistical analyses were per-formed using the LinMix module in WinNonlin Enterprise (version5.2). Correlates of blood ammonia were determined using Spear-man rank-order correlations. Measurement of total urinary nitro-gen (TUN) was performed by Elementar Rapid NIII Analyzer(Mayo Medical Laboratories, Rochester, MN) applying Dumas
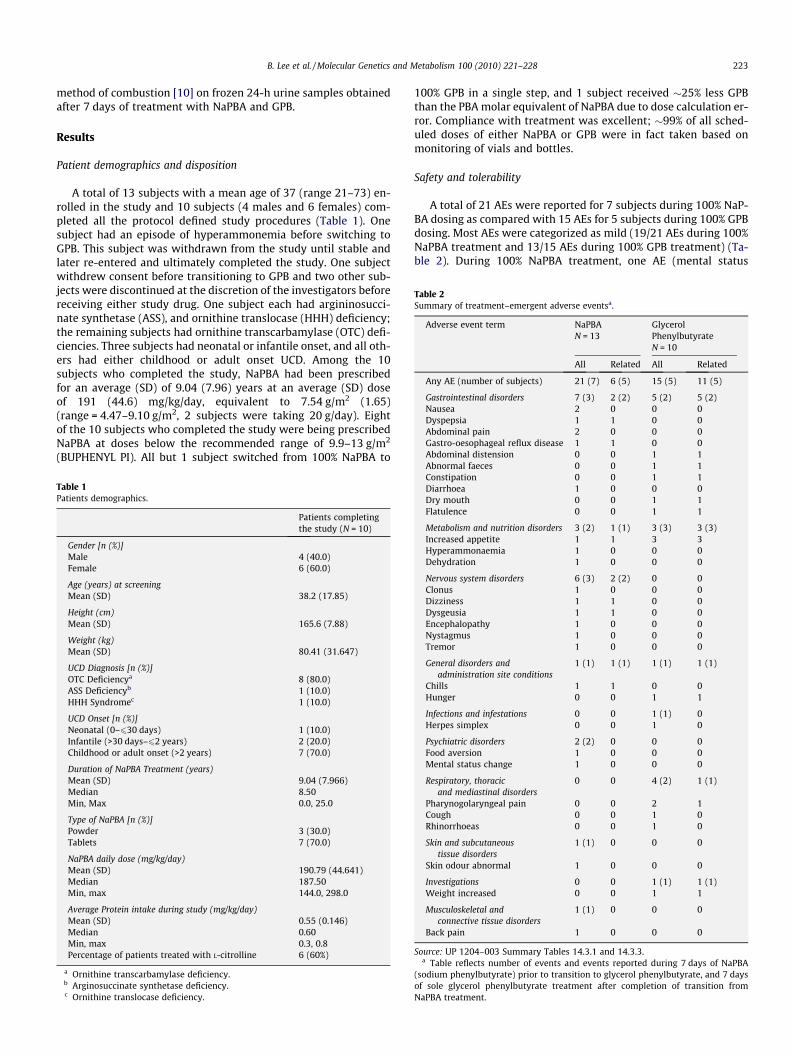
Table 2Summary of treatment–emergent adverse eventsa.
Adverse event term NaPBAN = 13
GlycerolPhenylbutyrateN = 10
All Related All Related
Any AE (number of subjects) 21 (7) 6 (5) 15 (5) 11 (5)
Gastrointestinal disorders 7 (3) 2 (2) 5 (2) 5 (2)Nausea 2 0 0 0Dyspepsia 1 1 0 0Abdominal pain 2 0 0 0Gastro-oesophageal reflux disease 1 1 0 0Abdominal distension 0 0 1 1
B. Lee et al. / Molecular Genetics and Metabolism 100 (2010) 221–228 223
method of combustion [10] on frozen 24-h urine samples obtainedafter 7 days of treatment with NaPBA and GPB.
Results
Patient demographics and disposition
A total of 13 subjects with a mean age of 37 (range 21–73) en-rolled in the study and 10 subjects (4 males and 6 females) com-pleted all the protocol defined study procedures (Table 1). Onesubject had an episode of hyperammonemia before switching toGPB. This subject was withdrawn from the study until stable andlater re-entered and ultimately completed the study. One subjectwithdrew consent before transitioning to GPB and two other sub-jects were discontinued at the discretion of the investigators beforereceiving either study drug. One subject each had argininosucci-nate synthetase (ASS), and ornithine translocase (HHH) deficiency;the remaining subjects had ornithine transcarbamylase (OTC) defi-ciencies. Three subjects had neonatal or infantile onset, and all oth-ers had either childhood or adult onset UCD. Among the 10subjects who completed the study, NaPBA had been prescribedfor an average (SD) of 9.04 (7.96) years at an average (SD) doseof 191 (44.6) mg/kg/day, equivalent to 7.54 g/m2 (1.65)(range = 4.47–9.10 g/m2, 2 subjects were taking 20 g/day). Eightof the 10 subjects who completed the study were being prescribedNaPBA at doses below the recommended range of 9.9–13 g/m2
(BUPHENYL PI). All but 1 subject switched from 100% NaPBA to
Table 1Patients demographics.
Patients completingthe study (N = 10)
Gender [n (%)]Male 4 (40.0)Female 6 (60.0)
Age (years) at screeningMean (SD) 38.2 (17.85)
Height (cm)Mean (SD) 165.6 (7.88)
Weight (kg)Mean (SD) 80.41 (31.647)
UCD Diagnosis [n (%)]OTC Deficiencya 8 (80.0)ASS Deficiencyb 1 (10.0)HHH Syndromec 1 (10.0)
UCD Onset [n (%)]Neonatal (0–630 days) 1 (10.0)Infantile (>30 days–62 years) 2 (20.0)Childhood or adult onset (>2 years) 7 (70.0)
Duration of NaPBA Treatment (years)Mean (SD) 9.04 (7.966)Median 8.50Min, Max 0.0, 25.0
Type of NaPBA [n (%)]Powder 3 (30.0)Tablets 7 (70.0)
NaPBA daily dose (mg/kg/day)Mean (SD) 190.79 (44.641)Median 187.50Min, max 144.0, 298.0
Average Protein intake during study (mg/kg/day)Mean (SD) 0.55 (0.146)Median 0.60Min, max 0.3, 0.8Percentage of patients treated with L-citrolline 6 (60%)
a Ornithine transcarbamylase deficiency.b Arginosuccinate synthetase deficiency.c Ornithine translocase deficiency.
100% GPB in a single step, and 1 subject received �25% less GPBthan the PBA molar equivalent of NaPBA due to dose calculation er-ror. Compliance with treatment was excellent; �99% of all sched-uled doses of either NaPBA or GPB were in fact taken based onmonitoring of vials and bottles.
Safety and tolerability
A total of 21 AEs were reported for 7 subjects during 100% NaP-BA dosing as compared with 15 AEs for 5 subjects during 100% GPBdosing. Most AEs were categorized as mild (19/21 AEs during 100%NaPBA treatment and 13/15 AEs during 100% GPB treatment) (Ta-ble 2). During 100% NaPBA treatment, one AE (mental status
Abnormal faeces 0 0 1 1Constipation 0 0 1 1Diarrhoea 1 0 0 0Dry mouth 0 0 1 1Flatulence 0 0 1 1
Metabolism and nutrition disorders 3 (2) 1 (1) 3 (3) 3 (3)Increased appetite 1 1 3 3Hyperammonaemia 1 0 0 0Dehydration 1 0 0 0
Nervous system disorders 6 (3) 2 (2) 0 0Clonus 1 0 0 0Dizziness 1 1 0 0Dysgeusia 1 1 0 0Encephalopathy 1 0 0 0Nystagmus 1 0 0 0Tremor 1 0 0 0
General disorders andadministration site conditions
1 (1) 1 (1) 1 (1) 1 (1)
Chills 1 1 0 0Hunger 0 0 1 1
Infections and infestations 0 0 1 (1) 0Herpes simplex 0 0 1 0
Psychiatric disorders 2 (2) 0 0 0Food aversion 1 0 0 0Mental status change 1 0 0 0
Respiratory, thoracicand mediastinal disorders
0 0 4 (2) 1 (1)
Pharynogolaryngeal pain 0 0 2 1Cough 0 0 1 0Rhinorrhoeas 0 0 1 0
Skin and subcutaneoustissue disorders
1 (1) 0 0 0
Skin odour abnormal 1 0 0 0
Investigations 0 0 1 (1) 1 (1)Weight increased 0 0 1 1
Musculoskeletal andconnective tissue disorders
1 (1) 0 0 0
Back pain 1 0 0 0
Source: UP 1204–003 Summary Tables 14.3.1 and 14.3.3.a Table reflects number of events and events reported during 7 days of NaPBA
(sodium phenylbutyrate) prior to transition to glycerol phenylbutyrate, and 7 daysof sole glycerol phenylbutyrate treatment after completion of transition fromNaPBA treatment.
224 B. Lee et al. / Molecular Genetics and Metabolism 100 (2010) 221–228
change) was considered moderate. During 100% GPB treatment,one subject with history of irritable bowel disease reported anAE (abdominal distension) that was considered severe and oneAE (flatulence) that was considered moderate; both resolved with-out specific treatment. Two subjects experienced SAEs of hyperam-monemia while receiving NaPBA, one occurred before the subjectbegan receiving GPB and one occurred 21 days after the subjecthad completed dosing with GPB and had switched back to NaPBA.Both were categorized as severe. There were no episodes of hyper-ammonemia on GPB.
Pharmacokinetic and pharmacodynamic analyses
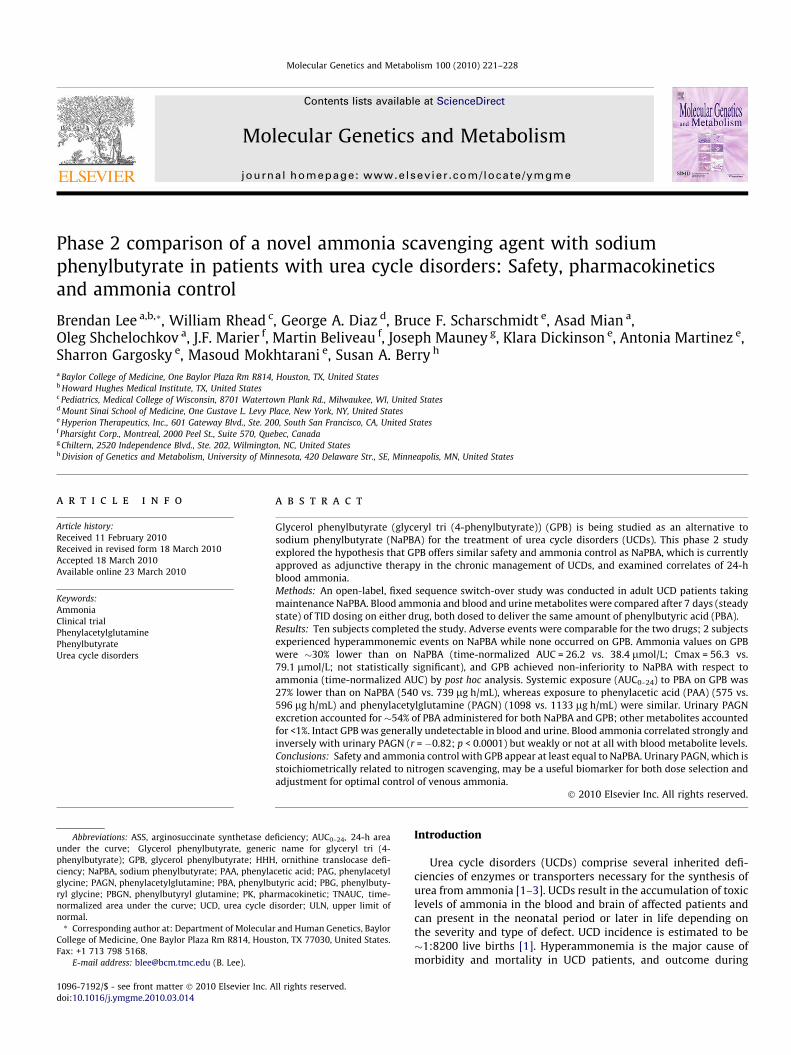
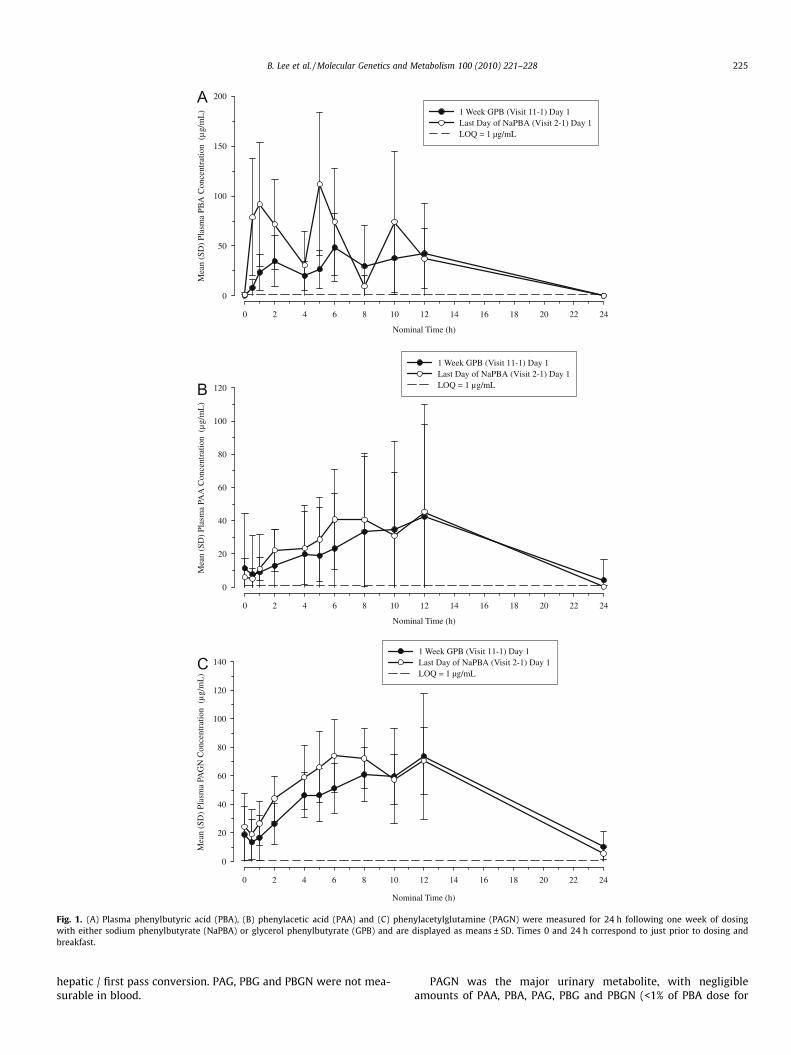
All 10 patients who completed the study were consideredevaluable for the PK analyses. Plasma PK parameters of PBA, PAAand PAGN and urinary PK parameters of PAGN are summarizedin Table 3 and the 24-h concentration profiles are depicted inFig. 1. Systemic exposure (AUC0–24) to PBA following GPB adminis-tration was 27% lower than that observed with NaPBA (540 vs.739 lg h/mL, respectively), whereas exposure levels of PAA (575vs. 596 lg h/mL, respectively) and PAGN (1098 vs. 1133 lg h/mL,respectively) were similar. PAG, PBG, and PBGN were not detect-able in plasma for either drug.
The total amount of PAGN excreted in urine over 24 h followingGPB treatment was slightly lower than that observed for NaPBA,but PAGN accounted for 54% of PBA delivered by both drugs (Ta-
Table 3PK parameters and ammonia following NaPBA and glycerol phenylbutyrateadministration.
PK/PD parameters Arithmetic mean (CV%)
Glycerolphenylbutyrate(n = 10)
NaPBA (n = 10)
PBA in plasmaAUC0–24 (lg h/mL) 540 (60.2)* 740 (49.1)*
Cmaxss (lg/mL) 70.1 (64.7) 141 (44.3)Cminss (lg/mL) 2.87 (265) 0.588 (255)
PAA in plasmaAUC0–24 (lg h/mL) 575 (169)* 596 (124)*
Cmaxss (lg/mL) 40.5 (147) 53.0 (94.7)Cminss (lg/mL) 7.06 (310) 3.56 (194)
PAGN in plasmaAUC0–24 (lg h/mL) 1098 (44.2) * 1133 (31.0)***
Cmaxss (lg/mL) 71.9 (55.9) 83.3 (25.8)Cminss (lg/mL) 12.1 (134) 16.8 (86.3)
PAGN in urineTotal excreted 0–24 h (lg)*** 10 784 747 (25.9) 12 153 473 (48.2)0–6 h (lg) 2381371 (61.3) 2452838 (41.6)6–12 h (lg) 3027310 (44.9) 4859121 (54.7)12–24 h (lg)*** 5433033 (50.4) 4645447 (59.8)Recovery of PBA as PAGN (%) 54 (15) 54 (16)
Total urinary nitrogen in 24 hMean (SD) g 9.0 (3.0)** 9.6 (3.9)**
AmmoniaTNAUC (lmol/L) 26.2 (38.9) 38.4 (51.0)Cmaxss (lmol/L) 56.3 (49.5) 79.1 (50.6)% normal ammonia values+ 59.5 (34.04) 73.1 (27.04)
Mean ammonia ratio(Glycerol phenylbutyrate /NaPBA) 0.7195% CI of ratio 0.44–1.14
AUC0–24, area under the concentration from time 0 (pre-dose) to 24 h; Cmaxss,maximum plasma concentration at steady state; Cminss, minimum plasma con-centration at steady state; TNAUC, time-normalized area under the curve.
+ % Normal ammonia values are presented as mean (SD).* n = 8.
** n = 7.*** n = 9.
ble 3). Peak urinary PAGN excretion for NaPBA occurred from 6–12 h after the first dose of the day as compared with 12–24 h forglycerol phenylbutyrate. Urinary PBA, PAA, PAG, PBG and PBGNeach accounted for less than 1% of PBA administered. Total 24-hcreatinine excretion after treatment with NaPBA or glycerol phen-ylbutyrate was similar with means (SD) of 1.08 (0.43) grams and1.03 (0.38) grams, respectively. The mean (SD) total urinary nitro-gen after treatment with NaPBA and GPB was similar, 9.6 (3.9) gand 9.0 (3.0) g, respectively.
Mean (SD) glutamine levels (lmol/dL) in the 8 patients forwhom measurements on both drugs were available were some-what higher on NaPBA as compared with GPB [739(294) vs.653(313)]; mean decrease = �86.6 (122); (p > 0.05).
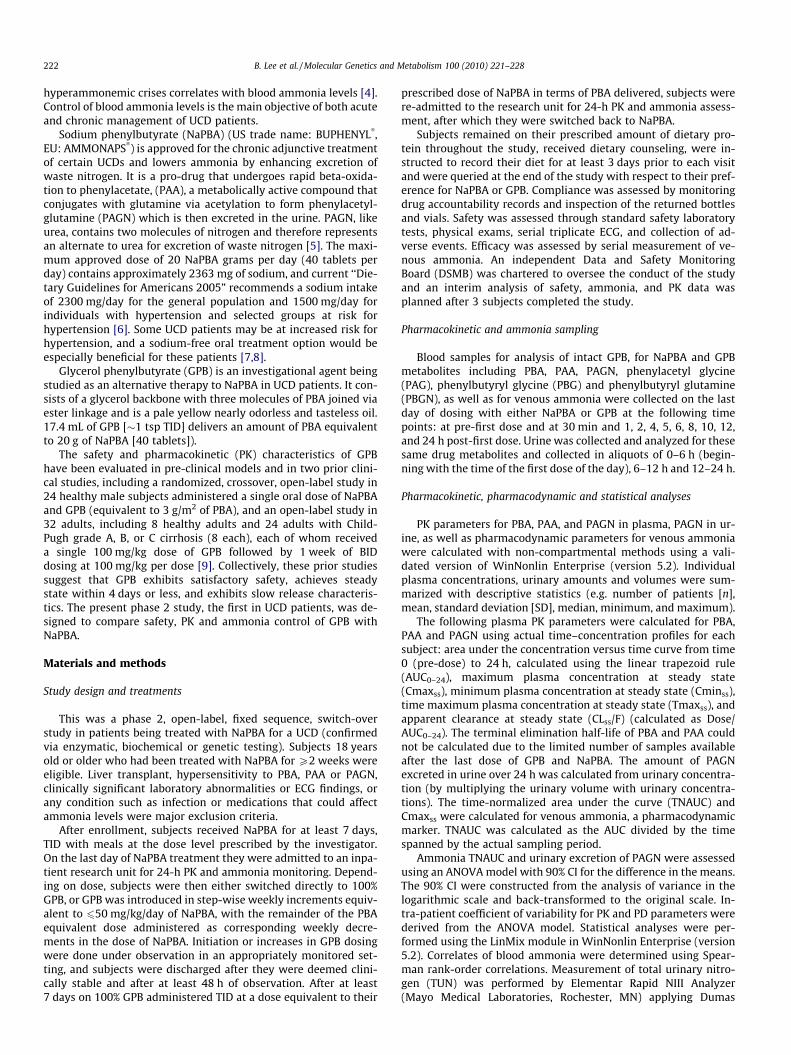
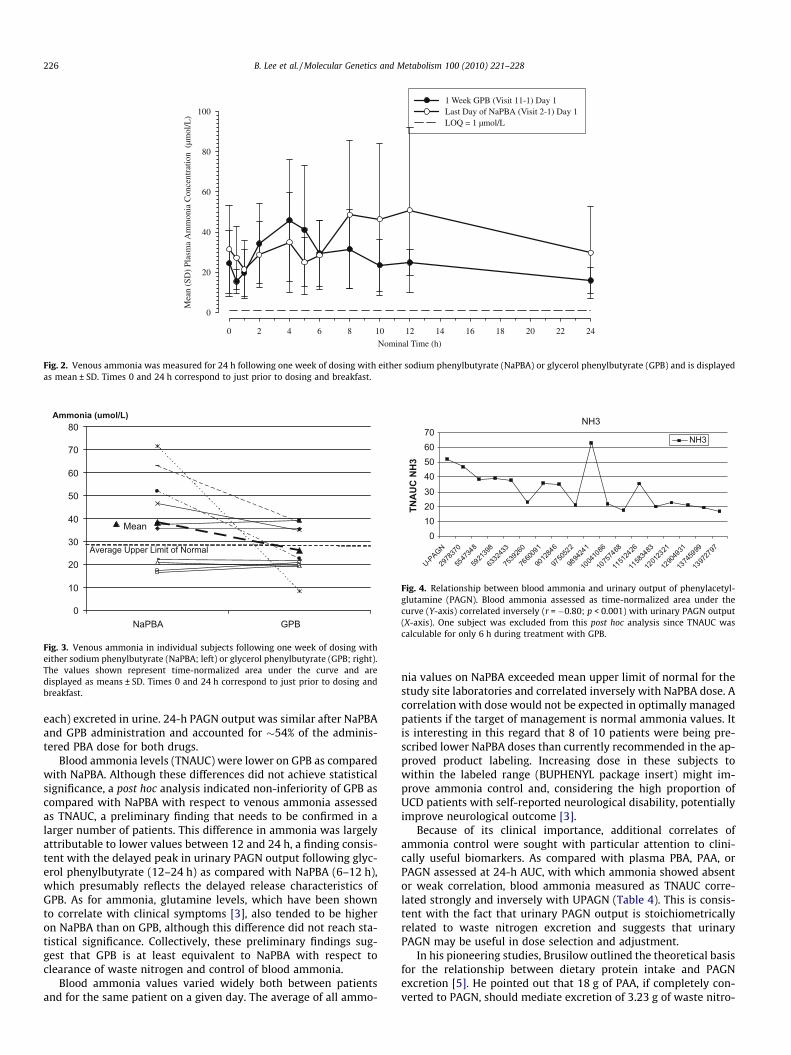
Blood ammonia values among all patients varied widely on bothNaPBA (range 2–150 lmol/L; n = 101 values total) and on GPB(range 2–106 lmol/L, n = 99 total values) and also varied widelyfor any given patient on a single day (2.4- to 54-fold variation onNaPBA; average = 10.4-fold; 2.4- to 12.3-fold variation on GPB;average = 5.4-fold). Mean ammonia values were lower on GPB thanon NaPBA when assessed as TNAUC (32% lower: 26.2 vs. 38.4 lmol/L, respectively) and Cmaxss (29% lower: 56.3 vs. 79.1 lmol/L,respectively) (Table 3). Mean ammonia TNAUC values for individ-ual subjects are depicted in Fig. 4; 27.0% of the ammonia values ob-tained while on GPB were above the upper limit of normal forammonia at their respective study site (upper limit of normal ran-ged from 26–35 lmol/L at the four sites), as compared with 39.6%while on NaPBA (Fig. 3). These differences were attributable tolower ‘overnight’ ammonia levels (12–24 h) and did not reach sta-tistical significance (Fig. 2). A post hoc analysis indicated non-infe-riority of GPB in controlling ammonia compared to NaPBA withrespect to TNAUC using standard non-inferiority methodologyand the conventional 1.25 upper boundary for the 95% CI. The ratioof the least square geometric means (GPB/NaPBA) was 0.71 with a95% CI of 0.44–1.14.
Correlates of blood ammonia
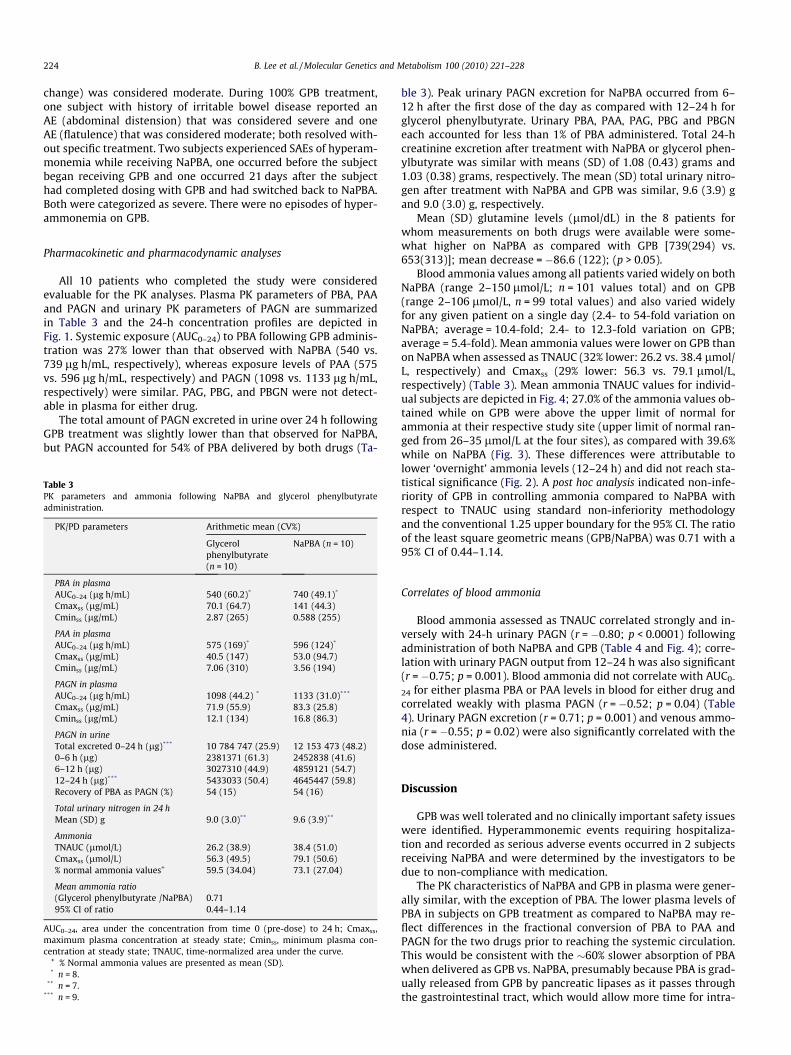
Blood ammonia assessed as TNAUC correlated strongly and in-versely with 24-h urinary PAGN (r = �0.80; p < 0.0001) followingadministration of both NaPBA and GPB (Table 4 and Fig. 4); corre-lation with urinary PAGN output from 12–24 h was also significant(r = �0.75; p = 0.001). Blood ammonia did not correlate with AUC0-
24 for either plasma PBA or PAA levels in blood for either drug andcorrelated weakly with plasma PAGN (r = �0.52; p = 0.04) (Table4). Urinary PAGN excretion (r = 0.71; p = 0.001) and venous ammo-nia (r = �0.55; p = 0.02) were also significantly correlated with thedose administered.
Discussion
GPB was well tolerated and no clinically important safety issueswere identified. Hyperammonemic events requiring hospitaliza-tion and recorded as serious adverse events occurred in 2 subjectsreceiving NaPBA and were determined by the investigators to bedue to non-compliance with medication.
The PK characteristics of NaPBA and GPB in plasma were gener-ally similar, with the exception of PBA. The lower plasma levels ofPBA in subjects on GPB treatment as compared to NaPBA may re-flect differences in the fractional conversion of PBA to PAA andPAGN for the two drugs prior to reaching the systemic circulation.This would be consistent with the �60% slower absorption of PBAwhen delivered as GPB vs. NaPBA, presumably because PBA is grad-ually released from GPB by pancreatic lipases as it passes throughthe gastrointestinal tract, which would allow more time for intra-
Nominal Time (h)
0 2 4 6 8 10 12 14 16 18 20 22 24
Mea
n (S
D)
Plas
ma
PBA
Con
cent
ratio
n (
µg/
mL
)
0
50
100
150
200
1 Week GPB (Visit 11-1) Day 1Last Day of NaPBA (Visit 2-1) Day 1LOQ = 1 µg/mL
Nominal Time (h)
0 2 4 6 8 10 12 14 16 18 20 22 24
Mea
n (S
D)
Plas
ma
PAA
Con
cent
ratio
n (
µg/
mL
)
0
20
40
60
80
100
120
1 Week GPB (Visit 11-1) Day 1Last Day of NaPBA (Visit 2-1) Day 1LOQ = 1 µg/mL
Nominal Time (h)
0 2 4 6 8 10 12 14 16 18 20 22 24
Mea
n (S
D)
Plas
ma
PAG
N C
once
ntra
tion
(µ
g/m
L)
0
20
40
60
80
100
120
1401 Week GPB (Visit 11-1) Day 1Last Day of NaPBA (Visit 2-1) Day 1LOQ = 1 µg/mL
B
A
C
Fig. 1. (A) Plasma phenylbutyric acid (PBA), (B) phenylacetic acid (PAA) and (C) phenylacetylglutamine (PAGN) were measured for 24 h following one week of dosingwith either sodium phenylbutyrate (NaPBA) or glycerol phenylbutyrate (GPB) and are displayed as means ± SD. Times 0 and 24 h correspond to just prior to dosing andbreakfast.
B. Lee et al. / Molecular Genetics and Metabolism 100 (2010) 221–228 225
hepatic / first pass conversion. PAG, PBG and PBGN were not mea-surable in blood.
PAGN was the major urinary metabolite, with negligibleamounts of PAA, PBA, PAG, PBG and PBGN (<1% of PBA dose for
Nominal Time (h)
0 2 4 6 8 10 12 14 16 18 20 22 24
Mea
n (S
D)
Plas
ma
Am
mon
ia C
once
ntra
tion
(µm
ol/L
)
0
20
40
60
80
1001 Week GPB (Visit 11-1) Day 1Last Day of NaPBA (Visit 2-1) Day 1LOQ = 1 µmol/L
Fig. 2. Venous ammonia was measured for 24 h following one week of dosing with either sodium phenylbutyrate (NaPBA) or glycerol phenylbutyrate (GPB) and is displayedas mean ± SD. Times 0 and 24 h correspond to just prior to dosing and breakfast.
Mean
0
10
20
30
40
50
60
70
80
BPGABPaN
Ammonia (umol/L)
Average Upper Limit of Normal
Fig. 3. Venous ammonia in individual subjects following one week of dosing witheither sodium phenylbutyrate (NaPBA; left) or glycerol phenylbutyrate (GPB; right).The values shown represent time-normalized area under the curve and aredisplayed as means ± SD. Times 0 and 24 h correspond to just prior to dosing andbreakfast.
NH3
010203040506070
U-P
AGN
2978
370
5547
348
5921
398
6332
433
7539
260
7660
091
9012
846
9750
522
9894
241
1004
1086
1075
7468
1151
2426
1158
3483
1201
2321
1290
4931
1374
5999
1397
2797
TNA
UC
NH
3
NH3
Fig. 4. Relationship between blood ammonia and urinary output of phenylacetyl-glutamine (PAGN). Blood ammonia assessed as time-normalized area under thecurve (Y-axis) correlated inversely (r = �0.80; p < 0.001) with urinary PAGN output(X-axis). One subject was excluded from this post hoc analysis since TNAUC wascalculable for only 6 h during treatment with GPB.
226 B. Lee et al. / Molecular Genetics and Metabolism 100 (2010) 221–228
each) excreted in urine. 24-h PAGN output was similar after NaPBAand GPB administration and accounted for �54% of the adminis-tered PBA dose for both drugs.
Blood ammonia levels (TNAUC) were lower on GPB as comparedwith NaPBA. Although these differences did not achieve statisticalsignificance, a post hoc analysis indicated non-inferiority of GPB ascompared with NaPBA with respect to venous ammonia assessedas TNAUC, a preliminary finding that needs to be confirmed in alarger number of patients. This difference in ammonia was largelyattributable to lower values between 12 and 24 h, a finding consis-tent with the delayed peak in urinary PAGN output following glyc-erol phenylbutyrate (12–24 h) as compared with NaPBA (6–12 h),which presumably reflects the delayed release characteristics ofGPB. As for ammonia, glutamine levels, which have been shownto correlate with clinical symptoms [3], also tended to be higheron NaPBA than on GPB, although this difference did not reach sta-tistical significance. Collectively, these preliminary findings sug-gest that GPB is at least equivalent to NaPBA with respect toclearance of waste nitrogen and control of blood ammonia.
Blood ammonia values varied widely both between patientsand for the same patient on a given day. The average of all ammo-
nia values on NaPBA exceeded mean upper limit of normal for thestudy site laboratories and correlated inversely with NaPBA dose. Acorrelation with dose would not be expected in optimally managedpatients if the target of management is normal ammonia values. Itis interesting in this regard that 8 of 10 patients were being pre-scribed lower NaPBA doses than currently recommended in the ap-proved product labeling. Increasing dose in these subjects towithin the labeled range (BUPHENYL package insert) might im-prove ammonia control and, considering the high proportion ofUCD patients with self-reported neurological disability, potentiallyimprove neurological outcome [3].
Because of its clinical importance, additional correlates ofammonia control were sought with particular attention to clini-cally useful biomarkers. As compared with plasma PBA, PAA, orPAGN assessed at 24-h AUC, with which ammonia showed absentor weak correlation, blood ammonia measured as TNAUC corre-lated strongly and inversely with UPAGN (Table 4). This is consis-tent with the fact that urinary PAGN output is stoichiometricallyrelated to waste nitrogen excretion and suggests that urinaryPAGN may be useful in dose selection and adjustment.
In his pioneering studies, Brusilow outlined the theoretical basisfor the relationship between dietary protein intake and PAGNexcretion [5]. He pointed out that 18 g of PAA, if completely con-verted to PAGN, should mediate excretion of 3.23 g of waste nitro-
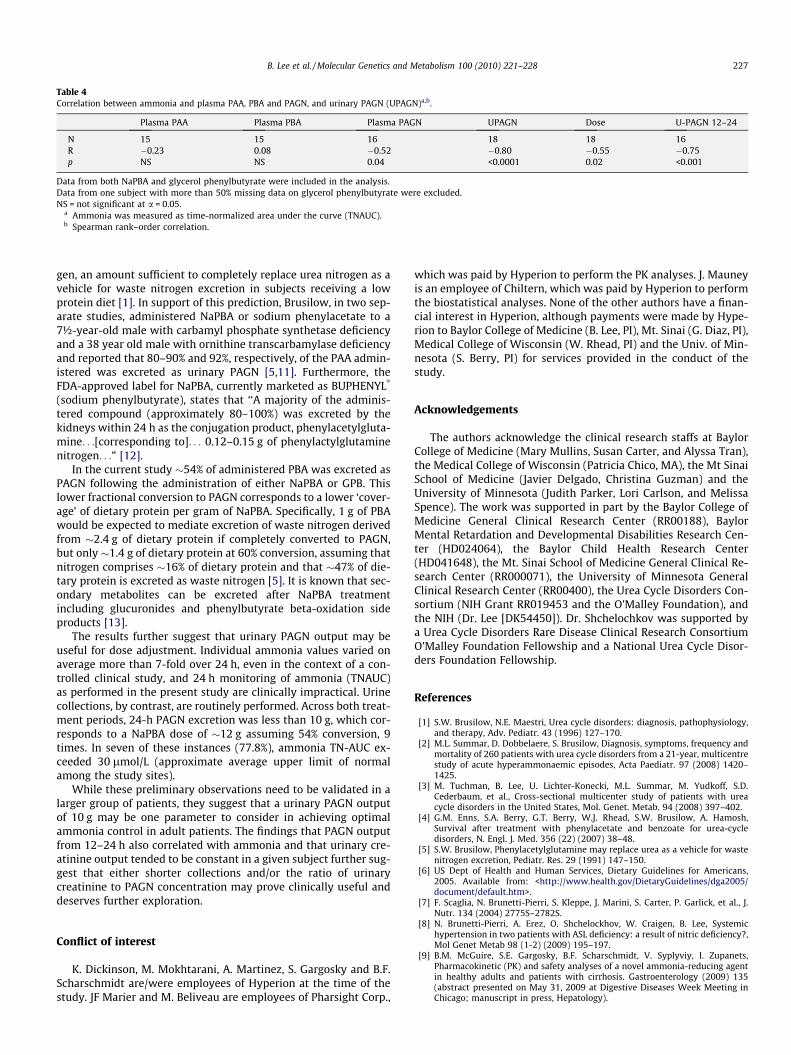
Table 4Correlation between ammonia and plasma PAA, PBA and PAGN, and urinary PAGN (UPAGN)a,b.
Plasma PAA Plasma PBA Plasma PAGN UPAGN Dose U-PAGN 12–24
N 15 15 16 18 18 16R �0.23 0.08 �0.52 �0.80 �0.55 �0.75p NS NS 0.04 <0.0001 0.02 <0.001
Data from both NaPBA and glycerol phenylbutyrate were included in the analysis.Data from one subject with more than 50% missing data on glycerol phenylbutyrate were excluded.NS = not significant at a = 0.05.
a Ammonia was measured as time-normalized area under the curve (TNAUC).b Spearman rank–order correlation.
B. Lee et al. / Molecular Genetics and Metabolism 100 (2010) 221–228 227
gen, an amount sufficient to completely replace urea nitrogen as avehicle for waste nitrogen excretion in subjects receiving a lowprotein diet [1]. In support of this prediction, Brusilow, in two sep-arate studies, administered NaPBA or sodium phenylacetate to a7½-year-old male with carbamyl phosphate synthetase deficiencyand a 38 year old male with ornithine transcarbamylase deficiencyand reported that 80–90% and 92%, respectively, of the PAA admin-istered was excreted as urinary PAGN [5,11]. Furthermore, theFDA-approved label for NaPBA, currently marketed as BUPHENYL
�
(sodium phenylbutyrate), states that ‘‘A majority of the adminis-tered compound (approximately 80–100%) was excreted by thekidneys within 24 h as the conjugation product, phenylacetylgluta-mine. . .[corresponding to]. . . 0.12–0.15 g of phenylactylglutaminenitrogen. . .” [12].
In the current study �54% of administered PBA was excreted asPAGN following the administration of either NaPBA or GPB. Thislower fractional conversion to PAGN corresponds to a lower ‘cover-age’ of dietary protein per gram of NaPBA. Specifically, 1 g of PBAwould be expected to mediate excretion of waste nitrogen derivedfrom �2.4 g of dietary protein if completely converted to PAGN,but only �1.4 g of dietary protein at 60% conversion, assuming thatnitrogen comprises �16% of dietary protein and that �47% of die-tary protein is excreted as waste nitrogen [5]. It is known that sec-ondary metabolites can be excreted after NaPBA treatmentincluding glucuronides and phenylbutyrate beta-oxidation sideproducts [13].
The results further suggest that urinary PAGN output may beuseful for dose adjustment. Individual ammonia values varied onaverage more than 7-fold over 24 h, even in the context of a con-trolled clinical study, and 24 h monitoring of ammonia (TNAUC)as performed in the present study are clinically impractical. Urinecollections, by contrast, are routinely performed. Across both treat-ment periods, 24-h PAGN excretion was less than 10 g, which cor-responds to a NaPBA dose of �12 g assuming 54% conversion, 9times. In seven of these instances (77.8%), ammonia TN-AUC ex-ceeded 30 lmol/L (approximate average upper limit of normalamong the study sites).
While these preliminary observations need to be validated in alarger group of patients, they suggest that a urinary PAGN outputof 10 g may be one parameter to consider in achieving optimalammonia control in adult patients. The findings that PAGN outputfrom 12–24 h also correlated with ammonia and that urinary cre-atinine output tended to be constant in a given subject further sug-gest that either shorter collections and/or the ratio of urinarycreatinine to PAGN concentration may prove clinically useful anddeserves further exploration.
Conflict of interest
K. Dickinson, M. Mokhtarani, A. Martinez, S. Gargosky and B.F.Scharschmidt are/were employees of Hyperion at the time of thestudy. JF Marier and M. Beliveau are employees of Pharsight Corp.,
which was paid by Hyperion to perform the PK analyses. J. Mauneyis an employee of Chiltern, which was paid by Hyperion to performthe biostatistical analyses. None of the other authors have a finan-cial interest in Hyperion, although payments were made by Hype-rion to Baylor College of Medicine (B. Lee, PI), Mt. Sinai (G. Diaz, PI),Medical College of Wisconsin (W. Rhead, PI) and the Univ. of Min-nesota (S. Berry, PI) for services provided in the conduct of thestudy.
Acknowledgements
The authors acknowledge the clinical research staffs at BaylorCollege of Medicine (Mary Mullins, Susan Carter, and Alyssa Tran),the Medical College of Wisconsin (Patricia Chico, MA), the Mt SinaiSchool of Medicine (Javier Delgado, Christina Guzman) and theUniversity of Minnesota (Judith Parker, Lori Carlson, and MelissaSpence). The work was supported in part by the Baylor College ofMedicine General Clinical Research Center (RR00188), BaylorMental Retardation and Developmental Disabilities Research Cen-ter (HD024064), the Baylor Child Health Research Center(HD041648), the Mt. Sinai School of Medicine General Clinical Re-search Center (RR000071), the University of Minnesota GeneralClinical Research Center (RR00400), the Urea Cycle Disorders Con-sortium (NIH Grant RR019453 and the O’Malley Foundation), andthe NIH (Dr. Lee [DK54450]). Dr. Shchelochkov was supported bya Urea Cycle Disorders Rare Disease Clinical Research ConsortiumO’Malley Foundation Fellowship and a National Urea Cycle Disor-ders Foundation Fellowship.
References
[1] S.W. Brusilow, N.E. Maestri, Urea cycle disorders: diagnosis, pathophysiology,and therapy, Adv. Pediatr. 43 (1996) 127–170.
[2] M.L. Summar, D. Dobbelaere, S. Brusilow, Diagnosis, symptoms, frequency andmortality of 260 patients with urea cycle disorders from a 21-year, multicentrestudy of acute hyperammonaemic episodes, Acta Paediatr. 97 (2008) 1420–1425.
[3] M. Tuchman, B. Lee, U. Lichter-Konecki, M.L. Summar, M. Yudkoff, S.D.Cederbaum, et al., Cross-sectional multicenter study of patients with ureacycle disorders in the United States, Mol. Genet. Metab. 94 (2008) 397–402.
[4] G.M. Enns, S.A. Berry, G.T. Berry, W.J. Rhead, S.W. Brusilow, A. Hamosh,Survival after treatment with phenylacetate and benzoate for urea-cycledisorders, N. Engl. J. Med. 356 (22) (2007) 38–48.
[5] S.W. Brusilow, Phenylacetylglutamine may replace urea as a vehicle for wastenitrogen excretion, Pediatr. Res. 29 (1991) 147–150.
[6] US Dept of Health and Human Services, Dietary Guidelines for Americans,2005. Available from: <http://www.health.gov/DietaryGuidelines/dga2005/document/default.htm>.
[7] F. Scaglia, N. Brunetti-Pierri, S. Kleppe, J. Marini, S. Carter, P. Garlick, et al., J.Nutr. 134 (2004) 2775S–2782S.
[8] N. Brunetti-Pierri, A. Erez, O. Shchelockhov, W. Craigen, B. Lee, Systemichypertension in two patients with ASL deficiency: a result of nitric deficiency?,Mol Genet Metab 98 (1-2) (2009) 195–197.
[9] B.M. McGuire, S.E. Gargosky, B.F. Scharschmidt, V. Syplyviy, I. Zupanets,Pharmacokinetic (PK) and safety analyses of a novel ammonia-reducing agentin healthy adults and patients with cirrhosis. Gastroenterology (2009) 135(abstract presented on May 31, 2009 at Digestive Diseases Week Meeting inChicago; manuscript in press, Hepatology).

228 B. Lee et al. / Molecular Genetics and Metabolism 100 (2010) 221–228
[10] J.N. Ward, K.M. Kloke, P.A. Chezick, S. Hughes, S.A. Hughes, J.P. McConnell,Rapid, accurate quantitation of nitrogen in urine and feces using the ElementarRapid NIII Analyzer, Clin. Chem. 48 (S6) (2002) A71.
[11] S.W. Brusilow, J. Finkelstein, Restoration of nitrogen homeostasis in a manwith ornithine transcarbamylase deficiency, Metabolism 42 (1993) 1336–1339.
[12] BUPHENYL� (package insert) Scottsdale, Ucyclyd Pharma, Inc., AZ, 2006[13] T. Kasumov, L.L. Brunengraber, B. Comte, M.A. Puchowicz, K. Jobbins, K.
Thomas, et al., New secondary metabolites of phenylbutyrate and humans andrats, Drug Metab. Dispos. 32 (2004) 10–19.