Embed Size (px)
Citation preview
Final report
UK market composition data of
polypropylene packaging
Report into the UK market composition of polypropylene packaging and the opportunities for production of recycled food grade polypropylene.
Project code: IMT003-102 Research date: October 2011-March 2012 Date: July 2012
WRAP’s vision is a world without waste, where resources are used sustainably. We work with businesses, individuals and communities to help them reap the benefits of reducing waste, developing sustainable products and using resources in an efficient way. Find out more at www.wrap.org.uk Document reference: [e.g. WRAP, 2006, Report Name (WRAP Project TYR009-19. Report prepared by…..Banbury, WRAP]
Written by: Hannah Burke, Keith Freegard, Liz Morrish and Roger Morton
Front cover photography: Baled PP packaging from a UK plastics recovery facility
While we have tried to make sure this report is accurate, we cannot accept responsibility or be held legally responsible for any loss or damage arising out of or in
connection with this information being inaccurate, incomplete or misleading. This material is copyrighted. You can copy it free of charge as long as the material is
accurate and not used in a misleading context. You must identify the source of the material and acknowledge our copyright. You must not use material to endorse or
suggest we have endorsed a commercial product or service. For more details please see our terms and conditions on our website at www.wrap.org.uk
UK market composition data of polypropylene packaging 1
Executive summary
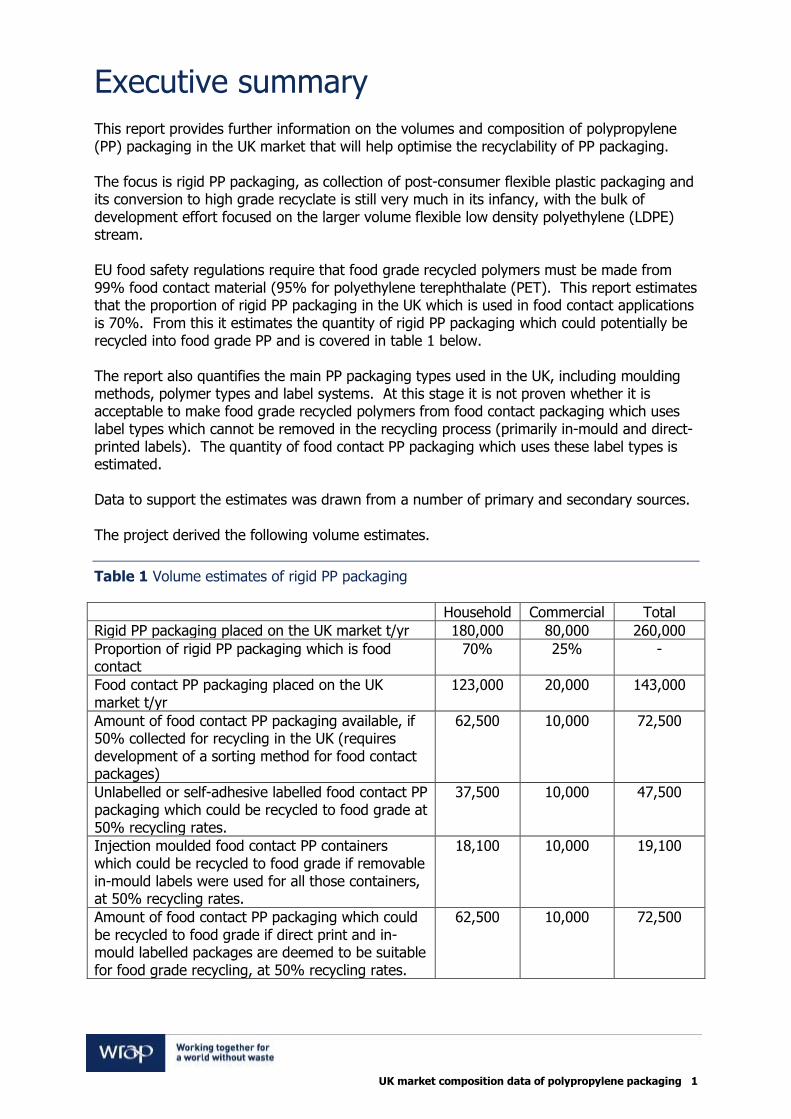
This report provides further information on the volumes and composition of polypropylene (PP) packaging in the UK market that will help optimise the recyclability of PP packaging. The focus is rigid PP packaging, as collection of post-consumer flexible plastic packaging and its conversion to high grade recyclate is still very much in its infancy, with the bulk of development effort focused on the larger volume flexible low density polyethylene (LDPE) stream. EU food safety regulations require that food grade recycled polymers must be made from 99% food contact material (95% for polyethylene terephthalate (PET). This report estimates that the proportion of rigid PP packaging in the UK which is used in food contact applications is 70%. From this it estimates the quantity of rigid PP packaging which could potentially be recycled into food grade PP and is covered in table 1 below. The report also quantifies the main PP packaging types used in the UK, including moulding methods, polymer types and label systems. At this stage it is not proven whether it is acceptable to make food grade recycled polymers from food contact packaging which uses label types which cannot be removed in the recycling process (primarily in-mould and direct-printed labels). The quantity of food contact PP packaging which uses these label types is estimated. Data to support the estimates was drawn from a number of primary and secondary sources. The project derived the following volume estimates.
Table 1 Volume estimates of rigid PP packaging
Household Commercial Total
Rigid PP packaging placed on the UK market t/yr 180,000 80,000 260,000
Proportion of rigid PP packaging which is food contact
70% 25% -
Food contact PP packaging placed on the UK market t/yr
123,000 20,000 143,000
Amount of food contact PP packaging available, if 50% collected for recycling in the UK (requires development of a sorting method for food contact packages)
62,500 10,000 72,500
Unlabelled or self-adhesive labelled food contact PP packaging which could be recycled to food grade at 50% recycling rates.
37,500 10,000 47,500
Injection moulded food contact PP containers which could be recycled to food grade if removable in-mould labels were used for all those containers, at 50% recycling rates.
18,100 10,000
19,100
Amount of food contact PP packaging which could be recycled to food grade if direct print and in-mould labelled packages are deemed to be suitable for food grade recycling, at 50% recycling rates.
62,500 10,000 72,500

UK market composition data of polypropylene packaging 2
Discussions with PP packaging converters suggest that removable in-mould labels could be introduced relatively easily once the technology is proven. This would improve the quality and may increase the quantity of rigid PP which could potentially be recycled to food grade. Replacing direct printed labels would require substantial investment in changes to current packaging equipment so cannot be recommended unless equipment changes are being considered. If recycling rates of rigid PP packaging were to be raised to the same level as the current recycling rate for bottles (circa 50%) then it is estimated that between 47,500 and 72,500 tonnes of food-use PP packaging material could be available for recycling into food grade material each year in the UK.
UK market composition data of polypropylene packaging 3
Contents
1 Introduction ................................................................................................. 6 1.1 Background to the project........................................................................... 6 1.2 Project aims .............................................................................................. 6 1.3 Methodology and approach ......................................................................... 6 1.4 Project scope ............................................................................................. 7
2 Assessment of UK PP packaging market size ............................................... 9 2.1 Estimating PP market size - Literature review ............................................... 9 2.2 Estimating PP market size - Stakeholder consultation exercise ..................... 11
3 Assessment of UK PP packaging composition ............................................ 13 3.1 Estimating PP packaging composition - Waste composition assessment ........ 13 3.2 Estimating PP packaging composition - Plastics converter estimates ............. 19
4 Summary of rigid PP packaging usage ....................................................... 23 5 Potential for recycled food grade PP .......................................................... 28
5.1 Requirements for food grade recycled PP ................................................... 28 5.2 Packaging design issues around food grade recycled PP .............................. 28 5.3 Composition of PP packaging .................................................................... 30 5.4 Thermoformed products ........................................................................... 31 5.5 Injection moulded products ....................................................................... 34 5.6 Blow moulded products ............................................................................ 36 5.7 Summary of label types used in rigid PP packaging ..................................... 36 5.8 Potential volume of feedstock for food grade recycled PP ............................ 38
6 Trends, opportunities and constraints ........................................................ 40 6.1 Opportunities to develop food grade PP recycling ........................................ 40 6.2 Competing outlets for recycled PP ............................................................. 40 6.3 Changes required in the supply chain to encourage food grade PP ............... 40 6.4 Constraints for brand owners, retailers and converters ................................ 41
7 Conclusions and recommendations ............................................................ 42
List of Tables
Table 1 Volume estimates of rigid PP packaging .............................................................. 1 Table 2 PP packaging market estimates from four European polymer producers compared with waste composition estimates obtained from the literature review .............................. 11 Table 3 PP separation results from hand sorting and estimate of total UK household PP volumes by category ..................................................................................................... 14 Table 4 Estimated split for thermoformed PP containers in the UK ................................... 19 Table 5 Comparison of rigid PP food contact market size estimates (t/yr) ......................... 20 Table 6 Estimated PP rigid food contact packaging volumes split by manufacturing method .................................................................................................................................. 21 Table 7 Typical pack constructions for thermoformed food trays ..................................... 33 Table 8 Summary of UK rigid PP packaging volumes and potential for food grade recycling .................................................................................................................................. 39

UK market composition data of polypropylene packaging 4
List of Figures
Figure 1 Split of plastic types in the household waste plastic stream (t/yr) ......................... 9 Figure 2 Hand sorting of household PP waste ................................................................ 13 Figure 3 PP rigid food contact packaging method t/yr ................................................... 15 Figure 4 PP rigid non-food packaging manufacturing method t/yr ................................. 16 Figure 5 Blow moulded food contact container split t/yr............................................... 16 Figure 6 Injection moulded food contact container split t/yr ......................................... 17 Figure 7 Thermoformed food contact container split t/yr ............................................. 18 Figure 8 Split of food contact rigid PP packaging by manufacturing method – from manufacturer estimates ................................................................................................ 22 Figure 9 Overall flows of household packaging within the UK supply chain ....................... 23 Figure 10 Breakdown of commercial rigid PP packaging used in the UK ........................... 24 Figure 11 Breakdown of household rigid PP packaging used in the UK ............................ 25 Figure 12 Breakdown of non-food contact household PP rigid packaging used in the UK ... 26 Figure 13 Breakdown of household and commercial food contact PP rigid packaging used in the UK ......................................................................................................................... 27 Figure 14 Label systems used for food contact rigid PP packaging t/yr ............................ 37 Figure 15 Label systems used for non-food contact rigid PP packaging ............................ 37
Glossary
Barrier layer A barrier consisting of one or more layers which either reduces the migration of authorised substances below their specific migration limit (SML) or reduces the migration of non-authorised substances into foods or food simulants to a not detectable level (Food Standards Agency).
Block copolymer A term to describe the type distribution of a second monomer within a copolymer, a block referring to sequential runs. A polypropylene block copolymer refers to a polypropylene homopolymer/copolymer of mixed ethylene composition where molecules of ethylene/propylene rubber coalesce during melt processing to form a toughening separate phase.
Blow moulding
Process of forming hollow, one piece articles (bottles, cans, jars) by expanding a piece of hot plastic (parison) against the internal surfaces of a heated two-piece mould, with compressed air.
Copolymer
A polymer formed from the polymerisation of two or more types of monomers.
EVOH barrier Ethylene Vinyl Alcohol barrier; a type of barrier layer used in food packaging.
Food contact Polymer or packaging which has been used in contact with food.
Food grade
Polymer or packaging that is originally manufactured under conditions which make it suitable for use in food contact applications.
HDPE High Density Polyethylene.
UK market composition data of polypropylene packaging 5
High Impact Polymer Polymers suitable for high impact applications for example power tool casings.
High Temperature Polymer
Polymers suitable for high temperature applications for example microwave meal trays.
Homopolymer
A polymer formed from the chemical process of polymerisation using one type of precursor molecule, known as monomer.
Injection moulding
Plastic melt processing technique; plastic granules are converted into a viscous melt by heat and shear prior to injection into a metal tool under, typically, high pressure. Cooling of the tool permits ejection of the cooled, now rigid, moulded article.
Low Impact Polymer Polymers suitable for low impact applications for example food trays and other packaging.
Low Temperature Polymer
Polymers suitable for low temperature applications for example ice cream tubs.
Melt Flow Rate A rheological test method providing an approximate measure of molecular weight and so providing an assessment of ease of flow within subsequent melt processing equipment.
Multi-layer packaging An item of packaging that consists of more than one layer, additional layers may be plastic barrier layers of the same or different polymer or another material such as aluminium foil.
PE Polyethylene
PET Polyethylene Terephthalate
PP Polypropylene
rPP Recycled polypropylene
Thermoform Forming of thermoplastic sheet by heating it and then pulling it down onto a mould surface to shape.
Acknowledgements
Axion Consulting, AMEC and WRAP would like to thank the following for their involvement in this project: Anson Packaging Lyondell Basell Robinsons Biffa Polymers Marks and Spencer RPC Closed Loop London Morrisons Sabic Ecoplastics Plastics Europe Sharp Interpack Ineos Pregis Total Jayplas (J&A Young) Regain Viridor Linpac RECOUP
UK market composition data of polypropylene packaging 6
1 Introduction 1.1 Background to the project Following previous work to scope and develop a process to decontaminate post-consumer polypropylene (PP) packaging waste, WRAP commissioned this project to gather further information on the volumes and composition of PP packaging in the UK market. PP is the third most common polymer in the household waste stream after PET (polyethylene terephthalate) and HDPE (high density polyethylene). Viable processes for the recovery of food grade recycled PET and HDPE polymers already exist, such as the closed loop recycling of HDPE milk bottles. However, a growing desire for food grade recycled PP (rPP) for use in food packaging has been observed particularly from the retail sector. Currently there is no commercial scale recycling of PP back into food contact applications. Recycled HDPE is used in the cases where recycled content is added to food contact PP. WRAP intends to use the findings of this project to further understand the quantity and types of PP packaging currently used in the UK market and to inform future work on optimising the recyclability of PP packaging. 1.2 Project aims The specific aims of the project were:
Calculate the total amount (tonnes) of PP packaging entering the UK market per year;
Calculate the percentage of PP packaging in the UK that is used for food contact
applications and what percentage is used for non-food contact applications;
Provide an estimation of PP packaging with scope to be recycled into food grade rPP;
Develop a breakdown of the composition of PP packaging to include:
Type of PP polymer (for example copolymer, homopolymer);
Melt flow and other physical properties of the polymer;
Pack formats - tubs, pots, trays and bottles;
Percentage of packs with and without labels;
Breakdown of label types - wrap around, shrink, in-mould labels;
Decoration techniques - direct or surface printing;
Colour/pigmentation versus clear/natural;
Barrier layers, coatings, membranes;
Application of the packaging - high temperature, low temperature, aqueous or fatty foods;
Source of packaging - household, fast food/leisure, production/commercial and industrial (C&I) waste; and
Key brands.
Identify key trends, opportunities and constraints for PP recycling in the UK.
1.3 Methodology and approach Axion Consulting worked with AMEC to deliver this work. A combination of stakeholder engagement, desk based research and practical research approaches were used to obtain information regarding the PP packaging market within the UK. Desk based research was conducted to identify existing research on PP packaging and any data on the size of the market from industry journals, published reports and credible internet
UK market composition data of polypropylene packaging 7
sources. This also included reviewing previous work carried out for WRAP on recycling of PP packaging. A series of discussions were held with stakeholders from across the PP packaging supply chain to obtain their estimates of the size of the PP packaging market, to understand the construction of typical PP packaging products used in the UK and to identify future trends, opportunities and constraints for PP recycling in the UK. Notes from the discussions were recorded and verified with participants. The stakeholders included representatives of local authorities, four polymer producers, three polymer packaging convertors, and several recyclers and retailers in the UK and Europe. While some participants were not able to comment on all areas of the research, contact with a range of stakeholders across the supply chain helped to ensure that a broad overview of the PP packaging market was obtained. The stakeholder engagement process provided a considerable amount of useful information, however, we identified notable gaps in the PP packaging market information and composition estimates. Although many of the converters consulted were very familiar with their own sub-sectors, some were unable to provide sufficient estimates of market volumes or material composition because their sub-sector was either too diverse or the information was considered to be commercially sensitive. In order to address concerns regarding the data gaps, it was agreed that a waste composition analysis would be conducted for baled post-consumer PP packaging from the UK household waste stream, which was sourced from a UK recycler. This additional work was delivered in January 2012 and is presented in section 3. 1.4 Project scope Within the scope of this project, food contact PP packaging is defined as packaging that has been in previous contact with food. Examples of packaging types would be meat trays, fruit punnets and ice cream tubs. Examples of non-food contact PP packaging include containers for cosmetics or detergents. Significant volumes of PP are used in food contact film packaging in the UK. However, collection and recycling of household plastic films is still very much in its infancy. At present, household waste plastic PP films collected in the UK are typically mixed with other polymer film types, such as LDPE and PET, and up to 40% paper and other contaminants1; isolating a food contact PP film fraction from the household waste stream presents a significant challenge. In addition, many of the food contact PP films currently used in the UK are highly decorated with metallisation and/or print and may also be laminated in multi-layer structures. These complex packaging constructions are unlikely to be suitable for food grade recycling. For these reasons detailed consideration of the market for and potential recyclability of PP films is excluded from the scope of the project. PP packaging is used in the fast food and leisure sector, mostly for thermoformed trays and sandwich cartons, but also for blow moulded jars and bottles. Although it is very difficult to quantify usage, it is believed that the total volumes used in this sector are small relative to other sectors and that most of the volume used in this sector will be included in the figures reported for household or commercial usage. For these reasons the research did not actively target the fast food and leisure sectors.
1 Axion compositional analysis for another WRAP project – not published

UK market composition data of polypropylene packaging 8
Non-packaging uses of PP are outside the scope of the research. Substantial quantities of PP are also used in non-packaging applications such as automotive and construction and in packaging for non-food industrial products such as paint and adhesives. Packaging for non-food industrial applications was largely excluded from the research due to the difficulty in quantifying material arisings, the challenges associated with the segregation and collection of this material and the limited potential for producing food grade recycled PP.
UK market composition data of polypropylene packaging 9
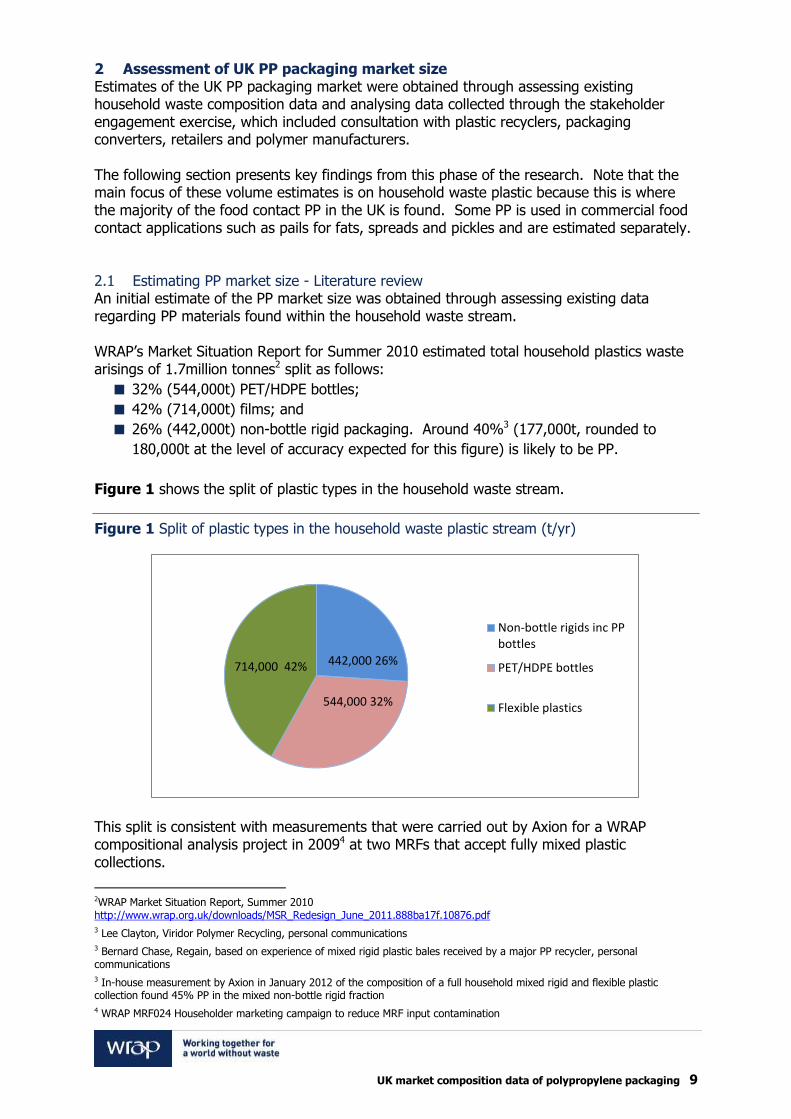
2 Assessment of UK PP packaging market size Estimates of the UK PP packaging market were obtained through assessing existing household waste composition data and analysing data collected through the stakeholder engagement exercise, which included consultation with plastic recyclers, packaging converters, retailers and polymer manufacturers. The following section presents key findings from this phase of the research. Note that the main focus of these volume estimates is on household waste plastic because this is where the majority of the food contact PP in the UK is found. Some PP is used in commercial food contact applications such as pails for fats, spreads and pickles and are estimated separately. 2.1 Estimating PP market size - Literature review An initial estimate of the PP market size was obtained through assessing existing data regarding PP materials found within the household waste stream. WRAP’s Market Situation Report for Summer 2010 estimated total household plastics waste arisings of 1.7million tonnes2 split as follows:
32% (544,000t) PET/HDPE bottles;
42% (714,000t) films; and
26% (442,000t) non-bottle rigid packaging. Around 40%3 (177,000t, rounded to
180,000t at the level of accuracy expected for this figure) is likely to be PP.
Figure 1 shows the split of plastic types in the household waste stream.
Figure 1 Split of plastic types in the household waste plastic stream (t/yr)
This split is consistent with measurements that were carried out by Axion for a WRAP compositional analysis project in 20094 at two MRFs that accept fully mixed plastic collections.
2WRAP Market Situation Report, Summer 2010 http://www.wrap.org.uk/downloads/MSR_Redesign_June_2011.888ba17f.10876.pdf
3 Lee Clayton, Viridor Polymer Recycling, personal communications
3 Bernard Chase, Regain, based on experience of mixed rigid plastic bales received by a major PP recycler, personal communications
3 In-house measurement by Axion in January 2012 of the composition of a full household mixed rigid and flexible plastic collection found 45% PP in the mixed non-bottle rigid fraction 4 WRAP MRF024 Householder marketing campaign to reduce MRF input contamination
442,000 26%
544,000 32%
714,000 42%
Non-bottle rigids inc PPbottles
PET/HDPE bottles
Flexible plastics
UK market composition data of polypropylene packaging 10
Analysis was conducted in order to estimate the proportion of PP waste arising that is currently captured through existing recycling collection schemes. In 2010, RECOUP conducted a survey which aimed to quantify the amount of household plastic packaging collected from bring sites and kerbside collections in the UK. An estimated 357,000t/yr of household plastic waste was collected, comprising5:
281,000t bottle-only collections:
The recyclers estimate that their deliveries from bottle-only collections contain on average 20% non-bottle plastics, mostly rigid packaging6;
About 40% of non-bottle rigids is estimated to be PP7,8,9 so total PP in bottle-only collections = 281,000 x 20% x 40% = 23,000t/yr; and
76,000t of non-bottle material in all-plastic collections, including films.
There are relatively few PP bottles in the household waste stream. Squeezable, blow-moulded sauce bottles and blow moulded bottles for cleaning products are the most significant PP bottle streams10. RECOUP only estimate the split of materials for the bottle element of these collections, and do not measure the split of materials in the non-bottle element of the collections. However, from Axion’s practical measurements of fully mixed plastic collections and WRAP’s own estimate of total plastic packaging waste arisings, it would be prudent to assume that the non-bottle fraction of these all-plastic collections comprises approximately:
38,000t films11; and
38,000t non-bottle rigids: about 40% of non-bottle rigids is estimated to be PP so total
PP in non-bottle collections = 38,000 x 40% = approximately 15,000t/yr.
From the RECOUP survey data and the above estimates it would therefore be reasonable to assume that total rigid PP in the 357,000t/yr household plastic stream currently collected in the UK and either exported or processed at UK plastic recovery facilities (PRFs) is around 23,000 (in bottle-only collections) + 15,000 (in all-plastic collections) = 38,000t/yr = 10.6% of the collected household waste plastic stream. This is consistent with the observations from operators of large scale plastic recycling facilities (PRFs) in the UK who currently see about 7-8% PP in their feed mix but expect the percentage of PP in their rigid plastic feed to grow to around 15% in the next few years as non-bottle rigid collections increase12. Key findings from the literature review include:
Within the UK, approximately 1.7million tonnes of household plastic waste arises each
year; and
Approximately 180,000t of this material is likely to be rigid PP packaging.
5 UK Household Plastics Packaging Collection Survey 2010, download from RECOUP website, www.recoup.org
6 Lee Clayton, Viridor Polymer Recycling, personal communications
7 Lee Clayton, Viridor Polymer Recycling, personal communications
8 Bernard Chase, Regain, based on experience of mixed rigid plastic bales received by a major PP recycler, personal communications
9 In-house measurement by Axion in January 2012 of the composition of a full household mixed rigid and flexible plastic collection found 45% PP in the mixed non-bottle rigid fraction 10 Jonathan Short, AWS Ecoplastics, personal coms 11 Based on previous Axion hand sorting measurements for WRAP mixed plastics project 2009 12 Jonathan Short, AWS Ecoplastics, personal coms
UK market composition data of polypropylene packaging 11
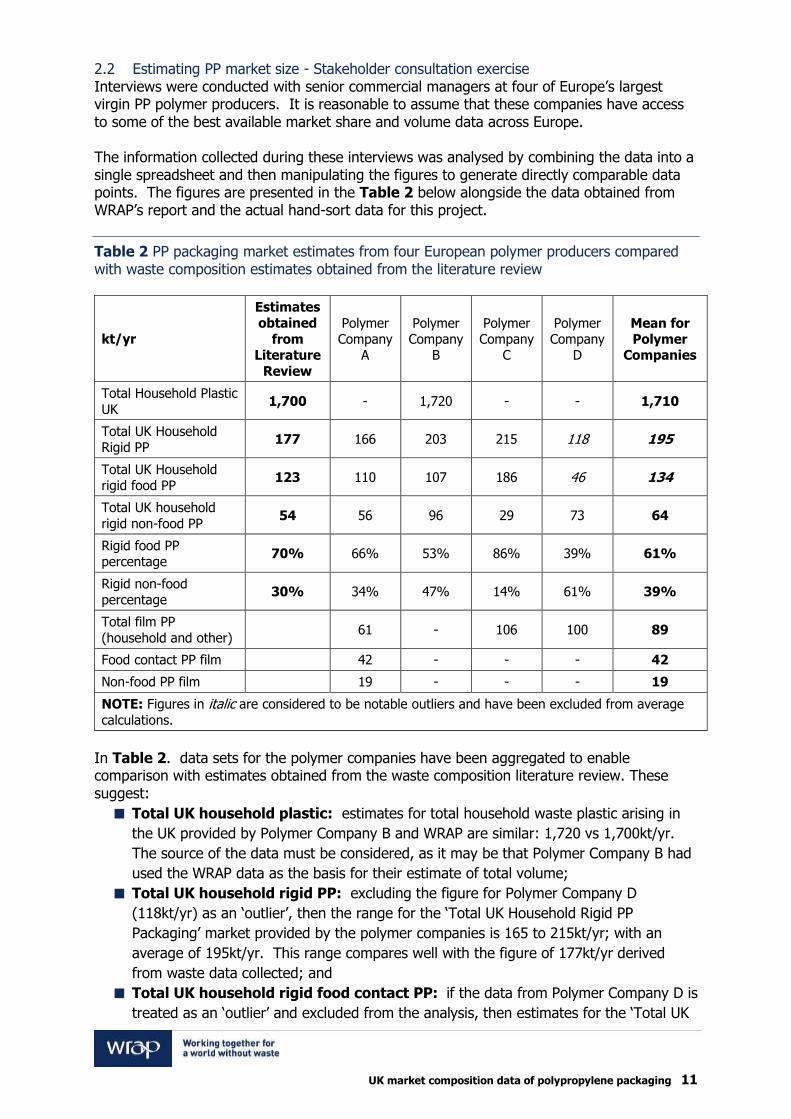
2.2 Estimating PP market size - Stakeholder consultation exercise Interviews were conducted with senior commercial managers at four of Europe’s largest virgin PP polymer producers. It is reasonable to assume that these companies have access to some of the best available market share and volume data across Europe. The information collected during these interviews was analysed by combining the data into a single spreadsheet and then manipulating the figures to generate directly comparable data points. The figures are presented in the Table 2 below alongside the data obtained from WRAP’s report and the actual hand-sort data for this project.
Table 2 PP packaging market estimates from four European polymer producers compared with waste composition estimates obtained from the literature review
kt/yr
Estimates obtained
from Literature
Review
Polymer Company
A
Polymer Company
B
Polymer Company
C
Polymer Company
D
Mean for Polymer
Companies
Total Household Plastic
UK 1,700 - 1,720 - - 1,710
Total UK Household Rigid PP
177 166 203 215 118 195
Total UK Household rigid food PP
123 110 107 186 46 134
Total UK household
rigid non-food PP 54 56 96 29 73 64
Rigid food PP percentage
70% 66% 53% 86% 39% 61%
Rigid non-food percentage
30% 34% 47% 14% 61% 39%
Total film PP
(household and other) 61 - 106 100 89
Food contact PP film
42 - - - 42
Non-food PP film
19 - - - 19
NOTE: Figures in italic are considered to be notable outliers and have been excluded from average
calculations.
In Table 2. data sets for the polymer companies have been aggregated to enable comparison with estimates obtained from the waste composition literature review. These suggest:
Total UK household plastic: estimates for total household waste plastic arising in
the UK provided by Polymer Company B and WRAP are similar: 1,720 vs 1,700kt/yr.
The source of the data must be considered, as it may be that Polymer Company B had
used the WRAP data as the basis for their estimate of total volume;
Total UK household rigid PP: excluding the figure for Polymer Company D
(118kt/yr) as an ‘outlier’, then the range for the ‘Total UK Household Rigid PP
Packaging’ market provided by the polymer companies is 165 to 215kt/yr; with an
average of 195kt/yr. This range compares well with the figure of 177kt/yr derived
from waste data collected; and
Total UK household rigid food contact PP: if the data from Polymer Company D is
treated as an ‘outlier’ and excluded from the analysis, then estimates for the ‘Total UK
UK market composition data of polypropylene packaging 12
household rigid food contact PP packaging’ quantities are estimated to be 110 to
186kt/yr, with an average of 134kt/yr. This compares well with the estimate from
waste stream composition of 123kt/yr.
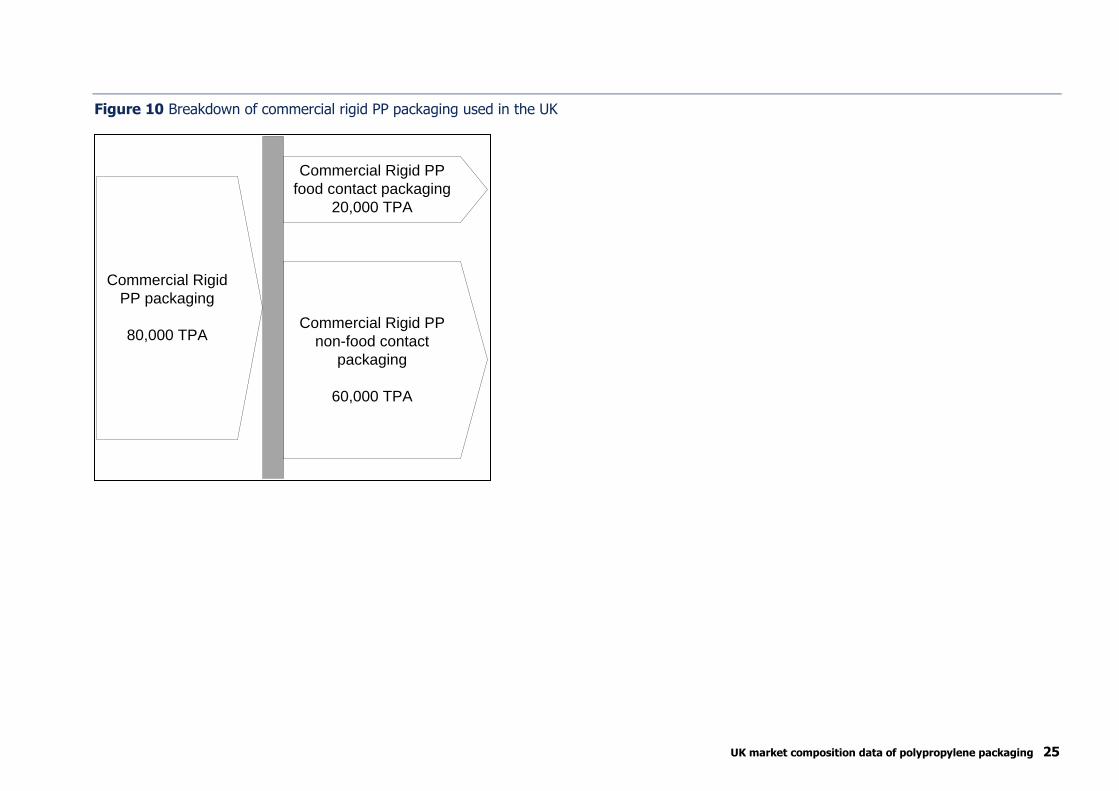
Estimates from the polymer manufacturers indicate that total PP placed on the market for rigid household packaging applications is in the range 170-215,000t/yr. Consultations with polymer manufacturers and converters indicate that the total volume of rigid PP food contact packaging likely to enter the household waste stream is in the range 100-160,000t/yr, over half of the rigid PP household packaging waste stream. This compares well with the waste analysis which indicates that about 70% (123,000t/yr) of the household PP rigid stream is food contact. Notes on flexible PP packaging This study does not focus on flexible PP packaging because high grade film recycling is still very much in its infancy. At some stage in future it may be possible to segregate food contact PP film for food grade recycling, although this is likely to present major technical challenges. However, it is worth noting that data collected from the polymer manufacturers for this project indicates that total flexible PP likely to end up in the household waste stream is in the range 60,000-100,000t/yr. Data provided by one of the polymer companies indicates that the flexible PP stream splits roughly two thirds food contact and one third non-food contact. Commercial & Industrial PP packaging The figures above relate to household packaging only. Substantial quantities of PP packaging are also used in the commercial and industrial sectors. This packaging is used for catering containers and for industrial and construction products such as paints and adhesives. Catering uses for PP packaging are primarily tubs and pails for fats and spreads and blow-moulded jars for pickles and sauces. It is difficult to estimate this volume accurately but from a 2005 report by RECOUP13 and consultations for this project with manufacturers the volume of food contact catering containers placed on the market in the UK is thought to be about 20,000t/yr. This is likely to split into about 15,000t/yr injection moulded tubs and pails and about 5,000t/yr blow moulded jars and bottles. Non-food contact rigid PP packaging used in the commercial and industrial sector includes paint and adhesive pails, plant pots and transit packaging. It is difficult to estimate these volumes but discussions with the polymer manufacturers indicate that they are likely to add up to around a further 60,000t/yr of rigid PP packaging, the great majority injection moulded. There is also potential to produce food grade recycled PP from injection moulded pails used in the catering sector. A report by RECOUP in 2005 estimated the total volume of injection moulded pails used in the UK to be about 30,000t/yr, of which about 20,000t/yr are used in catering. This estimate was confirmed as still valid in a confidential industry consultation in February 2012.
13 ‘The recycling of Polypropylene containers’, RECOUP, 2005
UK market composition data of polypropylene packaging 13
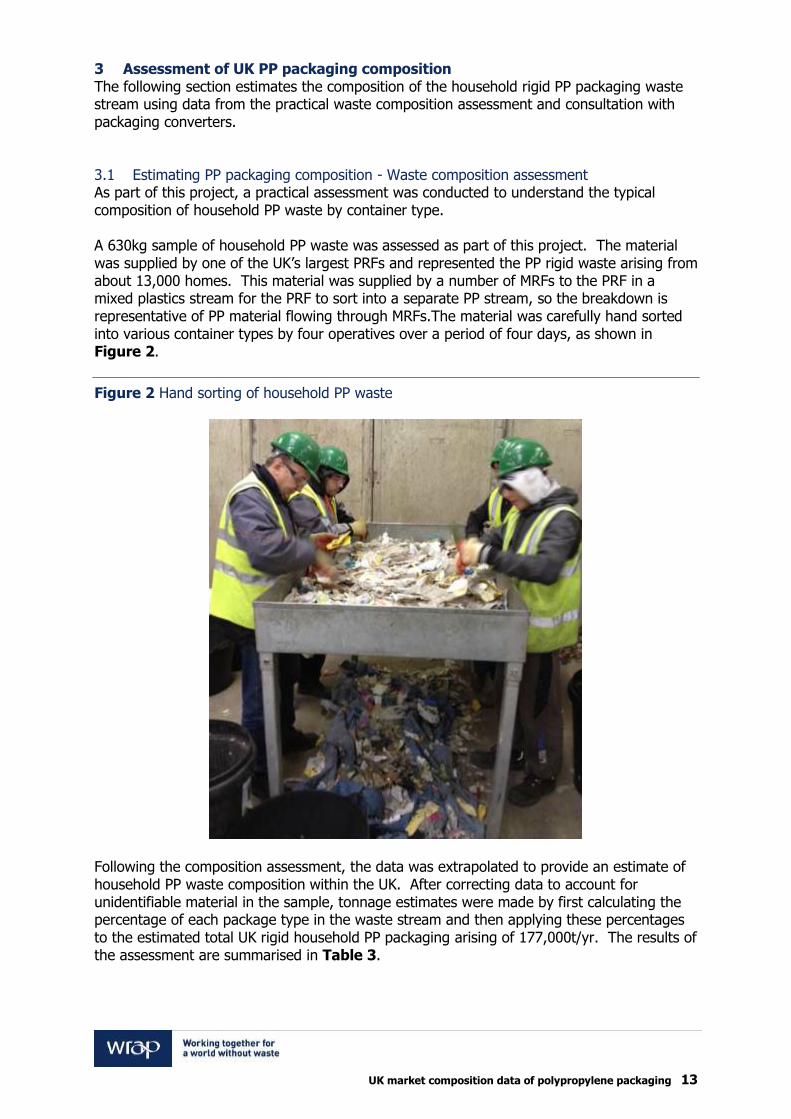
3 Assessment of UK PP packaging composition The following section estimates the composition of the household rigid PP packaging waste stream using data from the practical waste composition assessment and consultation with packaging converters. 3.1 Estimating PP packaging composition - Waste composition assessment As part of this project, a practical assessment was conducted to understand the typical composition of household PP waste by container type. A 630kg sample of household PP waste was assessed as part of this project. The material was supplied by one of the UK’s largest PRFs and represented the PP rigid waste arising from about 13,000 homes. This material was supplied by a number of MRFs to the PRF in a mixed plastics stream for the PRF to sort into a separate PP stream, so the breakdown is representative of PP material flowing through MRFs.The material was carefully hand sorted into various container types by four operatives over a period of four days, as shown in Figure 2.
Figure 2 Hand sorting of household PP waste
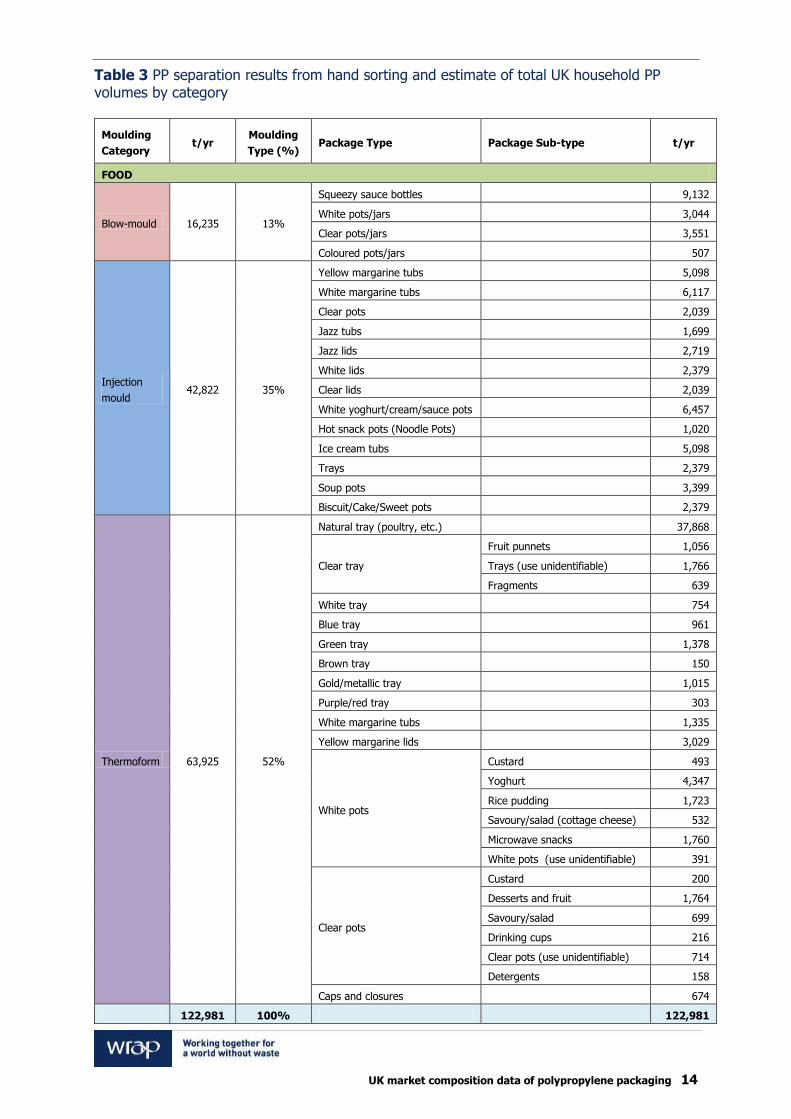
Following the composition assessment, the data was extrapolated to provide an estimate of household PP waste composition within the UK. After correcting data to account for unidentifiable material in the sample, tonnage estimates were made by first calculating the percentage of each package type in the waste stream and then applying these percentages to the estimated total UK rigid household PP packaging arising of 177,000t/yr. The results of the assessment are summarised in Table 3.
UK market composition data of polypropylene packaging 14
Table 3 PP separation results from hand sorting and estimate of total UK household PP volumes by category
Moulding
Category t/yr
Moulding
Type (%) Package Type Package Sub-type t/yr
FOOD
Blow-mould 16,235 13%
Squeezy sauce bottles
9,132
White pots/jars
3,044
Clear pots/jars
3,551
Coloured pots/jars
507
Injection
mould 42,822 35%
Yellow margarine tubs
5,098
White margarine tubs
6,117
Clear pots
2,039
Jazz tubs
1,699
Jazz lids
2,719
White lids
2,379
Clear lids
2,039
White yoghurt/cream/sauce pots
6,457
Hot snack pots (Noodle Pots)
1,020
Ice cream tubs
5,098
Trays
2,379
Soup pots
3,399
Biscuit/Cake/Sweet pots
2,379
Thermoform 63,925 52%
Natural tray (poultry, etc.)
37,868
Clear tray
Fruit punnets 1,056
Trays (use unidentifiable) 1,766
Fragments 639
White tray
754
Blue tray
961
Green tray
1,378
Brown tray
150
Gold/metallic tray
1,015
Purple/red tray
303
White margarine tubs
1,335
Yellow margarine lids
3,029
White pots
Custard 493
Yoghurt 4,347
Rice pudding 1,723
Savoury/salad (cottage cheese) 532
Microwave snacks 1,760
White pots (use unidentifiable) 391
Clear pots
Custard 200
Desserts and fruit 1,764
Savoury/salad 699
Drinking cups 216
Clear pots (use unidentifiable) 714
Detergents 158
Caps and closures
674
122,981 100% 122,981
UK market composition data of polypropylene packaging 15
Moulding Category t/yr Moulding Type (%) Package Type t/yr
NON-FOOD
Blow-mould 43,513 81%
Personal hygiene 14,845
Laundry detergent 15,869
Household cleaning 12,798
Injection mould 1,017 2% Containers 482
Caps and closures 535
Thermoform 9,289 17%
Flat packaging 4,466
Caps and closures 3,975
Detergents 849
53,819 100% 53,819
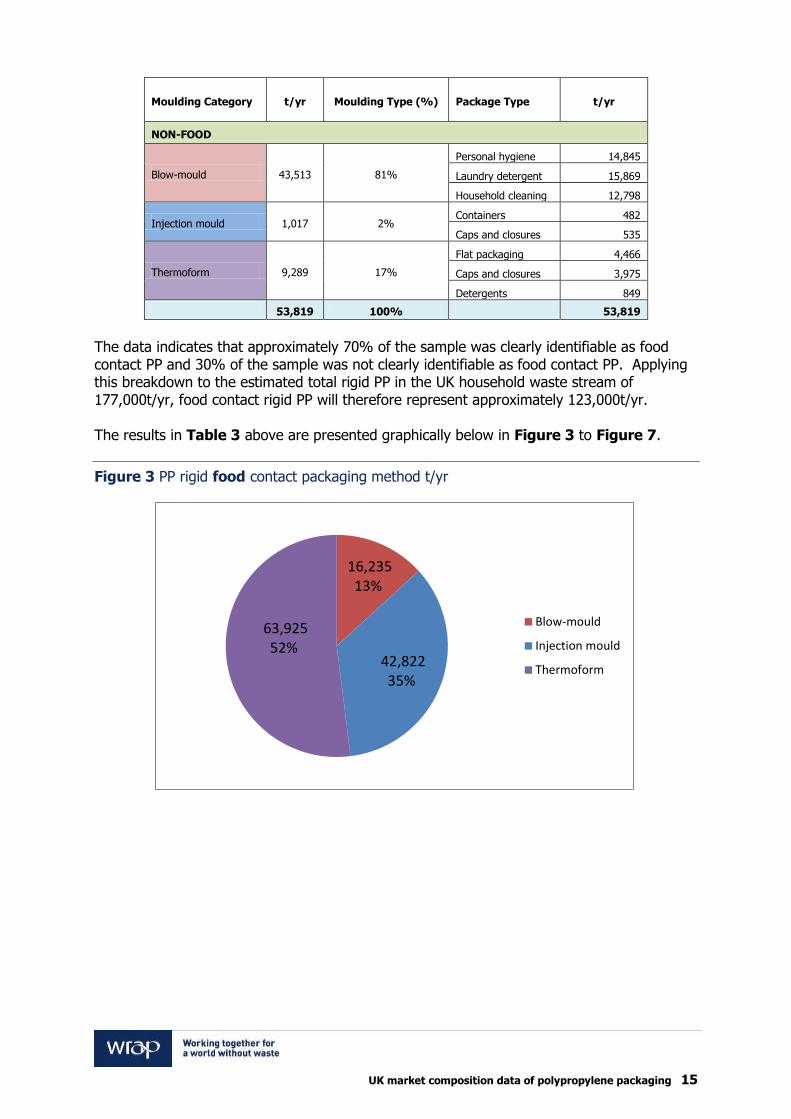
The data indicates that approximately 70% of the sample was clearly identifiable as food contact PP and 30% of the sample was not clearly identifiable as food contact PP. Applying this breakdown to the estimated total rigid PP in the UK household waste stream of 177,000t/yr, food contact rigid PP will therefore represent approximately 123,000t/yr. The results in Table 3 above are presented graphically below in Figure 3 to Figure 7.
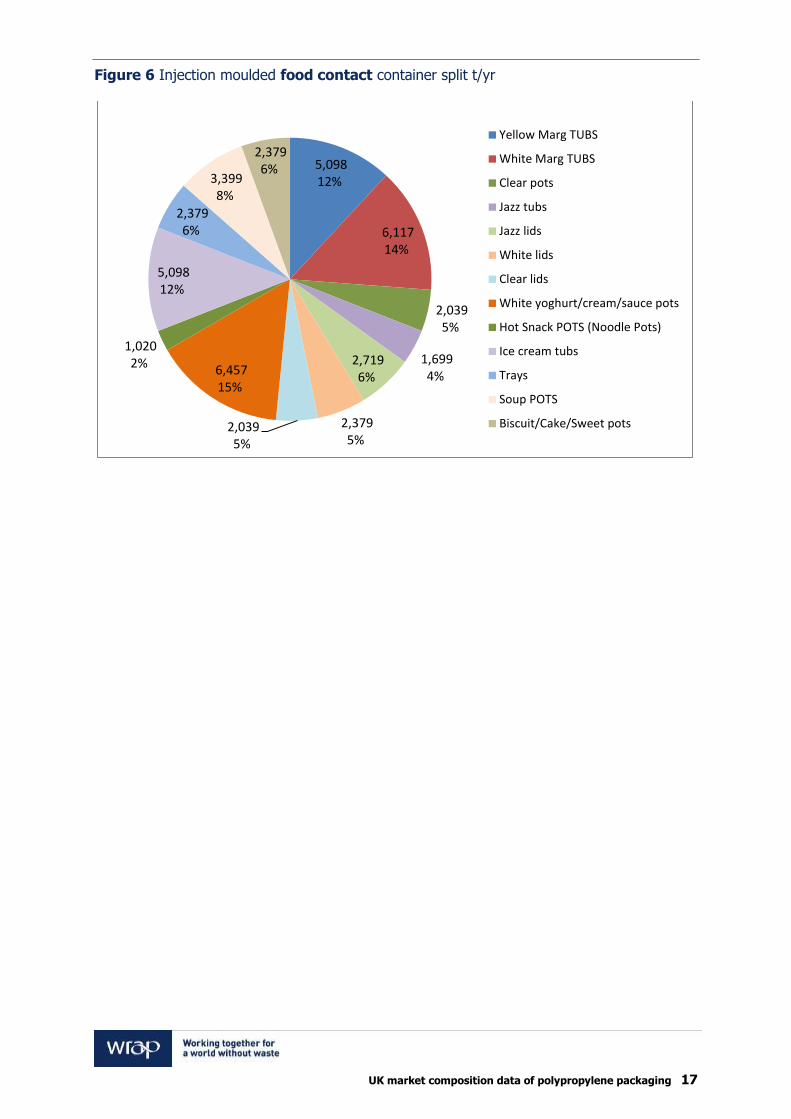
Figure 3 PP rigid food contact packaging method t/yr
16,235 13%
42,822 35%
63,925 52%
Blow-mould
Injection mould
Thermoform
UK market composition data of polypropylene packaging 16
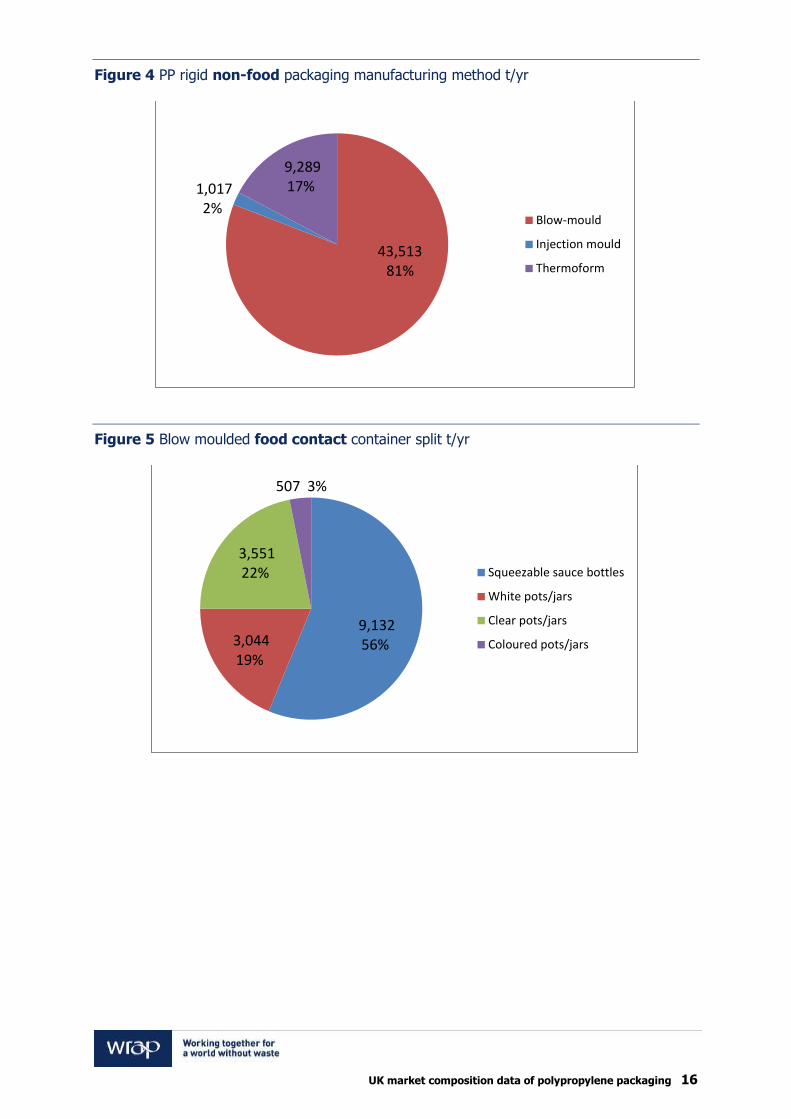
Figure 4 PP rigid non-food packaging manufacturing method t/yr
Figure 5 Blow moulded food contact container split t/yr
43,513 81%
1,017 2%
9,289 17%
Blow-mould
Injection mould
Thermoform
9,132 56% 3,044
19%
3,551 22%
507 3%
Squeezable sauce bottles
White pots/jars
Clear pots/jars
Coloured pots/jars
UK market composition data of polypropylene packaging 17
Figure 6 Injection moulded food contact container split t/yr
5,098 12%
6,117 14%
2,039 5%
1,699 4%
2,719 6%
2,379 5%
2,039 5%
6,457 15%
1,020 2%
5,098 12%
2,379 6%
3,399 8%
2,379 6%
Yellow Marg TUBS
White Marg TUBS
Clear pots
Jazz tubs
Jazz lids
White lids
Clear lids
White yoghurt/cream/sauce pots
Hot Snack POTS (Noodle Pots)
Ice cream tubs
Trays
Soup POTS
Biscuit/Cake/Sweet pots
UK market composition data of polypropylene packaging 18
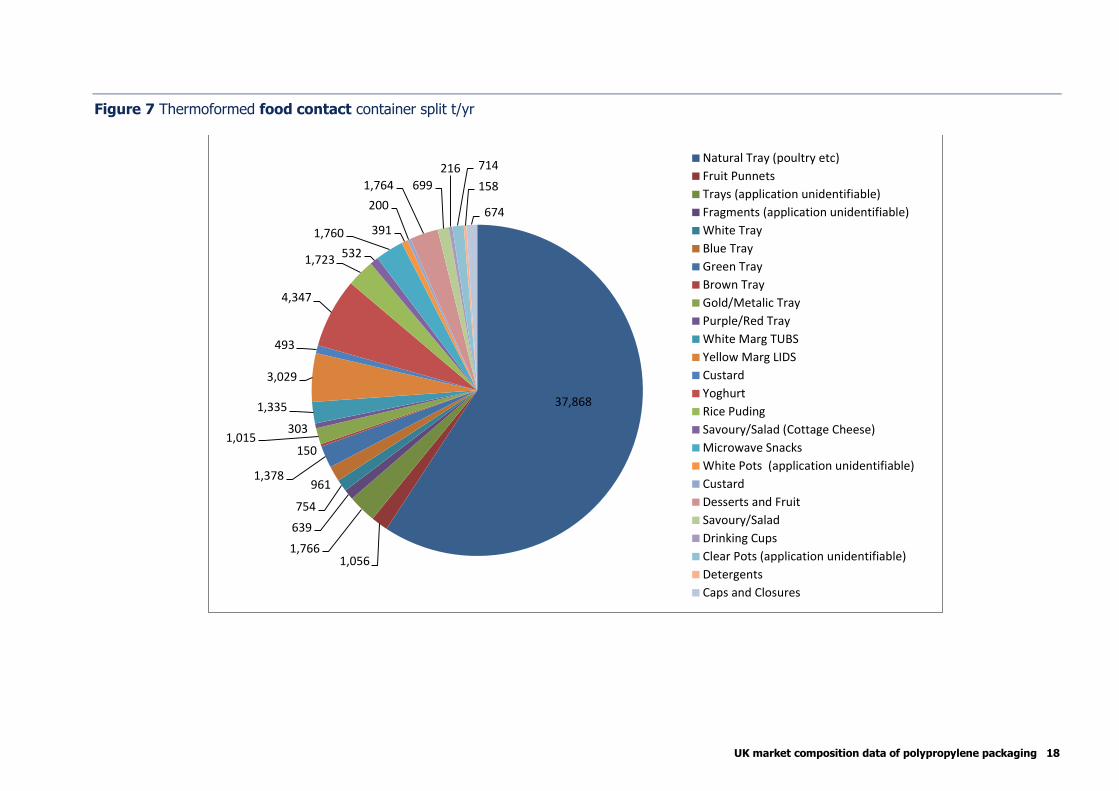
Figure 7 Thermoformed food contact container split t/yr
37,868
1,056 1,766
639
754
961 1,378
150 1,015
303
1,335
3,029
493
4,347
1,723 532
1,760 391
200
1,764 699
216 714
158
674
Natural Tray (poultry etc)
Fruit Punnets
Trays (application unidentifiable)
Fragments (application unidentifiable)
White Tray
Blue Tray
Green Tray
Brown Tray
Gold/Metalic Tray
Purple/Red Tray
White Marg TUBS
Yellow Marg LIDS
Custard
Yoghurt
Rice Puding
Savoury/Salad (Cottage Cheese)
Microwave Snacks
White Pots (application unidentifiable)
Custard
Desserts and Fruit
Savoury/Salad
Drinking Cups
Clear Pots (application unidentifiable)
Detergents
Caps and Closures
UK market composition data of polypropylene packaging 19
3.2 Estimating PP packaging composition - Plastics converter estimates As part of this project, telephone and face to face interviews were conducted with PP polymer converters. Most of these operate in niche markets and were unable to estimate total volumes for their market segments; however some were large enough to be able to estimate the total volumes of PP packaging in their segments. The total market volume estimates provided by three major plastics converters are summarised in this section. In addition to estimating market size, the converters also provided a great deal of useful data on typical polymer types, pack constructions and label systems used in PP packaging, summarised below. Plastics converter 1 Plastics converter 1 is a major thermoformer of food contact trays for vegetables, meat and poultry, sandwiches and ready meals in the UK. The company estimated that total thermoforms converted in UK = 200,000-250,000t. Approximately 35% (80,000t) of this is PP, comprising approximately 20,000t PP trays and 60,000t PP dairy and margarine pots and tubs. Plastics converter 2 Plastics converter 2 is a leading injection moulder for dairy and spread tubs. It also produces injection moulded tubs and pails for food and non-food applications, thermoformed lids and tubs for dairy products and blow-moulded bottles and jars for household and commercial uses.
Spread market only: plastics converter 2 estimated the total quantity of PP in the
UK spreads market to be around 15,000t, comprising approximately 60% (9,000t)
injection moulded margarine tubs and 40% (6,000t) thermoformed margarine lids and
thermoformed spread tubs; and
Total dairy and spreads market: plastics converter 2 estimated that 4.2 billion
pots/year are used in the UK dairy and spreads market, based on market data for the
whole of the EU of 35 billion items/year and a UK share of 12% of the EU.
Plastics converter 3
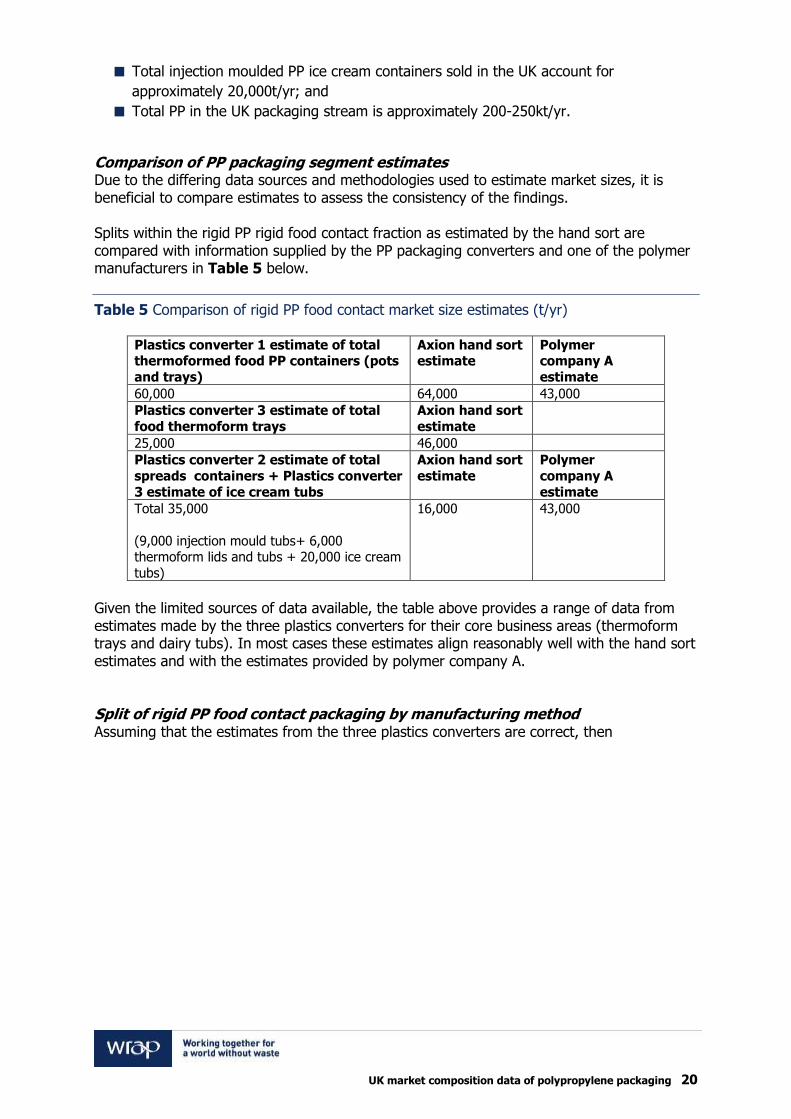
Plastics converter 3 is one of the UK’s largest thermoformer of food contact trays for vegetables, meat and poultry. Plastics converter 3 was able to confidently provide data for food contact thermoformed PP containers in the UK, outlined in Table 4.
Table 4 Estimated split for thermoformed PP containers in the UK
Application (food contact thermoforming) ‘000t/yr
Mushroom trays 8
Other vegetable trays 8
Meat, fish and poultry trays 25
Ready meal trays 15
Takeaway trays 3
Total 59
Plastics converter 3 also provided the following estimates based on general industry knowledge rather than its own manufacturing operations:
UK market composition data of polypropylene packaging 20
Total injection moulded PP ice cream containers sold in the UK account for
approximately 20,000t/yr; and
Total PP in the UK packaging stream is approximately 200-250kt/yr.
Comparison of PP packaging segment estimates Due to the differing data sources and methodologies used to estimate market sizes, it is beneficial to compare estimates to assess the consistency of the findings. Splits within the rigid PP rigid food contact fraction as estimated by the hand sort are compared with information supplied by the PP packaging converters and one of the polymer manufacturers in Table 5 below.
Table 5 Comparison of rigid PP food contact market size estimates (t/yr)
Plastics converter 1 estimate of total thermoformed food PP containers (pots
and trays)
Axion hand sort estimate
Polymer company A
estimate
60,000 64,000 43,000
Plastics converter 3 estimate of total
food thermoform trays
Axion hand sort
estimate
25,000 46,000
Plastics converter 2 estimate of total
spreads containers + Plastics converter
3 estimate of ice cream tubs
Axion hand sort
estimate
Polymer
company A
estimate
Total 35,000
(9,000 injection mould tubs+ 6,000 thermoform lids and tubs + 20,000 ice cream
tubs)
16,000 43,000
Given the limited sources of data available, the table above provides a range of data from estimates made by the three plastics converters for their core business areas (thermoform trays and dairy tubs). In most cases these estimates align reasonably well with the hand sort estimates and with the estimates provided by polymer company A. Split of rigid PP food contact packaging by manufacturing method Assuming that the estimates from the three plastics converters are correct, then
UK market composition data of polypropylene packaging 21
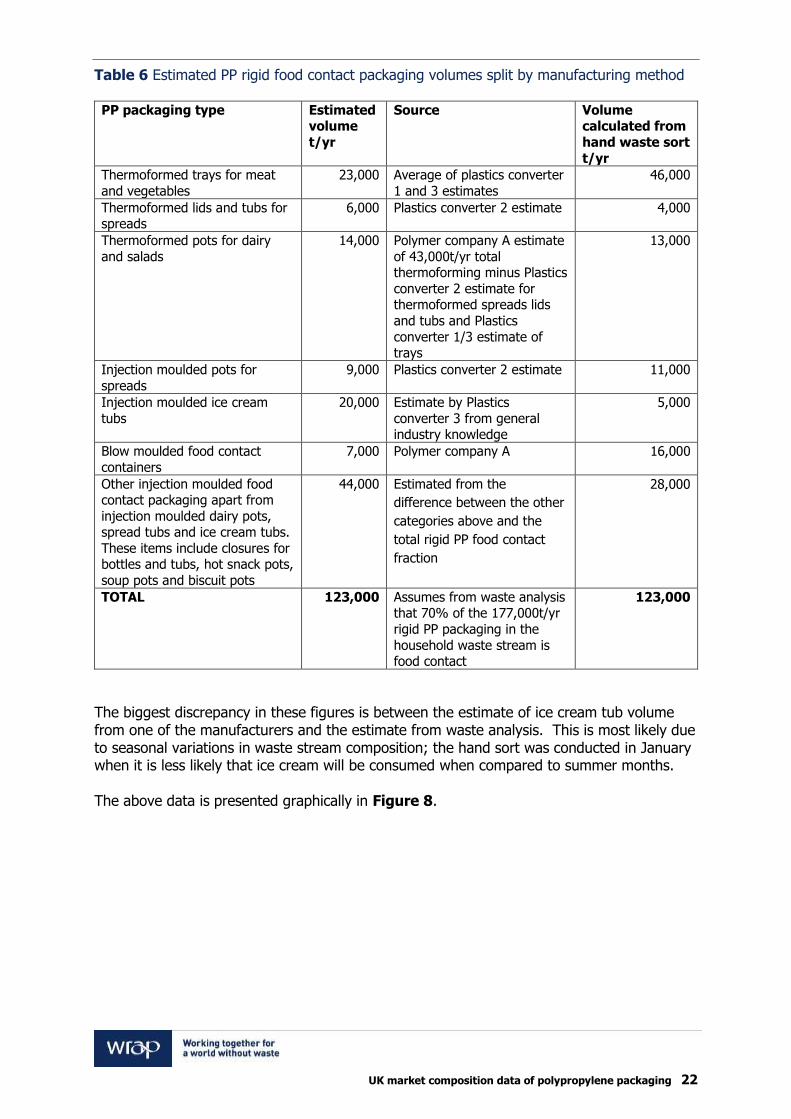
Table 6 estimates the following volumes for PP food contact packaging, split by manufacturing method.
UK market composition data of polypropylene packaging 22
Table 6 Estimated PP rigid food contact packaging volumes split by manufacturing method PP packaging type Estimated
volume
t/yr
Source Volume calculated from
hand waste sort
t/yr
Thermoformed trays for meat
and vegetables
23,000 Average of plastics converter
1 and 3 estimates
46,000
Thermoformed lids and tubs for spreads
6,000 Plastics converter 2 estimate 4,000
Thermoformed pots for dairy
and salads
14,000 Polymer company A estimate
of 43,000t/yr total thermoforming minus Plastics
converter 2 estimate for thermoformed spreads lids
and tubs and Plastics
converter 1/3 estimate of trays
13,000
Injection moulded pots for
spreads
9,000 Plastics converter 2 estimate 11,000
Injection moulded ice cream
tubs
20,000 Estimate by Plastics
converter 3 from general industry knowledge
5,000
Blow moulded food contact
containers
7,000 Polymer company A 16,000
Other injection moulded food contact packaging apart from
injection moulded dairy pots, spread tubs and ice cream tubs.
These items include closures for bottles and tubs, hot snack pots,
soup pots and biscuit pots
44,000 Estimated from the
difference between the other
categories above and the
total rigid PP food contact
fraction
28,000
TOTAL 123,000 Assumes from waste analysis that 70% of the 177,000t/yr
rigid PP packaging in the
household waste stream is food contact
123,000
The biggest discrepancy in these figures is between the estimate of ice cream tub volume from one of the manufacturers and the estimate from waste analysis. This is most likely due to seasonal variations in waste stream composition; the hand sort was conducted in January when it is less likely that ice cream will be consumed when compared to summer months. The above data is presented graphically in Figure 8.
UK market composition data of polypropylene packaging 23
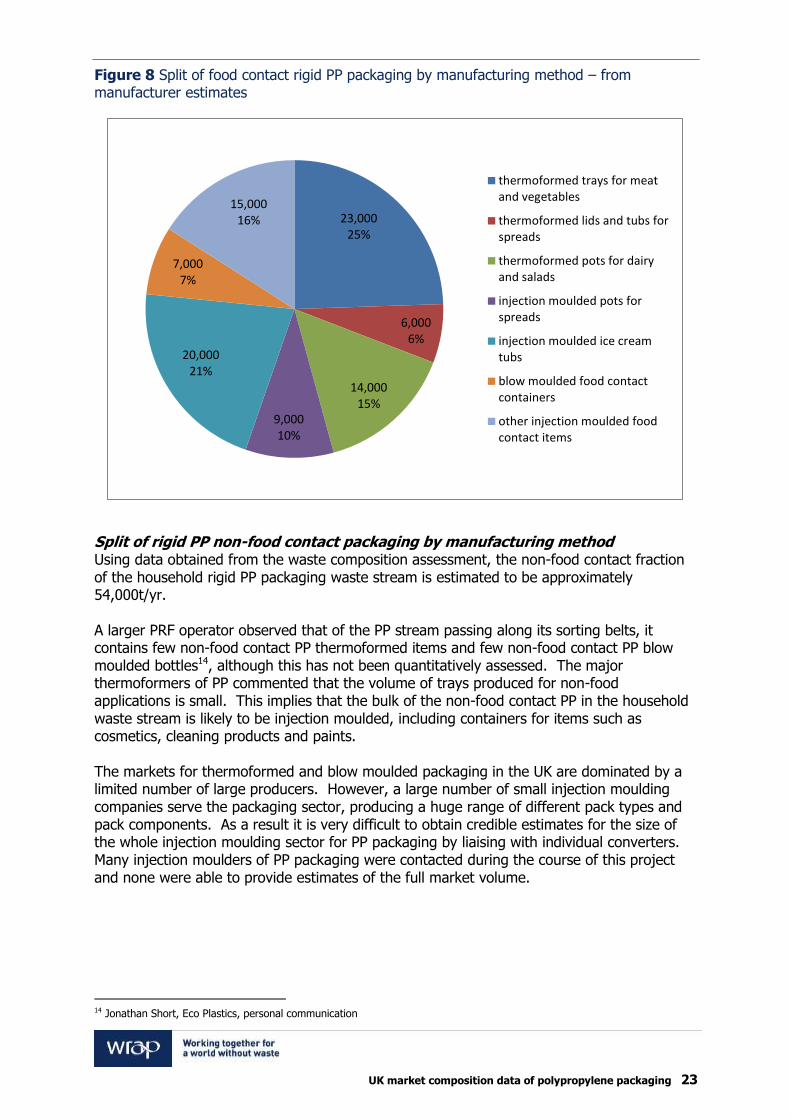
Figure 8 Split of food contact rigid PP packaging by manufacturing method – from manufacturer estimates
Split of rigid PP non-food contact packaging by manufacturing method Using data obtained from the waste composition assessment, the non-food contact fraction of the household rigid PP packaging waste stream is estimated to be approximately 54,000t/yr. A larger PRF operator observed that of the PP stream passing along its sorting belts, it contains few non-food contact PP thermoformed items and few non-food contact PP blow moulded bottles14, although this has not been quantitatively assessed. The major thermoformers of PP commented that the volume of trays produced for non-food applications is small. This implies that the bulk of the non-food contact PP in the household waste stream is likely to be injection moulded, including containers for items such as cosmetics, cleaning products and paints. The markets for thermoformed and blow moulded packaging in the UK are dominated by a limited number of large producers. However, a large number of small injection moulding companies serve the packaging sector, producing a huge range of different pack types and pack components. As a result it is very difficult to obtain credible estimates for the size of the whole injection moulding sector for PP packaging by liaising with individual converters. Many injection moulders of PP packaging were contacted during the course of this project and none were able to provide estimates of the full market volume.
14 Jonathan Short, Eco Plastics, personal communication
23,000 25%
6,000 6%
14,000 15%
9,000 10%
20,000 21%
7,000 7%
15,000 16%
thermoformed trays for meatand vegetables
thermoformed lids and tubs forspreads
thermoformed pots for dairyand salads
injection moulded pots forspreads
injection moulded ice creamtubs
blow moulded food contactcontainers
other injection moulded foodcontact items
UK market composition data of polypropylene packaging 24
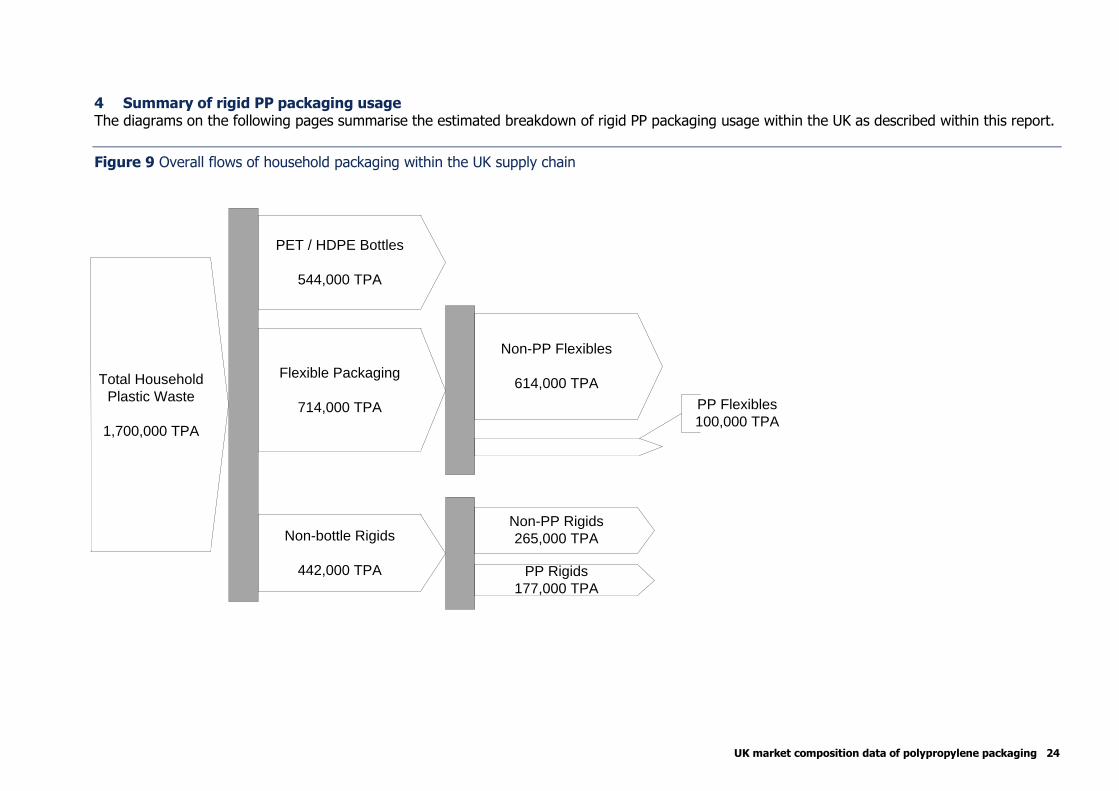
4 Summary of rigid PP packaging usage The diagrams on the following pages summarise the estimated breakdown of rigid PP packaging usage within the UK as described within this report.
Figure 9 Overall flows of household packaging within the UK supply chain
Total Household
Plastic Waste
1,700,000 TPA
PET / HDPE Bottles
544,000 TPA
Flexible Packaging
714,000 TPA
Non-bottle Rigids
442,000 TPA
Non-PP Flexibles
614,000 TPA
PP Flexibles
100,000 TPA
Non-PP Rigids
265,000 TPA
PP Rigids
177,000 TPA
UK market composition data of polypropylene packaging 25
Figure 10 Breakdown of commercial rigid PP packaging used in the UK
Commercial Rigid
PP packaging
80,000 TPA
Commercial Rigid PP
food contact packaging
20,000 TPA
Commercial Rigid PP
non-food contact
packaging
60,000 TPA
UK market composition data of polypropylene packaging 26
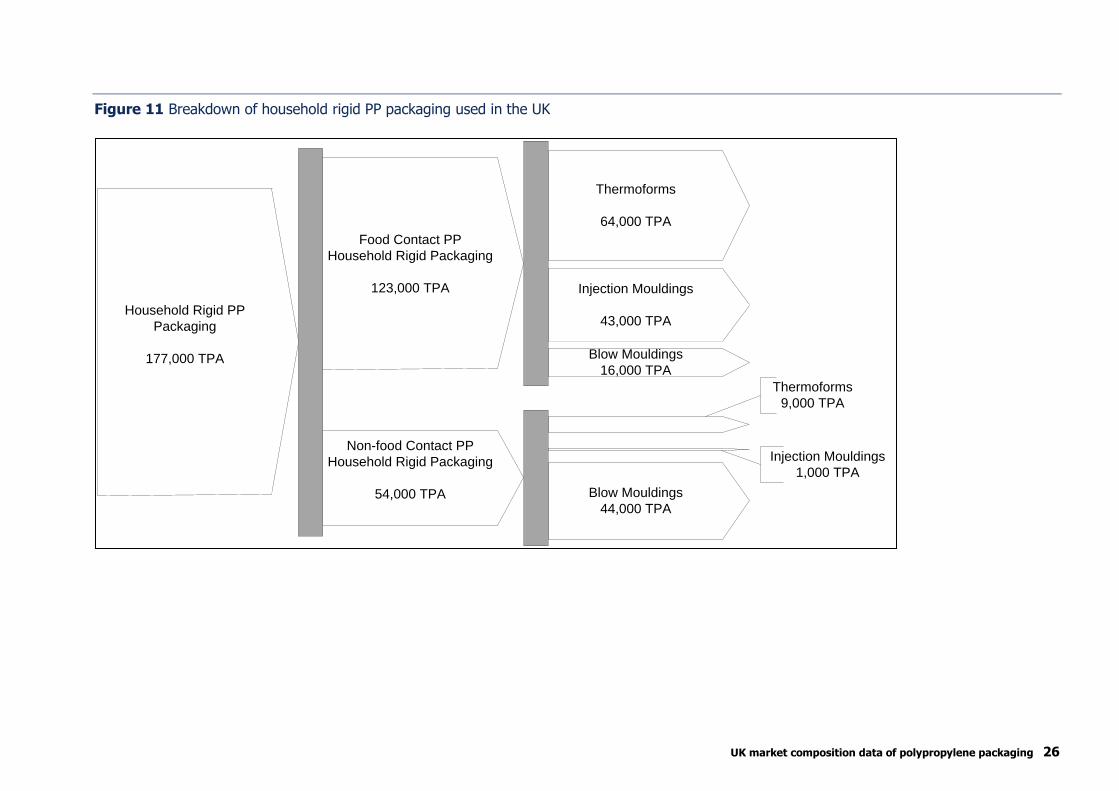
Figure 11 Breakdown of household rigid PP packaging used in the UK
Household Rigid PP
Packaging
177,000 TPA
Food Contact PP
Household Rigid Packaging
123,000 TPA
Non-food Contact PP
Household Rigid Packaging
54,000 TPA
Thermoforms
64,000 TPA
Injection Mouldings
43,000 TPA
Blow Mouldings
16,000 TPA
Blow Mouldings
44,000 TPA
Thermoforms
9,000 TPA
Injection Mouldings
1,000 TPA
UK market composition data of polypropylene packaging 27
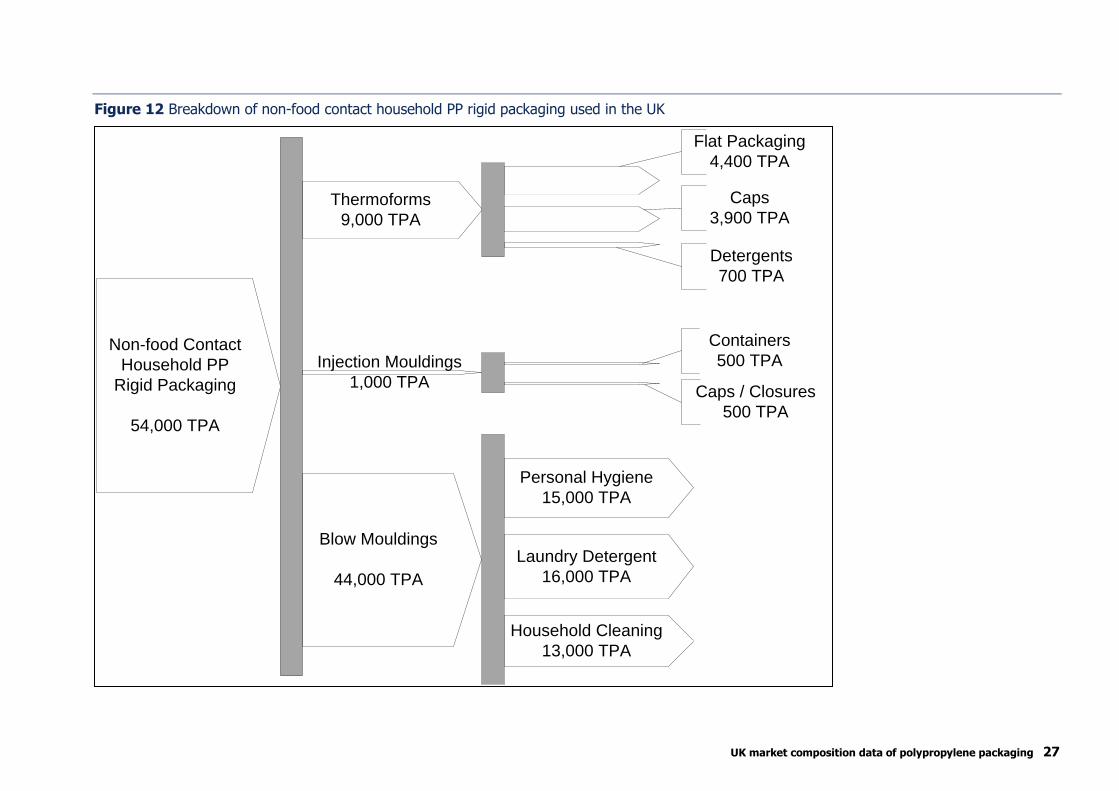
Figure 12 Breakdown of non-food contact household PP rigid packaging used in the UK
Non-food Contact
Household PP
Rigid Packaging
54,000 TPA
Thermoforms
9,000 TPA
Injection Mouldings
1,000 TPA
Flat Packaging
4,400 TPA
Caps
3,900 TPA
Detergents
700 TPA
Containers
500 TPA
Caps / Closures
500 TPA
Personal Hygiene
15,000 TPA
Laundry Detergent
16,000 TPA
Household Cleaning
13,000 TPA
Blow Mouldings
44,000 TPA
UK market composition data of polypropylene packaging 28
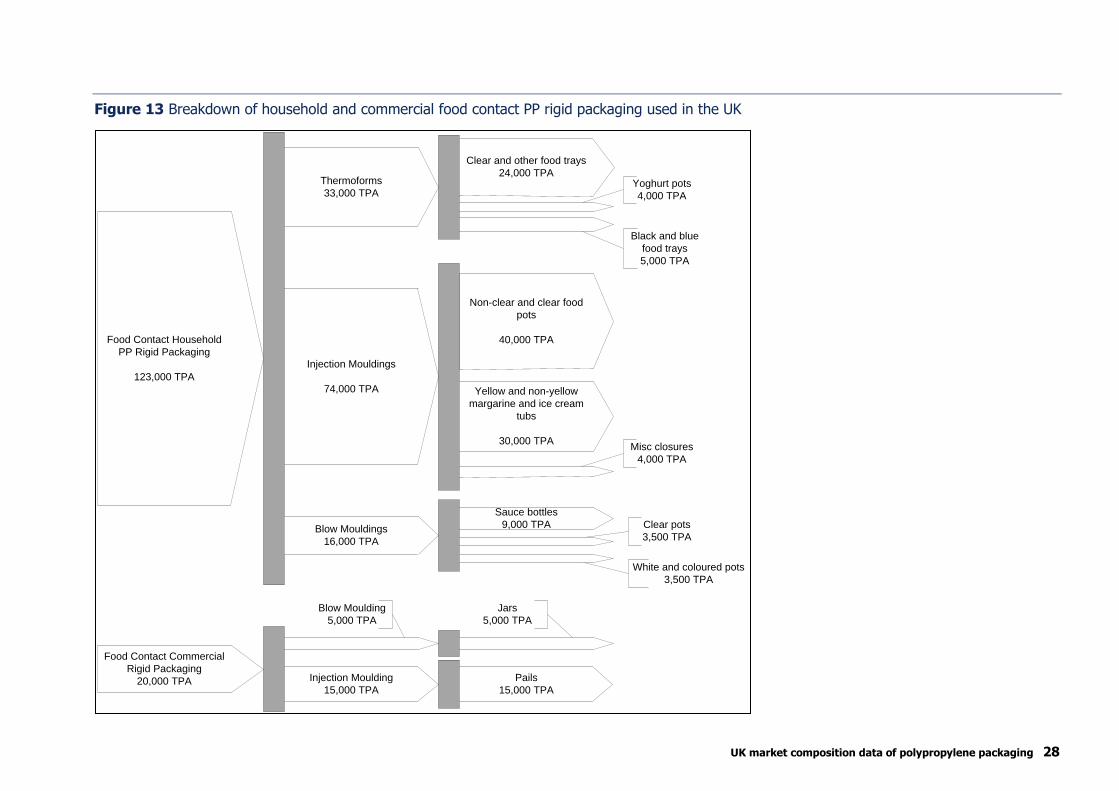
Figure 13 Breakdown of household and commercial food contact PP rigid packaging used in the UK
Food Contact Household
PP Rigid Packaging
123,000 TPA
Injection Mouldings
74,000 TPA
Blow Mouldings
16,000 TPA
Non-clear and clear food
pots
40,000 TPA
Clear and other food trays
24,000 TPA
Yellow and non-yellow
margarine and ice cream
tubs
30,000 TPAMisc closures
4,000 TPA
Yoghurt pots
4,000 TPA
Black and blue
food trays
5,000 TPA
Clear pots
3,500 TPA
White and coloured pots
3,500 TPA
Sauce bottles
9,000 TPA
Food Contact Commercial
Rigid Packaging
20,000 TPA
Blow Moulding
5,000 TPA
Injection Moulding
15,000 TPA
Jars
5,000 TPA
Pails
15,000 TPA
Thermoforms
33,000 TPA
UK market composition data of polypropylene packaging 29
5 Potential for recycled food grade PP This section assesses the factors that brand owners, packaging designers and specifiers, packaging converters, recyclers and other players in the supply chain must consider if a supply of food grade recycled PP is to be developed in the UK. 5.1 Requirements for food grade recycled PP The governing legislation for recycled plastic coming into contact with food is the ‘Commission Regulation EC 282/2008’ and the ‘Plastic materials and articles in contact with food (Eng) Regulation 2009’. The purpose of these pieces of legislation is to establish the requirements to be met by plastic materials containing recycled plastic and intended for food contact. The legislation is implemented and interpreted by the European Food Safety Authority (EFSA). EFSA guidelines require that 99% of the feed material for a food grade polymer recycling process must have been used for food contact in its first life (recently adjusted to 95% for PET). This immediately restricts the quantity of PP rigid packaging material that could potentially be recycled in the UK to the food contact fraction of the household stream plus any other food contact containers that are used in industrial applications. Examples of industrial PP food containers include injection moulded tubs and pails used for fats and large blow moulded containers. A further constraint imposed by the EFSA guidelines is that any non-polymer chemicals present in recycled polymer must be identified and their content must be reduced below predetermined limits. The limits set depend on the type of chemical. However, if the chemical can be positively identified and is not on a list of compounds specifically identified as hazardous then the content in the polymer must be reduced to the point where that chemical will not reach a concentration of more than 10ppb in the food simulant fluid when the recycled polymer is subjected to a migration test. In a migration test the sample of polymer is placed in a liquid which simulates the type of food material that it may contain when in use as packaging. The sample is stored for a set period of time at a set temperature which simulates real food storage conditions. After the test period the liquid is analysed to see what chemicals have been extracted from the polymer. The guidelines require that any chemicals present in the recycled polymer which cannot be positively identified must migrate into a food simulant fluid at much lower levels than for positively identified chemicals as their potential for harm is unknown. 5.2 Packaging design issues around food grade recycled PP Many PP food contact products are either direct printed (typically on thermoformed items) or in-mould labelled (for most injection moulded items). At present there are virtually no printing inks approved for direct food contact situations. Those that do exist are expensive and have a limited range of colours and are therefore rarely used. Labels are therefore positioned at the non-food-contact surface or are protected by a top-coat of a lacquer that is approved for food contact. Current direct printing and in-mould labelling technologies are not removed in the recycling process so the inks and label materials blend into the polymer material when it is melted at the end of the recycling process. The food safety properties of most of these inks are unknown and some of them may also degrade in unpredictable ways to produce other
UK market composition data of polypropylene packaging 30
chemical compounds at the temperatures which are experienced in polymer extrusion and moulding processes.
Decontamination work recently completed by WRAP15 did not find any specific issues with species/chemicals from In Mould Labels (IMLs) or direct printing inks. However in order to confirm whether recycled PP from packs with IMLs and direct printing inks meet the EU regulations for food contact, further investigation is recommended to check specifically for the presence of potentially problematic chemicals (such as photo-initiators and synergists) or their degradation products from IMLs and printing inks. We therefore recommend that these further investigations are made before PP packaging with IMLs and printing inks are used to produce recycled PP for food packaging. These issues mean that at present food contact PP containers which are either direct printed or in-mould labelled cannot yet be used with confidence as feedstock for food grade recycled PP. The polymers used for many PP food contact containers are pigmented and may also contain fillers or titanium dioxide as light blocks reduce translucency. These pigments and fillers are certified for food use but they cannot be removed by recycling processes and will affect the colour and transparency of the recycled polymer. Titanium dioxide in particular is very white and makes it difficult to produce black or dark coloured recycled polymer. Some packaging manufacturers are developing removable in-mould labels for injection moulded containers and others are developing packaging designs where direct print or in-mould labelling is moved to cardboard sleeves or to glued paper or plastic labels which can be removed in the recycling process and therefore enhance recyclability. Similarly some packaging manufacturers are developing new designs where the polymer is not pigmented and any colour required for decorating and branding is provided on the label. Different types of PP packaging require different sub-types of PP polymer. Injection moulding processes require high melt flow rate (MFR) polymer (>20g/10mins) while extrusion thermoforming and blow moulding processes require low melt flow rates (<2g/10mins). Some packaging products require co-polymer PP for high impact resistance or for good clarity while others can use less expensive homopolymer alone or a blend of homopolymer with co-polymer. If these polymer types are mixed in the waste stream then the resulting recycled polymer will have mechanical properties which reflect the properties of the feed materials. The recyclate may therefore not be suitable for use in all food contact end-use applications, particularly those with more demanding mechanical performance requirements. However the scoping study for WRAP on food grade PP recycling and several subsequent studies have demonstrated that recycled PP can be used in both thermoformed and injection moulded packaging products with few issues, especially when added at less than 25%16. Certain products may be made with an integral barrier layer to prevent migration of odours or oxygen. For example many blow moulded PP bottles and jars include an EVOH barrier layer. The barrier layer is usually thin compared to the PP layers either side so the EVOH is unlikely to disrupt the mechanical properties of the recycled polymer significantly. However even a small amount of EVOH does tend to reduce the transparency of the polymer.
15 Phase 3 Food Grade rPP decontamination final report
16 WRAP project MDP027 ‘Scoping study into food grade polypropylene recycling’ , Axion Consulting 2009
UK market composition data of polypropylene packaging 31
In summary, food grade recycled PP can only be made from a waste polymer feed where:
At least 99% of the feed material can be proven to have been in contact with food in
its first life;
The recycler can prove that any non-polymer chemicals which are retained in the
material, either from the use phase of the packaging or from the collection and
recycling process have been removed to a level which allows the material to pass a
migration test. At present it is difficult to prove this for direct printed or in-mould
labelled PP containers;
The physical properties of the recycled polymer, which are likely to lie somewhere
between the properties normally required for extrusion processes and the properties
required for injection moulding, are acceptable for the expected end-use; and
The colour of the recycled polymer is acceptable for the end-use. Recycled PP made
from coloured, direct printed or in-mould labelled feed material will have the average
pigmentation of the feed material.
In order to assess the challenges presented to recyclers by the rigid PP containers which currently enter the waste plastic supply chain, a range of packaging converters were consulted to discover the packaging constructions typically used in the most common PP packaging types found in the household waste stream. The results of these consultations are recorded in the following sections. 5.3 Composition of PP packaging It is important to note that there are no rules governing the design for recyclability of packaging in the UK and there are a large number of different packaging producers, each producing a wide range of pack designs for different brand owners and retailers. As a result the packaging constructions described below are only indicative of the majority of packs sold in each category. Within each category there will be substantial variation in pack design. In general PP is preferred for packaging types where the materials are filled, stored or used at either high temperature or low temperature and for aqueous or fatty foods. Unlike the other two main polymer types used in packaging, PET and HDPE, where there is little variation in the sub-types of polymer used, in the case of PP many different sub-types are used. There are two main groups of PP polymer grades. Homopolymer
More basic and less expensive grade of PP;
More cloudy appearance; and
Used as the major component for most thermoformed products.
Co-polymer
Better clarity;
Better impact properties;
Better flexibility and impact at low temperature;
Better ‘squeezability’ for sauce bottles; and
Used for a lot of injection moulded products (but not all).
There are two types of co-polymer. Block co-polymers give the better impact especially at low temperature but random co-polymers have the better clarity. Thermoformers may also blend in HDPE to give softer packs with better impact properties.
UK market composition data of polypropylene packaging 32
Both homopolymer and co-polymer PP can be made with either high or low melt flow rate (MFR). The melt flow rate is tailored to suit the moulding method used. In general extrusion, thermoforming and blow moulding processes require lower MFR and injection moulding processes, where the polymer has to flow into the corners of a mould cavity, require a higher MFR. Thermoformed and blow-moulded PP polymers have a MFR of less than 10, often 3 - 5. Injection moulded polymers have a melt flow rate in the range 20 - 70. The result is that mixed food contact PP packaging has an average MFR of about 8. Previous PP recycling scoping trials conducted on behalf of WRAP have demonstrated that this MFR should not create major problems for thermoformers even up to 100% for certain types of pack. The MFR of recycled PP from mixed food contact packaging may be too low for use in injection moulded packs at high addition rates because injection moulding requires high MFR polymer. However recycled PP has a complicated molecular weight distribution because it comprises a mix of polymer types. As a result MFR is a poor indicator of processing characteristics for it. For example it is likely the low Mw ‘tail’ acts as an internal lubricant, giving better injection moulding characteristics than the MFR would indicate. There is potential to adjust the MFR during the recycling process either by blending or by peroxide treatment to reach the higher MFR needed by injection moulders. There are some uncertainties over the suitability of this treatment method for food grade use as the peroxide treatment may leave unwanted low molecular weight shorter chain decomposition products in the recycled polymer. However this should still be acceptable from a regulatory perspective because the monomers are specified on the positive list, rather than the polymer. 5.4 Thermoformed products The majority of rigid PP thermoformed packaging made in the UK is for food use. Thermoformers use a range of polymer types for food applications, including PP, PET, PS and PVC. PP is generally best for applications that need complex mouldability or high top-load strength and applications where it is an advantage to have the same material for the tray and the heat seal cover. PP is essential for microwaveable packs because the aPET used for most packaging is not as stable in a microwave. PET is best for applications which require high clarity and good oxygen barrier performance to prevent food degradation in storage. At present some thermoform manufacturers are responding to demand from retailers for recycled content and switching from PP to (more expensive) PET because of greater availability of rPET. For example, two major UK dairy groups have recently moved from PP or polystyrene (PS) to clear unmarked PET yoghurt and cream pots with peelable cardboard sleeves to improve recyclability and to reduce the total amount of polymer used because PP and PS are not widely recycled in UK at present. At present when UK thermoformers wish to add recycled content to their PP products they add food grade rHDPE (from milk bottles) but they can only do this at around 10%. They
UK market composition data of polypropylene packaging 33
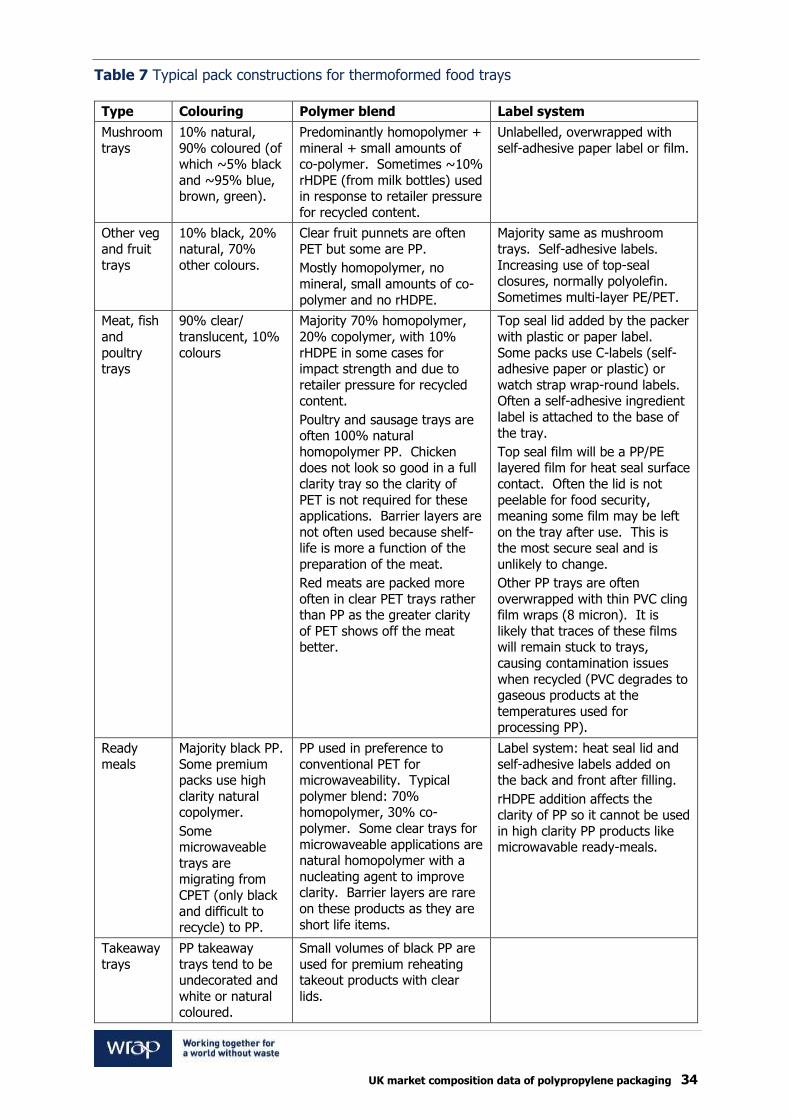
find they can add up to 50% rPET in their PET thermoformed products. Many PET food trays are black so adding rPET to these does not usually adversely affect the appearance of the packaging. Several thermoformers commented that they are nervous about using rPP, even if it is food grade approved, because the processing ‘window’ for virgin PP in sheet extrusion and vacuum forming machinery is much smaller than for PET, meaning that control of the operating parameters is more sensitive. They are concerned that adding rPP would increase the variability of the polymer properties, especially as a wide range of PP formulations are used in food contact applications, and could make the sheet forming and vac forming processes harder to control. Trials conducted on behalf of WRAP have, however, revealed that the concerns expressed by the thermoformers are simply perceived; the use of rPP is in fact technically viable and does not significantly alter the polymer properties. The following sections describe typical pack constructions for the main groups of PP packaging products, with information obtained from discussions with thermoformers. Food trays Table 7 outlines key information for thermoformed PP food trays.
UK market composition data of polypropylene packaging 34
Table 7 Typical pack constructions for thermoformed food trays
Type Colouring Polymer blend Label system
Mushroom
trays
10% natural,
90% coloured (of which ~5% black
and ~95% blue, brown, green).
Predominantly homopolymer +
mineral + small amounts of co-polymer. Sometimes ~10%
rHDPE (from milk bottles) used in response to retailer pressure
for recycled content.
Unlabelled, overwrapped with
self-adhesive paper label or film.
Other veg
and fruit
trays
10% black, 20%
natural, 70%
other colours.
Clear fruit punnets are often
PET but some are PP.
Mostly homopolymer, no
mineral, small amounts of co-
polymer and no rHDPE.
Majority same as mushroom
trays. Self-adhesive labels.
Increasing use of top-seal closures, normally polyolefin.
Sometimes multi-layer PE/PET.
Meat, fish
and
poultry trays
90% clear/
translucent, 10%
colours
Majority 70% homopolymer,
20% copolymer, with 10%
rHDPE in some cases for impact strength and due to
retailer pressure for recycled content.
Poultry and sausage trays are often 100% natural
homopolymer PP. Chicken does not look so good in a full
clarity tray so the clarity of
PET is not required for these applications. Barrier layers are
not often used because shelf-life is more a function of the
preparation of the meat.
Red meats are packed more
often in clear PET trays rather than PP as the greater clarity
of PET shows off the meat better.
Top seal lid added by the packer
with plastic or paper label.
Some packs use C-labels (self-adhesive paper or plastic) or
watch strap wrap-round labels. Often a self-adhesive ingredient
label is attached to the base of
the tray.
Top seal film will be a PP/PE layered film for heat seal surface
contact. Often the lid is not
peelable for food security, meaning some film may be left
on the tray after use. This is the most secure seal and is
unlikely to change.
Other PP trays are often
overwrapped with thin PVC cling film wraps (8 micron). It is
likely that traces of these films will remain stuck to trays,
causing contamination issues
when recycled (PVC degrades to gaseous products at the
temperatures used for processing PP).
Ready
meals
Majority black PP.
Some premium packs use high
clarity natural copolymer.
Some microwaveable
trays are migrating from
CPET (only black
and difficult to recycle) to PP.
PP used in preference to
conventional PET for microwaveability. Typical
polymer blend: 70% homopolymer, 30% co-
polymer. Some clear trays for
microwaveable applications are natural homopolymer with a
nucleating agent to improve clarity. Barrier layers are rare
on these products as they are
short life items.
Label system: heat seal lid and
self-adhesive labels added on the back and front after filling.
rHDPE addition affects the clarity of PP so it cannot be used
in high clarity PP products like microwavable ready-meals.
Takeaway
trays
PP takeaway
trays tend to be undecorated and
white or natural coloured.
Small volumes of black PP are
used for premium reheating takeout products with clear
lids.
UK market composition data of polypropylene packaging 35
Dairy pots and tubs This PP packaging segment includes thermoformed lids for injection moulded margarine tubs, a relatively small volume of thermoformed spread tubs and cream and yoghurt pots. The majority of yoghurt pots packaged as individual servings in the UK are packaged in PS, with larger sizes (typically 0.5l and above) often packaged in PP or PET with a card sleeve. There is a trend for products packaged in PS to migrate towards PP in order to reduce the range of polymer types in the waste stream but PS has advantages in thermoformability and also ‘cracks’ well when pots are split from each other by the consumer in multi-pot packs. Virtually all of these PP thermoformed items are made from 60% homopolymer and 40% co-polymer with a MFR of 3 - 4. These polymers are mixed before making the sheet which is then thermoformed to make the pots or lids. Approximately 80% of this material is direct printed and 20% has self-adhesive labels applied after moulding. Coleslaw and prepared salads in UK comprise some 50 million pots/yr, of which about 25 million are PP and 25 million are PET. Considering the PP containers, all are thermoformed with heat seal lids. The majority of these PP containers have direct print labelling, with the exception of a small, growing number of plain salad tubs which have cardboard sleeves. Prepared salads are moving gradually from PP to PET containers. Cream products are moving from PS direct print thermoformed pots to PP injection moulded in-mould labelling (IML) pots with heat seal lid plus a thermoformed clear PET lid with no marking. A thin PE coating is applied to most of the heat seal thermoformed items at the sheet extrusion stage prior to thermoforming in order to aid adhesion of the heat seal lid. Non-food packaging All of the thermoformers consulted commented that few thermoformed items are used in non-food household packaging items. Some toy packs are PP but also often PET or PVC and the packaging is usually made in the Far East where the toys are made. There are some thermoformed DIY packaging products and a small quantity (a few hundred tonnes per year) of trays for disposable medical products. 5.5 Injection moulded products All injection moulded processes require high MFR polymer so the melted polymer can penetrate the corners of the mould at high speed. Thin wall containers such as margarine tubs require particularly high melt flow. A wide range of PP polymer grades are produced for injection moulding applications with MFRs in the range 20 - 70. Thin wall containers for spreads and dairy products Margarine tubs have injection moulded PP bodies and the great majority have thermoformed PP lids. As they are very thin wall products they use 100% co-polymer PP to provide impact resistance for the tub. The majority of the spreads market uses in-mould labels (IML) for the body and direct print labelling for the lids. A few margarine brands (for example Kerry) have thermoformed pots with direct printing.
UK market composition data of polypropylene packaging 36
Ice cream tubs are injection moulded PP with IML. Block co-polymer is used to give good impact resistance at low temperature. Ice cream tub lids are mostly also injection moulded with IML. The majority of the ice cream market uses white or blue polymer with high levels of white titanium dioxide pigment to reduce transparency. However there is a trend towards clear PP tubs and lids to show off the product for premium ice cream brands. These clear tubs use IML. Other food containers Injection moulded PP fresh soup and confectionery pots (for example biscuit bites) have self-adhesive labels on clear pots or use in-mould labels. Other injection moulded PP food containers include large tubs and pails for catering packs of fats and oils, spreads and salads. These packs often have a wire or plastic handle and a PP push lid. Closures Significant volumes of PP are used to make injection moulded closures for all types of packaging. This includes screw caps for blow moulded PET, HDPE and PP bottles, screw lids for glass and plastic jars, push lids for paint cans, cardboard tubes and composite containers, such as cocoa tins, and more complex components, such as trigger action sprays for cleaning products. The variety of constructions is huge. Most closures are coloured and many have self-adhesive labels. IML for closures is less common. Non-food containers A very wide range of injection moulded PP container types and pack designs are made for a huge variety of products, including cosmetics, cleaning products, DIY products and paints. Pack types include tubs, pots, trays and bottles, some with screw lids, some with press-lids, some with foil seals. In most cases the lids and closures are also injection-moulded. Most non-food injection moulded PP containers are pigmented in some way for decoration and branding and the majority have some form of print or label on the pack. A wide range of decoration techniques are used, including wrap around, shrink and in-mould labels. Some packs use post-mould self-adhesive labels and some are direct screen-printed. Direct printing is usually used only for lower value products. No barrier layers are used in injection moulded products.
UK market composition data of polypropylene packaging 37
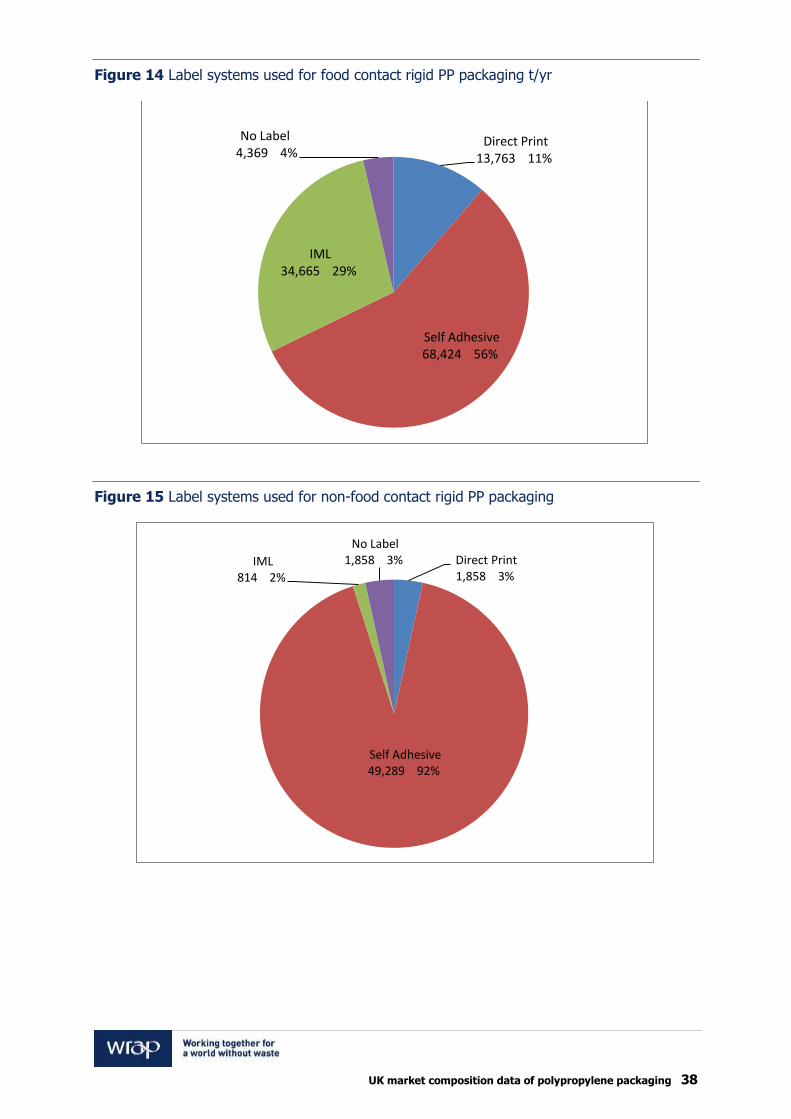
5.6 Blow moulded products Food containers Blow-moulded PP is used for squeezable ketchup and sauce bottles and is increasingly used in plastic screw-top fruit jars, which are rapidly replacing glass jars and steel cans for fruit and similar products. PP is used as it can be hot-filled, which is essential in many glass jar replacement applications. They are nearly always a multi-layer structure with a thin EVOH barrier layer applied between two PP layers. Often a slightly different mix of homopolymer and co-polymer is used in the outer and inner PP layers. This increases the complexity of PP bottles when compared to the simple single polymer construction used in the great majority of blow-moulded PET and HDPE bottles. Large blow-moulded PP jars are used for catering-size packs for pickles, sauces and similar products. These are also usually natural colour with an EVOH barrier layer. When the EVOH barrier layer from any sort of blow-moulded PP container is melted into the bulk PP in a recycling process it will tend to reduce the clarity of the mixed polymer. PP blow moulded bottles and jars are all labelled with self-adhesive labels applied either after moulding or after filling. Non-food containers Blow moulded PP non-food containers include storage jars and bottles for cleaning products. Non-food containers do not generally require barrier layers. 5.7 Summary of label types used in rigid PP packaging The approximate split of label types estimated by the packaging converters was applied to each of the product types identified in the waste composition analysis. This was used to estimate the overall split of label types used in the food and non-food contact components of the rigid PP packaging waste stream, as shown in Figure 14 and Figure 15.
UK market composition data of polypropylene packaging 38
Figure 14 Label systems used for food contact rigid PP packaging t/yr
Figure 15 Label systems used for non-food contact rigid PP packaging
Direct Print 13,763 11%
Self Adhesive 68,424 56%
IML 34,665 29%
No Label 4,369 4%
Direct Print 1,858 3%
Self Adhesive 49,289 92%
IML 814 2%
No Label 1,858 3%
UK market composition data of polypropylene packaging 39
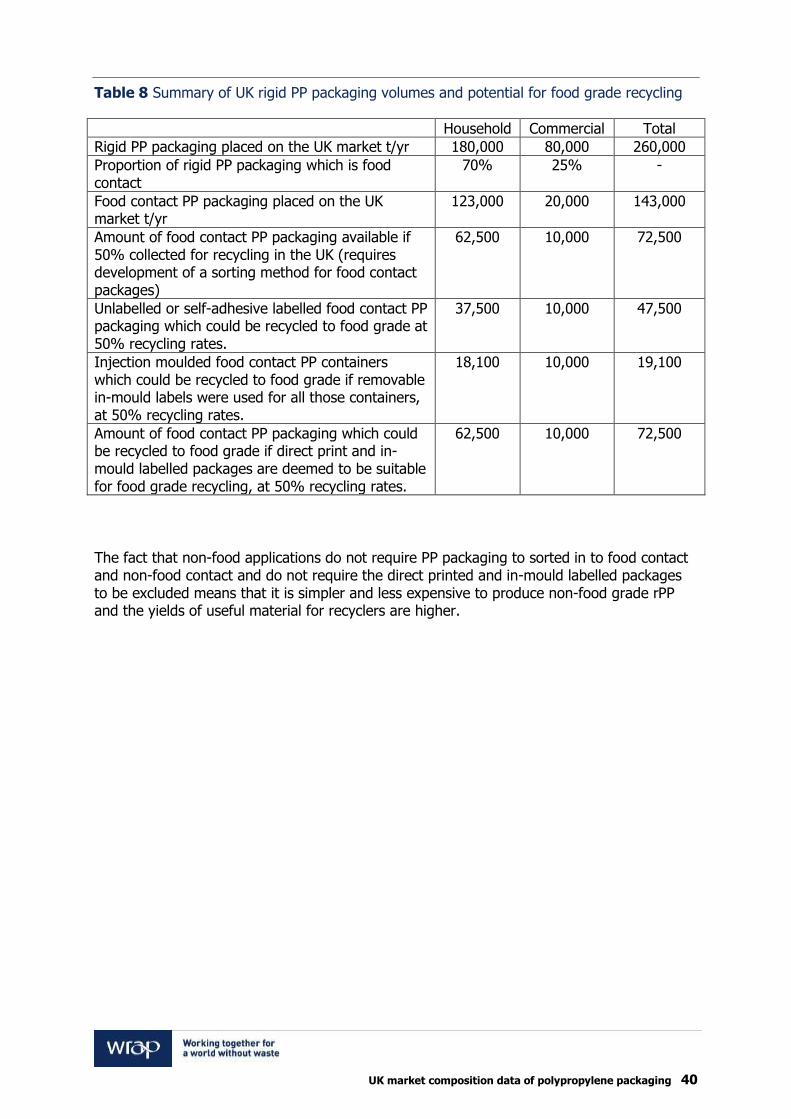
5.8 Potential volume of feedstock for food grade recycled PP Initial practical trials for WRAP have shown that it is possible to produce PP recyclates from the UK household waste stream that should be able to achieve EFSA food grade standards provided they are made from 99% food contact PP starting material (note that the limit is 95% for PET). A further constraint at present is that until it can be proven conclusively whether pigments from direct printed and in-mould labelled products may create problems for food grade PP recycling it may be necessary to assume that these products cannot be used as feedstock for food grade recycled PP. In addition to the household PP packaging waste stream, some food contact packaging could potentially be recovered from the catering supply chain by capturing injection moulded PP tubs and pails for fats, pickles and sauces and blow-moulded jars for similar applications. It is difficult to estimate this volume accurately but from the 2005 report by RECOUP and industry consultations for this project the volume of food contact catering containers placed on the market in the UK could be about 20,000t/yr. The table below summarises the total available volumes of PP packaging in the UK waste stream which are food contact and therefore potentially suitable for recycling for food grade applications at an assumed recycling rate of 50%. The key conclusions of the PP volume assessment are summarised in Table 8.
UK market composition data of polypropylene packaging 40
Table 8 Summary of UK rigid PP packaging volumes and potential for food grade recycling
Household Commercial Total
Rigid PP packaging placed on the UK market t/yr 180,000 80,000 260,000
Proportion of rigid PP packaging which is food contact
70% 25% -
Food contact PP packaging placed on the UK market t/yr
123,000 20,000 143,000
Amount of food contact PP packaging available if 50% collected for recycling in the UK (requires development of a sorting method for food contact packages)
62,500 10,000 72,500
Unlabelled or self-adhesive labelled food contact PP packaging which could be recycled to food grade at 50% recycling rates.
37,500 10,000 47,500
Injection moulded food contact PP containers which could be recycled to food grade if removable in-mould labels were used for all those containers, at 50% recycling rates.
18,100 10,000
19,100
Amount of food contact PP packaging which could be recycled to food grade if direct print and in-mould labelled packages are deemed to be suitable for food grade recycling, at 50% recycling rates.
62,500 10,000 72,500
The fact that non-food applications do not require PP packaging to sorted in to food contact and non-food contact and do not require the direct printed and in-mould labelled packages to be excluded means that it is simpler and less expensive to produce non-food grade rPP and the yields of useful material for recyclers are higher.
UK market composition data of polypropylene packaging 41
6 Trends, opportunities and constraints 6.1 Opportunities to develop food grade PP recycling It was clear from discussions for this project with retailers and packaging converters that there is significant desire for food grade recycled content plastic from consumers, retailers and brand owners in order to reduce the carbon impact of PP packaging. PP packaging converters are responding to this demand in two ways at present:
Adding recycled HDPE from milk bottles at up to 10% to PP; and
Changing packaging designs away from PP to PET (even though it is more expensive)
so that they can add rPET at up to 50%.
This situation creates a commercial opportunity which packaging recyclers could potentially address. Experience of food grade recyclers in the UK processing other polymer types (HDPE and PET) indicates that packaging manufacturers will very rarely pay more than virgin polymer price for recycled plastic but they will pay close to this price provided the recycled polymer meets food grade safety standards and matches the virgin material in terms of mechanical and processing performance. 6.2 Competing outlets for recycled PP The plastic recyclers contacted in the course of this study were unanimous that at this stage they are not ready to move to food grade PP production because:
They have a ready market at good prices for non-food grade recycled PP; and
The complex compliance requirements, extra capital costs and reduced yields inherent
in food grade recycling for PP make it too risky when other end markets are available.
There is strong demand for recycled PP derived from the packaging sector for non-food containers such as paint cans, horticulture, DIY products, construction products and automotive components. Customers in all these sectors use large volumes of material, positively value recycled content and will pay close to virgin price for high specification rPP without requiring food safety compliance. However the packaging sector is the biggest user of PP and most of it needs to be food grade material (around 70% for food contact uses). Therefore as recycling rates of PP packaging waste increase over the coming years to meet targets for plastics recycling there is an opportunity to produce a food contact recycled PP from this material that could be used to reduce the carbon impact of PP packaging. 6.3 Changes required in the supply chain to encourage food grade PP The initial scoping studies funded by WRAP have demonstrated that it is technically feasible to produce food grade rPP from sorted food contact end of life household PP packaging. It is not yet commercially viable to produce rPP at prices that are acceptable to retailers, brand owners and consumers. There are several changes which could be made throughout the supply chain in order to encourage development of food grade recycled PP:
Develop a system to allow automated sorting of PP containers which are
suitable for food grade recycling. This is likely to require collaboration between
retailers, brand owners, converters, label suppliers, recyclers and recycling machinery
suppliers to develop a standard label system which can be used with a wide range of
packaging types and designs and which can be detected and separated efficiently by
recycling separation machines and which can then be removed in the downstream
recycling process. WRAP is currently funding initial work to test a number of possible
label solutions;
UK market composition data of polypropylene packaging 42
Convert more food contact PP packaging from direct printed and in-mould
labels to label types which are removable in the recycling process. This can
be done by switching to removable label types or by moving label information to
separate sleeves. Certain label manufacturers are also working on development of
removable in-mould labels for injection moulded products. Packaging changes of this
type require collaboration between retailers, brand owners, label makers and
converters. They cannot be done overnight as any packaging design changes require
substantial investment by the converters; and
Convert more food contact PP packaging from pigmented polymer to natural
polymer. At present recycling PP from the food contact household PP waste stream
results in an opaque grey/green product. This is partly due to the direct print and in-
mould labels which become mixed into the recycled PP and partly due to the
pigmented polymer which is used in many PP food contact items. Moving colour and
brand messages from the container to removable labels or separate sleeves makes it
more likely that recyclers would be able to recover a separate stream of un-pigmented
natural PP. This material would have higher value and more end-use applications in
the food packaging sector.
6.4 Constraints for brand owners, retailers and converters Brand owners and retailers are subject to many other constraints beyond the drive to increase recycled content. The product must be made to look attractive, food safety and security must be preserved, carbon impact minimised, complex product information must be communicated and branding must be reinforced while at the same time costs must be controlled. Retailers are trying to reduce the range of polymer types used in packaging to just PET, HDPE and PP in order to improve recyclability. PP is an essential component of this mix because of its particular mechanical and physical properties. PP will therefore remain a significant polymer type within the household packaging mix for the foreseeable future. Retailers and brand owners will therefore have to work closely with packaging converters and recyclers and will also have to accept some compromises in pack design and cost in order to encourage the market to increase food grade PP recycling. As an example several converters commented during the consultations for this project that there is discussion within the market at present about using foamed PET to replace current packaging types in order to help light-weighting. This would create a big problem for recyclers because foamed PET would be very difficult to separate from HDPE and PP in the density separation processes that are used by many recyclers. Normally PP and HDPE float in water, whilst PET sinks. Foamed PET floats in water and would therefore contaminate the HDPE and PP streams.

UK market composition data of polypropylene packaging 43
7 Conclusions and recommendations PP’s properties of impact resistance, mouldability and low and high temperature stability make it an essential polymer for many packaging applications. It is these properties which have also led to it being used in a great variety of packaging types and with a wide range of grades and formulations for both food and non-food applications. HDPE and PET are largely present in the household waste stream as bottles with a single polymer type and with a high proportion of natural or clear material. Food grade recycling of PP therefore poses a very much greater technical and commercial challenge for recyclers than making food grade rHDPE or rPET, although these processes are challenging in themselves. Around 180,000t/yr of rigid PP packaging enters the household waste stream in the UK plus roughly 80,000t/yr more from commercial and industrial applications. Within this there is a total of around 72,500t/yr of potentially recoverable food contact rigid PP packaging in the UK, assuming a recycling rate of 50%. Most of this (62,500t/yr) is from the household waste stream but part is from the catering supply chain. In the medium term, without major changes to PP pack design, and assuming a recycling rate of 50%, there is potential in the UK to collect up to around 47,500t/yr of rigid PP food contact packaging that is suitable for food grade recycling, provided:
Rigid non-bottle plastic collections are increased;
A label-based automated sorting system can be developed;
New labels are fixed to all PP packaging that is suitable for food grade recycling; and
Capacity to handle non-bottle rigid plastics is added and new sorting machines are
installed at all the major UK PRFs so that around 50% of the available rigid food
contact PP without direct print or in-mould labels is captured from the household and
catering waste streams.
Larger volumes of rigid PP food contact packaging could potentially be recovered if:
Plastic collections for recycling increase beyond the 50% that is currently achieved for
plastic bottles. The trends are for kerbside plastic recycling collections to continue to
increase;
Pack designs are modified to convert current direct printed and in-mould labels to
other label types, including peelable in-mould labels, which can be removed in the
recycling process. This may require substantial investment by packaging converters
but could increase rigid PP suitable for food grade recycling to around 72,500t/y at
50% recycling rates; or
It can be demonstrated that recycled PP from packaging labelled with in mould labels
and direct printed labels meets the EFSA requirements for food contact. At 50%
recycling rates this would be around 72,500t/y.
At the same time there is strong demand for recycled PP from non-food end users in non-food packaging, construction products and automotive components. Because there is no requirement for food contact-only feed material for these markets and because there are usually few concerns about incorporating direct print and in-mould labels or pigmented polymer in the recyclate, the quantity of rigid PP packaging that is recoverable for non-food applications in the medium term, assuming a 50% recycling rate is much greater at around 130,000t/yr (i.e. half the total household and commercial rigid PP packaging placed on the UK market).
UK market composition data of polypropylene packaging 44
The food and non-food markets for recycled PP are not mutually exclusive and although there are viable non-food markets for PP, in the medium term when the supply of PP packaging waste increases in line with current trends, packaging converters and retailers will demand food grade rPP too. The packaging sector is a major user of PP and represents a large market for recyclers – but most of it needs to be food grade. This presents a future opportunity for the PP supply and recycling chain. In order to improve the recyclability of PP packaging for food contact applications retailers, brand owners, converters, local authorities, waste management companies and recyclers will need to work together in a concerted effort to develop the supply chain from pack design through to the recycling process so that the proportion of food contact PP packaging that can be recycled increases while at the same time the quality of the food grade PP recyclate reaches the standard required for use in new packaging.

www.wrap.org.uk/plastics