Embed Size (px)
Citation preview
6
Phase Contrast Computed Tomography
Fu Jian Beijing University of Aeronautics and Astronautics
China
1. Introduction
Absorption-based X-ray imaging has been used for medical and industrial applications and become an invaluable tool since German scientist Röntgen’s discovery more than a hundred years ago. By the development of computed tomography (CT), absorption-based X-ray imaging could be further improved and non-destructive three-dimensional (3D) views of internal structures became possible. In particular, for medical diagnostics applications, X-ray CT became an invaluable tool during the last 30 years. However, this kind of techniques provides poor contrast and spatial resolution for weakly absorption materials and structures with low atomic number. For example, since the absorption coefficients of soft tissue are very close to that of water, it is very difficult to distinguish internal features in the soft material. In the quest of better contrast in X-ray imaging, a number of different phase contrast imaging (PCI) techniques have been explored during the last few decades. The phase shift cross section is three orders of magnitude larger than the absorption cross section for materials with low atomic number, which is an indication that PCI is more sensitive to density variation than absorption-based X-ray imaging. As one of the important research topics in the field of PCI, phase contrast CT (PC-CT) has consequently been developed to get the phase shift cross section tomography image of the samples. Unlike absorption-based CT, PC-CT uses the phase shift rather than the absorption as the imaging signal and may provide better image quality in soft tissue and low atomic number samples. In this chapter, an overview of PCI and PC-CT methods was presented. Some of contents are directly adapted from the literatures. We will firstly introduce the concept of X-ray refraction, the complex refractive index and the phase signal. Then we will discuss the imaging principles of several kinds of PCI methods including crystal interferometer, analyzer based imaging, propagation based imaging and grating based imaging. Followed is the description of several PC-CT methods. PC-CT based on gratings and ordinary X-ray source will be the focus of discussion. Finally a description about the future of PC-CT will be presented.
2. X-ray refraction
It is well-known that refraction will be observed when light wave passes from one medium to another medium at any angle other than 90° or 0°. Refraction is the change in direction of a wave due to a change in its speed. It is described by Snell's law, which states that the angle of incidence is related to the angle of refraction. The index of refraction represents the refraction property of one media, which is relative to the propagation speed of light in this media.
www.intechopen.com
Computed Tomography – Clinical Applications
108
As a form of electromagnetic wave, X-ray also has refraction phenomenon when it interacts with matter. Meanwhile, X-ray is shorter in the wavelength than visible light and easier to penetrate matter. It has a wavelength in the range of 0.01 to 10nm, corresponding to frequencies in the range 30 petahertz to 30 exahertz (3×10¹⁶ Hz to 3×10¹⁹ Hz) and energies in the range 120 eV to 120 keV. Due to refraction, both the amplitude and the phase of the electromagnetic wave describing the X-ray beam are affected when X-rays penetrate matter. The amplitude gets attenuated and the phase gets shifted.
When calculating refraction effects of X-rays penetrating matter, one can calculate both absorption and phase shift of the X-ray wave from the complex index of refraction n . In homogeneous media with a nonzero electron density, the refractive index is usually written as 1n i . Where δ and are given by equations (1) and (2). is the wavelength,
150 2.82 10r m is the Thomson scattering length (classical electron radius), Z is the
atomic number, and A is the atomic number density. p and are phase shift cross section and the absorption cross section respectively (Jensen 2010).
0( / 2 / ) ( ) ( / 2 / )A A pr Z (1)
( / 4 / ) A (2)
To see the effect of the refractive index, we consider a wave propagating through a medium.
The propagation of an electromagnetic wave through a medium with index of refraction n
is described by equation (3). k is the wave vector, r is the position vector, and 0E is the
amplitude of the electric field.
(1 )0 0( ) i k rink r k rr E e E e e (3)
In vacuum, the index of refraction n is unity, and hence the propagation of a plane wave in
vacuum can be described by equation (4).
0( ) ik rr E e (4)
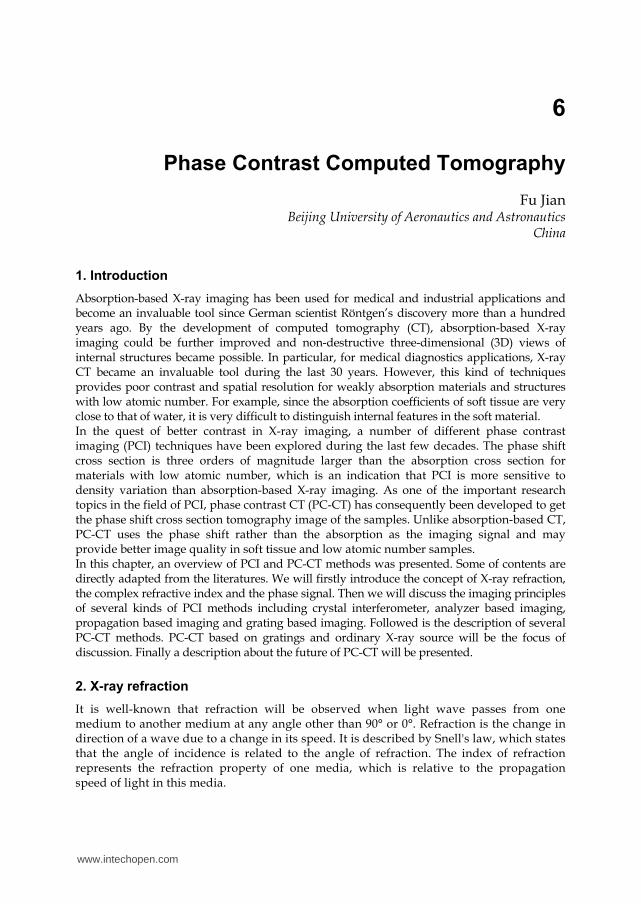
In Figure 1 an example of how a plane wave changes as it interacts with a block of material is displayed. A wave travelling through a medium with refractive index n is both
attenuated and phase shifted relative to a ray travelling through vacuum. The imaginary part of the refractive index describes the attenuation, here illustrated by the loss in amplitude and indicated by green lines in figure 1. The change in amplitude and intensity
are given by equations (5) and (6) respectively. 2k is the linear absorption coefficient
for absorption imaging. r is the length of the block of material.
0(1 )krE E e (5)
2 2 20 0 0 0 0| | | | (1 )kr kr rI E E e I I e I e (6)
The second part of the refractive index is the real part . The real part describes the change in wavelength of the X-rays inside the material. The change in wavelength causes a phase difference between the X-rays that pass through the material and the X-rays that do not. This change in phase is,
www.intechopen.com
Phase Contrast Computed Tomography
109
k r (7)
In general this can be rewritten as,
( , ) ( , )k x y dr k x y dy (8)
The change in phase also results in a change in direction of the X-rays as seen in Figure 1. The angular change in the direction is given as,
( ( , ) ) /x y dy x (9)
From the derivations above we now see how the real and the imaginary parts of the refractive index describe the behavior of X-rays as they pass through the material. These descriptions can be used to determine how to measure the real and imaginary parts of the refractive index, which are corresponding to phase contrast imaging and the conventional attenuation-based imaging (Jensen 2010).
Fig. 1. Phase shift and attenuation of a wave in a medium. Inside the medium with refractive index 1n i the wave get phase shifted with respect to the wave propagating in free space, as indicated by red lines, and attenuated, as indicated by green lines. Figure adapted from (Jensen 2010).
3. Why is phase contrast imaging?
The complex refractive index of the sample implies the features of phase contrast imaging and the conventional attenuation-based imaging.
From equations (1) and (2), we see that the ratio between the two cross sections p and is given as
/ (2 ) /p (10)
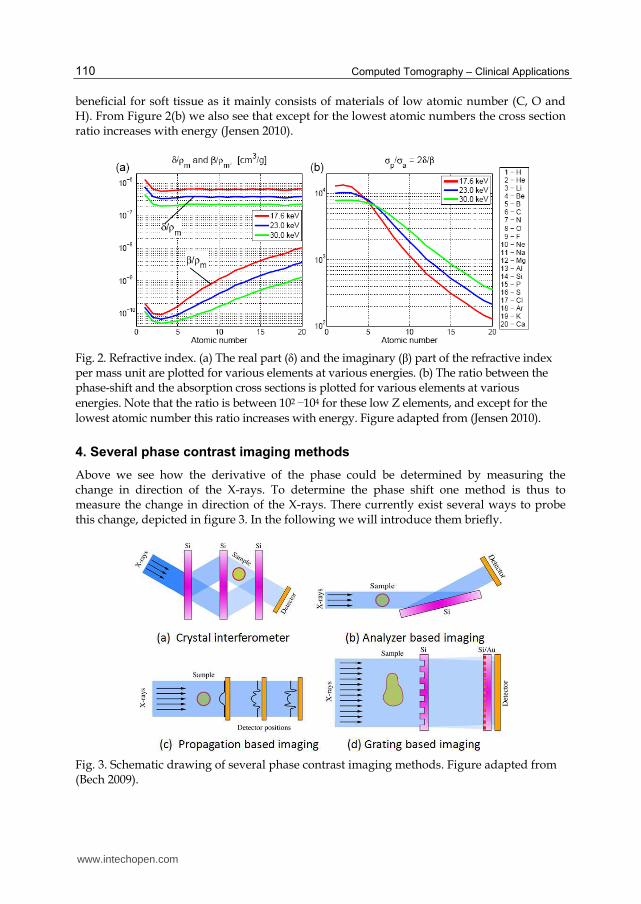
In Figure 2(a) the refractive index per mass unit is plotted for elements with atomic number lower than or equal to 20 for a number of different x-ray energies (data from Henke et al. , 1993). For water at 23.0keV, 74.36 10 and 102.20 10 . In Figure 2(b) the ratio between the phase shift cross sections and the absorption cross sections is plotted. We see that the ratio is in the range 2 410 10 (for water at 23.0 keV, 3/ 3.97 10p ). The cross section for the phase shift is thus 2-4 orders of magnitude greater than the cross section for the absorption. It is this large difference that is one of the motivations for performing phase contrast imaging, as phase contrast imaging has the potential to deliver contrast that is orders of magnitude better than standard absorption images. Phase contrast imaging is especially
www.intechopen.com
Computed Tomography – Clinical Applications
110
beneficial for soft tissue as it mainly consists of materials of low atomic number (C, O and H). From Figure 2(b) we also see that except for the lowest atomic numbers the cross section ratio increases with energy (Jensen 2010).
Fig. 2. Refractive index. (a) The real part (δ) and the imaginary (β) part of the refractive index per mass unit are plotted for various elements at various energies. (b) The ratio between the phase-shift and the absorption cross sections is plotted for various elements at various
energies. Note that the ratio is between 102 −104 for these low Z elements, and except for the lowest atomic number this ratio increases with energy. Figure adapted from (Jensen 2010).
4. Several phase contrast imaging methods
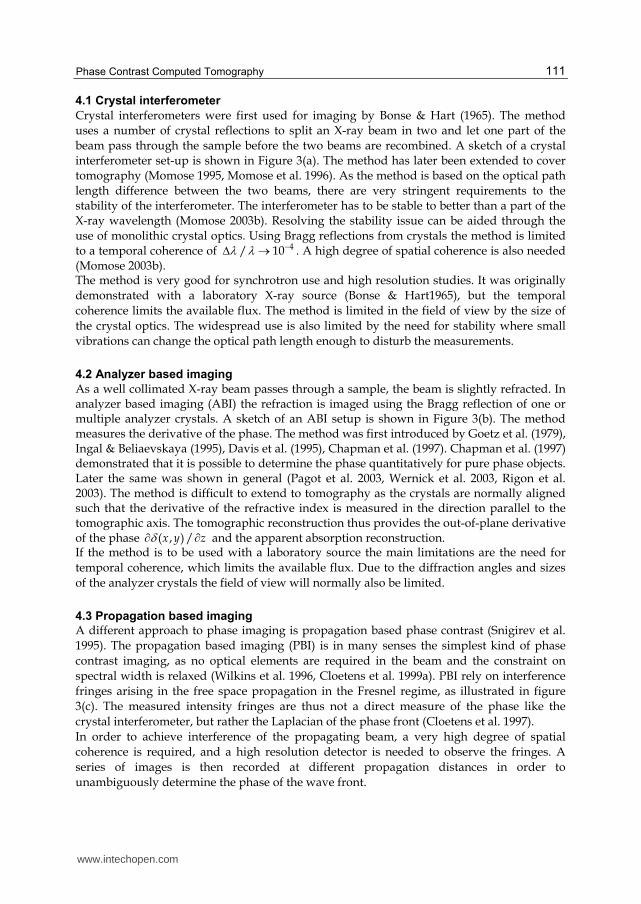
Above we see how the derivative of the phase could be determined by measuring the change in direction of the X-rays. To determine the phase shift one method is thus to measure the change in direction of the X-rays. There currently exist several ways to probe this change, depicted in figure 3. In the following we will introduce them briefly.
Fig. 3. Schematic drawing of several phase contrast imaging methods. Figure adapted from (Bech 2009).
www.intechopen.com
Phase Contrast Computed Tomography
111
4.1 Crystal interferometer
Crystal interferometers were first used for imaging by Bonse & Hart (1965). The method uses a number of crystal reflections to split an X-ray beam in two and let one part of the beam pass through the sample before the two beams are recombined. A sketch of a crystal interferometer set-up is shown in Figure 3(a). The method has later been extended to cover tomography (Momose 1995, Momose et al. 1996). As the method is based on the optical path length difference between the two beams, there are very stringent requirements to the stability of the interferometer. The interferometer has to be stable to better than a part of the X-ray wavelength (Momose 2003b). Resolving the stability issue can be aided through the use of monolithic crystal optics. Using Bragg reflections from crystals the method is limited to a temporal coherence of 4/ 10 . A high degree of spatial coherence is also needed (Momose 2003b). The method is very good for synchrotron use and high resolution studies. It was originally
demonstrated with a laboratory X-ray source (Bonse & Hart1965), but the temporal
coherence limits the available flux. The method is limited in the field of view by the size of
the crystal optics. The widespread use is also limited by the need for stability where small
vibrations can change the optical path length enough to disturb the measurements.
4.2 Analyzer based imaging
As a well collimated X-ray beam passes through a sample, the beam is slightly refracted. In analyzer based imaging (ABI) the refraction is imaged using the Bragg reflection of one or multiple analyzer crystals. A sketch of an ABI setup is shown in Figure 3(b). The method measures the derivative of the phase. The method was first introduced by Goetz et al. (1979), Ingal & Beliaevskaya (1995), Davis et al. (1995), Chapman et al. (1997). Chapman et al. (1997) demonstrated that it is possible to determine the phase quantitatively for pure phase objects. Later the same was shown in general (Pagot et al. 2003, Wernick et al. 2003, Rigon et al. 2003). The method is difficult to extend to tomography as the crystals are normally aligned such that the derivative of the refractive index is measured in the direction parallel to the tomographic axis. The tomographic reconstruction thus provides the out-of-plane derivative of the phase ( , ) /x y z and the apparent absorption reconstruction. If the method is to be used with a laboratory source the main limitations are the need for
temporal coherence, which limits the available flux. Due to the diffraction angles and sizes
of the analyzer crystals the field of view will normally also be limited.
4.3 Propagation based imaging
A different approach to phase imaging is propagation based phase contrast (Snigirev et al.
1995). The propagation based imaging (PBI) is in many senses the simplest kind of phase
contrast imaging, as no optical elements are required in the beam and the constraint on
spectral width is relaxed (Wilkins et al. 1996, Cloetens et al. 1999a). PBI rely on interference
fringes arising in the free space propagation in the Fresnel regime, as illustrated in figure
3(c). The measured intensity fringes are thus not a direct measure of the phase like the
crystal interferometer, but rather the Laplacian of the phase front (Cloetens et al. 1997).
In order to achieve interference of the propagating beam, a very high degree of spatial
coherence is required, and a high resolution detector is needed to observe the fringes. A
series of images is then recorded at different propagation distances in order to
unambiguously determine the phase of the wave front.
www.intechopen.com
Computed Tomography – Clinical Applications
112
This method is particularly good at edge enhancement, and is hence well suited for e.g. fiber samples, foam or localization of non-homogeneity in metals (Cloetens et al. 1999b) also in tomography setup. But for imaging of soft tissue and small density variations this method is not optimal (Nesterets & Wilkins 2008).
4.4 Grating based imaging
Grating based imaging (GBI) or shearing interferometer is a fourth approach to phase contrast imaging (Clauser 1998). It is related to the crystal interferometer in the sense that it consists of a beam splitter and a beam analyzer, and GBI is related to ABI by the fact that the first derivative of the phase front is measured. GBI has previously been applied to visible light phase contrast (Lohmann & Silva 1971), and has recently been applied to X-ray imaging as well (David et al. 2002, Momose et al. 2003a, Pfeiffer et al. 2006). The beam splitter grating splits the beam by diffraction, but the diffraction orders are separated by less than a milli-radian, and the diffracted beams are hence not spatially separated, but will interfere to create an intensity pattern downstream of the beam-splitter at a distance defined by the Talbot effect (Talbot 1836, Weitkamp et al. 2005), see figure 3(d). Refraction in a sample is measured by detecting the transverse shift of the interference pattern with a high resolution detector or an analyzer grating. Tomographic reconstruction of the differential phase is possible even without initial integration to retrieve the quantitative phase shift (Pfeiffer et al. 2007), and this kind of tomographic reconstruction has turned out to be an advantage to local tomography (Pfeiffer et al. (2008)).
5. Phase contrast computed tomography
The quantity that serves as imaging information is not the distribution function of the real part of the refractive index, but its projection along the propagation direction of X-ray beam. In
order to implement the quantitative analysis, should be reconstructed from the measured
projections. Phase contrast computed tomography consequently appears as the result of the
efforts to combine phase contrast imaging with computed tomography. There are mainly three
kinds of PC-CT which are based on ABI, PBI and GBI. In the following we will present them.
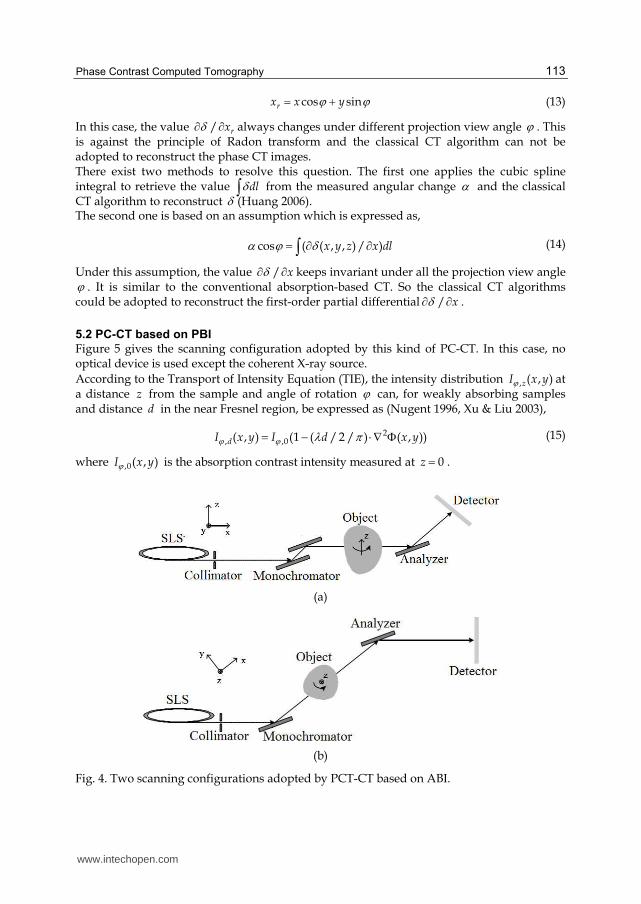
5.1 PC-CT based on ABI This kind of PC-CT adopts two scanning configurations to acquire phase projection data, depicted in figure 4. In the case of figure 4(a), the incidence direction of X-ray is parallel to lattice plane. The angular change in the direction is given as,
( ( , , ) / )x y z z dl (11)
In this case, the value / z keeps invariant under all the projection view angle. It is similar to the conventional absorption-based CT. So the classical CT algorithms could be adopted to reconstruct the distribution of / z , such as filtered back-projection algorithm (FBP) and algebraic reconstruction technique (ART). In the case of figure 4(b), the incidence direction of X-ray is perpendicular to lattice plane. The angular change in the direction is given as,
( / )rx dl (12)
www.intechopen.com
Phase Contrast Computed Tomography
113
cos sinrx x y (13)
In this case, the value / rx always changes under different projection view angle . This is against the principle of Radon transform and the classical CT algorithm can not be adopted to reconstruct the phase CT images. There exist two methods to resolve this question. The first one applies the cubic spline integral to retrieve the value dl from the measured angular change and the classical CT algorithm to reconstruct (Huang 2006). The second one is based on an assumption which is expressed as,
cos ( ( , , ) / )x y z x dl (14)
Under this assumption, the value / x keeps invariant under all the projection view angle . It is similar to the conventional absorption-based CT. So the classical CT algorithms could be adopted to reconstruct the first-order partial differential / x .
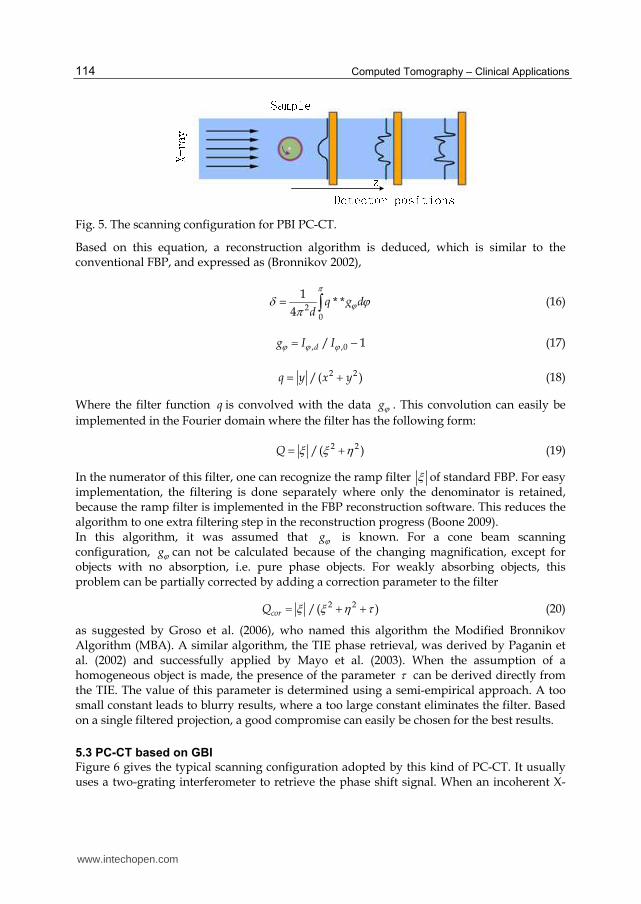
5.2 PC-CT based on PBI
Figure 5 gives the scanning configuration adopted by this kind of PC-CT. In this case, no optical device is used except the coherent X-ray source.
According to the Transport of Intensity Equation (TIE), the intensity distribution , ( , )zI x y at a distance z from the sample and angle of rotation can, for weakly absorbing samples and distance d in the near Fresnel region, be expressed as (Nugent 1996, Xu & Liu 2003),
2, ,0( , ) (1 ( / 2 / ) ( , ))dI x y I d x y (15)
where ,0( , )I x y is the absorption contrast intensity measured at 0z .
(a)
(b)
Fig. 4. Two scanning configurations adopted by PCT-CT based on ABI.
www.intechopen.com
Computed Tomography – Clinical Applications
114
Fig. 5. The scanning configuration for PBI PC-CT.
Based on this equation, a reconstruction algorithm is deduced, which is similar to the conventional FBP, and expressed as (Bronnikov 2002),
2
0
1* *
4q g d
d
(16)
, ,0/ 1dg I I (17)
2 2/( )q y x y (18)
Where the filter function q is convolved with the data g . This convolution can easily be
implemented in the Fourier domain where the filter has the following form:
2 2/( )Q (19)
In the numerator of this filter, one can recognize the ramp filter of standard FBP. For easy implementation, the filtering is done separately where only the denominator is retained, because the ramp filter is implemented in the FBP reconstruction software. This reduces the algorithm to one extra filtering step in the reconstruction progress (Boone 2009). In this algorithm, it was assumed that g is known. For a cone beam scanning configuration, g can not be calculated because of the changing magnification, except for objects with no absorption, i.e. pure phase objects. For weakly absorbing objects, this problem can be partially corrected by adding a correction parameter to the filter
2 2/( )corQ (20)
as suggested by Groso et al. (2006), who named this algorithm the Modified Bronnikov Algorithm (MBA). A similar algorithm, the TIE phase retrieval, was derived by Paganin et al. (2002) and successfully applied by Mayo et al. (2003). When the assumption of a homogeneous object is made, the presence of the parameter can be derived directly from the TIE. The value of this parameter is determined using a semi-empirical approach. A too small constant leads to blurry results, where a too large constant eliminates the filter. Based on a single filtered projection, a good compromise can easily be chosen for the best results.
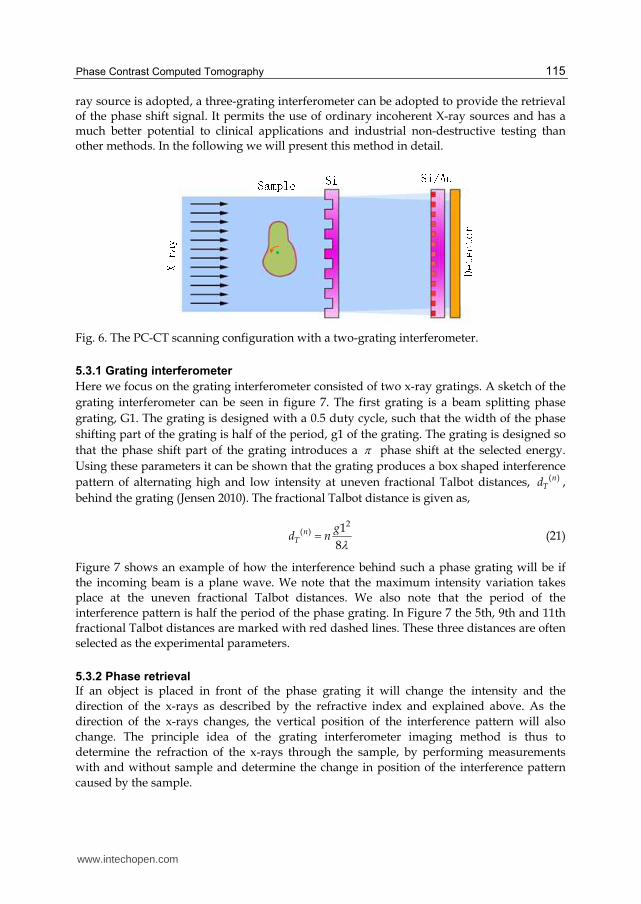
5.3 PC-CT based on GBI
Figure 6 gives the typical scanning configuration adopted by this kind of PC-CT. It usually uses a two-grating interferometer to retrieve the phase shift signal. When an incoherent X-
www.intechopen.com
Phase Contrast Computed Tomography
115
ray source is adopted, a three-grating interferometer can be adopted to provide the retrieval of the phase shift signal. It permits the use of ordinary incoherent X-ray sources and has a much better potential to clinical applications and industrial non-destructive testing than other methods. In the following we will present this method in detail.
Fig. 6. The PC-CT scanning configuration with a two-grating interferometer.
5.3.1 Grating interferometer
Here we focus on the grating interferometer consisted of two x-ray gratings. A sketch of the
grating interferometer can be seen in figure 7. The first grating is a beam splitting phase
grating, G1. The grating is designed with a 0.5 duty cycle, such that the width of the phase
shifting part of the grating is half of the period, g1 of the grating. The grating is designed so
that the phase shift part of the grating introduces a phase shift at the selected energy.
Using these parameters it can be shown that the grating produces a box shaped interference
pattern of alternating high and low intensity at uneven fractional Talbot distances, ( )nTd ,
behind the grating (Jensen 2010). The fractional Talbot distance is given as,
2
( ) 1
8n
T
gd n (21)
Figure 7 shows an example of how the interference behind such a phase grating will be if
the incoming beam is a plane wave. We note that the maximum intensity variation takes
place at the uneven fractional Talbot distances. We also note that the period of the
interference pattern is half the period of the phase grating. In Figure 7 the 5th, 9th and 11th
fractional Talbot distances are marked with red dashed lines. These three distances are often
selected as the experimental parameters.
5.3.2 Phase retrieval
If an object is placed in front of the phase grating it will change the intensity and the
direction of the x-rays as described by the refractive index and explained above. As the
direction of the x-rays changes, the vertical position of the interference pattern will also
change. The principle idea of the grating interferometer imaging method is thus to
determine the refraction of the x-rays through the sample, by performing measurements
with and without sample and determine the change in position of the interference pattern
caused by the sample.
www.intechopen.com
Computed Tomography – Clinical Applications
116
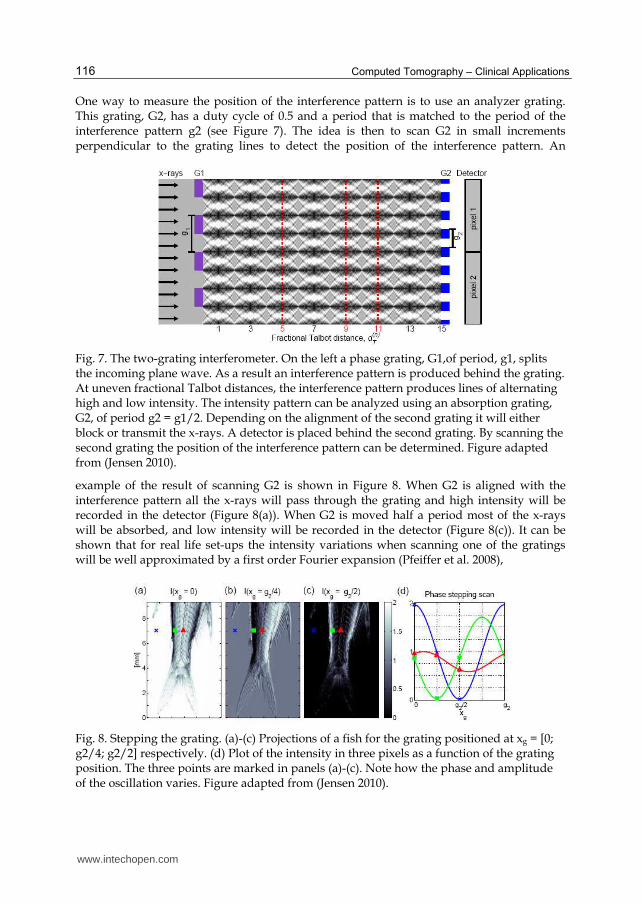
One way to measure the position of the interference pattern is to use an analyzer grating. This grating, G2, has a duty cycle of 0.5 and a period that is matched to the period of the interference pattern g2 (see Figure 7). The idea is then to scan G2 in small increments perpendicular to the grating lines to detect the position of the interference pattern. An
Fig. 7. The two-grating interferometer. On the left a phase grating, G1,of period, g1, splits the incoming plane wave. As a result an interference pattern is produced behind the grating. At uneven fractional Talbot distances, the interference pattern produces lines of alternating high and low intensity. The intensity pattern can be analyzed using an absorption grating, G2, of period g2 = g1/2. Depending on the alignment of the second grating it will either block or transmit the x-rays. A detector is placed behind the second grating. By scanning the second grating the position of the interference pattern can be determined. Figure adapted from (Jensen 2010).
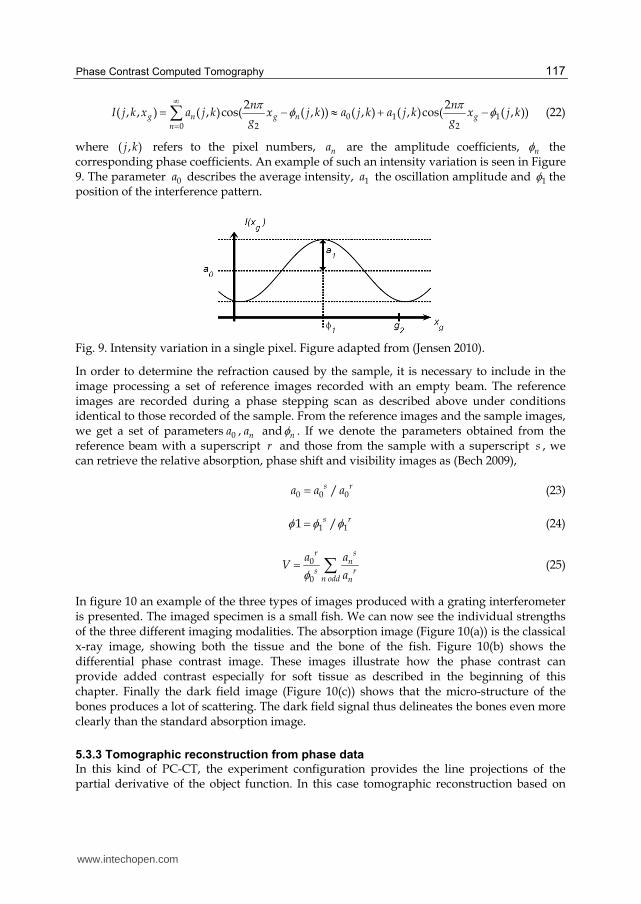
example of the result of scanning G2 is shown in Figure 8. When G2 is aligned with the interference pattern all the x-rays will pass through the grating and high intensity will be recorded in the detector (Figure 8(a)). When G2 is moved half a period most of the x-rays will be absorbed, and low intensity will be recorded in the detector (Figure 8(c)). It can be shown that for real life set-ups the intensity variations when scanning one of the gratings will be well approximated by a first order Fourier expansion (Pfeiffer et al. 2008),
Fig. 8. Stepping the grating. (a)-(c) Projections of a fish for the grating positioned at xg = [0; g2/4; g2/2] respectively. (d) Plot of the intensity in three pixels as a function of the grating position. The three points are marked in panels (a)-(c). Note how the phase and amplitude of the oscillation varies. Figure adapted from (Jensen 2010).
www.intechopen.com
Phase Contrast Computed Tomography
117
0 1 12 20
2 2( , , ) ( , )cos( ( , )) ( , ) ( , )cos( ( , ))g n g n g
n
n nI j k x a j k x j k a j k a j k x j k
g g
(22)
where ( , )j k refers to the pixel numbers, na are the amplitude coefficients, n the corresponding phase coefficients. An example of such an intensity variation is seen in Figure 9. The parameter 0a describes the average intensity, 1a the oscillation amplitude and 1 the position of the interference pattern.
Fig. 9. Intensity variation in a single pixel. Figure adapted from (Jensen 2010).
In order to determine the refraction caused by the sample, it is necessary to include in the image processing a set of reference images recorded with an empty beam. The reference images are recorded during a phase stepping scan as described above under conditions identical to those recorded of the sample. From the reference images and the sample images, we get a set of parameters 0a , na and n . If we denote the parameters obtained from the reference beam with a superscript r and those from the sample with a superscript s , we can retrieve the relative absorption, phase shift and visibility images as (Bech 2009),
0 0 0/s ra a a (23)
1 11 /s r (24)
0
0
r sn
s rn odd n
a aV
a (25)
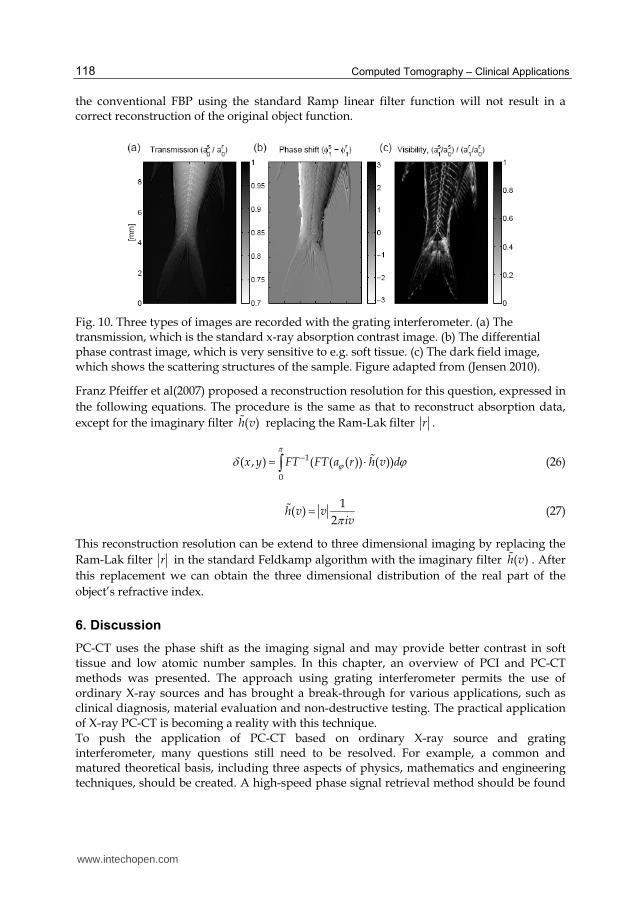
In figure 10 an example of the three types of images produced with a grating interferometer is presented. The imaged specimen is a small fish. We can now see the individual strengths of the three different imaging modalities. The absorption image (Figure 10(a)) is the classical x-ray image, showing both the tissue and the bone of the fish. Figure 10(b) shows the differential phase contrast image. These images illustrate how the phase contrast can provide added contrast especially for soft tissue as described in the beginning of this chapter. Finally the dark field image (Figure 10(c)) shows that the micro-structure of the bones produces a lot of scattering. The dark field signal thus delineates the bones even more clearly than the standard absorption image.
5.3.3 Tomographic reconstruction from phase data
In this kind of PC-CT, the experiment configuration provides the line projections of the partial derivative of the object function. In this case tomographic reconstruction based on
www.intechopen.com
Computed Tomography – Clinical Applications
118
the conventional FBP using the standard Ramp linear filter function will not result in a correct reconstruction of the original object function.
Fig. 10. Three types of images are recorded with the grating interferometer. (a) The transmission, which is the standard x-ray absorption contrast image. (b) The differential phase contrast image, which is very sensitive to e.g. soft tissue. (c) The dark field image, which shows the scattering structures of the sample. Figure adapted from (Jensen 2010).
Franz Pfeiffer et al(2007) proposed a reconstruction resolution for this question, expressed in
the following equations. The procedure is the same as that to reconstruct absorption data,
except for the imaginary filter ( )h v replacing the Ram-Lak filter r .
1
0
( , ) ( ( ( )) ( ))x y FT FT a r h v d
(26)
1
( )2
h v viv (27)
This reconstruction resolution can be extend to three dimensional imaging by replacing the
Ram-Lak filter r in the standard Feldkamp algorithm with the imaginary filter ( )h v . After
this replacement we can obtain the three dimensional distribution of the real part of the
object’s refractive index.
6. Discussion PC-CT uses the phase shift as the imaging signal and may provide better contrast in soft tissue and low atomic number samples. In this chapter, an overview of PCI and PC-CT methods was presented. The approach using grating interferometer permits the use of ordinary X-ray sources and has brought a break-through for various applications, such as clinical diagnosis, material evaluation and non-destructive testing. The practical application of X-ray PC-CT is becoming a reality with this technique. To push the application of PC-CT based on ordinary X-ray source and grating interferometer, many questions still need to be resolved. For example, a common and matured theoretical basis, including three aspects of physics, mathematics and engineering techniques, should be created. A high-speed phase signal retrieval method should be found
www.intechopen.com
Phase Contrast Computed Tomography
119
to reduce the exposure time and improve the efficiency. The fabrication technique of gratings should be developed to decrease the cost and improve the manufacture capability. Additionally, PC-CT should be also combined with other visible light imaging methods to improve further the imaging resolution and contrast. We believe that nanometre resolution PC-CT will appear in several years.
7. Acknowledgment
Special thanks to Prof. Franz Pfeiffer and Dr. Martin Bech at the department of physics in Technische Universität München (TUM), Munich, German, for introducing me to the field and for the many shared valuable discussion, and experiments. I acknowledge support from National Natural Science Foundation of China (50875013), China Beijing municipal natural science foundation (4102036), Beijing NOVA program (2009A09) and Beijing University of Aeronautics and Astronautics young scholar cultivation program (YWF-11-03-Q-043).
8. References
Bech, M. (2009). PhD thesis, X-ray imaging with a grating interferometer, University of
Copenhagen.
Bonse, U. & Hart, M. (1965). An x-ray interferometer, Applied Physics Letters, Vol. 6, No.8,
(April 1965), pp.155-156, ISSN 0003-6951.
Boone, M., Witte, Y. De, Dierick, M., Bulcke, J. Van den, Vlassenbroeck, J. & Hoorebeke, L.
Van. (2009). Practical use of the Modi_ed Bronnikov Algorithm in micro-CT,
Nuclear Instruments and Methods in Physics Research Section B, Vol.267, No.7, (April
2009), pp.1182-1186, ISSN 0168-583X.
Bronnikov, A. V. (2002). Theory of quantitative phase-contrast computed tomography,
Journal of the Optical Society of America A, Vol.19, No.3, (March 2002), pp.472-480,
ISSN 1084-7529.
Clauser, J. F. (1998). Us patent No. 5,812,629: Ultrahigh resolution interferometric x-ray
imaging.
Chapman, D., Thomlinson, W., Johnston, R. E., Washburn, D., Pisano, E., Gmur, N., Zhong,
Z., Menk, R., Arfelli, F. & Sayers, D. (1997). Diffraction enhanced x-ray imaging,
Physics in Medicine and Biology, V ol.42, No.11, (May 1997), pp.2015-2025, ISSN
0031-9155.
Cloetens, P., Ludwig, W., Baruchel, J., Dyck, D. V., Landuyt, J. V., Guigay, J.-P. & Schlenker,
M. (1999a). Holotomography: Quantitative phase tomography with micrometer
resolution using hard synchrotron radiation xrays, Applied Physics Letters, Vol. 75,
No.19, (September 1999), pp.2912-2914, ISSN 0003-6951.
Cloetens, P., Ludwig, W., Baruchel, J., Guigay, J.-P., Pernot-Rejmankova, P., Salome-Pateyron, M., Schlenker, M., Buffierec, J.-Y., Maire, E. & Peix, G. (1999b). Hard x-ray phase imaging using simple propagation of a coherent synchrotron radiation beam, Journal of Physics D: Applied Physics, Vol.32, No. 10A, (January 1999), pp.A145-A151, ISSN 0022-3727.
www.intechopen.com
Computed Tomography – Clinical Applications
120
Cloetens, P., Pateyron-Salome, M., Buffiere, J.Y., Peix, G., Baruchel, J., Peyrin, F. & Schlenker,
M. (1997). Observation of microstructure and damage in materials by phase
sensitive radiography and tomography, Journal of Applied Physics, Vol. 81, No.9,
(May 1997), pp.5878-5886, ISSN 0021-8979.
Davis, T. J., Gao, D., Gureyev, T. E., Stevenson, A. W. & Wilkins, S. W. (1995). Phase-contrast
imaging of weakly absorbing materials using hard x-rays, Nature, Vol.373,
(February 1995), pp.595-598, ISSN 0028-0836.
David, C., Nohammer, B., Solak, H. H. & Ziegler, E. (2002). Differential x-ray phase contrast
imaging using a shearing interferometer, Applied Physics Letters, Vol.81, No.17,
(October 2002), pp.3287-3289, ISSN 0003-6951.
Goetz, K., Kalashnikov, M. P., Mikhailov, Y. A., Sklizkov, G. V., Fedotov,S. I., Foerster,
E. & Zaumseil, P. (1979). Measurements of the parameters of shell targets for
laser thermonuclear fusion using an x-ray schlieren method, Soviet
Journal of Quantum Electronics, Vol.9, No.5, (May 1979), pp.607-610, ISSN 0049-
1748.
Groso, A., Abela, R. & Stampanoni, M. (2006). Implementation of a fast method for high
resolution phase contrast tomography, Optics Express, Vol.14, No.18, (September
2006), pp.8103-8110, ISSN 1094-4087.
Henke, B. L., Gullikson, E. M. & Davis, J. C. (1993). X-ray interactions: photoabsorption,
scattering, transmission, and reflection at E=50-30000eV, Z=1-92, Atomic
Data and Nuclear Data Tables, Vol. 54, No.2, (July 1993), pp.181-342, ISSN 0092-
640X.
Huang Z. F. (2006). PhD thesis, Research on extraction methods of phase information and CT
reconstruction algorithms in diffraction enhanced imaging, Tsinghua University.
Ingal, V. & Beliaevskaya, E. (1995). X-ray plane-wave topography observation of the phase
contrast from a non-crystalline object, Journal of Physics D: Applied Physics, Vol.28,
No.11, (May 1995), pp.2314-2317, ISSN 0022-3727.
Jensen, T. H. (2010). PhD thesis, Refraction and scattering based x-ray imaging, University of
Copenhagen.
Lohmann, A. W. & Silva, D. E. (1971). An interferometer based on the talbot effect, Optics
Communications, Vol.2, No.9, (1971), pp.413-415, ISSN 0030-4018.
Mayo, S. C., Davis, T., Gureyev, T. E., Miller, P. R., Paganin, D., Pogany, A., Stevenson, A.
&Wilkins, S.(2003). X-ray phase-contrast microscopy and microtomography, Optics
Express, Vo.11, No.19, (September 2003), pp.2289-2302, ISSN 1094-4087.
Momose, A. (1995). Demonstration of phase-contrast x-ray computed tomography using an
x-ray interferometer, Nuclear Instruments and Methods in Physics Research Section A,
No.352, No.3, (January 1995), pp.622-628, ISSN 0168-9002.
Momose, A. (2003b). Phase-sensitive imaging and phase tomography using x-ray
interferometers, Optics Express, Vol.11, No. 19, (September 2003), pp.2303–2314,
ISSN 1094-4087.
Momose, A., Kawamoto, S., Koyama, I., Hamaishi, Y., Takai, K. & Suzuki, Y. (2003a).
Demonstration of x-ray talbot interferometry, Japanese Journal of Applied Physics,
Vol.42, No.7B, (Seven 2003), pp.L866-L868, ISSN 0021-4922.
www.intechopen.com
Phase Contrast Computed Tomography
121
Momose, A., Takeda, T., Itai, Y. & Hirano, K. (1996). Phase-contrast x-ray computed
tomography for observing biological soft tissues, Nature Medicine, No.2, No.4,
(April 1996), pp.473-475, ISSN 1078-8956.
Nesterets, Y. I. & Wilkins, S. W. (2008). Phase-contrast imaging using a scanning-double-grating configuration, Optics Express, Vol.16, No.8, (April 2008), pp.5849-5867, ISSN 1094-4087.
Nugent, K. A., Gureyev, T. E., Cookson, D. F., Paganin, D. & Barnea, Z. (1996). Quantitative Phase Imaging Using Hard X Rays, Physical Review Letters, Vol.77, (September 1996), pp.2961-2964, ISSN 0031-9007.
Paganin, D., Mayo, S. C., Gureyev, T. E., Miller, P. R. &Wilkins, S. W. (2002). Simultaneous phase and amplitude extraction from a single defocused image of a homogeneous object, Journal of Microscopy, Vol.206, (April 2002), pp.33-40, ISSN 0022-2720 .
Pagot, E., Cloetens, P., Fiedler, S., Bravin, A., Coan, P., Baruchel, J., Hartwig, J. & Thomlinson, W. (2003). A method to extract quantitative information in analyzer-based x-ray phase contrast imaging, Applied Physics Letter, Vol.82, No.20, (October 2003), pp.3421-3423, ISSN 0003-6951.
Pfeiffer, F., David, C., Bunk, O., Donath, T., Bech, M., Duc, G. L., Bravin, A. & Cloetens, P. (2008). Region-of-interest tomography for gratingbased x-ray differential phase-contrast imaging, Physical Review Letters, Vol.101, (October 2008), pp.168101, ISSN 0031-9007.
Pfeiffer, F., Kottler, C., Bunk, O. & David, C. (2007). Hard x-ray phase tomography with low-brilliance sources, Physical Review Letters, Vol.98, (March 2007), pp.108105, ISSN 0031-9007.
Pfeiffer, F., Weitkamp, T., Bunk, O. & David, C. (2006). Phase retrieval and diffrential phase-contrast imaging with low-brilliance x-ray sources, Nature Physics, Vol.2, No.4, (March 2006), pp.258-261, ISSN 1745-2473.
Rigon, L., Besch, H. J., Arfelli, F., Menk, R. H., Heitner, G. & Plothow-Besch, H. (2003). A new DEI algorithm capable of investigating sub-pixel structures, Journal of Physics D: Applied Physics, Vol.36, No.10A, (May 2003), pp.A107-A112, ISSN 0022-3727.
Snigirev, A., Snigireva, I., Kohn, V., Kuznetsov, S. & Schelokov, I. (1995). On the possibilities of x-ray phase contrast microimaging by coherent high energy synchrotron radiation, Review of Scientific Instruments, Vol.66, No.12, (November 1995), pp.5486-5492, ISSN 0034-6748.
Talbot, H. F. (1836). Facts relating to optical science, Philosophical Magazine, Vol.9, No.56, pp.401-407, ISSN 19415966.
Weitkamp, T., Diaz, A., David, C., Pfeiffer, F., Stampanoni, M., Cloetens, P. & Ziegler, E. (2005). X-ray phase imaging with a grating interferometer, Optics Express, Vol.13, No.16, (August 2005), pp.6296-6304, ISSN 1094-4087.
Wernick, M. N., Wirjadi, O., Chapman, D., Zhong, Z., Galatsanos, N. P., Yang, Y., Brankov, J. G., Oltulu, O., Anastasio, M. A. & Muehleman, C. (2003). Multiple-image radiography, Physics in Medicine and Biology, Vol.48, No.23, (December 2003), pp.3875-3895, ISSN 0031-9155.
Wilkins, S. W., Gureyev, T. E., Gao, D., Pogany, A. & Stevenson, A. W. (1996). Phase-contrast imaging using polychromatic hard x-rays, Nature, Vol.384, (November 1996), pp.335-337, ISSN 0028-0836.
www.intechopen.com
Computed Tomography – Clinical Applications
122
Wu, X. & Liu, H. (2003). A general theoretical formalism for X-ray phase contrast imaging, Journal of X-Ray Science and Technology, Vol.11, No.1, (January 2003), pp.33-42, ISSN 0895-3996.
www.intechopen.com
Computed Tomography - Clinical ApplicationsEdited by Dr. Luca Saba
ISBN 978-953-307-378-1Hard cover, 342 pagesPublisher InTechPublished online 05, January, 2012Published in print edition January, 2012
InTech EuropeUniversity Campus STeP Ri Slavka Krautzeka 83/A 51000 Rijeka, Croatia Phone: +385 (51) 770 447 Fax: +385 (51) 686 166www.intechopen.com
InTech ChinaUnit 405, Office Block, Hotel Equatorial Shanghai No.65, Yan An Road (West), Shanghai, 200040, China
Phone: +86-21-62489820 Fax: +86-21-62489821
Computed Tomography (CT), and in particular multi-detector-row computed tomography (MDCT), is apowerful non-invasive imaging tool with a number of advantages over the others non- invasive imagingtechniques. CT has evolved into an indispensable imaging method in clinical routine. It was the first method tonon-invasively acquire images of the inside of the human body that were not biased by superimposition ofdistinct anatomical structures. The first generation of CT scanners developed in the 1970s and numerousinnovations have improved the utility and application field of the CT, such as the introduction of helical systemsthat allowed the development of the "volumetric CT" concept. In this book we want to explore the applicationsof CT from medical imaging to other fields like physics, archeology and computer aided diagnosis. Recentlyinteresting technical, anthropomorphic, forensic and archeological as well as paleontological applications ofcomputed tomography have been developed. These applications further strengthen the method as a genericdiagnostic tool for non- destructive material testing and three-dimensional visualization beyond its medical use.
How to referenceIn order to correctly reference this scholarly work, feel free to copy and paste the following:
Fu Jian (2012). Phase Contrast Computed Tomography, Computed Tomography - Clinical Applications, Dr.Luca Saba (Ed.), ISBN: 978-953-307-378-1, InTech, Available from:http://www.intechopen.com/books/computed-tomography-clinical-applications/phase-contrast-computed-tomography

© 2012 The Author(s). Licensee IntechOpen. This is an open access articledistributed under the terms of the Creative Commons Attribution 3.0License, which permits unrestricted use, distribution, and reproduction inany medium, provided the original work is properly cited.


![W J R World Journal of Radiology...(GIT) in multi-detector computed tomography (CT) [multiple detector computed tomography (MDCT)] is administration of high-attenuation contrast agents](https://img.pdfslide.net/doc/110x75/5f055a8d7e708231d4128c03/w-j-r-world-journal-of-radiology-git-in-multi-detector-computed-tomography.jpg)