Embed Size (px)
Citation preview
Physics Letters A 376 (2012) 919–924
Contents lists available at SciVerse ScienceDirect
Physics Letters A
www.elsevier.com/locate/pla
Phase detection in an ultracold polarized Fermi gas via electromagneticallyinduced transparency
Lu Zhou ∗, Keye Zhang, Beilei Zhu, Yan Li, Weiping Zhang ∗
Quantum Institute for Light and Atoms, Department of Physics, East China Normal University, Shanghai 200062, China
a r t i c l e i n f o a b s t r a c t
Article history:Received 30 September 2011Received in revised form 9 January 2012Accepted 10 January 2012Available online 12 January 2012Communicated by P.R. Holland
Keywords:Polarized Fermi gasElectromagnetically induced transparency
An optical detection scheme based on electromagnetically induced transparency is proposed to investigatethe nature of Fermi pairing in a trapped strongly interacting two-component atomic Fermi gas withpopulation imbalance. We show that valuable information can be acquired from the in situ probeabsorption spectrum to identify different phases existing in the system.
© 2012 Elsevier B.V. All rights reserved.
1. Introduction
The experimental realization of ultracold degenerate atomicFermi gas, together with the unprecedented control over the in-teratomic interaction by the means of Feshbach resonance, haveprovided a powerful playground for the study of pairing and su-perfluidity. For a two-component Fermi gas with equal population,the pairing mechanism have been well understood since the pio-neering work of Bardeen, Cooper and Schrieffer (BCS) [1]. On theother hand, many recent investigations focused on polarized Fermigas with imbalanced spin populations, which is expected to shedlight on many different fields of physics, for example, magnetizedsuperconductors and QCD [2].
For a polarized Fermi gas, population imbalance together withthe resonant strong interaction have introduced a few non-BCS ex-otic superfluid phases into the system such as the inhomogeneousFulde–Ferrell–Larkin–Ovchinnikov (FFLO) state [3] with non-zero-momentum pairing and the breached-pair (BP) state [4] in whichthe particles are paired except for a finite region of momentumshell. Polarized Fermi gas is predicted to exhibit a far richer phasediagram than the equal spin case [5–12] and have been realizedin experiment [13–17]. In the presence of the trap, due to the ef-fective chemical potentials become space-dependent, spatial phaseseparation will take place. An important question is how to unam-biguously differentiate these different phases.
In previous experiment, people use phase-contrast imagingtechnique to map the phase diagram of a polarized Fermi gas [18].
* Corresponding authors. Tel.: +86 021 52706175.E-mail address: [email protected] (L. Zhou).
0375-9601/$ – see front matter © 2012 Elsevier B.V. All rights reserved.doi:10.1016/j.physleta.2012.01.015
In this detection scheme, by appropriately choosing the probe fre-quency, the probe light dispersively interacts with the two atomiccomponents simultaneously and results in a phase shift propor-tional to the density difference between the two atomic compo-nents. They use the discontinuity in the spin polarization pro-file as the signature for phase transition, which can only indicatethe first-order superfluid-to-normal phase transition. The higher-order phase transitions, such as that between the BCS superfluidand BP phase, is of at least third-order nature and cannot be de-tected.
In order to clearly identify different superfluid phases, onewill have to go beyond first-order density–density correlation togain pairing information. This is the idea lies at the heart ofearly proposals on the optical detection of BCS phase transition[19–21] as well as other methods used to study strongly interact-ing atomic Fermi gases such as the spatial noise correlations [22],the momentum-resolved stimulated Raman technique [23–25] andradio-frequency (RF) spectroscopy [26–30].
In this work we discuss the application of an alternative de-tection scheme based on electromagnetically induced transparency(EIT), which was proposed recently for the detection of BCS pair-ing [31], to detect various phases in a trapped polarized Fermi gas.The probe absorption spectrum for different quantum phases inthe system is studied. We demonstrate that, the probe spectra willdisplay unique properties for different phases, which can serve asthe proof for unambiguous phase discrimination.
Compared to the previous detection methods (absorption imag-ing or phase-contrast imaging), only one additional control lightfield is required for the EIT-based detection scheme. In themeanwhile, it is principally non-destructive and does not inducemuch heating of the atomic sample, which makes the continuous
920 L. Zhou et al. / Physics Letters A 376 (2012) 919–924
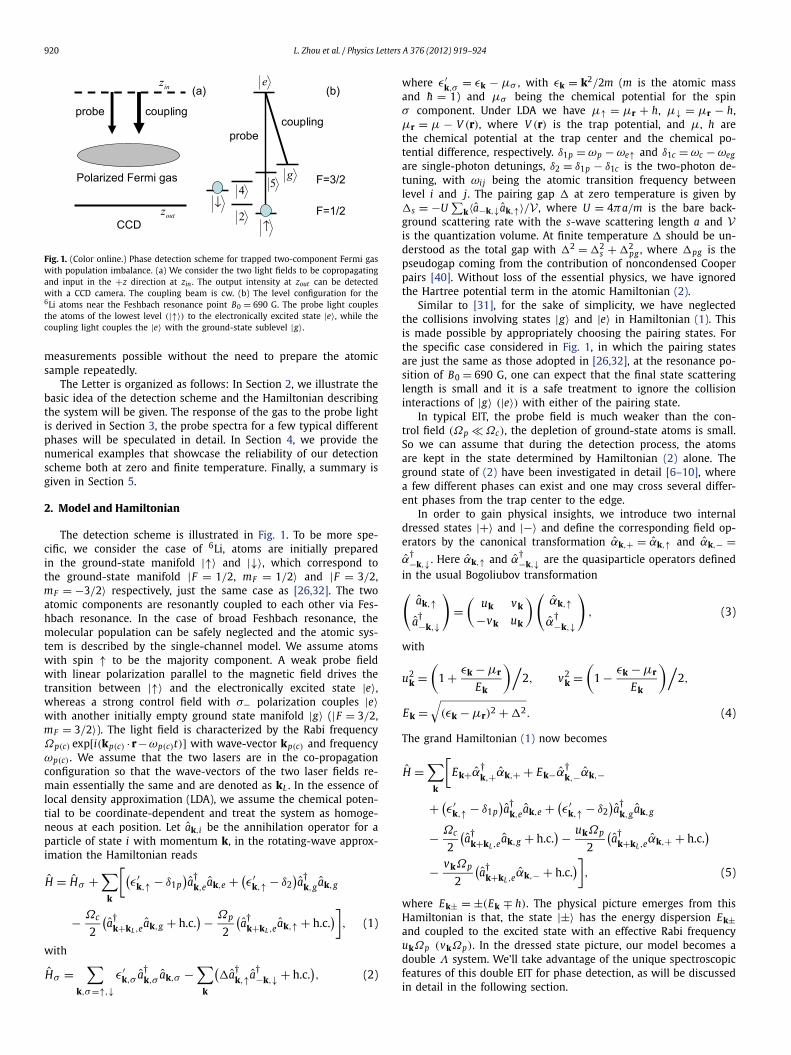
Fig. 1. (Color online.) Phase detection scheme for trapped two-component Fermi gaswith population imbalance. (a) We consider the two light fields to be copropagatingand input in the +z direction at zin . The output intensity at zout can be detectedwith a CCD camera. The coupling beam is cw. (b) The level configuration for the6Li atoms near the Feshbach resonance point B0 = 690 G. The probe light couplesthe atoms of the lowest level (|↑〉) to the electronically excited state |e〉, while thecoupling light couples the |e〉 with the ground-state sublevel |g〉.
measurements possible without the need to prepare the atomicsample repeatedly.
The Letter is organized as follows: In Section 2, we illustrate thebasic idea of the detection scheme and the Hamiltonian describingthe system will be given. The response of the gas to the probe lightis derived in Section 3, the probe spectra for a few typical differentphases will be speculated in detail. In Section 4, we provide thenumerical examples that showcase the reliability of our detectionscheme both at zero and finite temperature. Finally, a summary isgiven in Section 5.
2. Model and Hamiltonian
The detection scheme is illustrated in Fig. 1. To be more spe-cific, we consider the case of 6Li, atoms are initially preparedin the ground-state manifold |↑〉 and |↓〉, which correspond tothe ground-state manifold |F = 1/2, mF = 1/2〉 and |F = 3/2,mF = −3/2〉 respectively, just the same case as [26,32]. The twoatomic components are resonantly coupled to each other via Fes-hbach resonance. In the case of broad Feshbach resonance, themolecular population can be safely neglected and the atomic sys-tem is described by the single-channel model. We assume atomswith spin ↑ to be the majority component. A weak probe fieldwith linear polarization parallel to the magnetic field drives thetransition between |↑〉 and the electronically excited state |e〉,whereas a strong control field with σ− polarization couples |e〉with another initially empty ground state manifold |g〉 (|F = 3/2,mF = 3/2〉). The light field is characterized by the Rabi frequencyΩp(c) exp[i(kp(c) · r −ωp(c)t)] with wave-vector kp(c) and frequencyωp(c) . We assume that the two lasers are in the co-propagationconfiguration so that the wave-vectors of the two laser fields re-main essentially the same and are denoted as kL . In the essence oflocal density approximation (LDA), we assume the chemical poten-tial to be coordinate-dependent and treat the system as homoge-neous at each position. Let ak,i be the annihilation operator for aparticle of state i with momentum k, in the rotating-wave approx-imation the Hamiltonian reads
H = Hσ +∑
k
[(ε′
k,↑ − δ1p)a†
k,eak,e + (ε′
k,↑ − δ2)a†
k,gak,g
− Ωc
2
(a†
k+kL ,eak,g + h.c.
) − Ωp
2
(a†
k+kL ,eak,↑ + h.c.
)], (1)
with
Hσ =∑
ε′k,σ a†
k,σ ak,σ −∑(
�a†k,↑a†
−k,↓ + h.c.), (2)
k,σ=↑,↓ k
where ε′k,σ = εk − μσ , with εk = k2/2m (m is the atomic mass
and h = 1) and μσ being the chemical potential for the spinσ component. Under LDA we have μ↑ = μr + h, μ↓ = μr − h,μr = μ − V (r), where V (r) is the trap potential, and μ, h arethe chemical potential at the trap center and the chemical po-tential difference, respectively. δ1p = ωp − ωe↑ and δ1c = ωc − ωeg
are single-photon detunings, δ2 = δ1p − δ1c is the two-photon de-tuning, with ωi j being the atomic transition frequency betweenlevel i and j. The pairing gap � at zero temperature is given by�s = −U
∑k〈a−k,↓ak,↑〉/V , where U = 4πa/m is the bare back-
ground scattering rate with the s-wave scattering length a and Vis the quantization volume. At finite temperature � should be un-derstood as the total gap with �2 = �2
s + �2pg , where �pg is the
pseudogap coming from the contribution of noncondensed Cooperpairs [40]. Without loss of the essential physics, we have ignoredthe Hartree potential term in the atomic Hamiltonian (2).
Similar to [31], for the sake of simplicity, we have neglectedthe collisions involving states |g〉 and |e〉 in Hamiltonian (1). Thisis made possible by appropriately choosing the pairing states. Forthe specific case considered in Fig. 1, in which the pairing statesare just the same as those adopted in [26,32], at the resonance po-sition of B0 = 690 G, one can expect that the final state scatteringlength is small and it is a safe treatment to ignore the collisioninteractions of |g〉 (|e〉) with either of the pairing state.
In typical EIT, the probe field is much weaker than the con-trol field (Ωp � Ωc), the depletion of ground-state atoms is small.So we can assume that during the detection process, the atomsare kept in the state determined by Hamiltonian (2) alone. Theground state of (2) have been investigated in detail [6–10], wherea few different phases can exist and one may cross several differ-ent phases from the trap center to the edge.
In order to gain physical insights, we introduce two internaldressed states |+〉 and |−〉 and define the corresponding field op-erators by the canonical transformation αk,+ = αk,↑ and αk,− =α
†−k,↓ . Here αk,↑ and α
†−k,↓ are the quasiparticle operators defined
in the usual Bogoliubov transformation(ak,↑
a†−k,↓
)=
(uk vk
−vk uk
)(αk,↑α
†−k,↓
), (3)
with
u2k =
(1 + εk − μr
Ek
)/2, v2
k =(
1 − εk − μr
Ek
)/2,
Ek =√
(εk − μr)2 + �2. (4)
The grand Hamiltonian (1) now becomes
H =∑
k
[Ek+α
†k,+αk,+ + Ek−α
†k,−αk,−
+ (ε′
k,↑ − δ1p)a†
k,eak,e + (ε′
k,↑ − δ2)a†
k,gak,g
− Ωc
2
(a†
k+kL ,eak,g + h.c.
) − ukΩp
2
(a†
k+kL ,eαk,+ + h.c.
)− vkΩp
2
(a†
k+kL ,eαk,− + h.c.
)], (5)
where Ek± = ±(Ek ∓ h). The physical picture emerges from thisHamiltonian is that, the state |±〉 has the energy dispersion Ek±and coupled to the excited state with an effective Rabi frequencyukΩp (vkΩp). In the dressed state picture, our model becomes adouble Λ system. We’ll take advantage of the unique spectroscopicfeatures of this double EIT for phase detection, as will be discussedin detail in the following section.
L. Zhou et al. / Physics Letters A 376 (2012) 919–924 921
3. Probe absorption spectrum
In the presence of the control field, the probe light will see thetransparency window, as predicted by the theory of EIT [33]. Thetransparency window results from quantum interference and verysensitive to the two-photon resonance condition, which is momen-tum independent for normal Fermi gas. However when pairingemerges, this condition becomes momentum-dependent. This canresult in the unique property of probe absorption spectrum fordifferent phases, which serves as the key mechanism behind ourproposal for phase detection.
Assuming that the probe light is propagating along the z direc-tion, under slowly-varying envelop approximation the wave equa-tion can be written as [34]
∂Ωp
∂z+ 1
c
∂Ωp
∂t= −κΩp, (6)
with
κ = −iκ0
ΩpV∑k,q
⟨a†
q,↑ak+kL ,e⟩ei(k−q)·r. (7)
Here κ0 = μ0ωpc|μ↑e|2/h, where μ↑e is the |↑〉 → |e〉 transitiondipole moment.
Under the assumption that the ground-state population is onlyslightly affected by the probe light, one can derive from (3) and(5) that
a†k,↑(t) = ukαk,+e−iEk+t + vkαk,−e−iEk−t . (8)
On the other hand, we can have the equations of motion fromHamiltonian (1)
i∂
∂tak+kL ,e = (
ε′k+kL ,↑ − δ1p − iγ
)ak+kL ,e
− Ωc
2ak,g − Ωp
2ak,↑, (9a)
i∂
∂tak,g = (
ε′k,↑ − δ2
)ak,g − Ωc
2ak+kL ,e, (9b)
where we have phenomenologically introduced the decay rate γfor the excited state. Denote F( f (t)) as the frequency counterpartto f (t), performing Fourier transformation to Eq. (9), a straightfor-ward derivation will lead to
F(ak+kL ,e) = H(ω) ·F(Ωpak,↑/2), (10)
with the response function
H(ω) = ε′k,↑ − δ2 − ω
(ε′k+kL ,↑ − δ1p − iγ − ω)(ε′
k,↑ − δ2 − ω) − Ω2c /4
. (11)
If the control field Ωc is strong enough and γ is relatively small, itis a safe approximation for us to retain H(ω) up to the O(ω) term.Combine with Eq. (8), Eq. (10) can be recast in the time domain as
ak+kL ,e(t) = 1
2
[H(Ek+)ukαk,+e−iEk+t
+ H(Ek−)vkαk,−e−iEk−t]Ωp
+ i
2
[H ′(Ek+)ukαk,+e−iEk+t
+ H ′(Ek−)vkαk,−e−iEk−t]∂Ωp
∂t, (12)
where H ′(x) represents the first-order derivative of H(x) with re-spect to x. By considering that⟨α
†q,±αk,±
⟩ = f (Ek±)δq,k, 〈αq,±αk,∓〉 = 0,
where f (x) is the Fermi function. Then combine Eqs. (6), (7), (8)and (12) we can have
∂Ωp
∂z+ 1
c
∂Ωp
∂t= iK0Ωp − K1
∂Ωp
∂t, (13)
with
K0 = κ0
2V∑
k
[H(Ek+)u2
k f (Ek+) + H(Ek−)v2k f (Ek−)
], (14)
K1 = κ0
2V∑
k
[H ′(Ek+)u2
k f (Ek+) + H ′(Ek−)v2k f (Ek−)
]. (15)
Suppose we input a Gaussian pulse at z = 0 with width τ ,which means Ωp(0, t) = Ωp0 exp(−t2/τ 2), then by solving Eq. (13)one can obtain
Ωp(z, t) = Ωp0 exp
[iK0z − (t − z/v g)
τ 2
], (16)
where v g is the group velocity defined by 1/v g = 1/c +Re(K1) andK0 = φ + iα/2. In a two-color photoassociation scheme, the groupvelocity of the propagating light had been theoretically studied asa probe of Fermi pairing [35].
Eq. (14) explicitly gives the analytical expressions of the cor-responding phase shift per unit length φ and absorption coeffi-cient α. A simple glance at Eq. (14) will show that K0 is composedof two parts, one from state |+〉 with the spectra response func-tion H(Ek+) and quasiparticle density u2
k f (Ek+), while the othercontribution is from state |−〉 with the spectra response functionH(Ek−) and quasiparticle density v2
k f (Ek−). This is the result ofdouble EIT as we have analyzed in Section 2.
Based on Eq. (14), in the following we’ll discuss in detail whatinformation can be derived out from the probe light for a few typi-cal different phases which will exist in the trapped two-componentFermi gas with population imbalance, including the normal phase,BCS phase and BP phase. Here we neglect the FFLO phase whichis stable only within a narrow parameter window deep in theBCS region [36]. However, we should note here that this phase ismore favored in one-dimensional Fermi mixture [16,37,38], wherethe present LDA treatment will breakdown. One will then need tosolve this system with the Bogoliubov–de Gennes equations, thiswill be left for further investigation and not discussed here.
3.1. Normal phase
For the normal phase, the energy gap will vanish (� = 0),a straightforward derivation from Eq. (14) will lead to
K normal0 = κ0
2V∑
k
H(ε′
k,↑)
f(ε′
k,↑),
which is just the probe spectra for the normal Fermi gas withchemical potential μ↑ . One can then have the absorption coeffi-cient
α ∝ δ22
[δ2(δ2 + δ1c) − Ω2c /4]2 + γ 2δ2
2
,
under this situation the probe spectra will have a transparencywindow locate at δ2 = 0. When the system is on two photon reso-nance (δ2 = 0), one will have α = φ = 0.
3.2. BCS phase
For the conventional BCS phase, at zero temperature, sinceEk+ > 0 while Ek− < 0, we have f (Ek+) = 0 and f (Ek−) = 1. ThenEq. (14) will resort to
922 L. Zhou et al. / Physics Letters A 376 (2012) 919–924
K BCS0 = κ0
2V∑
k
H(Ek−)v2k,
the only contribution to the probe absorption spectrum comesfrom state |−〉. Then according to Eq. (11), for the probe absorp-tion spectra, the absorption peak will shift to δ2 = εk − μr + Ek ,which will be broadened due to Fermi–Dirac distribution of theatomic population.
By increasing the temperature below the BCS transition tem-perature, the contribution from state |+〉 will arise and becomemore and more prominent, in the meanwhile a left peak locatesat δ2 = εk − μr − Ek will appear. The probe spectra will exhibita double-peak structure. When the temperature continuously in-creases and exceeds the BCS transition temperature, we’ll go backto the normal EIT as discussed above. This can serve as the signa-ture for BCS pairing [31].
3.3. BP phase
Differing from the BCS phase, BP phase is a polarized super-fluid with gapless fermionic excitations. This phase is unique inthe sense that it is phase separated in the momentum space, whilein real space it is homogeneous. The only theoretically proved sta-ble BP phase appears on the BEC side of the Feshbach resonance,whose ground state at zero temperature can be written in termsof the original operators a†
k,↑ and a†−k,↓ and the vacuum state |0〉
as
|Ψ 〉BP =∏
|k|<kc
a†k,↑
∏|k|>kc
(uk + vka†
k,↑a†−k,↓
)|0〉, (17)
where kc is the critical momentum satisfies E |k|=kc+ = 0. When|k| < kc , we have Ek+ < 0, the smallest energy is reached whenthe modes with negative Ek+ are filled and the remaining modesare left empty, which results in the ground state (17).
At zero temperature, a simple derivation starts from Eq. (14)will lead to
K BP0 = κ0
V∑
|k|<kc
H(Ek+)u2k + κ0
V∑
k
H(Ek−)v2k. (18)
From the above equation one can see that K BP0 is composed of
two parts. One part consisting of quasiparticle excitation in theform of excess unpaired fermions, while the other consisting ofthe pairs forming the superfluid. This property is very similar tothe RF spectra [26] for the majority components. The probe ab-sorption spectrum will then display a double-peak structure, sinceonly the quasiparticles with the momentum |k| < kc contribute tothe left peak, this will result in a much narrower width of the leftpeak than the right peak. These properties possessed by the probespectra can serve as the proof to differentiate BP phase from thenormal phase and BCS phase.
At non-zero temperature, the main features of the probe spec-tra still persists. Our detection scheme will work extremely well atrelatively low temperature, which is the current experimental situ-ation [11]. When the temperature becomes relatively high, the BCSphase will also display a double-peak structure. To achieve an un-ambiguous signature of the BP phase, one will then still need toresort to the momentum resolved spectrum [23,25].
4. Numerical results and discussion
The properties of the atomic system are determined by thenumber equations
N↑ = 1
V
∫d3r
∑[u2
k f (Ek+) + v2k f (Ek−)
],
k
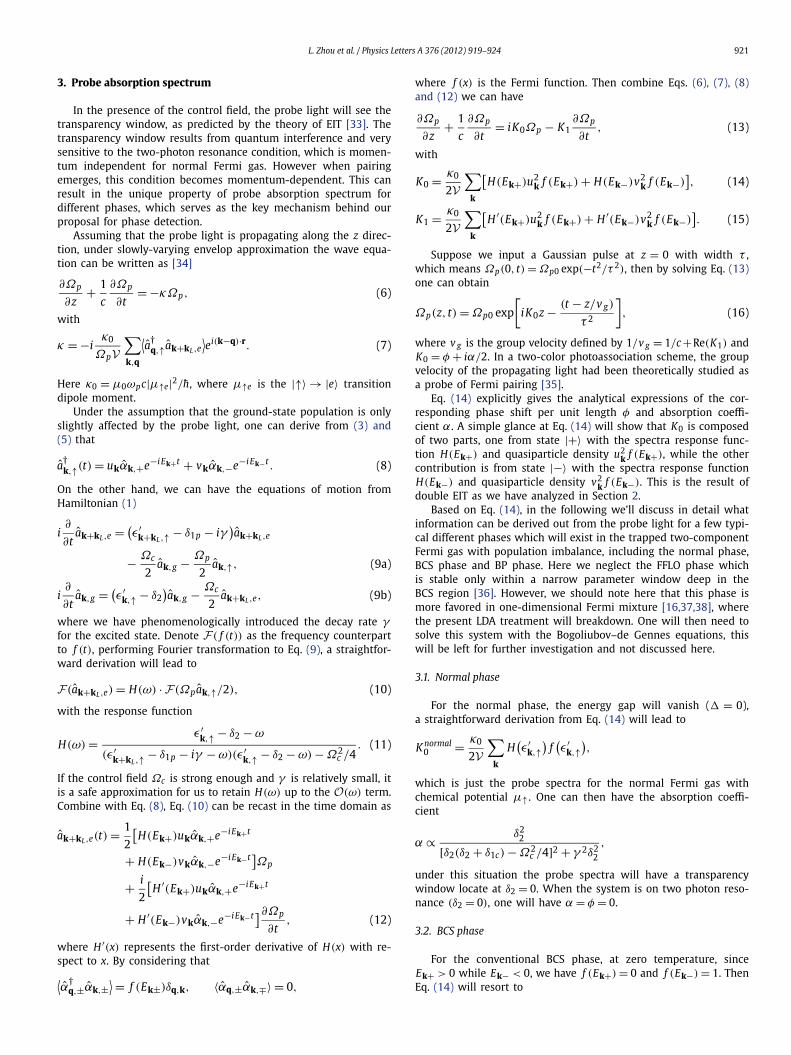
Fig. 2. (Color online.) Density profiles of imbalanced Fermi mixtures in a harmonictrap, calculated with the parameters T = 0, P = 0.2 and (a) 1/kF a = 0; (b) 1/kF a =1.5. The green lines refer to the majority component, the blue lines to the minoritycomponent and the black lines to the density difference n↑ − n↓ . The referencedensity n0 = 2k3
F /3π2 refer to N noninteracting fermions at the center of the trapwith equal population for the two spin components.
N↓ = 1
V
∫d3r
∑k
[u2
k f (−Ek−) + v2k f (−Ek+)
],
together with the requirement that the local density thermody-namic potential Ωσ (r) = −kB T ln[tr(e−Hσ /kB T )] finds its globalminimum. We define the population imbalance as P = (N↑ −N↓)/(N↑ + N↓). In order to simplify the numerical simulation, fol-lowing the methods used in [6], we transform the above equationsinto the dimensionless form. To do this, we choose the energy unitto be the Fermi energy at the trap center for N noninteractingfermions with equal population E F = (3Nωxωyωz)
1/3. In our cal-culation E F corresponds to N = 1.5 × 10⁵ atoms in the trap centerwith trap frequencies ωy = ωz ∼ 110BP Hz and ωx ∼ 23 Hz, whichmakes E F ∼ 5 kHz and T F ∼ 250 nK. The harmonic trap in theunit of E F can be expressed in the dimensionless form V (r)/E F =∑
i r2i /R2
TFi with the Thomas–Fermi radius RTFi =√
2E F /mω2i along
the i-th direction. The momentum is in the unit of kF ≡ √2mE F
and temperature is in the unit of T F .Then the properties of the system is determined by three di-
mensionless parameters T /T F , kF a and P . Two typically differentcases will be considered, where we set the system at unitarity(1/kF a = 0) and on the BEC side (1/kF a > 0). We first considerthe zero-temperature situation (T = 0), for P = 0.2 the popula-tion difference density profiles are displayed in Fig. 2. Accordingto our calculation, when the system is tuned on resonance, itwill separate into three different phases in the trap: a BCS coreat the center, a normal polarized phase (NP) at the edge of thetrap with only the majority component, and normal mixed phase(NM) in the middle. This is consistent with the results got fromquantum Monte Carlo approach [10]. When the system enters intothe BEC side (1/kF a = 1.5), as shown in Fig. 2(b), the interme-diate NM phase in the middle disappears and the BP phase ap-pears. At zero temperature, we can discriminate the BCS phasefrom other phases simply by observing the density distributionbecause the two components have equal population in the BCSphase due to atoms are fully paired. However one cannot differ-entiate NM phase and BP phase because in both these two phasesthe two spin components have unequal population. We calculate
L. Zhou et al. / Physics Letters A 376 (2012) 919–924 923
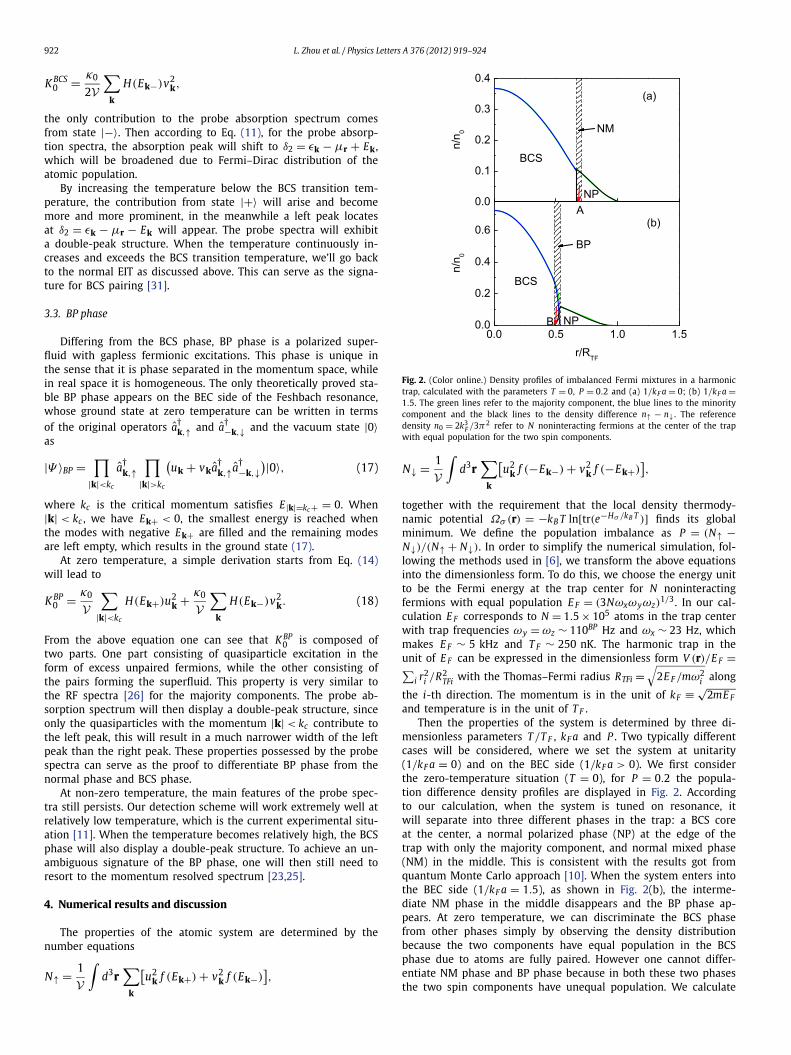
Fig. 3. The probe absorption spectra for the sample points in Fig. 2 marked by thearrow.
the probe absorption spectrum for the coordinate A and B, whichare marked by the arrow, and in the NM region and BP region,respectively. In typical experiments ωc is fixed while ωp changesto produce a probe spectrum, so in our calculation we set δ1c = 0which lead to δ2 = δ1p . The spontaneous decay rate γ for the ex-cited state of 6Li is typically 36.9 MHz [39] and then estimated tobe 7400E F in our scaling defined above. The other parameters areset as Ωc = 0.8 MHz ∼ 160E F . The numerical results are shown inFig. 3.
From which we can observe that the probe spectra displaytotally different behavior as we have analyzed in Section 3. Forpoint A in the normal phase, the probe spectra display a singleabsorption spectra on the resonance (δ1p = 0), reminiscent of thetraditional EIT transmission spectrum. While that for point B inthe BP phase, the probe spectra display a double-peak structure.The left peak is very sharp and with its center localized at δ1p < 0,while the right peak locates at δ1p > 0 and is much broader than
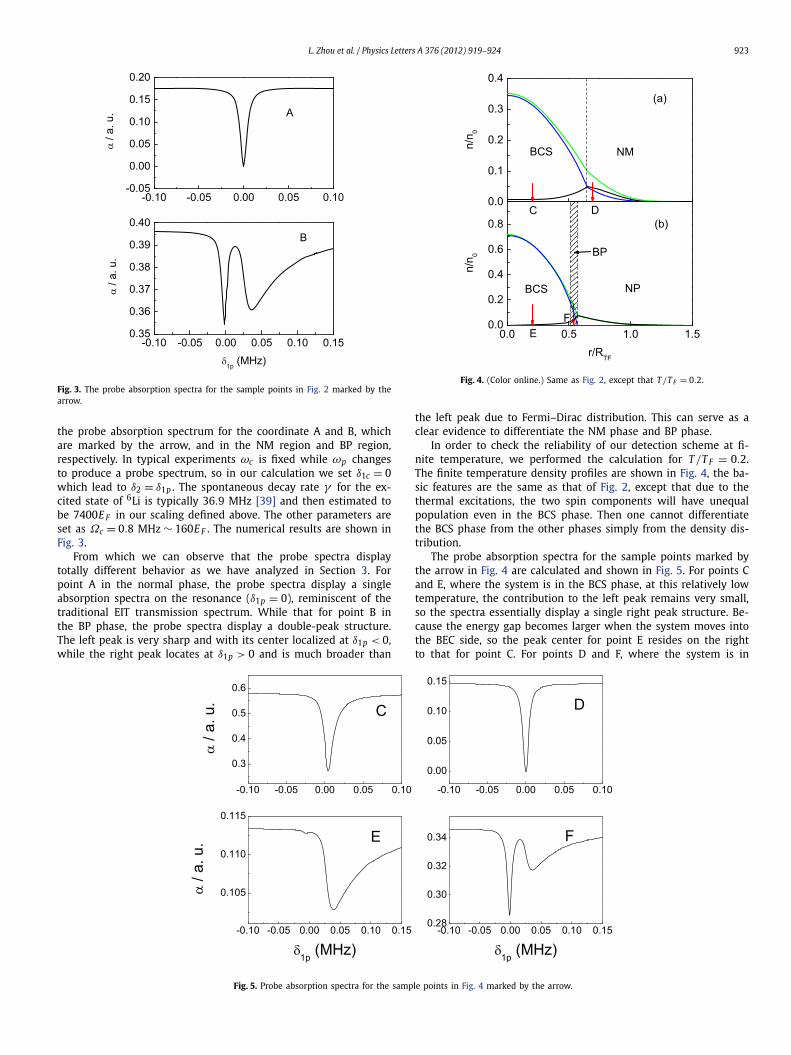
Fig. 4. (Color online.) Same as Fig. 2, except that T /T F = 0.2.
the left peak due to Fermi–Dirac distribution. This can serve as aclear evidence to differentiate the NM phase and BP phase.
In order to check the reliability of our detection scheme at fi-nite temperature, we performed the calculation for T /T F = 0.2.The finite temperature density profiles are shown in Fig. 4, the ba-sic features are the same as that of Fig. 2, except that due to thethermal excitations, the two spin components will have unequalpopulation even in the BCS phase. Then one cannot differentiatethe BCS phase from the other phases simply from the density dis-tribution.
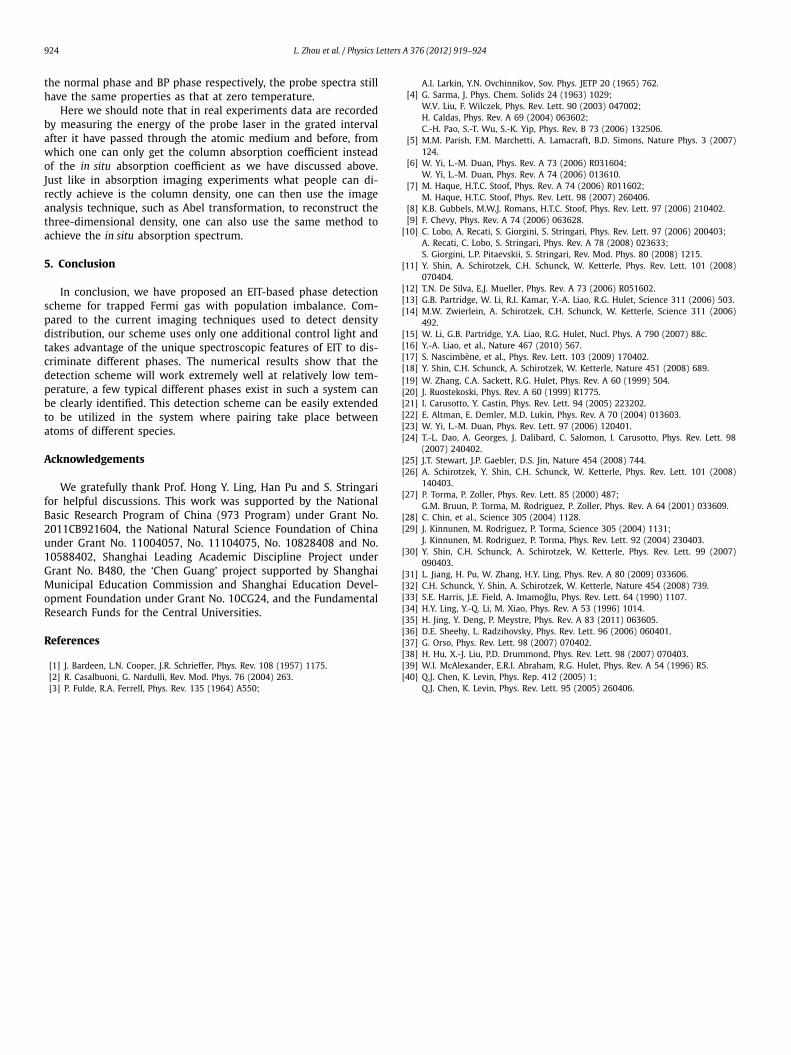
The probe absorption spectra for the sample points marked bythe arrow in Fig. 4 are calculated and shown in Fig. 5. For points Cand E, where the system is in the BCS phase, at this relatively lowtemperature, the contribution to the left peak remains very small,so the spectra essentially display a single right peak structure. Be-cause the energy gap becomes larger when the system moves intothe BEC side, so the peak center for point E resides on the rightto that for point C. For points D and F, where the system is in
Fig. 5. Probe absorption spectra for the sample points in Fig. 4 marked by the arrow.
924 L. Zhou et al. / Physics Letters A 376 (2012) 919–924
the normal phase and BP phase respectively, the probe spectra stillhave the same properties as that at zero temperature.
Here we should note that in real experiments data are recordedby measuring the energy of the probe laser in the grated intervalafter it have passed through the atomic medium and before, fromwhich one can only get the column absorption coefficient insteadof the in situ absorption coefficient as we have discussed above.Just like in absorption imaging experiments what people can di-rectly achieve is the column density, one can then use the imageanalysis technique, such as Abel transformation, to reconstruct thethree-dimensional density, one can also use the same method toachieve the in situ absorption spectrum.
5. Conclusion
In conclusion, we have proposed an EIT-based phase detectionscheme for trapped Fermi gas with population imbalance. Com-pared to the current imaging techniques used to detect densitydistribution, our scheme uses only one additional control light andtakes advantage of the unique spectroscopic features of EIT to dis-criminate different phases. The numerical results show that thedetection scheme will work extremely well at relatively low tem-perature, a few typical different phases exist in such a system canbe clearly identified. This detection scheme can be easily extendedto be utilized in the system where pairing take place betweenatoms of different species.
Acknowledgements
We gratefully thank Prof. Hong Y. Ling, Han Pu and S. Stringarifor helpful discussions. This work was supported by the NationalBasic Research Program of China (973 Program) under Grant No.2011CB921604, the National Natural Science Foundation of Chinaunder Grant No. 11004057, No. 11104075, No. 10828408 and No.10588402, Shanghai Leading Academic Discipline Project underGrant No. B480, the ‘Chen Guang’ project supported by ShanghaiMunicipal Education Commission and Shanghai Education Devel-opment Foundation under Grant No. 10CG24, and the FundamentalResearch Funds for the Central Universities.
References
[1] J. Bardeen, L.N. Cooper, J.R. Schrieffer, Phys. Rev. 108 (1957) 1175.[2] R. Casalbuoni, G. Nardulli, Rev. Mod. Phys. 76 (2004) 263.[3] P. Fulde, R.A. Ferrell, Phys. Rev. 135 (1964) A550;
A.I. Larkin, Y.N. Ovchinnikov, Sov. Phys. JETP 20 (1965) 762.[4] G. Sarma, J. Phys. Chem. Solids 24 (1963) 1029;
W.V. Liu, F. Wilczek, Phys. Rev. Lett. 90 (2003) 047002;H. Caldas, Phys. Rev. A 69 (2004) 063602;C.-H. Pao, S.-T. Wu, S.-K. Yip, Phys. Rev. B 73 (2006) 132506.
[5] M.M. Parish, F.M. Marchetti, A. Lamacraft, B.D. Simons, Nature Phys. 3 (2007)124.
[6] W. Yi, L.-M. Duan, Phys. Rev. A 73 (2006) R031604;W. Yi, L.-M. Duan, Phys. Rev. A 74 (2006) 013610.
[7] M. Haque, H.T.C. Stoof, Phys. Rev. A 74 (2006) R011602;M. Haque, H.T.C. Stoof, Phys. Rev. Lett. 98 (2007) 260406.
[8] K.B. Gubbels, M.W.J. Romans, H.T.C. Stoof, Phys. Rev. Lett. 97 (2006) 210402.[9] F. Chevy, Phys. Rev. A 74 (2006) 063628.
[10] C. Lobo, A. Recati, S. Giorgini, S. Stringari, Phys. Rev. Lett. 97 (2006) 200403;A. Recati, C. Lobo, S. Stringari, Phys. Rev. A 78 (2008) 023633;S. Giorgini, L.P. Pitaevskii, S. Stringari, Rev. Mod. Phys. 80 (2008) 1215.
[11] Y. Shin, A. Schirotzek, C.H. Schunck, W. Ketterle, Phys. Rev. Lett. 101 (2008)070404.
[12] T.N. De Silva, E.J. Mueller, Phys. Rev. A 73 (2006) R051602.[13] G.B. Partridge, W. Li, R.I. Kamar, Y.-A. Liao, R.G. Hulet, Science 311 (2006) 503.[14] M.W. Zwierlein, A. Schirotzek, C.H. Schunck, W. Ketterle, Science 311 (2006)
492.[15] W. Li, G.B. Partridge, Y.A. Liao, R.G. Hulet, Nucl. Phys. A 790 (2007) 88c.[16] Y.-A. Liao, et al., Nature 467 (2010) 567.[17] S. Nascimbène, et al., Phys. Rev. Lett. 103 (2009) 170402.[18] Y. Shin, C.H. Schunck, A. Schirotzek, W. Ketterle, Nature 451 (2008) 689.[19] W. Zhang, C.A. Sackett, R.G. Hulet, Phys. Rev. A 60 (1999) 504.[20] J. Ruostekoski, Phys. Rev. A 60 (1999) R1775.[21] I. Carusotto, Y. Castin, Phys. Rev. Lett. 94 (2005) 223202.[22] E. Altman, E. Demler, M.D. Lukin, Phys. Rev. A 70 (2004) 013603.[23] W. Yi, L.-M. Duan, Phys. Rev. Lett. 97 (2006) 120401.[24] T.-L. Dao, A. Georges, J. Dalibard, C. Salomon, I. Carusotto, Phys. Rev. Lett. 98
(2007) 240402.[25] J.T. Stewart, J.P. Gaebler, D.S. Jin, Nature 454 (2008) 744.[26] A. Schirotzek, Y. Shin, C.H. Schunck, W. Ketterle, Phys. Rev. Lett. 101 (2008)
140403.[27] P. Torma, P. Zoller, Phys. Rev. Lett. 85 (2000) 487;
G.M. Bruun, P. Torma, M. Rodriguez, P. Zoller, Phys. Rev. A 64 (2001) 033609.[28] C. Chin, et al., Science 305 (2004) 1128.[29] J. Kinnunen, M. Rodriguez, P. Torma, Science 305 (2004) 1131;
J. Kinnunen, M. Rodriguez, P. Torma, Phys. Rev. Lett. 92 (2004) 230403.[30] Y. Shin, C.H. Schunck, A. Schirotzek, W. Ketterle, Phys. Rev. Lett. 99 (2007)
090403.[31] L. Jiang, H. Pu, W. Zhang, H.Y. Ling, Phys. Rev. A 80 (2009) 033606.[32] C.H. Schunck, Y. Shin, A. Schirotzek, W. Ketterle, Nature 454 (2008) 739.[33] S.E. Harris, J.E. Field, A. Imamoglu, Phys. Rev. Lett. 64 (1990) 1107.[34] H.Y. Ling, Y.-Q. Li, M. Xiao, Phys. Rev. A 53 (1996) 1014.[35] H. Jing, Y. Deng, P. Meystre, Phys. Rev. A 83 (2011) 063605.[36] D.E. Sheehy, L. Radzihovsky, Phys. Rev. Lett. 96 (2006) 060401.[37] G. Orso, Phys. Rev. Lett. 98 (2007) 070402.[38] H. Hu, X.-J. Liu, P.D. Drummond, Phys. Rev. Lett. 98 (2007) 070403.[39] W.I. McAlexander, E.R.I. Abraham, R.G. Hulet, Phys. Rev. A 54 (1996) R5.[40] Q.J. Chen, K. Levin, Phys. Rep. 412 (2005) 1;
Q.J. Chen, K. Levin, Phys. Rev. Lett. 95 (2005) 260406.