Embed Size (px)
Citation preview
Phase Diagrams
Binary Eutectoid Systems
1
What is Phase?
• The term ‘phase’ refers to a separate and identifiable
state of matter in which a given substance may exist.
• Applicable to both crystalline and non-crystalline
materials
• An important refractory oxide silica is able to exist as
three crystalline phases, quartz, tridymite and
cristobalite, as well as a non-crystalline phase, silica
glass, and as molten silica
• Every pure material is considered to be a phase, so
also is every solid, liquid, and gaseous solution
• For example, the sugar–water syrup solution is one
phase, and solid sugar is another
2
Introduction to Phase Diagram
• There is a strong correlation between
microstructure and mechanical properties,
and the development of microstructure of an
alloy is related to the characteristics of its
phase diagram
• It is a type of chart used to show conditions at
which thermodynamically distinct phases can
occur at equilibrium
• Provides valuable information about melting,
casting, crystallization, and other phenomena
3
4
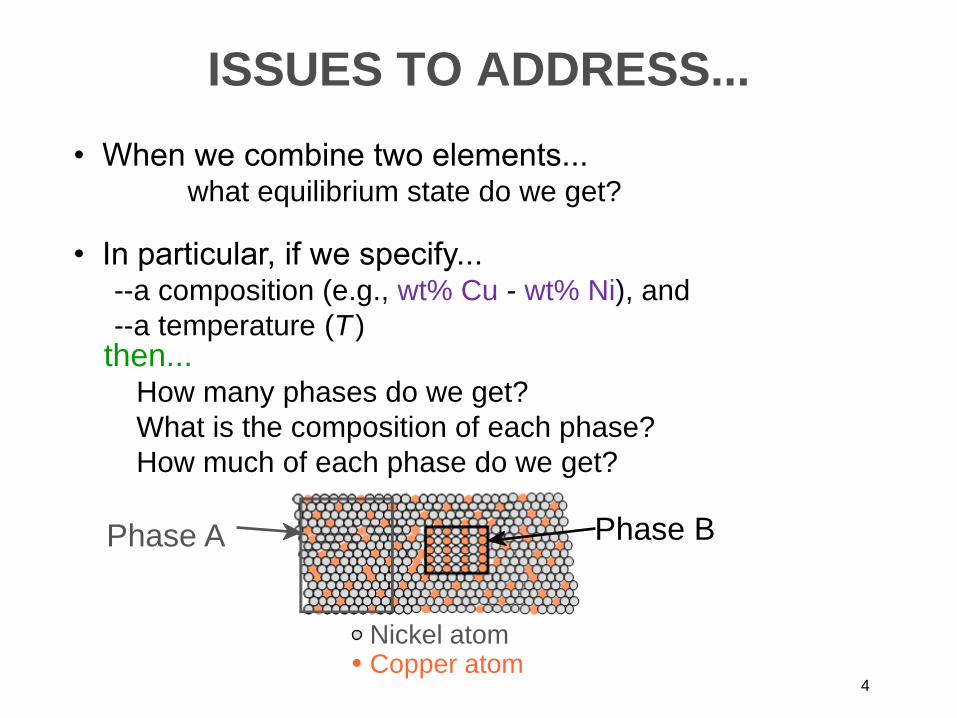
• When we combine two elements... what equilibrium state do we get?
• In particular, if we specify... --a composition (e.g., wt% Cu - wt% Ni), and
--a temperature (T ) then... How many phases do we get?
What is the composition of each phase?
How much of each phase do we get?
ISSUES TO ADDRESS...
Phase B Phase A
Nickel atom Copper atom
Solubility Limit
• At some specific temperature, there is a
maximum concentration of solute atoms that
may dissolve in the solvent to form a solid
solution, which is called as Solubility Limit
• The addition of solute in excess of this solubility
limit results in the formation of another
compound that has a distinctly different
composition
• This solubility limit depends on the temperature
5
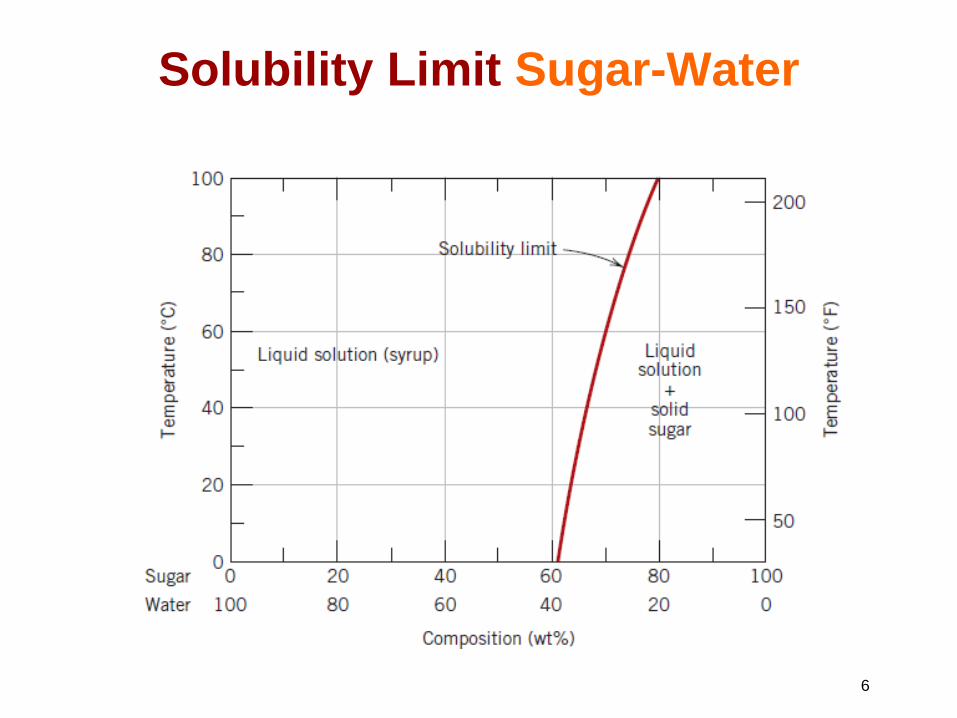
Solubility Limit Sugar-Water
6

Microstructure
• the structure of a prepared surface of material as
revealed by a microscope above 25× magnification
• The microstructure of a material can strongly
influence properties such as strength, toughness,
ductility, hardness, corrosion resistance, high/low
temperature behavior, wear resistance, etc
7
8
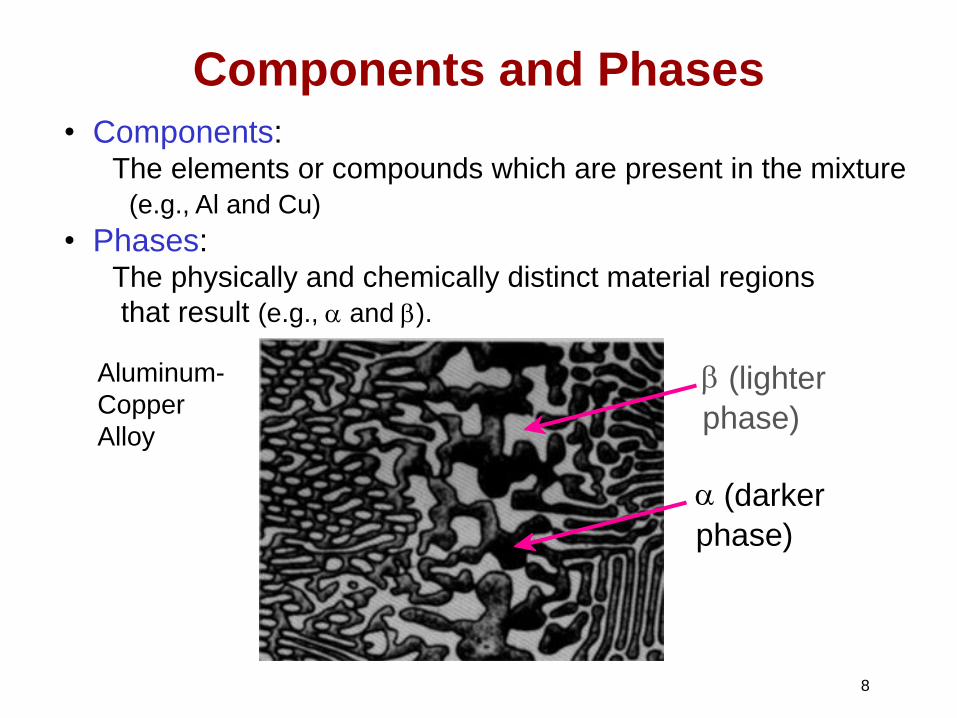
• Components: The elements or compounds which are present in the mixture
(e.g., Al and Cu)
• Phases: The physically and chemically distinct material regions
that result (e.g., a and b).
Aluminum-
Copper
Alloy
Components and Phases
a (darker
phase)
b (lighter
phase)
9
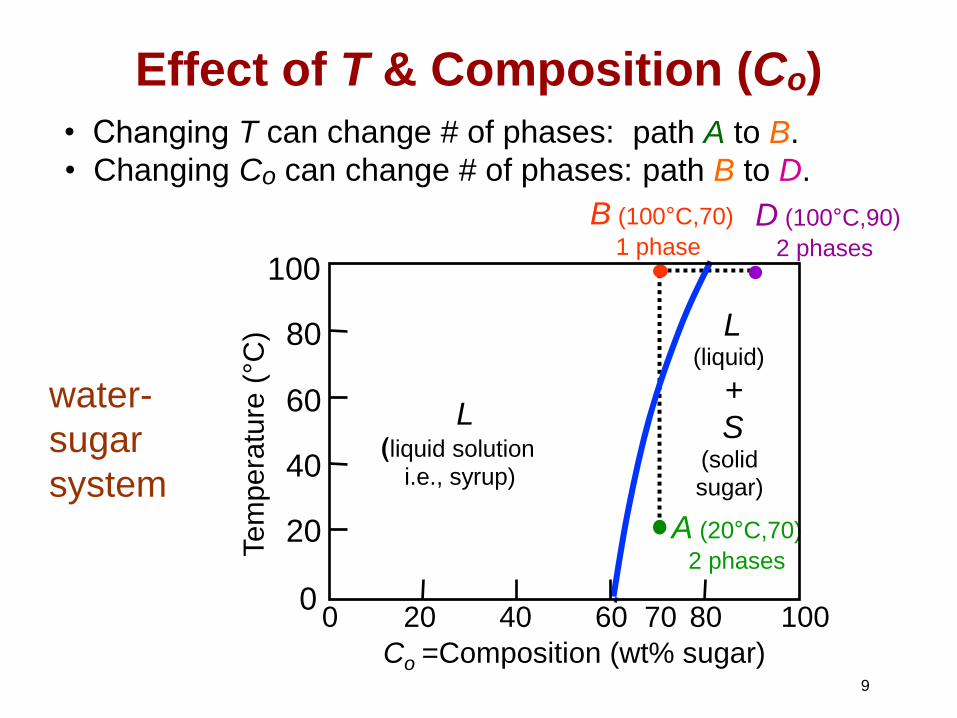
Effect of T & Composition (Co)
• Changing T can change # of phases:
D (100°C,90)
2 phases
B (100°C,70)
1 phase
path A to B.
• Changing Co can change # of phases: path B to D.
A (20°C,70)
2 phases
70 80 100 60 40 20 0
Tem
pera
ture
(°C
)
Co =Composition (wt% sugar)
L ( liquid solution
i.e., syrup)
20
100
40
60
80
0
L (liquid)
+ S
(solid sugar)
water-
sugar
system
Binary Phase Diagrams
• A phase diagram in which temperature and
composition are variable parameters, and
pressure is held constant—normally 1atm
• Binary phase diagrams are maps that
represent the relationships between
temperature and the compositions and
quantities of phases at equilibrium, which
influence the microstructure of an alloy.
• Many microstructures develop from phase
transformations, the changes that occur when
the temperature is altered
10
11
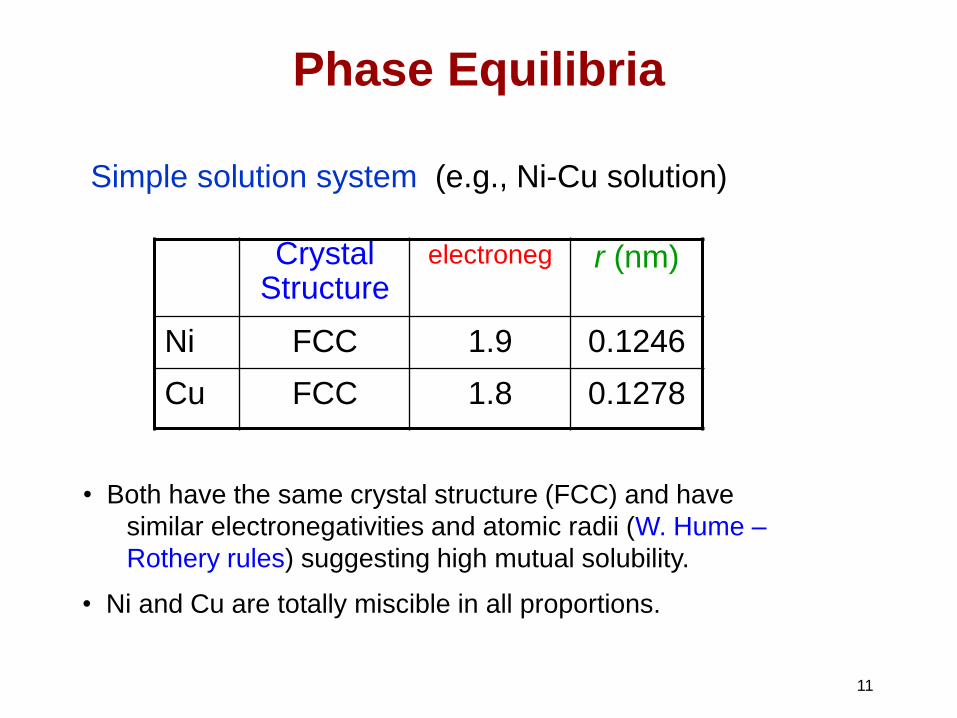
Phase Equilibria
Crystal Structure
electroneg r (nm)
Ni FCC 1.9 0.1246
Cu FCC 1.8 0.1278
• Both have the same crystal structure (FCC) and have
similar electronegativities and atomic radii (W. Hume –
Rothery rules) suggesting high mutual solubility.
Simple solution system (e.g., Ni-Cu solution)
• Ni and Cu are totally miscible in all proportions.
12
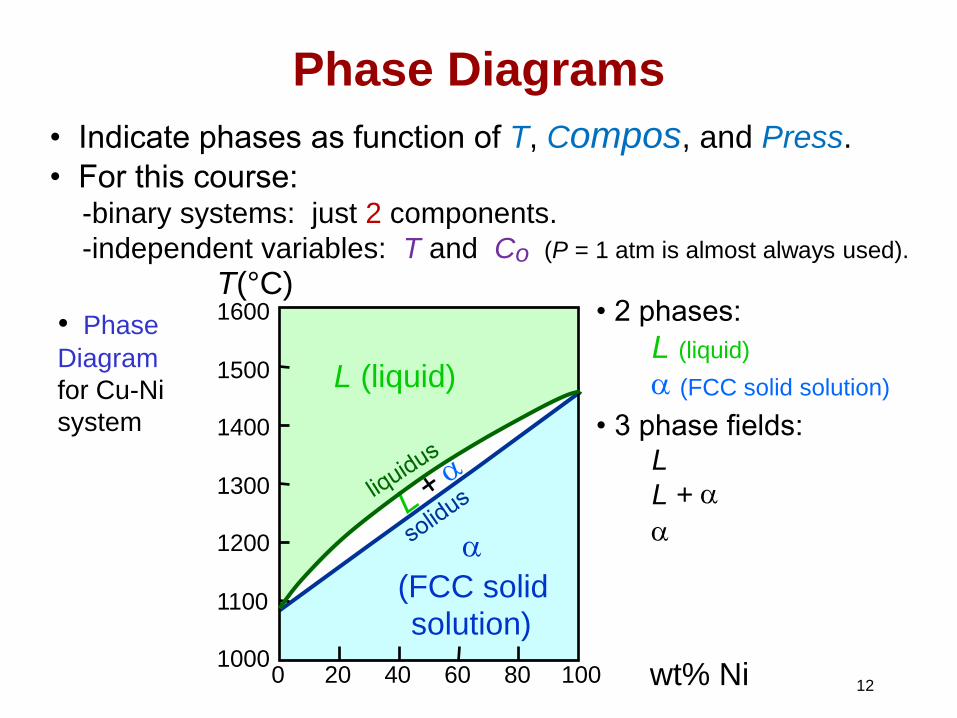
Phase Diagrams
• Indicate phases as function of T, Compos, and Press.
• For this course: -binary systems: just 2 components.
-independent variables: T and Co (P = 1 atm is almost always used).
• Phase
Diagram
for Cu-Ni
system
• 2 phases: L (liquid)
a (FCC solid solution)
• 3 phase fields:
L
L + a
a
wt% Ni 20 40 60 80 100 0 1000
1100
1200
1300
1400
1500
1600 T(°C)
L (liquid)
a
(FCC solid solution)
13
wt% Ni 20 40 60 80 100 0 1000
1100
1200
1300
1400
1500
1600 T(°C)
L (liquid)
a (FCC solid solution)
Cu-Ni
phase
diagram
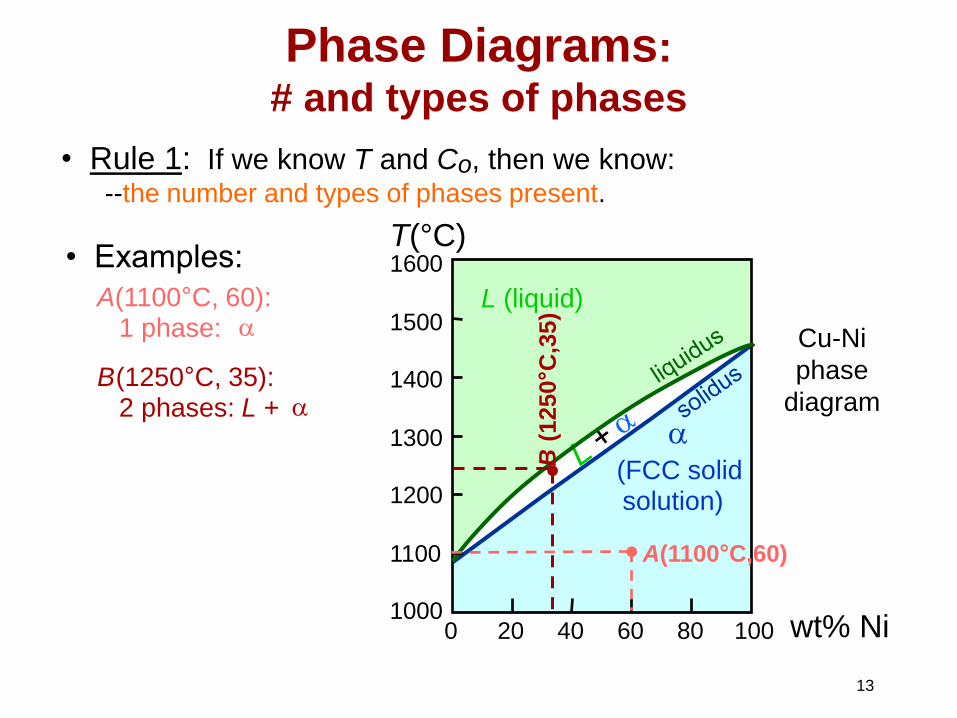
Phase Diagrams: # and types of phases
• Rule 1: If we know T and Co, then we know: --the number and types of phases present.
• Examples:
A(1100°C, 60): 1 phase: a
B (1250°C, 35): 2 phases: L + a
B (
1250°C
,35)
A(1100°C,60)
14
wt% Ni
20
1200
1300
T(°C)
L (liquid)
a
(solid)
30 40 50
Cu-Ni
system
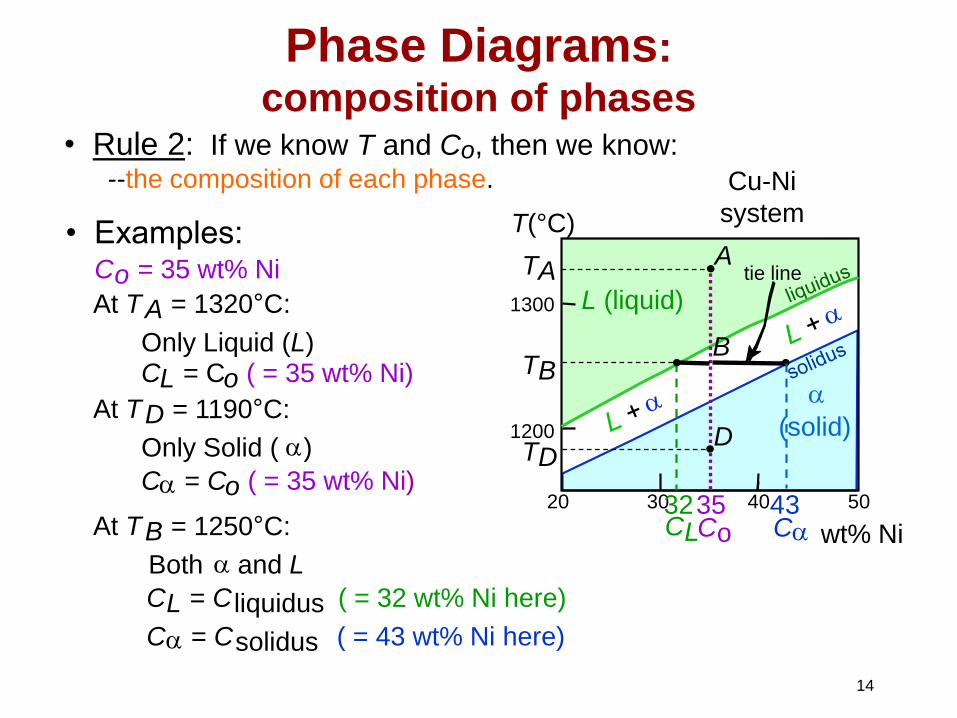
Phase Diagrams: composition of phases
• Rule 2: If we know T and Co, then we know: --the composition of each phase.
• Examples: T A
A
35 C o
32 C L
At T A = 1320°C:
Only Liquid (L) C L = C o ( = 35 wt% Ni)
At T B = 1250°C:
Both a and L
C L = C liquidus ( = 32 wt% Ni here)
C a = C solidus ( = 43 wt% Ni here)
At T D = 1190°C:
Only Solid ( a )
C a = C o ( = 35 wt% Ni )
C o = 35 wt% Ni
B T B
D T D
tie line
4 C a 3
15
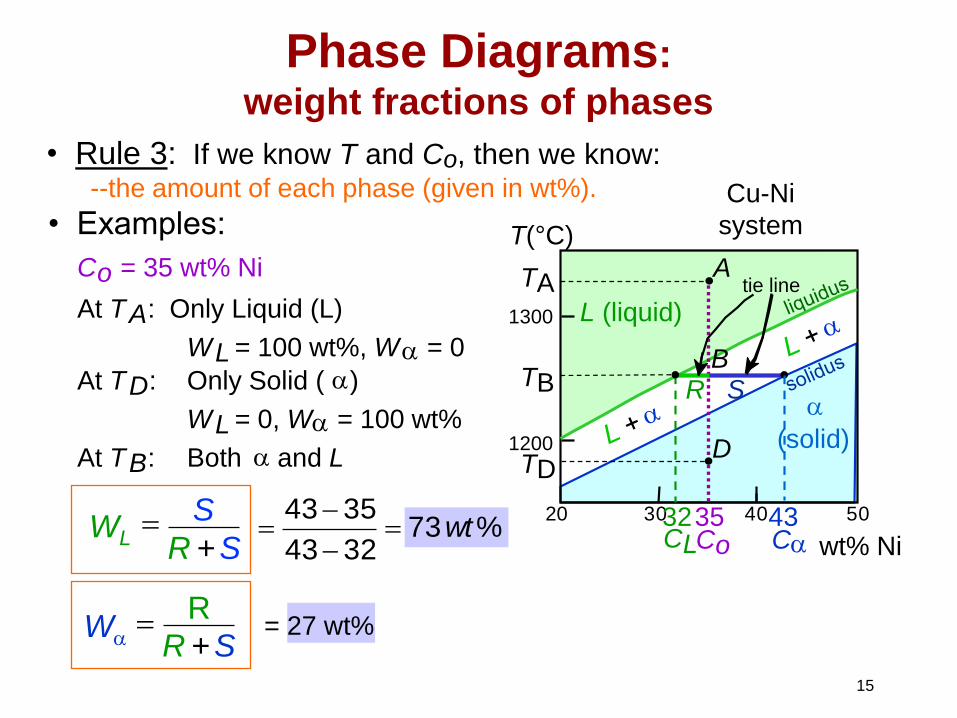
• Rule 3: If we know T and Co, then we know: --the amount of each phase (given in wt%).
• Examples:
At T A : Only Liquid (L)
W L = 100 wt%, W a = 0
At T D : Only Solid ( a )
W L = 0, W a = 100 wt%
C o = 35 wt% Ni
Phase Diagrams:
weight fractions of phases
wt% Ni
20
1200
1300
T(°C)
L (liquid)
a
(solid)
3 0 4 0 5 0
Cu-Ni
system
T A A
35 C o
32 C L
B T B
D T D
tie line
4 C a 3
R S
At T B : Both a and L
% 733243
3543wt
= 27 wt%
WL S
R + S
Wa R
R + S
16
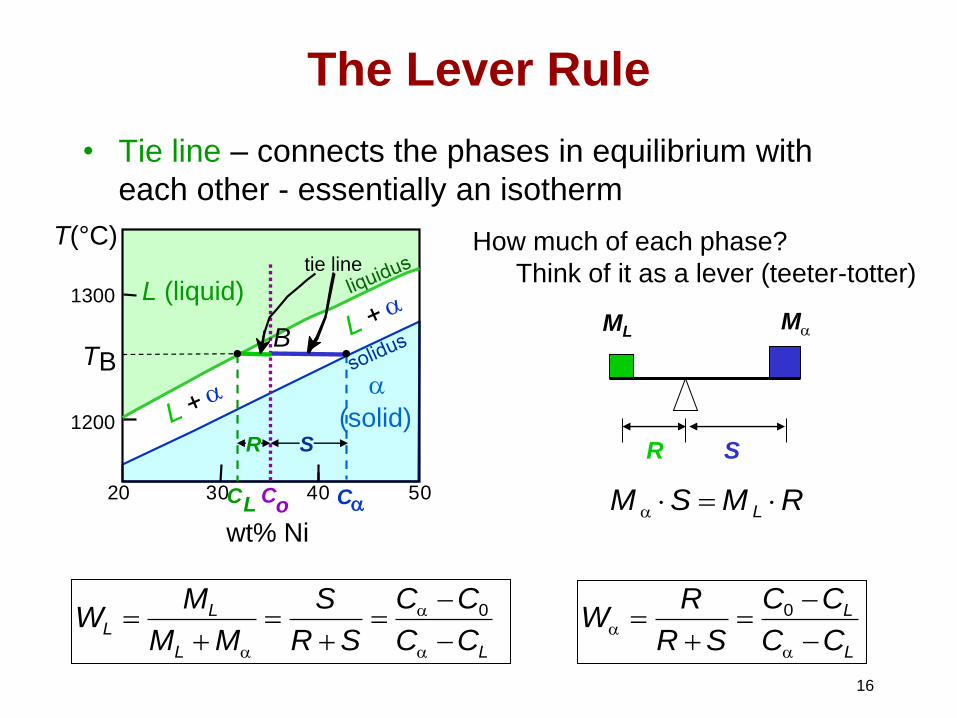
• Tie line – connects the phases in equilibrium with
each other - essentially an isotherm
The Lever Rule
How much of each phase?
Think of it as a lever (teeter-totter)
ML Ma
R S
RMSM L a
L
L
LL
LL
CC
CC
SR
RW
CC
CC
SR
S
MM
MW
a
a
a
a
a
00
wt% Ni
20
1200
1300
T(°C)
L (liquid)
a
(solid)
3 0 4 0 5 0
B T B
tie line
C o C L C a
S R
17
wt% Ni 20
120 0
130 0
3 0 4 0 5 0 110 0
L (liquid)
a
(solid)
T(°C)
A
35 C o
L: 35wt%Ni
Cu-Ni
system
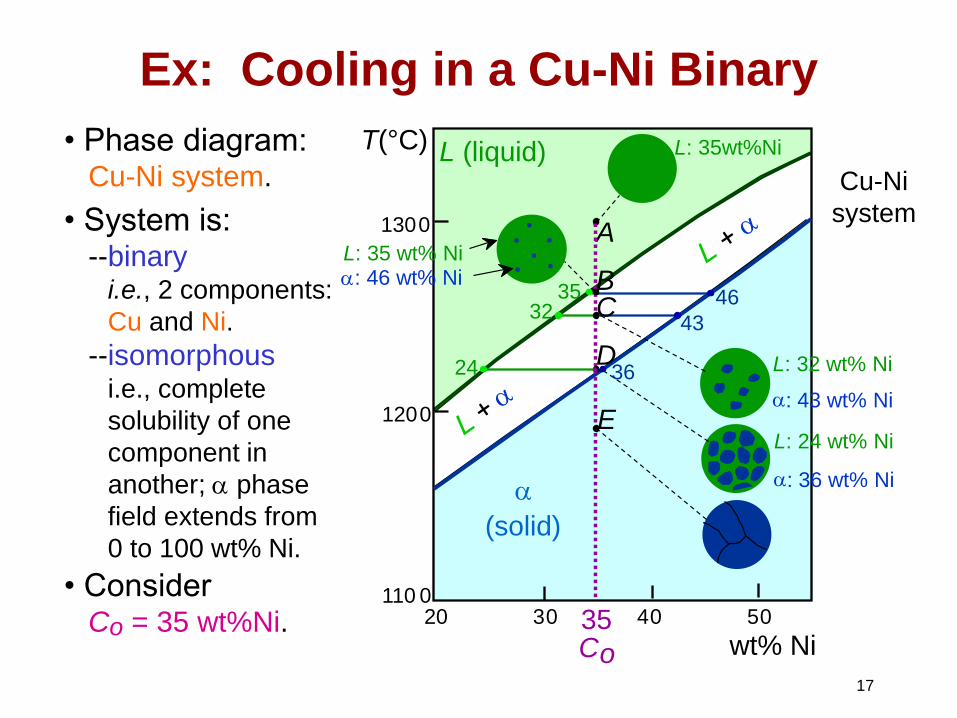
• Phase diagram: Cu-Ni system.
• System is: --binary i.e., 2 components:
Cu and Ni.
--isomorphous i.e., complete
solubility of one
component in
another; a phase
field extends from
0 to 100 wt% Ni.
• Consider Co = 35 wt%Ni.
Ex: Cooling in a Cu-Ni Binary
46 35
43 32
a : 43 wt% Ni
L: 32 wt% Ni
L: 24 wt% Ni
a : 36 wt% Ni
B a: 46 wt% Ni L: 35 wt% Ni
C
D
E
24 36
18
Equilibrium Cooling
• (between the liquidus and solidus lines): With continued
slow cooling, both compositions and relative amounts
of each of the phases will change.
• The compositions of the liquid and aphases will follow
the liquidus and solidus lines, respectively.
• Furthermore, the fraction of the aphase will increase
with continued cooling.
• The overall alloy composition remains unchanged
• The final product (upon crossing the solidus line) has a
uniform composition in a polycrystalline a–phase solid
solution.
• Subsequent cooling will produce no microstructural or
composition changes.
19
Nonequilibrium Cooling
• Slow cooling: readjustment in the compositions of the
liquid and solid phases with changes in temperatures – Diffusion in both solid and liquid phases and also across the
solid-liquid interface.
– Diffusion is a time-dependent phenomenon
• In virtually all practical solidification situations, cooling
rates are much too rapid to allow these compositional
readjustments and maintenance of equilibrium.
20
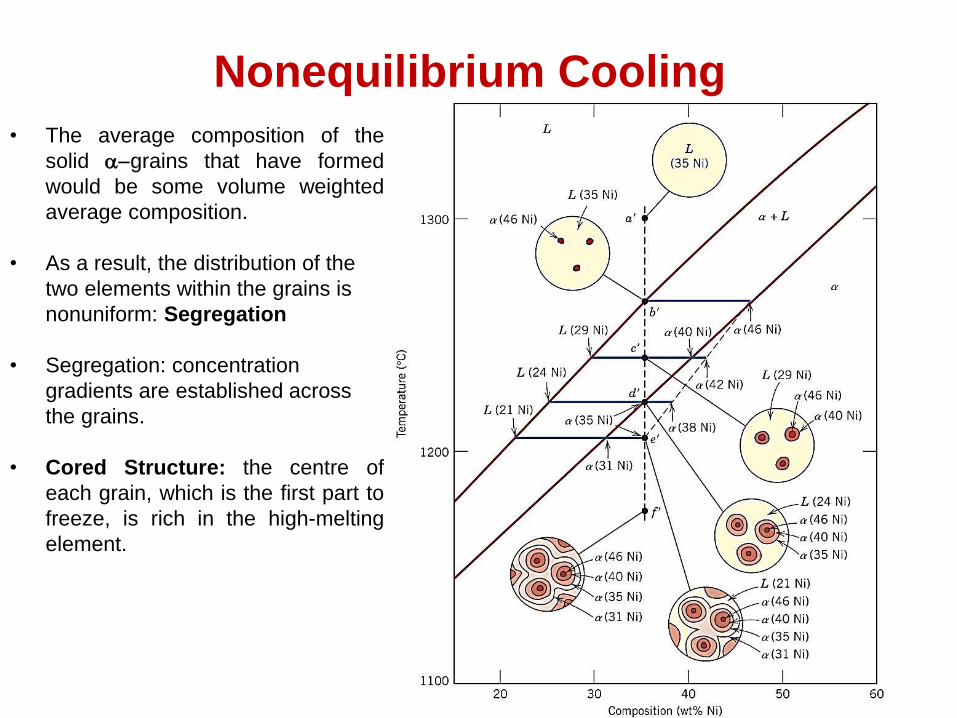
Nonequilibrium Cooling
• The average composition of the
solid agrains that have formed
would be some volume weighted
average composition.
• As a result, the distribution of the
two elements within the grains is
nonuniform: Segregation
• Segregation: concentration
gradients are established across
the grains.
• Cored Structure: the centre of
each grain, which is the first part to
freeze, is rich in the high-melting
element.
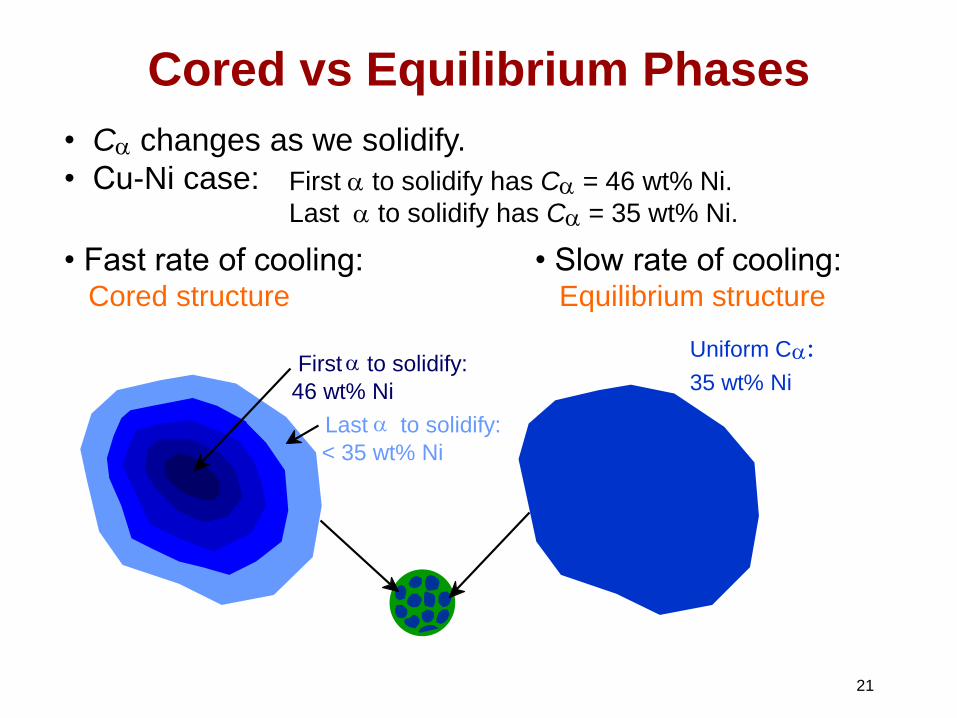
21
• Ca changes as we solidify.
• Cu-Ni case:
• Fast rate of cooling: Cored structure
• Slow rate of cooling: Equilibrium structure
First a to solidify has Ca = 46 wt% Ni.
Last a to solidify has Ca = 35 wt% Ni.
Cored vs Equilibrium Phases
First a to solidify:
46 wt% Ni
Uniform C a :
35 wt% Ni
Last a to solidify:
< 35 wt% Ni
22
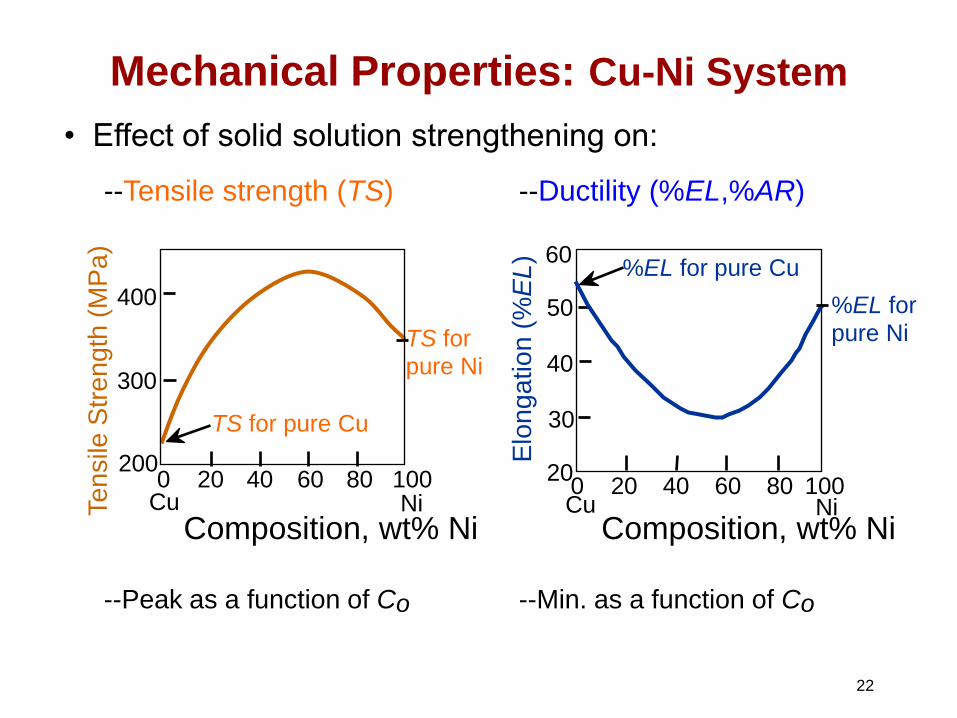
Mechanical Properties: Cu-Ni System
• Effect of solid solution strengthening on:
--Tensile strength (TS) --Ductility (%EL,%AR)
--Peak as a function of Co --Min. as a function of Co
Te
nsile
Str
en
gth
(M
Pa
)
Composition, wt% Ni Cu Ni 0 20 40 60 80 100
200
300
400
TS for pure Ni
TS for pure Cu
Elo
ng
atio
n (
%E
L)
Composition, wt% Ni Cu Ni 0 20 40 60 80 100
20
30
40
50
60
%EL for pure Ni
%EL for pure Cu
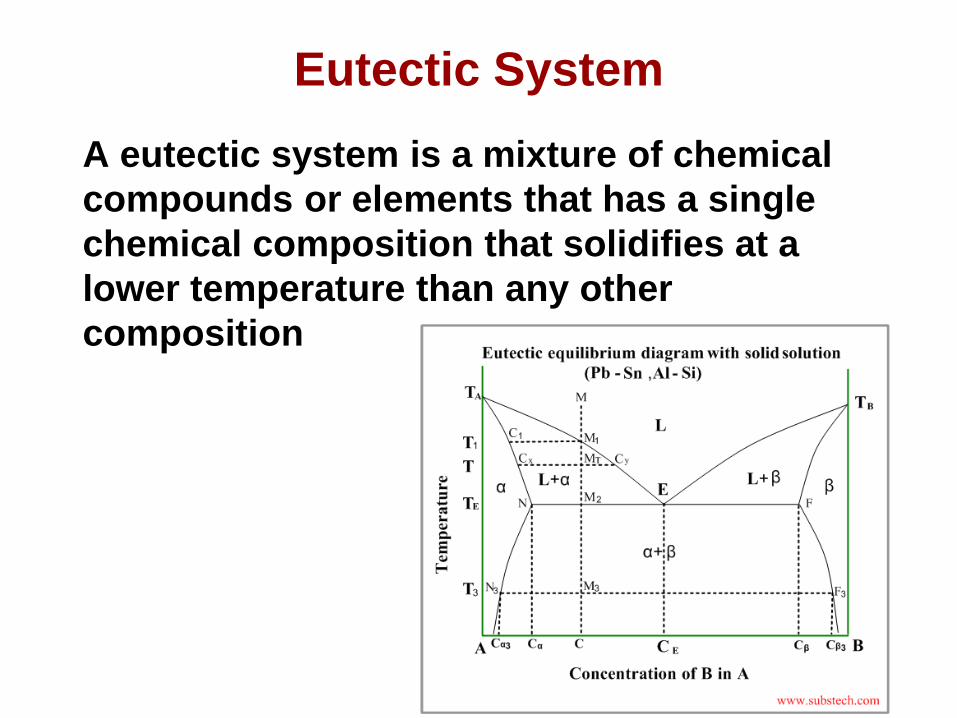
Eutectic System
A eutectic system is a mixture of chemical
compounds or elements that has a single
chemical composition that solidifies at a
lower temperature than any other
composition
23
24
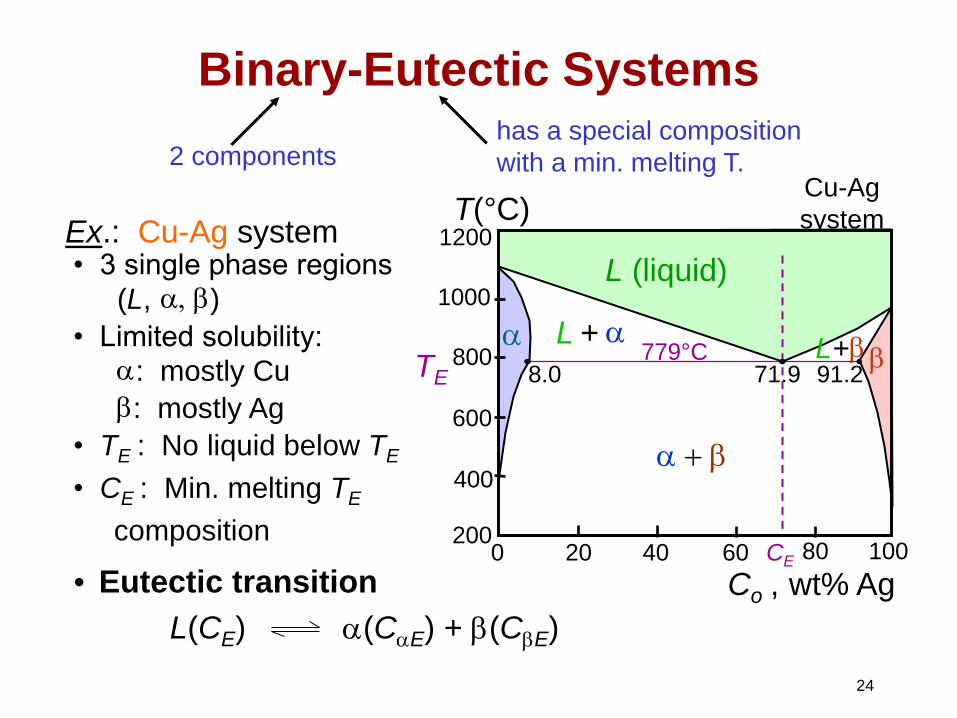
: Min. melting TE
2 components has a special composition
with a min. melting T.
Binary-Eutectic Systems
• Eutectic transition
L(CE) a(CaE) + b(CbE)
• 3 single phase regions
(L, a, b )
• Limited solubility:
a : mostly Cu
b : mostly Ag
• TE : No liquid below TE
• CE
composition
Ex.: Cu-Ag system
Cu-Ag
system
L (liquid)
a L + a L + b b
a b
Co , wt% Ag 20 40 60 80 100 0
200
1200 T(°C)
400
600
800
1000
CE
TE 8.0 71.9 91.2 779°C
25
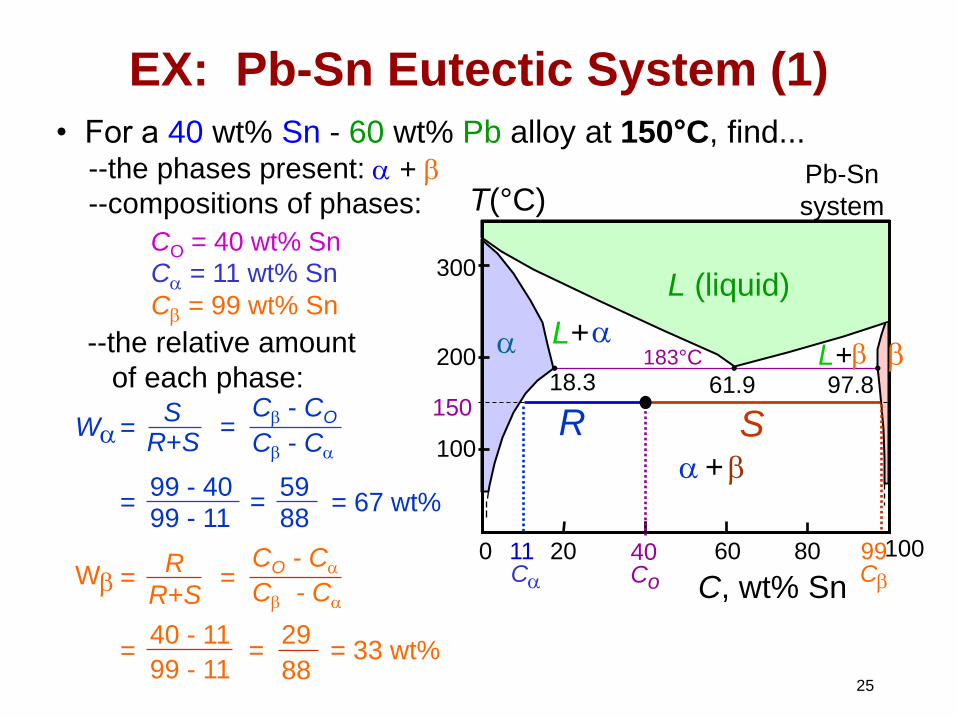
L + a L + b
a + b
200
T(°C)
18.3
C, wt% Sn
20 60 80 100 0
300
100
L (liquid)
a 183°C
61.9 97.8
b
• For a 40 wt% Sn - 60 wt% Pb alloy at 150°C, find... --the phases present: Pb-Sn
system
EX: Pb-Sn Eutectic System (1)
a + b
--compositions of phases:
CO = 40 wt% Sn
--the relative amount
of each phase: 150
40 Co
11 Ca
99 Cb
S R
Ca = 11 wt% Sn
Cb = 99 wt% Sn
W a = Cb - CO
Cb - Ca
= 99 - 40
99 - 11
= 59
88
= 67 wt%
S R+S
=
W b = CO - Ca
Cb - Ca
= R
R+S
= 29
88
= 33 wt% = 40 - 11
99 - 11
26
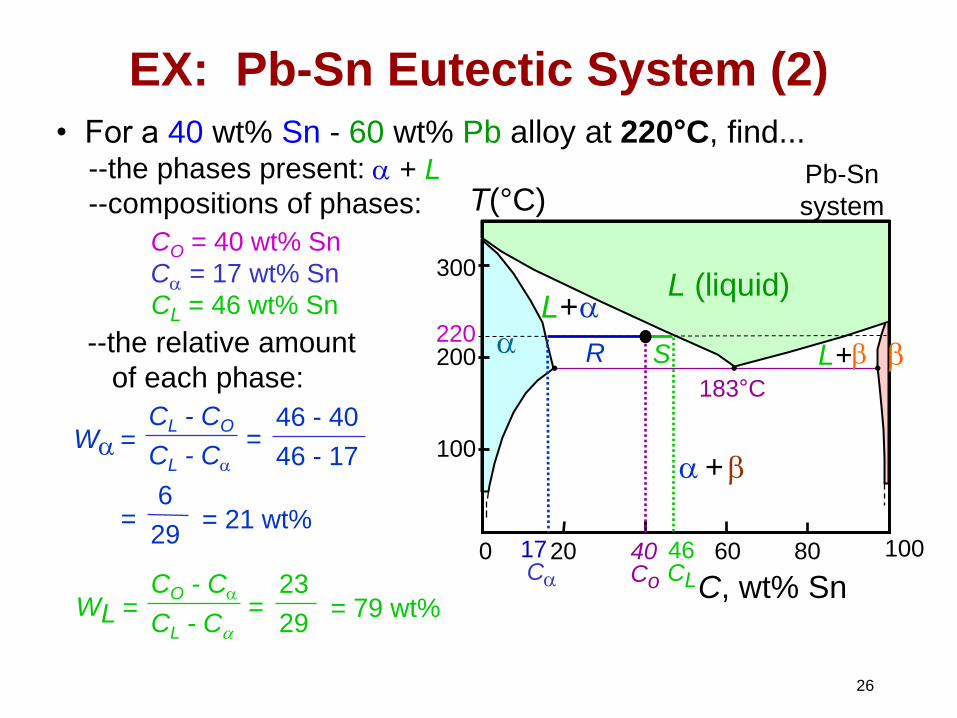
L + b
a + b
200
T(°C)
C, wt% Sn
20 60 80 100 0
300
100
L (liquid)
a b
L + a
183°C
• For a 40 wt% Sn - 60 wt% Pb alloy at 220°C, find... --the phases present: Pb-Sn
system
EX: Pb-Sn Eutectic System (2)
a + L --compositions of phases:
CO = 40 wt% Sn
--the relative amount
of each phase:
W a = CL - CO
CL - Ca
= 46 - 40
46 - 17
= 6
29
= 21 wt%
W L = CO - Ca
CL - Ca
= 23
29
= 79 wt%
40 Co
46 CL
17 Ca
220 S R
Ca = 17 wt% Sn
CL = 46 wt% Sn
27
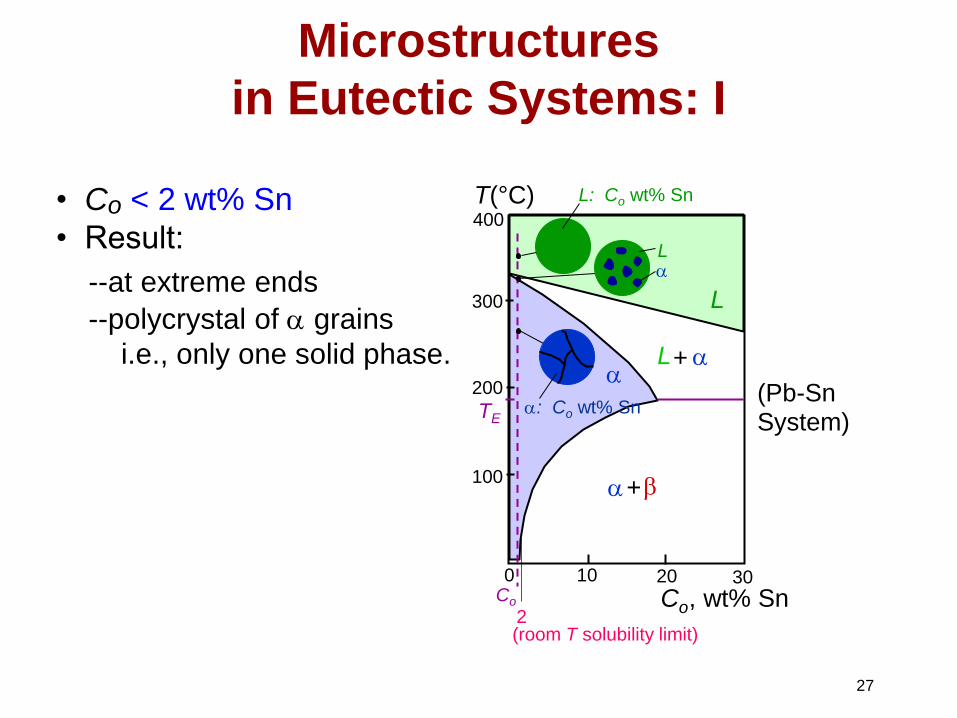
• Co < 2 wt% Sn
• Result:
--at extreme ends --polycrystal of a grains
i.e., only one solid phase.
Microstructures
in Eutectic Systems: I
0
L + a
200
T(°C)
Co , wt% Sn 10
2
20 Co
300
100
L
a
30
a + b
400
(room T solubility limit)
TE
(Pb-Sn System)
a L
L: Co wt% Sn
a: Co wt% Sn
28
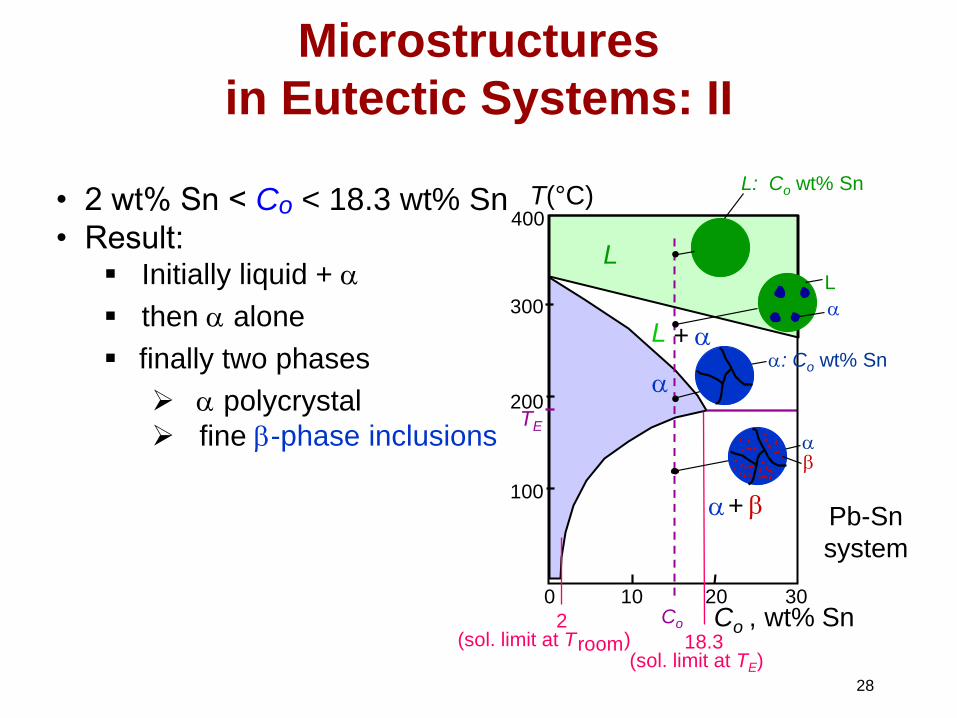
• 2 wt% Sn < Co < 18.3 wt% Sn
• Result: Initially liquid + a
then a alone
finally two phases
a polycrystal
fine b-phase inclusions
Microstructures
in Eutectic Systems: II
Pb-Sn
system
L + a
200
T(°C)
Co , wt% Sn 10
18.3
20 0 Co
300
100
L
a
30
a + b
400
(sol. limit at TE)
TE
2 (sol. limit at T room )
L
a
L: Co wt% Sn
a b
a: Co wt% Sn
29
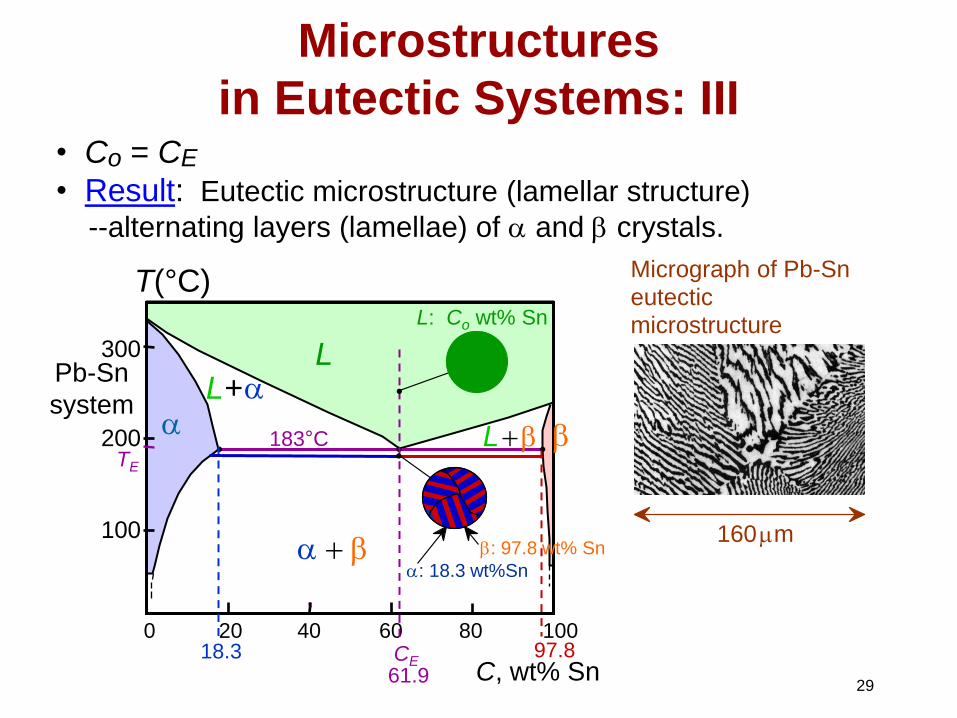
• Co = CE
• Result: Eutectic microstructure (lamellar structure)
--alternating layers (lamellae) of a and b crystals.
Microstructures
in Eutectic Systems: III
160 m
Micrograph of Pb-Sn eutectic microstructure
Pb-Sn
system
L b
a b
200
T(°C)
C, wt% Sn
20 60 80 100 0
300
100
L
a b
L + a
183°C
40
TE
18.3
a: 18.3 wt%Sn
97.8
b: 97.8 wt% Sn
CE 61.9
L: Co wt% Sn
30
Microstructural Developments
in Eutectic Systems III • The microstructure of the solid results from the Eutectic
transformation consists of alternating layers (called
lamellae) of the a and b phases that form
simultaneously during the transformation.
• The microstructure at Eutectic point is called
EUTECTIC STRUCTURE.
• Subsequent cooling of the alloy form just below the
eutectic to room temperature will result in only minor
microstructural alterations.
31
Lamellar Eutectic Structure
32
Microstructural Developments
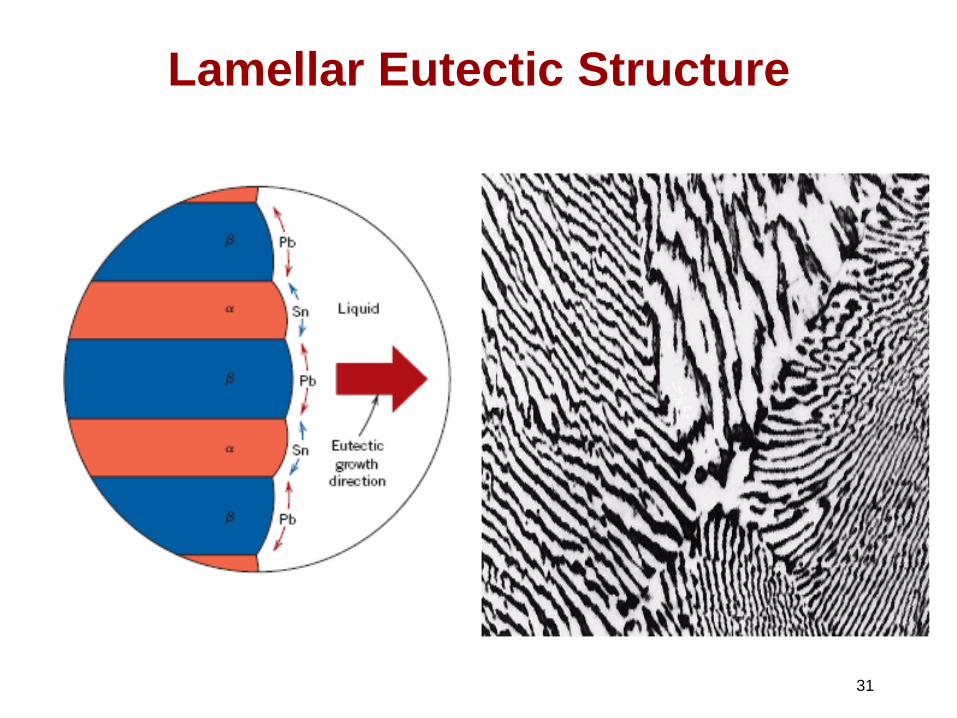
in Eutectic Systems III • The a-b layered eutectic growing into and replacing the
liquid phase
• The process of redistribution of lead and tin occurs by
diffusion in the liquid just ahead of the eutectic-liquid
interface.
• The arrows indicate the directions of diffusion of lead
and tin atoms; lead atoms diffuse toward the a–phase
layers because this a–phase is lead-rich.
• Similarly for the tin-rich phase
33
60/40 TIN-LEAD SOLDER
• A familiar example is the 60/40 solder, a low-melting
temperature having near-Eutectic compositions.
• An alloy of this composition is completely molten about
185 C, which makes it especially attractive as a low-
temperature solder.
34
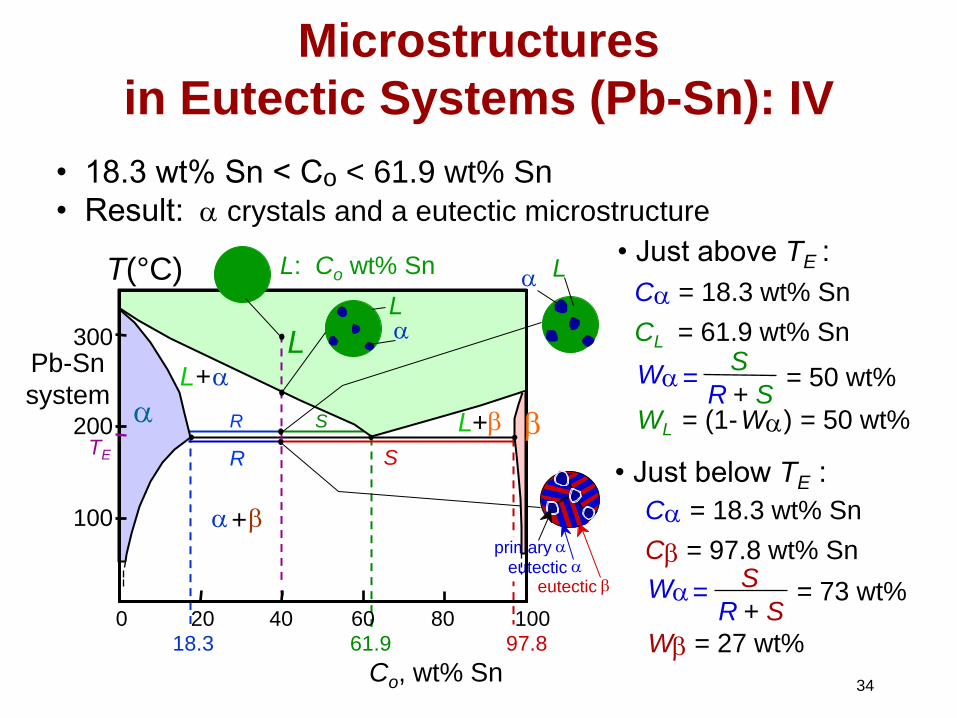
• 18.3 wt% Sn < Co < 61.9 wt% Sn
• Result: a crystals and a eutectic microstructure
Microstructures
in Eutectic Systems (Pb-Sn): IV
18.3 61.9
S R
97.8
S R
primary a
eutectic a
eutectic b
WL = (1- W a ) = 50 wt%
C a = 18.3 wt% Sn
CL = 61.9 wt% Sn S
R + S W a = = 50 wt%
• Just above TE :
• Just below TE :
C a = 18.3 wt% Sn
C b = 97.8 wt% Sn S
R + S W a = = 73 wt%
W b = 27 wt%
Pb-Sn
system L + b 200
T(°C)
Co, wt% Sn
20 60 80 100 0
300
100
L
a b
L + a
40
a + b
TE
L: Co wt% Sn L a L a
35
L + a L + b
a + b
200
Co, wt% Sn 20 60 80 100 0
300
100
L
a b
TE
40
(Pb-Sn System)
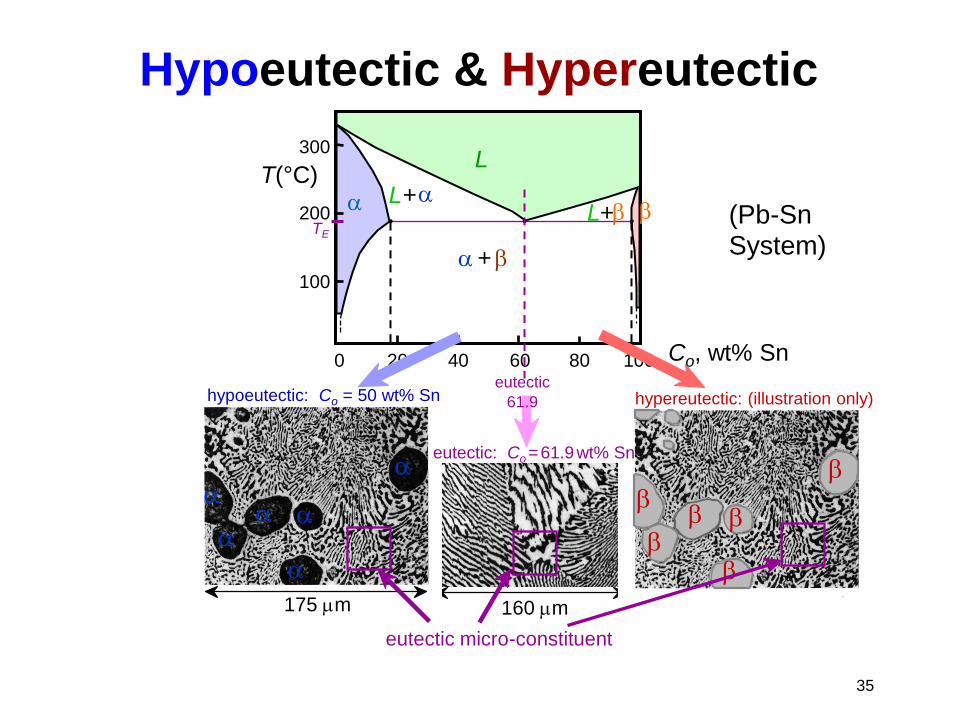
Hypoeutectic & Hypereutectic
160 m
eutectic micro-constituent
hypereutectic: (illustration only)
b
b b
b b
b
175 m
a
a
a
a a
a
hypoeutectic: Co = 50 wt% Sn
T(°C)
61.9
eutectic
eutectic: Co = 61.9 wt% Sn
36
Microstructural Developments
in Eutectic Systems IV • Insignificant changes will occur with the phase that
formed during cooling through the a + L region.
• So the –phase will be present in the eutectic structure
and also as the phase that formed while cooling
through the a + L phase field.
• So there are two microconstituents: a and eutectic
structures.
• Microconstituent is an element of the microstructure
having an identifiable and characteristic structure.
• It is possible to compute the relative amounts of both
eutectic and primary microconstituents.
37
SUMMARY
• Phase diagrams are useful tools to determine:
-- the number and types of phases present,
-- the composition of each phase,
-- and the weight fraction of each phase
given the temperature and composition of the system.
• The microstructure of an alloy depends on
-- its composition, and
-- whether or not cooling rate allows for maintenance of
equilibrium.