Embed Size (px)
Citation preview

ILASS Americas 26th Annual Conference on Liquid Atomization and Spray Systems, Portland, OR, May 2014
Phase Doppler Analysis of Aqueous Film-Forming Foam (AFFF) Firefighting Jets
C. P. Menchini*†‡, G. J. Morris†, W. W. Huebsch†, and D. S. Dierdorf§
Department of Mechanical & Aerospace Engineering†
West Virginia University†
Morgantown, WV 26506-6106 USA
Engineering Science Division‡
Applied Research Associates, Inc.
Panama City, FL 32401-6357 USA
Southwest Division§
Applied Research Associates, Inc.
Albuquerque, NM 87110-1229 USA
Abstract
Over the past few decades, aircraft rescue firefighting has made technical strides on multiple fronts, particularly in the
field of fire suppression agent application and materials research. A study was recently conducted to examine fire-
fighting agent application flow behavior and to quantify various flow performance characteristics that differentiate
water and aqueous film-forming foam (AFFF) jets. AFFF has been the high performing fuel fire suppression agent
of choice for several years based on hydrocarbon and fluorocarbon surface active ingredients. However, its long-term
viability has been recently threatened due to the presence of certain constituents recognized by the Environmental
Protection Agency as emerging contaminants. Hence, understanding the performance attributes of AFFF is important
now more than ever to help develop possible replacement agents. An aqueous firefighting agent application laboratory
was specially constructed to carry out 2-D phase Doppler analysis on firefighting jets ranging from 1 to 11 MPa (150
to 1550 lbin-2) and 4 to 25 lmin-1 (1 to 6.4 galmin-1) at AFFF concentration levels ranging from 0 (pure water) to 9
percent by volume. Results showed AFFF enhanced jet break-up and generated spatially-averaged, mean profile
droplet sizes 7 to 38 percent less in diameter compared to water jets, and AFFF jets lagged water jets in terms of axial
droplet velocity by as much as 10 percent over those respective ranges. Increasing AFFF concentration levels beyond
the manufacturer’s recommended levels for firefighting use did not significantly alter phase Doppler results. The data
collected are being used to develop simulation capabilities for aircraft-crash-fire suppression risk assessment models.
The next phase of development is to characterize near field, AFFF-surface interactions to better understand agent
accumulation mechanics and their influence on aircraft structures engulfed in fire.
*Corresponding author: [email protected]

Introduction
Aqueous film-forming foam (AFFF) has been the
class B liquid fuel firefighting agent of choice for the air-
craft rescue and firefighting industry for several decades
due to its high performance characteristics governed by
its hydrocarbon and fluorocarbon surfactant ingredients.
Figures 1 and 2 illustrate its use at the live fire research
and training facilities at Tyndall Air Force Base, FL en-
gaged in suppressing two different types of accidental
fire scenarios.
Figure 1. AFFF being dispensed via a high-reach ex-
tendable turret on an aircraft mock-up, 2-D pool fire.
Figure 2. AFFF being dispensed via hand line on an
engine nacelle mock-up, 3-D running fuel fire.
Unfortunately, the long-term viability of AFFF in its cur-
rent composition has been threatened due to the presence
of certain constituents recently recognized by the Envi-
ronmental Protection Agency as emerging contaminants
[1]. Thus, understanding the physical performance at-
tributes of AFFF is critical for developing potential re-
placement and more environmentally friendly agents
with similar capability. Further, a simulation framework
sponsored by the Federal Aviation Administration
(FAA) is being developed to model a comprehensive air-
craft-crash-fire-suppression event. High quality valida-
tion data are needed to support the fire suppression as-
pect of this more involved, multi-tiered effort.
An aqueous firefighting agent application labora-
tory was constructed at West Virginia University (WVU)
to quantify AFFF firefighting jet flow characteristics and
their differentiation from conventional water-only fire-
fighting jets. The present work overviews the physical
nature of AFFF, the WVU laboratory set-up, the data ac-
quisition procedure, and the results from a 2-D phase
Doppler analysis on jets ranging from 1 to 11 MPa (150
to 1550 lbin-2) and 4 to 25 lmin-1 (1 to 6.4 galmin-1) at
AFFF concentration levels ranging from 0 (pure water)
to 9 percent by volume.
Physical Nature of AFFF
Originally referred to as “light water,” AFFF has the
ability to cover a lower density liquid hydrocarbon fuel
surface with a foam layer to act as both a thermal and
evaporative barrier to hinder and ultimately extinguish
combustion. AFFF’s film-forming properties are de-
rived from its ability to sustain a thin film along the hy-
drocarbon fuel surface after the foam layer has collapsed,
exhibiting a unique capacity to self-heal if penetrated by
debris. Water alone is typically unsuccessful at extin-
guishing hydrocarbon fires because the higher density
water tends to sink below the lower density fuel provid-
ing negligible firefighting benefit [2].
Military specification (MIL-SPEC) C301MS 3-per-
cent AFFF manufactured by Chemguard and Williams®,
a subsidiary of Tyco International, was the AFFF con-
centrate used exclusively for the present study. Its con-
stituents and fluid properties are typical of most MIL-
SPEC AFFF formulations. MIL-SPEC AFFF is manu-
factured and distributed in concentrate form in either 3-
percent or 6-percent formulas. The percentage denotes
the volumetric proportion at which AFFF concentrate
must be mixed with water to generate a firefighting agent
solution capable of meeting MIL-SPEC performance cri-
teria [3]. In practice, most modern firefighting agent de-
livery systems allow for variable water-AFFF concen-
trate proportioning to suit specific needs [4]. Table 1
lists the known chemical constituents that make up the
AFFF concentrate used in the present study. Approxi-
mate AFFF concentrate compositions developed by
other manufacturers are listed in the following selected
references [5-8].
Chemical or Trade Name Percent Volume
Butyl carbitolTM 0 – 8
Magnesium sulfate 0.5 – 1.5
Ethylenediane tetra acetic acid 0.5 – 1.5
Hydrocarbon surfactant Proprietary
Fluorocarbon surfactant Proprietary
Table 1. Reported AFFF chemical constituents [9].
AFFF concentrate is primarily made up of an “ac-
tive” blend of hydrocarbon and fluorocarbon surfactants,
also referred to as surface active agents, in percentages
known exclusively to the manufacturer [4]. AFFF sur-
factant molecules prefer to align along a free surface
such that their hydrophilic heads migrate toward water
and their hydrophobic and oleophobic tails migrate to-
ward the fuel surface and air, respectively. Although flu-
orocarbon and hydrocarbon surfactant polar head groups
can exhibit strong similarities, fluorocarbon surfactant
tails are both hydrophobic and oleophobic by nature
whereas hydrocarbon surfactant tails are only hydropho-
bic [5]. Figure 3 illustrates the favorable orientation of
surfactant molecules when AFFF is situated between a
fuel-air interface.
Hydrocarbon fuel (liquid phase)
AFFF surfactant solution
Fluorocarbon
surfactant
Hydrocarbon
surfactant
+-+-Hydrophilic
ionic head
Hydrophobic
organic tail
Hydrophilic
ionic head
Hydrophobic /
oleophobic
organic tail
Air (gas phase)
Figure 3. Conceptual alignment of AFFF surfactants in
an air-water-fuel environment [4, 5].
In dynamic scenarios such as firefighting jets where
AFFF is injected into the atmosphere from a nozzle
breaking up into droplets, the surfactant’s preference to
self-orient becomes a time-dependent process based on
molecular diffusion. In the initial stages of injection into
air, surfactants are randomly distributed. As time pro-
gresses, the surfactant molecules undergo preferential
alignment to create an annular monolayer. The level of
organization the surfactants reach increases as surface
age increases [4]. This molecular process helps define
an instantaneous surface tension at a finite rate, better
known as the dynamic surface tension of the fluid. Fig-
ure 4 depicts this morphology using the cross-section of
a single airborne droplet of AFFF aging with time.
Time
Figure 4. Conceptual alignment of AFFF surfactants in
an airborne liquid jet droplet [4].
AFFF concentrate exhibits many of the same fluid
properties as water, most notably density, boiling point,
and freezing point. It is an order of magnitude more vis-
cous in standard conditions compared to water, but ex-
hibits Newtonian behavior at shear rates consistent with
most firefighting jet flow regimes [9, 10]. AFFF proper-
ties approach the properties of pure water more so once
the concentrate is diluted in typical proportions with wa-
ter to form firefighting agent solution. The greatest prop-
erty contrast is expectedly with surface tension due to the
presence of the hydrocarbon and fluorocarbon surfac-
tants and the molecular behavior previously discussed.
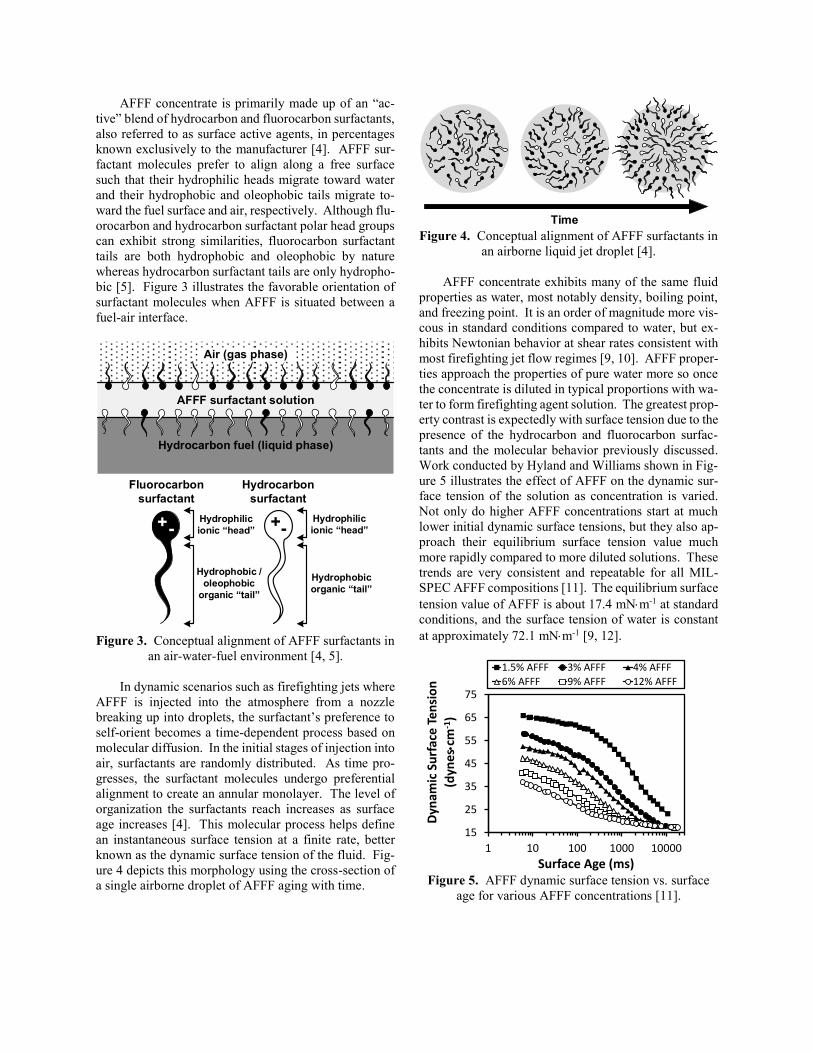
Work conducted by Hyland and Williams shown in Fig-
ure 5 illustrates the effect of AFFF on the dynamic sur-
face tension of the solution as concentration is varied.
Not only do higher AFFF concentrations start at much
lower initial dynamic surface tensions, but they also ap-
proach their equilibrium surface tension value much
more rapidly compared to more diluted solutions. These
trends are very consistent and repeatable for all MIL-
SPEC AFFF compositions [11]. The equilibrium surface
tension value of AFFF is about 17.4 mNm-1 at standard
conditions, and the surface tension of water is constant
at approximately 72.1 mNm-1 [9, 12].
Figure 5. AFFF dynamic surface tension vs. surface
age for various AFFF concentrations [11].
15
25
35
45
55
65
75
1 10 100 1000 10000
Dyn
amic
Su
rfac
e T
en
sio
n
(dyn
es
cm-1
)
Surface Age (ms)
1.5% AFFF 3% AFFF 4% AFFF
6% AFFF 9% AFFF 12% AFFF
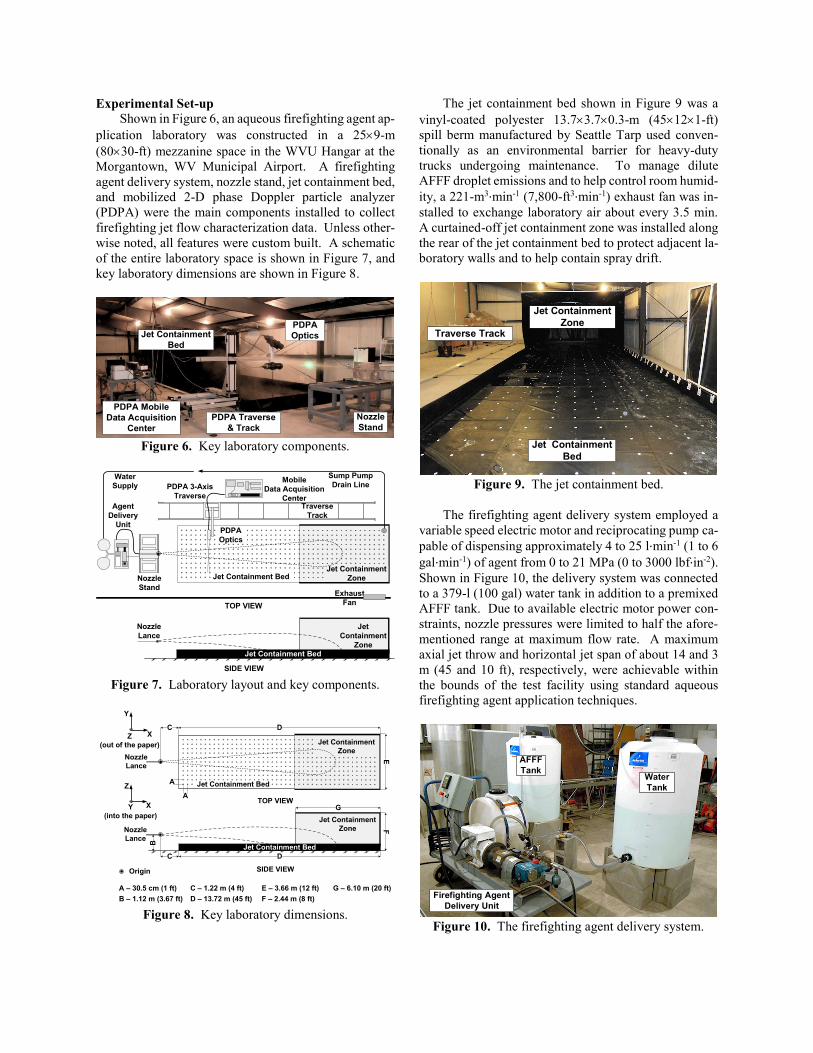
Experimental Set-up
Shown in Figure 6, an aqueous firefighting agent ap-
plication laboratory was constructed in a 259-m
(8030-ft) mezzanine space in the WVU Hangar at the
Morgantown, WV Municipal Airport. A firefighting
agent delivery system, nozzle stand, jet containment bed,
and mobilized 2-D phase Doppler particle analyzer
(PDPA) were the main components installed to collect
firefighting jet flow characterization data. Unless other-
wise noted, all features were custom built. A schematic
of the entire laboratory space is shown in Figure 7, and
key laboratory dimensions are shown in Figure 8.
Figure 6. Key laboratory components.
Figure 7. Laboratory layout and key components.
Figure 8. Key laboratory dimensions.
The jet containment bed shown in Figure 9 was a
vinyl-coated polyester 13.73.70.3-m (45121-ft)
spill berm manufactured by Seattle Tarp used conven-
tionally as an environmental barrier for heavy-duty
trucks undergoing maintenance. To manage dilute
AFFF droplet emissions and to help control room humid-
ity, a 221-m3·min-1 (7,800-ft3·min-1) exhaust fan was in-
stalled to exchange laboratory air about every 3.5 min.
A curtained-off jet containment zone was installed along
the rear of the jet containment bed to protect adjacent la-
boratory walls and to help contain spray drift.
Figure 9. The jet containment bed.
The firefighting agent delivery system employed a
variable speed electric motor and reciprocating pump ca-
pable of dispensing approximately 4 to 25 l·min-1 (1 to 6
gal·min-1) of agent from 0 to 21 MPa (0 to 3000 lbf·in-2).
Shown in Figure 10, the delivery system was connected
to a 379-l (100 gal) water tank in addition to a premixed
AFFF tank. Due to available electric motor power con-
straints, nozzle pressures were limited to half the afore-
mentioned range at maximum flow rate. A maximum
axial jet throw and horizontal jet span of about 14 and 3
m (45 and 10 ft), respectively, were achievable within
the bounds of the test facility using standard aqueous
firefighting agent application techniques.
Figure 10. The firefighting agent delivery system.
PDPA Mobile
Data Acquisition
Center
PDPA Traverse
& Track
Jet Containment
Bed
PDPA
Optics
Nozzle
Stand
Agent
Delivery
Unit
Nozzle
Stand
Jet Containment
Zone
Mobile
Data Acquisition
Center
PDPA 3-Axis
Traverse
Sump Pump
Drain Line
PDPA
Optics
Water
Supply
Jet Containment Bed
Traverse
Track
Exhaust
Fan
Jet
Containment
ZoneJet Containment Bed
Nozzle
Lance
TOP VIEW
SIDE VIEW
B
Jet Containment
Zone
C
X
Z
Y
(into the paper)
SIDE VIEW
Jet Containment Bed
Jet Containment Bed
A
A
C D
E
Jet Containment
Zone
TOP VIEW
F
X
Y
Z
(out of the paper)
G
Nozzle
Lance
Nozzle
Lance
Origin
A – 30.5 cm (1 ft) C – 1.22 m (4 ft) E – 3.66 m (12 ft) G – 6.10 m (20 ft)
B – 1.12 m (3.67 ft) D – 13.72 m (45 ft) F – 2.44 m (8 ft)
Jet Containment
Bed
Jet Containment
ZoneTraverse Track
Water
Tank
Firefighting Agent
Delivery Unit
AFFF
Tank

The nozzle stand was fabricated from a
2.41.20.9-m (843-ft) linear rail table that allowed
for three degrees of freedom to position the nozzle and
to provide fine alignment adjustment with respect to the
PDPA. The nozzle assembly stationed atop the nozzle
stand is shown in Figure 11.
Figure 11. The firefighting jet nozzle assembly.
A 6.4-mm (0.25-in) AP4™ Attack Tip (AP4) nozzle
made by Stoneage Waterblast Tools® was used to gener-
ate all firefighting jets. It was chosen due to its precise
manufacturing standards, the availability of a family of
self-similar simple nozzle profiles to span the entire pres-
sure-flow rate performance envelope of interest, and its
capacity to generate adequate foam accumulation on the
ground. The AP4 nozzle was a single bore nozzle with
a step-reducing channel. It is shown in Figure 12 from
multiple angles with D denoting the nozzle diameter.
Figure 12. The AP4 nozzle.
A 2-D PDPA manufactured by TSI, Inc. shown in
Figure 11 was used to acquire axial droplet velocity, ver-
tical droplet velocity, and droplet size data for each fire-
fighting jet [13, 14]. PDPA optics were cantilevered on
a 2-m (6.6 ft) “T” rail connected to a tri-axis traverse
overhanging the jet containment bed and arranged in
back-scatter mode 30 degrees off-set from one another.
To improve measurement confidence, three photo detec-
tors were used to generate a correlation based on two in-
dependent droplet size measurements.
The traverse was rolled on a V-groove track adja-
cent to the jet containment bed to provide measurement
access over its entire length. PDPA system components
were tethered to the traverse by fiber optic and traverse
power cables. The traverse had a local measurement
range of 1 m3, sub-millimeter movement precision, and
was controlled by the PDPA data acquisition software.
Table 2 summarizes key PDPA hardware and soft-
ware settings. Axial and vertical droplet velocity were
recorded on channel one and two using laser beam wave-
lengths () of 514.5 nm and 488 nm, respectively.
Figure 13. PDPA System Components.
Platform
Nozzle Lance
Lateral
Adjustment
Vertical
Adjustment
Nozzle
Side
View
Front
View
Isometric
View
Cross-Section
ViewNozzle Profile
D
PDPA
Computer
Signal
Analyzer
Photo Detector
Module
Oscilloscope
Transmitter
Probe
Optical
Receiver
5 W Argon-Ion LaserBeam Separator
Traverse
Controller
Laser Power
Supply

Setting Value
Transmitter focal length (mm) 1000
Receiver focal length (mm 1000
Slit aperture (m) 150
Min-max diameter (m) 2 - 685
Measuring vol. diameter (mm) 0.370
Measuring vol. length (mm) 8.77
Beam expander ratio (-) 2.11
Bragg cell freq. (MHz) 40
Ch. 1 min/max velocity limit (ms-1) -24.4/175.4
Ch. 2 min/max velocity limit (ms-1) -23.1/185.1
Max. no. of samples 50,000
Time out (s) 20
Band pass filter (Mhz) 2 - 20
Down mix freq. (Mhz) 36
Index of refraction 1.33
Scattering mode Internal reflection
Table 2. Key PDPA hardware and software settings.
Data Acquisition Procedure
Phase Doppler data were acquired at five pressure-
flow rate nozzle settings shown in Figure 14 with respect
to the firefighting agent delivery system performance en-
velope.
Figure 14. Nozzle pressure-flow rate conditions tested.
Results from each nozzle setting numbered in Figure 14
are referred to via their case name listed in Table 3. Wa-
ter and 6-percent AFFF were the primary agent compo-
sitions tested. Six-percent AFFF refers to C301MS pro-
portioned at 6 parts AFFF concentrate and 94 parts wa-
ter. An AFFF concentration sensitivity study was also
conducted at the medium flow, medium pressure nozzle
setting at the quantities shown in Figure 14.
No. Case name
1 Low flow, low pressure
2 Low flow, high pressure
3 Medium flow, medium pressure
4 High flow, low pressure
5 High flow, high pressure
Table 3. Firefighting jet case name description.
For each of the five firefighting jet nozzle condi-
tions, nine to eleven 1-D vertical (z-direction) profiles
were recorded depending on jet reach shown in Figure
15. The axial distance downstream of each profile sta-
tion shown in Figure 15 is listed in Table 4. Locations
where the AFFF concentration study was conducted are
denoted by an asterisk.
Figure 15. Phase Doppler profile measurement
locations.
Vertical profile station no. X-axis location
1 6.4 mm (0.25 in)
2 25.4 mm (1 in)
3* 0.152 m (6in)
4 0.305 m (1 ft)
5* 0.914 m (3 ft)
6 1.52 m (5 ft)
7* 3.05 m (10 ft)
8 4.57 m (15 ft)
9* 6.10 m (20 ft)
10 7.62 m (25 ft)
11 9.14 m (30 ft)
* AFFF Concentration Study
Table 4. Phase Doppler profile measurement locations.
Flow Regime
of Interest
Nozzle
Performance
EnvelopePDPA Test Points
AFFF Concentration Sensitivity Study
(Water, 6% AFFF)
(Water; 3% , 6% , 9% AFFF)
1
2
3
4
5
Jet Containment Bed
X
Y
Z
(out of the paper)
TOP VIEW
Nozzle
Lance
654312 7 8 9 10 11Nozzle
Lance
Jet Containment
Zone
X
Z
Y
(into the paper)
SIDE VIEW
AFFF
Concentration
Study
Locations
OriginPDPA
Measurement
Envelope
Z-direction
Vertical
PDPA
Profiles
Jet Containment Bed
Firefighting
Jet
Region
Jet Containment
Zone

For each profile location, phase Doppler data were
collected first on a fully-developed water jet. Once com-
pleted, the firefighting agent delivery system was manu-
ally transitioned to dispense AFFF while maintaining
current pump speed and nozzle exit velocity. While the
AFFF jet was developing, the PDPA traverse re-traced
its steps in space to repeat the measurement process for
the AFFF jet at the same discrete locations where water
jet data were previously recorded. Twenty-five phase
Doppler point measurements were recorded for each pro-
file. Points were located close together near the jet axial
centerline to resolve steep velocity gradients, and then
rapidly expanded outward to measure as much of the jet
as possible within the range of the traverse measurement
volume while stationed at that particular location on the
track. Uneven, time-sampled data were recorded for
twenty seconds at each point or a combined 50,000 valid
droplet velocity and diameter measurement count,
whichever limit was reached first. Profile locations were
spaced axially in close proximity to the nozzle to capture
large jet velocity gradients, and then expanded further
downstream where change in measured values were less
drastic. Profiles were subject to variation in relative dis-
tance from the ground due to profile relaxation from
droplet dispersion and overall jet sag due to gravity.
Axial droplet velocity (Vd,X) and vertical droplet ve-
locity (Vd,Z) for both the axial and vertical components
were calculated based on the following general equation
for measuring droplet velocity,
Vd = fDoppler (1)
where is the measuring volume fringe spacing and
fDoppler is the measured Doppler frequency. The fringe
spacing is calculated by,
=
2sin(/2)
(2)
where is the laser beam intersection angle at the meas-
uring volume. The droplet diameter (d) is derived based
on the measured phase shift angle () from the following
equation,
360=M
Photo Detector Separation
Receiver Focal Length
d
(3)
where M is the slope of the phase-diameter relationship
based on Mie theory and constants defined by the PDPA
optics and droplet fluid medium [14, 15].
Results
Firefighting jet Reynolds numbers based on nozzle
diameter were fully turbulent on the order of 105 for all
cases considered in the present study. Consistent with
spray types involving hole-type fuel injectors or pressure
atomizers, the AP4 nozzle family was best represented
by a log normal droplet size distribution. Of the log nor-
mal based fitting functions available in the Phase Dop-
pler data acquisition software Flowsizer™, the Nuki-
yama-Tanasawa distribution function provided the best
fit for all phase Doppler firefighting jet points measured.
The Nukiyama-Tanasawa distribution is defined as fol-
lows,
f(d) = d2exp - (bd)q (4)
where f(d) is a number distribution function describing
the number of droplets of a given diameter. The param-
eters b and q are fit variables [14]. The characteristic
droplet size distribution measured is shown in Figure 16
comparing a water and 6-percent AFFF jet over a range
of 25 discrete, equal width droplet size bins. All 50,000
sampled points are shown in Figure 17 illustrating the
droplet diameter versus axial droplet velocity. No sig-
nificant clipping along the phase Doppler upper diameter
measurement range was observed. Water and AFFF jets
have similar distributions except water jets exhibited
larger mean droplet diameters. This pattern was con-
sistent for all firefighting jet pressure-flow rate combina-
tions examined.
Figure 16. Characteristic firefighting jet droplet diam-
eter distribution with accompanying fit.
WATER FIT
6% AFFF FIT

Figure 17. Characteristic firefighting jet raw data sam-
ple of axial droplet velocity vs. droplet diameter distri-
bution.
Figures 18 through 21 depict profile samples from
the medium flow, medium pressure nozzle condition at
x = 6.10 m (20 ft) downstream from the nozzle. These
results show how water and 6-percent AFFF agent verti-
cal 1-D spatial profiles typically compared with one an-
other. Data points are presented in terms of time-aver-
aged axial droplet velocity, vertical droplet velocity,
mean diameter (D10), and Sauter mean droplet diameter
(D32). The horizontal bars shown in the velocity plots
of Figures 18 and 19 indicate the minimum and maxi-
mum ±RMS velocity for each profile. Solid bars are as-
sociated with water jets and dashed bars are associated
with AFFF jets. RMS diameter ranges were approxi-
mately equivalent between water and AFFF jets.
A statistically unbiased order of magnitude estimate
(E) of the deviation between the experimentally time-av-
eraged droplet velocity and diameter values from their
true mean values was found for a select number of points
using autocorrelation techniques. By autocorrelating
each raw signal (), the number of samples it took for
the signal to decorrelate (Ndecorr) was calculated. This
information, the RMS and mean sample data values,
along with the total number of recorded samples (N) was
used to estimate E from the following relationship,
E= RMS
√NNdecorr-1
(5)
Five equally-spaced points out of the total 25 point pro-
file were used to calculate a ±E range for velocity and
mean droplet diameter measurements shown in Figures
18 through 20 [10].
Measurement error was difficult to determine accu-
rately as it was a function of not only hardware resolution
but also spatial system alignment. Taking these factors
into account, velocity measurement uncertainty was typ-
ically less than 0.50 percent of the measured velocity.
Droplet diameter measurement uncertainty had similar
dependencies and was generally less than one percent of
the maximum measurable droplet diameter plus one per-
cent of the actual measured droplet diameter [16].
Figure 18. Vertical (z) profile location vs. mean axial
droplet velocity.
Figure 19. Vertical (z) profile location vs. mean verti-
cal droplet velocity.
Figure 20. Vertical (z) profile location vs. mean drop-
let diameter.
-500
-400
-300
-200
-100
0
100
200
300
400
-2 0 2 4 6 8 10 12
Ve
rtic
al (
Z) L
oca
tio
n (
mm
)
Mean Vd,X (ms-1)
WATER
6% AFFFEWATER = 0.27 ms-1
E6% AFFF = 0.35 ms-1
-500
-400
-300
-200
-100
0
100
200
300
400
-3 -2 -1 0 1 2 3
Ve
rtic
al (
Z) L
oca
tio
n (
mm
)
Mean Vd,Z (ms-1)
WATER
6% AFFF
EWATER = 0.05 ms-1
E6% AFFF = 0.04 ms-1
-500
-400
-300
-200
-100
0
100
200
300
400
0 10 20 30 40 50 60 70 80 90
Ve
rtic
al (
Z) L
oca
tio
n (
mm
)
D10 (m)
WATER
6% AFFF
EWATER = 0.30 m
E6% AFFF = 0.34 m

Figure 21. Vertical (z) profile location vs. Sauter mean
droplet diameter.
Data from each 1-D vertical profile composed of 25
time-averaged discrete points were spatially-averaged to
generate a single mean profile value that could be more
easily reported. This process is illustrated in Figure 22.
The phase Doppler results from all five nozzle settings
have been condensed in this manner to summarize the
global patterns observed in Figures 23 through 30.
Figure 22. A schematic depicting how spatially-aver-
aged, mean profile flow parameter values were defined.
In this group of figures, spatially-averaged water jet
data immediately precede 6-percent AFFF jet data for
axial droplet velocity, vertical droplet velocity, mean
droplet diameter, and Sauter mean droplet results. Dif-
ferentiation among water and AFFF jet velocity results
shown in Figures 23 through 26 was not very remarka-
ble. The greatest discrepancies were measured to be
about 10 percent and 2 percent for axial and vertical
droplet results, respectively. For the majority of vertical
droplet results, differences between water and AFFF jets
were statistically insignificant.
Spatially-averaged, mean profile droplet diameters
for all nozzle pressure-flow rate settings were globally
reduced by about 7 to 38 percent with the addition of
AFFF. Discrete, time-averaged measurement points
within each profile exhibited relative differences by as
much as 25 to 100 percent. This resulted in the most de-
finitive measure of difference between water and AFFF
jets. Low pressure jets exhibited the greatest reduction
in mean droplet size compared to high pressure jets due
to the generation of relatively larger initial droplet diam-
eters with longer airborne residency times. The reduc-
tion in mean droplet size was due to the surface tension-
lowering surfactant additives which decreased local We-
ber numbers and enhanced overall jet break-up. Nozzle
pressure increases also decreased mean droplet diameter,
which was expected as jet atomization and secondary
break-up was further enhanced. The loss in AFFF drop-
let size reduced AFFF droplet mass causing a general
loss of firefighting jet spray momentum. This loss in
momentum caused the aforementioned disparity ob-
served in axial droplet velocity and less so for the vertical
droplet velocity measurements.
Sauter mean droplet diameters followed a similar
trend for three out of the five nozzle settings compared
to the mean droplet diameter results. However, the other
two nozzle settings generated conflicting results. Low
flow, high pressure and medium flow, medium pressure
jets showed AFFF jet Sauter mean droplet sizes ex-
ceeded water jet Sauter mean droplet sizes. A closer in-
spection of full profile data showed a large amount of
scatter between AFFF jet sampling points, particularly in
the far downstream portion of each jet. This indicated a
non-negligible number of non-spherical, bubble-like
AFFF formations much larger than the water droplets
may have been improperly validated by the PDPA skew-
ing Sauter mean droplet diameter results for these partic-
ular jet locations. It should also be noted that very few
(e.g. 10 or less) droplets measured in the upper threshold
of the PDPA measurement envelope in a field of 50,000
data samples were capable of altering Sauter mean drop-
let diameter results by 10 percent or more.
AFFF concentration sensitivity results ranging
from water to 9-percent AFFF showed negligible change
in flow parameters beyond the manufacturer’s recom-
mended proportional mixing level with water for both
velocity and mean droplet diameter measurements. This
was not surprising as there has been little evidence to
show firefighting effectiveness can been significantly in-
creased by an increase in AFFF concentration over man-
ufacturer requirements to meet MIL-SPEC foam gener-
ation performance guidelines. A sample of these profile
results exercised on the medium flow, medium pressure
nozzle condition at x = 6.10 m (20 ft) are shown in Fig-
ures 31 through 34.
-500
-400
-300
-200
-100
0
100
200
300
400
0 100 200 300 400
Ve
rtic
al (
Z) L
oca
tio
n (
mm
)
D32 (m)
WATER
6% AFFF
9 10
Mean
Profile Flow
Parameter
Value
Side View
PDPA
Measurement
Envelope
Z-direction
Vertical PDPA
Profiles
Firefighting Jet
Region
Example
Measurement
Location

Figure 23. Mean profile, mean axial droplet velocity
of water jets vs. axial distance downstream.
Figure 24. Mean profile, mean axial droplet velocity
of 6% AFFF jets vs. axial distance downstream.
Figure 25. Mean profile, mean vertical droplet velocity
of water jets vs. axial distance downstream.
Figure 26. Mean profile, mean vertical droplet velocity
of 6% AFFF jets vs. axial distance downstream.
Figure 27. Mean profile, mean droplet diameter of wa-
ter jets vs. axial distance downstream.
Figure 28. Mean profile, mean droplet diameter of 6%
AFFF jets vs. axial distance downstream.
0
10
20
30
40
50
60
70
80
90
0 2000 4000 6000 8000 10000
Me
an P
rofi
le
Mea
n V
d,X
(ms
-1)
XD-1
HIGH FLOW, LOW PRESS
LOW FLOW, LOW PRESS
MED FLOW, MED PRESS
HIGH FLOW, HIGH PRESS
LOW FLOW, HIGH PRESS
0
10
20
30
40
50
60
70
80
90
100
0 2000 4000 6000 8000 10000
Mea
n P
rofi
le D
10
(
m)
XD-1
HIGH FLOW, LOW PRESS
LOW FLOW, LOW PRESS
MED FLOW, MED PRESS
HIGH FLOW, HIGH PRESS
LOW FLOW, HIGH PRESS
0
10
20
30
40
50
60
70
80
90
100
0 2000 4000 6000 8000 10000
Mea
n P
rofi
le D
10
(
m)
XD-1
HIGH FLOW, LOW PRESS
LOW FLOW, LOW PRESS
MED FLOW, MED PRESS
HIGH FLOW, HIGH PRESS
LOW FLOW, HIGH PRESS

Figure 29. Mean profile, Sauter mean droplet diameter
of water jets vs. axial distance downstream.
Figure 30. Mean profile, Sauter mean droplet diameter
of 6% AFFF jets vs. axial distance downstream.
Figure 31. Vertical (z) profile location vs. mean axial
droplet velocity for various AFFF concentrations.
Figure 32. Vertical (z) profile location vs. mean verti-
cal droplet velocity for various AFFF concentrations.
Figure 33. Vertical (z) profile location vs. mean drop-
let diameter for various AFFF concentrations.
Figure 34. Vertical (z) profile location vs. Sauter mean
droplet diameter for various AFFF concentrations.
0
50
100
150
200
250
300
350
400
0 2000 4000 6000 8000 10000
Mea
n P
rofi
le D
32
(
m)
XD-1
HIGH FLOW, LOW PRESS
LOW FLOW, LOW PRESS
MED FLOW, MED PRESS
HIGH FLOW, HIGH PRESS
LOW FLOW, HIGH PRESS
0
50
100
150
200
250
300
350
400
0 2000 4000 6000 8000 10000
Mea
n P
rofi
le D
32
(
m)
XD-1
HIGH FLOW, LOW PRESS
LOW FLOW, LOW PRESS
MED FLOW, MED PRESS
HIGH FLOW, HIGH PRESS
LOW FLOW, HIGH PRESS
-500
-400
-300
-200
-100
0
100
200
300
400
0 2 4 6 8 10 12
Ve
rtic
al (
Z) L
oca
tio
n (
mm
)
Mean Vd,X (ms-1)
WATER
3% AFFF
6% AFFF
9% AFFF
-500
-400
-300
-200
-100
0
100
200
300
400
-3 -2 -1 0 1 2 3
Ve
rtic
al (
Z) L
oca
tio
n (
mm
)
Mean Vd,Z (ms-1)
WATER
3% AFFF
6% AFFF
9% AFFF
-500
-400
-300
-200
-100
0
100
200
300
400
0 10 20 30 40 50 60 70 80 90
Ve
rtic
al (
Z) L
oca
tio
n (
mm
)
D10 (m)
WATER
3% AFFF
6% AFFF
9% AFFF
-20
-15
-10
-5
0
5
10
15
20
0 50 100 150 200 250 300 350 400
Ve
rtic
al (
Z) L
oca
tio
n (
mm
)
D32 (m)
WATER
3% AFFF
6% AFFF
9% AFFF

Conclusions
Although PDPA had its limitations in terms of dis-
crete point measurements, spherical particle assump-
tions, and possessing a finite droplet size measurement
range, all of the firefighting jet flow regimes queried in
the present study provided results of high enough quality
to warrant further, more detailed investigations of AFFF
jets using PDPA. The following key findings were
made:
The AP4 nozzle family generated firefighting jets
with a log-normal droplet size distribution con-
sistent with other hole-type or pressure atomizer
nozzles. The Nukiyama-Tanasawa model provided
the best fit.
Mean droplet size was the primary flow parameter
effected by the addition of AFFF due its surfactant
ingredients reducing surface tension by about a fac-
tor of four. AFFF reduced spatially-averaged, mean
profile droplet sizes from approximately 7 to as
much as 38 percent compared to water jets depend-
ing on nozzle conditions. Lower pressure jets were
more greatly influenced by AFFF compared to
higher pressure jet conditions. Discrete, time-aver-
aged measurement points within each profile exhib-
ited relative differences by as much as 12 to 50 per-
cent. Because droplet size was substantially de-
creased, AFFF jets incurred a greater loss in mo-
mentum compared to water jets which caused veloc-
ities primarily in the axial direction to diminish by
as much as 10 percent.
Increasing AFFF concentration significantly beyond
the manufacturer’s recommended levels did not sig-
nificantly alter in-flight droplet flow parameters.
An increase in AFFF concentration was most notice-
ably observed within Sauter mean diameter results
where a possible growing faction of abnormally
large bubble-like, droplet distortions could more
easily influence a larger sample size.
Future Work
Follow-on work calls for the near field characteriza-
tion of AFFF-surface interactions to better understand
agent (foam) accumulation mechanics and their influ-
ence on aircraft structures engulfed in fire. Work will
also continue on the development of a firefighting agent
application model that takes in to account the effects of
AFFF and its integration into an aircraft-crash-fire sup-
pression risk assessment model.
Acknowledgements
This effort was funded by the FAA Airport and Air-
craft Safety R&D Division via an interagency agreement
with the Air Force Research Laboratory (AFRL) through
federal contract no. FA4819-10-C-0013. Mr. John
Hawk of the AFRL, and Mr. Kristofor Cozart, Mr. Wil-
liam Fischer, and Mr. Steven Wells of Applied Research
Associates, Inc. are acknowledged for their support in
developing laboratory capabilities. Mr. Nicholas Hillen
of WVU is also recognized for his help in laboratory con-
struction and data acquisition.
References
1. United States Environmental Protection Agency,
Emerging Contaminants – Perfluorooctane Sulfonate
(PFOS) and Perfluoroctanic Acid (PFOA), Emerging
Contaminants Fact Sheet – PFOS and PFOA, Solid
Waste and Emergency Response (5106P), EPA 505-
F-11-002, March 2013.
2. Fittes, D.W., and Nash, P., Fire Technology 5:284-
298 (1969).
3. U.S. Military Specification MIL-F 24385F, “Fire-
fighting Extinguishing Agent, Aqueous Film-Form-
ing Foam (AFFF) Liquid Concentrate for Fresh and
Sea Water,” Naval Sea Systems Command (1992).
4. Enlow, M.A., Dierdorf, D.S., and Campbell, R.,
“Time Dependent Analysis of Hydrocarbon and Flu-
orocarbon Surfactant Solutions, Air Force Research
Laboratory Report No. AFRL-RX-TY-TR-2010-
0075.
5. Moody, C.A., and Field, J.A., Environmental Science
& Technology 34:3864-3870 (2000).
6. Vecitis, C.D., Wang, Y., Cheng, J., Park, H., Mader,
B.T., and Hoffmann, M.R., Environmental Science &
Technology 44:432-438 (2010).
7. Magrabi, S.A., Dlugogorski, B.Z., and Jameson, G.J.,
Fire Safety Journal 37:21-52 (2002).
8. Carruette, M.L., Persson, H., and Pabon, M., Fire
Technology 40:367-384 (2004).
9. Chemguard C301MS, “Material Data Safety Sheet,”
Chemguard, Inc., www.chemguard.com, January
2011.
10. Menchini, C., “Experimental Flow Characterization
and Computational Model Development of Aqueous
Film-Forming Foam Firefighting Jets,” Ph.D. Thesis,
West Virginia University, Morgantown, WV (2013).
11. Hyland, E.K., and Williams, B.A., “Characterization
of the Dynamic Surface Tension of Aqueous Film-
Forming Foam,” Navy Research Laboratory Report
No. NRL/MR/6180—04-8749.
12. United States: National Bureau of Standards, Jour-
nal of Physical and Chemical Reference Data, Amer-
ican Chemical Society 7 (3) 1978.
13. TSI Incorporated, Phase Doppler Particle Analyzer
(PDPA)/Laser Doppler Velocimeter Installation
Manual, P/N 1990024 Rev. B, 2005.
14. TSI Incorporated, “Phase Doppler Particle Analyzer
(PDPA)/Laser Doppler Velocimeter Operations
Manual, P/N 1990048 Rev. D, 2005.

15. Albrecht, H.E., Laser Doppler and Phase Doppler
Measurement Techniques, Springer Online Library,
2003.
16. Lai, W., Shakal, J., and Troolin, D., “Accuracy, Res-
olution, and Repeatability of Powersight PDA and
LDV Systems, TSI Technical Note P/N 5001520
(A4), 2013.