Embed Size (px)
Citation preview

Phase Equilibrium
Engr 2110 – Chapter 9
Dr. R. R. Lindeke
Topics for Study
� Definitions of Terms in Phase studies
� Binary Systems�Complete solubility (fully miscible) systems
�Multiphase systems
� Eutectics
� Eutectoids and Peritectics
� Intermetallic Compounds
� The Fe-C System
Some Definitions
Component of a system: Pure metals and or compounds of which an
alloy is composed, e.g. Cu and Ag or Fe and Fe3C. They are the
solute(s) and solvent
System: A body of engineering material under investigation. e.g. Ag – Cu
system, NiO-MgO system (or even sugar-milk system)
Solubility Limit: The maximum concentration of solute atoms that may
dissolve in the Solvent to form a “solid solution” at some temperature.
Phases: A homogenous portion of a system that has uniform physical and
chemical characteristics, e.g. pure material, solid solution, liquid solution,
and gaseous solution, ice and water, syrup and sugar.
Microstructure: A system’s microstructure is characterized by the number
of phases present, their proportions, and the manner in which they are
distributed or arranged. Factors affecting microstructure are: alloying
elements present, their concentrations, and the heat treatment of the alloy.
Single phase system = Homogeneous system
Multi phase system = Heterogeneous system or mixtures
Definitions, cont
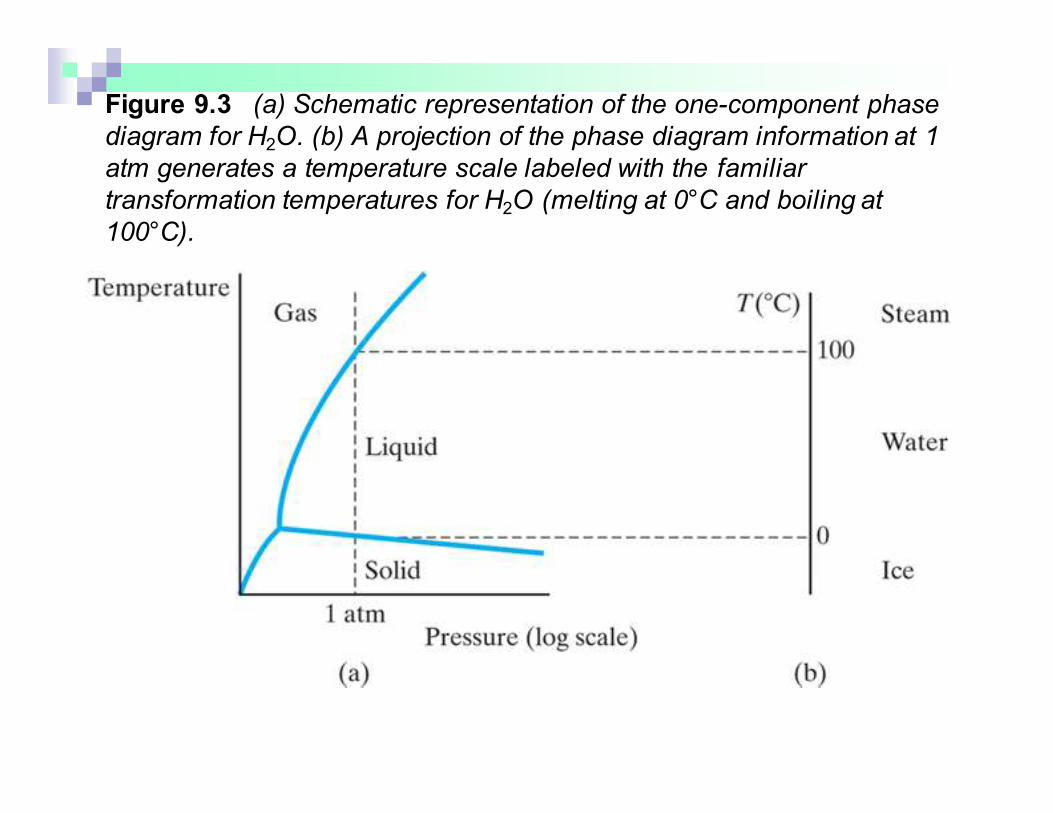
Figure 9.3 (a) Schematic representation of the one-component phase
diagram for H2O. (b) A projection of the phase diagram information at 1
atm generates a temperature scale labeled with the familiar
transformation temperatures for H2O (melting at 0°C and boiling at
100°C).

Figure 9.4 (a) Schematic representation of the one-component phase
diagram for pure iron. (b) A projection of the phase diagram information
at 1 atm generates a temperature scale labeled with important
transformation temperatures for iron. This projection will become one
end of important binary diagrams, such as that shown in Figure 9.19
Phase Equilibrium: A stable configuration with lowest free-energy (internal energy of
a system, and also randomness or disorder of the atoms or molecules (entropy).
Any change in Temperature, Composition, and Pressure causes an increase in free
energy and away from Equilibrium thus forcing a move to another ‘state’
Equilibrium Phase Diagram: It is a “map” of the information about the control of
microstructure or phase structure of a particular material system. The relationships
between temperature and the compositions and the quantities of phases present at
equilibrium are represented.
Definition that focus on “Binary Systems”
Binary Isomorphous Systems: An alloy system that contains two components that attain
complete liquid and solid solubility of the components, e.g. Cu and Ni alloy. It is the
simplest binary system.
Binary Eutectic Systems: An alloy system that contains two components that has a
special composition with a minimum melting temperature.
Definitions, cont
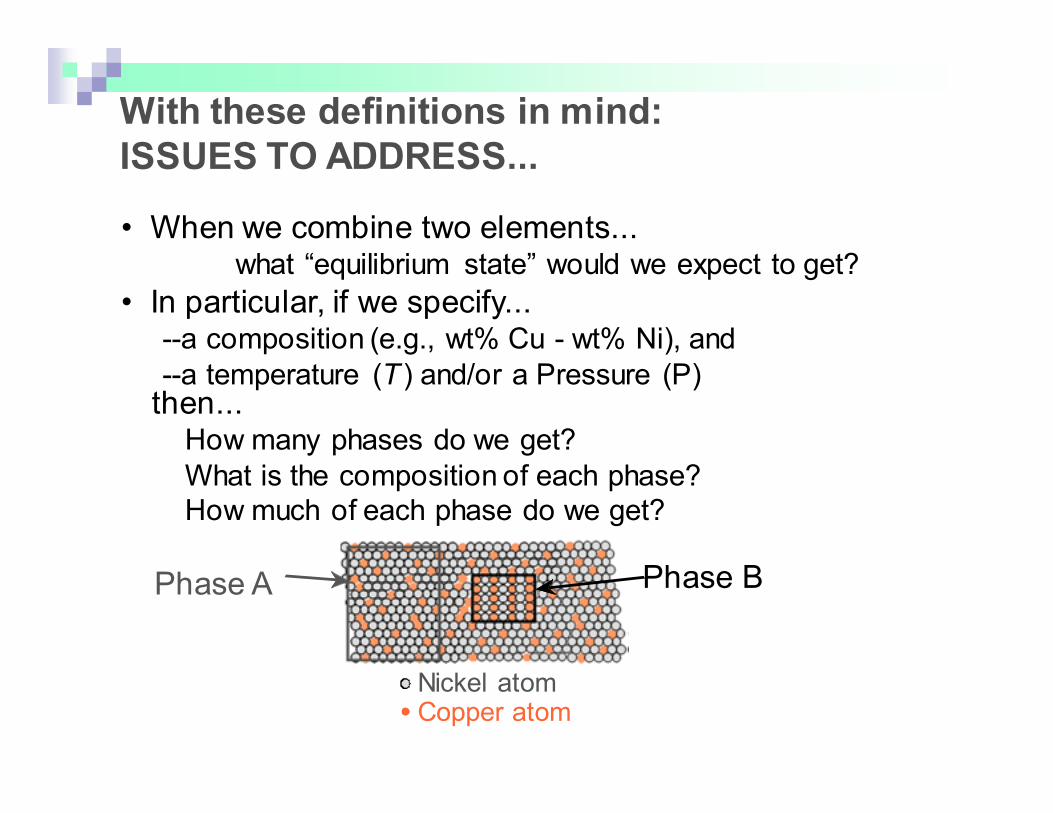
With these definitions in mind:
ISSUES TO ADDRESS...
• When we combine two elements...what “equilibrium state” would we expect to get?
• In particular, if we specify...--a composition (e.g., wt% Cu - wt% Ni), and
--a temperature (T ) and/or a Pressure (P)then...
How many phases do we get?
What is the composition of each phase?
How much of each phase do we get?
Phase BPhase A
Nickel atomCopper atom

Gibb’s Phase Rule: a tool to define the number of phases and/or degrees of phase changes that can be
found in a system at equilibrium
� For any system under study the rule determines if the system is at equilibrium
� For a given system, we can use it to predict how many phases can be expected
� Using this rule, for a given phase field, we can predict how many independent parameters (degrees of freedom) we can specify
� Typically, N = 1 in most condensed systems – pressure is fixed!
where:
F is # degrees of freedom of the system (independent parameters)
C is # components (elements) in system
P is # phases at equil.
N is # "noncompostional" parameters in system (temp &/or Press
F C P N= − +
ure)
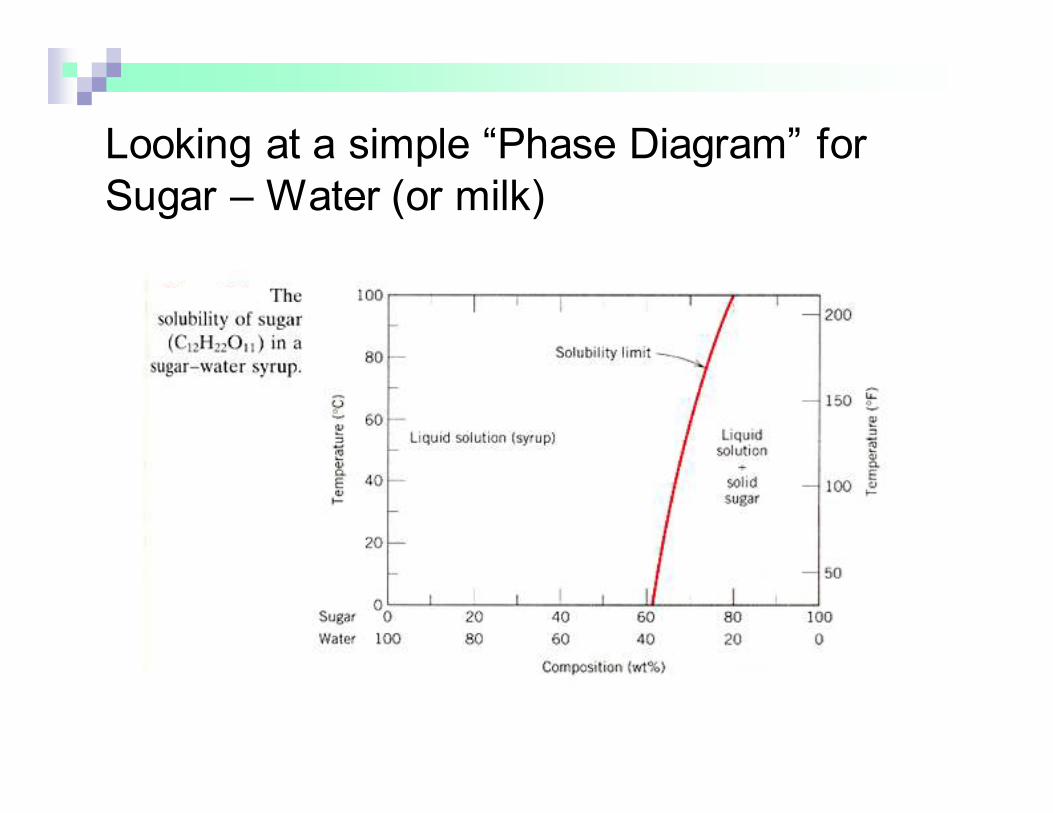
Looking at a simple “Phase Diagram” for
Sugar – Water (or milk)
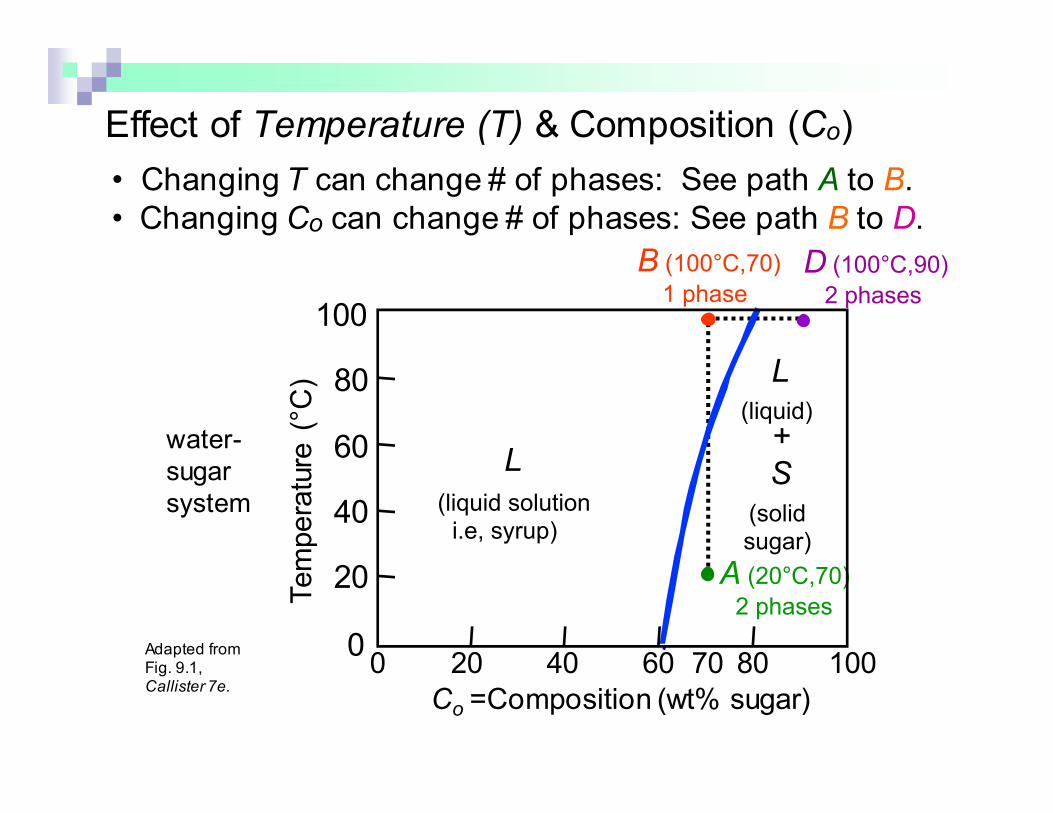
Effect of Temperature (T) & Composition (Co)
• Changing T can change # of phases:
D (100°C,90)
2 phases
B (100°C,70)
1 phase
See path A to B.
• Changing Co can change # of phases: See path B to D.
Adapted from Fig. 9.1, Callister 7e.
A (20°C,70)
2 phases
70 80 1006040200
Temperature (°C
)
Co =Composition (wt% sugar)
L
(liquid solutioni.e, syrup)
20
100
40
60
80
0
L(liquid) + S
(solid sugar)
water-
sugar
system
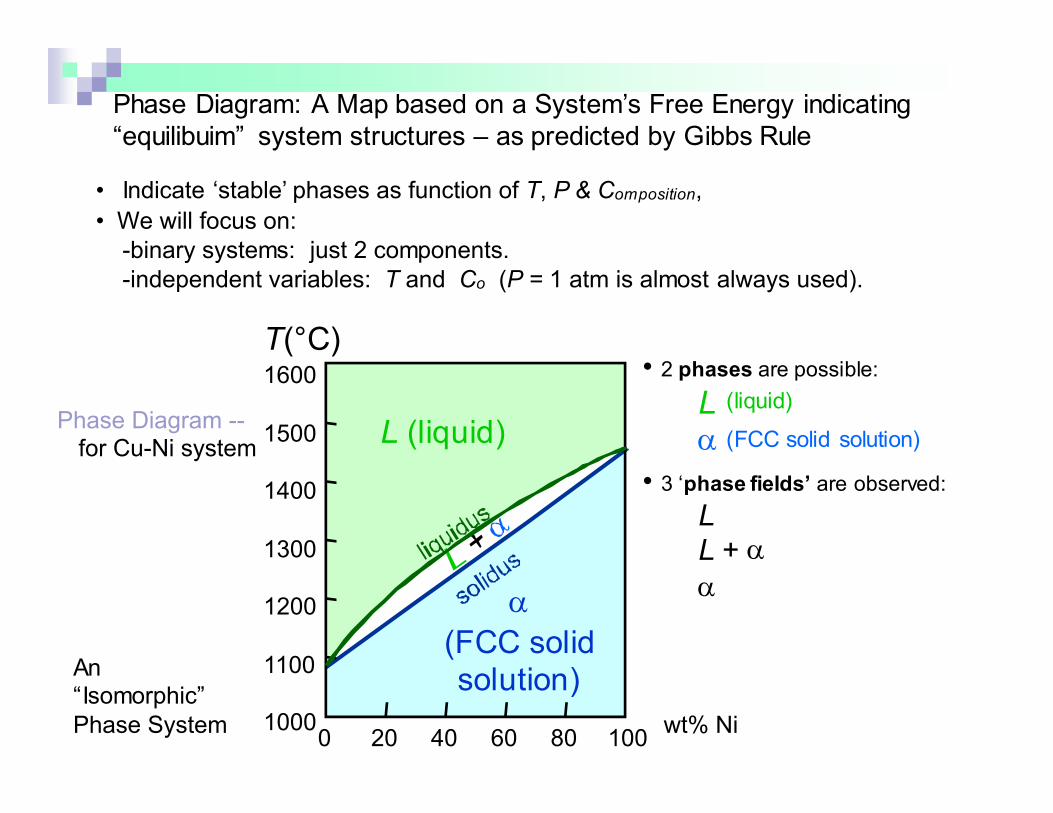
Phase Diagram: A Map based on a System’s Free Energy indicating
“equilibuim” system structures – as predicted by Gibbs Rule
• Indicate ‘stable’ phases as function of T, P & Composition,
• We will focus on:
-binary systems: just 2 components.
-independent variables: T and Co (P = 1 atm is almost always used).
Phase Diagram --for Cu-Ni system
• 2 phases are possible:
L (liquid)
α (FCC solid solution)
• 3 ‘phase fields’ are observed:
L
L + α
α
wt% Ni20 40 60 80 1000
1000
1100
1200
1300
1400
1500
1600
T(°C)
L (liquid)
α
(FCC solid solution)An
“Isomorphic”
Phase System
wt% Ni20 40 60 80 10001000
1100
1200
1300
1400
1500
1600
T(°C)
L (liquid)
α(FCC solid solution)
Cu-Ni
phase
diagram
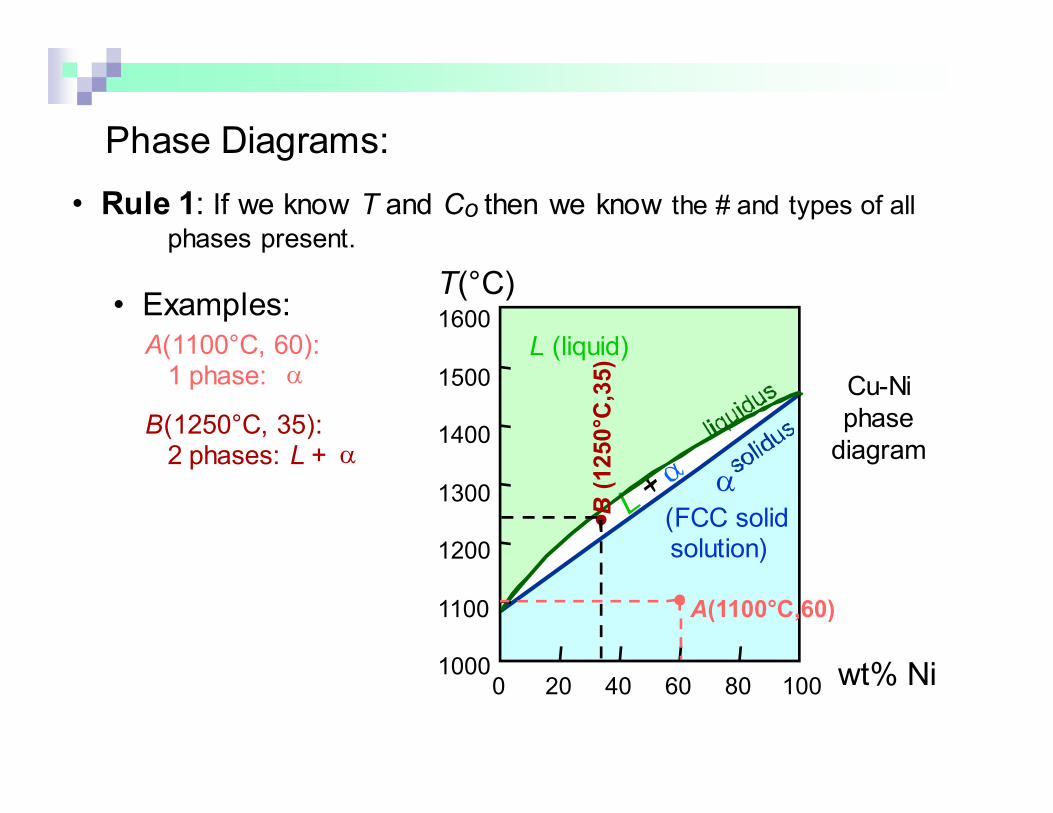
Phase Diagrams:
• Rule 1: If we know T and Co then we know the # and types of all
phases present.
• Examples:
A(1100°C, 60): 1 phase: α
B(1250°C, 35): 2 phases: L + α
B(1250°C,35)
A(1100°C,60)

wt% Ni
20
1200
1300
T(°C)
L (liquid)
α
(solid)
30 40 50
Cu-Ni
system
Phase Diagrams:
• Rule 2: If we know T and Co we know the composition of each phase
• Examples:TA
A
35Co
32CL
At TA = 1320°C:
Only Liquid (L) CL = Co ( = 35 wt% Ni)
At TB = 1250°C:
Both α and L
CL = C liquidus ( = 32 wt% Ni here)
Cα = Csolidus ( = 43 wt% Ni here)
At TD = 1190°C:
Only Solid ( α)
Cα = Co ( = 35 wt% Ni)
Co = 35 wt% Ni
adapted from Phase Diagrams
of Binary Nickel Alloys, P. Nash (Ed.), ASM
International, Materials Park, OH, 1991.
BTB
DTD
tie line
4Cα3
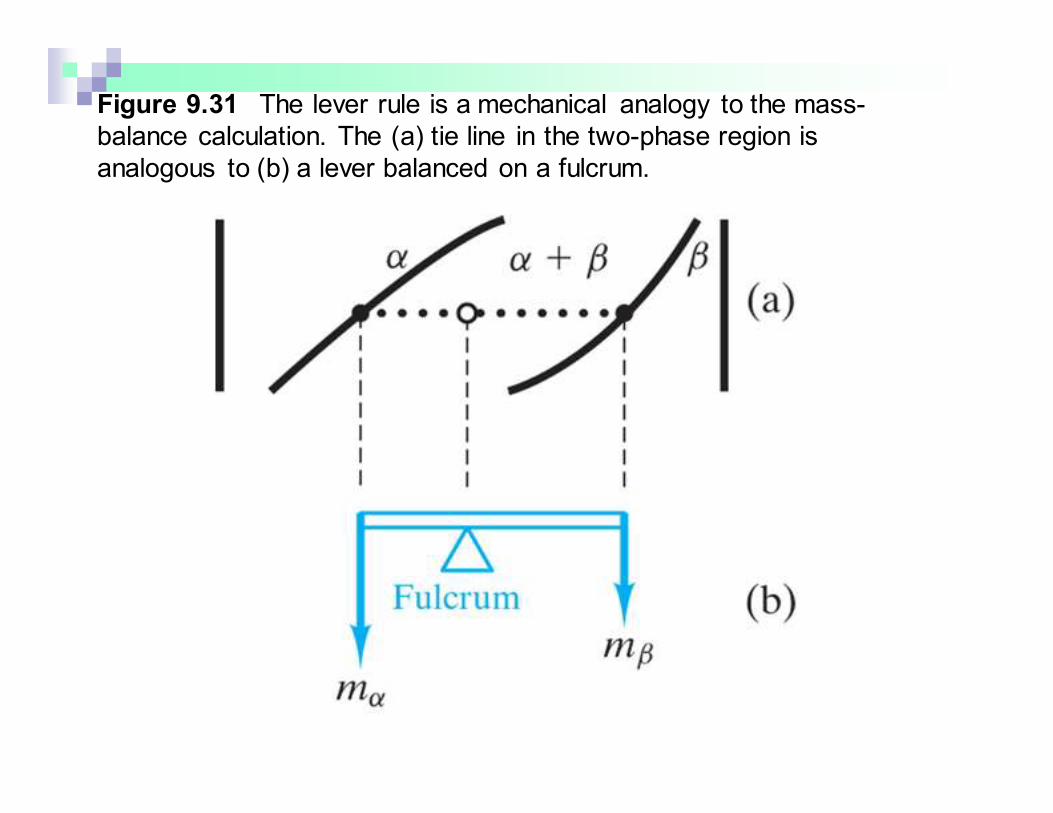
Figure 9.31 The lever rule is a mechanical analogy to the mass-
balance calculation. The (a) tie line in the two-phase region is
analogous to (b) a lever balanced on a fulcrum.
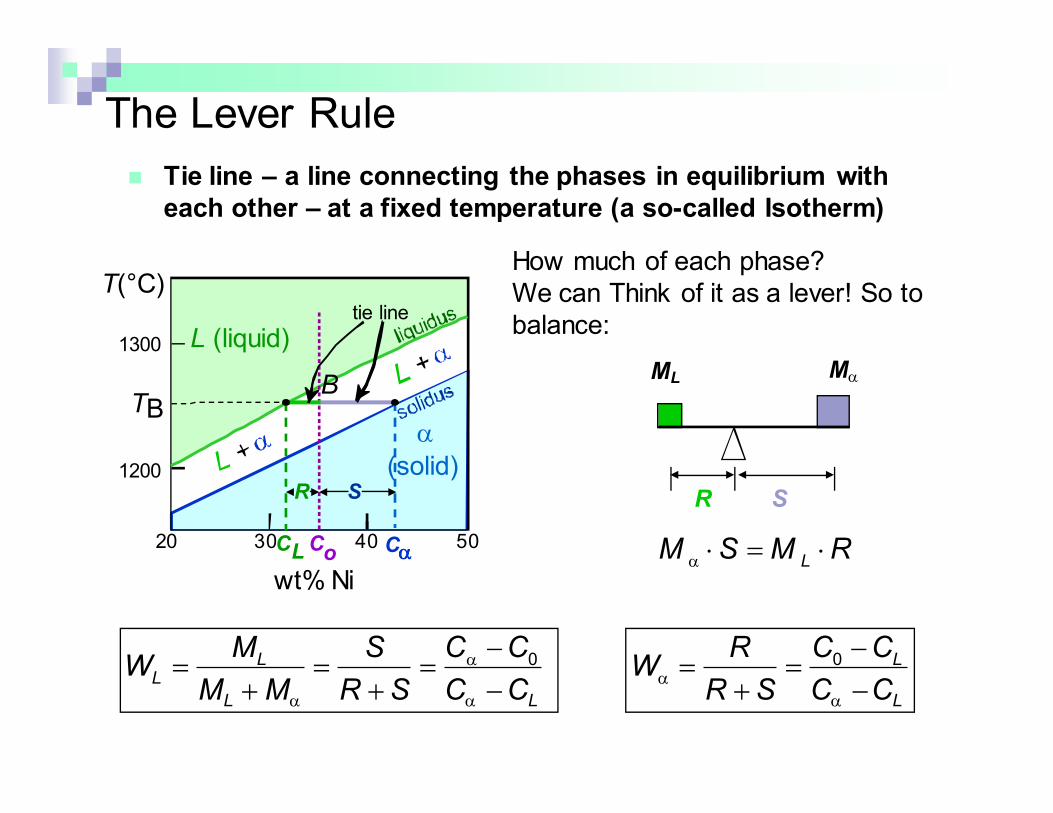
� Tie line – a line connecting the phases in equilibrium with
each other – at a fixed temperature (a so-called Isotherm)
The Lever Rule
How much of each phase?
We can Think of it as a lever! So to
balance:
ML Mα
R S
RMSM L ⋅=⋅α
L
L
LL
LL
CC
CC
SR
RW
CC
CC
SR
S
MM
MW
−
−=
+=
−
−=
+=
+=
α
α
α
α
α
00
wt% Ni
20
1200
1300
T(°C)
L (liquid)
α
(solid)
30 40 50
BTB
tie line
Co
CL Cαααα
SR
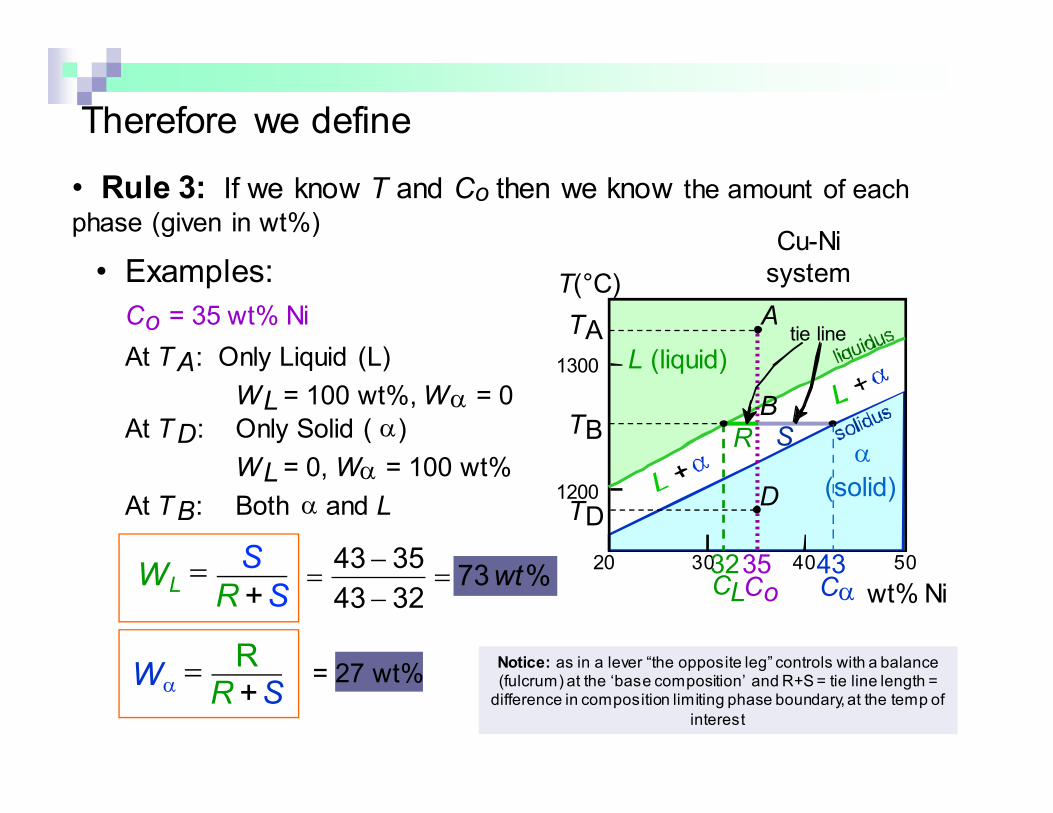
• Rule 3: If we know T and Co then we know the amount of each phase (given in wt%)
• Examples:
At TA: Only Liquid (L)
WL = 100 wt%, Wα = 0
At TD: Only Solid ( α)
WL = 0, Wα = 100 wt%
Co = 35 wt% Ni
Therefore we define
wt% Ni
20
1200
1300
T(°C)
L (liquid)
α
(solid)
30 40 50
Cu-Ni
system
TAA
35Co
32CL
BTB
DTD
tie line
4Cα3
R S
At TB: Both α and L
% 733243
3543wt=
−
−=
= 27 wt%
WL= S
R +S
Wα=
RR +S
Notice: as in a lever “the opposite leg” controls with a balance (fulcrum) at the ‘base composition’ and R+S = tie line length = difference in composition limiting phase boundary, at the temp of
interest
wt% Ni20
1200
1300
30 40 501100
L (liquid)
α
(solid)
T(°C)
A
35Co
L: 35wt%Ni
Cu-Ni
system
• Phase diagram:Cu-Ni system.
• System is:--binaryi.e., 2 components:
Cu and Ni.
--isomorphousi.e., complete
solubility of one
component in
another; α phase
field extends from
0 to 100 wt% Ni.
Adapted from Fig. 9.4, Callister 7e.
• ConsiderCo = 35 wt%Ni.
Ex: Cooling in a Cu-Ni Binary
4635
4332
α: 43 wt% Ni
L: 32 wt% Ni
L: 24 wt% Ni
α: 36 wt% Ni
Bα: 46 wt% Ni
L: 35 wt% Ni
C
D
E
24 36
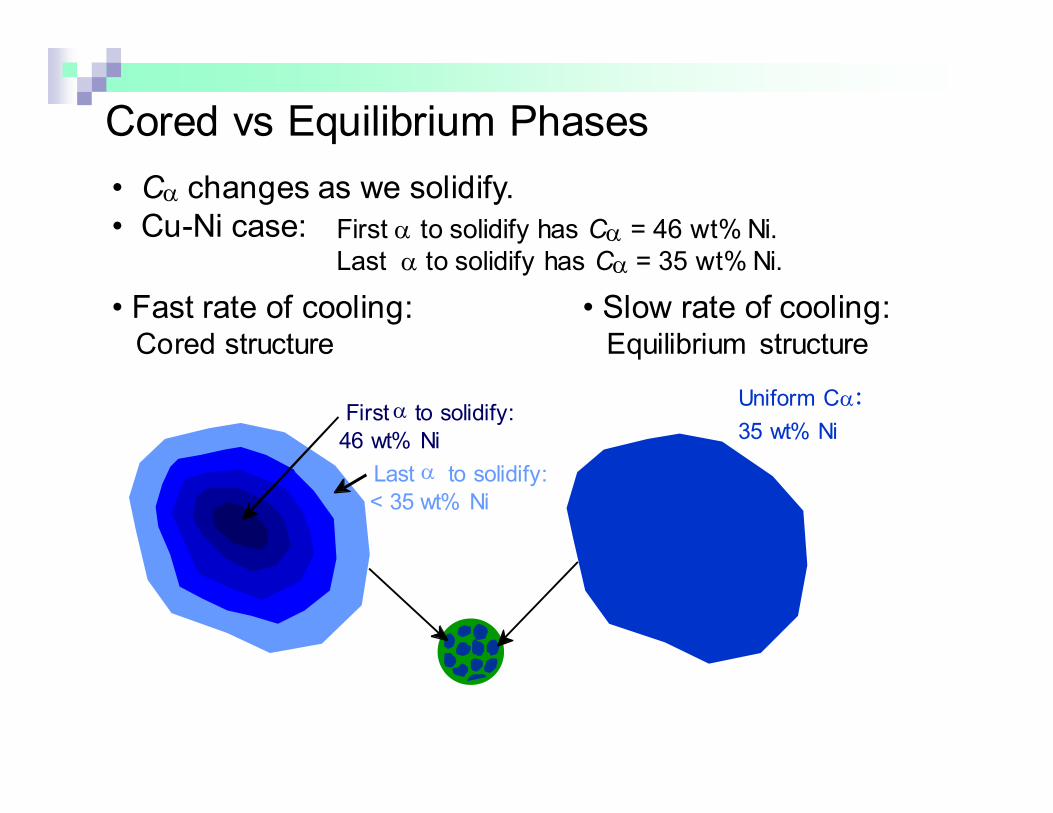
• Cα changes as we solidify.
• Cu-Ni case:
• Fast rate of cooling:Cored structure
• Slow rate of cooling:Equilibrium structure
First α to solidify has Cα = 46 wt% Ni.
Last α to solidify has Cα = 35 wt% Ni.
Cored vs Equilibrium Phases
First α to solidify:
46 wt% Ni
Uniform Cα:
35 wt% Ni
Last α to solidify:
< 35 wt% Ni
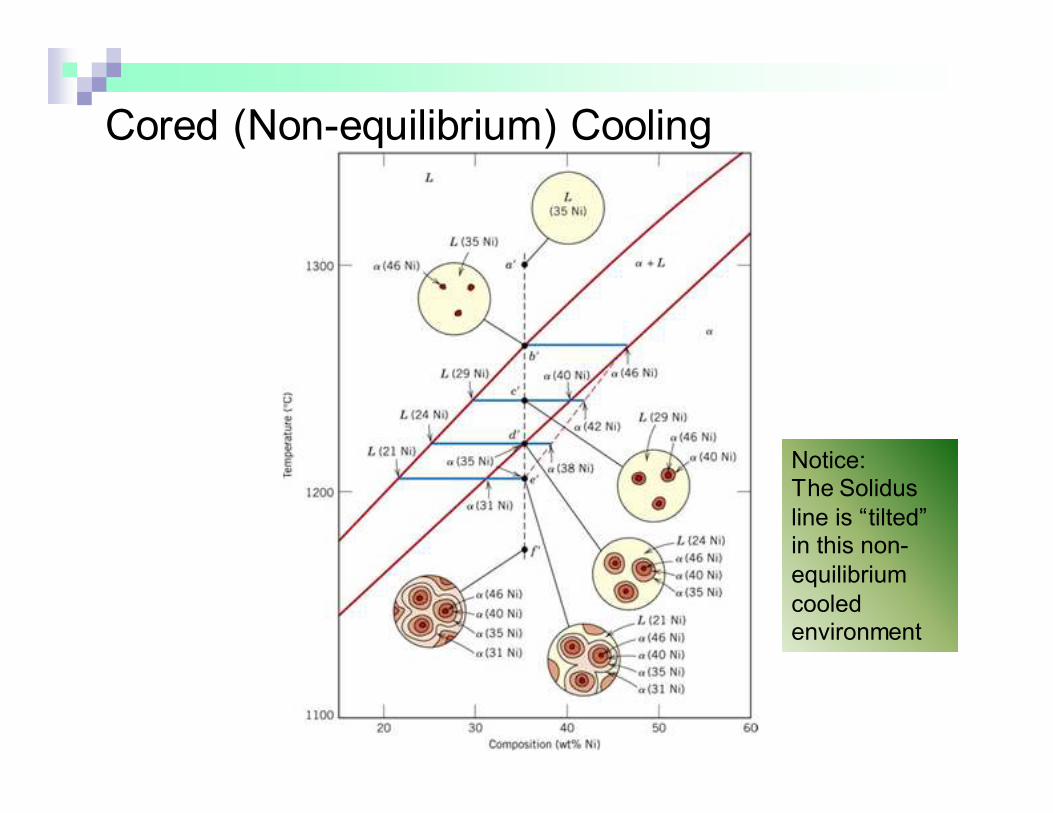
Cored (Non-equilibrium) Cooling
Notice:The Solidus
line is “tilted” in this non-
equilibrium
cooled environment
: Min. melting TE
2 componentshas a ‘special’ composition with a min.
melting Temp.
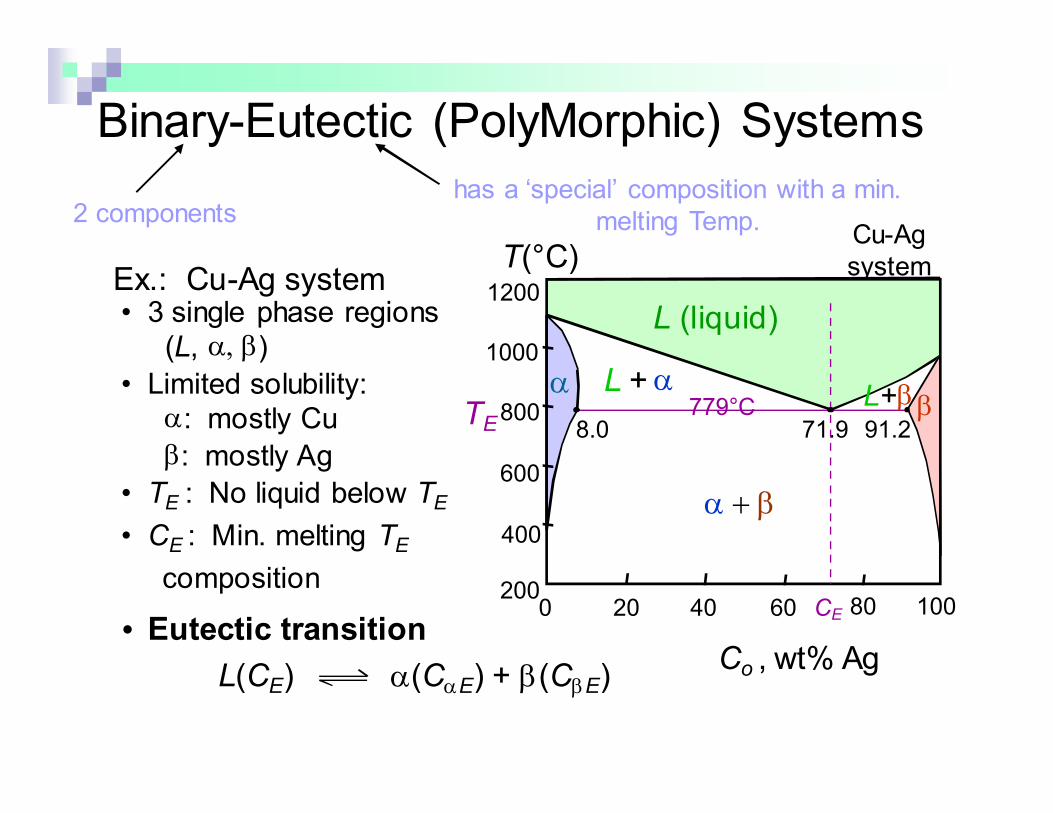
Binary-Eutectic (PolyMorphic) Systems
• Eutectic transition
L(CE) α(CαE) + β(CβE)
• 3 single phase regions
(L, α, β)
• Limited solubility: α: mostly Cu
β: mostly Ag
• TE : No liquid below TE
• CE
composition
Ex.: Cu-Ag system
Cu-Ag
system
L (liquid)
α L + αL+β β
α + β
Co , wt% Ag
20 40 60 80 1000200
1200
T(°C)
400
600
800
1000
CE
TE 8.0 71.9 91.2779°C
L+αL+β
α+ β
200
T(°C)
18.3
C, wt% Sn20 60 80 1000
300
100
L (liquid)
α183°C
61.9 97.8
β
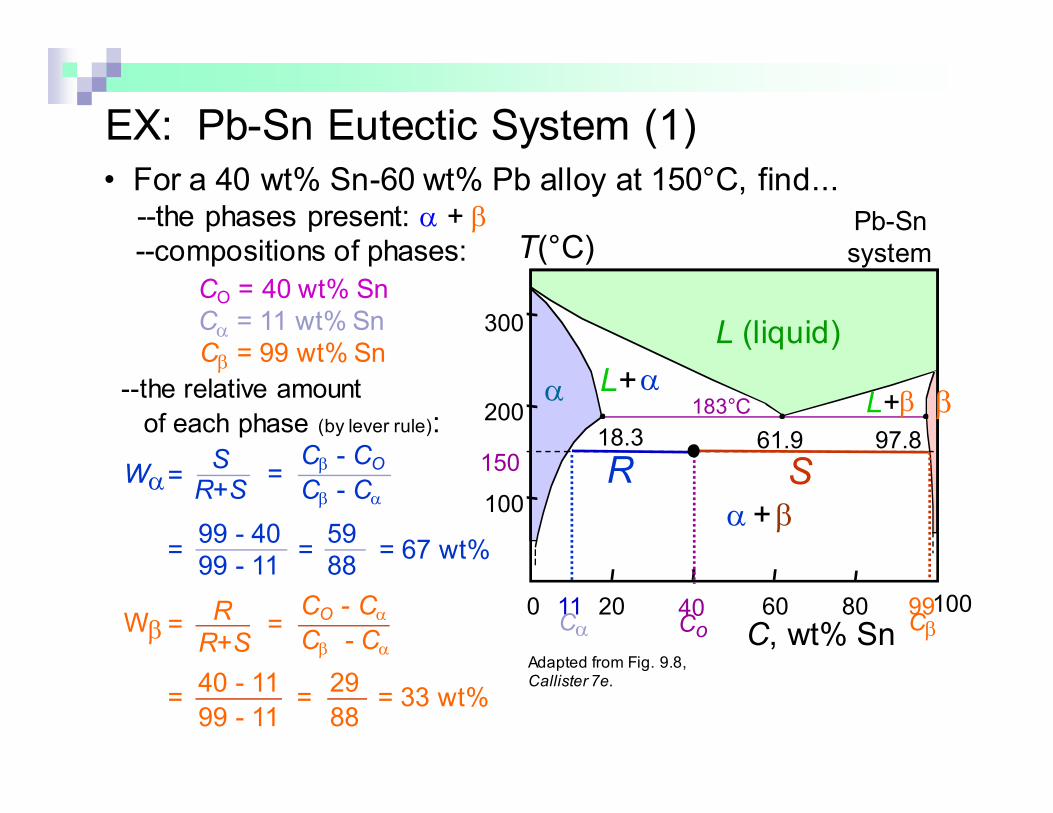
• For a 40 wt% Sn-60 wt% Pb alloy at 150°C, find...--the phases present: Pb-Sn
system
EX: Pb-Sn Eutectic System (1)
α + β
--compositions of phases:
CO = 40 wt% Sn
--the relative amount
of each phase (by lever rule):
150
40Co
11Cα
99Cβ
SR
Cα = 11 wt% Sn
Cβ = 99 wt% Sn
Wα=Cβ - COCβ - Cα
=99 - 40
99 - 11=59
88= 67 wt%
SR+S
=
Wβ=CO - Cα
Cβ - Cα
=R
R+S
=29
88= 33 wt%=
40 - 11
99 - 11
Adapted from Fig. 9.8, Callister 7e.
L+β
α+ β
200
T(°C)
C, wt% Sn
20 60 80 1000
300
100
L (liquid)
α β
L+α
183°C
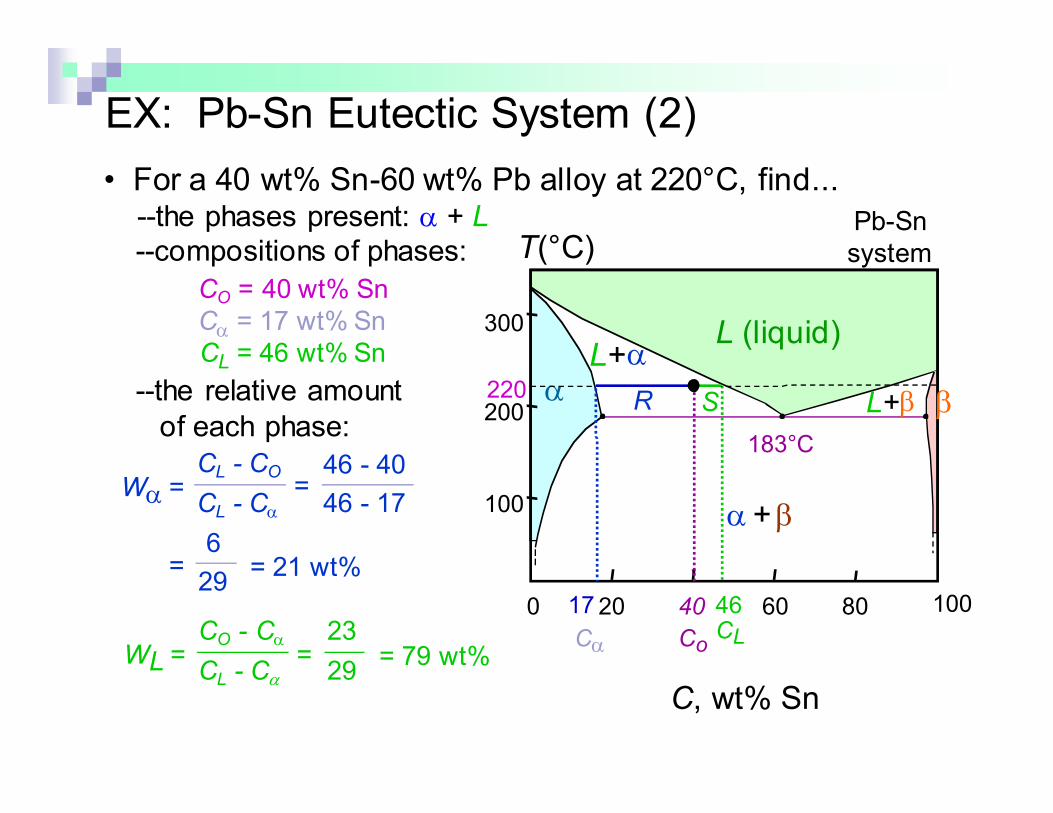
• For a 40 wt% Sn-60 wt% Pb alloy at 220°C, find...--the phases present: Pb-Sn
system
EX: Pb-Sn Eutectic System (2)
α + L
--compositions of phases:
CO = 40 wt% Sn
--the relative amount
of each phase:
Wα =CL - CO
CL - Cα
=46 - 40
46 - 17
=6
29= 21 wt%
WL =CO - Cα
CL - Cα
=23
29= 79 wt%
40
Co
46CL
17
Cα
220SR
Cα = 17 wt% Sn
CL = 46 wt% Sn
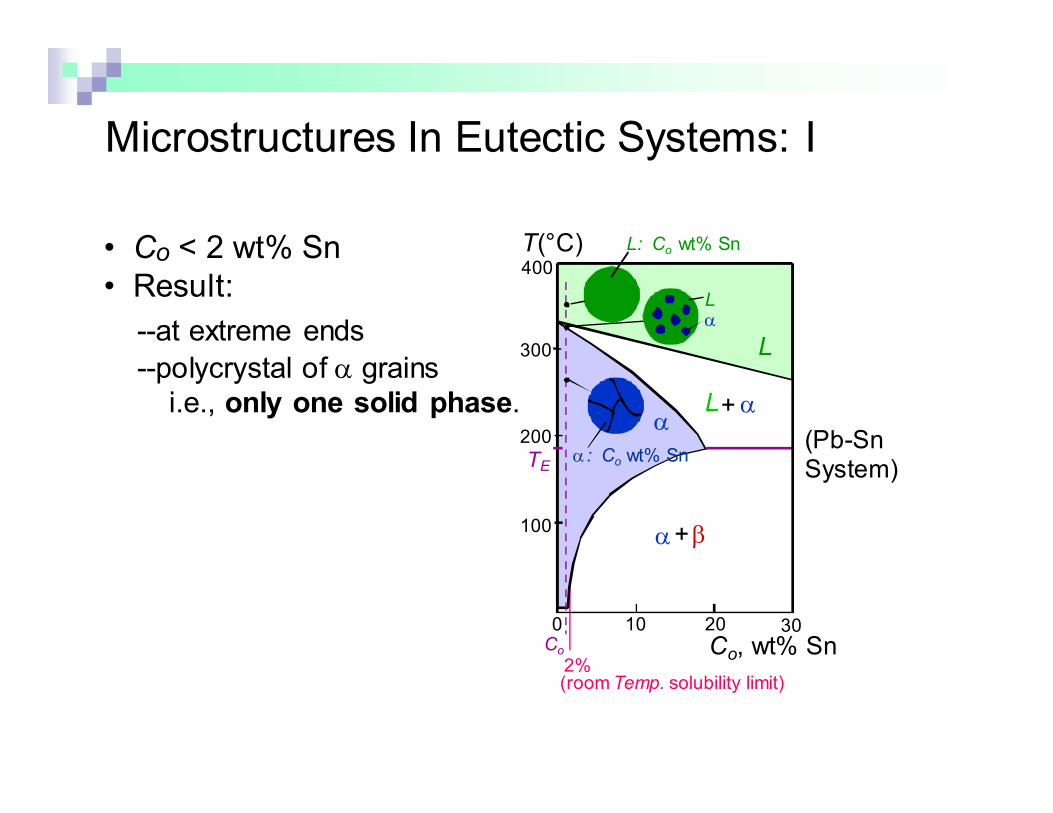
• Co < 2 wt% Sn
• Result:
--at extreme ends
--polycrystal of α grains
i.e., only one solid phase.
Microstructures In Eutectic Systems: I
0
L+ α
200
T(°C)
Co, wt% Sn10
2%
20Co
300
100
L
α
30
α+β
400
(room Temp. solubility limit)
TE(Pb-SnSystem)
αL
L: Co wt% Sn
α: Co wt% Sn

• 2 wt% Sn < Co < 18.3 wt% Sn
• Result:� Initially liquid
� Then liquid + α
� then α alone
� finally two solid phases
� α polycrystal
� fine β-phase inclusions
Microstructures in Eutectic Systems: II
Pb-Sn
system
L + α
200
T(°C)
Co , wt% Sn10
18.3
200Co
300
100
L
α
30
α+ β
400
(sol. limit at TE)
TE
2(sol. limit at Troom)
L
α
L: Co wt% Sn
αβ
α: Co wt% Sn
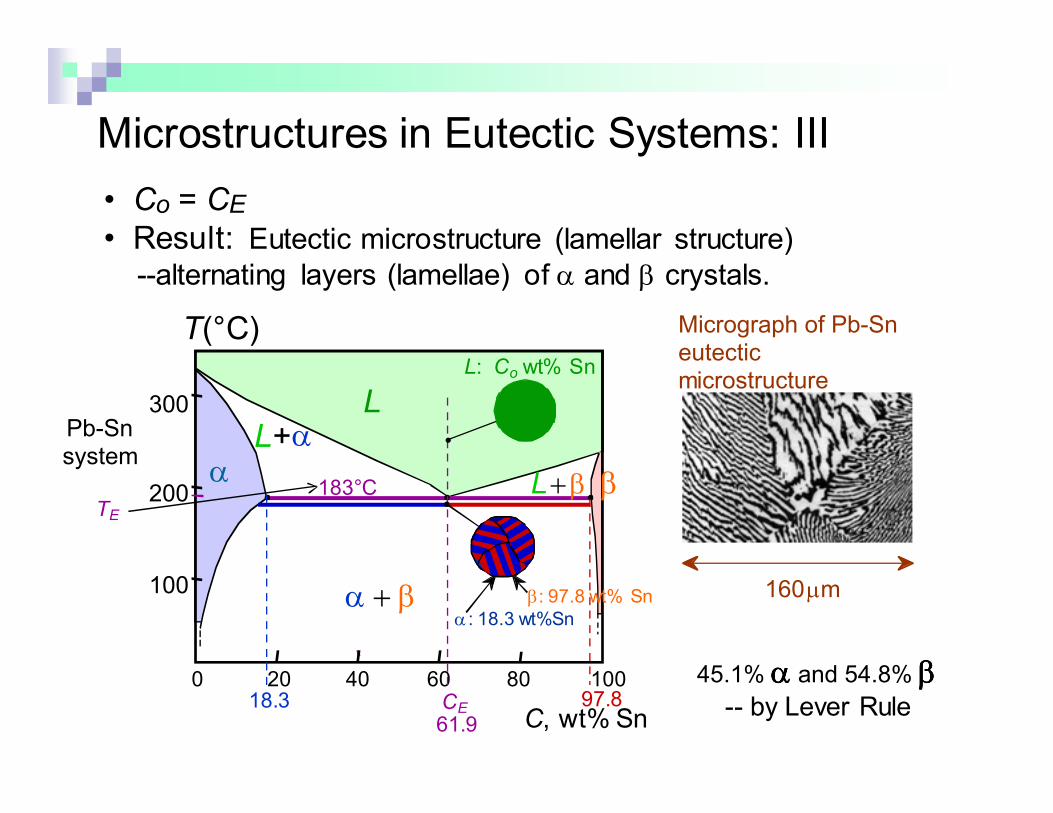
• Co = CE• Result: Eutectic microstructure (lamellar structure)
--alternating layers (lamellae) of α and β crystals.
Microstructures in Eutectic Systems: III
160µm
Micrograph of Pb-Sn eutectic microstructure
Pb-Snsystem
L + β
α + β
200
T(°C)
C, wt% Sn
20 60 80 1000
300
100
L
α β
L+α
183°C
40
TE
18.3
α: 18.3 wt%Sn
97.8
β: 97.8 wt% Sn
CE61.9
L: Co wt% Sn
45.1% αααα and 54.8% ββββ-- by Lever Rule
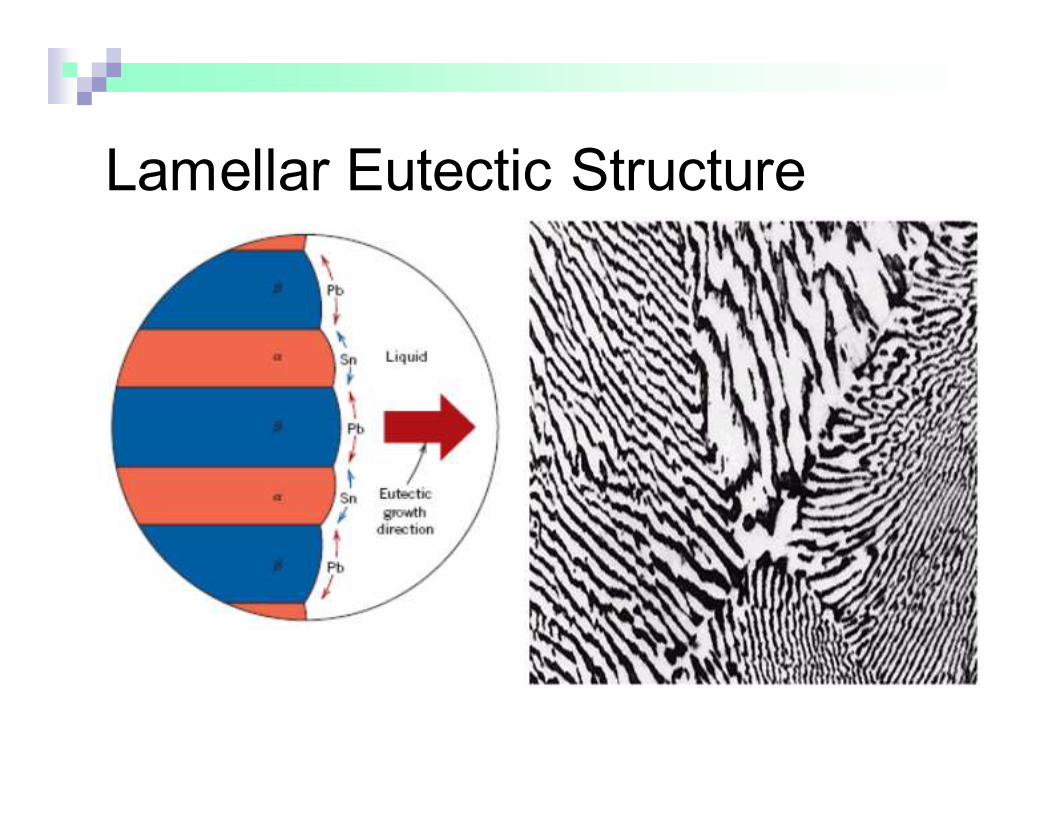
Lamellar Eutectic Structure
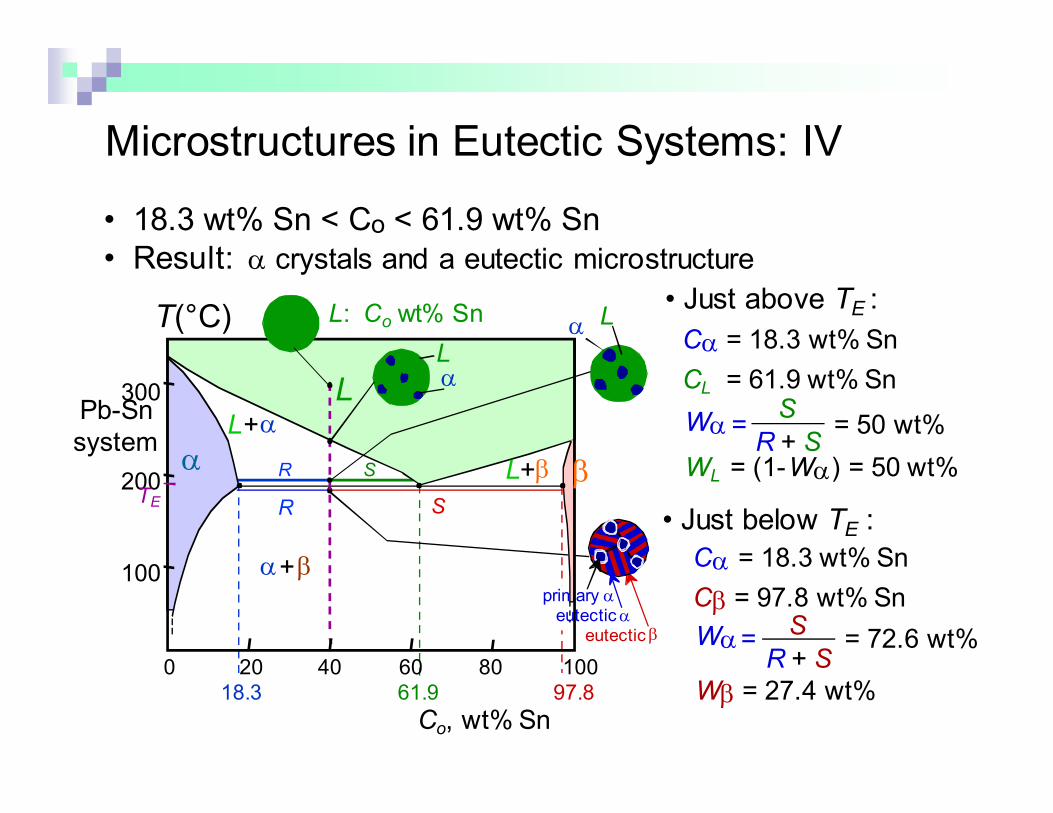
• 18.3 wt% Sn < Co < 61.9 wt% Sn
• Result: α crystals and a eutectic microstructure
Microstructures in Eutectic Systems: IV
18.3 61.9
SR
97.8
SR
primary αeutectic α
eutectic β
WL = (1-Wα) = 50 wt%
Cα = 18.3 wt% Sn
CL = 61.9 wt% SnS
R + SWα= = 50 wt%
• Just above TE :
• Just below TE :
Cα = 18.3 wt% Sn
Cβ = 97.8 wt% SnS
R + SWα= = 72.6 wt%
Wβ = 27.4 wt%
Pb-Sn
systemL+β
200
T(°C)
Co, wt% Sn
20 60 80 1000
300
100
L
α β
L+α
40
α+β
TE
L: Co wt% Sn LαLα

L+αL+β
α+ β
200
Co, wt% Sn20 60 80 1000
300
100
L
α βTE
40
(Pb-Sn System)
Hypoeutectic & Hypereutectic Compositions
160 µm
eutectic micro-constituent
hypereutectic: (illustration only)
β
ββ
ββ
β
from Metals Handbook, 9th ed., Vol. 9, Metallography and
Microstructures, American
Society for Metals, Materials Park, OH, 1985.
175 µm
α
α
α
αα
α
hypoeutectic: Co = 50 wt% Sn
T(°C)
61.9
eutectic
eutectic: Co= 61.9wt% Sn
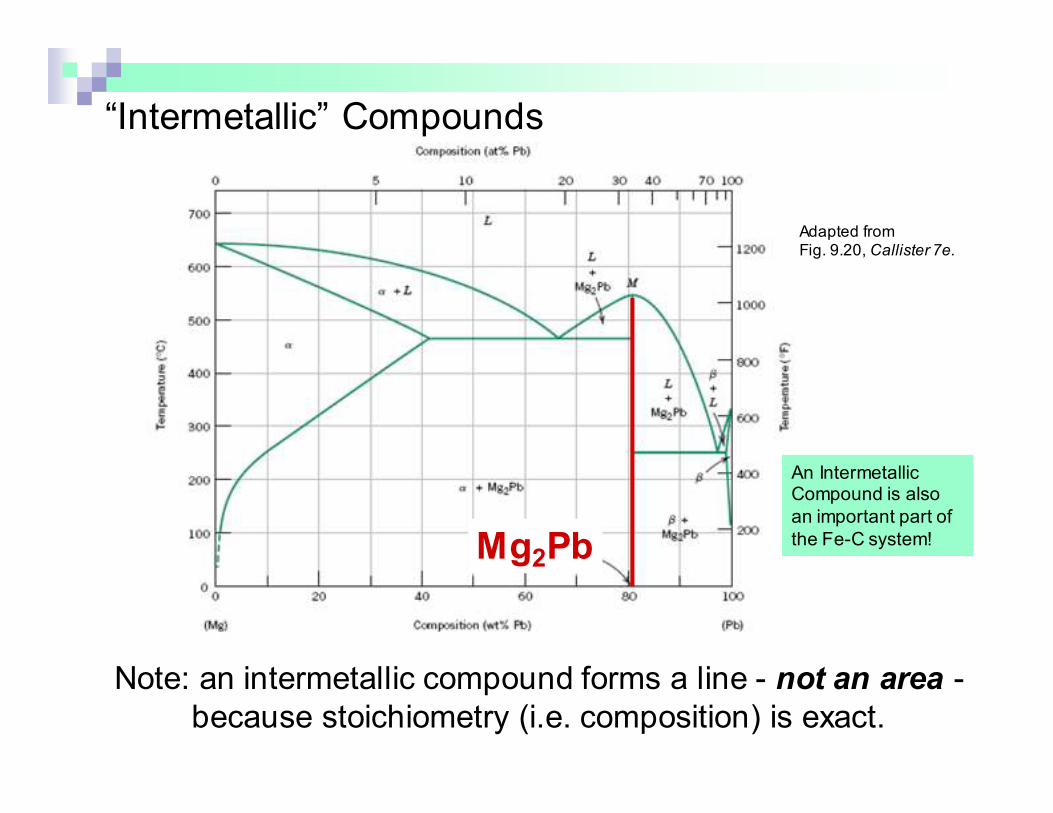
“Intermetallic” Compounds
Mg2Pb
Note: an intermetallic compound forms a line - not an area -
because stoichiometry (i.e. composition) is exact.
Adapted from Fig. 9.20, Callister 7e.
An Intermetallic Compound is also
an important part of
the Fe-C system!
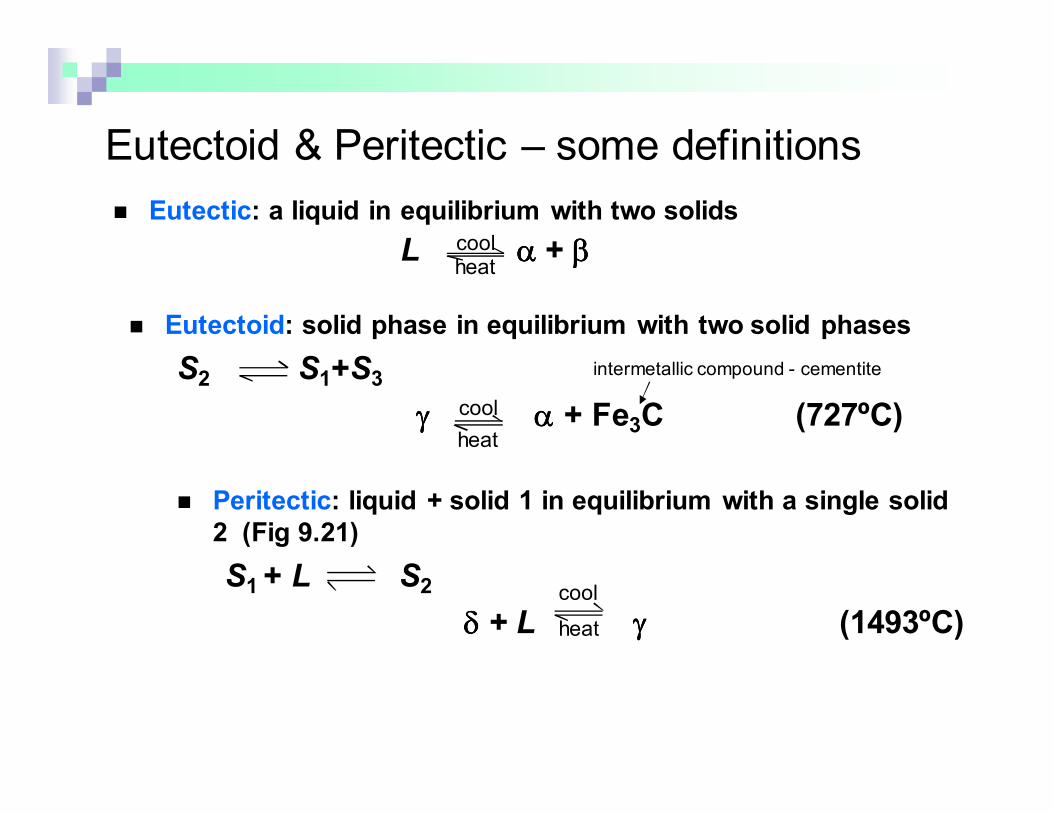
� Eutectoid: solid phase in equilibrium with two solid phases
S2 S1+S3
γγγγ αααα + Fe3C (727ºC)
intermetallic compound - cementite
cool
heat
� Peritectic: liquid + solid 1 in equilibrium with a single solid
2 (Fig 9.21)
S1 + L S2
δδδδ + L γγγγ (1493ºC)cool
heat
� Eutectic: a liquid in equilibrium with two solids
L αααα + ββββ
Eutectoid & Peritectic – some definitions
coolheat
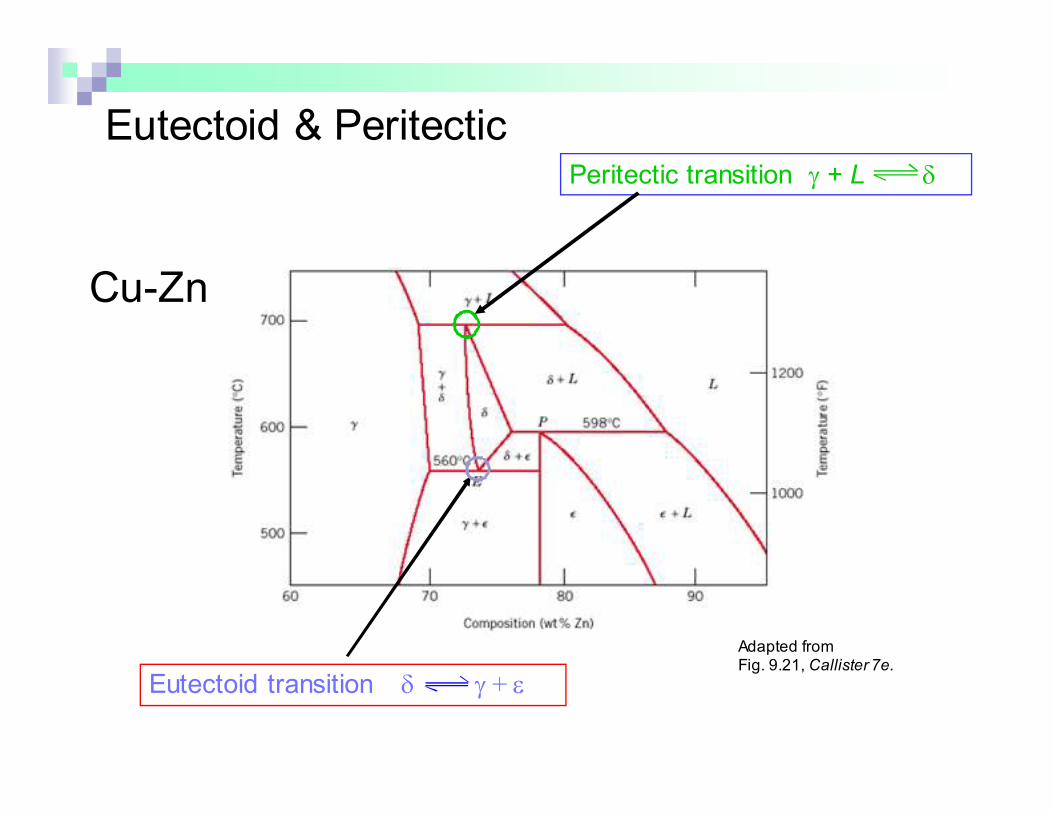
Eutectoid & Peritectic
Cu-Zn Phase diagram
Adapted from Fig. 9.21, Callister 7e.
Eutectoid transition δ γ + ε
Peritectic transition γ + L δ
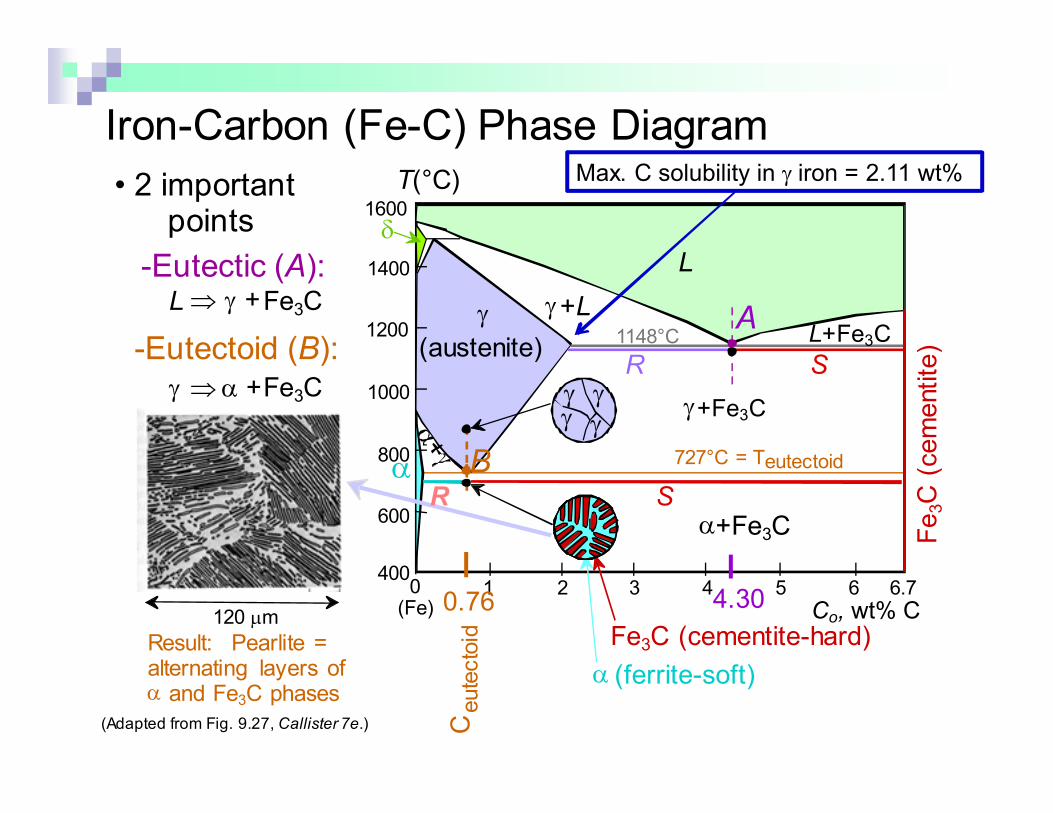
Iron-Carbon (Fe-C) Phase Diagram
• 2 important points
-Eutectoid (B):γ ⇒ α +Fe3C
-Eutectic (A):L ⇒ γ +Fe3C
Fe3C (cementite)
1600
1400
1200
1000
800
600
4000 1 2 3 4 5 6 6.7
L
γ
(austenite)
γ+L
γ+Fe3C
α+Fe3C
L+Fe3C
δ
(Fe) Co, wt% C
1148°C
T(°C)
α 727°C = Teutectoid
A
SR
4.30
Result: Pearlite = alternating layers of α and Fe3C phases
120 µm
(Adapted from Fig. 9.27, Callister 7e.)
γ γ
γγ
R S
0.76
Ceutectoid
B
Fe3C (cementite-hard)
α (ferrite-soft)
Max. C solubility in γ iron = 2.11 wt%
Hypoeutectoid Steel
Adapted from Figs. 9.24 and 9.29,Callister 7e. (Fig. 9.24 adapted from
Binary Alloy Phase Diagrams, 2nd ed., Vol.
1, T.B. Massalski (Ed.-in-Chief), ASM International, Materials Park, OH,
1990.)
Fe3C (cementite)
1600
1400
1200
1000
800
600
4000 1 2 3 4 5 6 6.7
L
γ
(austenite)
γ+L
γ +Fe3C
α+Fe3C
L+Fe3C
δ
(Fe) Co, wt% C
1148°C
T(°C)
α727°C
(Fe-C System)
C0
0.76
proeutectoid ferritepearlite
100 µmHypoeutectoid
steel
R S
α
wα =S/(R+S)
wFe3C
=(1-wα)
w pearlite = w γpearlite
r s
wα =s/(r+s)wγ =(1-wα)
γ
γ γ
γα
αα
γγγ γ
γ γ
γγ
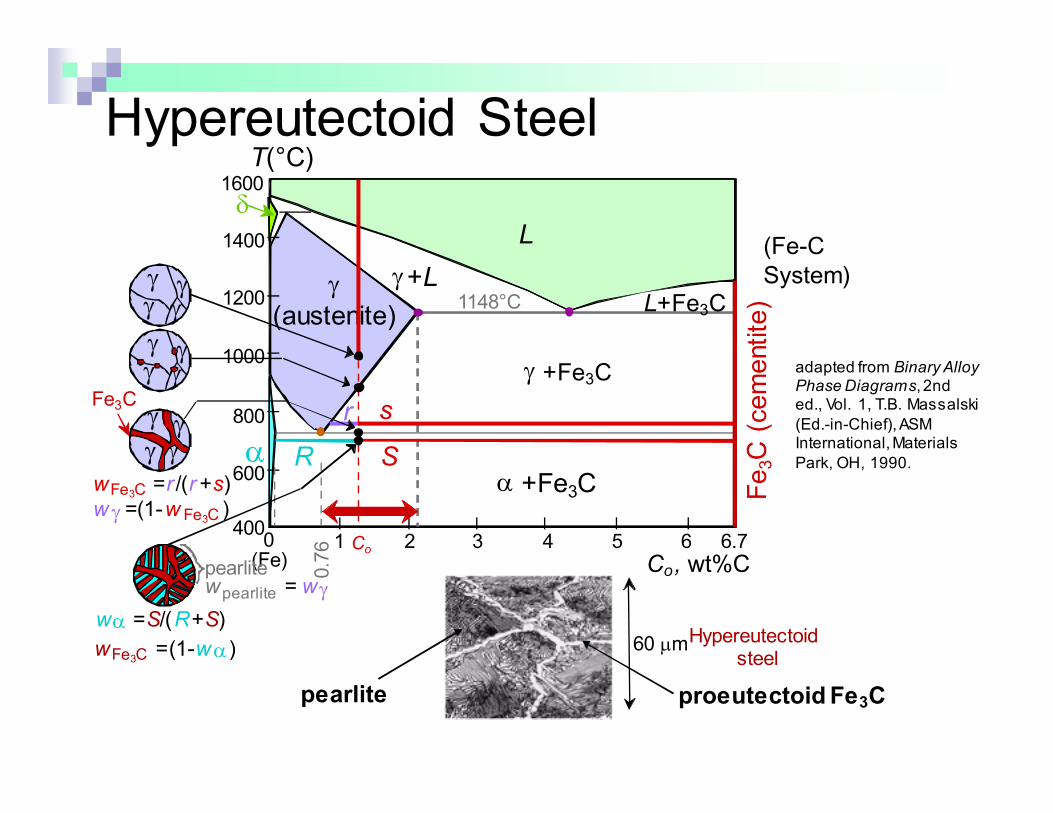
Hypereutectoid Steel
Fe3C (cementite)
1600
1400
1200
1000
800
600
4000 1 2 3 4 5 6 6.7
L
γ
(austenite)
γ+L
γ +Fe3C
α +Fe3C
L+Fe3C
δ
(Fe) Co, wt%C
1148°C
T(°C)
α
adapted from Binary Alloy Phase Diagrams, 2nd ed., Vol. 1, T.B. Massalski
(Ed.-in-Chief), ASM International, Materials
Park, OH, 1990.
(Fe-C
System)
0.76 Co
proeutectoid Fe3C
60 µmHypereutectoid steel
pearlite
R S
wα =S/(R+S)
wFe3C =(1-wα)
wpearlite = wγpearlite
sr
wFe3C =r /(r+s)
w γ =(1-w Fe3C )
Fe3C
γγ
γ γ
γγγ γ
γγγ γ
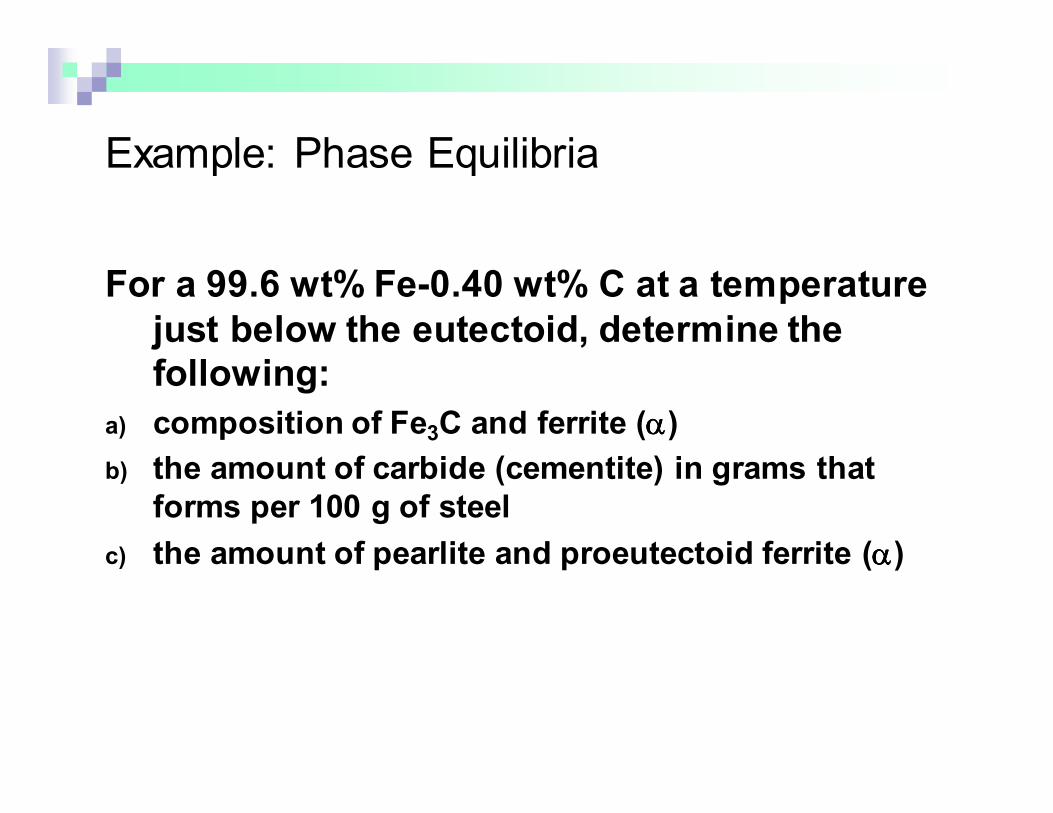
Example: Phase Equilibria
For a 99.6 wt% Fe-0.40 wt% C at a temperature
just below the eutectoid, determine the
following:
a) composition of Fe3C and ferrite (αααα)
b) the amount of carbide (cementite) in grams that
forms per 100 g of steel
c) the amount of pearlite and proeutectoid ferrite (αααα)

Solution:
g 3.94
g 5.7 CFe
g7.5100 022.07.6
022.04.0
100xCFe
CFe
3
CFe3
3
3
=α
=
=−
−=
−
−=
α+ α
α
x
CC
CCo
b) the amount of carbide
(cementite) in grams that
forms per 100 g of steel
a) composition of Fe3C and ferrite (α)
CO = 0.40 wt% C
Cα = 0.022 wt% C
CFe C = 6.70 wt% C3
Fe3C (cementite)
1600
1400
1200
1000
800
600
4000 1 2 3 4 5 6 6.7
L
γ (austenite)
γ+L
γ +Fe3C
α+Fe3C
L+Fe3C
δ
Co, wt% C
1148°C
T(°C)
727°C
CO
R S
CFe C3
Cαααα
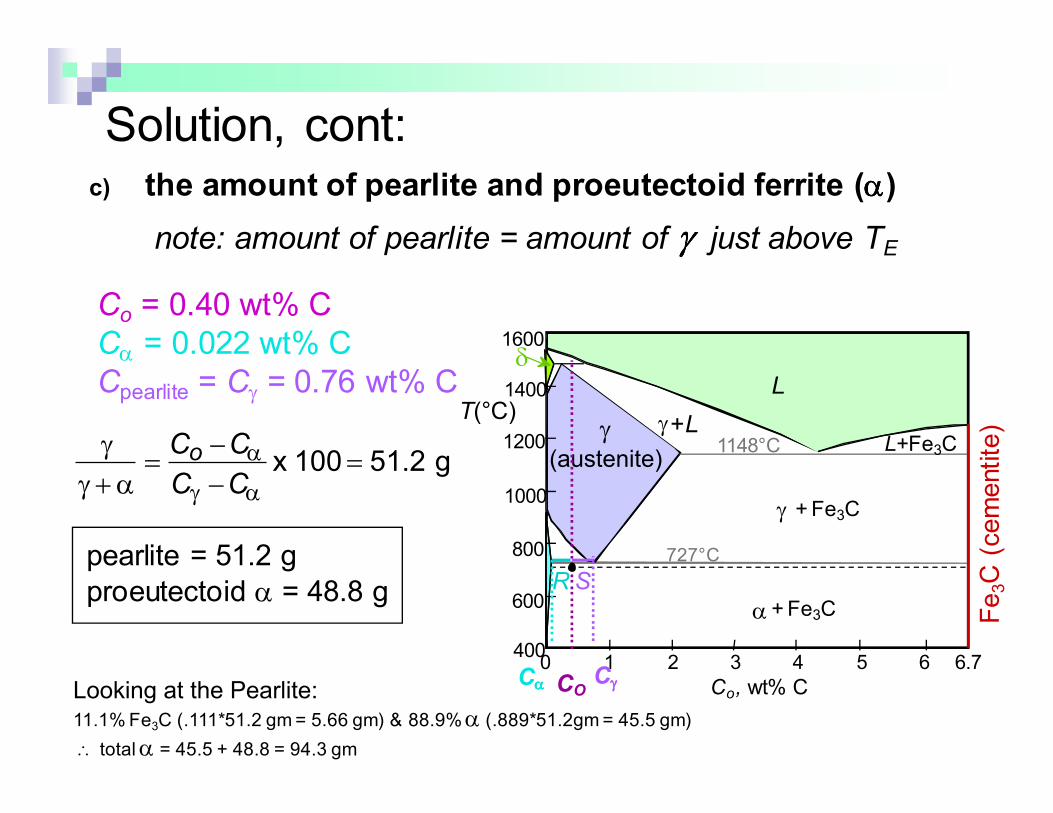
Solution, cont:c) the amount of pearlite and proeutectoid ferrite (αααα)
note: amount of pearlite = amount of γγγγ just above TE
Co = 0.40 wt% C
Cα = 0.022 wt% C
Cpearlite = Cγ = 0.76 wt% C
γ
γ + α=Co −Cα
Cγ −Cα
x 100 = 51.2 g
pearlite = 51.2 g
proeutectoid α = 48.8 g
Fe3C (cementite)
1600
1400
1200
1000
800
600
4000 1 2 3 4 5 6 6.7
L
γ (austenite)
γ+L
γ +Fe3C
α+Fe3C
L+Fe3C
δ
Co, wt% C
1148°C
T(°C)
727°C
CO
R S
CγγγγCααααLooking at the Pearlite:11.1% Fe3C (.111*51.2 gm = 5.66 gm) & 88.9% α (.889*51.2gm = 45.5 gm)
∴ total α = 45.5 + 48.8 = 94.3 gm
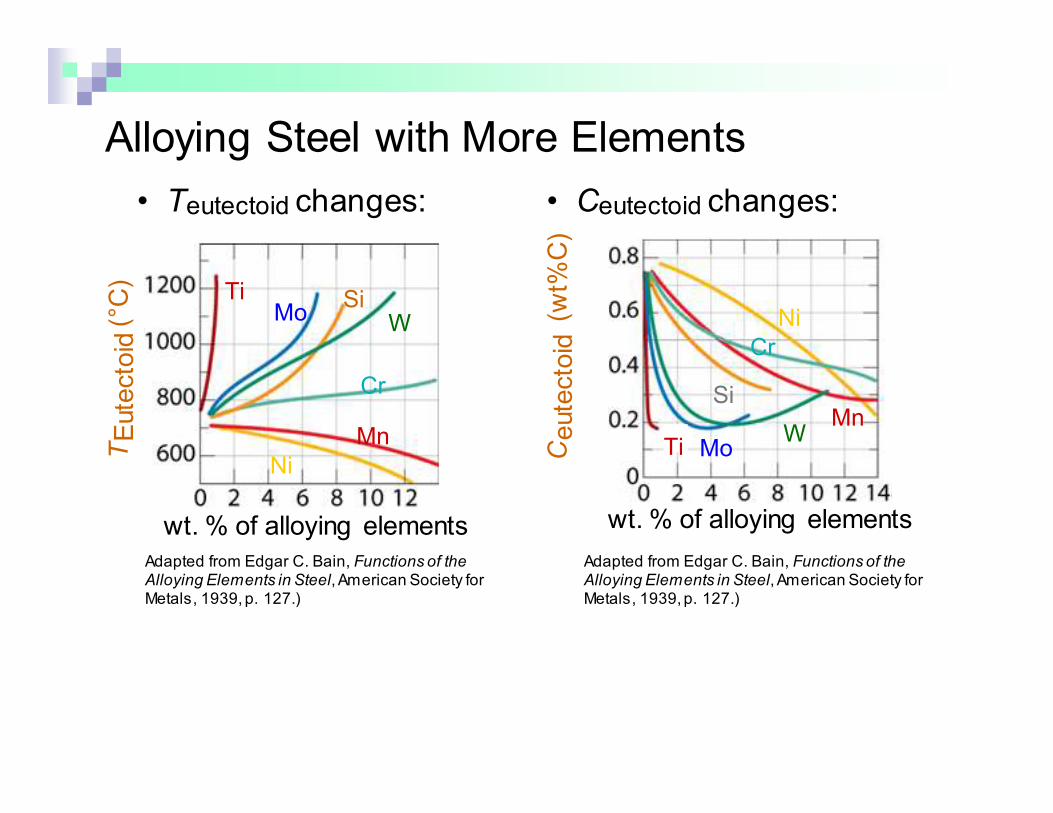
Alloying Steel with More Elements
• Teutectoid changes: • Ceutectoid changes:
Adapted from Edgar C. Bain, Functions of the Alloying Elements in Steel, American Society for Metals, 1939, p. 127.)
Adapted from Edgar C. Bain, Functions of the Alloying Elements in Steel, American Society for Metals, 1939, p. 127.)
TEutectoid(°C)
wt. % of alloying elements
Ti
Ni
MoSi
W
Cr
Mn
wt. % of alloying elements
Ceutectoid
(wt%
C)
Ni
Ti
Cr
SiMn
WMo
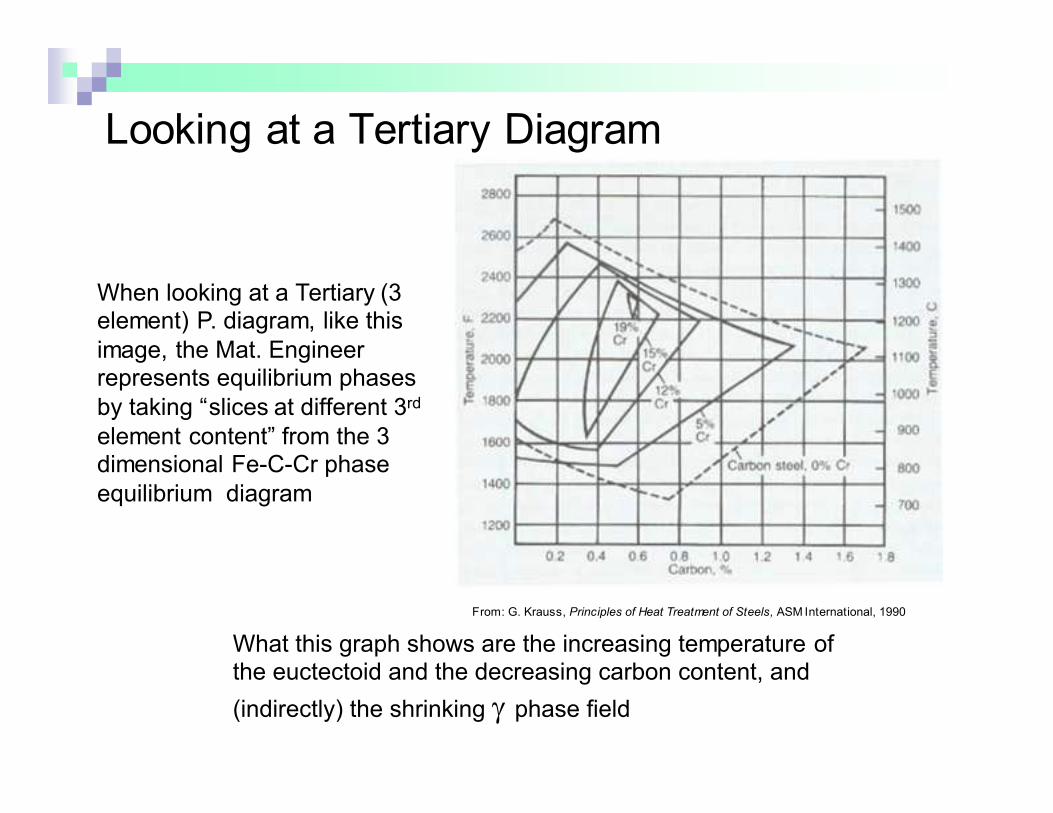
Looking at a Tertiary Diagram
When looking at a Tertiary (3 element) P. diagram, like this
image, the Mat. Engineer represents equilibrium phases
by taking “slices at different 3rd
element content” from the 3 dimensional Fe-C-Cr phase
equilibrium diagram
What this graph shows are the increasing temperature of the euctectoid and the decreasing carbon content, and
(indirectly) the shrinking γ phase field
From: G. Krauss, Principles of Heat Treatment of Steels, ASM International, 1990
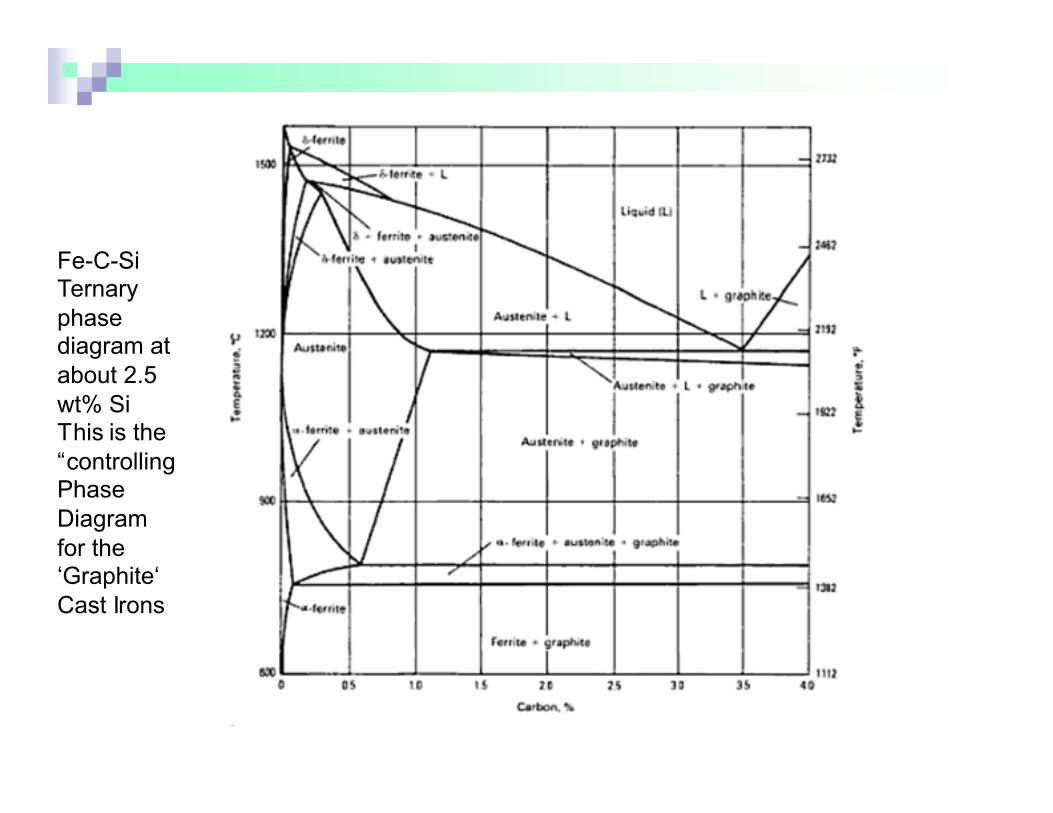
Fe-C-Si Ternary
phase diagram at
about 2.5
wt% SiThis is the
“controlling Phase
Diagram
for the ‘Graphite‘
Cast Irons

• Phase diagrams are useful tools to determine:
-- the number and types of phases,
-- the wt% of each phase,
-- and the composition of each phase
for a given T and composition of the system.
• Alloying to produce a solid solution usually
--increases the tensile strength (TS)
--decreases the ductility.
• Binary eutectics and binary eutectoids allow for
(cause) a range of microstructures.
Summary