Embed Size (px)
Citation preview
Phase noise characteristics of microwavesignals generated by semiconductor laser
dynamics
Jun-Ping Zhuang1 and Sze-Chun Chan1,2
1Department of Electronic Engineering, City University of Hong Kong,Hong Kong, China
2State Key Laboratory of Millimeter Waves, City University of Hong Kong,Hong Kong, China
Abstract: Phase noise of the period-one (P1) nonlinear dynamical oscilla-tion in an optically injected semiconductor laser is numerically investigated.The P1 dynamics causes the laser output intensity to oscillate at a widelytunable frequency for photonic microwave generation, although the intrinsicspontaneous emission in the laser inevitably degrades the microwave signaland manifests as the oscillation phase noise. To characterize the phasenoise, the P1 microwave linewidth is first numerically examined throughthe rate equations with a Langevin term. The P1 microwave linewidth isfound to vary with the injection parameters. It is nearly minimized whenthe microwave power maximizes. Owing to the laser nonlinearities, theP1 microwave linewidth can even be smaller than the free-running opticallinewidth. By adding an optical feedback to the laser, the P1 microwavelinewidth is found to reduce as the feedback strength and feedback delayincrease, in which an inverse-square dependency is followed asymptotically.By modification to a dual-loop feedback, noisy side peaks around the centralP1 frequency are effectively suppressed through the Vernier effect. Thedual-loop feedback maintains a low phase noise variance over a wide tuningrange of the P1 frequency, while allowing long delay times for significantP1 microwave linewidth narrowing.
© 2015 Optical Society of America
OCIS codes: (140.5960) Semiconductor lasers; (140.3520) Lasers, injection-locked;(350.4010) Microwaves; (190.3100) Instabilities and chaos.
References and links1. T. B. Simpson, J. M. Liu, M. AlMulla, N. G. Usechak, and V. Kovanis, “Limit-cycle dynamics with reduced
sensitivity to perturbations,” Phys. Rev. Lett. 112, 023901 (2014).2. T. B. Simpson, J. M. Liu, M. AlMulla, N. G. Usechak, and V. Kovanis, “Linewidth sharpening via polarization-
rotated feedback in optically injected semiconductor laser oscillators,” IEEE J. Sel. Top. Quantum Electron. 19,1500807 (2013).
3. A. Quirce and A. Valle, “High-frequency microwave signal generation using multi-transverse mode VCSELssubject to two-frequency optical injection,” Opt. Express 20, 13390–13401 (2012).
4. H. Lin, D. W. Pierce, A. J. Basnet, A. Quirce, Y. Zhang, and A. Valle, “Two-frequency injection on a multimodevertical-cavity surface-emitting laser,” Opt. Express 19, 22437–22442 (2011).
5. M. Pochet, T. Locke, and N. G. Usechak, “Generation and modulation of a millimeter-wave subcarrier on anoptical frequency generated via optical injection,” IEEE Photon. J. 4, 1881–1891 (2012).
#224479 - $15.00 USD Received 7 Oct 2014; revised 11 Jan 2015; accepted 15 Jan 2015; published 30 Jan 2015 © 2015 OSA 9 Feb 2015 | Vol. 23, No. 3 | DOI:10.1364/OE.23.002777 | OPTICS EXPRESS 2777
6. M. Pochet, N. A. Naderi, V. Kovanis, and L. F. Lester, “Modeling the dynamic response of an optically-injectednanostructure diode laser,” IEEE J. Quantum Electron. 47, 827–833 (2011).
7. A. Hurtado, I. D. Henning, M. J. Adams, and L. F. Lester, “Generation of tunable millimeter-wave and THzsignals with an optically injected quantum dot distributed feedback laser,” IEEE Photon. J. 5, 5900107 (2013).
8. Y. H. Liao and F. Y. Lin, “Dynamical characteristics and their applications of semiconductor lasers subject toboth optical injection and optical feedback,” Opt. Express 21, 23568–23578 (2013).
9. Y. S. Juan and F. Y. Lin, “Photonic generation of broadly tunable microwave signals utilizing a dual-beam opti-cally injected semiconductor laser,” IEEE Photon. J. 3, 644–650 (2011).
10. Y. H. Hung and S. K. Hwang, “Photonic microwave amplification for radio-over-fiber links using period-onenonlinear dynamics of semiconductor lasers,” Opt. Lett. 38, 3355–3358 (2013).
11. Y. H. Hung, C. H. Chu, and S. K. Hwang, “Optical double-sideband modulation to single-sideband modulationconversion using period-one nonlinear dynamics of semiconductor lasers for radio-over-fiber links,” Opt. Lett.38, 1482–1484 (2013).
12. S. C. Chan, S. K. Hwang, and J. M. Liu, “Period-one oscillation for photonic microwave transmission using anoptically injected semiconductor laser,” Opt. Express 15, 14921–14935 (2007).
13. S. C. Chan, “Analysis of an optically injected semiconductor laser for microwave generation,” IEEE J. QuantumElectron. 46, 421–428 (2010).
14. J. Capmany and D. Novak, “Microwave photonics combines two worlds,” Nat. Photon. 1, 319–330 (2007).15. J. P. Yao, “Microwave photonics,” J. Lightwave Technol. 27, 314–335 (2009).16. X. Q. Qi and J. M. Liu, “Photonic microwave applications of the dynamics of semiconductor lasers,” IEEE J.
Sel. Top. Quantum Electron. 17, 1198–1211 (2011).17. L. F. Lester, N. A. Naderi, F. Grillot, R. Raghunathan, and V. Kovanis, “Strong optical injection and the differen-
tial gain in a quantum dash laser,” Opt. Express 22, 7222–7228 (2014).18. F. Grillot, C. Wang, N. A. Naderi, and J. Even, “Modulation properties of self-injected quantum-dot semicon-
ductor diode lasers,” IEEE J. Sel. Top. Quantum Electron. 19, 1900812 (2013).19. S. Wieczorek, W. W. Chow, L. Chrostowski, and C. J. Chang-Hasnain, “Improved semiconductor-laser dynamics
from induced population pulsation,” IEEE J. Quantum Electron. 42, 552–562 (2006).20. B. Bortnik, Y. C. Hung, H. Tazawa, B. J. Seo, J. Luo, A. K. Y. Jen, W. H. Steier, and H. R. Fetterman, “Electrooptic
polymer ring resonator modulation up to 165 GHz,” IEEE J. Sel. Top. Quantum Electron. 13, 104–110 (2007).21. R. J. Steed, L. Ponnampalam, M. J. Fice, C. C. Renaud, D. C. Rogers, D. G. Moodie, G. D. Maxwell, I. F.
Lealman, M. J. Robertson, L. Pavlovic, L. Naglic, M. Vidmar, and A. J. Seeds, “Hybrid integrated optical phase-lock loops for photonic terahertz sources,” IEEE J. Sel. Top. Quantum Electron. 17, 210–217 (2011).
22. E. Sooudi, C. de Dios Fernandez, J. G. McInerney, G. Huyet, F. Lelarge, K. Merghem, R. Rosales, A. Martinez,A. Ramdane, and S. P. Hegarty, “A novel scheme for two-level stabilization of semiconductor mode-locked lasersusing simultaneous optical injection and optical feedback,” IEEE J. Sel. Top. Quantum Electron. 19, 1101208(2013).
23. M. J. Strain, M. Zanola, G. Mezosi, and M. Sorel, “Generation of picosecond pulses over a 40-nm wavelengthrange using an array of distributed Bragg grating mode-locked lasers,” IEEE Photon. Technol. Lett. 25, 368–370(2013).
24. M. Haji, L. P. Hou, A. E. Kelly, J. Akbar, J. H. Marsh, J. M. Arnold, and C. N. Ironside, “High frequency opto-electronic oscillators based on the optical feedback of semiconductor mode-locked laser diodes,” Opt. Express20, 3268–3274 (2012).
25. R. Rosales, K. Merghem, A. Martinez, A. Akrout, J. P. Tourrenc, A. Accard, F. Lelarge, and A. Ramdane,“InAs/InP quantum-dot passively mode-locked lasers for 1.55-μm applications,” IEEE J. Sel. Top. QuantumElectron. 17, 1292–1301 (2011).
26. C. Y. Lin, F. Grillot, Y. Li, R. Raghunathan, and L. F. Lester, “Microwave characterization and stabilizationof timing jitter in a quantum-dot passively mode-locked laser via external optical feedback,” IEEE J. Sel. Top.Quantum Electron. 17, 1311–1317 (2011).
27. F. Tian, J. Chen, and G. F. Li, “Amplitude and phase noise of self-pulsations in laser diodes,” Electron. Lett. 33,312–312 (1997).
28. X. Wang, G. F. Li, and C. S. Ih, “Microwave/millimeter-wave frequency subcarrier lightwave modulations basedon self-sustained pulsation of laser diode,” J. Lightwave Technol. 11, 309–315 (1993).
29. J. B. Georges and K. Y. Lau, “Self-pulsating laser diodes as fast-tunable (≤ 1 ns) FSK transmitters in subcarriermultiple-access networks,” IEEE Photon. Technol. Lett. 5, 242–245 (1993).
30. J. Renaudier, G. H. Duan, P. Landais, and P. Gallion, “Phase correlation and linewidth reduction of 40 GHz self-pulsation in distributed Bragg reflector semiconductor lasers,” IEEE J. Quantum Electron. 43, 147–156 (2007).
31. O. Carroll, Y. Tanguy, J. Houlihan, and G. Huyet, “Dynamics of self-pulsing semiconductor lasers with opticalfeedback,” Opt. Commun. 239, 429–436 (2004).
32. M. Al-Mumin, X. Wang, W. Mao, S. Pappert, and G. F. Li, “Optical generation and sideband injection lockingof tunable 11-120 GHz microwave/millimetre signals,” Electron. Lett. 36, 1547–1548 (2000).
33. X. H. Wang and G. F. Li, “Subcarrier frequency enhancement of two-section Fabry-Perot laser diodes usingexternal optical injection,” Opt. Commun. 171, 113–118 (1999).
#224479 - $15.00 USD Received 7 Oct 2014; revised 11 Jan 2015; accepted 15 Jan 2015; published 30 Jan 2015 © 2015 OSA 9 Feb 2015 | Vol. 23, No. 3 | DOI:10.1364/OE.23.002777 | OPTICS EXPRESS 2778
34. G. F. Li, D. M Nair, and K. M. Magde, “Amplitude and phase noise of periodic orbits in a nonlinear opticalsystem: theory and experiments,” IEEE LEOS Annual Meeting Proc. 2, 178–179 (1997).
35. B. Romeira, J. Javaloyes, J. M. L. Figueiredo, C. N. Ironside, H. I. Cantu, and A. E. Kelly, “Delayed feedback dy-namics of Lienard-type resonant tunneling-photo-detector optoelectronic oscillators,” IEEE J. Quantum Electron.49, 31–42 (2013).
36. J. Y. Kim, J. H. Jo, W. Y. Choi, and H. K. Sung, “Dual-loop dual-modulation optoelectronic oscillators withhighly suppressed spurious tones,” IEEE Photon. Technol. Lett. 24, 706–708 (2012).
37. S. L. Pan and J. P. Yao, “Wideband and frequency-tunable microwave generation using an optoelectronic oscil-lator incorporating a Fabry-Perot laser diode with external optical injection,” Opt. Lett. 35, 1911–1913 (2010).
38. X. S. Yao and L. Maleki, “Multiloop optoelectronic oscillator,” IEEE J. Quantum Electron. 36, 79–84 (2000).39. X. S. Yao and L. Maleki, “Optoelectronic microwave oscillator,” J. Opt. Soc. Am. B 13, 1725–1735 (1996).40. F. Li and A. S. Helmy, “Gigahertz to terahertz tunable all-optical single-side-band microwave generation via
semiconductor optical amplifier gain engineering,” Opt. Lett. 38, 4542–4545 (2013).41. Y. N. Tan, L. Jin, L. Cheng, Z. Quan, M. Li, and B. O. Guan, “Multi-octave tunable RF signal generation based
on a dual-polarization fiber grating laser,” Opt. Express 20, 6961–6967 (2012).42. G. Carpintero, E. Rouvalis, K. Lawniczuk, M. Fice, C. C. Renaud, X. J. M. Leijtens, E. A. J. M. Bente, M. Chi-
toui, F. V. Dijk, and A. J. Seeds, “95 GHz millimeter wave signal generation using an arrayed waveguide gratingdual wavelength semiconductor laser,” Opt. Lett. 37, 3657–3659 (2012).
43. M. Zanola, M. J. Strain, G. Giuliani, and M. Sorel, “Monolithically integrated DFB lasers for tunable and narrowlinewidth millimeter-wave generation,” IEEE J. Sel. Topics Quantum Electron. 19, 1500406 (2013).
44. S. Donati and S. K. Hwang, “Chaos and high-level dynamics in coupled lasers and their applications,” Prog.Quantum Electron. 36, 293–341 (2012).
45. J. P. Zhuang and S. C. Chan, “Tunable photonic microwave generation using optically injected semiconductorlaser dynamics with optical feedback stabilization,” Opt. Lett. 38, 344–346 (2013).
46. C. Cui and S. C. Chan, “Performance analysis on using period-one oscillation of optically injected semiconductorlasers for radio-over-fiber uplinks,” IEEE J. Quantum Electron. 48, 490–499 (2012).
47. C. Cui, X. Fu, and S. C. Chan, “Double-locked semiconductor laser for radio-over-fiber uplink transmission,”Opt. Lett. 34, 3821–3823 (2009).
48. J. B. Altes, I. Gatare, K. Panajotov, H. Thienpont, and M. Sciamanna, “Mapping of the dynamics induced byorthogonal optical injection in vertical-cavity surface-emitting lasers,” IEEE J. Quantum Electron. 42, 198–207(2006).
49. M. S. Torre, C. Masoller, and K. A. Shore, “Numerical study of optical injection dynamics of vertical-cavitysurface-emitting lasers,” IEEE J. Quantum Electron. 40, 25–30 (2004).
50. X. Q. Qi and J. M. Liu, “Dynamics scenarios of dual-beam optically injected semiconductor lasers,” IEEE J.Quantum Electron. 47, 762–769 (2011).
51. M. Zhang, T. Liu, A. Wang, J. Zhang, and Y. Wang, “All-optical clock frequency divider using Fabry-Perot laserdiode based on the dynamical period-one oscillation,” Opt. Commun. 284, 1289–1294 (2011).
52. S. C. Chan and J. M. Liu, “Microwave frequency division and multiplication using an optically injected semi-conductor laser,” IEEE J. Quantum Electron. 41, 1142–1147 (2005).
53. S. C. Chan, S. K. Hwang, and J. M. Liu, “Radio-over-fiber AM-to-FM upconversion using an optically injectedsemiconductor laser,” Opt. Lett. 31, 2254–2256 (2006).
54. C. H. Cheng, C. W. Lee, T. W. Lin, and F. Y. Lin, “Dual-frequency laser Doppler velocimeter for speckle noisereduction and coherence enhancement,” Opt. Express 20, 20255–20265 (2012).
55. T. B. Simpson and F. Doft, “Double-locked laser diode for microwave photonics applications,” IEEE Photon.Technol. Lett. 11, 1476–1478 (1999).
56. T. B. Simpson, “Phase-locked microwave-frequency modulations in optically-injected laser diodes,” Opt. Com-mun. 170, 93–98 (1999).
57. S. C. Chan and J. M. Liu, “Tunable narrow-linewidth photonic microwave generation using semiconductor laserdynamics,” IEEE J. Sel. Top. Quantum Electron. 10, 1025–1032 (2004).
58. K. H. Lo, S. K. Hwang, and S. Donati, “Optical feedback stabilization of photonic microwave generation usingperiod-one nonlinear dynamics of semiconductor lasers,” Opt. Express 22, 18648–18661 (2014).
59. J. M. Liu, H. F. Chen, X. J. Meng, and T. B. Simpson, “Modulation bandwidth, noise, and stability of a semicon-ductor laser subject to strong injection locking,” IEEE Photon. Technol. Lett. 9, 1325–1327 (1997).
60. T. Erneux and P. Glorieux, Laser Dynamics (Cambridge Univ. Press, 2010).61. S. S. Li, Q. Liu, and S. C. Chan, “Distributed feedbacks for time-delay signature suppression of chaos generated
from a semiconductor laser,” IEEE Photon. J. 4, 1930–1935 (2012).62. T. B. Simpson, J. M. Liu, K. F. Huang, and K. Tai, “Nonlinear dynamics induced by external optical injection in
semiconductor lasers,” Quantum Semiclass. Opt. 9, 765–784 (1997).63. C. Henry, “Phase noise in semiconductor lasers,” J. Lightwave Technol. 4, 298–311 (1986).64. N. Zhang, X. Cai, and S. Yu, “Optical generation of tunable and narrow linewidth radio frequency signal based
on mutual locking between integrated semiconductor lasers,” Photon. Res. 2, B11–B17 (2014).65. P. M. Varangis, A. Gavrielides, V. Kovanis, and L. F. Lester, “Linewidth broadening across a dynamical instabil-
#224479 - $15.00 USD Received 7 Oct 2014; revised 11 Jan 2015; accepted 15 Jan 2015; published 30 Jan 2015 © 2015 OSA 9 Feb 2015 | Vol. 23, No. 3 | DOI:10.1364/OE.23.002777 | OPTICS EXPRESS 2779
ity,” Phys. Lett. A 250, 117–122 (1998).66. J. Ohtsubo, Semiconductor Lasers: Stability, Instability and Chaos (Springer, 2008).67. K. Petermann, “External optical feedback phenomena in semiconductor lasers,” IEEE J. Sel. Top. Quantum
Electron. 1, 480–489 (1995).68. F. Kefelian, S. O’Donoghue, M. T. Todaro, J. G. McInerney, and G. Huyet, “RF linewidth in monolithic passively
mode-locked semiconductor laser,” IEEE Photon. Technol. Lett. 20, 1405–1407 (2008).69. O. Pottiez, O. Deparis, R. Kiyan, M. Haelterman, P. Emplit, P. Megret, and M. Blondel, “Supermode noise of
harmonically mode-locked erbium fiber lasers with composite cavity,” IEEE J. Quantum Electron. 38, 252–259(2002).
1. Introduction
Nonlinear dynamical period-one (P1) oscillations in optically injected semiconductor lasershave been actively investigated for photonic microwave generation [1–13]. Photonic microwavegeneration enables the transmission of microwave signals over optical fibers with no electro-magnetic interference and low propagation loss [14–16]. Approaches adopting high-frequencyelectronic sources for photonic microwave generation include direct modulation on injection-locked lasers [17–19], external modulation using electrooptic materials [20], and side-bandlocking along with phase-lock loops on modulated light sources [21], which can yield very lowphase noise depending on the electronic sources. However, there are also several approaches re-quiring no high-frequency electronic sources for photonic microwave generation. For example,mode-locked laser diodes (MLLDs) are excellent for monolithically generating photonic mi-crowave tones at the pulse repetition rates. The frequency tunability is limited by the fixed cav-ity lengths, though some injection and feedback schemes were recently employed to improvethe frequency stability and time-bandwidth products in MLLDs [22–26]. Two-section laserswith proper cavity designs had led to pioneering works on self-pulsation phenomena [27–29],which can be observed even without involving any external perturbations. Interesting analysisand modeling of the phase noise associated with the self-pulsations have been reported [30–34].The optoelectronic oscillators (OEOs) also require no electronic sources to generate microwavesignals. Employing long fiber-based feedback loops yield excellent stabilities, though the loopsstill incorporate high-frequency electronic filters and detectors. Replacing these electronic de-vices with photonic devices can further improve the tunability and other performances ofOEOs [35–39]. Dual-wavelength operation was implemented in fiber lasers to generate mi-crowave frequencies by proper seeding from independent lasers or by different gratings withmechanical or thermal tuning [40, 41]. It was also monolithically implemented in semicon-ductor lasers with arrayed waveguide gratings to yield discrete tunability [42]. A monolithicapproach with three mutually injected lasers was also investigated recently for microwave gen-eration tunable up to 40 GHz, where a clear microwave linewidth reduction to 2.5 MHz wasattained by mutual locking through frequency mixing [43].
The nonlinear dynamical P1 oscillation has emerged as an interesting alternative to photonicmicrowave generation [1, 16]. The P1 oscillation is among a variety of nonlinear dynamicssuch as period-doubled, quasi-periodic, and chaotic oscillations for lasers under continuous-wave (CW) injections. The P1 oscillation is obtained when a stably locked laser experiences aHopf bifurcation, which generates a modulation of the laser emission intensity at a microwavefrequency [1, 13, 44]. The P1 oscillation has been investigated in conventional single-modedistributed feedback (DFB) lasers [1, 2, 45–47], quantum-dash or quantum-dot lasers [5–7],as well as vertical-cavity surface-emitting lasers (VCSELs) [3, 4, 48, 49]. Dual-wavelength in-jection and multi-transverse mode injection have also been reported for generating photonicmicrowave signals [3, 9, 50].
For photonic microwave generation, the nonlinear dynamical P1 oscillation offers the fol-lowing advantages [16]. The P1 frequency is widely tunable beyond the original relaxation
#224479 - $15.00 USD Received 7 Oct 2014; revised 11 Jan 2015; accepted 15 Jan 2015; published 30 Jan 2015 © 2015 OSA 9 Feb 2015 | Vol. 23, No. 3 | DOI:10.1364/OE.23.002777 | OPTICS EXPRESS 2780
resonance frequency, reaching even the terahertz band [6, 7]. The P1 oscillation generates pho-tonic microwave signals all-optically without using any electronic microwave sources [2, 16].Single sideband (SSB) optical spectra are attainable by adjusting the injection parameters withthe benefit of minimizing the microwave power penalty during transmission through dispersivefibers [10–12, 46]. Intensity modulation depth of nearly 100% can be attained for generatingmaximal microwave power at a constant optical average power [5, 10]. Data modulation onthe microwave signal can be realized by modulating the laser bias current electrically or theinjection optically [5, 47]. These advantages were utilized in a number of applications such asradio-over-fiber downlink transmission [5], uplink transmission [46, 47], clock frequency divi-sion [51, 52], modulation format conversion [11, 53], photonic microwave amplification [10],and Doppler velocimeter with long detection ranges [54].
In spite of these advantages, the P1 oscillation dynamics inherently contains phase noisedue to fluctuations in the lasers. The phase noise causes adverse effects such as reductions ofthe signal-to-noise ratios in communication links [5], degradations of the noise performancein photonic microwave amplification [10], and limitations of the maximal detection range inDoppler velocimeters [54]. For instance, the velocity resolution degrades within a few metersusing a P1 oscillation with a 13.9-MHz microwave linewidth [54]. As a result, some techniqueswere developed for reducing the phase noise. Experiments have demonstrated double-lockingusing a microwave source [55, 56], optoelectronic feedback employing an electronic feedbackloop [57], and polarization-rotated feedback added with the optoelectronic feedback [2], wherea reduced linewidth of about 3 kHz was obtained for P1 oscillation at 6 GHz. To avoid the fre-quency limitations of high-speed electronics, a dual-loop optical feedback was demonstrated asan all-optical approach with the P1 oscillation frequency increased to over 45 GHz while main-taining a narrow linewidth below 50 kHz [45]. Such a dual-loop feedback on P1 oscillationrequired no high-speed electronics, demonstrated wide frequency tunability, and significantlyreduced both the microwave linewidth as well as the phase variance [45]. However, there werefew reports investigating the P1 oscillation noise numerically. Interesting operating points withthe P1 oscillation frequency being insensitive to the injection detuning frequency were identi-fied from recent simulations [1]. Data transmission performances were reported by modelingthe operational noise of the pump or injection [5]. Nonetheless, the influences of the intrinsicspontaneous emission noise on the P1 oscillation remain to be systematically investigated.
In this paper, the phase noise of the P1 oscillation due to the spontaneous emissions in theinjected laser is investigated numerically. As a fundamental noise source intrinsic to the laser,spontaneous emission is modeled by a Langevin fluctuation force in the rate-equation model,causing phase noise in the P1 oscillation, which broadens the P1 microwave linewidth. To beginwith, only optical injection is applied to invoke the P1 oscillation. The P1 microwave linewidthis found to vary with the injection parameters. It is minimized when the amplitude of the inten-sity oscillation maximizes at any given P1 frequency. Interestingly, the P1 microwave linewidthcan be even smaller than the free-running optical linewidth, which is impossible without non-linear interactions in the laser. Moreover, by adding a single-loop optical feedback to the laser,the P1 microwave linewidth is observed to clearly reduce. The linewidth is found as inverselyproportional to the square of the feedback strength. It is also found as inversely proportionalto the square of the feedback delay time. However, noisy side peaks in the power spectrum areenhanced as the delay lengthens, which prompts the use of a dual-loop optical feedback. Thedual-loop optical feedback is found to significantly suppress the side peaks though the Verniereffect when the delay times are incommensurate. So the dual-loop feedback enables microwavelinewidth narrowing by adopting long feedback delay times, while keeping a low phase varianceregardless of the P1 oscillation frequency. With a free-running optical linewidth of 100 MHz,the laser in P1 oscillation at 24 GHz gives a microwave linewidth of 22 MHz, which is then
#224479 - $15.00 USD Received 7 Oct 2014; revised 11 Jan 2015; accepted 15 Jan 2015; published 30 Jan 2015 © 2015 OSA 9 Feb 2015 | Vol. 23, No. 3 | DOI:10.1364/OE.23.002777 | OPTICS EXPRESS 2781
Output
Circulator
(f1
,1)
(f2
,2)
(i, f
i )
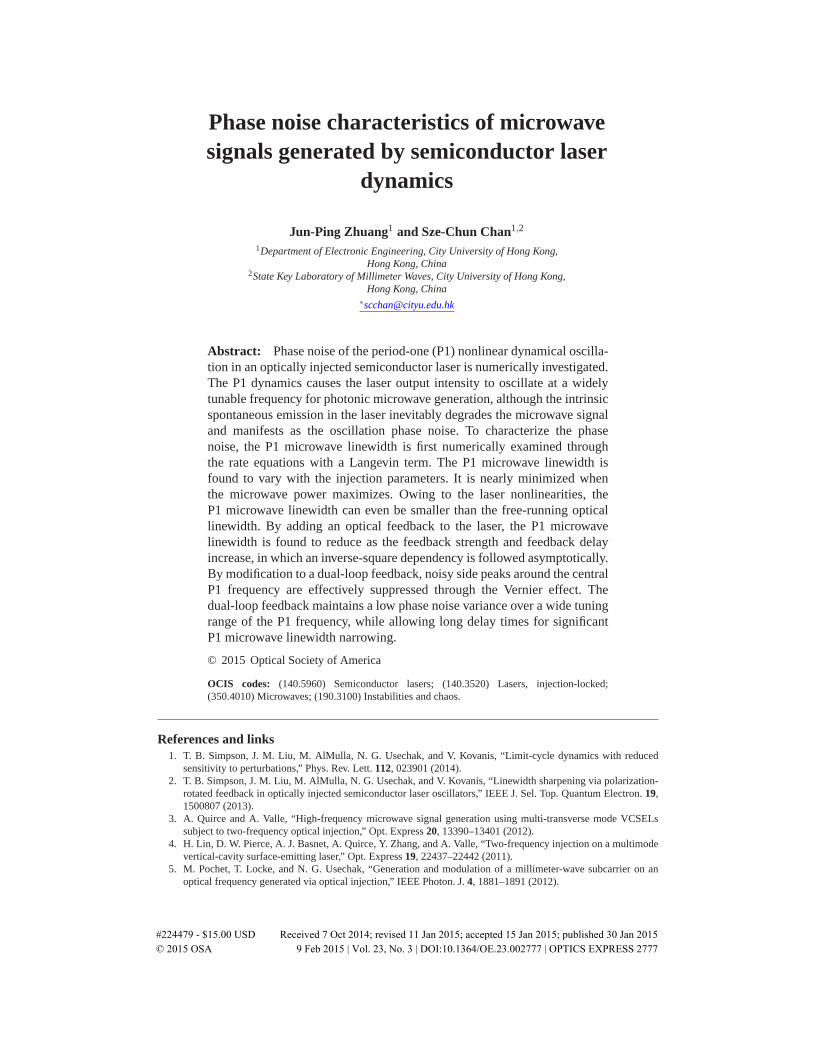
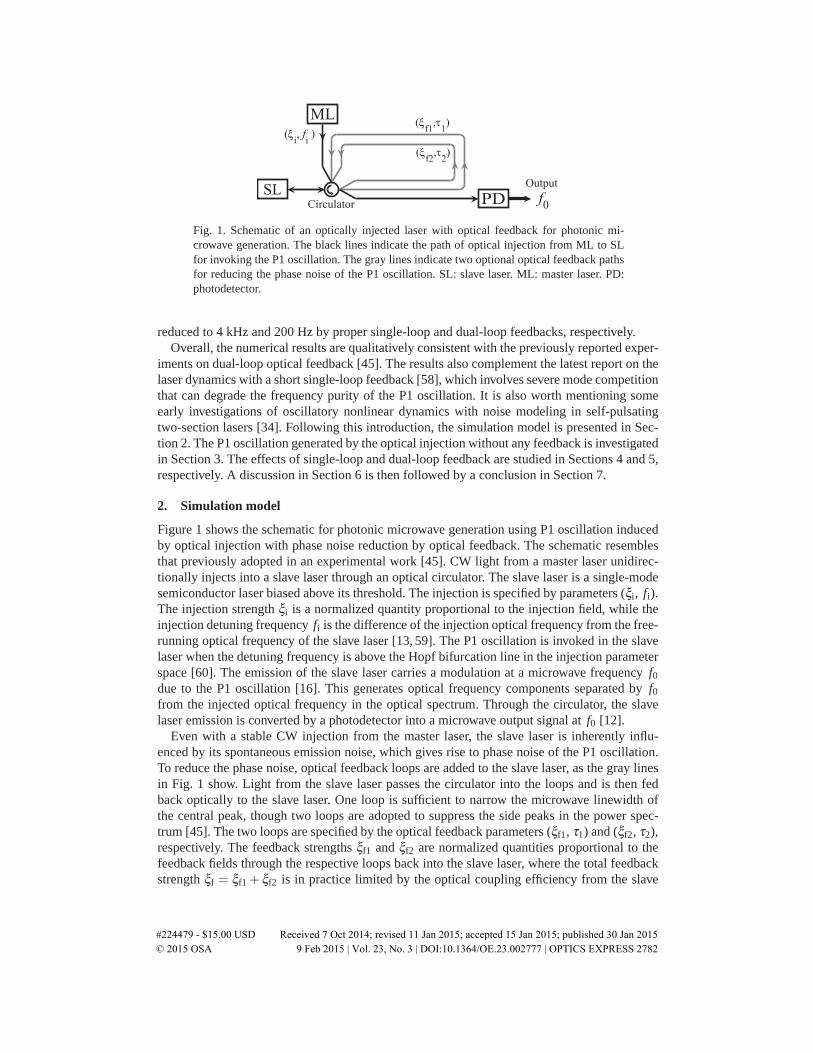
Fig. 1. Schematic of an optically injected laser with optical feedback for photonic mi-crowave generation. The black lines indicate the path of optical injection from ML to SLfor invoking the P1 oscillation. The gray lines indicate two optional optical feedback pathsfor reducing the phase noise of the P1 oscillation. SL: slave laser. ML: master laser. PD:photodetector.
reduced to 4 kHz and 200 Hz by proper single-loop and dual-loop feedbacks, respectively.Overall, the numerical results are qualitatively consistent with the previously reported exper-
iments on dual-loop optical feedback [45]. The results also complement the latest report on thelaser dynamics with a short single-loop feedback [58], which involves severe mode competitionthat can degrade the frequency purity of the P1 oscillation. It is also worth mentioning someearly investigations of oscillatory nonlinear dynamics with noise modeling in self-pulsatingtwo-section lasers [34]. Following this introduction, the simulation model is presented in Sec-tion 2. The P1 oscillation generated by the optical injection without any feedback is investigatedin Section 3. The effects of single-loop and dual-loop feedback are studied in Sections 4 and 5,respectively. A discussion in Section 6 is then followed by a conclusion in Section 7.
2. Simulation model
Figure 1 shows the schematic for photonic microwave generation using P1 oscillation inducedby optical injection with phase noise reduction by optical feedback. The schematic resemblesthat previously adopted in an experimental work [45]. CW light from a master laser unidirec-tionally injects into a slave laser through an optical circulator. The slave laser is a single-modesemiconductor laser biased above its threshold. The injection is specified by parameters (ξi, fi).The injection strength ξi is a normalized quantity proportional to the injection field, while theinjection detuning frequency fi is the difference of the injection optical frequency from the free-running optical frequency of the slave laser [13, 59]. The P1 oscillation is invoked in the slavelaser when the detuning frequency is above the Hopf bifurcation line in the injection parameterspace [60]. The emission of the slave laser carries a modulation at a microwave frequency f0due to the P1 oscillation [16]. This generates optical frequency components separated by f0from the injected optical frequency in the optical spectrum. Through the circulator, the slavelaser emission is converted by a photodetector into a microwave output signal at f0 [12].
Even with a stable CW injection from the master laser, the slave laser is inherently influ-enced by its spontaneous emission noise, which gives rise to phase noise of the P1 oscillation.To reduce the phase noise, optical feedback loops are added to the slave laser, as the gray linesin Fig. 1 show. Light from the slave laser passes the circulator into the loops and is then fedback optically to the slave laser. One loop is sufficient to narrow the microwave linewidth ofthe central peak, though two loops are adopted to suppress the side peaks in the power spec-trum [45]. The two loops are specified by the optical feedback parameters (ξf1, τ1) and (ξf2, τ2),respectively. The feedback strengths ξf1 and ξf2 are normalized quantities proportional to thefeedback fields through the respective loops back into the slave laser, where the total feedbackstrength ξf = ξf1 + ξf2 is in practice limited by the optical coupling efficiency from the slave
#224479 - $15.00 USD Received 7 Oct 2014; revised 11 Jan 2015; accepted 15 Jan 2015; published 30 Jan 2015 © 2015 OSA 9 Feb 2015 | Vol. 23, No. 3 | DOI:10.1364/OE.23.002777 | OPTICS EXPRESS 2782
laser into the circulator [44]. The feedback delay times τ1 and τ2 are the group delays of theoptical signal emitting from and returning to the slave laser through the respective loops [61].The slave laser, injection, and feedbacks are assumed to have aligned polarizations. The phasedifferences are ignored as they do not show strong influences on the oscillation noise in thefollowing simulation results.
The dynamics of the slave laser is described by the intracavity optical field amplitudeA(t) and the charge carrier density N(t). The field amplitude is a complex phasor quantitywith respect to the free-running optical frequency of the slave laser. For convenience, thefield amplitude is normalized to a = A/|A0| and the charge carrier density is normalized ton = (N −N0)/N0, where A0 and N0 are respectively the free-running values of A and N. Theslave laser is modeled by the following rate equations [13, 59]:
dadt
=1− ib
2
[γcγn
γsJn− γp(|a|2 −1)
]a+ξiγce
−i2π fit + f
+ξf1γca(t − τ1)+ξf2γca(t − τ2), (1)dndt
= −(γs + γn|a|2
)n− γsJ
(1− γp
γc|a|2)(|a|2 −1), (2)
where γc is the cavity decay rate, γs is the spontaneous carrier relaxation rate, γn is the differen-tial carrier relaxation rate, γp is the nonlinear carrier relaxation rate, b is the linewidth enhance-ment factor, and J is the normalized bias current above threshold. The term with ξi representsthe optical injection [6,12,44]. The terms with ξf1 and ξf2 represent the optical feedbacks fromthe two loops [61].
A Langevin fluctuating force f is included in Eq. (1) to account for the spontaneous emissionnoise of the slave laser [59, 62]. Its real and imaginary parts are mutually independent. TheLangevin force at different times are also independent, where ergodicity is observed with thefollowing averages:
< f (t) f ∗(t ′)> =4πΔν1+b2 δ (t − t ′), (3)
< f (t) f (t ′)> = 0, (4)
< f (t)> = 0. (5)
Here, Δν is the full width at half-maximum (FWHM) optical linewidth when the slave laseris free-running [63]. Unlike other environmental fluctuations such as temperature and detuningvariations, the spontaneous emission noise represented by f is intrinsic to the slave laser andcannot be avoided. In the simulations, the FWHM optical linewidth of the free-running slavelaser is taken as Δν = 100 MHz [3]. The parameters from a typical semiconductor laser areadopted [12]: γc = 5.36× 10¹¹ s−1, γs = 5.96× 10⁹ s−1, γn = 7.53× 10⁹ s−1, γp = 1.91×10¹⁰ s−1, b = 3.2, and J = 1.222. They correspond to a relaxation resonance frequency of fr =10.25 GHz. Second-order Runge-Kutta integration is conducted on Eqs. (1)–(2). The opticalspectrum and power spectrum of the slave laser emission are obtained by applying the Fouriertransform on a(t) and |a(t)|2, respectively. The optical spectrum directly corresponds to theslave laser emission light, whereas the power spectrum corresponds to the microwave output ofthe photodetector in Fig. 1. The numerical integration has a time step of 0.93 ps. It is carriedover a time span of effectively up to 1.05 ms, which is orders of magnitude longer than thosereported in most related works [1, 12, 16]. The long time span enables high spectral resolutionfor examining the narrow microwave linewidths.
#224479 - $15.00 USD Received 7 Oct 2014; revised 11 Jan 2015; accepted 15 Jan 2015; published 30 Jan 2015 © 2015 OSA 9 Feb 2015 | Vol. 23, No. 3 | DOI:10.1364/OE.23.002777 | OPTICS EXPRESS 2783
3. Optical injection-induced P1
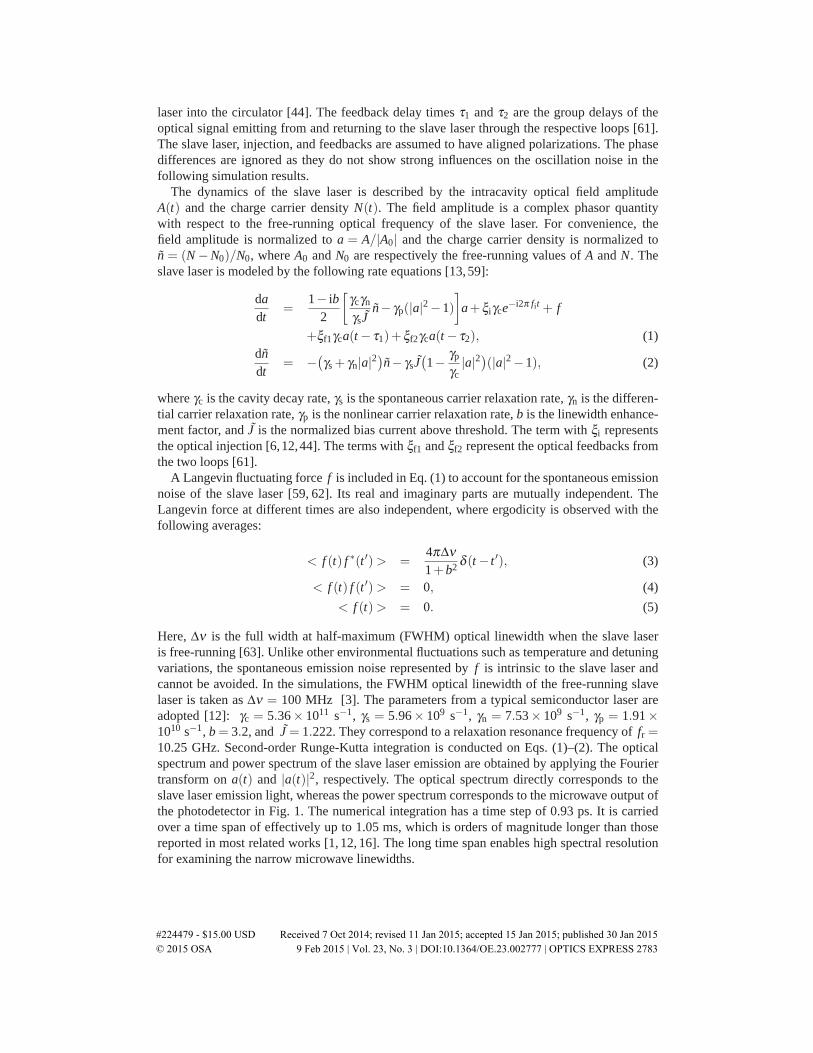
The P1 oscillation is invoked in the slave laser by optical injection alone without applyingany optical feedback. The optical injection parameters (ξi, fi) determine the P1 oscillation fre-quency f0. The optical feedback strengths ξf1 and ξf2 are set to zero. The variation of theP1 microwave linewidth at different oscillation frequencies is examined in this section. Fig-ures 2(a)–2(d) show the optical spectra and the power spectra of the slave laser emission underP1 oscillations of different frequencies f0. The resolution bandwidths of the optical and powerspectra are 8 MHz and 0.06 MHz, respectively. The optical spectra are offset to the opticalfrequency of the free-running slave laser, while the power spectra are centered at the respectiveP1 oscillation frequencies f0. For each value of f0 in Fig. 2, the injection parameters are chosento maximize the microwave power, which corresponds to maximizing the intensity modulationdepth in the time-domain intensity waveforms. The intensity modulation depth is found to ex-ceed 94% under the injection parameters in Fig. 2. Throughout this work, the microwave poweris estimated by integrating the power spectrum over ±1 GHz around f0, where the microwaveharmonics at multiples of f0 are at least 20 dB weaker than the fundamental and are henceignored.
3.1. Microwave linewidth Δ f0 versus frequency f0
In Fig. 2(a) with (ξi, fi) = (0.03, 4.0 GHz), the slave laser exhibits P1 oscillation at f0 =10.2 GHz. From the optical spectrum in Fig. 2(a-i), the optical injection with detuning fre-quency fi is regenerated in the slave laser as the red arrow indicates. The P1 dynamics gives riseto a number of optical sidebands separated by multiples of the P1 frequency f0 from the regen-erative component. These optical sidebands generate a beat signal at f0 in the power spectrum,as Fig. 2(a-ii) shows. However, the spontaneous emission noise represented by the Langevinfluctuating force broadens the optical linewidths of the optical sidebands. It also broadens themicrowave linewidth at f0 in the power spectrum, which has a FWHW microwave linewidth ofΔ f0 = 55 MHz based on a Lorentzian fit.
In Fig. 2(b) with (ξi, fi) = (0.12, 7.0 GHz), the P1 frequency f0 increases to 18 GHz. Theoptical spectrum in Fig. 2(b-i) again contains the regenerative component at fi and the opticalsidebands separated by multiples of f0. The strongest components of the optical spectrum arethe regenerative component at fi and its first lower sideband at fi − f0. The two componentsare of equal amplitude and so attain the maximal intensity modulation depth of 100% [12]. Thepower spectrum in Fig. 2(b-ii) shows the beat signal at f0, which has a narrower microwavelinewidth Δ f0 = 14 MHz. This is actually the narrowest microwave linewidth of P1 oscillation ifno feedback is applied. Interestingly, the P1 microwave linewidth Δ f0 is even narrower than thefree-running optical linewidth Δν of the laser. The narrow linewidth is allowed by the nonlinearfrequency mixing among a number of optical frequency components in the P1 optical spectrumof Fig. 2(b-i). The P1 oscillation is not exactly the same as heterodyning the injection light witha free-running slave laser [12,13]. Similar narrowing of microwave linewidth through nonlinearfrequency mixing was also reported in mutually coupled three-laser systems with DFB lasersas well as semiconductor ring lasers (SRLs) [43, 64].
In Fig. 2(c) with (ξi, fi) = (0.17, 14.2 GHz), the P1 frequency f0 increases to 24 GHz. Theassociated microwave linewidth slightly degrades to Δ f0 = 22 MHz. In Fig. 2(d) with (ξi, fi) =(0.48, 55.5 GHz), the P1 frequency f0 continually increases to 60 GHz, which is much greaterthan the relaxation resonance frequency fr of the laser. From the optical spectrum in Fig. 2(d-i),the components at fi and fi − f0 are now much more dominating, in which they are at least30 dB stronger than the rest of the sidebands. According to a two-wavelength approximation,the component at fi is simply the regeneration of the emission, while the component at fi − f0is the emission of the slave laser near its cavity resonance [13]. The slave laser is different from
#224479 - $15.00 USD Received 7 Oct 2014; revised 11 Jan 2015; accepted 15 Jan 2015; published 30 Jan 2015 © 2015 OSA 9 Feb 2015 | Vol. 23, No. 3 | DOI:10.1364/OE.23.002777 | OPTICS EXPRESS 2784
Injection Only
Fig. 2. (i) Optical spectra and (ii) power spectra of the slave laser emission subject to opticalinjection alone without any feedback. The laser is driven into P1 oscillation at frequency f0= (a) 10.2 GHz, (b) 18 GHz, (c) 24 GHz, and (d) 60 GHz by using injection parameters (ξi,fi) = (0.03, 4.0 GHz), (0.12, 7.0 GHz), (0.17, 14.2 GHz), and (0.48, 55.5 GHz), respectively.The injection parameters are chosen to maximize the microwave power for each f0. Themicrowave linewidth Δ f0 is labeled in each power spectrum.
being free-running because its cavity resonance is red-shifted by the injection. Strong injectioncan suppress the emission power at fi − f0 and thereby can increase the optical linewidth atfi − f0 beyond Δν [63]. Through beating with the regenerative component, the component atfi− f0 produces the power spectrum in Fig. 2(d-ii). The microwave linewidth is increased to Δ f0= 105 MHz, which is now larger than Δν . For maximal microwave power, further increasing f0requires increasing fi. It is associated with reducing the emission power at fi − f0 with furtherdegradation of Δ f0. In short, Fig. 2 illustrates the wide tunability of the P1 frequency f0 beyondthe relaxation resonance frequency fr, though the associated microwave linewidth Δ f0 varieswith the injection parameters.
3.2. Microwave linewidth Δ f0 versus injection parameters (ξi, fi)
To systematically investigate the behavior of the P1 microwave linewidth Δ f0, Fig. 3 showsits contour map in the injection parameter space (ξi, fi). The large blue region above the Hopfbifurcation line is a region of P1 oscillation. The blue contour map indicates the microwavelinewidth Δ f0 of the P1 oscillation. At (ξi, fi) = (0.12, 7.0 GHz), the yellow point in Fig. 3gives the minimal linewidth of Δ f0 = 14 MHz. Such a minimal-linewidth point is attained at f0
#224479 - $15.00 USD Received 7 Oct 2014; revised 11 Jan 2015; accepted 15 Jan 2015; published 30 Jan 2015 © 2015 OSA 9 Feb 2015 | Vol. 23, No. 3 | DOI:10.1364/OE.23.002777 | OPTICS EXPRESS 2785
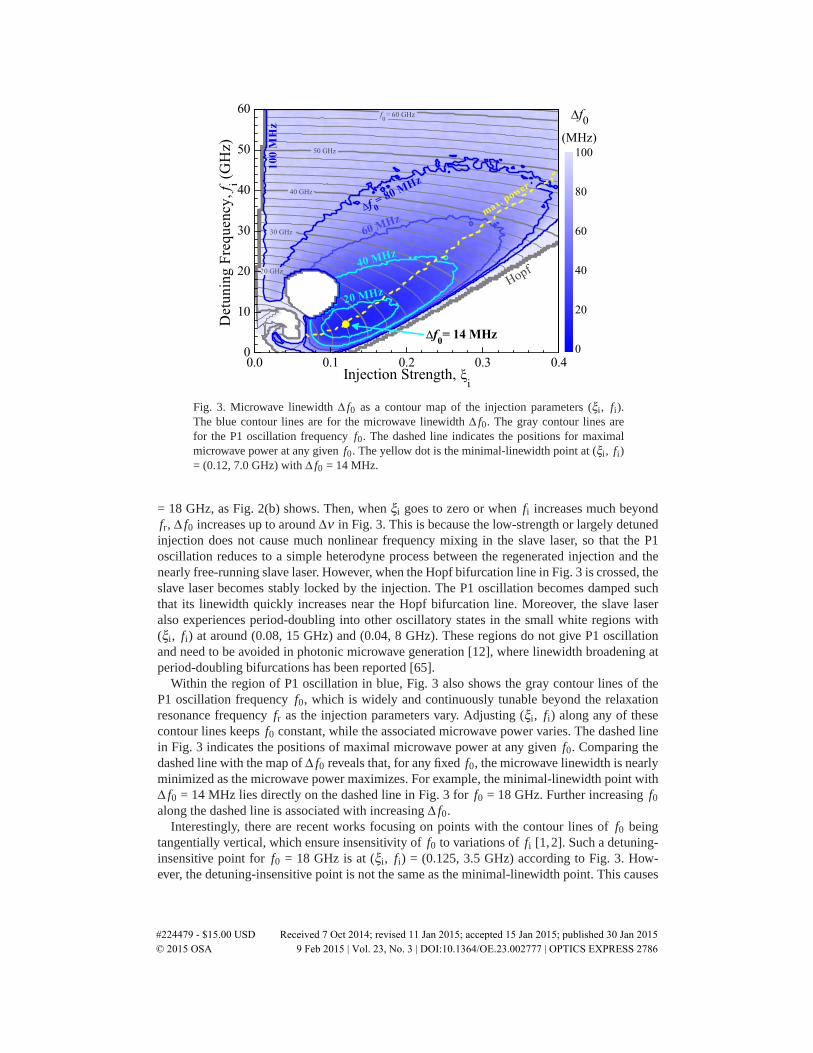
Fig. 3. Microwave linewidth Δ f0 as a contour map of the injection parameters (ξi, fi).The blue contour lines are for the microwave linewidth Δ f0. The gray contour lines arefor the P1 oscillation frequency f0. The dashed line indicates the positions for maximalmicrowave power at any given f0. The yellow dot is the minimal-linewidth point at (ξi, fi)= (0.12, 7.0 GHz) with Δ f0 = 14 MHz.
= 18 GHz, as Fig. 2(b) shows. Then, when ξi goes to zero or when fi increases much beyondfr, Δ f0 increases up to around Δν in Fig. 3. This is because the low-strength or largely detunedinjection does not cause much nonlinear frequency mixing in the slave laser, so that the P1oscillation reduces to a simple heterodyne process between the regenerated injection and thenearly free-running slave laser. However, when the Hopf bifurcation line in Fig. 3 is crossed, theslave laser becomes stably locked by the injection. The P1 oscillation becomes damped suchthat its linewidth quickly increases near the Hopf bifurcation line. Moreover, the slave laseralso experiences period-doubling into other oscillatory states in the small white regions with(ξi, fi) at around (0.08, 15 GHz) and (0.04, 8 GHz). These regions do not give P1 oscillationand need to be avoided in photonic microwave generation [12], where linewidth broadening atperiod-doubling bifurcations has been reported [65].
Within the region of P1 oscillation in blue, Fig. 3 also shows the gray contour lines of theP1 oscillation frequency f0, which is widely and continuously tunable beyond the relaxationresonance frequency fr as the injection parameters vary. Adjusting (ξi, fi) along any of thesecontour lines keeps f0 constant, while the associated microwave power varies. The dashed linein Fig. 3 indicates the positions of maximal microwave power at any given f0. Comparing thedashed line with the map of Δ f0 reveals that, for any fixed f0, the microwave linewidth is nearlyminimized as the microwave power maximizes. For example, the minimal-linewidth point withΔ f0 = 14 MHz lies directly on the dashed line in Fig. 3 for f0 = 18 GHz. Further increasing f0along the dashed line is associated with increasing Δ f0.
Interestingly, there are recent works focusing on points with the contour lines of f0 beingtangentially vertical, which ensure insensitivity of f0 to variations of fi [1,2]. Such a detuning-insensitive point for f0 = 18 GHz is at (ξi, fi) = (0.125, 3.5 GHz) according to Fig. 3. How-ever, the detuning-insensitive point is not the same as the minimal-linewidth point. This causes
#224479 - $15.00 USD Received 7 Oct 2014; revised 11 Jan 2015; accepted 15 Jan 2015; published 30 Jan 2015 © 2015 OSA 9 Feb 2015 | Vol. 23, No. 3 | DOI:10.1364/OE.23.002777 | OPTICS EXPRESS 2786
no contradiction because the intrinsic spontaneous emission noise, rather than the detuningvariation, is considered as the fundamental source of fluctuation here in Fig. 3. As for experi-mental investigations, the temperature fluctuations have not been totally eliminated thus far, soboth detuning variations and spontaneous emissions contribute to the linewidth. The linewidth,nonetheless, was experimentally confirmed to vary with the injection parameters [2, 45].
Summarizing this section on optical injection, the P1 oscillation can have a microwavelinewidth Δ f0 being smaller than the free-running optical linewidth Δν . Given a P1 microwavefrequency f0, its linewidth Δ f0 is nearly minimized when the microwave power maximizes.The P1 frequency f0 can also be tuned much beyond fr, but it is associated with increasingΔ f0. In order to reduce the microwave linewidth and phase noise, optical feedbacks on the P1oscillation are considered in the following sections.
4. P1 with single-loop feedback
Linewidth reduction through single-loop optical feedback is considered in this section on theoptically injected laser in P1 oscillation. Similar to a solitary laser without injection [66,67], thefeedback loop stores the phase information, sets up external cavity modes, and causes reductionof the linewidth for the central peak along with residual side peaks separated by the reciprocalof the feedback delay time. In this section, the optical injection parameters are fixed at (ξi, fi) =(0.17, 14.2 GHz). The laser enters P1 oscillation at f0 = 24 GHz as in Fig. 2(c) prior to applyingany feedback. To avoid losing generality, the injection parameters are chosen not to correspondto the minimum-linewidth point in Fig. 3 as the feedback is found to reduce the microwavelinewidth regardless of the P1 frequency. Only one loop in Fig. 1 is turned on with feedbackparameters (ξf1, τ1) denoted simply as (ξf, τ), whilst the other loop remains off by keeping ξf2
at zero. Figures 4(a)–4(d) show the optical and power spectra of the laser emission at differentfeedback strengths. The feedback delay time is fixed at τ = 2.4 ns. The optical spectra are againoffset to the free-running frequency of the laser. The power spectra are centered at 24 GHz. Theresolution bandwidth of the optical spectra remains at 8 MHz, but that of the power spectrais decreased to 1 kHz for examining the narrow central peaks. The high-resolution spectra aremade possible by the significantly increased effective simulation time-span compared to mostearlier works [1, 12, 16].
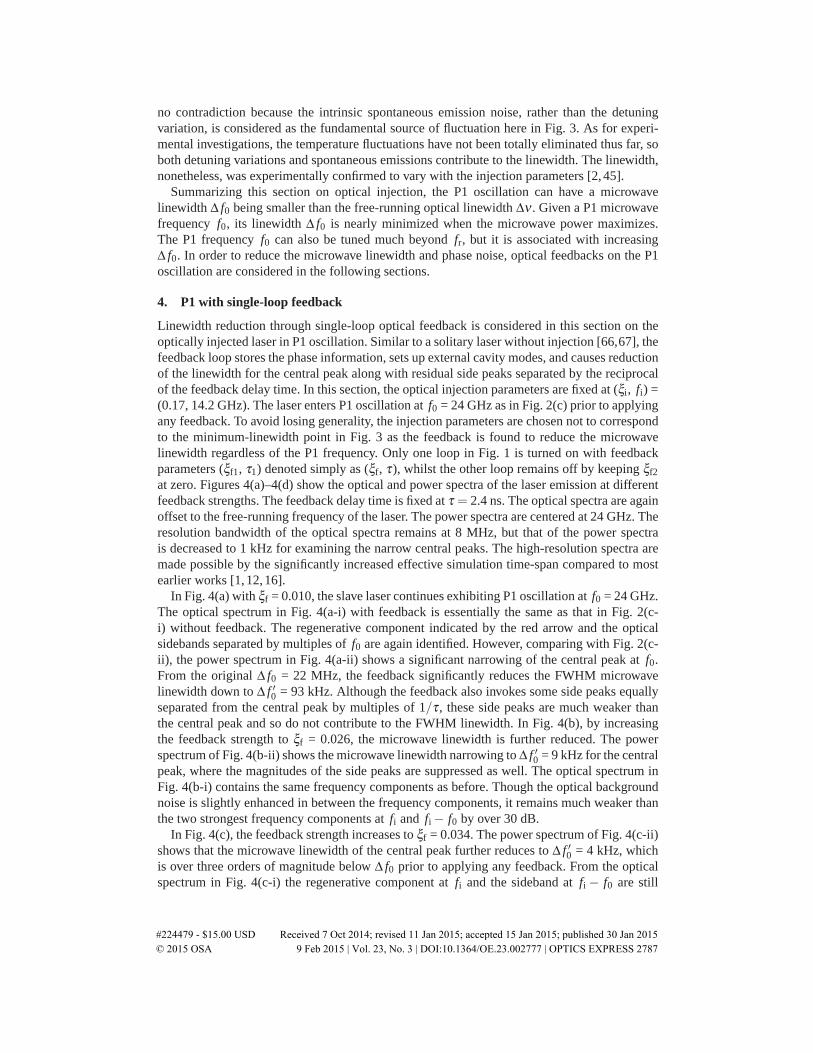
In Fig. 4(a) with ξf = 0.010, the slave laser continues exhibiting P1 oscillation at f0 = 24 GHz.The optical spectrum in Fig. 4(a-i) with feedback is essentially the same as that in Fig. 2(c-i) without feedback. The regenerative component indicated by the red arrow and the opticalsidebands separated by multiples of f0 are again identified. However, comparing with Fig. 2(c-ii), the power spectrum in Fig. 4(a-ii) shows a significant narrowing of the central peak at f0.From the original Δ f0 = 22 MHz, the feedback significantly reduces the FWHM microwavelinewidth down to Δ f ′0 = 93 kHz. Although the feedback also invokes some side peaks equallyseparated from the central peak by multiples of 1/τ , these side peaks are much weaker thanthe central peak and so do not contribute to the FWHM linewidth. In Fig. 4(b), by increasingthe feedback strength to ξf = 0.026, the microwave linewidth is further reduced. The powerspectrum of Fig. 4(b-ii) shows the microwave linewidth narrowing to Δ f ′0 = 9 kHz for the centralpeak, where the magnitudes of the side peaks are suppressed as well. The optical spectrum inFig. 4(b-i) contains the same frequency components as before. Though the optical backgroundnoise is slightly enhanced in between the frequency components, it remains much weaker thanthe two strongest frequency components at fi and fi − f0 by over 30 dB.
In Fig. 4(c), the feedback strength increases to ξf = 0.034. The power spectrum of Fig. 4(c-ii)shows that the microwave linewidth of the central peak further reduces to Δ f ′0 = 4 kHz, whichis over three orders of magnitude below Δ f0 prior to applying any feedback. From the opticalspectrum in Fig. 4(c-i) the regenerative component at fi and the sideband at fi − f0 are still
#224479 - $15.00 USD Received 7 Oct 2014; revised 11 Jan 2015; accepted 15 Jan 2015; published 30 Jan 2015 © 2015 OSA 9 Feb 2015 | Vol. 23, No. 3 | DOI:10.1364/OE.23.002777 | OPTICS EXPRESS 2787
Injection with Single-loop Feedback
Fig. 4. (i) Optical spectra and (ii) power spectra of the slave laser emission subject tooptical injection with single-loop feedback. The feedback strength ξf = (a) 0.010, (b) 0.026,(c) 0.034, and (d) 0.060. The feedback delay time is fixed at τ = 2.4 ns. The injectionparameters are fixed at (ξi, fi) = (0.17, 14.2 GHz). The reduced microwave linewidth Δ f ′0is labeled for each central peak at f0.
the two strongest components, yet subharmonic components emerge in between the originalcomponents because of proximity to a period-doubling bifurcation [52]. A subharmonic sig-nal at f0/2 emerges accordingly in the power spectrum, but it is over 9 dB weaker than thefundamental at f0 and can be easily filtered out by microwave filters in practical systems.
Obviously, the feedback strength cannot be increased indefinitely. For instance, in Fig. 4(d),the slave laser enters into chaotic oscillation when the feedback strength increases to 0.060. Theoptical spectrum in Fig. 4(d-i) still contains the regenerative component at fi, but the spectrumis much broadended into a continuum of chaos. The power spectrum is broadened significantlywith only a small portion shown in Fig. 4(d-ii), which contains a repeating pattern in every 1/τas a characteristic of feedback-induced chaos [61]. It is worth mentioning that the different non-linear dynamical regimes of the laser under both optical injection and feedback were recentlystudied in detail [8, 58], where chaotic oscillations must be avoided for microwave generationby limiting the maximal feedback strength.
According to the numerical results in Fig. 4, the P1 microwave linewidth reduces as the feed-back strength increases as long as the laser remains in periodic oscillation. Experimentally, thefeedback-induced narrowing of the P1 microwave linewidth was confirmed [45]. Analytically,the feedback-induced microwave linewidth reduction has not been thoroughly understood. In
#224479 - $15.00 USD Received 7 Oct 2014; revised 11 Jan 2015; accepted 15 Jan 2015; published 30 Jan 2015 © 2015 OSA 9 Feb 2015 | Vol. 23, No. 3 | DOI:10.1364/OE.23.002777 | OPTICS EXPRESS 2788
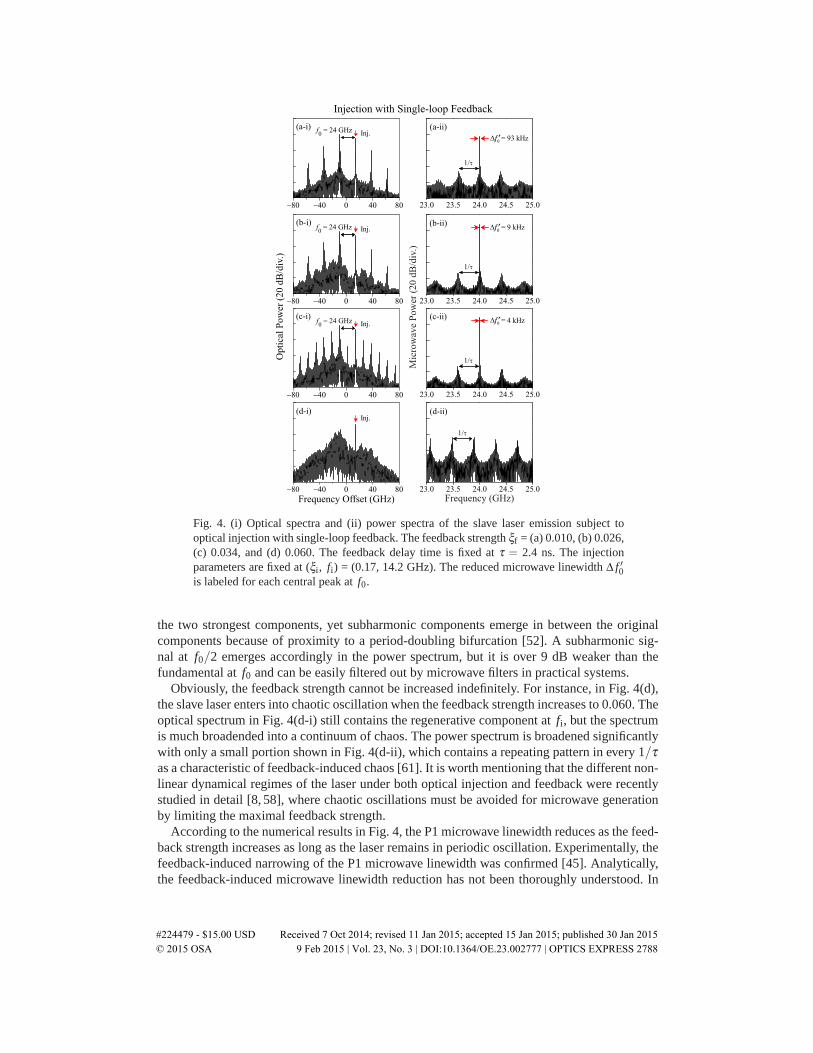
Fig. 5. Reduced microwave linewidth Δ f ′0 (closed symbols) and microwave power (opensymbols) as functions of the single-loop feedback strength ξf. The feedback delay time isfixed at τ = 2.4 ns. The estimations of Δ f ′0 with β = 1 (blue) and
√1+b2 (red) are obtained
from Eq. (6). The red curve is the lower-bound of Δ f ′0.
order to estimate the reduced microwave linewidth Δ f ′0, it is first observed from Figs. 4(a-i)–4(c-i) that the two components at fi and fi − f0 dominate the P1 optical spectra. The regener-ative component at fi comes from a CW injection and carries nearly no linewidth. So the P1microwave linewidth is directly translated from the optical linewidth at fi − f0. Then, by bor-rowing the results on feedback-induced optical linewidth narrowing in a solitary laser withoutinjection [44,66,67], the feedback-induced optical linewidth narrowing at fi− f0 for the injectedlaser is estimated. As a result, the reduced microwave linewidth Δ f ′0 for the P1 oscillation withfeedback (ξf, τ) is approximated as
Δ f ′0 ≈Δ f0
(1+βγcτξf)2 , (6)
where Δ f0 is the microwave linewidth obtained under optical injection alone prior to applyingany feedback and the feedback is assumed not to affect the optical power at fi− f0 as Figs. 4(a-i)–4(c-i) suggest. The factor β depends on the excited external cavity mode [44]. It is equalto unity for the minimum threshold mode and equal to
√1+b2 for the minimum linewidth
mode. The latter case sets the lower-bound of Δ f ′0. The dependencies of Δ f ′0 on the feedbackparameters are simulated next for verifying Eq. (6).
4.1. Reduced microwave linewidth Δ f ′0 versus feedback strength ξf
The closed symbols in Fig. 5 show the reduced microwave linewidth Δ f ′0 as the feedbackstrength ξf varies. The feedback delay time is fixed at τ = 2.4 ns. The linewidth is obtainedat the P1 frequency of f0 = 24 GHz because the injection is fixed at (ξi, fi) = (0.17, 14.2 GHz).The P1 oscillation has the original microwave linewidth of Δ f0 = 22 MHz prior to applicationof the feedback as shown in Fig. 2(c-ii). As the feedback strength ξf increases, the microwavelinewidth Δ f ′0 decreases continuously. It reaches a minimal value of 4 kHz at ξf = 0.034 inFig. 5. Further increasing the feedback strength eventually drives the laser into chaos and sobroadens the linewidth.
Using Eq. (6), Δ f ′0 is estimated as the blue and red curves for β = 1 and√
1+b2, respec-tively. Provided that the laser remains in periodic oscillation, the simulation results are abovethe analytical lower-bound as indicated by the red curve. The simulation results are also in
#224479 - $15.00 USD Received 7 Oct 2014; revised 11 Jan 2015; accepted 15 Jan 2015; published 30 Jan 2015 © 2015 OSA 9 Feb 2015 | Vol. 23, No. 3 | DOI:10.1364/OE.23.002777 | OPTICS EXPRESS 2789
close agreement with the analytical results in blue. According to Eq. (6), when the feedbackis sufficiently strong with ξfτ � γ−1
c , the reduced microwave linewidth Δ f ′0 is proportional toξ−2
f .The microwave power of the signal at f0 is plotted as open symbols in Fig. 5. The power
varies by less than 3 dB when ξf < 0.04 as long as the laser remains in periodic oscillation.Therefore, unlike conventional oscillators such as the OEOs, the feedback in Fig. 1 is not re-sponsible for generating the P1 oscillation. The feedback merely stabilizes the fluctuations ofthe P1 oscillation [57].
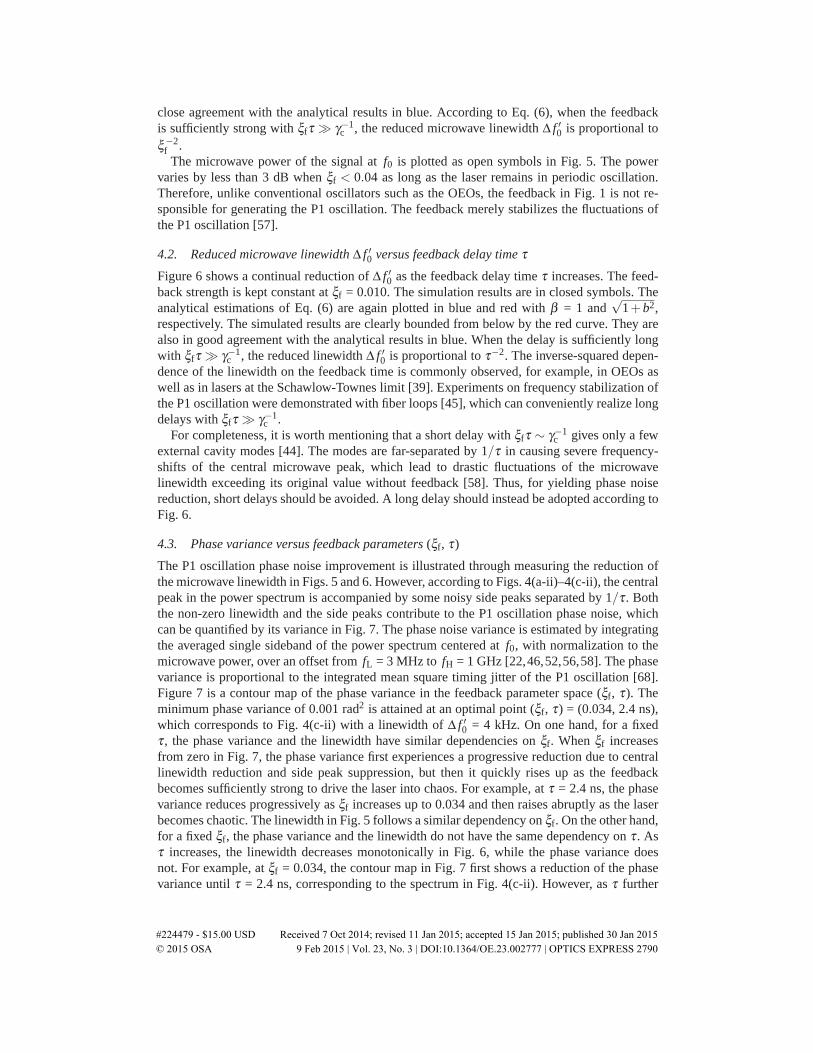
4.2. Reduced microwave linewidth Δ f ′0 versus feedback delay time τFigure 6 shows a continual reduction of Δ f ′0 as the feedback delay time τ increases. The feed-back strength is kept constant at ξf = 0.010. The simulation results are in closed symbols. Theanalytical estimations of Eq. (6) are again plotted in blue and red with β = 1 and
√1+b2,
respectively. The simulated results are clearly bounded from below by the red curve. They arealso in good agreement with the analytical results in blue. When the delay is sufficiently longwith ξfτ � γ−1
c , the reduced linewidth Δ f ′0 is proportional to τ−2. The inverse-squared depen-dence of the linewidth on the feedback time is commonly observed, for example, in OEOs aswell as in lasers at the Schawlow-Townes limit [39]. Experiments on frequency stabilization ofthe P1 oscillation were demonstrated with fiber loops [45], which can conveniently realize longdelays with ξfτ � γ−1
c .For completeness, it is worth mentioning that a short delay with ξfτ ∼ γ−1
c gives only a fewexternal cavity modes [44]. The modes are far-separated by 1/τ in causing severe frequency-shifts of the central microwave peak, which lead to drastic fluctuations of the microwavelinewidth exceeding its original value without feedback [58]. Thus, for yielding phase noisereduction, short delays should be avoided. A long delay should instead be adopted according toFig. 6.
4.3. Phase variance versus feedback parameters (ξf, τ)
The P1 oscillation phase noise improvement is illustrated through measuring the reduction ofthe microwave linewidth in Figs. 5 and 6. However, according to Figs. 4(a-ii)–4(c-ii), the centralpeak in the power spectrum is accompanied by some noisy side peaks separated by 1/τ . Boththe non-zero linewidth and the side peaks contribute to the P1 oscillation phase noise, whichcan be quantified by its variance in Fig. 7. The phase noise variance is estimated by integratingthe averaged single sideband of the power spectrum centered at f0, with normalization to themicrowave power, over an offset from fL = 3 MHz to fH = 1 GHz [22,46,52,56,58]. The phasevariance is proportional to the integrated mean square timing jitter of the P1 oscillation [68].Figure 7 is a contour map of the phase variance in the feedback parameter space (ξf, τ). Theminimum phase variance of 0.001 rad2 is attained at an optimal point (ξf, τ) = (0.034, 2.4 ns),which corresponds to Fig. 4(c-ii) with a linewidth of Δ f ′0 = 4 kHz. On one hand, for a fixedτ , the phase variance and the linewidth have similar dependencies on ξf. When ξf increasesfrom zero in Fig. 7, the phase variance first experiences a progressive reduction due to centrallinewidth reduction and side peak suppression, but then it quickly rises up as the feedbackbecomes sufficiently strong to drive the laser into chaos. For example, at τ = 2.4 ns, the phasevariance reduces progressively as ξf increases up to 0.034 and then raises abruptly as the laserbecomes chaotic. The linewidth in Fig. 5 follows a similar dependency on ξf. On the other hand,for a fixed ξf, the phase variance and the linewidth do not have the same dependency on τ . Asτ increases, the linewidth decreases monotonically in Fig. 6, while the phase variance doesnot. For example, at ξf = 0.034, the contour map in Fig. 7 first shows a reduction of the phasevariance until τ = 2.4 ns, corresponding to the spectrum in Fig. 4(c-ii). However, as τ further
#224479 - $15.00 USD Received 7 Oct 2014; revised 11 Jan 2015; accepted 15 Jan 2015; published 30 Jan 2015 © 2015 OSA 9 Feb 2015 | Vol. 23, No. 3 | DOI:10.1364/OE.23.002777 | OPTICS EXPRESS 2790
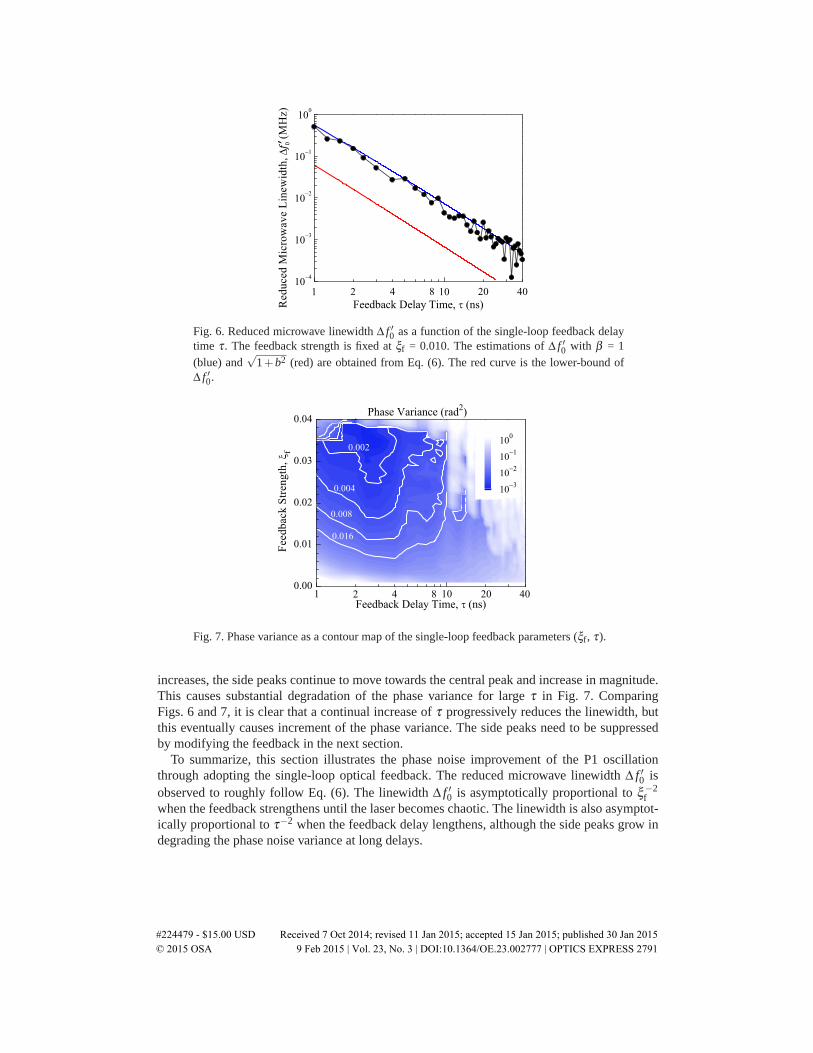
Fig. 6. Reduced microwave linewidth Δ f ′0 as a function of the single-loop feedback delaytime τ . The feedback strength is fixed at ξf = 0.010. The estimations of Δ f ′0 with β = 1(blue) and
√1+b2 (red) are obtained from Eq. (6). The red curve is the lower-bound of
Δ f ′0.
Fig. 7. Phase variance as a contour map of the single-loop feedback parameters (ξf, τ).
increases, the side peaks continue to move towards the central peak and increase in magnitude.This causes substantial degradation of the phase variance for large τ in Fig. 7. ComparingFigs. 6 and 7, it is clear that a continual increase of τ progressively reduces the linewidth, butthis eventually causes increment of the phase variance. The side peaks need to be suppressedby modifying the feedback in the next section.
To summarize, this section illustrates the phase noise improvement of the P1 oscillationthrough adopting the single-loop optical feedback. The reduced microwave linewidth Δ f ′0 isobserved to roughly follow Eq. (6). The linewidth Δ f ′0 is asymptotically proportional to ξ−2
fwhen the feedback strengthens until the laser becomes chaotic. The linewidth is also asymptot-ically proportional to τ−2 when the feedback delay lengthens, although the side peaks grow indegrading the phase noise variance at long delays.
#224479 - $15.00 USD Received 7 Oct 2014; revised 11 Jan 2015; accepted 15 Jan 2015; published 30 Jan 2015 © 2015 OSA 9 Feb 2015 | Vol. 23, No. 3 | DOI:10.1364/OE.23.002777 | OPTICS EXPRESS 2791
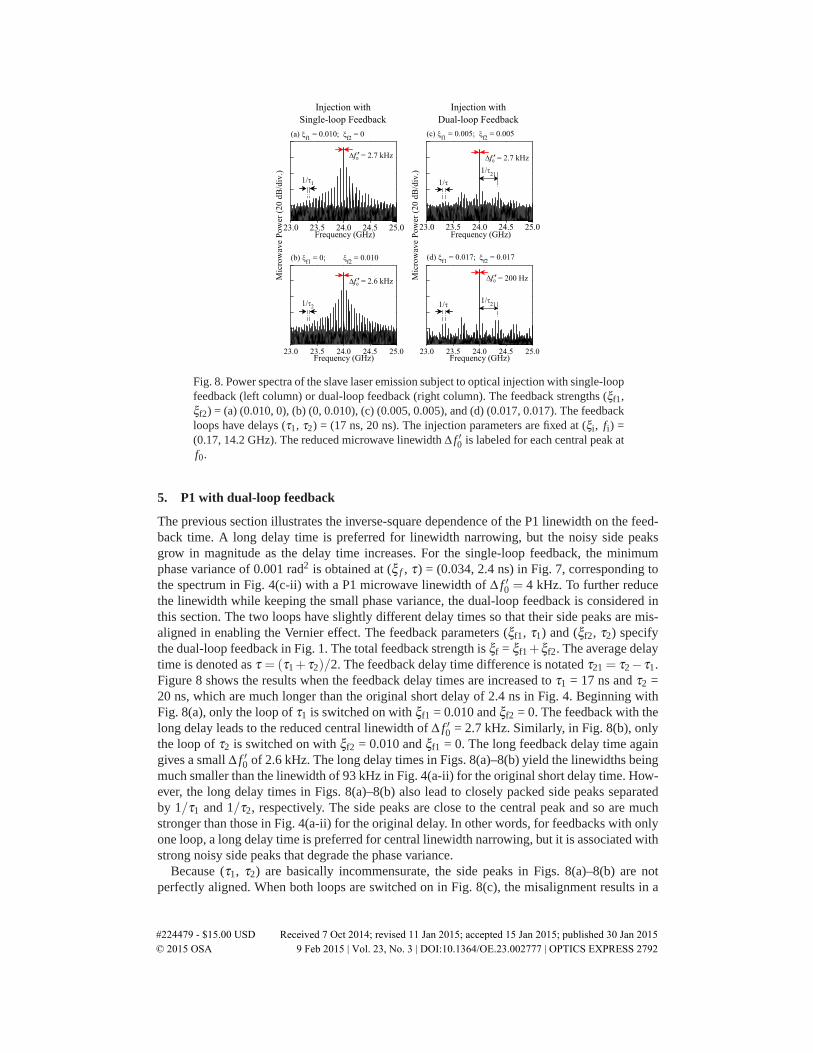
Fig. 8. Power spectra of the slave laser emission subject to optical injection with single-loopfeedback (left column) or dual-loop feedback (right column). The feedback strengths (ξf1,ξf2) = (a) (0.010, 0), (b) (0, 0.010), (c) (0.005, 0.005), and (d) (0.017, 0.017). The feedbackloops have delays (τ1, τ2) = (17 ns, 20 ns). The injection parameters are fixed at (ξi, fi) =(0.17, 14.2 GHz). The reduced microwave linewidth Δ f ′0 is labeled for each central peak atf0.
5. P1 with dual-loop feedback
The previous section illustrates the inverse-square dependence of the P1 linewidth on the feed-back time. A long delay time is preferred for linewidth narrowing, but the noisy side peaksgrow in magnitude as the delay time increases. For the single-loop feedback, the minimumphase variance of 0.001 rad2 is obtained at (ξ f , τ) = (0.034, 2.4 ns) in Fig. 7, corresponding tothe spectrum in Fig. 4(c-ii) with a P1 microwave linewidth of Δ f ′0 = 4 kHz. To further reducethe linewidth while keeping the small phase variance, the dual-loop feedback is considered inthis section. The two loops have slightly different delay times so that their side peaks are mis-aligned in enabling the Vernier effect. The feedback parameters (ξf1, τ1) and (ξf2, τ2) specifythe dual-loop feedback in Fig. 1. The total feedback strength is ξf = ξf1+ξf2. The average delaytime is denoted as τ = (τ1+τ2)/2. The feedback delay time difference is notated τ21 = τ2−τ1.Figure 8 shows the results when the feedback delay times are increased to τ1 = 17 ns and τ2 =20 ns, which are much longer than the original short delay of 2.4 ns in Fig. 4. Beginning withFig. 8(a), only the loop of τ1 is switched on with ξf1 = 0.010 and ξf2 = 0. The feedback with thelong delay leads to the reduced central linewidth of Δ f ′0 = 2.7 kHz. Similarly, in Fig. 8(b), onlythe loop of τ2 is switched on with ξf2 = 0.010 and ξf1 = 0. The long feedback delay time againgives a small Δ f ′0 of 2.6 kHz. The long delay times in Figs. 8(a)–8(b) yield the linewidths beingmuch smaller than the linewidth of 93 kHz in Fig. 4(a-ii) for the original short delay time. How-ever, the long delay times in Figs. 8(a)–8(b) also lead to closely packed side peaks separatedby 1/τ1 and 1/τ2, respectively. The side peaks are close to the central peak and so are muchstronger than those in Fig. 4(a-ii) for the original delay. In other words, for feedbacks with onlyone loop, a long delay time is preferred for central linewidth narrowing, but it is associated withstrong noisy side peaks that degrade the phase variance.
Because (τ1, τ2) are basically incommensurate, the side peaks in Figs. 8(a)–8(b) are notperfectly aligned. When both loops are switched on in Fig. 8(c), the misalignment results in a
#224479 - $15.00 USD Received 7 Oct 2014; revised 11 Jan 2015; accepted 15 Jan 2015; published 30 Jan 2015 © 2015 OSA 9 Feb 2015 | Vol. 23, No. 3 | DOI:10.1364/OE.23.002777 | OPTICS EXPRESS 2792
clear suppression of the side peaks as a Vernier effect [24, 69], which brings down the phasevariance significantly. The dual-loop feedback is simulated with two equally strong feedbackstrengths of ξf1 = ξf2 = 0.005 such that the total feedback strength ξf is still 0.010. As a result,the central linewidth is maintained at Δ f ′0 = 2.7 kHz, but the phase variance is brought backdown to the order of 0.001 rad2. By increasing both feedback strengths to ξf1 = ξf2 = 0.017,Fig. 8(d) shows a further reduction of the central peak linewidth down to just Δ f ′0 = 200 Hzaccording to a Lorentzian fit, where the phase noise variance is less than 0.001 rad2. Hence,the dual-loop feedback is preferred over single-loop feedback because it maintains a low phasevariance while the central linewidth narrows.
The spectra with dual-loop feedback in Fig. 8(c)–8(d) contains residual side peaks separatedat multiples of the reciprocal of the average delay τ . The magnitudes of the side peaks alsofollow an undulating envelope at the dual-loop beat frequency 1/τ21 = 0.33 GHz. Nonetheless,these side peaks are much weaker than the central peak because 1/τ21 is much greater than theoriginal P1 microwave linewidth of Δ f0 = 22 MHz without feedback, as in Fig. 2(c-ii). Thelinewidth reduction and side peaks suppression in Fig. 8 are qualitatively consistent with thereported experimental results [45].
5.1. Phase variance versus total feedback strength ξf
To systematically quantify the suppression of side peaks, Fig. 9 shows the phase noise varianceas the total feedback strength ξf varies. The feedback delay times are kept constant at τ1 =17 ns and τ2 = 20 ns. Generally, the phase variance comprises of the contribution from theLorentzian tail of the central peak and the contribution from the side peaks. When the sidepeaks are completely eliminated, the ideal phase variance can be calculated by integrating theLorentzian tail of the central peak with linewidth Δ f ′0. Such an ideal phase variance is givenby Δ f ′0( f−1
L − f−1H )/2π when Δ f ′0 fL [22, 68]. Here, Δ f ′0 is estimated by substituting the
total feedback strength ξf and the averaged delay time τ into Eq. (6) with β = 1. The resultantestimation of the ideal phase variance is shown in Fig. 9 as the blue curve, which is alwaysbelow the actual phase variance due to incomplete elimination of side peaks.
For single-loop feedback, only one loop is switched on at a time. The up-triangles are fromswitching on only the loop of τ1 at strength ξf1 = ξf so that ξf2 is zero. Likewise, the down-triangles are from switching on only the loop of τ2 at strength ξf2 = ξf so that ξf1 is zero. Re-gardless of which loop is switched on, the phase variance is always much greater than its idealvalue in Fig. 9, which is due to the strong side peaks obtained at the long feedback delay times.The triangles also show the gradual reduction of phase variances as ξf increases, although thereduction slope is less than that of the ideal phase variance. The phase variance eventually risesat ξf = 0.024 or 0.014 for the two independent loops as the laser exhibits complex dynamics.
By contrast, the dual-loop feedback yields the phase variance as the circles indicate in Fig. 9.Both loops are switched on with equal strengths such that ξf1 = ξf2 = ξf/2. The phase variancefrom dual-loop feedback is always much smaller than that from single-loop feedback becauseof the suppression of the side peaks. It also reduces more quickly as the feedback strengthξf increases. The laser remains in P1 oscillation over a larger range of ξf for the dual-loopfeedback as compared with the single-loop feedbacks. Until the complex dynamics emergesat ξf of over 0.04, the dual-loop feedback is useful for reducing the phase variance down toless than 0.001 rad2. Therefore, although it does not completely eliminate all side peaks, thedual-loop feedback always gives a lower phase variance compared to that from the single-loopfeedbacks and widens the range of the total feedback strength for P1 oscillation.
#224479 - $15.00 USD Received 7 Oct 2014; revised 11 Jan 2015; accepted 15 Jan 2015; published 30 Jan 2015 © 2015 OSA 9 Feb 2015 | Vol. 23, No. 3 | DOI:10.1364/OE.23.002777 | OPTICS EXPRESS 2793
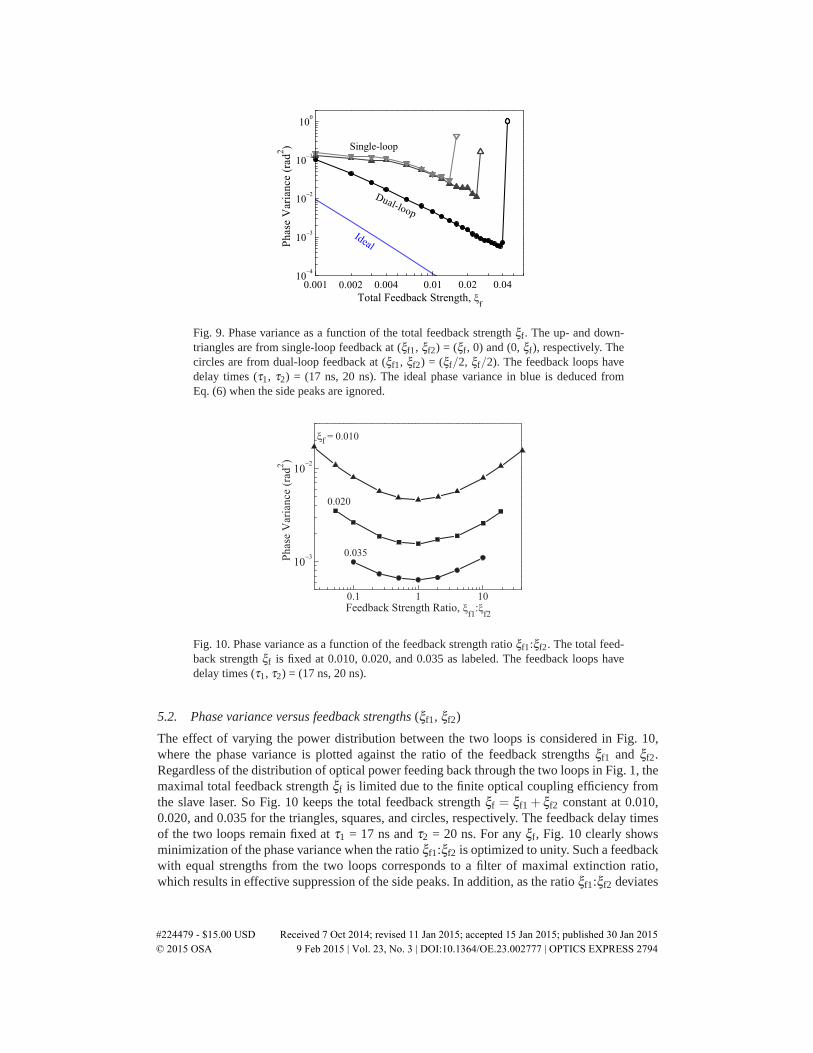
Fig. 9. Phase variance as a function of the total feedback strength ξf. The up- and down-triangles are from single-loop feedback at (ξf1, ξf2) = (ξf, 0) and (0, ξf), respectively. Thecircles are from dual-loop feedback at (ξf1, ξf2) = (ξf/2, ξf/2). The feedback loops havedelay times (τ1, τ2) = (17 ns, 20 ns). The ideal phase variance in blue is deduced fromEq. (6) when the side peaks are ignored.
Fig. 10. Phase variance as a function of the feedback strength ratio ξf1:ξf2. The total feed-back strength ξf is fixed at 0.010, 0.020, and 0.035 as labeled. The feedback loops havedelay times (τ1, τ2) = (17 ns, 20 ns).
5.2. Phase variance versus feedback strengths (ξf1, ξf2)
The effect of varying the power distribution between the two loops is considered in Fig. 10,where the phase variance is plotted against the ratio of the feedback strengths ξf1 and ξf2.Regardless of the distribution of optical power feeding back through the two loops in Fig. 1, themaximal total feedback strength ξf is limited due to the finite optical coupling efficiency fromthe slave laser. So Fig. 10 keeps the total feedback strength ξf = ξf1 + ξf2 constant at 0.010,0.020, and 0.035 for the triangles, squares, and circles, respectively. The feedback delay timesof the two loops remain fixed at τ1 = 17 ns and τ2 = 20 ns. For any ξf, Fig. 10 clearly showsminimization of the phase variance when the ratio ξf1:ξf2 is optimized to unity. Such a feedbackwith equal strengths from the two loops corresponds to a filter of maximal extinction ratio,which results in effective suppression of the side peaks. In addition, as the ratio ξf1:ξf2 deviates
#224479 - $15.00 USD Received 7 Oct 2014; revised 11 Jan 2015; accepted 15 Jan 2015; published 30 Jan 2015 © 2015 OSA 9 Feb 2015 | Vol. 23, No. 3 | DOI:10.1364/OE.23.002777 | OPTICS EXPRESS 2794
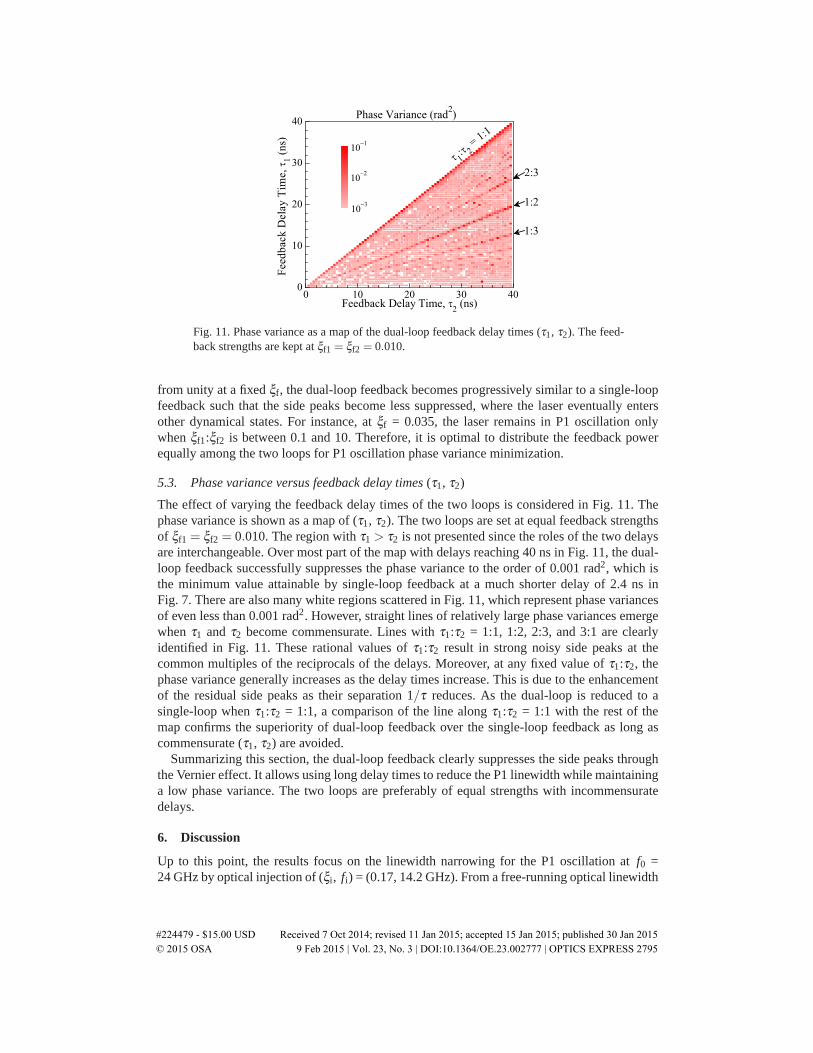
Fig. 11. Phase variance as a map of the dual-loop feedback delay times (τ1, τ2). The feed-back strengths are kept at ξf1 = ξf2 = 0.010.
from unity at a fixed ξf, the dual-loop feedback becomes progressively similar to a single-loopfeedback such that the side peaks become less suppressed, where the laser eventually entersother dynamical states. For instance, at ξf = 0.035, the laser remains in P1 oscillation onlywhen ξf1:ξf2 is between 0.1 and 10. Therefore, it is optimal to distribute the feedback powerequally among the two loops for P1 oscillation phase variance minimization.
5.3. Phase variance versus feedback delay times (τ1, τ2)
The effect of varying the feedback delay times of the two loops is considered in Fig. 11. Thephase variance is shown as a map of (τ1, τ2). The two loops are set at equal feedback strengthsof ξf1 = ξf2 = 0.010. The region with τ1 > τ2 is not presented since the roles of the two delaysare interchangeable. Over most part of the map with delays reaching 40 ns in Fig. 11, the dual-loop feedback successfully suppresses the phase variance to the order of 0.001 rad2, which isthe minimum value attainable by single-loop feedback at a much shorter delay of 2.4 ns inFig. 7. There are also many white regions scattered in Fig. 11, which represent phase variancesof even less than 0.001 rad2. However, straight lines of relatively large phase variances emergewhen τ1 and τ2 become commensurate. Lines with τ1:τ2 = 1:1, 1:2, 2:3, and 3:1 are clearlyidentified in Fig. 11. These rational values of τ1:τ2 result in strong noisy side peaks at thecommon multiples of the reciprocals of the delays. Moreover, at any fixed value of τ1:τ2, thephase variance generally increases as the delay times increase. This is due to the enhancementof the residual side peaks as their separation 1/τ reduces. As the dual-loop is reduced to asingle-loop when τ1:τ2 = 1:1, a comparison of the line along τ1:τ2 = 1:1 with the rest of themap confirms the superiority of dual-loop feedback over the single-loop feedback as long ascommensurate (τ1, τ2) are avoided.
Summarizing this section, the dual-loop feedback clearly suppresses the side peaks throughthe Vernier effect. It allows using long delay times to reduce the P1 linewidth while maintaininga low phase variance. The two loops are preferably of equal strengths with incommensuratedelays.
6. Discussion
Up to this point, the results focus on the linewidth narrowing for the P1 oscillation at f0 =24 GHz by optical injection of (ξi, fi) = (0.17, 14.2 GHz). From a free-running optical linewidth
#224479 - $15.00 USD Received 7 Oct 2014; revised 11 Jan 2015; accepted 15 Jan 2015; published 30 Jan 2015 © 2015 OSA 9 Feb 2015 | Vol. 23, No. 3 | DOI:10.1364/OE.23.002777 | OPTICS EXPRESS 2795
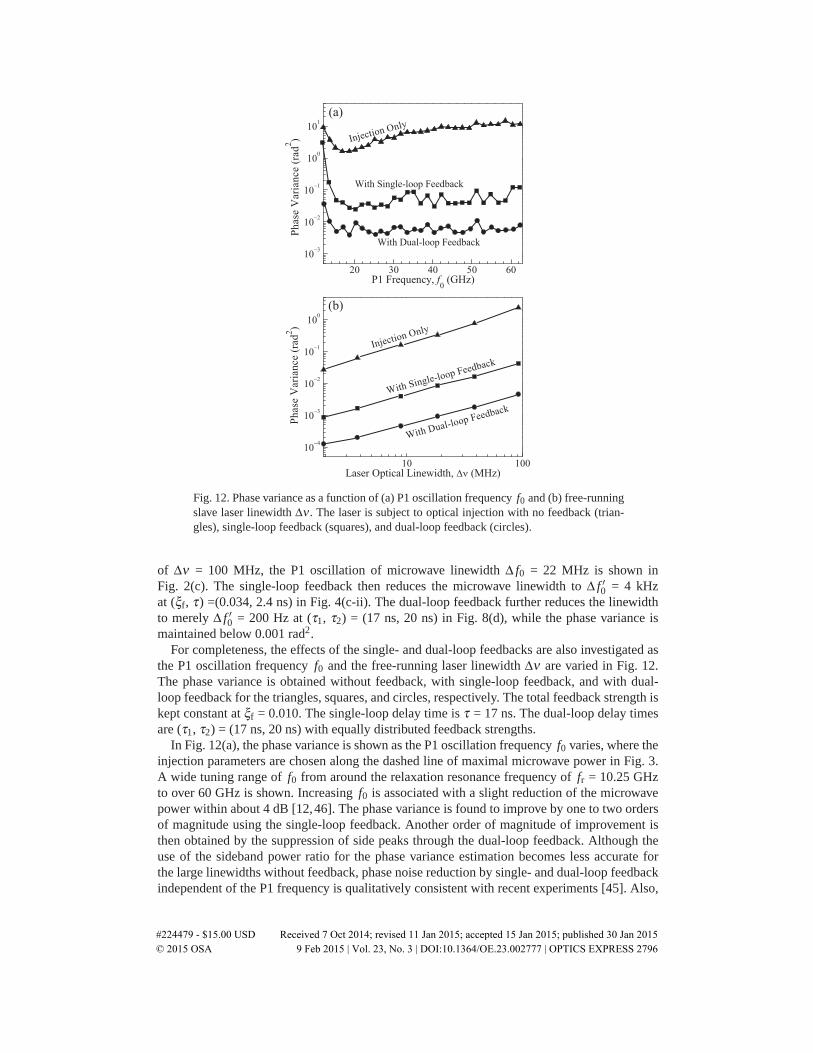
Fig. 12. Phase variance as a function of (a) P1 oscillation frequency f0 and (b) free-runningslave laser linewidth Δν . The laser is subject to optical injection with no feedback (trian-gles), single-loop feedback (squares), and dual-loop feedback (circles).
of Δν = 100 MHz, the P1 oscillation of microwave linewidth Δ f0 = 22 MHz is shown inFig. 2(c). The single-loop feedback then reduces the microwave linewidth to Δ f ′0 = 4 kHzat (ξf, τ) =(0.034, 2.4 ns) in Fig. 4(c-ii). The dual-loop feedback further reduces the linewidthto merely Δ f ′0 = 200 Hz at (τ1, τ2) = (17 ns, 20 ns) in Fig. 8(d), while the phase variance ismaintained below 0.001 rad2.
For completeness, the effects of the single- and dual-loop feedbacks are also investigated asthe P1 oscillation frequency f0 and the free-running laser linewidth Δν are varied in Fig. 12.The phase variance is obtained without feedback, with single-loop feedback, and with dual-loop feedback for the triangles, squares, and circles, respectively. The total feedback strength iskept constant at ξf = 0.010. The single-loop delay time is τ = 17 ns. The dual-loop delay timesare (τ1, τ2) = (17 ns, 20 ns) with equally distributed feedback strengths.
In Fig. 12(a), the phase variance is shown as the P1 oscillation frequency f0 varies, where theinjection parameters are chosen along the dashed line of maximal microwave power in Fig. 3.A wide tuning range of f0 from around the relaxation resonance frequency of fr = 10.25 GHzto over 60 GHz is shown. Increasing f0 is associated with a slight reduction of the microwavepower within about 4 dB [12,46]. The phase variance is found to improve by one to two ordersof magnitude using the single-loop feedback. Another order of magnitude of improvement isthen obtained by the suppression of side peaks through the dual-loop feedback. Although theuse of the sideband power ratio for the phase variance estimation becomes less accurate forthe large linewidths without feedback, phase noise reduction by single- and dual-loop feedbackindependent of the P1 frequency is qualitatively consistent with recent experiments [45]. Also,
#224479 - $15.00 USD Received 7 Oct 2014; revised 11 Jan 2015; accepted 15 Jan 2015; published 30 Jan 2015 © 2015 OSA 9 Feb 2015 | Vol. 23, No. 3 | DOI:10.1364/OE.23.002777 | OPTICS EXPRESS 2796
regardless of whether any feedback is applied, Fig. 12(a) shows a sharp increase of the phasevariance as f0 reduces in approaching fr. This is due to the proximity to the emergence ofchaotic or other nonlinear dynamics. In Fig. 12(b), the impact of the free-running linewidth Δνof the slave laser is illustrated. Without any feedback, the P1 phase variance is found as directlyproportional to Δν , where the phase variance reduction by the single- and dual-loop feedbacksare independent of Δν . Hence, the phase noise improvement by optical feedback is generallyapplicable over wide ranges of P1 frequency as well as laser linewidth.
7. Conclusion
In conclusion, the nonlinear dynamical P1 oscillation of a semiconductor laser subject to bothoptical injection and feedback is systematically investigated by simulation with the Langevinnoise. With optical injection alone, the P1 oscillation frequency f0 is widely tunable beyondthe relaxation resonance frequency fr, where the microwave linewidth Δ f0 varies with the in-jection parameters. By the P1 nonlinear dynamics, the microwave linewidth Δ f0 can even besmaller than the free-running optical linewidth Δν . By adding a single-loop optical feedback,the reduced microwave linewidth Δ f ′0 is found as asymptotically proportional to ξ−2
f τ−2. Bymodifying to a dual-loop feedback, the Vernier effect of incommensurate delay times effectivelysuppresses the side peaks in the power spectrum, which enables P1 linewidth narrowing at longdelay times while maintaining a low phase noise variance. The results support analytical andexperimental investigations on the all-optical narrow-linewidth tunable photonic microwavegeneration by the laser nonlinear dynamics.
Acknowledgments
The authors thank Dr. Marc Sorel for valuable discussions. This work was supported in part bya grant from the Research Grant Council of Hong Kong under Project CityU 110712, a grantfrom the City University of Hong Kong under Project 7002726, and a grant from the RoyalSociety U.K. under Project IE120157.
#224479 - $15.00 USD Received 7 Oct 2014; revised 11 Jan 2015; accepted 15 Jan 2015; published 30 Jan 2015 © 2015 OSA 9 Feb 2015 | Vol. 23, No. 3 | DOI:10.1364/OE.23.002777 | OPTICS EXPRESS 2797


![Microwave Ghost Imaging via LTE-DL Signals · conventional microwave imaging methods, it possesses some unique features such as nonlocal reconstruction [6], non-scanning [7], super-resolution](https://img.pdfslide.net/doc/110x75/5fe80cf896e43d4db24be7ca/microwave-ghost-imaging-via-lte-dl-signals-conventional-microwave-imaging-methods.jpg)
![ALL-OPTICAL MICROWAVE SIGNAL PROCESSING€¦ · Microwave photonics is an interdisciplinary field that investigates the interaction between microwave and optical signals [1]-[3] for](https://img.pdfslide.net/doc/110x75/60833e506ba8f8072e7ce524/all-optical-microwave-signal-processing-microwave-photonics-is-an-interdisciplinary.jpg)