Embed Size (px)
Citation preview
Nov. 25, 2008
Phase Transformation of Materials
Nong-Moon Hwang
4.3 Alloy solidification
4.3.2 Eutectic solidification
4.3.1 Solidification of single-phase alloys
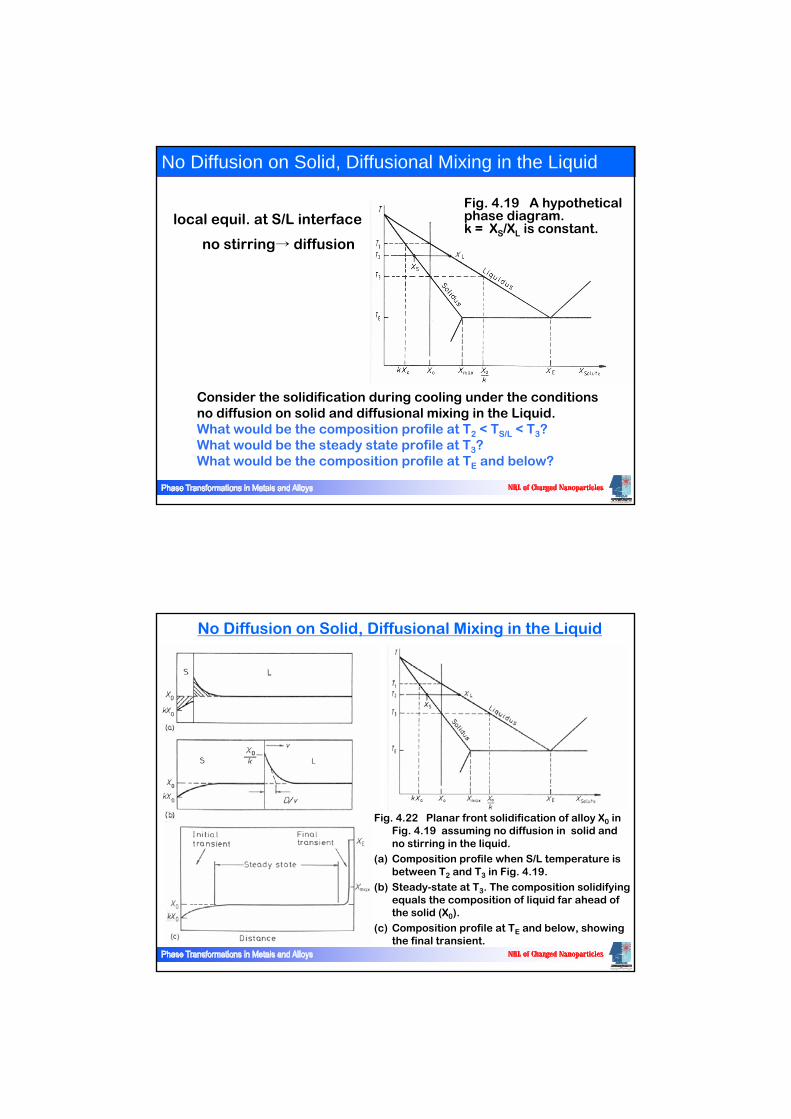
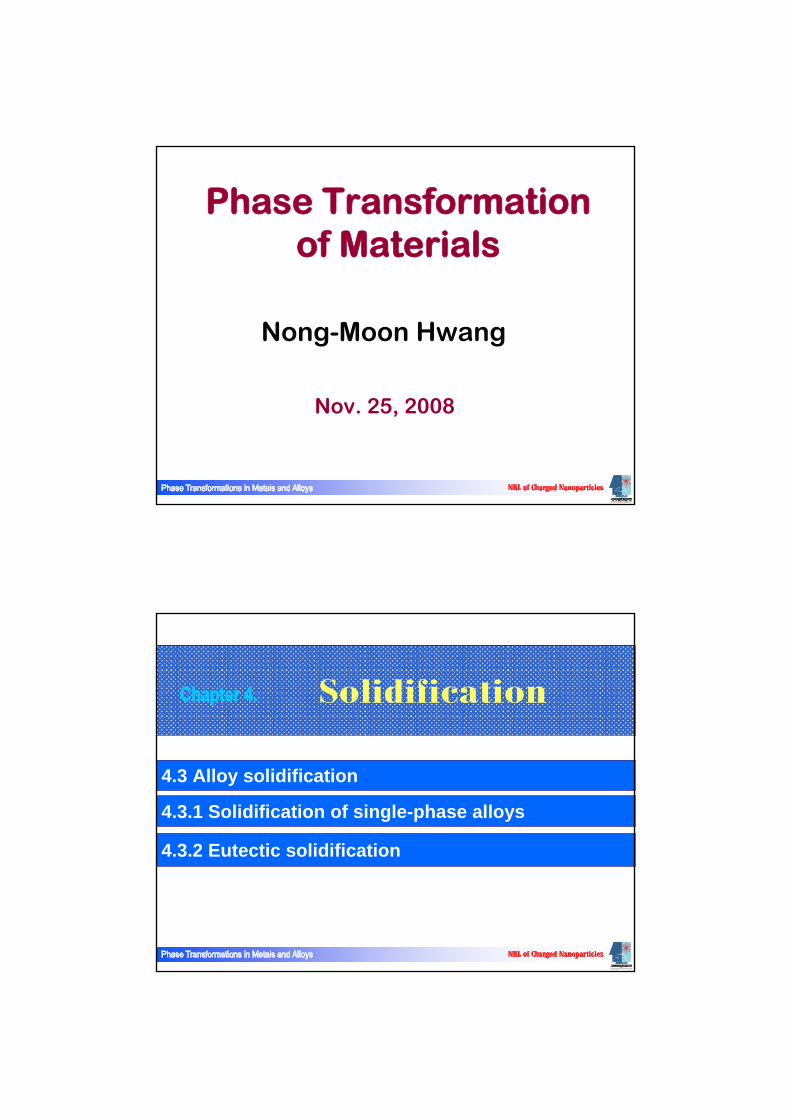
Fig. 4.19 A hypothetical phase diagram. k = XS/XL is constant.
No Diffusion on Solid, Diffusional Mixing in the Liquid
Consider the solidification during cooling under the conditionsno diffusion on solid and diffusional mixing in the Liquid.What would be the composition profile at T2 < TS/L < T3?What would be the steady state profile at T3?What would be the composition profile at TE and below?
local equil. at S/L interface
no stirring→ diffusion
Fig. 4.22 Planar front solidification of alloy X0 in Fig. 4.19 assuming no diffusion in solid and no stirring in the liquid.
(a) Composition profile when S/L temperature is between T2 and T3 in Fig. 4.19.
(b) Steady-state at T3. The composition solidifying equals the composition of liquid far ahead of the solid (X0).
(c) Composition profile at TE and below, showing the final transient.
No Diffusion on Solid, Diffusional Mixing in the Liquid
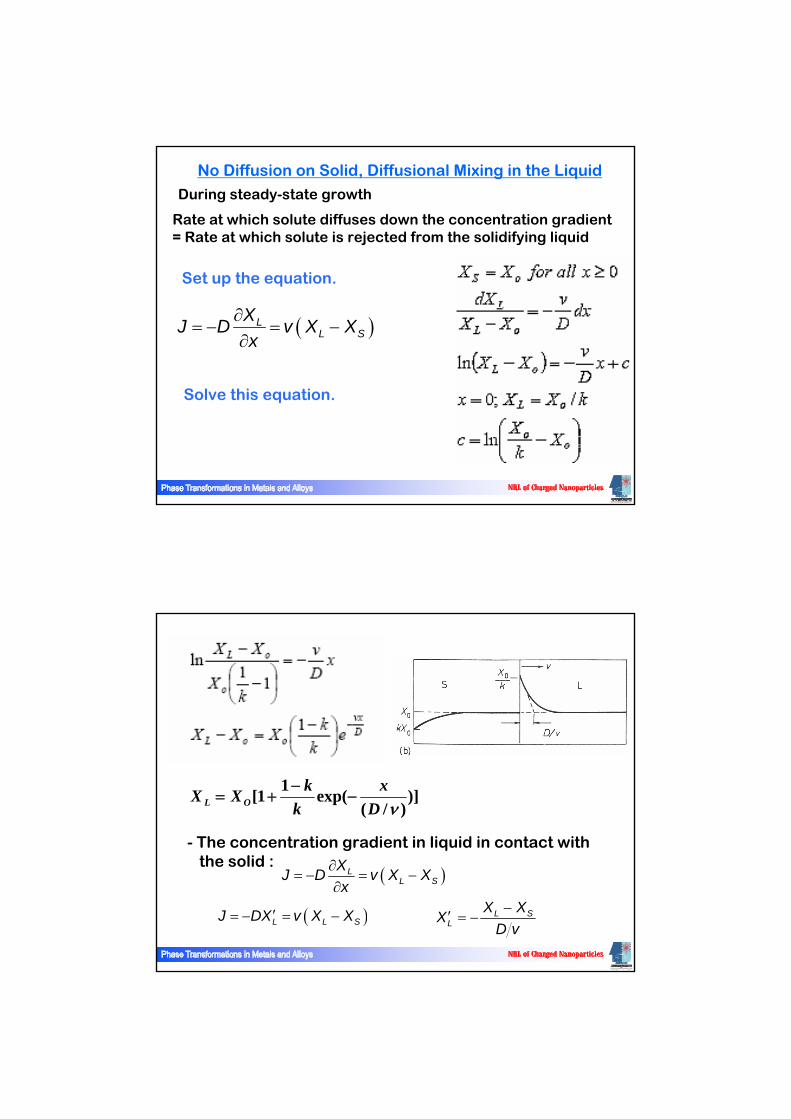
No Diffusion on Solid, Diffusional Mixing in the Liquid
During steady-state growth
Rate at which solute diffuses down the concentration gradient= Rate at which solute is rejected from the solidifying liquid
( )LL S
XJ D v X Xx
∂= − = −
∂
Solve this equation.
Set up the equation.
- The concentration gradient in liquid in contact with the solid :
)])/(
exp(11[νD
xk
kXX OL −−
+=
( )L L SJ DX v X X′= − = − L SL
X XXD v−′ = −
( )LL S
XJ D v X Xx
∂= − = −
∂
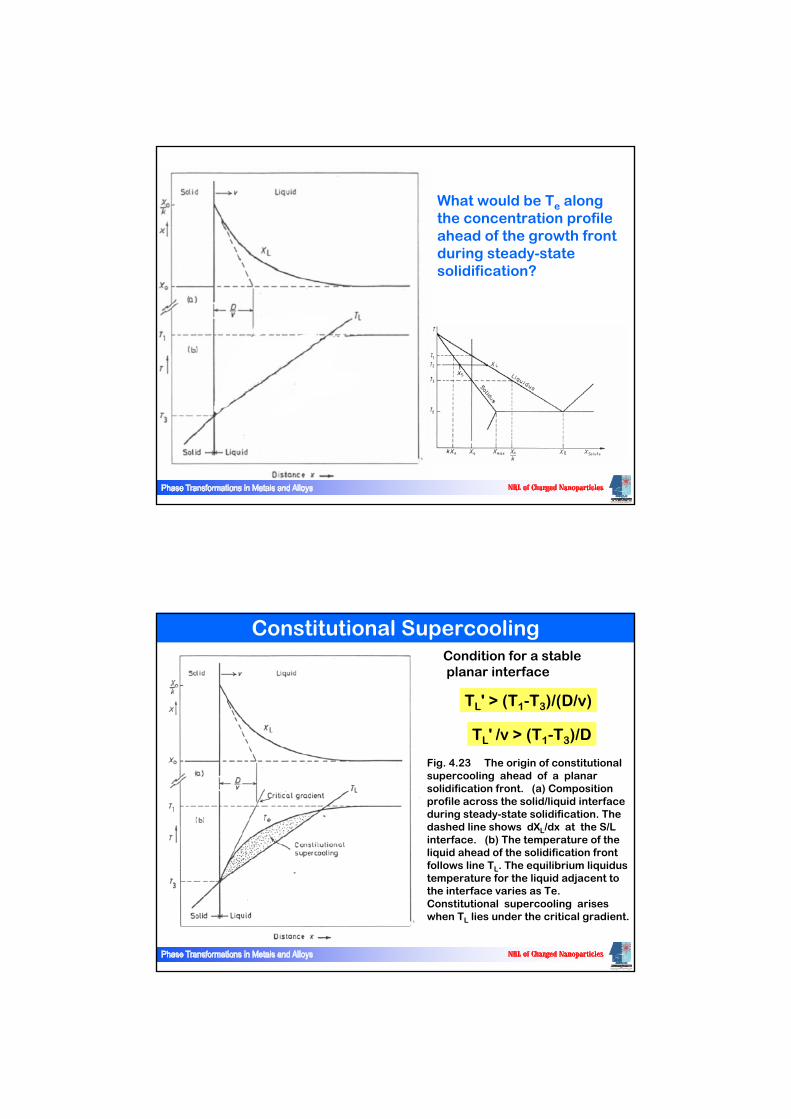
What would be Te alongthe concentration profileahead of the growth frontduring steady-statesolidification?
Fig. 4.23 The origin of constitutional supercooling ahead of a planar solidification front. (a) Composition profile across the solid/liquid interface during steady-state solidification. The dashed line shows dXL/dx at the S/L interface. (b) The temperature of the liquid ahead of the solidification front follows line TL. The equilibrium liquidustemperature for the liquid adjacent to the interface varies as Te. Constitutional supercooling arises when TL lies under the critical gradient.
Constitutional Supercooling
TL' /v > (T1-T3)/D
TL' > (T1-T3)/(D/v)
Condition for a stableplanar interface
Cellular and Dendritic Solidification
• Constitutional supercooling :
At the interface, TL = Te (not TE) = T3.
• Criterion for the planar interface :
TL’/v>(T1-T3)/D : the protrusion melts back.T1-T3 : Equilibrium freezing range of alloy
Large range promotes protrusions.
• Dendrites
Development of secondary arms and tertiary arms: <100>
Solute effect : low k enlarges T1-T3Promotes dendrites.
Cooling rate effect : Fast cooling makes lateral diffusion of the rejected solutes difficultand promotes cell formationof smaller cell spacing.
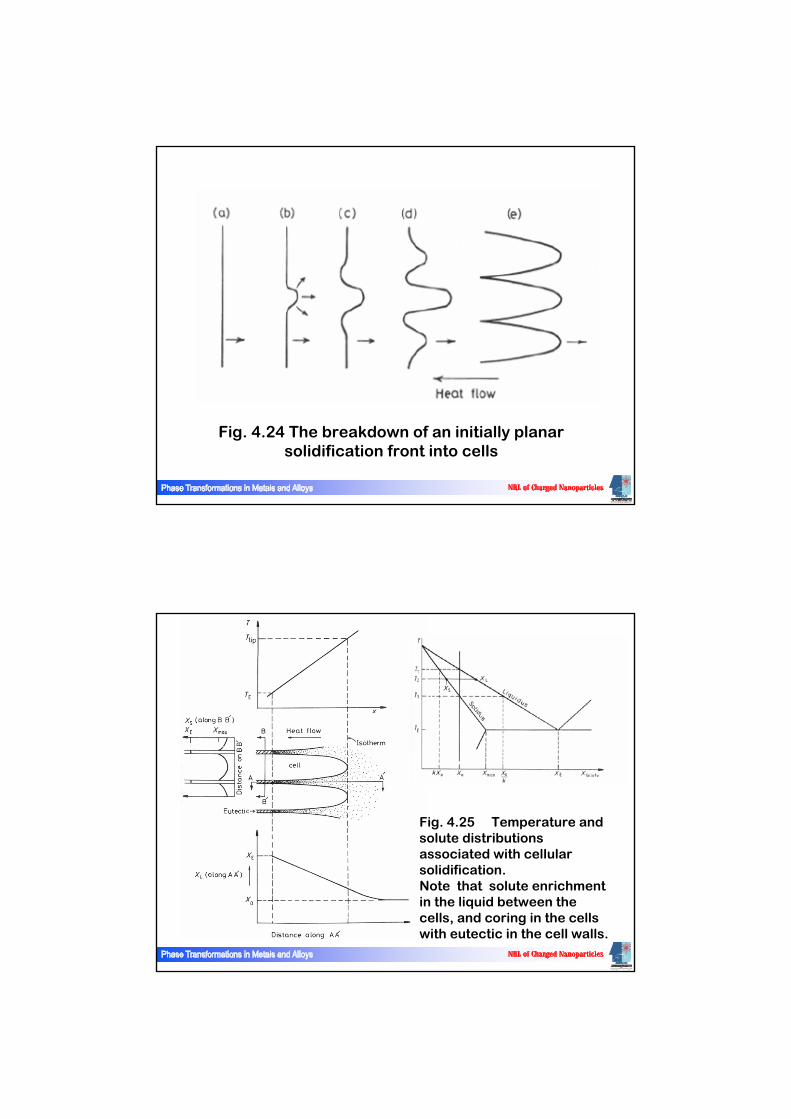
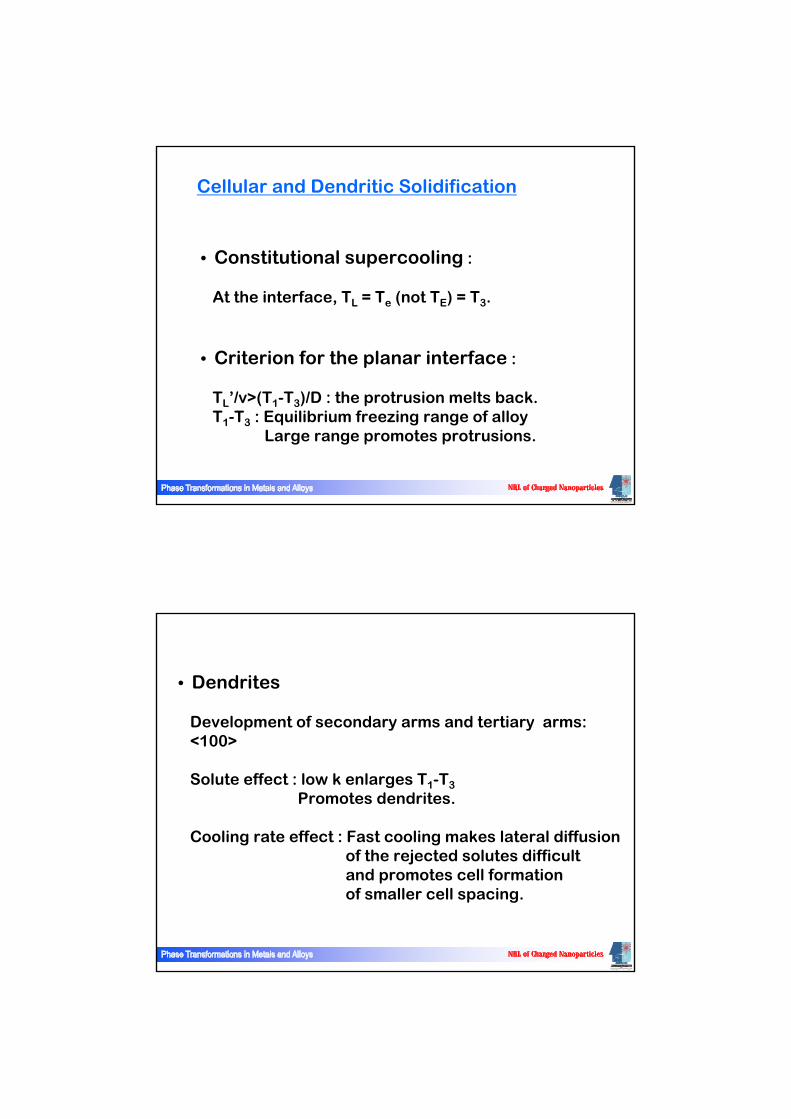
Fig. 4.24 The breakdown of an initially planar solidification front into cells
Fig. 4.25 Temperature and solute distributions associated with cellular solidification. Note that solute enrichment in the liquid between the cells, and coring in the cells with eutectic in the cell walls.
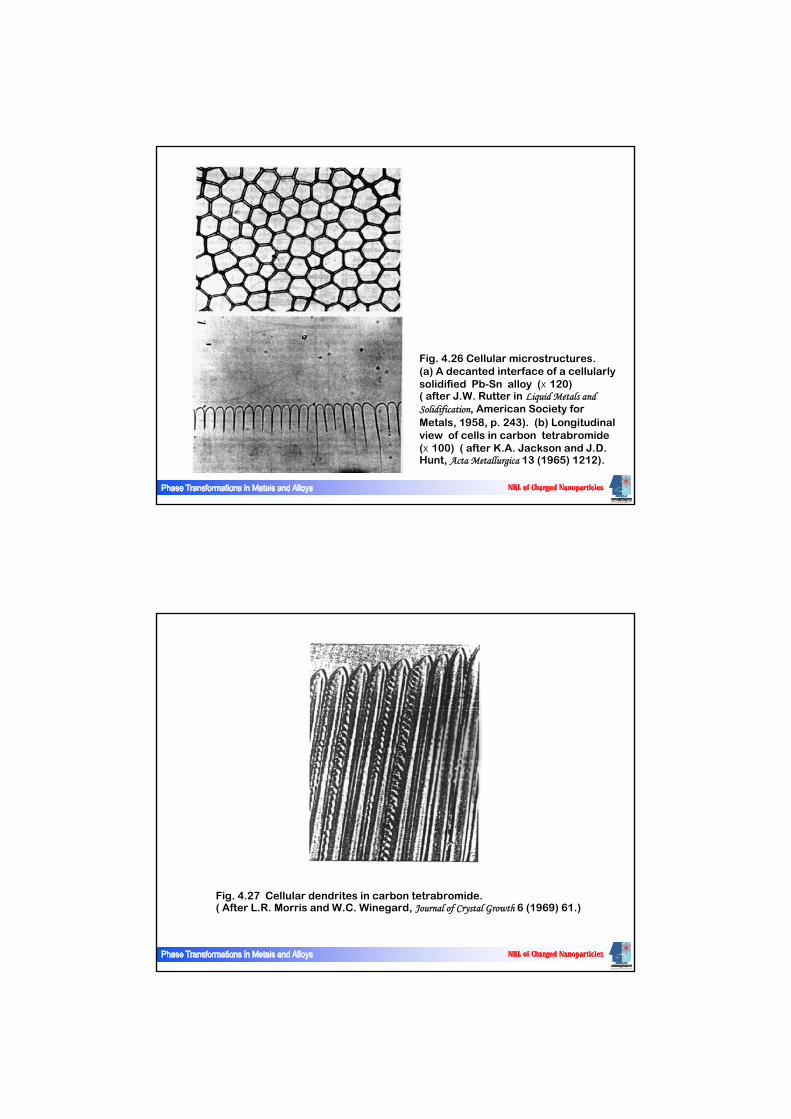
Fig. 4.26 Cellular microstructures. (a) A decanted interface of a cellularlysolidified Pb-Sn alloy (x 120) ( after J.W. Rutter in Liquid Metals and Solidification, American Society for Metals, 1958, p. 243). (b) Longitudinal view of cells in carbon tetrabromide(x 100) ( after K.A. Jackson and J.D. Hunt, Acta Metallurgica 13 (1965) 1212).
Fig. 4.27 Cellular dendrites in carbon tetrabromide. ( After L.R. Morris and W.C. Winegard, Journal of Crystal Growth 6 (1969) 61.)
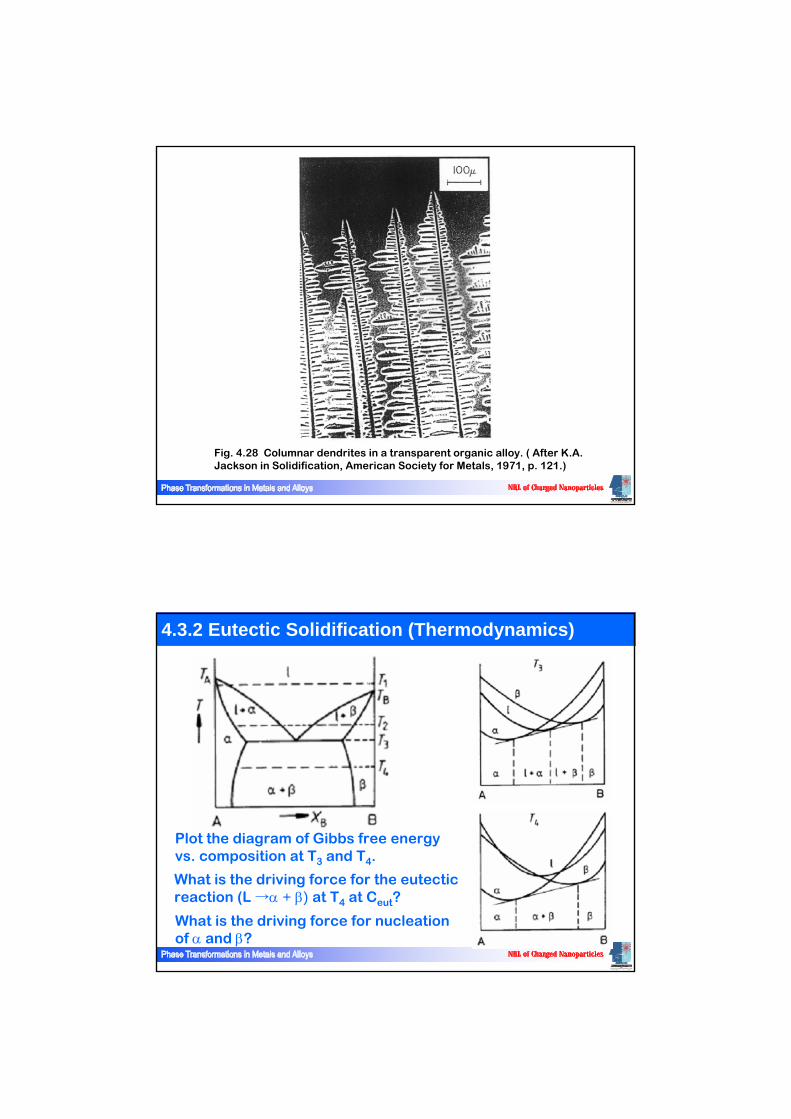
Fig. 4.28 Columnar dendrites in a transparent organic alloy. ( After K.A. Jackson in Solidification, American Society for Metals, 1971, p. 121.)
4.3.2 Eutectic Solidification (Thermodynamics)
Plot the diagram of Gibbs free energy vs. composition at T3 and T4.
What is the driving force for nucleationof α and β?
What is the driving force for the eutecticreaction (L →α + β) at T4 at Ceut?
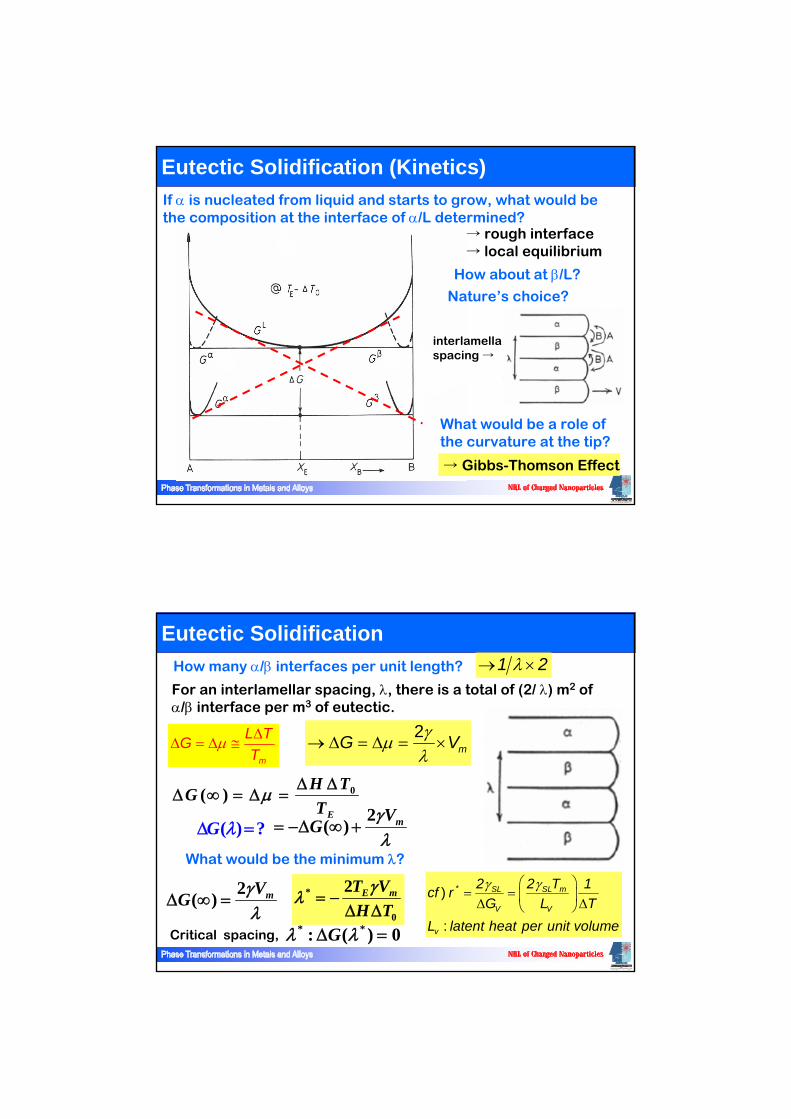
Eutectic Solidification (Kinetics)
interlamellarspacing →
If α is nucleated from liquid and starts to grow, what would bethe composition at the interface of α/L determined?
→ rough interface→ local equilibrium
How about at β/L?
Nature’s choice?
What would be a role ofthe curvature at the tip?
→ Gibbs-Thomson Effect
Eutectic Solidification
2( ) mVG γλ
= −Δ ∞ +
0( )E
H TGT
μ Δ ΔΔ ∞ = Δ =
Critical spacing, * *: ( ) 0Gλ λΔ =
*
0
2 E mT VH Tγ
λ = −Δ Δ
What would be the minimum λ?
For an interlamellar spacing, λ, there is a total of (2/ λ) m2 ofα/β interface per m3 of eutectic.
( ) ?G λΔ =
How many α/β interfaces per unit length? 21 ×→ λ
2mG Vγμ
λ→ Δ = Δ = ×
2( ) mVG γλ
Δ ∞ =*)
:
SL SL m
V V
v
2 2 T 1cf rG L T
L latent heat per unit volume
γ γ⎛ ⎞= = ⎜ ⎟Δ Δ⎝ ⎠
m
L TGT
μ ΔΔ = Δ ≅
*
0
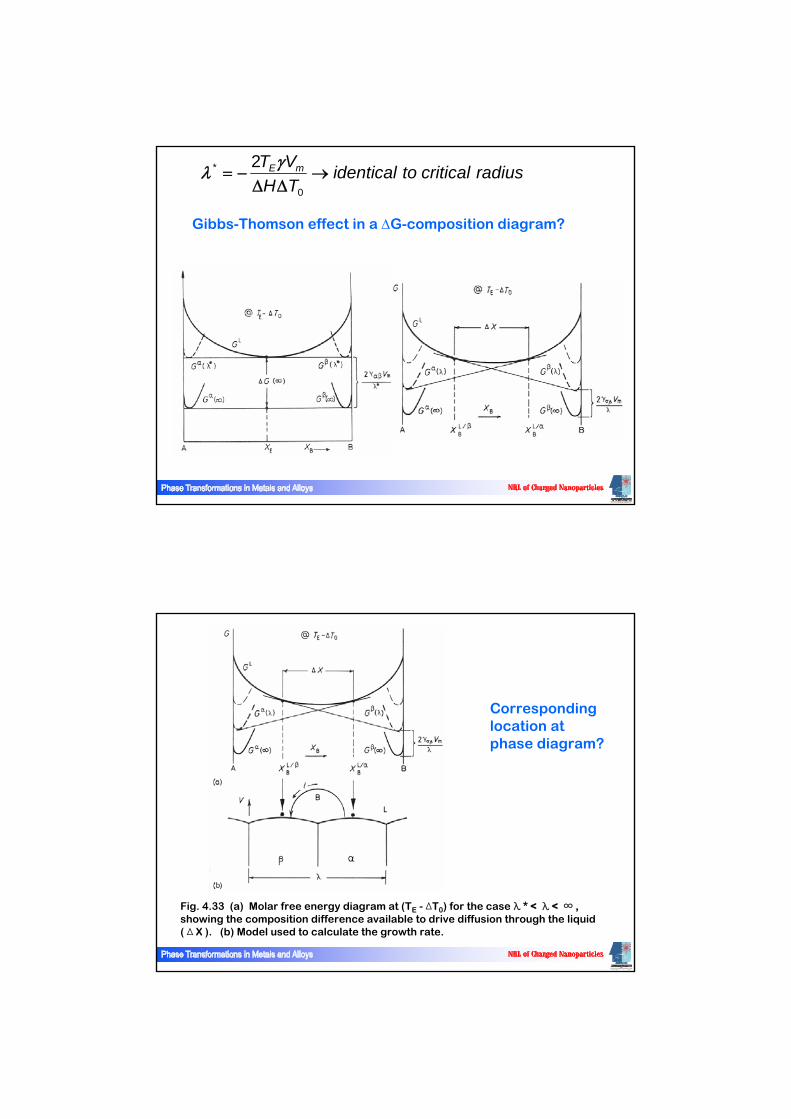
2 E mT V identical to critical radiusH Tγλ = − →
Δ Δ
Gibbs-Thomson effect in a ΔG-composition diagram?
Fig. 4.33 (a) Molar free energy diagram at (TE - ∆T0) for the case λ * < λ < ∞ , showing the composition difference available to drive diffusion through the liquid ( ∆ X ). (b) Model used to calculate the growth rate.
Correspondinglocation atphase diagram?
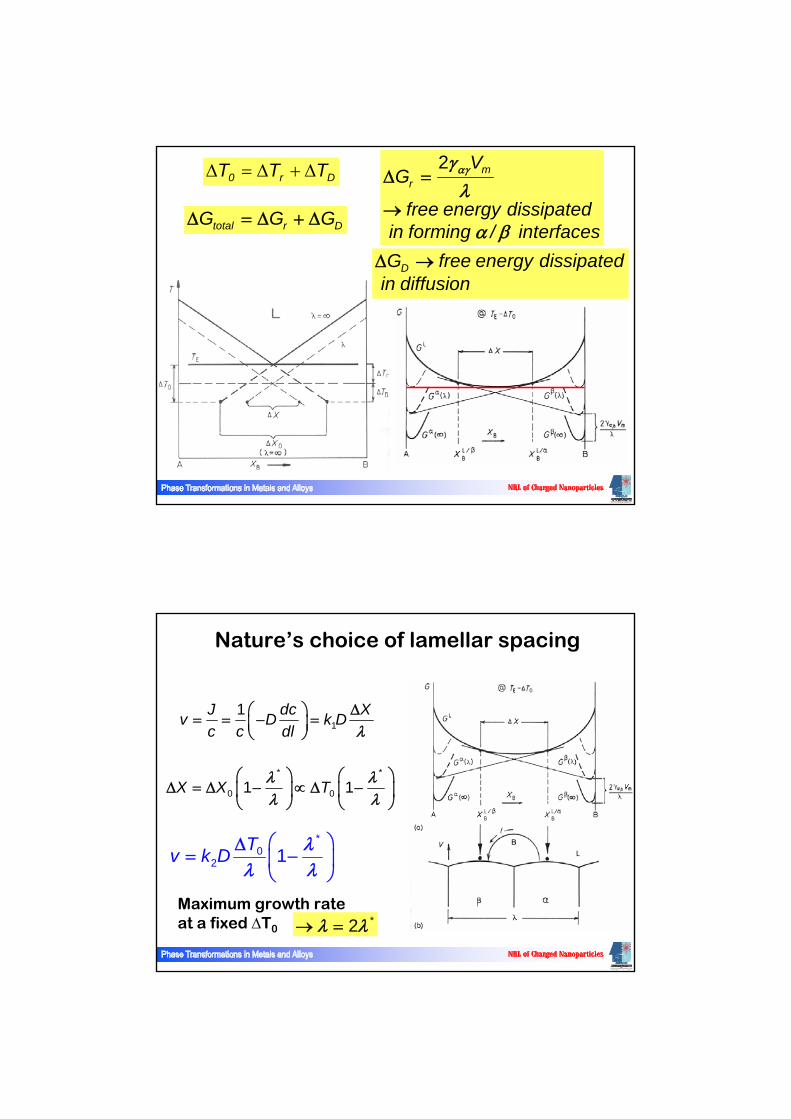
Dr0 TTT Δ+Δ=Δ
total r DG G GΔ = Δ + Δ
2 mr
VG
free energy dissipatedin forming / interfaces
αγγλ
α β
Δ =
→
DG free energy dissipatedin diffusionΔ →
11J dc Xv D k D
c c dl λΔ⎛ ⎞= = − =⎜ ⎟
⎝ ⎠
* *
0 01 1X X Tλ λλ λ
⎛ ⎞ ⎛ ⎞Δ = Δ − ∝ Δ −⎜ ⎟ ⎜ ⎟
⎝ ⎠ ⎝ ⎠
*0
2 1Tv k D λλ λ
⎛ ⎞Δ= −⎜ ⎟
⎝ ⎠
*2λ λ→ =Maximum growth rate at a fixed ΔT0
Nature’s choice of lamellar spacing
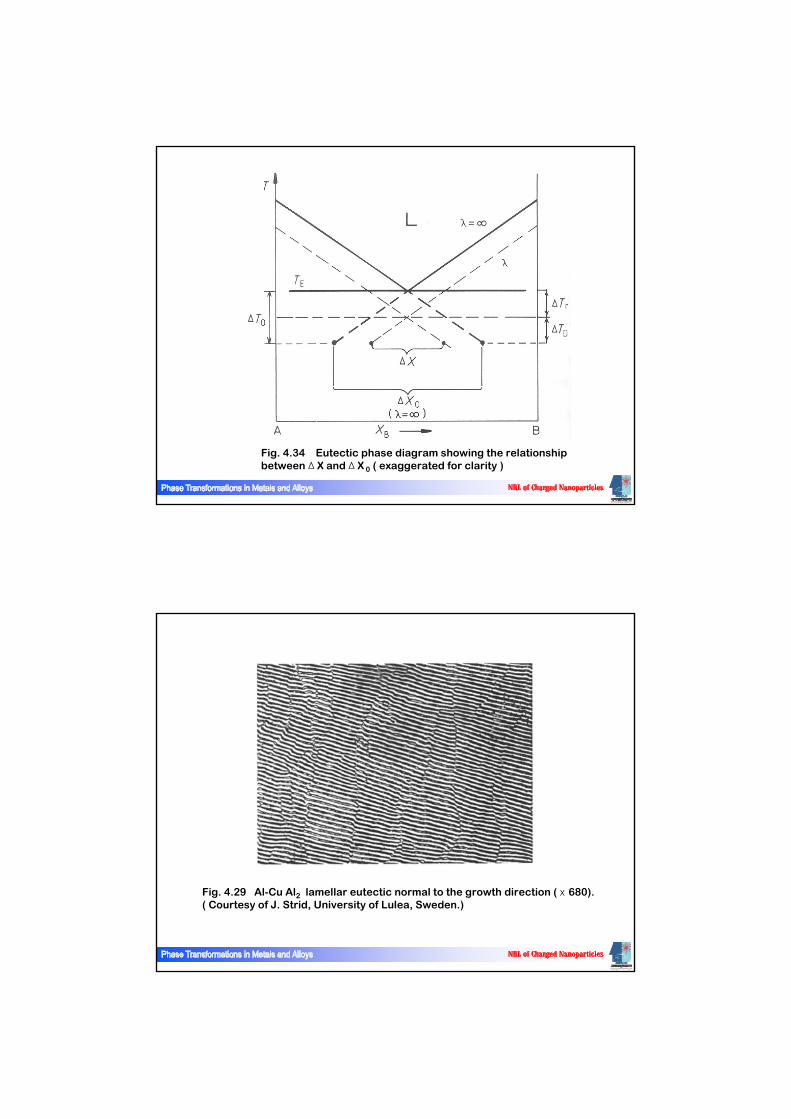
Fig. 4.34 Eutectic phase diagram showing the relationship between ∆ X and ∆ X 0 ( exaggerated for clarity )
Fig. 4.29 Al-Cu Al2 lamellar eutectic normal to the growth direction ( x 680). ( Courtesy of J. Strid, University of Lulea, Sweden.)
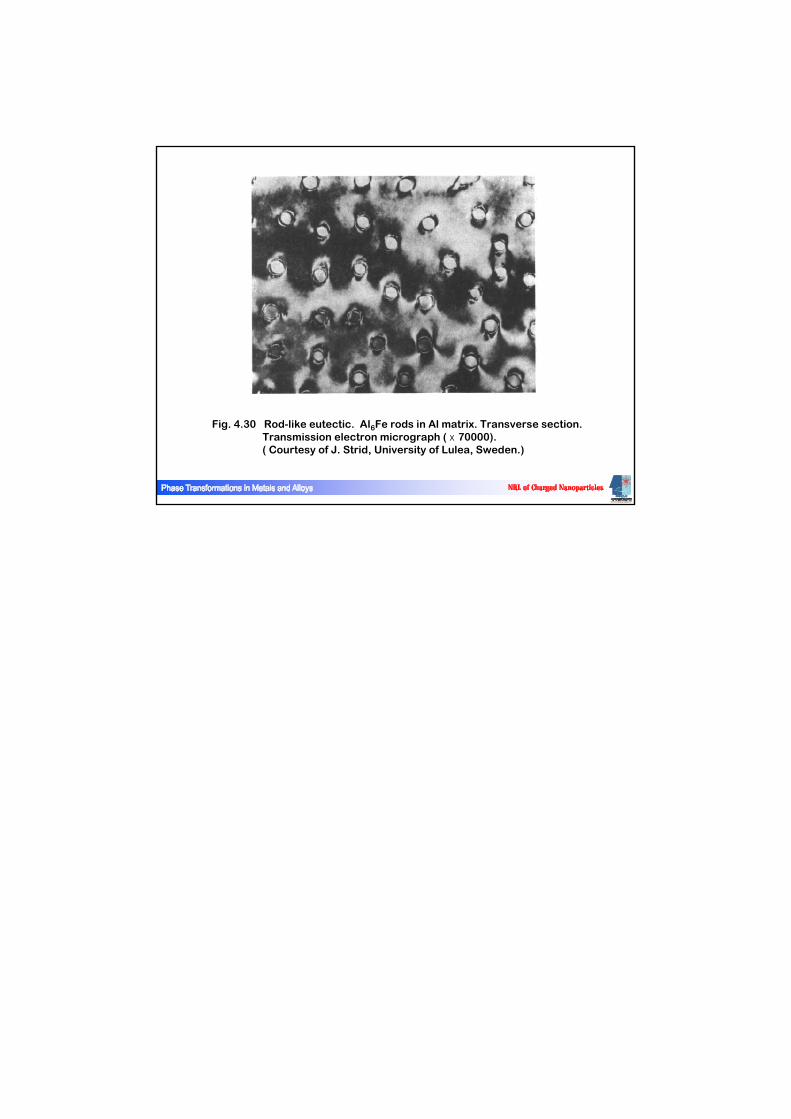
Fig. 4.30 Rod-like eutectic. Al6Fe rods in Al matrix. Transverse section. Transmission electron micrograph ( x 70000). ( Courtesy of J. Strid, University of Lulea, Sweden.)