Embed Size (px)
Citation preview
Phased-array measurements of full-scale high-amplitude jet noise
Blaine M. Harker, Kent L. Gee, Tracianne B. Neilsen, Alan T. Wall, Michael M. James
Beamforming in aeroacoustics applications have undergone significant advances over the past decade, although successful source reconstructions depend on array geometry and the assumed source model. The application of phased-array algorithms to ground array measurements of a full-scale tactical jet engine yield equivalent source reconstructions for military and afterburner engine conditions. A deconvolution approach for the mapping of acoustic sources (DAMAS) is utilized to remove array effects seen in conventional beamforming and allows for improved interpretation of results.
I. Introduction et and rocket noise reduction efforts require an improved understanding of the noise source
characteristics, which have been an active and perplexing topic of research for over six decades. While significant progress has been made towards increased understanding, a complete model describing source and field behavior does not exist. This has application to aerospace research, where next generation fighter jets demand improved power and performance and result in increased radiated sound fields. The current sound exposure levels to military1 and aircraft personnel as well as community noise near airports fuels a need to better understand and mitigate the high sound levels.
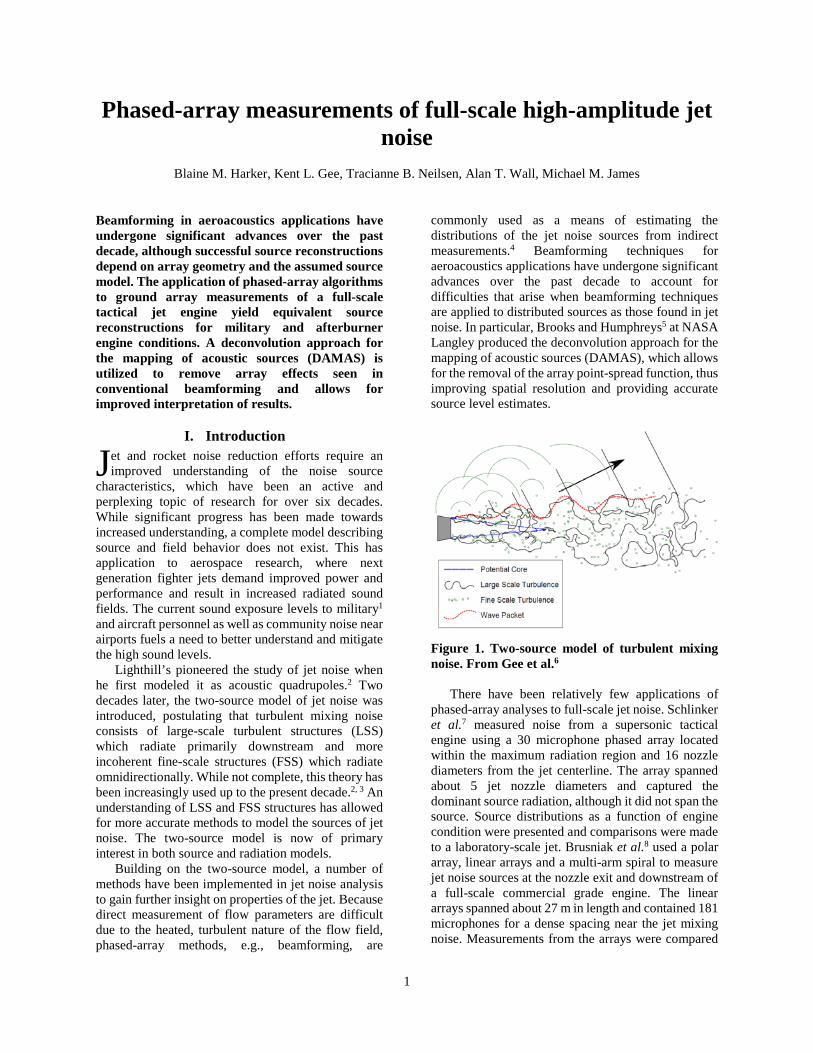
Lighthill’s pioneered the study of jet noise when he first modeled it as acoustic quadrupoles.2 Two decades later, the two-source model of jet noise was introduced, postulating that turbulent mixing noise consists of large-scale turbulent structures (LSS) which radiate primarily downstream and more incoherent fine-scale structures (FSS) which radiate omnidirectionally. While not complete, this theory has been increasingly used up to the present decade.2, 3 An understanding of LSS and FSS structures has allowed for more accurate methods to model the sources of jet noise. The two-source model is now of primary interest in both source and radiation models.
Building on the two-source model, a number of methods have been implemented in jet noise analysis to gain further insight on properties of the jet. Because direct measurement of flow parameters are difficult due to the heated, turbulent nature of the flow field, phased-array methods, e.g., beamforming, are
commonly used as a means of estimating the distributions of the jet noise sources from indirect measurements.4 Beamforming techniques for aeroacoustics applications have undergone significant advances over the past decade to account for difficulties that arise when beamforming techniques are applied to distributed sources as those found in jet noise. In particular, Brooks and Humphreys5 at NASA Langley produced the deconvolution approach for the mapping of acoustic sources (DAMAS), which allows for the removal of the array point-spread function, thus improving spatial resolution and providing accurate source level estimates.
Figure 1. Two-source model of turbulent mixing noise. From Gee et al.6
There have been relatively few applications of phased-array analyses to full-scale jet noise. Schlinker et al.7 measured noise from a supersonic tactical engine using a 30 microphone phased array located within the maximum radiation region and 16 nozzle diameters from the jet centerline. The array spanned about 5 jet nozzle diameters and captured the dominant source radiation, although it did not span the source. Source distributions as a function of engine condition were presented and comparisons were made to a laboratory-scale jet. Brusniak et al.8 used a polar array, linear arrays and a multi-arm spiral to measure jet noise sources at the nozzle exit and downstream of a full-scale commercial grade engine. The linear arrays spanned about 27 m in length and contained 181 microphones for a dense spacing near the jet mixing noise. Measurements from the arrays were compared
J
1
for consistency and conventional beamforming applied to the jet centerline. However, neither of these analyses applied a deconvolution to the beamforming results for potentially improved resolution. Dougherty and Mendoza9 used a 100 foot radius polar arc array in measurements of a Honeywell Tech977 engine and applied DAMAS and CLEAN-SC to engine and jet noise beamforming results to show a higher resolution image using both methods and a reduction in sidelobes using CLEAN-SC. Padois et al.10 tested a hybrid beamforming method and briefly compared this with DAMAS and CLEAN-SC on a full-scale aero-engine. When DAMAS was applied in addition to this hybrid method, the convergence rates were much faster so as to require significantly fewer iterations, thus making DAMAS and its derivatives much more feasible computationally.
The focus of this paper is the preliminary implementation of DAMAS to the noise measured on a line array of ground-based microphones in the vicinity of an F-22A Raptor. In the present analysis, DAMAS is applied to remove array effects introduced from array geometry and provide a more accurate and higher resolution linear reconstruction estimate. Preliminary results suggest that localization techniques need to include the partially correlated, extended nature of the jet noise sources to yield physically reasonable estimates of the source distribution.
II. Methods Before applying phased-array methods to the noise
measured near the F-22, a discussion of the methods is presented. A brief introduction to conventional beamforming is given, and the DAMAS algorithm summarized. The array effects, which convolute conventional beamforming models of the source region, are mitigated by means of the DAMAS algorithm while maintaining the incoherent monopole assumption. The application of both conventional beamforming and DAMAS to simulated fields illustrates the consequences of the assumption of uncorrelated sources that underlies many beamforming methods and provides perspective for evaluating the F-22 results.
A. Conventional Beamforming An overview of the conventional beamforming method is provided to facilitate the interpretation of the results. For a more detailed account, refer to Ref. [5] and Ref. [11]. Measurements of an acoustic field are taken using an array of 𝑀𝑀 microphones (see Figure 2), which need not be uniformly spaced. The auto-spectra and cross-spectra of the measurements are
used to create the cross-spectral matrix (CSM), given by
CSM = �𝐺𝐺11 ⋯ 𝐺𝐺1𝑀𝑀⋮ ⋱ ⋮
𝐺𝐺𝑀𝑀1 ⋯ 𝐺𝐺𝑀𝑀𝑀𝑀�, (1)
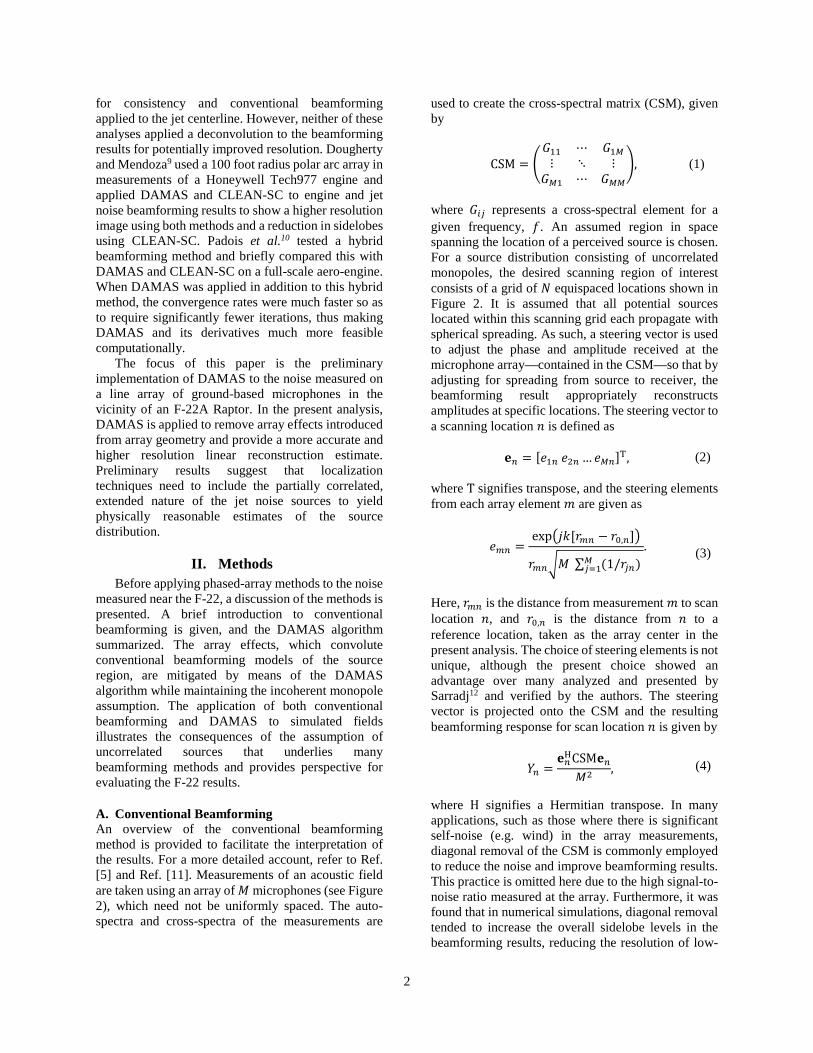
where 𝐺𝐺𝑖𝑖𝑖𝑖 represents a cross-spectral element for a given frequency, 𝑓𝑓. An assumed region in space spanning the location of a perceived source is chosen. For a source distribution consisting of uncorrelated monopoles, the desired scanning region of interest consists of a grid of 𝑁𝑁 equispaced locations shown in Figure 2. It is assumed that all potential sources located within this scanning grid each propagate with spherical spreading. As such, a steering vector is used to adjust the phase and amplitude received at the microphone array—contained in the CSM—so that by adjusting for spreading from source to receiver, the beamforming result appropriately reconstructs amplitudes at specific locations. The steering vector to a scanning location 𝑛𝑛 is defined as
𝐞𝐞𝑛𝑛 = [𝑒𝑒1𝑛𝑛 𝑒𝑒2𝑛𝑛 … 𝑒𝑒𝑀𝑀𝑛𝑛]T, (2) where T signifies transpose, and the steering elements from each array element 𝑚𝑚 are given as
𝑒𝑒𝑚𝑚𝑛𝑛 =exp�𝑗𝑗𝑗𝑗[𝑟𝑟𝑚𝑚𝑛𝑛 − 𝑟𝑟0,𝑛𝑛]�
𝑟𝑟𝑚𝑚𝑛𝑛�𝑀𝑀 ∑ (1/𝑟𝑟𝑖𝑖𝑛𝑛) 𝑀𝑀𝑖𝑖=1
. (3)
Here, 𝑟𝑟𝑚𝑚𝑛𝑛 is the distance from measurement 𝑚𝑚 to scan location 𝑛𝑛, and 𝑟𝑟0,𝑛𝑛 is the distance from 𝑛𝑛 to a reference location, taken as the array center in the present analysis. The choice of steering elements is not unique, although the present choice showed an advantage over many analyzed and presented by Sarradj12 and verified by the authors. The steering vector is projected onto the CSM and the resulting beamforming response for scan location 𝑛𝑛 is given by
𝑌𝑌𝑛𝑛 =𝐞𝐞𝑛𝑛HCSM𝐞𝐞𝑛𝑛
𝑀𝑀2 , (4)
where H signifies a Hermitian transpose. In many applications, such as those where there is significant self-noise (e.g. wind) in the array measurements, diagonal removal of the CSM is commonly employed to reduce the noise and improve beamforming results. This practice is omitted here due to the high signal-to-noise ratio measured at the array. Furthermore, it was found that in numerical simulations, diagonal removal tended to increase the overall sidelobe levels in the beamforming results, reducing the resolution of low-
2
level features. The dispersion of energy is a common consequence in array processing methods, with the array point-spread function determining the array imaging quality. Poorly designed arrays suffer from a high degree of spreading from a point source while carefully designed arrays can reduce this effect.
Figure 2. Measurement array (blue dots) and scanning grid (dashed line) placed over source distribution (illustrated in blue).
B. DAMAS Algorithm The deconvolution approach for the mapping of acoustic sources (DAMAS) was first proposed by Brooks and Humphreys.5 DAMAS is employed to deconvolve the array effects in conventional beamforming from the original source properties. The problem is cast into a linear system of equations,
𝐀𝐀 𝐱𝐱 = 𝐛𝐛, (5)
where the DAMAS algorithm assumes that incoherent monopoles, each with a different complex amplitude, comprise the original source region. In Equation 5, 𝐱𝐱 is a vector of monopole source strengths located at each scanning grid point 𝑛𝑛 as 𝐱𝐱 = [𝑥𝑥1 𝑥𝑥2 … 𝑥𝑥𝑁𝑁]T. The vector 𝐱𝐱, when convoluted by 𝐀𝐀, produces the beamforming response at each scanning grid location, grouped into a vector as 𝐛𝐛 = [𝑌𝑌1 𝑌𝑌2 …𝑌𝑌𝑁𝑁]T. The matrix 𝐀𝐀 is formed by combining anticipated convolution data, with each matrix column representing the beamforming output of a single monopole at position 𝑛𝑛, vectorized into a column format. It is calculated by
𝐀𝐀𝑛𝑛𝑛𝑛′ =
𝐞𝐞𝑛𝑛H [∙]𝑛𝑛′ 𝐞𝐞𝑛𝑛𝑀𝑀2
=𝐞𝐞𝑛𝑛H �𝐞𝐞𝑛𝑛′
−1�𝐞𝐞𝑛𝑛′−1�H� 𝐞𝐞𝑛𝑛
𝑀𝑀2 , (6)
with [∙]𝑛𝑛′ representing the CSM of a single monopole located at 𝑛𝑛′. The inverse steering vector,
𝐞𝐞𝑛𝑛−1 = [𝑒𝑒1𝑛𝑛−1 𝑒𝑒2𝑛𝑛−1 … 𝑒𝑒𝑁𝑁𝑛𝑛−1]T, (7) is formed by combining inverse steering elements (assuming a spherical spreading from the source location)
𝑒𝑒𝑚𝑚𝑛𝑛−1 =1𝑟𝑟𝑚𝑚𝑛𝑛
exp�𝑗𝑗𝑗𝑗[𝑟𝑟𝑚𝑚𝑛𝑛 − 𝑟𝑟0,𝑛𝑛]�. (8)
The linear system in Eq. (5) is solved iteratively
using a Gauss-Seidel type relaxation method with a non-negativity constraint. At each iteration step, 𝑠𝑠, a residual component 𝑞𝑞𝑛𝑛
(𝑠𝑠) is calculated for each location 𝑛𝑛. It is defined as
𝑞𝑞𝑛𝑛(𝑠𝑠) = �𝐴𝐴𝑛𝑛𝑖𝑖
𝑛𝑛−1
𝑖𝑖=1
𝑥𝑥𝑖𝑖(𝑠𝑠+1) + �𝐴𝐴𝑛𝑛𝑖𝑖𝑥𝑥𝑖𝑖
(𝑠𝑠)𝑁𝑁
𝑖𝑖=𝑛𝑛
− 𝑌𝑌𝑛𝑛 , (9)
where 𝐴𝐴𝑛𝑛𝑖𝑖 are elements of 𝑨𝑨, 𝑥𝑥𝑖𝑖 are elements of 𝒙𝒙, and 𝑌𝑌𝑛𝑛 are components of 𝒃𝒃. The source strength vector is initialized as 𝒙𝒙(0) = 0, although it has been shown that beginning with a more likely estimate of the initial source distribution reduces the necessary number of iterations to converge on a solution.13 As each residual term is updated, the solution for the source strength, 𝑥𝑥𝑛𝑛
(𝑠𝑠+1), is also updated as
𝑥𝑥𝑛𝑛(𝑠𝑠+1) = max�𝑥𝑥𝑛𝑛
(𝑠𝑠) −𝛿𝛿 ⋅ 𝑞𝑞𝑛𝑛
(𝑠𝑠)
𝐴𝐴𝑛𝑛𝑛𝑛, 0�, (10)
where a non-negativity constraint is enforced to ensure all source strengths are physically significant. Iterations are repeated until the residual converges to a minimum value. In this paper, the number of iterations is typically set to 1000 for adequate convergence. The rate of convergence is typically frequency dependent, with higher frequencies converging more quickly as the point-spread function is more well-defined. DAMAS results also depend on the ratio of the spacing between scanning points, Δ𝑥𝑥, to the beamwidth of the array, 𝐵𝐵, which is the diameter of the 3 dB down region of a point source reconstruction. For example, depending on the choice of Δ𝑥𝑥/𝐵𝐵, a simple source may be distributed across multiple scanning points resulting in a distribution of the original source strength over the multiple points. Brooks and Humphreys in Ref. [5] give a suitable range as 0.05 ≤ Δ𝑥𝑥/𝐵𝐵 ≤ 0.20. In the following results, Δ𝑥𝑥/𝐵𝐵 = 0.20 is used, unless otherwise noted.
To illustrate the advantages of DAMAS, an application of both conventional beamforming and DAMAS to the numerical case of a single point source are provided. The source is centered to a fifty-element
3
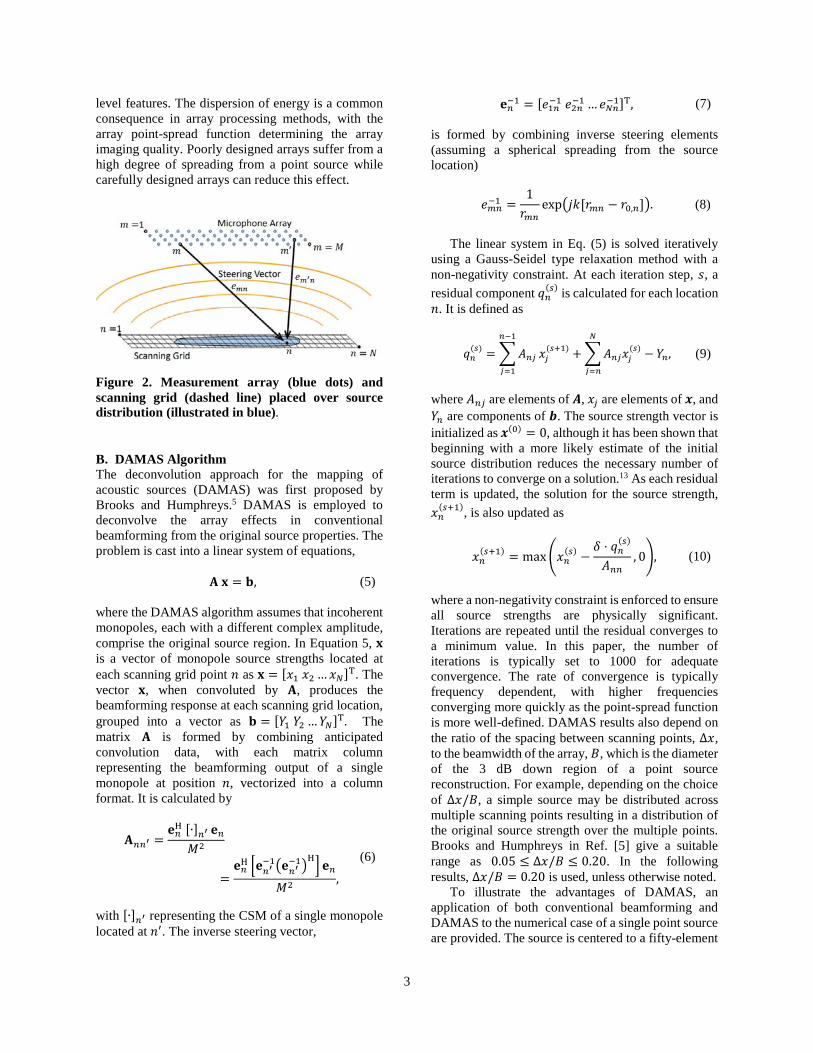
receiver array in a free space, shown in Figure 3(a). The array is designed similar to the array used in the full-scale measurements. A one-dimensional scanning grid region spanning 5.0 m to 20.0 m and spaced such that Δ𝑥𝑥/𝐵𝐵 = 0.20 is also displayed in Figure 3(a). The results at 300 Hz are given in Figure 3(b), with the location and amplitude of the point source indicated by the red circle. The conventional beamforming algorithm (black) represents the array point-spread function and yields a relatively wide central lobe, whose amplitude at the peak output matches the original source level, and grating lobes. When DAMAS (blue) is applied, the sidelobe levels are significantly reduced and a narrow point source is reconstructed. The level of the DAMAS reconstruction is lower than the point source because of the fine resolution of the scanning grid; the reconstruction of the source is distributed across at least three scanning points. The combined amplitude across these points is 94.2 dB re 20 𝜇𝜇Pa: only a 0.2 dB error from 94.0 dB re 20 𝜇𝜇Pa assigned as the point source amplitude at this single frequency.
Figure 3. (a) Geometric configuration of receiving array and source reconstruction grid for the numerical example of a single monopole. (b) Conventional beamforming (black) and DAMAS results (blue) for one frequency of the single monopole.
III. Experiment and Results Noise measurements were made of a Pratt and
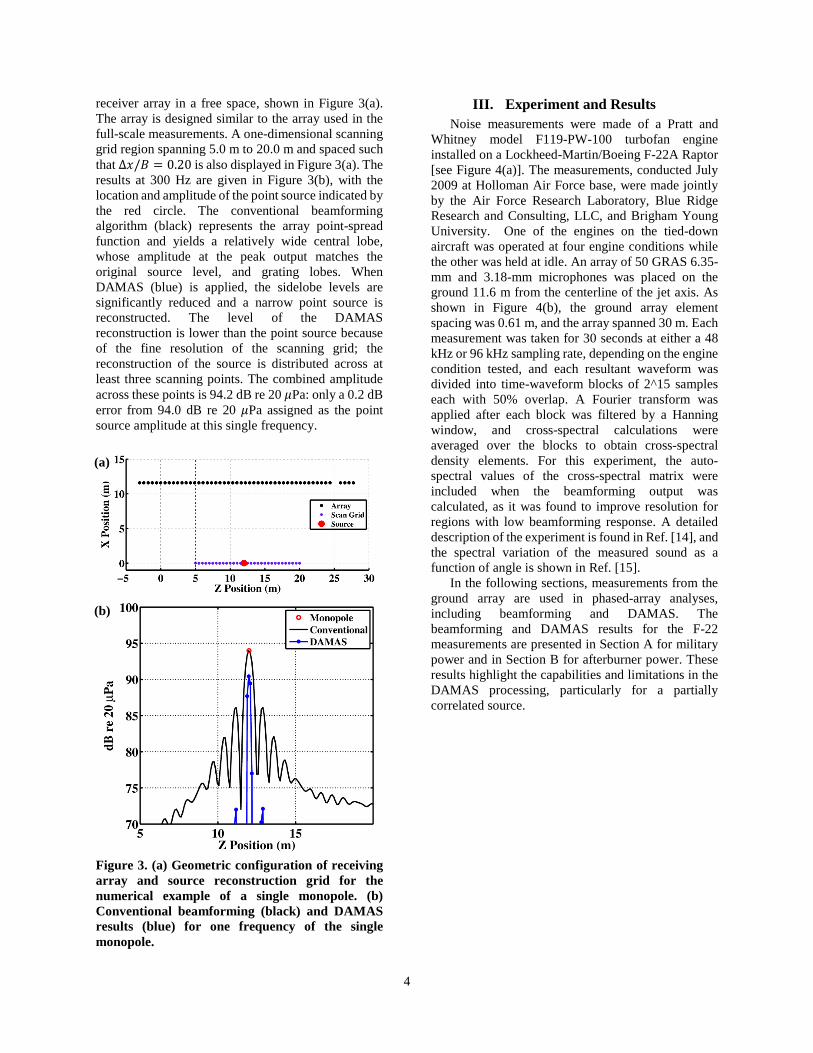
Whitney model F119-PW-100 turbofan engine installed on a Lockheed-Martin/Boeing F-22A Raptor [see Figure 4(a)]. The measurements, conducted July 2009 at Holloman Air Force base, were made jointly by the Air Force Research Laboratory, Blue Ridge Research and Consulting, LLC, and Brigham Young University. One of the engines on the tied-down aircraft was operated at four engine conditions while the other was held at idle. An array of 50 GRAS 6.35-mm and 3.18-mm microphones was placed on the ground 11.6 m from the centerline of the jet axis. As shown in Figure 4(b), the ground array element spacing was 0.61 m, and the array spanned 30 m. Each measurement was taken for 30 seconds at either a 48 kHz or 96 kHz sampling rate, depending on the engine condition tested, and each resultant waveform was divided into time-waveform blocks of 2^15 samples each with 50% overlap. A Fourier transform was applied after each block was filtered by a Hanning window, and cross-spectral calculations were averaged over the blocks to obtain cross-spectral density elements. For this experiment, the auto-spectral values of the cross-spectral matrix were included when the beamforming output was calculated, as it was found to improve resolution for regions with low beamforming response. A detailed description of the experiment is found in Ref. [14], and the spectral variation of the measured sound as a function of angle is shown in Ref. [15].
In the following sections, measurements from the ground array are used in phased-array analyses, including beamforming and DAMAS. The beamforming and DAMAS results for the F-22 measurements are presented in Section A for military power and in Section B for afterburner power. These results highlight the capabilities and limitations in the DAMAS processing, particularly for a partially correlated source.
(a)
(b)
4
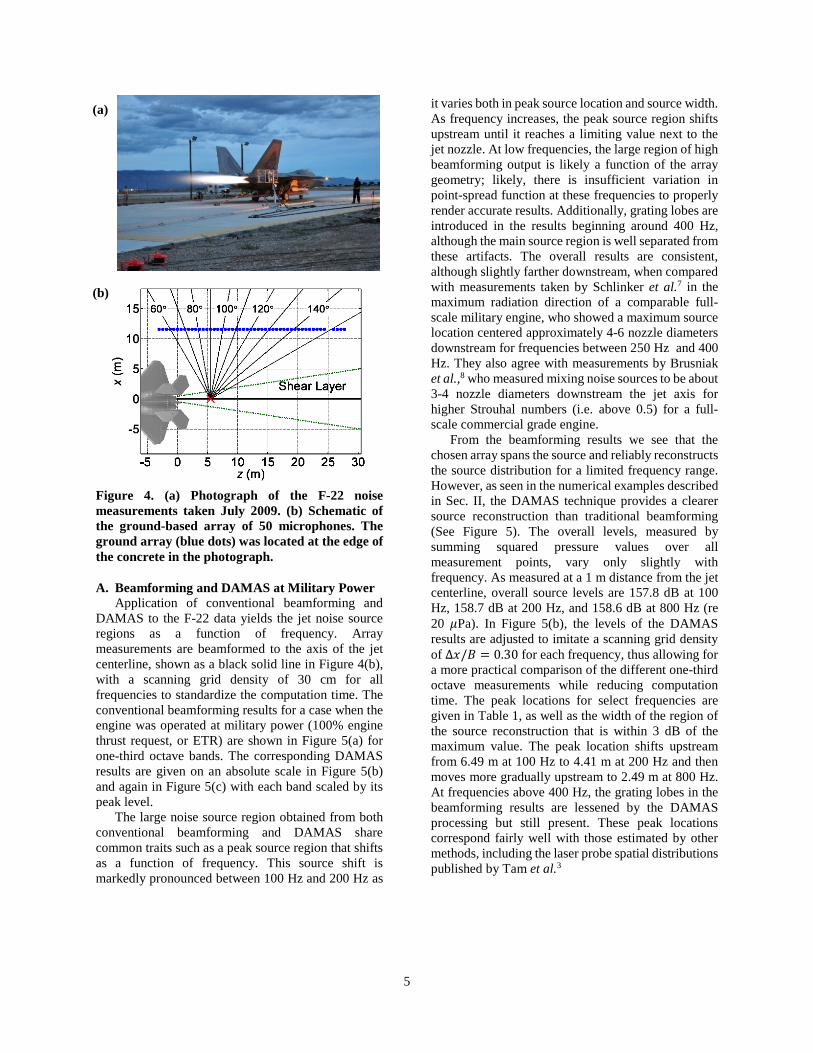
Figure 4. (a) Photograph of the F-22 noise measurements taken July 2009. (b) Schematic of the ground-based array of 50 microphones. The ground array (blue dots) was located at the edge of the concrete in the photograph.
A. Beamforming and DAMAS at Military Power Application of conventional beamforming and
DAMAS to the F-22 data yields the jet noise source regions as a function of frequency. Array measurements are beamformed to the axis of the jet centerline, shown as a black solid line in Figure 4(b), with a scanning grid density of 30 cm for all frequencies to standardize the computation time. The conventional beamforming results for a case when the engine was operated at military power (100% engine thrust request, or ETR) are shown in Figure 5(a) for one-third octave bands. The corresponding DAMAS results are given on an absolute scale in Figure 5(b) and again in Figure 5(c) with each band scaled by its peak level.
The large noise source region obtained from both conventional beamforming and DAMAS share common traits such as a peak source region that shifts as a function of frequency. This source shift is markedly pronounced between 100 Hz and 200 Hz as
it varies both in peak source location and source width. As frequency increases, the peak source region shifts upstream until it reaches a limiting value next to the jet nozzle. At low frequencies, the large region of high beamforming output is likely a function of the array geometry; likely, there is insufficient variation in point-spread function at these frequencies to properly render accurate results. Additionally, grating lobes are introduced in the results beginning around 400 Hz, although the main source region is well separated from these artifacts. The overall results are consistent, although slightly farther downstream, when compared with measurements taken by Schlinker et al.7 in the maximum radiation direction of a comparable full-scale military engine, who showed a maximum source location centered approximately 4-6 nozzle diameters downstream for frequencies between 250 Hz and 400 Hz. They also agree with measurements by Brusniak et al.,8 who measured mixing noise sources to be about 3-4 nozzle diameters downstream the jet axis for higher Strouhal numbers (i.e. above 0.5) for a full-scale commercial grade engine.
From the beamforming results we see that the chosen array spans the source and reliably reconstructs the source distribution for a limited frequency range. However, as seen in the numerical examples described in Sec. II, the DAMAS technique provides a clearer source reconstruction than traditional beamforming (See Figure 5). The overall levels, measured by summing squared pressure values over all measurement points, vary only slightly with frequency. As measured at a 1 m distance from the jet centerline, overall source levels are 157.8 dB at 100 Hz, 158.7 dB at 200 Hz, and 158.6 dB at 800 Hz (re 20 𝜇𝜇Pa). In Figure 5(b), the levels of the DAMAS results are adjusted to imitate a scanning grid density of Δ𝑥𝑥/𝐵𝐵 = 0.30 for each frequency, thus allowing for a more practical comparison of the different one-third octave measurements while reducing computation time. The peak locations for select frequencies are given in Table 1, as well as the width of the region of the source reconstruction that is within 3 dB of the maximum value. The peak location shifts upstream from 6.49 m at 100 Hz to 4.41 m at 200 Hz and then moves more gradually upstream to 2.49 m at 800 Hz. At frequencies above 400 Hz, the grating lobes in the beamforming results are lessened by the DAMAS processing but still present. These peak locations correspond fairly well with those estimated by other methods, including the laser probe spatial distributions published by Tam et al.3
(b)
(a)
5
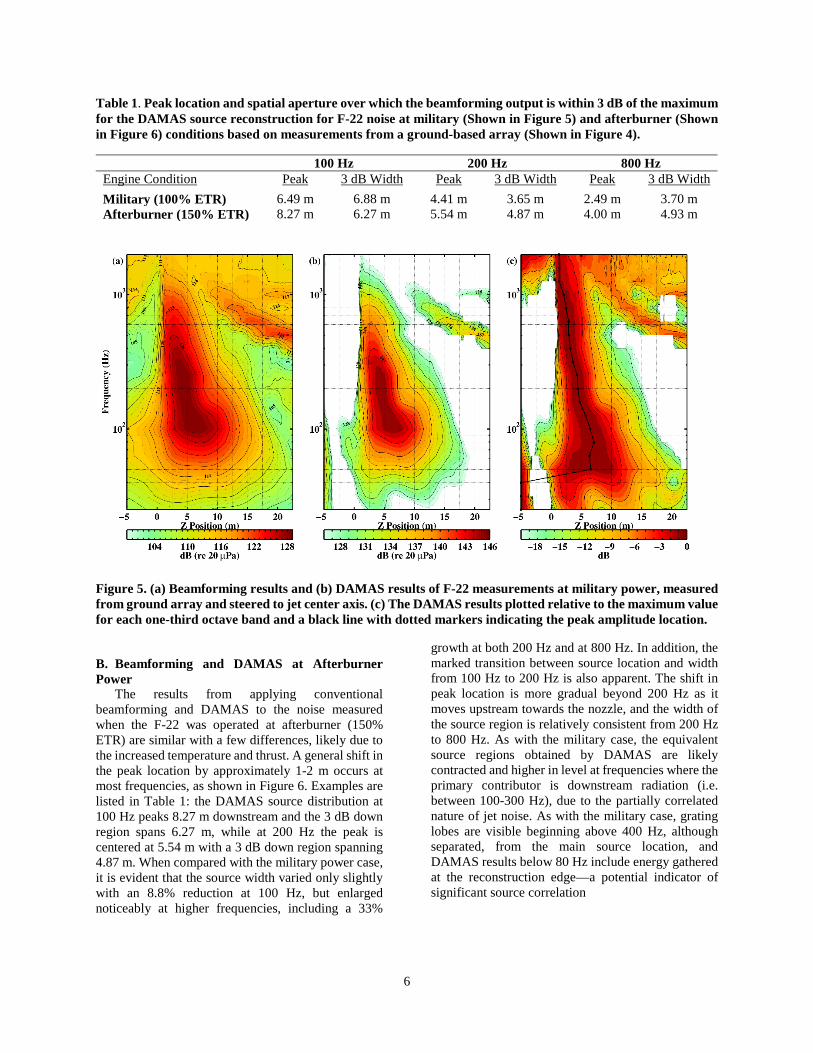
Table 1. Peak location and spatial aperture over which the beamforming output is within 3 dB of the maximum for the DAMAS source reconstruction for F-22 noise at military (Shown in Figure 5) and afterburner (Shown in Figure 6) conditions based on measurements from a ground-based array (Shown in Figure 4).
100 Hz 200 Hz 800 Hz Engine Condition Peak 3 dB Width Peak 3 dB Width Peak 3 dB Width
Military (100% ETR) 6.49 m 6.88 m 4.41 m 3.65 m 2.49 m 3.70 m Afterburner (150% ETR) 8.27 m 6.27 m 5.54 m 4.87 m 4.00 m 4.93 m
Figure 5. (a) Beamforming results and (b) DAMAS results of F-22 measurements at military power, measured from ground array and steered to jet center axis. (c) The DAMAS results plotted relative to the maximum value for each one-third octave band and a black line with dotted markers indicating the peak amplitude location.
B. Beamforming and DAMAS at Afterburner Power
The results from applying conventional beamforming and DAMAS to the noise measured when the F-22 was operated at afterburner (150% ETR) are similar with a few differences, likely due to the increased temperature and thrust. A general shift in the peak location by approximately 1-2 m occurs at most frequencies, as shown in Figure 6. Examples are listed in Table 1: the DAMAS source distribution at 100 Hz peaks 8.27 m downstream and the 3 dB down region spans 6.27 m, while at 200 Hz the peak is centered at 5.54 m with a 3 dB down region spanning 4.87 m. When compared with the military power case, it is evident that the source width varied only slightly with an 8.8% reduction at 100 Hz, but enlarged noticeably at higher frequencies, including a 33%
growth at both 200 Hz and at 800 Hz. In addition, the marked transition between source location and width from 100 Hz to 200 Hz is also apparent. The shift in peak location is more gradual beyond 200 Hz as it moves upstream towards the nozzle, and the width of the source region is relatively consistent from 200 Hz to 800 Hz. As with the military case, the equivalent source regions obtained by DAMAS are likely contracted and higher in level at frequencies where the primary contributor is downstream radiation (i.e. between 100-300 Hz), due to the partially correlated nature of jet noise. As with the military case, grating lobes are visible beginning above 400 Hz, although separated, from the main source location, and DAMAS results below 80 Hz include energy gathered at the reconstruction edge—a potential indicator of significant source correlation
6
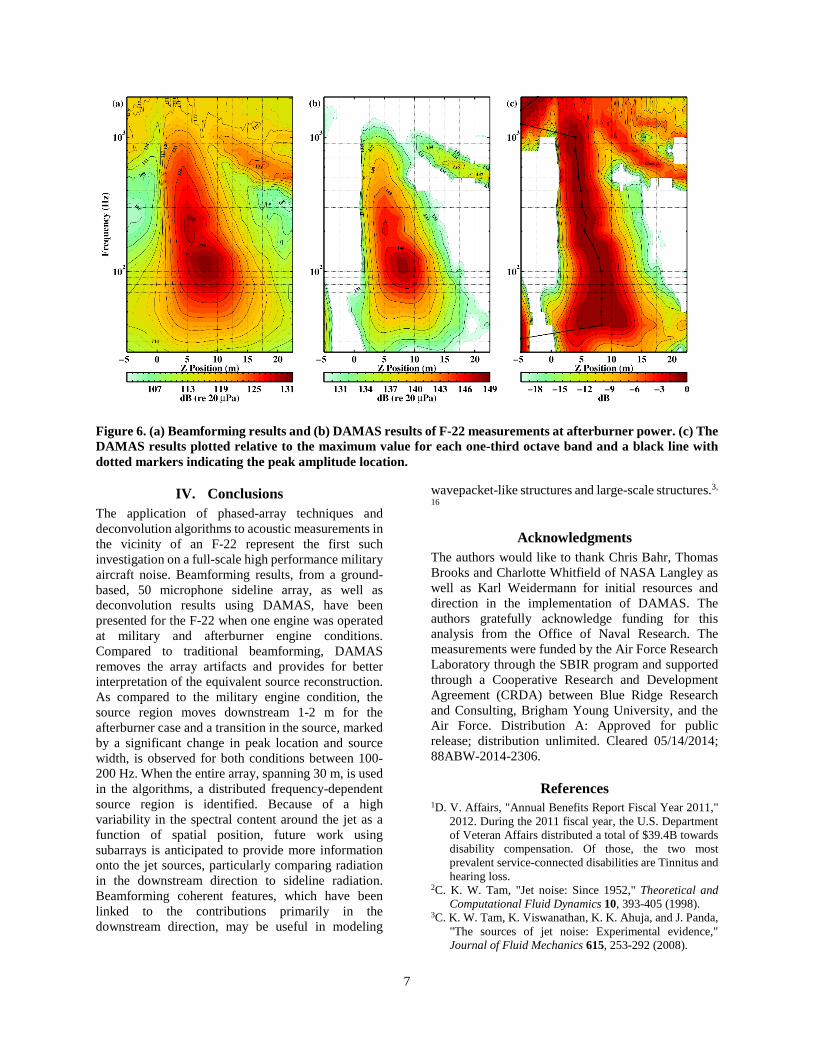
Figure 6. (a) Beamforming results and (b) DAMAS results of F-22 measurements at afterburner power. (c) The DAMAS results plotted relative to the maximum value for each one-third octave band and a black line with dotted markers indicating the peak amplitude location.
IV. Conclusions The application of phased-array techniques and deconvolution algorithms to acoustic measurements in the vicinity of an F-22 represent the first such investigation on a full-scale high performance military aircraft noise. Beamforming results, from a ground-based, 50 microphone sideline array, as well as deconvolution results using DAMAS, have been presented for the F-22 when one engine was operated at military and afterburner engine conditions. Compared to traditional beamforming, DAMAS removes the array artifacts and provides for better interpretation of the equivalent source reconstruction. As compared to the military engine condition, the source region moves downstream 1-2 m for the afterburner case and a transition in the source, marked by a significant change in peak location and source width, is observed for both conditions between 100-200 Hz. When the entire array, spanning 30 m, is used in the algorithms, a distributed frequency-dependent source region is identified. Because of a high variability in the spectral content around the jet as a function of spatial position, future work using subarrays is anticipated to provide more information onto the jet sources, particularly comparing radiation in the downstream direction to sideline radiation. Beamforming coherent features, which have been linked to the contributions primarily in the downstream direction, may be useful in modeling
wavepacket-like structures and large-scale structures.3,
16
Acknowledgments The authors would like to thank Chris Bahr, Thomas Brooks and Charlotte Whitfield of NASA Langley as well as Karl Weidermann for initial resources and direction in the implementation of DAMAS. The authors gratefully acknowledge funding for this analysis from the Office of Naval Research. The measurements were funded by the Air Force Research Laboratory through the SBIR program and supported through a Cooperative Research and Development Agreement (CRDA) between Blue Ridge Research and Consulting, Brigham Young University, and the Air Force. Distribution A: Approved for public release; distribution unlimited. Cleared 05/14/2014; 88ABW-2014-2306.
References 1D. V. Affairs, "Annual Benefits Report Fiscal Year 2011,"
2012. During the 2011 fiscal year, the U.S. Department of Veteran Affairs distributed a total of $39.4B towards disability compensation. Of those, the two most prevalent service-connected disabilities are Tinnitus and hearing loss.
2C. K. W. Tam, "Jet noise: Since 1952," Theoretical and Computational Fluid Dynamics 10, 393-405 (1998).
3C. K. W. Tam, K. Viswanathan, K. K. Ahuja, and J. Panda, "The sources of jet noise: Experimental evidence," Journal of Fluid Mechanics 615, 253-292 (2008).
7
4S. R. Venkatesh, D. R. Polak, and S. Narayanan, "Beamforming algorithm for distributed source localization and its application to jet noise," AIAA Journal 41, 1238-1246 (2003).
5T. F. Brooks and W. M. Humphreys, "A deconvolution approach for the mapping of acoustic sources (DAMAS) determined from phased microphone arrays," Journal of Sound and Vibration 294, 856-879 (2006).
6K. L. Gee, T. B. Neilsen, A. T. Wall, J. M. Downing, and M. M. James, "The “sound Of Freedom”: Characterizing Jet Noise From High‐Performance Military Aircraft," Acoustics Today 9, 8-21 (2013).
7R. Schlinker, S. Liljenberg, D. Polak, K. Post, C. Chipman, and A. Stern, "Supersonic Jet Noise Source Characteristics & Propagation: Engine and Model Scale," AIAA Paper 2007-3623, 2007.
8L. Brusniak, J. Underbrink, E. Nesbitt, D. Lynch, and M. Martinez, "Phased array measurements of full-scale engine exhaust noise," AIAA Paper 2007-3612, 2007.
9R. Dougherty and J. Mendoza, "Phased Array Beamforming with 100-Foot Polar Arc Microphones in a Static Engine Noise Test," AIAA Paper 2008-51, 2008.
10T. Padois, A. Berry, P.-A. Gauthier, and N. Joshi, "Beamforming matrix regularization and inverse problem for sound source localization : application to aero-engine noise," AIAA Paper 2013-2212, 2013.
11K. Ehrenfried and L. Koop, "Comparison of iterative deconvolution algorithms for the mapping of acoustic sources," AIAA Journal 45, 1584-1595 (2007).
12E. Sarradj, "Three-Dimensional Acoustic Source Mapping with Different Beamforming Steering Vector Formulations," Advances in Acoustics and Vibration 2012, (2012).
13P. D. Robert, R. Rakesh Chandran, and R. Ganesh, "Deconvolution of Sources in Aeroacoustic Images from Phased Microphone Arrays Using Linear Programming," AIAA Paper 2013.
14A. T. Wall, K. L. Gee, M. M. James, K. A. Bradley, S. A. McInerny, and T. B. Neilsen, "Near-field noise measurements of a high-performance military jet aircraft," Noise Control Engineering Journal 60, 421-434 (2012).
15T. B. Neilsen, K. L. Gee, A. T. Wall, and M. M. James, "Similarity spectra analysis of high-performance jet aircraft noise," Journal of the Acoustical Society of America 133, 2116-2125 (2013).
16D. Papamoschou, "Wavepacket modeling of the jet noise source," AIAA Paper 2011-2835, 2011.
8