Embed Size (px)
Citation preview

Phaseolus beans: impact on glycaemic response and chronic disease riskin human subjects
Andrea M. Hutchins1*, Donna M. Winham2 and Sharon V. Thompson3
1Department of Health Sciences, University of Colorado Colorado Springs, 1420 Austin Bluffs Parkway, Colorado Springs,
CO 80918, USA2Nutrition Program, School of Nutrition and Health Promotion, 500 North 3rd Street, Phoenix, AZ 85004, USA3Center for Research on Occupational and Environmental Toxicology, Oregon Health & Science University, 3181 Southwest
Sam Jackson Park Road, Portland, OR 97239, USA
(Submitted 15 September 2011 – Accepted 1 December 2011)
Abstract
Consumption of Phaseolus vulgaris bean species such as pinto, black, navy or kidney may be beneficial in the prevention and treatment
of chronic diseases. In particular, conditions that are promoted by increased glycaemic stress (hyperglycaemia and hyperinsulinaemia)
including diabetes, CVD and cancer seem to be reduced in individuals who eat more of these beans. The present paper discusses the
influence of P. vulgaris species on glycaemic response and the impact that relationship may have on the risk of developing diabetes,
CVD and cancer.
Key words: Phaseolus vulgaris: Beans: Glycaemic response: Chronic disease: Human subjects
Consumption of the Phaseolus vulgaris species of beans
may be beneficial in the prevention and treatment of chronic
diseases that are promoted by increased glycaemic stress
(hyperglycaemia and hyperinsulinaemia). These conditions
include diabetes and CVD, as well as cancer.
The importance of controlling postprandial blood glucose
in the prevention and management of chronic disease has
gained recognition in recent years(1–3). Glucose elevations
cause oxidative stress that then alters the ability of the lining
of blood vessels, or endothelium, to respond appropriately
to blood flow. Some foods such as beans appear to stabilise
or reduce postprandial glucose variability. Epidemiological
studies show associations with increased legume consumption
and decreased rates or prevalence of chronic diseases such
as type 2 diabetes mellitus (T2DM)(4–6). Most beans such
as the common bean (P. vulgaris sp., for example, pinto
bean, black bean, navy bean) have a low glycaemic index
(GI)(7,8). In contrast, high-GI items such as white rice and
white bread can elevate postprandial glucose and result in
increased oxidative stress(9–11).
The low glycaemic response of beans alone has been docu-
mented(9,12), but few studies have looked at the acute effects
of P. vulgaris or common beans on glycaemic response as
part of a meal(8,13). In the limited number of studies that
have looked at mixed meals, beans combined with a high-
GI or refined carbohydrate food produced a glycaemic
response that was in between the GI of the two foods when
analysed alone(8,13,14). It is not clear what kind of synergistic
effects are produced or if an intermediate value always
exists when the composition of the foods is varied. These
findings are important for guiding recommendations to
improve diabetes control and lower CVD and cancer risk(10).
It is possible that adding a low-GI food may reduce damage
produced by other high-GI components of that meal. One
important consideration is that we do not know the magnitude
of the effect. It also appears that the glycaemic response
attenuation is not necessarily linear.
The present paper discusses the relationship between
glycaemic concentrations and glycaemic response produced
by the consumption of P. vulgaris species, and the impact
that relationship may have on the risk of developing diabetes,
CVD and cancer. Glycaemic concentration refers to blood
glucose measures at a particular point in time (for example,
fasting) and glycaemic response is defined as blood glucose
*Corresponding author: Associate Professor A. Hutchins, fax þ1 719 255 4433, email [email protected]
Abbreviations: GI, glycaemic index; GL, glycaemic load; T2DM, type 2 diabetes mellitus.
British Journal of Nutrition (2012), 108, S52–S65 doi:10.1017/S0007114512000761q The Authors 2012
British
Journal
ofNutrition

concentration following meal consumption, which is esta-
blished by the rate at which glucose is released into and
subsequently removed from circulation(15).
Review methods
The electronic databases MEDLINEw, CINAHLw and the
Cochrane Library were searched in November 2010, May
2011 and August 2011 with no date limitations. Keywords
used for the search were ‘Phaseolus vulgaris’, ‘beans’,
‘legumes’ and ‘glycaemic response’. Abstracts of articles
identified as potentially relevant based on the use of the
terms Phaseolus vulgaris, beans, or legumes and glycaemic
response in the abstract or keywords were obtained. The
1438 article abstracts were then reviewed to determine if the
article investigated the impact of P. vulgaris on glycaemic
response or the prevention or treatment of diabetes mellitus,
heart disease, CVD, obesity, weight management or cancer.
Relevant articles (n 118) were then collected in full text.
The full-text articles were screened for inclusion based
on the following criteria: (1) published in a scientific peer-
reviewed journal; (2) used P. vulgaris as a sole treatment or
as part of a treatment; (3) published in English; (4) addressed
the impact of P. vulgaris on glycaemic response or prevention
or treatment of diabetes mellitus, CVD or cancer; (5) used
human subjects; and (6) not an editorial, expert opinion,
review or instructive article. The reference lists of included
articles, review articles and meta-analyses were hand-searched
for articles that met the inclusion criteria but that had not
been identified during the electronic database search.
Relevant articles from the reference lists that met the inclusion
criteria were collected in full text. We found twenty-three
articles meeting the criteria for inclusion in the tables in the
present review.
Evidence for health outcomes
Evidence that beans induce low glycaemic response
Beans and other dry grain pulses typically reduce post-
prandial glucose elevations in short-term studies with non-
diabetic and diabetic individuals compared with most starch
foods(13,14,16–23). Most studies that examined the impact
of legumes on glycaemic control have utilised either normo-
glycaemic or T2DM participants.
The lower glycaemic response to beans has been attri-
buted to their low GI or delayed digestion of the carbo-
hydrate within and, therefore, delayed absorption of
glucose(7,8,10,12–14). One important question to address, how-
ever, is determination of the magnitude and nature of the
effect of beans on the glycaemic response to meals containing
high-GI foods. The few studies that have explored this
question generally report that beans combined with a high-
GI food produce a glycaemic response that is intermediate
between the high- and low-GI foods, but this is not to say
that the nature of the effect is additive or linear(8,13,14,17,19–22).
The mixed-meal findings presented in Table 1 have import-
ant implications for chronic disease risk reduction(10,24).
Individuals generally consume foods in combination, not in
isolation, so determining the overall glycaemic response to
the combination of foods has greater ‘real-life’ application to
determining chronic disease risk reduction. Demonstrating
that inclusion of beans in a meal results in a lower glycaemic
response to the meal will provide a realistic, food-based
mechanism for reducing the oxidative stress, endothelium-
dependent vasodilation, and increased blood pressure associ-
ated with increased risk for some chronic diseases such as
T2DM, complications of T2DM and CVD. Further research is
required to examine the lower glycaemic response associated
with bean meals along with changes in oxidative stress,
endothelium-dependent vasodilation and blood pressure to
confirm the validity and strength of this relationship. These
studies should be adequately powered randomised controlled
trials lasting at least 6 weeks in order to effectively assess
the impact of beans’ ability to lower the glycaemic response
on these markers for chronic disease risk.
Impact of Phaseolus vulgaris species and glycaemicresponse on type 2 diabetes mellitus and risk factorsfor type 2 diabetes mellitus
Controlling postprandial glucose increases through incorpor-
ation of low-GI foods such as P. vulgaris sp. has a favourable
impact on glucose control. Studies demonstrating that con-
sumption of low-GI foods such as beans improve glucose
control and T2DM control, as well as reduce risk for develop-
ing T2DM, have been analysed and summarised elsewhere
and will be covered briefly in the present review(25–27).
A recent Cochrane review assessed eleven randomised
controlled trials and determined the effects of low-GI or low-
glycaemic load (GL) diets and found that they improve glycae-
mic control in individuals with diabetes(28). Their positive
conclusions are supported by other meta-analyses(29,30) which
demonstrated reductions in HbA1c of 0·27 (95 % CI 20·5,
20·03)(30) to 0·43 (95 % CI 0·13, 0·72)(29) when low-GI diets
were compared with high-GI diets. The reductions in HbA1c
achieved with a low-GI diet are comparable with those
produced by pharmacological interventions (for example,
hypoglycaemic medications)(29). However, the studies included
in these reviews treated low-GI, or low-GL, diets in a more
global fashion and did not focus solely on beans.
A meta-analysis(7) examined forty-one studies that exam-
ined the effects of legume consumption alone, legume con-
sumption as part of a low-GI diet, and legume consumption
as part of a high-fibre diet. Pooled analyses demonstrated
that legumes, alone or in low-GI or high-fibre diets, improve
markers of longer-term glycaemic control (HbA1c and fructo-
samine). Of the reports from the meta-analysis(7) that focused
on P. vulgaris consumption, seven(31–37) are summarised in
Table 2. These results are encouraging news for individuals
with or at risk for T2DM since they indicate that simple diet
changes, such as the inclusion of beans, can have a positive
impact on glycaemic control. Nevertheless, these studies also
illustrate the fact that few studies have focused on how bean
intake influences risk factors for or the treatment of T2DM,
let alone whether their effect is linked solely to the lower
Phaseolus beans and glycaemic response S53
British
Journal
ofNutrition

Table 1. Impact of Phaseolus vulgaris species on glycaemic response
Studyreference Design Sample size Population Duration Treatment Results Conclusions
(1) GI studies with the same amount of carbohydrate in test food as control(a) Whole beansBornetet al.(1987)(13)
Randomisedcross-overtrial
Eighteenadults
Men andwomen withT2DM
Six test mealsconsumedon separatedays
Test foods:White breadWhite riceWheat flour spaghettiKidney beansLentilsPotato flakesFoods consumed aloneor as part of iso-glucido-lipido-protidic meal
All foods and mealsprovided 50 g availablecarbohydrate
GI of single foods:White bread . potato flakes .
wheat flour spaghetti . whiterice . lentils . kidney beans(P,0·001)
GI of test meals:White bread . potato flakes .
white rice . wheat flourspaghetti . lentils . kidneybeans (P,0·001)
No significant differences between testfoods alone and test foods as part ofa meal
GI remains discriminatingeven in the context of amixed meal in thispopulation
(2) Single-meal postprandial studies(a) Whole beansJenkinset al.(1980)(16)
Randomisedcontrolledcross-overtrial
Groups ofbetween fiveandten adults
Healthy menand women
Eight legumesand twenty-four foodsconsumedon separatedays
Thirty-two foods:Beans:Butter beansHaricot beansKidney beansSoyabeansBlackeye peasChickpeasMarrowfat peasLentils
Tubers:Instant mashed potatoesNew potatoSweet potatoYams
Grains:BuckwheatMilletBrown riceWhite riceSweetcorn
Bread and pastas:White breadWholemeal breadWhite spaghettiBrown spaghettiRyvita
Breakfast cereals:All-BranCornflakesMuesliPorridge oatsShredded WheatWeetabix
Biscuits:DigestiveOatmeal
Mean glucose AUC and peak rise afterbean consumption were, respectively,51% (P,0·001) and 41% (P,0·001)of the values after the grains; 51%(P,0·01) and 45% (P,0·001)of the values after the bread andspaghetti; 45% (P,0·001) and 43%(P,0·001) of the values after the biscuits;51% (P,0·001) and 48% (P,0·001) ofthe values after the breakfast cereals;and 55% (P,0·01) and 45% (P,0·001)of the values after the tubers
Leguminous seeds as aclass produce the low-est rise in postprandialblood glucose of thecarbohydrate-rich foodstested
A.M
.H
utch
ins
eta
l.S5
4
British Journal of Nutrition

Table 1. Continued
Studyreference
Design Sample size Population Duration Treatment Results Conclusions
Rich teaWater
Fresh peasBaked beansCanned soyabeans
Panlasiguiet al.(1995)(18)
Randomisedcross-overtrial
Elevenadults
Healthy menand women,aged22 ^ 1·1years
Six mealsconsumedon separatedays
Test foods:ChickpeasPigeon peasBlack beansMung beansWhite beansWhite bread (control)
Each meal provided 50 gavailable carbohydrate
Glycaemic response to all beans was lowercompared with white bread (P,0·01).
Glycaemic response to chickpeas (P,0·01)and the GI of chickpeas (P,0·01) werelower than to black beans, pigeon peasand mung beans but not different fromwhite beans
The differences in the gly-caemic responsesamong the legumescould be due to thedifferences in amountand kind of dietary fibre,amylose content andthe presence of antinu-trients
Thompsonet al.(2009)(14)
Randomisedcross-overtrial
Nineadults
Healthy adultwomen
Three testmealsconsumedon separatedays
Test meals:White riceBlack beans/riceChickpeas/rice
Each meal provided 50 gavailable carbohydrate
Net changes in glucose responses weresignificantly lower for the black beans/riceand chickpeas/rice meals than the ricecontrol at 60 and 90min post-treatment(P¼0·041 and P¼0·002, respectively)
Black bean and chickpeaintake as part of a mealcan reduce the glycae-mic response to a high-GI food
Thompsonet al.(2011)(21)
Randomisedcross-overtrial
Seventeenadults
Adults withT2DM
Four test mealsconsumedon separatedays
Test meals:White ricePinto beans/riceBlack beans/riceDark red kidney beans/rice
Each meal provided 50 gavailable carbohydrate
Net changes in glucose responses weresignificantly lower for the pinto beans/rice,black beans/rice and dark red kidneybeans/rice meals than the rice control at90, 120 and 150min post-treatment(P,0·05)
IAUC were also significantly reduced forthe pinto beans/rice (P,0·01) and blackbeans/rice (P,0·05) meals comparedwith the rice control
The combination of wholebeans and rice may bebeneficial to those withT2DM to assist withblood glucose manage-ment
(b) Other forms of beansLeathwood
& Pollet(1988)(17)
Randomiseddouble-blindcross-overtrial
Trial 1: sixadults
Trial 2: sixadults
Trial 1: healthymen andwomen, aged30–45 years
Trial 2: healthymen andwomen, aged35–45 years
Single mealsconsumedon separatedays
Trial 1: threemeals
Trial 2: sixmeals
Trial 1:Bean flakes or potatoflakes as part of ashepherd’s pie
Trial 2:Bean flakes orpotato flakes as partof a shepherd’s pie witha spinach, ratatouilleor tomato topping
Trial 1: The meal with bean flakes produceda lower 30min postprandial rise in glu-cose compared with the potato flake meal(P,0·01)
Trial 2: The meals with bean flakes pro-duced a greater feeling of fullness, lesshunger and less desire for a snack at240min postprandially (P,0·05, P,0·05and P,0·05, respectively)
‘Slow-release carbo-hydrates’ in the form ofbean flakes, whenincluded in a realisticmeal, produce a low,sustained rise in plasmaglucose concentrationsand a delay in thereappearance of ratedhunger
Potter et al.(1981)(19)
Randomisedcross-overtrial
Eight adults Healthy men,aged 22–45years
Four mealsconsumedon separatedays
Four blended test meals:Liquid glucoseBrown ricePinto beansAll Bran
Each meal provided 75 gcarbohydrate
Pinto bean meals produced a lower 30, 60and 180min postprandial rise in glucose(P,0·01, P,0·05 and P,0·01, respect-ively) compared with the liquid glucosemeal and a lower 30min postprandial risein insulin (P,0·01) compared with theliquid glucose meal and the rice meal
Meals containing the sameamount of carbohydrateproduce differentresponses in glucoseand insulin
Tappy et al.(1986)(20)
Randomisedcross-overtrial
Ten adults Six healthy menand women,aged 19–37years
Four obeseadults with
Two mealsconsumedon separatedays
Test meals:White bean flakes mealPotato flakes meal
Each meal provided 50 gcarbohydrate
Postprandial glucose and insulin concen-trations were lower with the bean flakesmeal compared with the potato flakesmeal at 30min (P,0·01 and P,0·001,respectively) in the healthy participants
At 150 and 180min postprandially, glucose
The reduced but more pro-longed elevations of glu-cose and insulin areconsistent with a slowerdigestion rate of starchand a delay in glucose
Phase
olu
sbean
san
dgly
caem
icre
sponse
S55
British Journal of Nutrition

Table 1. Continued
Studyreference
Design Sample size Population Duration Treatment Results Conclusions
T2DM, aged48–61 years
(P,0·02 and P,0·05, respectively) andinsulin concentrations (P,0·05 andP,0·05, respectively) were higher withthe bean flakes meal compared with thepotato flakes meal in the healthy partici-pants
Statistical analyses were not performed onthe results from the obese diabetic partici-pants
absorption
Torsdottiret al.(1989)(22)
Randomisedcross-overtrial
Six adults Healthy men,aged 22–30years
Two test mealsconsumedon separatedays
Test meals:Mashed bean flakes andmeatMashed potato flakes andmeat
Bean flakes meal produced lower blood glu-cose (P,0·01) and serum insulin(P,0·05) concentrations than the potatoflakes meal
IAUC was lower following the bean flakesmeal (P,0·05) compared with the potatoflakes meal
No significant difference in gastric emptyingbetween the two meals
Low glycaemic responseafter a meal containingbean flakes may be dueto slow digestion ofbean starch in the smallintestine
Tovar et al.(1992)(23)
Randomisedcross-overtrial
Ten adults Healthy menand women,aged36 ^ 2·5years
Six test mealsconsumedon separatedays
Test meals:Red beansBoiled beansAutoclaved beansBean precookedflour porridge
Bean flour with freestarch cakes
LentilsLentil precookedflour porridge
Wheat breadEach meal provided30g availablecarbohydrate
All meals containing legumes producedlower postprandial glucose values at 30and 45min (P,0·05) compared with thewheat bread meal.
All meals containing legumes producedlower postprandial insulin values at 30and 45min (P,0·05) compared with thewheat bread meal.
Processed bean meals (bean precookedflour porridge and bean flour with freestarch cakes) produced glucose and insu-lin responses that were higher than thewhole bean meals but lower than thewheat bread meals (P,0·05)
Results from this studyconfirm the deleteriouseffect of processing onthe metabolic responsesto legumes. This maybe attributed in part tothermal and/or mechan-ical alteration of thebotanical structure ofthe seeds and also tothe release of physicallyinaccessible starch bymechanical disruption ofcell walls
Winhamet al.(2007)(8)
Randomisedcross-overtrial
Twelve adults:low-dosetreatment
Eleven adults:high-dosetreatment
Healthy menand women,aged 20–65years
Six test meals(three low-dose, threehigh-dose)consumedon separatedays
Low-dose meals (includedhalf cup bean paste):Pinto beansBlack-eyed peaNavy beans
High-dose meals (includedone cup bean paste):Pinto beansBlack-eyed peaNavy beans
No significant differences by dose or beantype in glucose, insulin response, whole-body insulin sensitivity or HOMA
When provided in the formof a spread (beanpaste), pinto bean, navybean, or black-eyed peaintake as part of a treat-ment did not signifi-cantly reduce glycaemicresponse to high-GIfoods
T2DM, type 2 diabetes mellitus; GI, glycaemic index; AUC, area under the curve; IAUC, incremental area under the curve; HOMA, homeostasis model assessment.
A.M
.H
utch
ins
eta
l.S5
6
British Journal of Nutrition
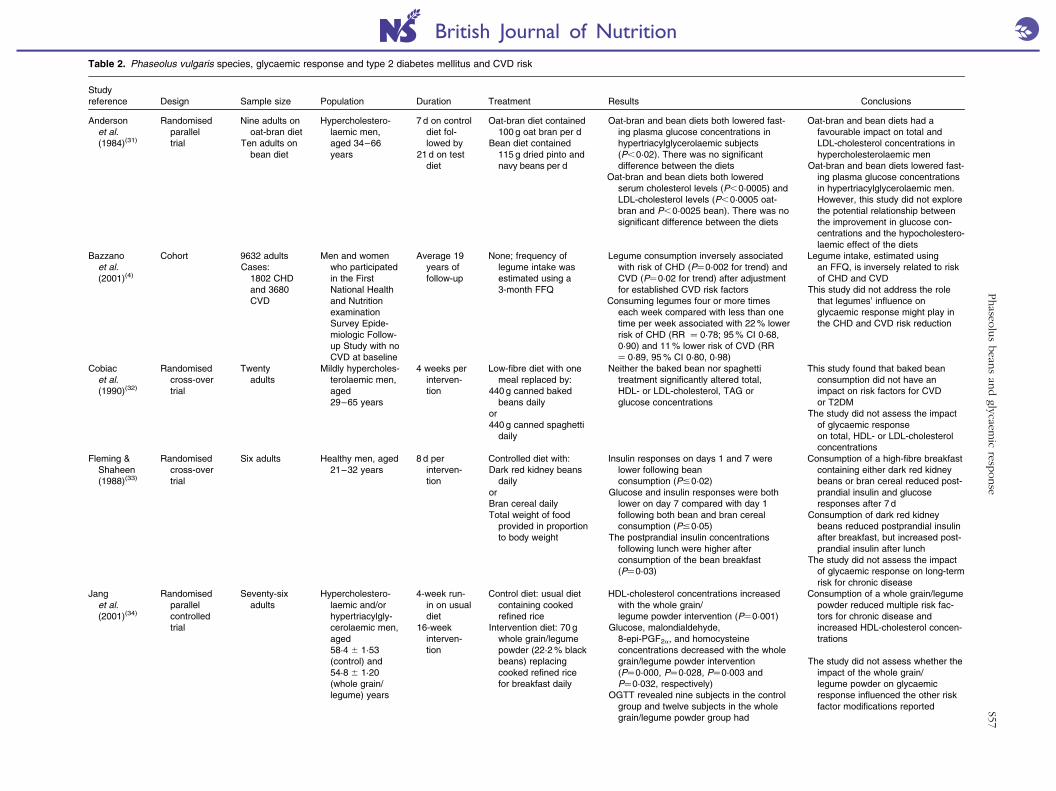
Table 2. Phaseolus vulgaris species, glycaemic response and type 2 diabetes mellitus and CVD risk
Studyreference Design Sample size Population Duration Treatment Results Conclusions
Andersonet al.(1984)(31)
Randomisedparalleltrial
Nine adults onoat-bran diet
Ten adults onbean diet
Hypercholestero-laemic men,aged 34–66years
7 d on controldiet fol-lowed by
21d on testdiet
Oat-bran diet contained100 g oat bran per d
Bean diet contained115 g dried pinto andnavy beans per d
Oat-bran and bean diets both lowered fast-ing plasma glucose concentrations inhypertriacylglycerolaemic subjects(P,0·02). There was no significantdifference between the diets
Oat-bran and bean diets both loweredserum cholesterol levels (P,0·0005) andLDL-cholesterol levels (P,0·0005 oat-bran and P,0·0025 bean). There was nosignificant difference between the diets
Oat-bran and bean diets had afavourable impact on total andLDL-cholesterol concentrations inhypercholesterolaemic men
Oat-bran and bean diets lowered fast-ing plasma glucose concentrationsin hypertriacylglycerolaemic men.However, this study did not explorethe potential relationship betweenthe improvement in glucose con-centrations and the hypocholestero-laemic effect of the diets
Bazzanoet al.(2001)(4)
Cohort 9632 adultsCases:
1802 CHDand 3680CVD
Men and womenwho participatedin the FirstNational Healthand NutritionexaminationSurvey Epide-miologic Follow-up Study with noCVD at baseline
Average 19years offollow-up
None; frequency oflegume intake wasestimated using a3-month FFQ
Legume consumption inversely associatedwith risk of CHD (P¼0·002 for trend) andCVD (P¼0·02 for trend) after adjustmentfor established CVD risk factors
Consuming legumes four or more timeseach week compared with less than onetime per week associated with 22% lowerrisk of CHD (RR ¼ 0·78; 95% CI 0·68,0·90) and 11% lower risk of CVD (RR¼ 0·89, 95% CI 0·80, 0·98)
Legume intake, estimated usingan FFQ, is inversely related to riskof CHD and CVD
This study did not address the rolethat legumes’ influence onglycaemic response might play inthe CHD and CVD risk reduction
Cobiacet al.(1990)(32)
Randomisedcross-overtrial
Twentyadults
Mildly hypercholes-terolaemic men,aged29–65 years
4 weeks perinterven-tion
Low-fibre diet with onemeal replaced by:
440 g canned bakedbeans daily
or440 g canned spaghetti
daily
Neither the baked bean nor spaghettitreatment significantly altered total,HDL- or LDL-cholesterol, TAG orglucose concentrations
This study found that baked beanconsumption did not have animpact on risk factors for CVDor T2DM
The study did not assess the impactof glycaemic responseon total, HDL- or LDL-cholesterolconcentrations
Fleming &Shaheen(1988)(33)
Randomisedcross-overtrial
Six adults Healthy men, aged21–32 years
8 d perinterven-tion
Controlled diet with:Dark red kidney beans
dailyorBran cereal dailyTotal weight of food
provided in proportionto body weight
Insulin responses on days 1 and 7 werelower following beanconsumption (P#0·02)
Glucose and insulin responses were bothlower on day 7 compared with day 1following both bean and bran cerealconsumption (P#0·05)
The postprandial insulin concentrationsfollowing lunch were higher afterconsumption of the bean breakfast(P¼0·03)
Consumption of a high-fibre breakfastcontaining either dark red kidneybeans or bran cereal reduced post-prandial insulin and glucoseresponses after 7 d
Consumption of dark red kidneybeans reduced postprandial insulinafter breakfast, but increased post-prandial insulin after lunch
The study did not assess the impactof glycaemic response on long-termrisk for chronic disease
Janget al.(2001)(34)
Randomisedparallelcontrolledtrial
Seventy-sixadults
Hypercholestero-laemic and/orhypertriacylgly-cerolaemic men,aged58·4 ^ 1·53(control) and54·8 ^ 1·20(whole grain/legume) years
4-week run-in on usualdiet
16-weekinterven-tion
Control diet: usual dietcontaining cookedrefined rice
Intervention diet: 70 gwhole grain/legumepowder (22·2% blackbeans) replacingcooked refined ricefor breakfast daily
HDL-cholesterol concentrations increasedwith the whole grain/legume powder intervention (P¼0·001)
Glucose, malondialdehyde,8-epi-PGF2a, and homocysteineconcentrations decreased with the wholegrain/legume powder intervention(P¼0·000, P¼0·028, P¼0·003 andP¼0·032, respectively)
OGTT revealed nine subjects in the controlgroup and twelve subjects in the wholegrain/legume powder group had
Consumption of a whole grain/legumepowder reduced multiple risk fac-tors for chronic disease andincreased HDL-cholesterol concen-trations
The study did not assess whether theimpact of the whole grain/legume powder on glycaemicresponse influenced the other riskfactor modifications reported
Phase
olu
sbean
san
dgly
caem
icre
sponse
S57
British Journal of Nutrition

Table 2. Continued
Studyreference
Design Sample size Population Duration Treatment Results Conclusions
new-onset T2DMIn non-diabetic subjects, whole grain/
legume powder consumption decreasedfasting glucose, response areas of glu-cose and insulin during OGTT, and insulinresistance
In the T2DM subjects, whole grain/legume powder consumption decreasedfasting glucose and the response area ofglucose during OGTT
McAuleyet al.(2002)(104)
Randomisedparalleltrial
Seventy-nineadults
Normoglycaemicinsulin-resistantmen and women
4 months Modest diet and exerciseprogramme
Intensive diet andexercise programme(included recommen-dation for legumeconsumption)
Control group
Intensive diet and exercise programmegroup improved insulin sensitivity (25%increase, P¼0·006 v. 9% in the modestgroup, P¼0·23)
This study indicated that intensivediet and exercise therapy may berequired to improve insulin sensi-tivity in insulin-resistant adults
Legumes were recommended as partof the intensive diet and exerciseprogramme, but this study did notdirectly address the influence of thelegumes on glycaemic responseand how that may have alteredinsulin sensitivity
Winhamet al.(2007)(36)
Randomisedcross-overcontrolledtrial
Sixteenadults
Hyperinsulinaemicmen (n 7) andwomen (n 9),aged 22–65years
8 weeks perinterven-tion
Control:Half cup canned
carrots dailyInterventions:
Half cup canned pintobeans daily
Half cup cannedblack-eyed peasdaily
Consumption of half cup pinto beansdecreased total and LDL-cholesterolconcentrations (P¼0·011 and P¼0·013,respectively)
HDL-cholesterol, TAG, hs-CRP, glucose,insulin and HbA1c were not significantlydifferent
Daily pinto bean consumptiondecreased total and LDL-choles-terol concentrations in this study
Since glucose, insulin and HbA1c
values were not significantlyaltered, this study does not indicatethat the influence of beans onglycaemic response was relatedto the change in cholesterolconcentrations
Winham &Hutchins(2007)(35)
Randomisedcross-overcontrolledtrial
Twenty-threeadults
Hypercholestero-laemic men(n 10) andwomen (n 13),aged 22–70years
8 weeks perinterven-tion
Control: half cup cannedcarrots daily
Intervention: half cupvegetarian bakedbeans daily
Consumption of half cup baked beansdecreased total cholesterol concen-trations (P¼0·01)
LDL-cholesterol, HDL-cholesterol, TAG,hs-CRP, glucose, insulin and HbA1c werenot significantly different
Daily baked bean consumptiondecreased total cholesterolconcentrations in this study
Since glucose, insulin and HbA1c
values were not significantlyaltered, this study does not indicatethat the influence of beans onglycaemic response was relatedto the change in cholesterolconcentrations
Wurschet al.(1988)(37)
Randomisedcross-overcontrolledtrial
Six adults Healthy youngmen, aged26 ^ 6 years
7 d per testmeal(breakfast)
Control: 58 g glucose in150ml water
Test meals (breakfast):114 g white kidneybean flakes daily
or62 g potato flakes, 38·5 g
low-starch wheat branand 17 g soya isolatedaily
Mean area under the glucose responsecurve at 1 and 2 h was higher followingthe potato flake-based test meal com-pared with the bean flake test meal(P,0·01 and P,0·05, respectively)
Mean area under the insulin response curveat 1, 2 and 6 h was higher following thepotato flake-based test meal comparedwith the bean flake test meal (P,0·01,P,0·01 and P,0·02,respectively)
A breakfast containing bean flakesfavourably altered postprandial glu-cose and insulin response curves
Since this was a short-term study,the influence of the favourablepostprandial effects of bean flakeson risk for chronic disease wasnot assessed
RR, relative risk; T2DM, type 2 diabetes mellitus; OGTT, oral glucose tolerance test; hs-CRP, high-sensitivity C-reactive protein.
A.M
.H
utch
ins
eta
l.S5
8
British Journal of Nutrition

glycaemic response when consumed. Studies that explore
how beans exert their influence on T2DM prevention and
treatment and whether their effect on glycaemic response is
related to that influence are required.
Impact of Phaseolus vulgaris species and glycaemicresponse on CVD and CVD risk factors
Besides controlling postprandial glucose increases, numerous
research studies indicate that a low-GI diet may also play a
role in reducing the risk for or preventing CVD; however,
these studies did not focus on beans as a low-GI food.
These studies have been analysed and summarised else-
where(25,26,38 –40) and so will not be covered in detail in the
present review. Despite the interest in the role of a low-GI
diet in CVD risk reduction, the mechanisms behind this risk
reduction have yet to be determined. A Cochrane review
examined twenty-one randomised controlled trials that
included a total of 713 participants. This review found no
evidence that low-GI diets influenced changes in certain
well-known risk factors for CVD including HDL-cholesterol,
LDL-cholesterol, TAG or total cholesterol concentrations.
The authors of the Cochrane review reported that many of
the trials included in the review were ‘short-term, of poor
quality and did not have sufficient power to detect clinical
important differences’(41).
Observational studies and a very limited number of
randomised controlled trials indicate a beneficial effect of
bean consumption on short-term satiety and weight loss
when combined with energy restriction(42,43), but these effects
may not be related to the relationship between bean intake
and glycaemic response. Few studies isolated and examined
P. vulgaris species intake separately from other food
groups(42,43), and none of these studies directly addressed
the relationship between bean intake, glycaemic response
and short-term satiety and weight loss, so results in this area
should be interpreted with caution.
Although P. vulgaris species are known to decrease
LDL-cholesterol, a well-known risk factor for CVD, in
normocholesterolaemic and hypercholesterolaemic partici-
pants(35,36,44 –47), this effect is most probably attributed to the
soluble fibre found in the beans and not to the impact the
beans have on glycaemic response. Nevertheless, other risk
factors for CVD, such as oxidative stress, have been identified
and low-GI foods such as beans and low-GI diets may favour-
ably influence these risk factors.
In addition to chronic hyperglycaemia, elevated post-
prandial glucose can increase oxidative stress, worsen
endothelium-dependent vasodilation and raise blood press-
ure(10,48–50). Dysmetabolic changes after eating are significant
contributors to CVD risk and individuals with T2DM are
already at increased risk of CVD. On the other hand, control-
ling the postprandial glucose response by the inclusion of
low-GI/GL foods in the diet can decrease CVD risk. Dietary
patterns that include low-GI/GL foods, such as beans, were
associated with a lower risk for CVD, even after accounting
for other known risk factors such as cigarette smoking, obesity
and family history in a prospective cohort study of 44 875
men aged 40–75 years(51).
Impact of Phaseolus vulgaris species and glycaemicresponse on cancer and cancer risk factors
Researchers hypothesise that glycaemic response may incre-
ase cancer risk through the modulation of hormone concen-
trations (for example, insulin-like growth factor) by insulin
and that hyperinsulinaemia may increase cancer risk(52,53).
Studies examining the effect of GI and GL on the risk for
various cancers (breast, colorectal, endometrial, gastric, ovar-
ian, pancreatic, prostate, renal) report mixed results(54–81).
Most studies utilised either a cohort or case–control design,
relying on FFQ to determine the average daily GI and GL
of participants(54–59,61–64,67–70,74–81). Inaccurate memory of
foods consumed over the recall period (typically 1–2 years)
and recall bias are potential confounding factors with FFQ
and retrospective studies in general. Researchers also acknow-
ledge that the reliability and validity of estimating average
daily GI and GL from FFQ is questionable. Some GI and
GL values have been obtained from small samples and the
variability of the values is undetermined(54–58).
Few studies have reported the relationship of P. vulgaris
species and glycaemic response on cancer risk (Table 3)(59,66,74). We were unable to find any studies that had the
examination of bean intake, glycaemic response and cancer
risk or incidence as a primary objective. One cohort and
one case–control study found weak associations between
legume intake and a reduction in cancer risk related to a
decrease in glycaemic response(59,74). A randomised con-
trolled trial found that a high-legume diet and a healthy
American diet both favourably influenced biomarkers for
cancer risk(66). If the hypothesis that glycaemic response
makes an impact on cancer risk via insulin actions and inter-
actions, then incorporation of beans into the diet to modulate
the glycaemic response could have a favourable impact on
the risk for a variety of cancers. However, determining the
impact of glycaemic response and beans on cancer risk in a
human population will require more accurate and reliable
methods of tracking diet intake over long periods of time.
Composition of Phaseolus vulgaris species of beans
According to the Dietary Guidelines for Americans and the
United States Department of Agriculture, beans are classified
as both a protein and a starchy vegetable source(82). Beans
contain a high amount of protein, with one serving of
most bean types (half cup) providing 7–8 g. Beans are also
an excellent source of fibre, providing 3–9 g of soluble and
insoluble fibre per half-cup serving(83).
Beans contain very little fat, generally accounting for
less than 3 % of the energy content, and have a very low
saturated fat content(84). Beans are also high in folate, Fe,
Mg, Zn, n-3 fatty acids and antioxidants(7,85–88). They contain
phytate and phenolic compounds that may function similarly
to glucose-lowering a-glucosidase or a-amylase inhibitor
T2DM medications such as metformin and acarbose(7,86).
Phaseolus beans and glycaemic response S59
British
Journal
ofNutrition

Table 3. Phaseolus vulgaris species, glycaemic response and cancer risk
Study refer-ence Design Sample size Population Duration Treatment Results Conclusions
Choet al.(2003)(59)
Cohort 714 cases of breastcancer from popu-lation of 90 655over8 years follow-up
Premenopausalwomen, aged26–46 years
Cases identifiedbetween 1991and 1999
None; semi-quantitativeFFQ with 133 fooditems (initial) and 142food items (follow-up)used to calculate GIand GL
GI and GL were not associated withbreast cancer risk. There was aweak, non-significant inverseassociation between intake offibre from legumes and breastcancer risk (RRfor 5th quintile compared with 1stquintile ¼ 0·79; 95% CI 0·62,1·02; P for trend ¼0·04)
This study did not find a relationshipbetween GI and GL and breast cancerrisk
Although there was a weak, non-signifi-cant inverse association betweenintake of fibre from legumes andbreast cancer risk, there is no evi-dence that the relationship betweenlegumes and glycaemic response isrelated to this association
Hartmanet al.(2010)(66)
Randomisedcontrolledtrial
Sixty-four men Men, aged 35–75years, without ahistory of color-ectal cancer
4 weeks oneach diet
Control diet (high-GI (69)healthyAmerican diet)
High-legume (250 g/d),low-GI(38) diet
Both diets significantly reduced fast-ing CRP (P¼0·018 legume andP¼0·007 control) and sTNFRI(P¼0·005 legume and P¼0·001control). The control diet signifi-cantly reduced sTNRFII(P,0·001)
Neither diet decreased fasting insu-lin or C-peptide concentrations.The control diet reduced the fast-ing glucose concentration(P¼0·012) and the legume dietincreased it (P¼0·001)
Both the control and high-legume dietshad favourable effects on biomarkersassociated with incidence of colorectalcancer and adenomas
In this study, the legume diet increasedfasting glucose concentrations, aresult that is inconsistent with the typi-cal reported influence of legumes onglycaemic response
Potischmanet al.(1999)(74)
Case–control
568 cases; 1451controls
Cases: Premeno-pausal women,aged 20–44years, withbreast cancer
Controls: Preme-nopausalwomen, aged20–44 years,without cancer
Cases identifiedbetween 1990and 1992
None; modified versionof standard 100-itemNCI-Block FFQ
Increased intake of beans (OR 0·87;95% CI 0·7, 1·2; 4th quartile) andfibre from beans (OR 0·88; 95%CI 0·7, 1·2 4th quartile) wereassociated with reduced breastcancer risk
Increased bean intake is associated witha minimal, if any, reduction in risk ofearly-stage breast cancer amongyoung women.
Although there was a small reduction inrisk of early-stage breast canceramong young women associated withbean and bean fibre intake, there isno evidence that the relationshipbetween beans and glycaemicresponse is related to this association
GI, glycaemic index; GL, glycaemic load; RR, relative risk; CRP, C-reactive protein; sTNFRI/II, soluble tumour necrosis factor-a receptors I and II; NCI, National Cancer Institute.
A.M
.H
utch
ins
eta
l.S6
0
British Journal of Nutrition

The predominant macronutrient in beans is carbohydrate,
contributing 60–65 % of the energy content. Starch, the pri-
mary digestible carbohydrate in beans, can be categorised as
readily digestible, slowly digestible and resistant starch(89).
All bean varieties including the P. vulgaris species contain
a higher ratio of slowly digestible:readily digestible starch
compared with other starchy foods. In general, most beans
contain 30–40 % amylose, a linear polymer of glucose
units (a1–4 linkages), whereas most other starches contain
20–30 % amylose. Starches with more than 30 % amylose are
readily digestible or resistant starch depending on the amylose
content and hydrothermal treatment applied to the food.
Beans also contain a substantial amount of resistant starch,
considered as a dietary fibre. Resistant starch is defined as
any starch that resists digestion by amylase in the small intes-
tine and progresses to the large intestine for fermentation by
the gut bacteria(90,91). Slowly digestible starch is associated
with reduced glycaemic responses and lower postprandial
glucose levels compared with readily digestible starch.
This attenuated glycaemic response can benefit both insulin-
resistant individuals and individuals with diabetes.
Proposed mechanisms of action
The mechanism of action responsible for the low glycaemic
response to beans is multifaceted. Possible explanations
include a high content of viscous fibre, protein, relatively
high amylose starch and antinutrients. In addition, processing
methods affecting the physical form of the beans may alter
their glycaemic response.
Beans are commonly consumed in their whole form, or as a
minimally processed food with little or no grinding. Eating the
intact bean maintains the integrity of the cell wall, slowing
digestion of the bean in the upper small intestine. Whole
beans also have cell walls that are more resistant to digestion
than the cell walls of cereal grains. Minimal or no processing
of the bean combined with the resistance of the bean cell wall
to digestion provides a likely primary mechanism of action
that explains the low glycaemic response to beans(92).
Viscous fibres form a gel-like substance along the digestive
tract, which may slow the rate of gastric emptying and absorp-
tion rate of nutrients. Inclusion of a viscous fibre with a test
meal may reduce the blood glucose response by an average
of 44 %(93). Purified viscous fibres also reduce postprandial
gastric inhibitory polypeptide and insulin levels more effec-
tively than non-viscous fibres(94,95). Beans are particularly
high in soluble fibres that increase viscosity of the intestinal
lumen or the unstirred water layer(96–98). However, Tappy
et al.(20) found significantly lower glucose and insulin
responses to a bean meal alone compared with a potato
meal with added bean fibre. Therefore, the attenuated glycae-
mic response seen as a result of bean consumption cannot be
explained solely by the beans’ fibre content.
The protein fraction of beans may interact with starch
to reduce the digestibility and glycaemic response of that
starch. Alli & Baker(99) found carbohydrates tightly bound
to proteins isolated from uncooked beans using citric acid
and sodium hydroxide extracts, providing evidence for a
starch–protein interaction.
The ratio of amylose:amylopectin starch found in beans
may also alter the glycaemic response. The higher molecular
weight, greater surface area and branching structure of
amylopectin make it subject to faster digestion than amylose.
High-amylose meals (70 % amylose) compared with high-
amylopectin meals (70 % amylopectin) result in significantly
lower plasma glucose in healthy normoglycaemic adults at
30 and 60 min after meal consumption(100). Among natural
sources of carbohydrates, beans have the highest percentage
of starch as amylose (30–40 %), which is 5–10 % more
amylose than is found in most cereals(90).
In addition to protein–starch interactions and the nature
of the starch in beans, the phytic acid content of beans
may influence the glycaemic response after bean consump-
tion. The phytic acid content of beans is high compared
with non-bean foods. There is a negative correlation bet-
ween phytic acid concentrations and glycaemic indices for
non-diabetic adults (r 20·78, P,0·001)(101). A study using
unleavened bread made from navy bean flour (containing
phytic acid) demonstrated that consuming the navy bean
bread significantly reduced blood glucose area under the
curve by 64 % compared with that of unleavened bread
made from white wheat flour(102). Removing the phytic acid
from the navy bean flour significantly increased the glycaemic
area under the curve by 141 %. Phytic acid is believed to
inhibit starch digestion both directly and indirectly. Structu-
rally, phytic acid binds directly with starch through phosphate
bonds and reduces starch digestibility(102). Indirectly, phytic
acid may bind to cations such as Ca. Since the stability of
a-amylases, including pancreatic a-amylase, is dependent on
Ca(101), the lack of available Ca can decrease the effectiveness
of a-amylases, slowing the rate of starch digestion. Phytic acid
also binds to negatively charged groups on proteins, such
as a-amylases, at neutral and alkaline pH(102), rendering
them useless and reducing the digestion of starch by amylase.
Future directions
All beans are not created equal – nor do they elicit identical
biological responses when consumed. Even though the GI
values for beans are typically very low, studies examining
the glycaemic effects of assorted beans from P. vulgaris
species have demonstrated that the glycaemic response dif-
fers based on the bean used. Researchers should continue
to study different beans from the P. vulgaris species to deter-
mine the individual glycaemic effects associated with each
bean type.
Definitively determining if the form of the bean consumed
changes the glycaemic response, or other positive biological
effects associated with bean consumption, should be a
priority. As interest in the P. vulgaris species increases, the
food industry will probably formulate functional or manu-
factured foods that contain ground beans, bean powder,
bean paste, etc. to address the marketing potential in this
area. Research is needed to ensure that the various forms in
which the bean can be utilised impart the same beneficial
Phaseolus beans and glycaemic response S61
British
Journal
ofNutrition

properties associated with the consumption of whole beans,
including maintaining the low-GI/GL qualities.
Studies such as the one conducted by Kallio et al.(103)
demonstrate that foods can make an impact and act via mole-
cular pathways by affecting signal transduction and gene
function. The constituents of foods that act on these pathways
go beyond the traditional macro- and micronutrient content
typically reported for such foods. Research that identifies the
phytochemical components of foods, including beans, is
desperately needed to allow research in this area to progress.
We are just beginning to explore the mechanisms of action
that are responsible for the chronic disease risk-reduction ben-
efits conferred by whole bean consumption. More research is
required to define the pathways involved, including those
related to changes in oxidative stress, endothelium-dependent
vasodilation, and blood pressure, in order to determine the
full extent of the influence that beans have on the prevention
of chronic disease.
Summary
Traditional foods such as beans should be retained in the diet
because of their many health benefits, including a positive
impact on postprandial glycaemic response. Hyperglycaemia,
whether it occurs following a meal or due to poorly controlled
T2DM, is known to increase oxidative stress, contribute to
hypertension and increase the risk for CVD. Examination of
the glycaemic response to meals, especially culturally import-
ant food combinations such as beans and rice, is important
for the prevention and control of hyperglycaemia-induced
diseases.
Understanding the glycaemic responses elicited by the
beans of the P. vulgaris market classification and how these
responses vary depending on the bean consumed is essential.
Since not all beans are equal in response, these findings will
allow provision of accurate nutrition education to individuals
who have, or are at risk for, T2DM.
Acknowledgements
The preparation of the present review article received no
specific grant funding from any funding agency in the
public, commercial or not-for-profit sectors. A. M. H. and
S. V. T. were responsible for retrieving references. A. M. H.
and D. M. W. were responsible for writing the article. S. V.
T. was responsible for the design of the tables. A. M. H.,
S. V. T. and D. M. W. were responsible for critical reading
and evaluation, presentation of the data and article editing.
The article has been read and approved by all authors. A. M.
H. and D. M. W. have previously received research funding
from Bush Brothers & Company and the US Dry Bean Council.
A. M. H. is a member of the editorial advisory board for the
Dry Bean Quarterly, published by the Northarvest Bean
Growers Association, serves as an editor for Bean Briefs, pub-
lished by the US Dry Bean Council, and has written a white
paper supporting the promotion of bean consumption for
the US Dry Bean Council. D. M. W. has served as a research
advisor for Bush Brothers & Company and Pulse Canada.
S. V. T. has no conflicts of interest to report related to the
content of the present review article.
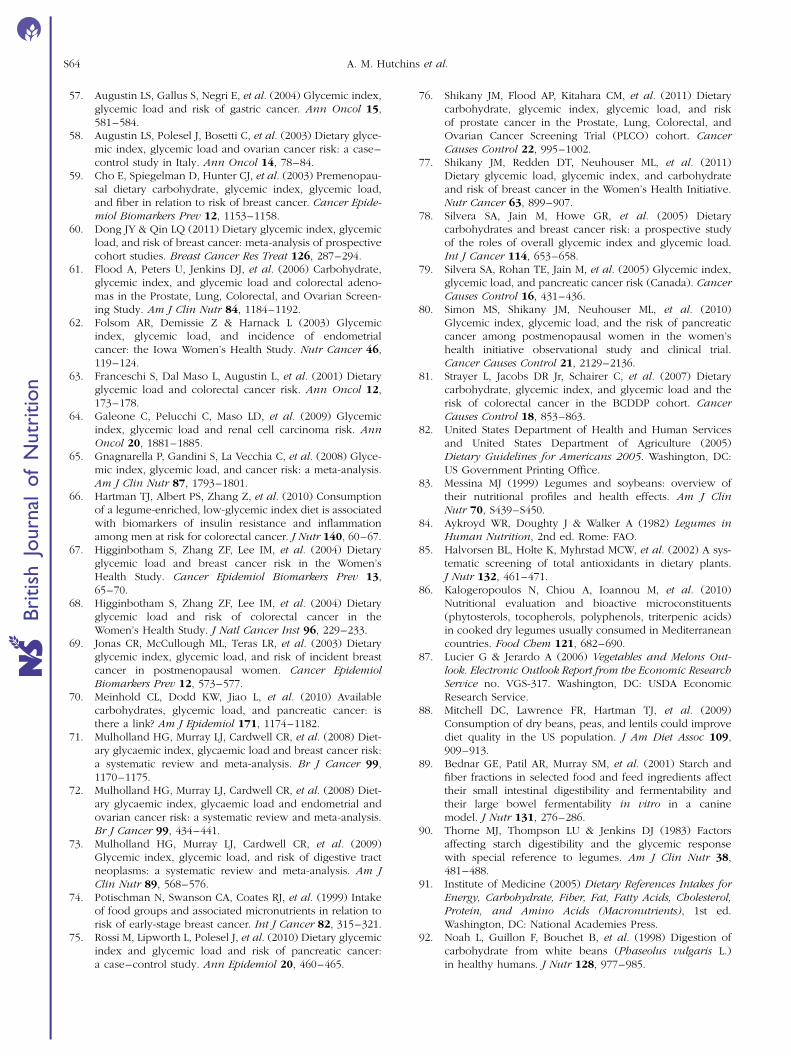
References
1. Ceriello A (2008) Cardiovascular effects of acute hyper-glycaemia: pathophysiological underpinnings. Diab VascDis Res 5, 260–268.
2. Ceriello A (2008) Possible role of oxidative stress in thepathogenesis of hypertension. Diabetes Care 31, Suppl. 2,S181–S184.
3. Ceriello A, Esposito K, Piconi L, et al. (2008) Oscillatingglucose is more deleterious to endothelial function andoxidative stress than mean glucose in normal and type 2diabetic patients. Diabetes 57, 1349–1354.
4. Bazzano LA, He J, Ogden LG, et al. (2001) Legume con-sumption and risk of coronary heart disease in US menand women: NHANES I Epidemiologic Follow-up Study.Arch Intern Med 161, 2573–2578.
5. Darmadi-Blackberry I, Wahlqvist ML, Kouris-Blazos A, et al.(2004) Legumes: the most important dietary predictor ofsurvival in older people of different ethnicities. Asia PacificJ Clin Nutr 13, 217–220.
6. Esposito K, Ciotola M, Giugliano F, et al. (2006) Medi-terranean diet improves erectile function in subjects withmetabolic syndrome. Int J Impotence Res 18, 405–410.
7. Sievenpiper JL, Kendall CW, Esfahani A, et al. (2009) Effectof non-oil-seed pulses on glycaemic control: a systematicreview and meta-analysis of randomised controlled experi-mental trials in people with and without diabetes.Diabetologia 52, 1479–1495.
8. Winham DM, Hutchins AM & Melde CL (2007) Pinto bean,navy bean, and black-eye pea consumption do not signi-ficantly lower the glycemic response to a high glycemicindex treatment in normoglycemic adults. Nutr Res 27,535–541.
9. Atkinson FS, Foster-Powell K & Brand-Miller JC (2008)International tables of glycemic index and glycemic loadvalues: 2008. Diabetes Care 31, 2281–2283.
10. O’Keefe JH & Bell DSH (2007) Postprandial hyperglycemia/hyperlipidemia (postprandial dysmetabolism) is a cardio-vascular risk factor. Am J Cardiol 100, 899–904.
11. Lavi T, Karasik A, Koren-Morag N, et al. (2009) The acuteeffect of various glycemic index dietary carbohydrates onendothelial function in nondiabetic overweight and obesesubjects. J Am Coll Cardiol 53, 2283–2287.
12. Foster-Powell K, Holt SHA & Brand-Miller JC (2002) Inter-national table of glycemic index load values: 2002. Am JClin Nutr 76, 5–58.
13. Bornet FR, Costagliola D, Rizkalla SW, et al. (1987) Insuline-mic and glycemic indexes of six starch-rich foods takenalone and in a mixed meal by type 2 diabetics. Am J ClinNutr 45, 588–595.
14. Thompson SV, Winham DM & Hutchins AM (2009) Blackbean and chickpea consumption reduce glycemic responseas part of a rice meal. FASEB J 23, 540–542.
15. Sheard NF, Clark NG, Brand-Miller JC, et al. (2004) Dietarycarbohydrate (amount and type) in the prevention andmanagement of diabetes. Diabetes Care 27, 2266–2271.
16. Jenkins DJ, Wolever TM, Taylor RH, et al. (1980) Excep-tionally low blood glucose response to dried beans:comparison with other carbohydrate foods. Br Med J 281,578–580.
A. M. Hutchins et al.S62
British
Journal
ofNutrition

17. Leathwood P & Pollet P (1988) Effects of slow releasecarbohydrates in the form of bean flakes on the evolutionof hunger and satiety in man. Appetite 10, 1–11.
18. Panlasigui LN, Panlilio LM & Madrid JC (1995) Glycaemicresponse in normal subjects to five different legumescommonly used in the Philippines. Int J Food Sci Nutr 46,155–160.
19. Potter JG, Coffman KP, Reid RL, et al. (1981) Effect of testmeals of varying dietary fiber content on plasma insulinand glucose response. Am J Clin Nutr 34, 328–334.
20. Tappy L, Wursch P, Randin JP, et al. (1986) Metabolic effectof pre-cooked instant preparations of bean and potato innormal and in diabetic subjects. Am J Clin Nutr 43, 30–36.
21. Thompson SV, Winham DM & Hutchins AM (2012) Bean andrice meals reduce postprandial glycemic response in adultswith type 2 diabetes: a cross-over study. Nutr J (in press).
22. Torsdottir I, Alpsten M, Andersson H, et al. (1989) Gastricemptying and glycemic response after ingestion ofmashed bean or potato flakes in composite meals. Am JClin Nutr 50, 1415–1419.
23. Tovar J, Granfeldt Y & Bjorck I (1992) Effect of processingon blood glucose and insulin responses to starch inlegumes. J Agric Food Chem 40, 1846–1851.
24. Eckel RH, Kahn R, Robertson RM, et al. (2006) Preventingcardiovascular disease and diabetes: a call to action fromthe American Diabetes Association and the AmericanHeart Association. Diabetes Care 29, 1697–1699.
25. Jenkins DJ, Kendall CW, Augustin LS, et al. (2002) Glycemicindex: overview of implications in health and disease. Am JClin Nutr 76, 266S–273S.
26. Barclay AW, Petoca P, McMillan-Price J, et al. (2008)Glycemic index, glycemic load, and chronic diseaserisk–a meta-analysis of observational studies. Am J ClinNutr 87, 627–637.
27. Venn BJ & Mann JI (2004) Cereal grain, legumes anddiabetes. Eur J Clin Nutr 58, 1443–1461.
28. Thomas D & Elliott EJ (2009) Low glycaemic index, or lowglycaemic load, diets for diabetes mellitus The CochraneDatabase of Systematic Reviews 2009, issue 1, CD006296.http://www.mrw.interscience.wiley.com/cochrane/clsysrev/articles/CD006296/frame.html
29. Brand-Miller JC, Thomas M, Swan V, et al. (2003) Physio-logical validation of the concept of glycemic load in leanyoung adults. J Nutr 133, 2728–2732.
30. Opperman AM, Venter CS, Oosthuizen W, et al. (2004)Meta-analysis of the health effects of using the glycaemicindex in meal-planning. Br J Nutr 92, 367–381.
31. Anderson JW, Story L, Sieling B, et al. (1984) Hypo-cholesterolemic effects of oat-bran or bean intake forhypercholesterolemic men. Am J Clin Nutr 40, 1146–1155.
32. Cobiac L, McArthur R & Nestel PJ (1990) Can eating bakedbeans lower plasma cholesterol? Eur J Clin Nutr 44,819–822.
33. Fleming SE & Shaheen SM (1988) Repeated consumptionof high-fiber breakfasts: effects on postprandial glucoseand insulin responses after breakfast and lunch. Am JClin Nutr 47, 859–867.
34. Jang Y, Lee JH, Kim OY, et al. (2001) Consumption ofwhole grain and legume powder reduces insulin demand,lipid peroxidation, and plasma homocysteine concen-trations in patients with coronary artery disease: random-ized controlled clinical trial. Arterioscler Thromb Vasc Biol21, 2065–2071.
35. Winham DM & Hutchins AM (2007) Baked bean consump-tion reduces total cholesterol in mildly hypercholesterole-mic men and women. Nutr Res 27, 380–386.
36. Winham DM, Hutchins AM & Johnston CS (2007) Pintobean consumption reduces biomarkers for heart diseaserisk. J Am Coll Nutr 26, 243–249.
37. Wursch P, Acheson K, Koellreutter B, et al. (1988) Metaboliceffects of instant bean and potato over 6 hours. Am J ClinNutr 48, 1418–1423.
38. Rizkalla SW, Bellisle F & Slama G (2002) Health benefits oflow glycaemic index foods, such as pulses, in diabeticpatients and healthy individuals. Br J Nutr 88, Suppl. 3,S255–S262.
39. Kitahara CM (2010) Low-glycemic load diets: how does theevidence for prevention of disease measure up? J Am DietAssoc 110, 1818–1819.
40. Leeds AR (2002) Glycemic index and heart disease. Am JClin Nutr 76, 286S–289S.
41. Kelly SAM, Frost G & Whittaker V, et al. (2004) Low glycae-mic index diets for coronary heart disease The CochraneDatabase of Systematic Reviews, 2004, issue 4, CD004467.http://www.mrw.interscience.wiley.com/cochrane/clsysrev/articles/CD004467/frame.html
42. McCrory MA, Hamaker BR, Lovejoy JC, et al. (2010) Pulseconsumption, satiety, and weight management. Adv Nutr1, 17–30.
43. Williams PG, Grafenauer SJ & O’Shea JE (2008) Cerealgrains, legumes, and weight management: a compre-hensive review of the scientific evidence. Nutr Rev 66,171–182.
44. Anderson JW, Gustafson NJ, Spencer DB, et al. (1990)Serum lipid response of hypercholesterolemic men tosingle and divided doses of canned beans. Am J ClinNutr 51, 1013–1019.
45. Anderson JW & Major AW (2002) Pulses and lipaemia,short- and long-term effect: potential in the prevention ofcardiovascular disease. Br J Nutr 88, Suppl. 3, S263–S271.
46. Anderson JW, Smith BM & Washnock CS (1999) Cardiovas-cular and renal benefits of dry bean and soybean intake.Am J Clin Nutr 70, 464S–474S.
47. Nestel P, Cehun M & Chronopoulos A (2004) Effects oflong-term consumption and single meals of chickpeas onplasma glucose, insulin, and triacylglycerol concentrations.Am J Clin Nutr 79, 390–395.
48. Davignon J & Ganz P (2004) Role of endothelial dysfunc-tion in atherosclerosis. Circulation 109, III-27–III-32.
49. Hu Y, Block G, Norkus EP, et al. (2006) Relations of glyce-mic index and glycemic load with plasma oxidative stressmarkers. Am J Clin Nutr 84, 70–76.
50. Ceriello A, Esposito K, Piconi L, et al. (2008) Glucose“peak” and glucose “spike”: impact on endothelial functionand oxidative stress. Diabetes Res Clin Pract 82, 262–267.
51. Hu FB, Rimm EB, Stampfer MJ, et al. (2000) Prospectivestudy of major dietary patterns and risk of coronary heartdisease in men. Am J Clin Nutr 72, 912–921.
52. Stoll BA (1999) Western nutrition and the insulin resistancesyndrome: a link to breast cancer. Eur J Clin Nutr 53,83–87.
53. Kaaks R (1996) Nutrition, hormones, and breast cancer: isinsulin the missing link? Cancer Causes Control 7, 605–625.
54. Augustin LS, Dal Maso L, La Vecchia C, et al. (2001) Dietaryglycemic index and glycemic load, and breast cancer risk:a case–control study. Ann Oncol 12, 1533–1538.
55. Augustin LS, Galeone C, Dal Maso L, et al. (2004) Glycemicindex, glycemic load and risk of prostate cancer. Int JCancer 112, 446–450.
56. Augustin LS, Gallus S, Bosetti C, et al. (2003) Glycemicindex and glycemic load in endometrial cancer. Int JCancer 105, 404–407.
Phaseolus beans and glycaemic response S63
British
Journal
ofNutrition
57. Augustin LS, Gallus S, Negri E, et al. (2004) Glycemic index,glycemic load and risk of gastric cancer. Ann Oncol 15,581–584.
58. Augustin LS, Polesel J, Bosetti C, et al. (2003) Dietary glyce-mic index, glycemic load and ovarian cancer risk: a case–control study in Italy. Ann Oncol 14, 78–84.
59. Cho E, Spiegelman D, Hunter CJ, et al. (2003) Premenopau-sal dietary carbohydrate, glycemic index, glycemic load,and fiber in relation to risk of breast cancer. Cancer Epide-miol Biomarkers Prev 12, 1153–1158.
60. Dong JY & Qin LQ (2011) Dietary glycemic index, glycemicload, and risk of breast cancer: meta-analysis of prospectivecohort studies. Breast Cancer Res Treat 126, 287–294.
61. Flood A, Peters U, Jenkins DJ, et al. (2006) Carbohydrate,glycemic index, and glycemic load and colorectal adeno-mas in the Prostate, Lung, Colorectal, and Ovarian Screen-ing Study. Am J Clin Nutr 84, 1184–1192.
62. Folsom AR, Demissie Z & Harnack L (2003) Glycemicindex, glycemic load, and incidence of endometrialcancer: the Iowa Women’s Health Study. Nutr Cancer 46,119–124.
63. Franceschi S, Dal Maso L, Augustin L, et al. (2001) Dietaryglycemic load and colorectal cancer risk. Ann Oncol 12,173–178.
64. Galeone C, Pelucchi C, Maso LD, et al. (2009) Glycemicindex, glycemic load and renal cell carcinoma risk. AnnOncol 20, 1881–1885.
65. Gnagnarella P, Gandini S, La Vecchia C, et al. (2008) Glyce-mic index, glycemic load, and cancer risk: a meta-analysis.Am J Clin Nutr 87, 1793–1801.
66. Hartman TJ, Albert PS, Zhang Z, et al. (2010) Consumptionof a legume-enriched, low-glycemic index diet is associatedwith biomarkers of insulin resistance and inflammationamong men at risk for colorectal cancer. J Nutr 140, 60–67.
67. Higginbotham S, Zhang ZF, Lee IM, et al. (2004) Dietaryglycemic load and breast cancer risk in the Women’sHealth Study. Cancer Epidemiol Biomarkers Prev 13,65–70.
68. Higginbotham S, Zhang ZF, Lee IM, et al. (2004) Dietaryglycemic load and risk of colorectal cancer in theWomen’s Health Study. J Natl Cancer Inst 96, 229–233.
69. Jonas CR, McCullough ML, Teras LR, et al. (2003) Dietaryglycemic index, glycemic load, and risk of incident breastcancer in postmenopausal women. Cancer EpidemiolBiomarkers Prev 12, 573–577.
70. Meinhold CL, Dodd KW, Jiao L, et al. (2010) Availablecarbohydrates, glycemic load, and pancreatic cancer: isthere a link? Am J Epidemiol 171, 1174–1182.
71. Mulholland HG, Murray LJ, Cardwell CR, et al. (2008) Diet-ary glycaemic index, glycaemic load and breast cancer risk:a systematic review and meta-analysis. Br J Cancer 99,1170–1175.
72. Mulholland HG, Murray LJ, Cardwell CR, et al. (2008) Diet-ary glycaemic index, glycaemic load and endometrial andovarian cancer risk: a systematic review and meta-analysis.Br J Cancer 99, 434–441.
73. Mulholland HG, Murray LJ, Cardwell CR, et al. (2009)Glycemic index, glycemic load, and risk of digestive tractneoplasms: a systematic review and meta-analysis. Am JClin Nutr 89, 568–576.
74. Potischman N, Swanson CA, Coates RJ, et al. (1999) Intakeof food groups and associated micronutrients in relation torisk of early-stage breast cancer. Int J Cancer 82, 315–321.
75. Rossi M, Lipworth L, Polesel J, et al. (2010) Dietary glycemicindex and glycemic load and risk of pancreatic cancer:a case–control study. Ann Epidemiol 20, 460–465.
76. Shikany JM, Flood AP, Kitahara CM, et al. (2011) Dietarycarbohydrate, glycemic index, glycemic load, and riskof prostate cancer in the Prostate, Lung, Colorectal, andOvarian Cancer Screening Trial (PLCO) cohort. CancerCauses Control 22, 995–1002.
77. Shikany JM, Redden DT, Neuhouser ML, et al. (2011)Dietary glycemic load, glycemic index, and carbohydrateand risk of breast cancer in the Women’s Health Initiative.Nutr Cancer 63, 899–907.
78. Silvera SA, Jain M, Howe GR, et al. (2005) Dietarycarbohydrates and breast cancer risk: a prospective studyof the roles of overall glycemic index and glycemic load.Int J Cancer 114, 653–658.
79. Silvera SA, Rohan TE, Jain M, et al. (2005) Glycemic index,glycemic load, and pancreatic cancer risk (Canada). CancerCauses Control 16, 431–436.
80. Simon MS, Shikany JM, Neuhouser ML, et al. (2010)Glycemic index, glycemic load, and the risk of pancreaticcancer among postmenopausal women in the women’shealth initiative observational study and clinical trial.Cancer Causes Control 21, 2129–2136.
81. Strayer L, Jacobs DR Jr, Schairer C, et al. (2007) Dietarycarbohydrate, glycemic index, and glycemic load and therisk of colorectal cancer in the BCDDP cohort. CancerCauses Control 18, 853–863.
82. United States Department of Health and Human Servicesand United States Department of Agriculture (2005)Dietary Guidelines for Americans 2005. Washington, DC:US Government Printing Office.
83. Messina MJ (1999) Legumes and soybeans: overview oftheir nutritional profiles and health effects. Am J ClinNutr 70, S439–S450.
84. Aykroyd WR, Doughty J & Walker A (1982) Legumes inHuman Nutrition, 2nd ed. Rome: FAO.
85. Halvorsen BL, Holte K, Myhrstad MCW, et al. (2002) A sys-tematic screening of total antioxidants in dietary plants.J Nutr 132, 461–471.
86. Kalogeropoulos N, Chiou A, Ioannou M, et al. (2010)Nutritional evaluation and bioactive microconstituents(phytosterols, tocopherols, polyphenols, triterpenic acids)in cooked dry legumes usually consumed in Mediterraneancountries. Food Chem 121, 682–690.
87. Lucier G & Jerardo A (2006) Vegetables and Melons Out-look. Electronic Outlook Report from the Economic ResearchService no. VGS-317. Washington, DC: USDA EconomicResearch Service.
88. Mitchell DC, Lawrence FR, Hartman TJ, et al. (2009)Consumption of dry beans, peas, and lentils could improvediet quality in the US population. J Am Diet Assoc 109,909–913.
89. Bednar GE, Patil AR, Murray SM, et al. (2001) Starch andfiber fractions in selected food and feed ingredients affecttheir small intestinal digestibility and fermentability andtheir large bowel fermentability in vitro in a caninemodel. J Nutr 131, 276–286.
90. Thorne MJ, Thompson LU & Jenkins DJ (1983) Factorsaffecting starch digestibility and the glycemic responsewith special reference to legumes. Am J Clin Nutr 38,481–488.
91. Institute of Medicine (2005) Dietary References Intakes forEnergy, Carbohydrate, Fiber, Fat, Fatty Acids, Cholesterol,Protein, and Amino Acids (Macronutrients), 1st ed.Washington, DC: National Academies Press.
92. Noah L, Guillon F, Bouchet B, et al. (1998) Digestion ofcarbohydrate from white beans (Phaseolus vulgaris L.)in healthy humans. J Nutr 128, 977–985.
A. M. Hutchins et al.S64
British
Journal
ofNutrition

93. Wolever TMS & Jenkins DJA (2001) Effect of dietary fiberand foods on carbohydrate metabolism. In CRC Handbookof Dietary Fiber in Human Nutrition, 3rd ed., pp. 321–362[GA Spiller, editor]. Boca Raton, FL: CRC Press.
94. Jenkins DJ & Jenkins AL (1985) Dietary fiber and the glyce-mic response. Proc Soc Exp Biol Med 180, 422–431.
95. Jenkins DJ, Kendall CW, McKeown-Eyssen G, et al. (2008)Effect of a low-glycemic index or a high-cereal fiber dieton type 2 diabetes: a randomized trial. JAMA 300,2742–2753.
96. Brownlee IA, Havler ME, Dettmar PW, et al. (2003) Colonicmucus: secretion and turnover in relation to dietary fibreintake. Proc Nutr Soc 62, 245–249.
97. Cohn JS, Kamili A, Wat E, et al. (2010) Reduction inintestinal cholesterol absorption by various food com-ponents: mechanisms and implications. Atheroscler Suppl11, 45–48.
98. Fuse K, Bamba T & Hosoda S (1989) Effects of pectin on fattyacid and glucose absorption and on thickness of unstirredwater layer in rat and human intestine. Dig Dis Sci 34,1109–1116.
99. Alli I & Baker RE (1980) Constitution of leguminous seeds:the microscopic structure of proteins isolated from phaseo-lus beans. J Sci Food Agric 31, 1316–1322.
100. Behall KM, Scholfield DJ & Canary JC (1988) Effect of starchstructure on glucose and insulin responses in adults. Am JClin Nutr 47, 428–432.
101. Yoon JH, Thompson LU & Jenkins DJA (1983) The effect ofphytic acid on in vitro rate of starch digestibility and bloodglucose response. Am J Clin Nutr 38, 835–842.
102. Thompson LU, Button CL & Jenkins DJ (1987) Phytic acidand calcium affect the in vitro rate of navy bean starchdigestion and blood glucose response in humans. Am JClin Nutr 46, 467–473.
103. Kallio P, Kolehmalnen M, Laaksonen DE, et al. (2007) Diet-ary carbohydrate modifcation induces alterations in geneexpression in abdominal subcutaneous adipose tissue inperson with the metabolic syndrome: the FUNGENUTStudy. Am J Clin Nutr 85, 1417–1427.
104. McAuley KA, Williams SM,Mann JI, et al. (2002) Intensive life-style changes are necessary to improve insulin sensitivity: arandomized controlled trial. Diabetes Care 25, 445–452.
Phaseolus beans and glycaemic response S65
British
Journal
ofNutrition