Embed Size (px)
Citation preview

Phasor Measurement Unit (PMU)
Applications
Akanksha Pachpinde
Harkirat Singh Choong
Outline
• Introduction to Synchrophasors
• Measuring Synchrophasors using PMU
• Early PMU applications
• PMU in power system protection
• WLS method of State Estimation (SE)
• SE with PMU and SCADA data
• Effect of PMU integration

Introduction to Synchrophasors
An AC waveform can be mathematically represented as:
In phasor notation it can be
represented as:
where: = rms magnitude of waveform
= phase angle
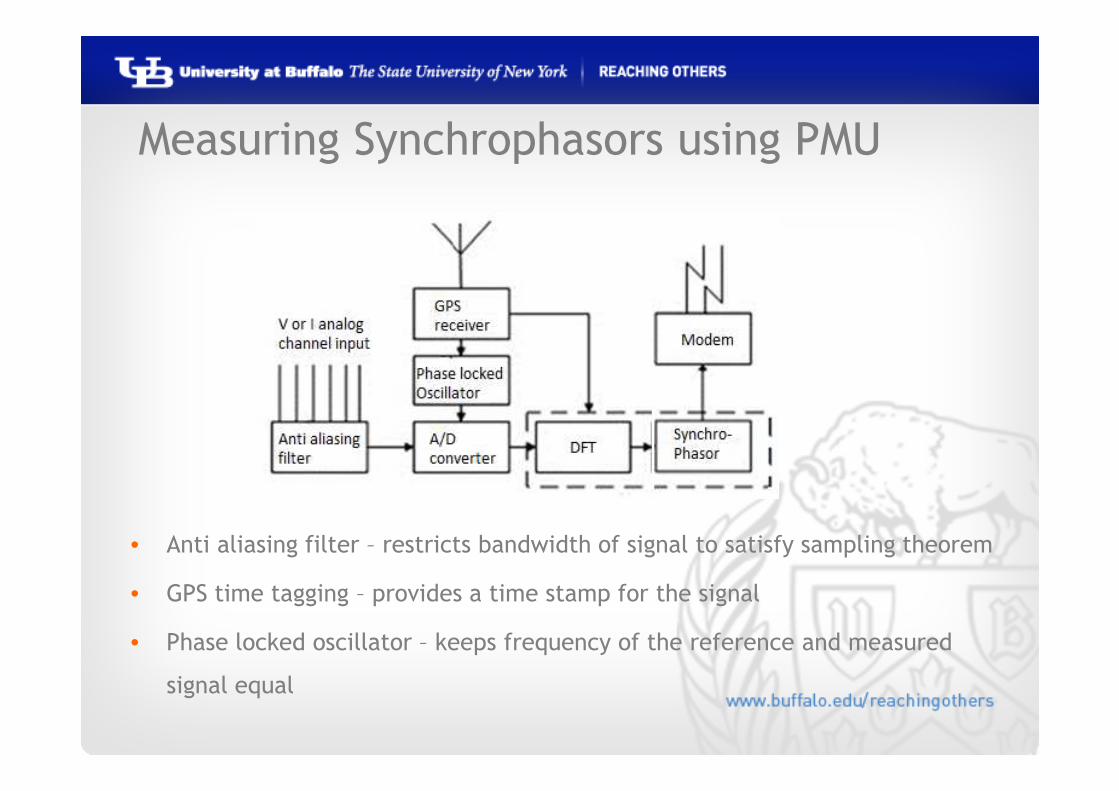
Measuring Synchrophasors using PMU
• Anti aliasing filter – restricts bandwidth of signal to satisfy sampling theorem
• GPS time tagging – provides a time stamp for the signal
• Phase locked oscillator – keeps frequency of the reference and measured
signal equal
Early PMU Applications
• First recorded wide area measurements- EPRI Parameter
Identification Data Acquisition System project in 1992
• PMUs at early stages worked as Digital system disturbance recorders
(DSDRs) due to limitation in availability and bandwidth of
communication channels
• PMU used for fast and accurate postmortem analysis of Northeastern
US blackout (2003) and US West coast blackout (1996)
• Optimum locations for PMU placements for maximum depth of
observability
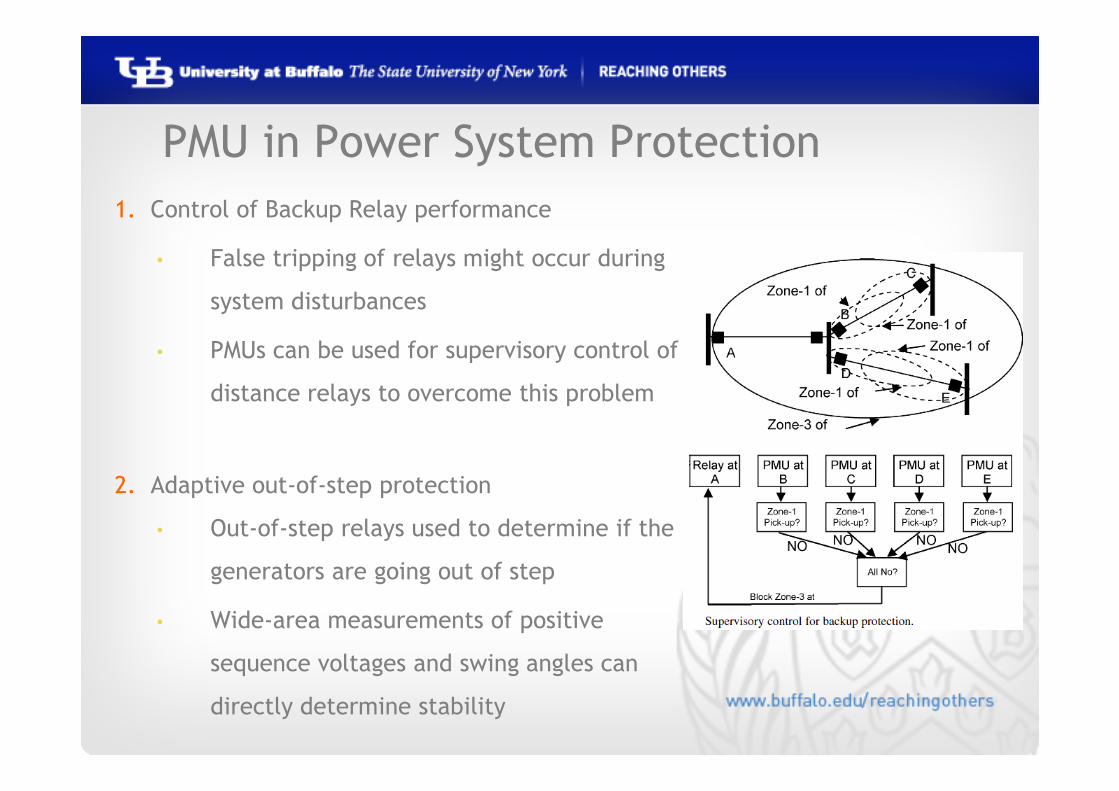
PMU in Power System Protection
1. Control of Backup Relay performance
• False tripping of relays might occur during
system disturbances
• PMUs can be used for supervisory control of
distance relays to overcome this problem
2. Adaptive out-of-step protection
• Out-of-step relays used to determine if the
generators are going out of step
• Wide-area measurements of positive
sequence voltages and swing angles can
directly determine stability
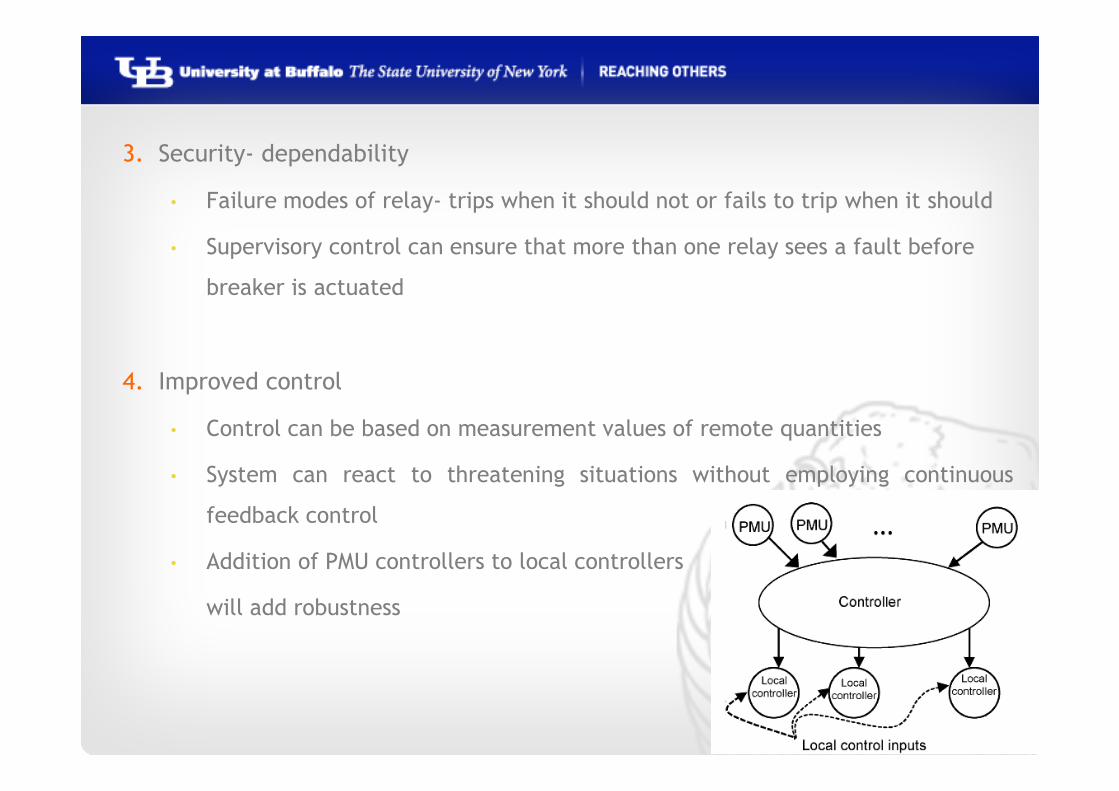
3. Security- dependability
• Failure modes of relay- trips when it should not or fails to trip when it should
• Supervisory control can ensure that more than one relay sees a fault before
breaker is actuated
4. Improved control
• Control can be based on measurement values of remote quantities
• System can react to threatening situations without employing continuous
feedback control
• Addition of PMU controllers to local controllers
will add robustness

5. Loss of Mains (LOM)
• LOM or islanding occurs when a part of utility with atleast one
distributed generator is separated from the system
• Phase angle variation from the grid supply substation and
distributed generators rarely exceeds 5o

• Simulated network shown with following scenarios applied:
I. Islanding events with active power imbalance of 1%, 2%, 3%, 10%, 20%
between DG output and local demand.
II. Three phase faults at six different locations
III. Load switching, with range of change from 2.7 MW to 25 MW.
• Rate of change of Phase angle (ROCOPA)= (δk - δk-1 )/0.06
degree/sec
Acceleration= (ROCOPAk – ROCOPAk-1 )/0.06 degree/sec2
Time window for calculation is 60 ms
δk is the voltage angle at k
processing interval
δk-1 is the voltage angle 60 ms prior
to k processing interval
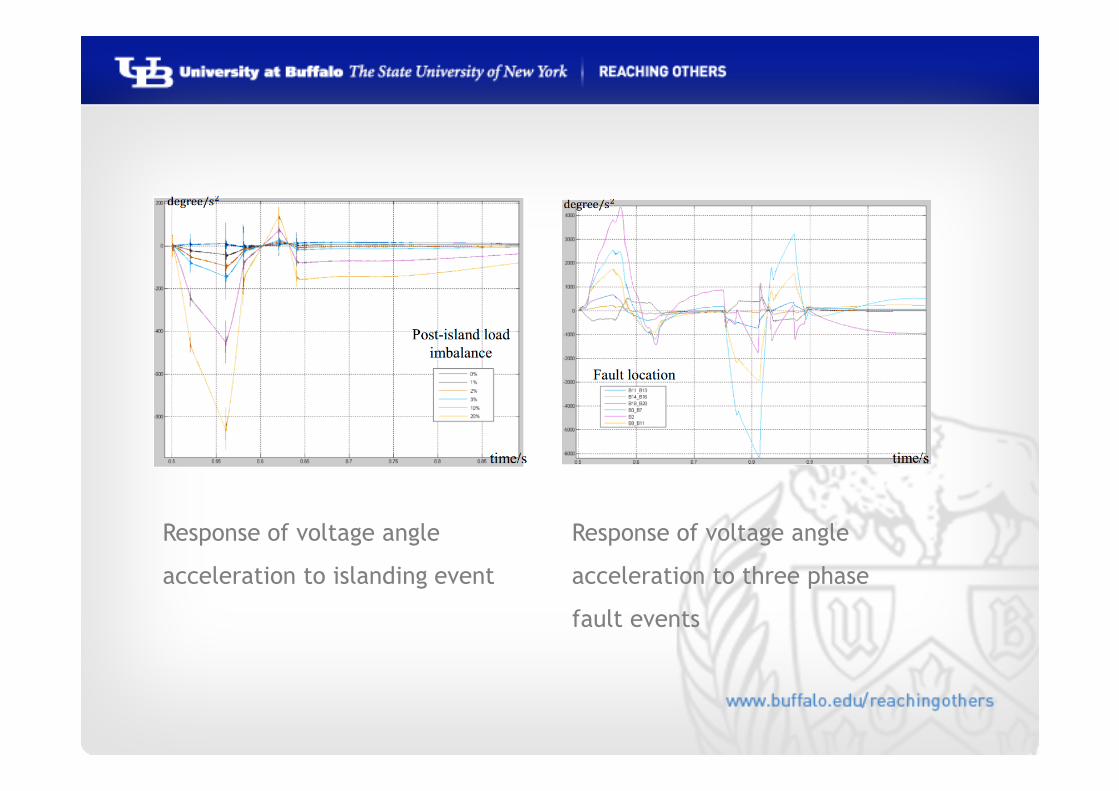
Response of voltage angle
acceleration to islanding event
Response of voltage angle
acceleration to three phase
fault events
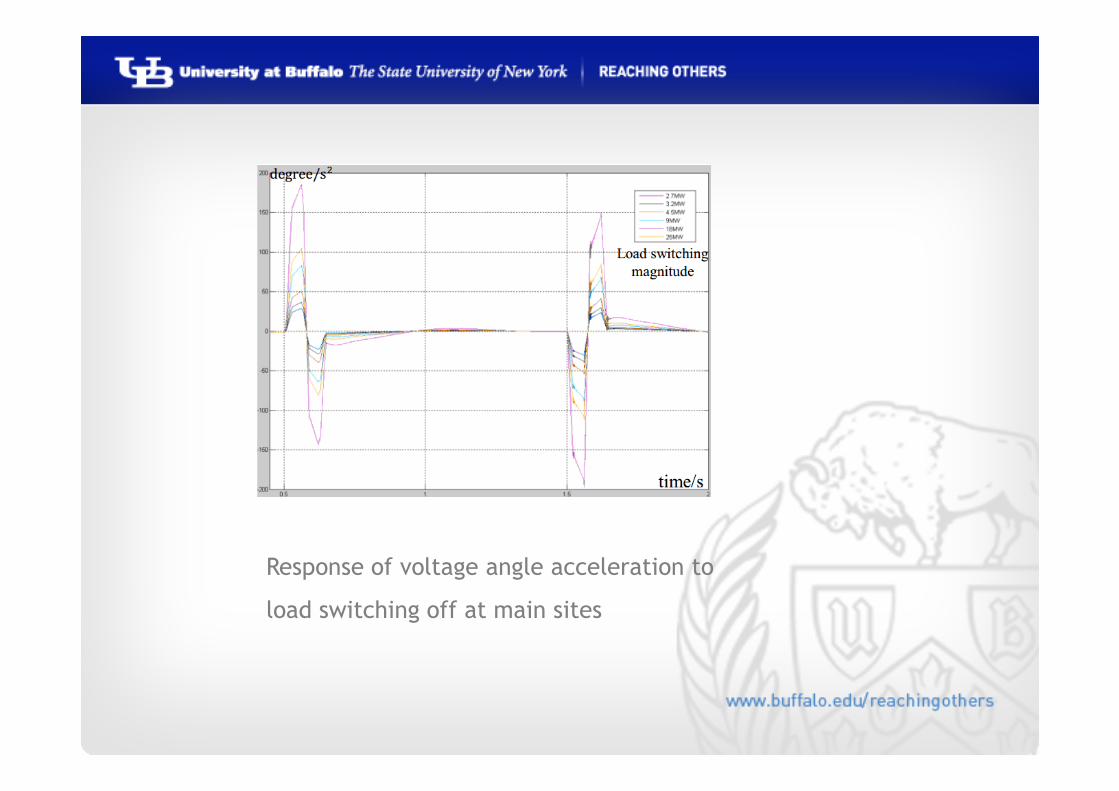
Response of voltage angle acceleration to
load switching off at main sites
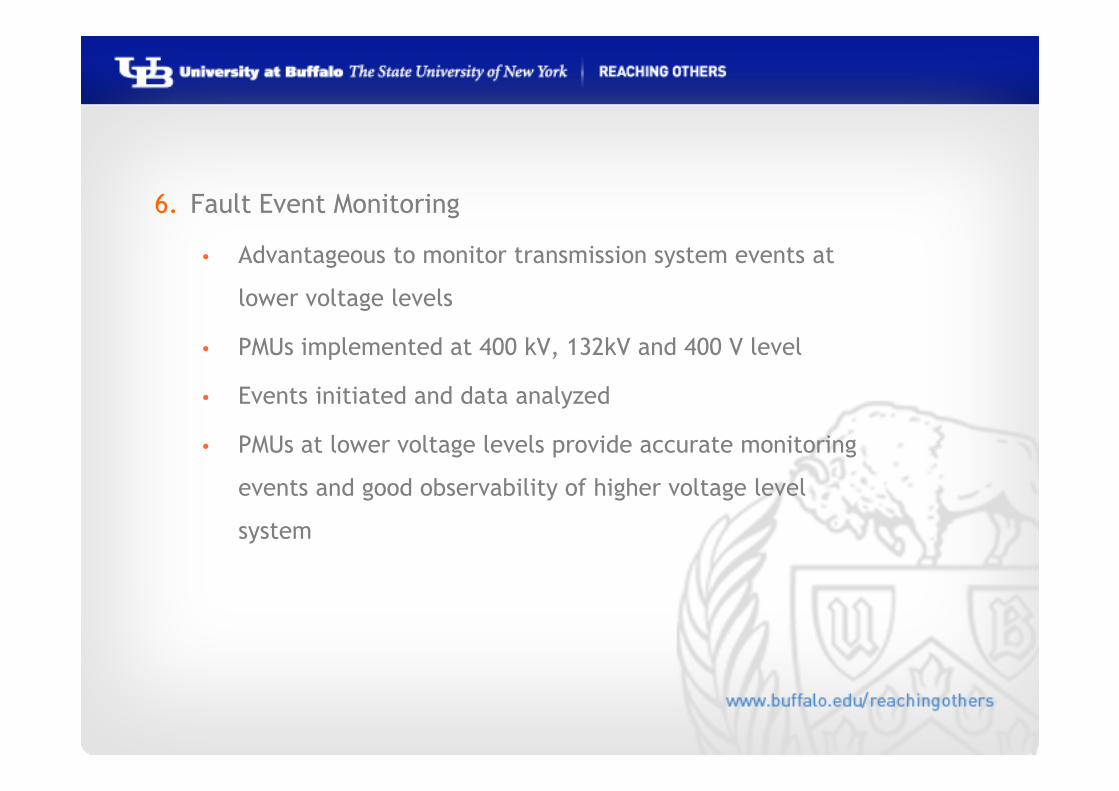
6. Fault Event Monitoring
• Advantageous to monitor transmission system events at
lower voltage levels
• PMUs implemented at 400 kV, 132kV and 400 V level
• Events initiated and data analyzed
• PMUs at lower voltage levels provide accurate monitoring
events and good observability of higher voltage level
system
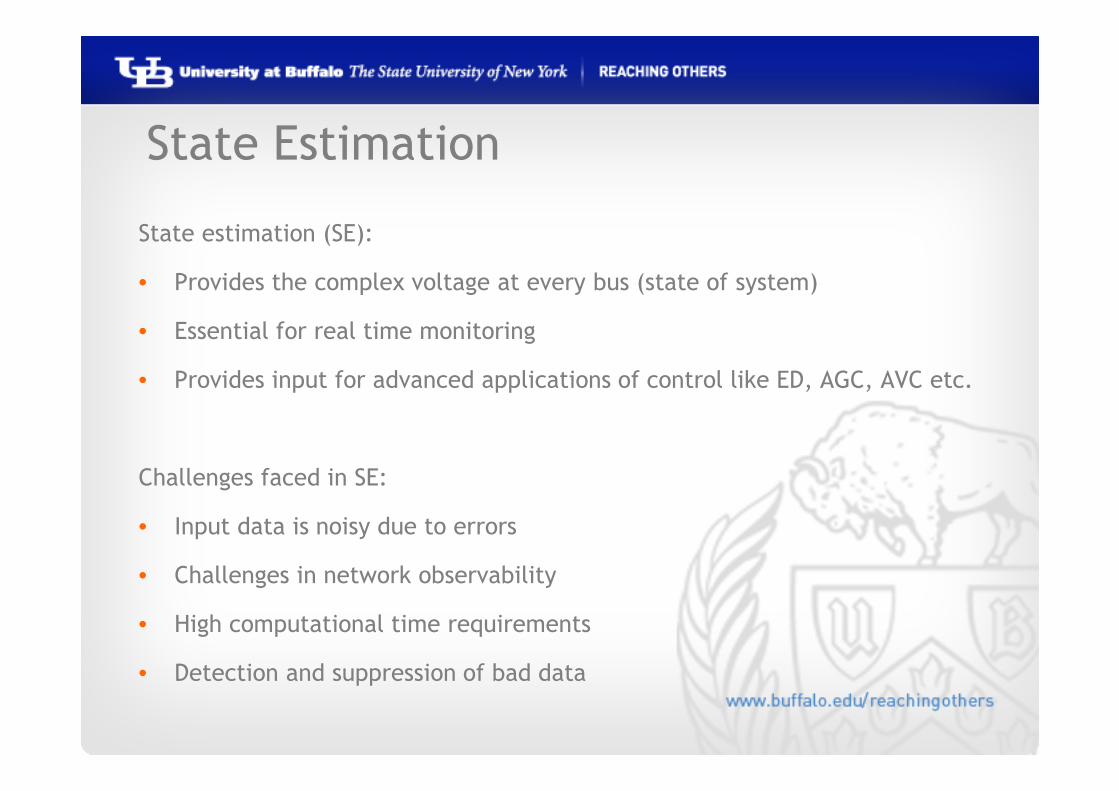
State Estimation
State estimation (SE):
• Provides the complex voltage at every bus (state of system)
• Essential for real time monitoring
• Provides input for advanced applications of control like ED, AGC, AVC etc.
Challenges faced in SE:
• Input data is noisy due to errors
• Challenges in network observability
• High computational time requirements
• Detection and suppression of bad data
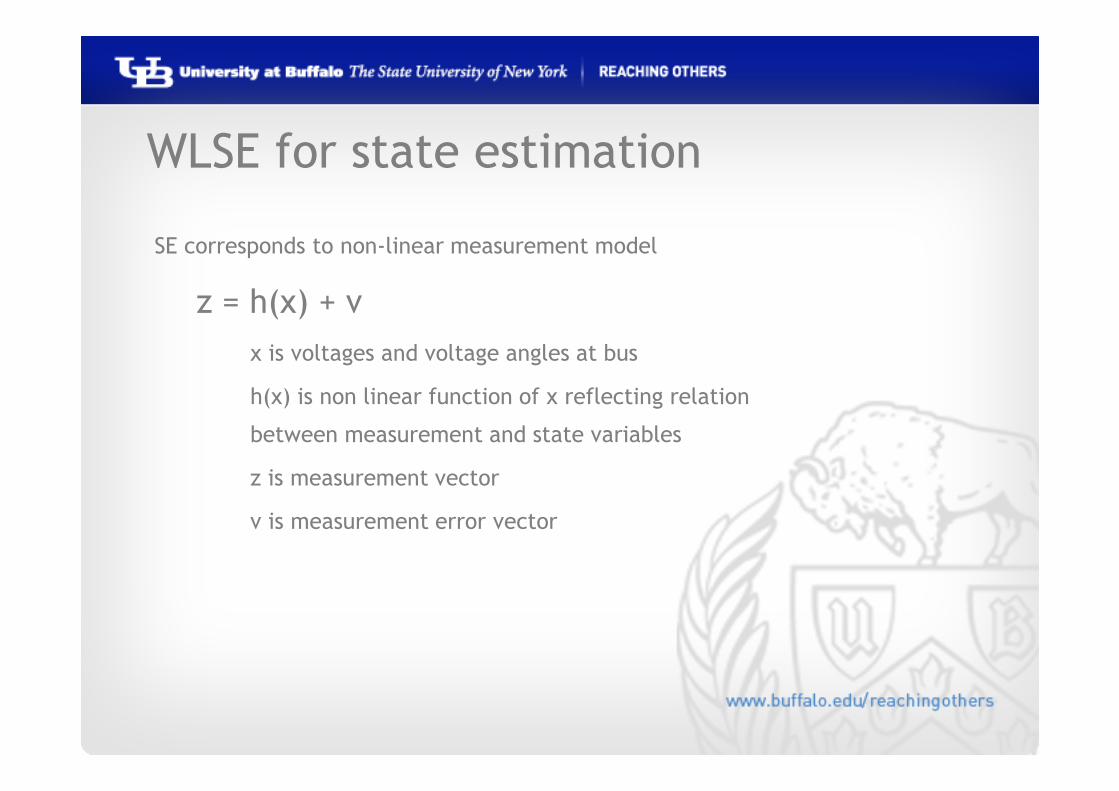
WLSE for state estimation
SE corresponds to non-linear measurement model
z = h(x) + v
x is voltages and voltage angles at bus
h(x) is non linear function of x reflecting relation
between measurement and state variables
z is measurement vector
v is measurement error vector

Objective is to minimize the sum of the squared weighted residuals
between the estimated and actual measurements
J (x) = (z − h(x))T R−1 (z − h(x))
where R−1 is
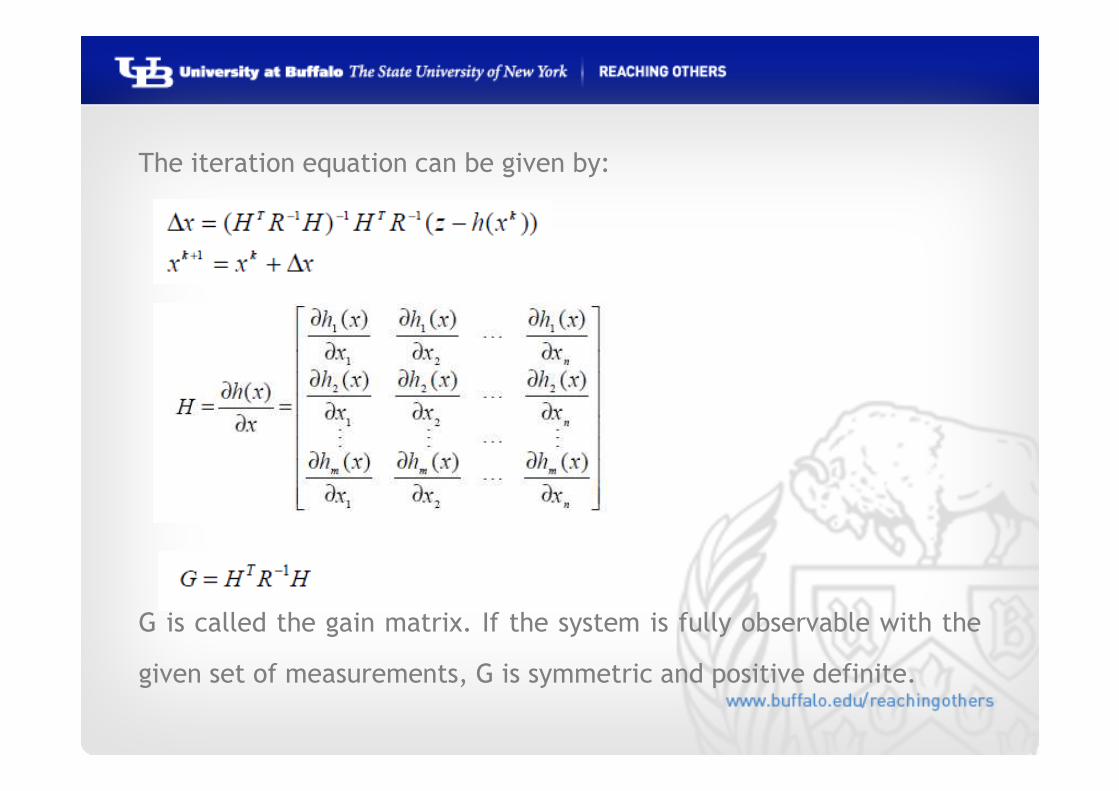
The iteration equation can be given by:
G is called the gain matrix. If the system is fully observable with the
given set of measurements, G is symmetric and positive definite.
SE with SCADA and PMU data
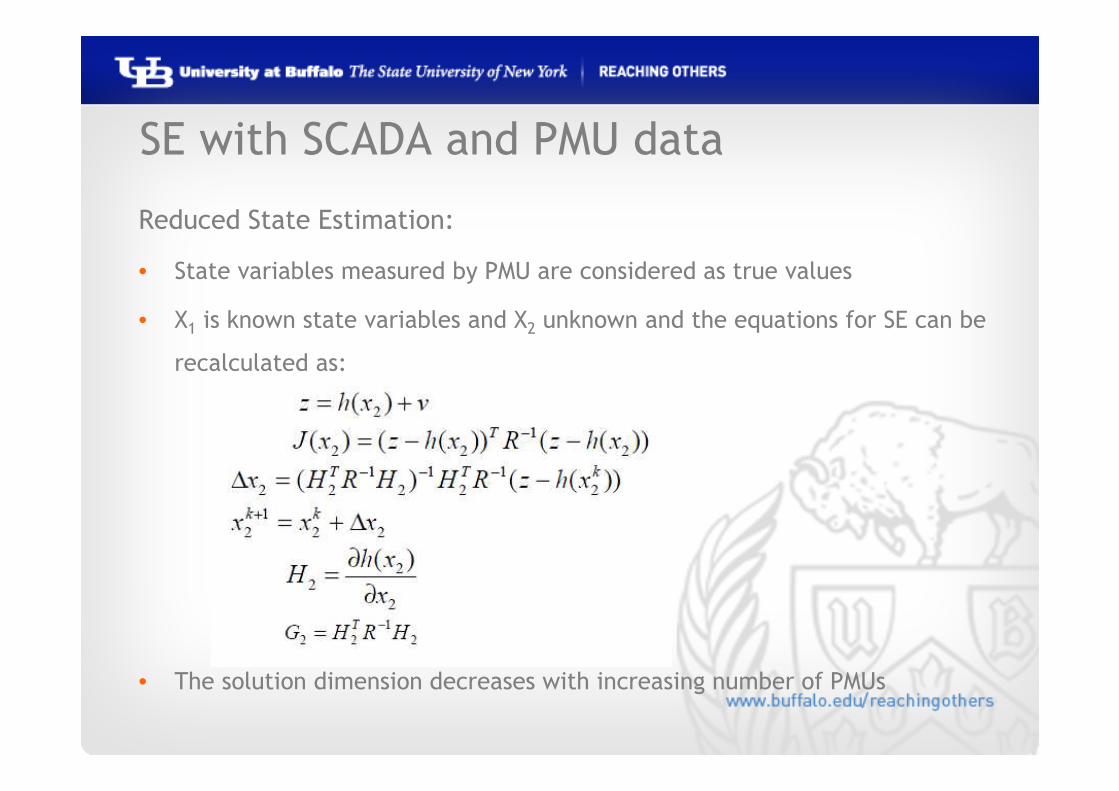
Reduced State Estimation:
• State variables measured by PMU are considered as true values
• X1 is known state variables and X2 unknown and the equations for SE can be
recalculated as:
• The solution dimension decreases with increasing number of PMUs
Local mixed SE
• PMU placement divides system in localized observable islands
• Localized SE can be processed based on WLS method
• PMU and SCADA measurements are mixed for correction of data from PMU
• Local estimator is ignored if PMU data is accurate
Coordination SE
• Take local SE of islands and get corrected values of local state variables x1
(not carried out when PMU data reliable)
• x1 used as initial value i.e. x1 is true value
• Reduced SE performed to find x2
• Calculation ends when difference between estimated state variables is
within threshold limit

Effect of PMU integration on
Observability
• For N bus system: dimension of G is (2N − 1)× (2N − 1)
• NA PMUs introduced: dimension of G is (2N − 1 − 2NA) × (2N − 1 − 2NA)
• Addition of PMU makes numerical analysis easier and faster
• If all buses are replaced with PMUs, state observability will disappear
Algorithm of State Estimation
• If data from PMU is accurate, it is considered as true value
• If not, mixed state estimation performed
• In any case, conventional WLS method can be used without any modification
Recognition of bad data
• The largest normalized residual method is used
• The normalized residual of i th measurement is defined as ratio between
measurement residual and the residual standard deviation
• The method depends upon measure of redundancy which is K = m/ n
• If NA PMUs placed in N bus system, redundancy is raised to
K = m/ (2N – 1 – 2NA)
Dynamic state estimation
• Proposed in 1970’s based on Kallman filtering
• Application unsuccessful because of big estimation size and calculation time
• May benefit from the reduced calculation time due to integration of PMU
Effect of PMU integration on
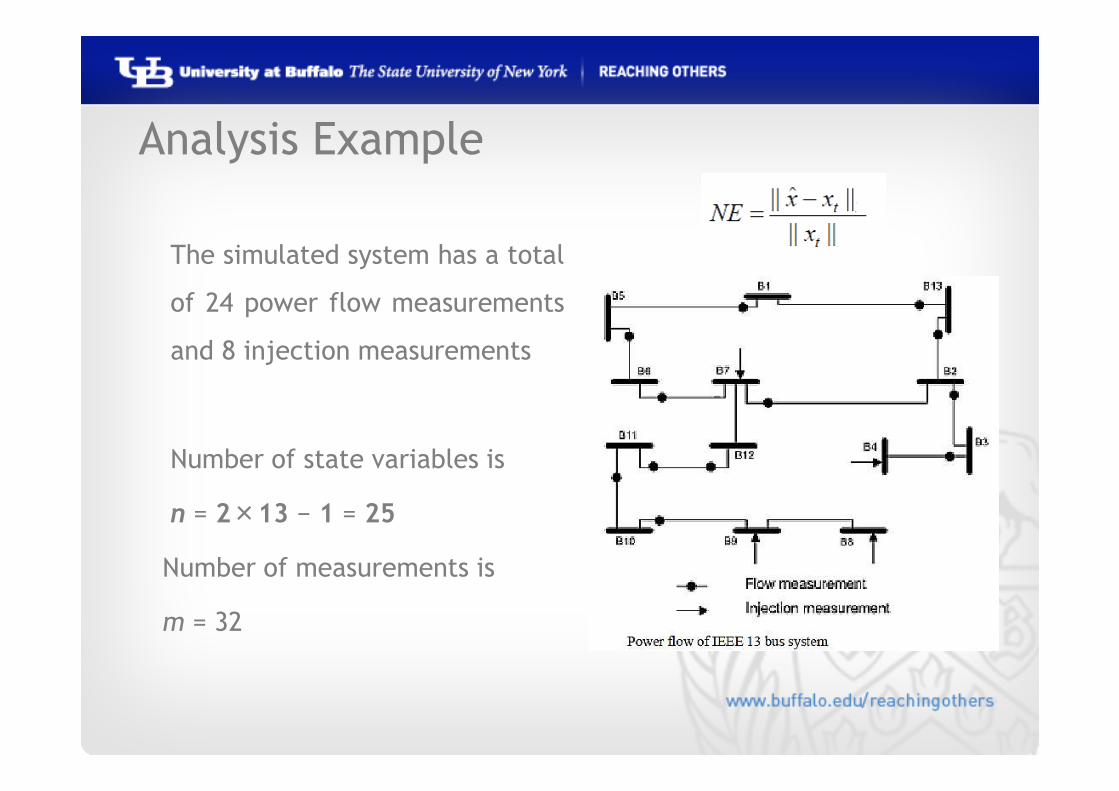
The simulated system has a total
of 24 power flow measurements
and 8 injection measurements
Number of state variables is
n = 2×13 − 1 = 25
Number of measurements is
m = 32
Analysis Example

Case I: A system which is
observable and no bad
data occurs
Case II: A system which is
observable as well as one
bad data P27
Case III: A system which is
observable but at lower
measurement redundancy
level
References
[1] F. Ding and C. Booth, "Protection and stability assessment in future
distribution networks using PMUs," in Developments in Power Systems
Protection, 2012. DPSP 2012. 11th International Conference on, 2012, pp.
1-6.
[2] J. De La Ree, V. Centeno, J. S. Thorp, and A. G. Phadke, "Synchronized
phasor measurement applications in power systems," Smart Grid, IEEE
Transactions on, vol. 1, pp. 20-27, 2010.
[3] F. Chen, X. Han, Z. Pan, and L. Han, "State estimation model and
algorithm including pmu," in Electric Utility Deregulation and Restructuring
and Power Technologies, 2008. DRPT 2008. Third International Conference
on, 2008, pp. 1097-1102.

Questions ?

Thank you