Embed Size (px)
Citation preview

REPORT
Ambient Air Quality Monitoring (AAQM) Report January 2019 West Gate Tunnel Project
Submitted to:
Mr Tim Spawton CPB JH Joint Venture West Gate Tunnel Project Level 11, 5 Bowen Crescent Melbourne VIC 3004
Submitted by:
Golder Building 7, Botanicca Corporate Park 570 – 588 Swan Street Richmond, Victoria 3121
Australia
+61 3 8862 3500
1789878-006-R-Rev0
March 2019
Accreditation No. 1910
Accredited for compliance with ISO/IEC 17025 - Testing.
The results of the tests, calibrations and/or measurements included in
this document are traceable to Australian / national standards.

March 2019 1789878-006-R-Rev0
i
Record of Issue
Company Client Contact Version Date Issued Method of Delivery
CPB JH WGT Project
Tim Spawton Rev 0 1/03/2019 Electronic
Distribution List 1 electronic copy - CPB JH Joint Venture
1 electronic copy - Golder Associates Pty Ltd

March 2019 1789878-006-R-Rev0
ii
Executive Summary
Air quality monitoring for the West Gate Tunnel Project has been specifically established to develop a “baseline”
of data from current local conditions. This baseline will be used to measure any changes once the tunnel opens
in 2022. When the project opens, air quality monitoring will continue for up to 5 years.
The results of the West Gate Tunnel Project Ambient Air Quality Monitoring (AAQM) program for the period of
1 January 2019 to 31 January 2019 are presented below.
The following tables present the maximum measured concentration for each parameter at Stations 1, 2, 3, 4, 5
and 6 during the reporting period. The maximum concentration for each parameter is compared with the
respective criteria.
Station 1 Summary January 2019
Parameter Units Averaging period Maximum concentration Air quality objectiveA
Exceedances
PM2.5 ug/m3 24 hour 20 25 Nil
PM10 ug/m3 24 hour 56 50 2
Note: A - SEPP(AAQ) objective
Station 2, Station 3, Station 5 and Station 6 Summary January 2019
Parameter Units Averaging period
Maximum concentration Air quality objectiveA
Exceedances Station 2 Station 3 Station 5 Station 6
PM2.5 ug/m3 24 hour 19 18 18 20 36 Nil
PM10 ug/m3 24 hour 57 56 59 88 60 1
Note: A - SEPP(AQM) Intervention level Station 4 Summary January 2019
Parameter Units Averaging period Maximum concentration Air quality objective
Exceedances
PM2.5 ug/m3 24 hour 26 36A Nil
PM10 ug/m3 24 hour 116 60A 9
NO2 ppb 1 hour 58 140A Nil
CO ppm 1 hour 1.0 29A Nil
Benzene ppb 24 hour 0.7 3.0B Nil
Toluene ppb 24 hour 1.6 1000B Nil
Total xylene isomers ppb 24 hour 1.9 250B Nil
Note: A - SEPP(AQM) Intervention level B - Air NEPM Monitoring investigation level

March 2019 1789878-006-R-Rev0
iii
Results for the January 2019 ambient air quality monitoring programme were less than the respective air quality
objectives for all parameters measured at stations 2, 3 and 5. Station 1 (Yarraville Gardens) exceeded the PM10
air quality objective on two days (17/01/2019 and 25/01/2019). Station 6 (Millers Road) exceeded the PM10 air
quality objective on one day (25/01/2019).
Station 4 (Primula Avenue) exceeded the PM10 air quality objective on nine days (11/01/2019, 14/01/2019,
15/01/2019, 16/01/2019, 17/01/2019, 24/01/2019, 25/01/2019, 30/01/2019 and 31/01/2019), all other
parameters monitored at station 4 were less than the respective air quality objectives.
Station 4 is now located in a construction area (Millers Road exit ramp and noise wall relocation) and the
measured PM10 concentrations may not be representative of impacts at the closest residential receptor.

March 2019 1789878-006-R-Rev0
iv
Table of Contents
1.0 INTRODUCTION ............................................................................................................................... 1
2.0 AAQMS DETAILS ............................................................................................................................. 2
2.1 Site locations ......................................................................................................................... 2
2.2 Siting assessment ................................................................................................................. 3
2.3 Equipment specifications ...................................................................................................... 4
3.0 AIR QUALITY CRITERIA.................................................................................................................. 4
SEPP(AAQ) ....................................................................................................................................... 5
SEPP(AQM) ...................................................................................................................................... 5
NEPM (Air Toxics) ............................................................................................................................. 5
4.0 TEST METHODS .............................................................................................................................. 6
4.1 Particulate matter (PM2.5) ...................................................................................................... 6
4.2 Particulate matter (PM10) ....................................................................................................... 6
4.3 Nitrogen dioxide (NO2) .......................................................................................................... 6
4.4 Carbon monoxide (CO) ......................................................................................................... 7
4.5 Volatile organic compounds (BTEX) ..................................................................................... 7
4.6 Meteorological parameters .................................................................................................... 7
5.0 MEASUREMENT UNCERTAINTY ................................................................................................... 7
5.1 PM2.5 ...................................................................................................................................... 7
5.2 PM10 ...................................................................................................................................... 7
5.3 NO2 ........................................................................................................................................ 7
5.4 CO ......................................................................................................................................... 7
5.5 Benzene ................................................................................................................................ 8
5.6 Meteorological parameters .................................................................................................... 8
5.7 Calibration and maintenance ................................................................................................ 9
6.0 RESULTS ........................................................................................................................................ 10
6.1 Particulate matter (BAM PM2.5 & PM10) ............................................................................... 10
6.1.1 Station 1 – Yarraville Gardens ....................................................................................... 10
6.1.2 Station 2 – Francis Street .............................................................................................. 11

March 2019 1789878-006-R-Rev0
v
6.1.3 Station 3 – Railway Reserve .......................................................................................... 12
6.1.4 Station 4 – Primula Avenue ........................................................................................... 13
6.1.5 Station 5 – Donald McLean Reserve ............................................................................. 14
6.1.6 Station 6 – Millers Road ................................................................................................. 15
6.1.7 Combined PM2.5 mass concentrations ........................................................................... 16
6.2 Nitrogen dioxide (NO2) ........................................................................................................ 17
6.3 Carbon monoxide (CO) ....................................................................................................... 18
6.4 Volatile organic compounds (BTEX) ................................................................................... 19
6.5 Meteorological parameters .................................................................................................. 20
6.5.1 Temperature ................................................................................................................... 20
6.5.2 Relative humidity ............................................................................................................ 20
6.5.3 Atmospheric pressure .................................................................................................... 21
6.5.4 Wind speed .................................................................................................................... 22
6.5.5 Wind rose – Station 1 (Yarraville Gardens) ................................................................... 22
6.5.6 Wind rose – Station 2 (Francis Street) ........................................................................... 23
6.5.7 Wind rose – Station 3 (Railway Reserve) ...................................................................... 23
6.5.8 Wind rose – Station 4 (Primula Avenue) ........................................................................ 24
6.5.9 Wind rose – Station 5 (Donald McLean Reserve) ......................................................... 24
7.0 QUALITY ASSURANCE ................................................................................................................. 25
7.1 Data capture ........................................................................................................................ 25
7.2 Data validation..................................................................................................................... 26
8.0 DISCUSSION .................................................................................................................................. 26
9.0 IMPORTANT INFORMATION RELATING TO THIS REPORT ...................................................... 27
TABLES
Station 1 Summary January 2019 .............................................................................................................. ii
Station 2, Station 3, Station 5 and Station 6 Summary January 2019 ....................................................... ii
Station 4 Summary January 2019 .............................................................................................................. ii
Table 1: AAQMS monitoring details .......................................................................................................... 1
Table 2: AAQMS commissioning dates ..................................................................................................... 2
Table 3: Australian standard AAQMS siting criteria compliance ............................................................... 3
Table 4: AAQMS instrumentation .............................................................................................................. 4

March 2019 1789878-006-R-Rev0
vi
Table 5: Air quality indicators and objectives ............................................................................................ 5
Table 6: Meteorological parameters measurement uncertainty ................................................................ 8
Table 7: Calibrations .................................................................................................................................. 9
Table 8: Station 1 (Yarraville Gardens AAQMS) PM2.5 and PM10 percentiles (24 hour average) ........... 10
Table 9: Station 2 (Francis Street AAQMS) PM2.5 and PM10 percentiles (24 hour average) .................. 11
Table 10: Station 3 (Railway Reserve AAQMS) PM2.5 and PM10 percentiles (24 hour average) ............ 12
Table 11: Station 4 (Primula Avenue AAQMS) PM2.5 and PM10 percentiles (24 hour average) ............. 13
Table 12: Station 5 (Donald McLean Reserve AAQMS) PM2.5 and PM10 percentiles (24 hour average) 14
Table 13: Station 6 (Millers Road AAQMS) PM2.5 and PM10 percentiles (24 hour average) ................... 15
Table 14: Station 4 (Primula Avenue AAQMS) NO2 percentiles (1 hour average) ................................. 17
Table 15: Station 4 (Primula Avenue AAQMS) CO percentiles (1 hour average) ................................... 18
Table 16: Station 4 - Primula Avenue AAQMS BTEX concentrations (24 hour average) ....................... 19
Table 17: Data capture ............................................................................................................................ 25
Table 18: Station 1 Summary – January 2019 ........................................................................................ 26
Table 19: Station 2, Station 3, Station 5 and Station 6 Summary – January 2019 ................................. 26
Table 20: Station 4 Summary – January 2019 ........................................................................................ 26
FIGURES
Figure 1: West Gate Tunnel AAQMS site locations .................................................................................. 3
Figure 2: Station 1 PM2.5 and PM10 concentration (24 hour average) – January 2019 ........................... 10
Figure 3: Station 2 PM2.5 and PM10 concentration (24 Hour Average) – January 2019 .......................... 11
Figure 4: Station 3 PM2.5 and PM10 concentration (24 hour average) – January 2019 ........................... 12
Figure 5: Station 4 PM2.5 and PM10 concentration (24 hour average) – January 2019 ........................... 13
Figure 6: Station 5 PM2.5 and PM10 concentration (24 hour average) – January 2019 ........................... 14
Figure 7: Station 6 PM2.5 and PM10 concentration (24 hour average) – January 2019 ........................... 15
Figure 8: Combined PM2.5 concentration (24 hour average) – January 2019 ......................................... 16
Figure 9: Combined PM10 concentration (24 hour average) – January 2019.......................................... 16
Figure 10: Station 4 NO2 concentration (1 hour average) – January 2019 ............................................. 17
Figure 11: Station 4 CO concentration (1 hour average) – January 2019 .............................................. 18
Figure 12: Ambient temperature (1 hour average) All AAQMS – January 2019 ..................................... 20
Figure 13: Relative humidity (1 hour average) All AAQMs – January 2019 ............................................ 21
Figure 14: Atmospheric pressure (1 hour average) Station 4 (Primula Avenue) – January 2019 .......... 21
Figure 15: Wind speed (1 hour average) All AAQMs – January 2019 .................................................... 22
Figure 16: Wind speed (1 hour average) Station 1 Yarraville Gardens AAQMs ..................................... 22
Figure 17: Wind speed (1 hour average) Station 2 Francis Street AAQMs ............................................ 23

March 2019 1789878-006-R-Rev0
vii
Figure 18: Wind speed (1 hour average) Station 3 Railway Reserve AAQMs ........................................ 23
Figure 19: Wind speed (1 hour average) Station 4 Primula Avenue AAQMs ......................................... 24
Figure 20: Wind speed (1 hour average) Station 5 Donald McLean Reserve AAQMs ........................... 24
APPENDICES
APPENDIX A Data Exceptions
APPENDIX B Laboratory Certificates
APPENDIX C Important Information Relating to this Report

March 2019 1789878-006-R-Rev0
1
1.0 INTRODUCTION Air quality monitoring for the West Gate Tunnel Project has been specifically established to develop a
“baseline” of data from current local conditions. This baseline will be used to measure any changes once the
tunnel opens in 2022. When the project opens, air quality monitoring will continue for up to 5 years.
The results of the West Gate Tunnel Project West Gate Tunnel Project Ambient Air Quality Monitoring (AAQM)
program for the period of 1 January 2019 to 31 January 2019 are contained in the following report.
The AAQM program was conducted in accordance with the Environmental Performance Requirement (EPR)
AQP4 for the Project and consists of six AAQM stations (AAQMS) monitoring the following ambient air quality
indicators:
continuous measurement of particulate matter with an equivalent aerodynamic diameter less than 10 microns (PM10)
continuous measurement of particulate matter with an equivalent aerodynamic diameter less than 2.5 microns (PM2.5)
continuous measurement of wind speed and wind direction (Stations 1 to 5).
Additionally, one of the specified AAQMS (Primula Avenue) monitors the following additional air quality
indicators in combination with PM10 and PM2.5:
continuous monitoring of oxides of nitrogen ([NOx] comprising of nitrogen dioxide (NO2) and nitric oxide [NO])
continuous monitoring of carbon monoxide (CO)
one in six day monitoring of benzene, toluene, ethylbenzene and xylene isomers (BTEX)
continuous measurement of atmospheric pressure.
AAQMS Station 1 to Station 6 were installed and commissioned during the period 22/08/2018 to 12/10/2018.
Specific installation dates can be found below in Section 2.1.
Details of the air quality indicators monitored at each AAQMS are provided in Table 1.
Table 1: AAQMS monitoring details
Site name
Location Coordinates Monitoring parameters
Station 1 Barbara Beyer Reserve, 2 Harris Street, Yarraville
-37.812730°S 144.900017°E
PM10 and PM2.5
Ambient temperature, relative humidity, wind speed and wind direction
Station 2 51-53 Francis Street -37.821800°S 144.894383°E
PM10 and PM2.5
Ambient temperature, relative humidity, wind speed and wind direction
Station 3 Railway Lot 64, (part) 15 Goulburn
Street, Yarraville
-37.814063°S 144.891320°E
PM10 and PM2.5
Ambient temperature, relative humidity, wind speed and wind direction
Station 4 44 Primula Avenue, Brooklyn -37.824284°S 144.846425°E
PM10 and PM2.5 NO, NO2, NOx and CO BTEX – one in six day sampling (24 hour average)

March 2019 1789878-006-R-Rev0
2
Site name
Location Coordinates Monitoring parameters
Ambient temperature, relative humidity, atmospheric pressure, wind speed and wind direction
Station 5 Donald McLean Reserve, Spotswood
-37.826442°S 144.882133°E
PM10 and PM2.5
Ambient temperature, relative humidity, wind speed and wind direction
Station 6 44 Millers Road Brooklyn -37.821252°S 144.848878°E
PM10 and PM2.5
Ambient temperature and relative humidity
2.0 AAQMS DETAILS
2.1 Site locations AAQMS Station 1 to Station 5 were installed and commissioned during the period 22/08/2018 to 31/08/2018.
AAQMS Station 6 (Millers Road) was commissioned on 12/10/2018. Meteorological sensors (wind speed and
direction) were installed later due to delays in calibration from the instrument supplier. AAQMS commissioning
dates are provided in Table 2. Figure 1 presents the locations of the AAQMS.
Table 2: AAQMS commissioning dates
Parameter Station 1 Station 2 Station 3 Station 4 Station 5 Station 6
AAQMS 23/08/2018 22/08/2018 22/08/2018 22/08/2018 31/08/2018 12/10/2018
Wind speed & direction 07/09/2018 20/09/2018 14/09/2018 10/09/2018 17/09/2018 23/11/2018A
A - wind sensor is not compliant with siting criteria specified in AS 3580.14

March 2019 1789878-006-R-Rev0
3
Figure 1: West Gate Tunnel AAQMS site locations
2.2 Siting assessment Australian Standard AS/NZS 3580.1.1 “Methods for Sampling and Analysis of Ambient Air – Part 1.1. Guide to
Siting Air Monitoring Equipment” provides general guidance for the siting of ambient air monitoring equipment
and specific siting parameters for individual air pollutants. Table 3 provides a comparison between
recommended criteria contained in the Standard for the parameters monitored at neighbourhood and peak
monitoring stations with actual conditions at each AAQMS.
Table 3: Australian standard AAQMS siting criteria compliance
Station Station
1 Station
2 Station
3 Station
4 Station
5 Station
6
Station type
Nei
gh
bo
urh
oo
d
Pea
k
Pea
k
Pea
k
Pea
k
Pea
k
Inlet height above ground level 1.0 m – 15 m
Clear sky angle 120° (Neighbourhood) - - - - -
Unrestricted 270° airflow around inlet (Neighbourhood) - - - - -
Unrestricted 180° airflow around inlet (Peak) -
Distance to supporting structure ≥ 1 m

March 2019 1789878-006-R-Rev0
4
Station Station
1 Station
2 Station
3 Station
4 Station
5 Station
6
Station type
Nei
gh
bo
urh
oo
d
Pea
k
Pea
k
Pea
k
Pea
k
Pea
k
10 m from drip line of trees A
No extraneous sources nearby B C
Greater than 50 m from road (≤ 10,000 vehicles/day) - - - - -
Greater than 2 m from road (Peak station) -
Note: A Tree drip line is <3 m from sampler inlets and meteorological monitoring equipment B Temporary construction area for Millers Road noise wall and exit ramp relocation works C Residential chimney is <5 m from the sampler inlet.
2.3 Equipment specifications Table 4 provides a list of the monitoring equipment installed at the AAQMS.
Table 4: AAQMS instrumentation
Parameter Equipment item Manufacturer Model
PM2.5 Beta Attenuation Monitor (BAM) Thermo Fisher Scientific Inc. 5014i
PM10 Beta Attenuation Monitor (BAM) Thermo Fisher Scientific Inc. 5014i
Oxides of Nitrogen Chemiluminescence Thermo Fisher Scientific Inc. 42i
Carbon Monoxide Infra-red gas filter correlation Thermo Fisher Scientific Inc. 48i
Temperature Pt100 resistive platinum sensor Thermo Fisher Scientific Inc. 5014i
BTEX Summa canister Restek 6 litre
Relative humidity Capacitive thin film sensor Thermo Fisher Scientific Inc. 5014i
Atmospheric Pressure Beta Attenuation Monitor (BAM) Thermo Fisher Scientific Inc. 5014i
Wind speed and wind direction
Ultrasonic anemometer RM Young Model 86000
3.0 AIR QUALITY CRITERIA The ambient air quality criteria applicable to the West Gate Tunnel Project are derived from the following
legislation:
State Environment Protection Policy (Ambient Air Quality) [SEPP(AAQ)]
State Environment Protection Policy (Air Quality Management) [SEPP(AQM)].
National Environment Protection (Air Toxics) Measure Monitoring Investigation Levels (MILs)

March 2019 1789878-006-R-Rev0
5
SEPP(AAQ)
The SEPP(AAQ) adopts the requirements of the National Environment Protection (Ambient Air Quality) Measure
(Air NEPM) and its environmental quality objectives (EQOs) for CO, NO2, and particles (as PM10 and PM2.5).
The SEPP(AAQ) EQOs apply to air quality within a region or sub-region considered to be representative of
exposure of the general population in Victoria. These objectives have been adopted for the purposes of
comparison with results from background/ neighbourhood monitoring stations for the West Gate Tunnel Project
and are relevant to Station 1 (Yarraville Gardens).
SEPP(AQM)
The SEPP(AQM) sets out legislative requirements for managing and assessing air emissions in Victoria. The
aim of the SEPP(AQM) is to ensure that prescribed air quality objectives are met and protect the beneficial uses
of the air environment. Schedule B lists intervention levels which are used in the assessment of local or
neighbourhood air monitoring data. Consistent with assessment of impacts described in the Environment Effects
Statement for the West Gate Tunnel Project, the intervention levels have been adopted for purposes of
comparison with results from peak monitoring stations for the West Gate Tunnel Project and are applicable to
Station 2 (Francis Street), Station 3 (Railway Reserve), Station 4 (Primula Avenue), Station 5 (Donald McLean
Reserve) and Station 6 (Millers Road).
NEPM (Air Toxics)
The aim of the Air Toxics NEPM is to gain a greater understanding of the levels of air toxics at specific locations
where elevated concentrations are likely to occur and where the potential for significant human exposure exists.
The Air Toxics NEPM established monitoring investigation levels (MILs) relevant for the West Gate Tunnel Project
for benzene, toluene and xylene isomers. The MILs are used purposes of comparison with results from the air
toxics monitored at Station 4 (Primula Avenue).
Table 5 presents the air quality indicators and objectives for each AAQMS for the West Gate Tunnel Project.
Table 5: Air quality indicators and objectives
Location Pollutant Units Air Quality Objective
Averaging period
Station 1
PM10
µg/m3
50 24 hour
20 Annual
PM2.5 25 24 hour
8 Annual
Station 2 Station 3 Station 4 Station 5 Station 6
PM10
µg/m3
60
24 hour
PM2.5 36

March 2019 1789878-006-R-Rev0
6
Location Pollutant Units Air Quality Objective
Averaging period
Station 4
CO ppm 29 1 hour
NO2 ppb 140 1 hour
Benzene ppb 3 Annual
Toluene ppb 1000 24 hour
100 Annual
Ethylbenzene ppb NA 24 hour
Xylene isomers ppb 250 24 hour
200 Annual
4.0 TEST METHODS
4.1 Particulate matter (PM2.5) PM2.5 concentrations are determined using a Beta Attenuation Monitor (BAM).
Suspended particulate matter in ambient air is measured using the attenuation of beta rays as a surrogate for
continuous mass determination. Beta rays are high energy electrons generated from the radioactive decay of
the radon isotope Rn-222. When contacting particulate matter beta rays are either absorbed or their energy
level is diminished. The relationship between the attenuation of beta rays between the source and detector is
used to determine the mass density.
The BAM is equipped with a flow control and measurement system. The flow control system volumetrically
controls the flowrate to 16.7 l/min. The flowrate is used with the mass density to calculate the particulate matter
concentration.
The sampler is fitted with a size selective inlet, which separates particles with an equivalent aerodynamic
diameter greater than 10 microns from the sample stream. An in-line PM2.5 particle size separator is also fitted
to further separate particles; only those with an equivalent aerodynamic diameter less than 2.5 microns can
pass through the particle size separator to the filter for mass determination.
The PM2.5 monitoring method is based on the requirements contained within Australian Standard
AS/NZS 3580.9.12 “Methods for Sampling and Analysis of Ambient Air – Method 9.12: Determination of
Suspended Particulate Matter – PM2.5 Beta Attenuation Monitors” (NATA Laboratory Accreditation No. 1910).
4.2 Particulate matter (PM10) PM10 concentrations are determined using a continuous BAM without an in-line PM2.5 particle size separator.
All other measurement processes remain the same as for the PM2.5 test method.
The PM10 monitoring method is based on the requirements contained within Australian Standard
AS/NZS 3580.9.11:2016 “Methods for Sampling and Analysis of Ambient Air – Method 9.11: Determination of
Suspended Particulate Matter – PM10 Beta Attenuation Monitors” (NATA Laboratory Accreditation No. 1910).
4.3 Nitrogen dioxide (NO2) Oxides of nitrogen concentrations were determined using a 42i Thermo Scientific chemiluminescence gas
analyser.

March 2019 1789878-006-R-Rev0
7
Automatic calibrations are carried out daily against a NATA certified reference gas mixture. Manual calibrations
are conducted at one month intervals.
The oxides of nitrogen (NO, NO2 and NOx) monitoring method is based on the requirements of Australian
Standard AS 3580.5.1, “Determination of Oxides of Nitrogen – Chemiluminescence Method”.
4.4 Carbon monoxide (CO) Carbon monoxide concentrations are determined using a 48i Thermo Scientific infra-red gas filter correlation
analyser.
Automatic calibrations are carried out daily against a NATA certified reference gas mixture. Manual calibrations
are conducted at one month intervals.
The carbon monoxide monitoring method is based on the requirements of Australian Standard AS 3580.7.1,
“Determination of Carbon Monoxide – Direct Reading Instrumental Method”.
4.5 Volatile organic compounds (BTEX) A sample is collected in an evacuated electro-polished and passivated stainless steel canister. Analysis involves
separation by gas chromatography (GC) and measurement by mass selective (MS) detector.
The procedure for sampling Volatile Organic Compounds (VOCs) using evacuated canisters, and for the
subsequent analysis, is described in USEPA Method TO-15 ”Determination of Volatile Organic Compounds
(VOCs) in air collected in specially-prepared canisters and analysed by Gas Chromatography/Mass
Spectrometry (GC/MS)”.
Samples were analysed by Queensland Health (NATA Laboratory Accreditation No. 41) based on USEPA
method TO-15. The test method used was in accordance with Golder Source Test Method C9, "Canister
(Evacuated) Sampling for VOC: In Ambient Air and Source Emissions".
4.6 Meteorological parameters Monitoring of meteorological parameters; wind speed/direction, temperature, relative humidity and atmospheric
pressure was conducted in accordance with Australian Standard AS 3580.14 “Methods for Sampling and
Analysis of Ambient Air – Part 14: Meteorological Monitoring for Ambient Air Quality Monitoring Applications”
(NATA Laboratory Accreditation No. 1910).
5.0 MEASUREMENT UNCERTAINTY
5.1 PM2.5 The measurement uncertainty for PM2.5 by BAM is published by Thermo-Fisher as ±2 µg/m3 (24 hour average).
5.2 PM10 The measurement uncertainty for PM2.5 by BAM is published by Thermo-Fisher as ±2 µg/m3 (24 hour average).
5.3 NO2 The measurement uncertainty for NO, NO2 and NOx by Chemiluminescence is published in AS3580.5.1 as
±10% (24 hour average).
5.4 CO The measurement uncertainty for CO by Infra-red gas filter correlation is published in AS3580.7.1 as ±10% (24
hour average).
March 2019 1789878-006-R-Rev0
8
5.5 Benzene USEPA Method TO-15 cites the accuracy and precision for two ambient air quality studies conducted in the
United States of America. The average replicate precision for a range of 16 compounds in both studies was
15%. Replicate precision was defined as the ratio of the average difference between replicates to the average
value of replicates.
The reported accuracies for both studies ranged between ± 4 % and ± 31%. The average accuracy for both
studies for the range of 16 compounds was ± 11%. Accuracy is defined as the ratio of the difference between
expected and observed audit results to the expected audit result.
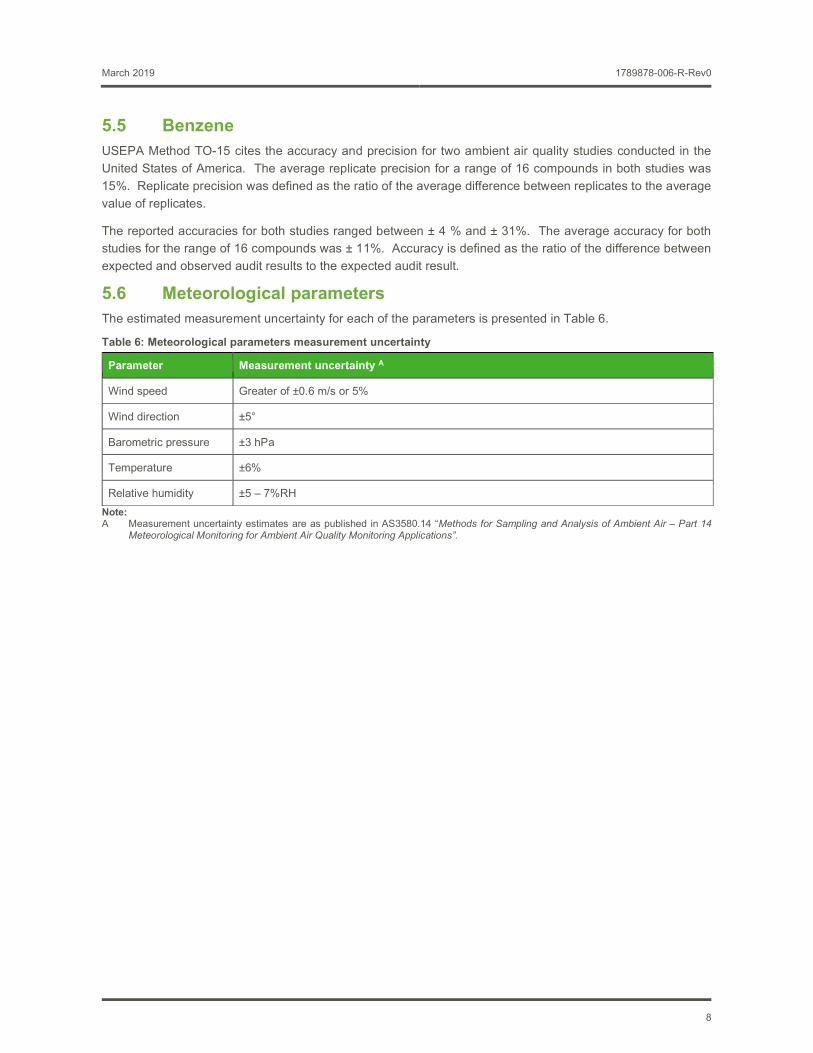
5.6 Meteorological parameters The estimated measurement uncertainty for each of the parameters is presented in Table 6.
Table 6: Meteorological parameters measurement uncertainty
Note: A Measurement uncertainty estimates are as published in AS3580.14 “Methods for Sampling and Analysis of Ambient Air – Part 14
Meteorological Monitoring for Ambient Air Quality Monitoring Applications”.
Parameter Measurement uncertainty A
Wind speed Greater of ±0.6 m/s or 5%
Wind direction ±5°
Barometric pressure ±3 hPa
Temperature ±6%
Relative humidity ±5 – 7%RH

March 2019 1789878-006-R-Rev0
9
5.7 Calibration and maintenance Sample flow rate calibration was conducted on a monthly basis using a NATA calibrated primary standard
flowmeter. Calibration details for the reporting period are presented in Table 7.
Table 7: Calibrations
Location Parameter Last Calibration Date Calibration Type
Station 1 PM10 30/01/2019 Monthly
PM2.5 30/01/2019 Monthly
Wind speed and direction 9/08/2018 Two yearly
Station 2 PM10 30/01/2019 Monthly
PM2.5 30/01/2019 Monthly
Wind speed and direction 7/08/2018 Two yearly
Station 3 PM10 30/01/2019 Monthly
PM2.5 30/01/2019 Monthly
Wind speed and direction 10/08/2018 Two yearly
Station 4 PM10 31/01/2019 Monthly
PM2.5 31/01/2019 Monthly
NO/ NO2 / NOx 31/01/2019 Monthly
CO 31/01/2019 Monthly
BTEX NA Flow-controllers and canisters
certified by lab
Wind speed and direction 7/08/2018 Two yearly
Station 5 PM10 31/01/2019 Monthly
PM2.5 31/01/2019 Monthly
Wind speed and direction 10/08/2018 Two yearly
Station 6 PM10 31/01/2019 Monthly
PM2.5 31/01/2019 Monthly

March 2019 1789878-006-R-Rev0
10
6.0 RESULTS The monitoring results for 1 January 2019 to 31 January 2019 are presented in the following sections.
6.1 Particulate matter (BAM PM2.5 & PM10) PM2.5 and PM10 were continuously monitored and 5-minute averages logged. The 5-minute average data was
transformed to 24 hour averages for reporting.
PM2.5 and PM10 concentration statistics from the reporting period for Station 1 to Station 6 are presented in
Table 8 to Table 13. The 24 hour average plots for Station 1 to Station 6 are presented in Figure 2 to Figure 7.
6.1.1 Station 1 – Yarraville Gardens Table 8: Station 1 (Yarraville Gardens AAQMS) PM2.5 and PM10 percentiles (24 hour average)
Parameter Concentration (µg/m3)A
Air quality objectiveB
Maximum 99th 98th 95th 90th 75th 50th (µg/m3)
PM2.5 20 19 19 18 13 12 10 25
PM10 56 56 55 51 46 32 26 50
Note: A Micrograms per cubic metre at 0°C and 101.3 kPa B SEPP(AAQ) Objective
.
Figure 2: Station 1 PM2.5 and PM10 concentration (24 hour average) – January 2019

March 2019 1789878-006-R-Rev0
11
6.1.2 Station 2 – Francis Street Table 9: Station 2 (Francis Street AAQMS) PM2.5 and PM10 percentiles (24 hour average)
Parameter Concentration (µg/m3)A
Air quality objectiveB
Maximum 99th 98th 95th 90th 75th 50th (µg/m3)
PM2.5 19 19 18 18 17 13 10 36
PM10 57 55 53 50 41 32 24 60
Note: A Micrograms per cubic metre at 0°C and 101.3 kPa B SEPP(AQM) Intervention level
Figure 3: Station 2 PM2.5 and PM10 concentration (24 Hour Average) – January 2019

March 2019 1789878-006-R-Rev0
12
6.1.3 Station 3 – Railway Reserve Table 10: Station 3 (Railway Reserve AAQMS) PM2.5 and PM10 percentiles (24 hour average)
Parameter Concentration (µg/m3)A
Air quality objectiveB
Maximum 99th 98th 95th 90th 75th 50th (µg/m3)
PM2.5 18 18 17 16 13 12 8.8 36
PM10 56 53 50 43 41 29 25 60
Note: A Micrograms per cubic metre at 0°C and 101.3 kPa B SEPP(AQM) Intervention level
Figure 4: Station 3 PM2.5 and PM10 concentration (24 hour average) – January 2019

March 2019 1789878-006-R-Rev0
13
6.1.4 Station 4 – Primula Avenue Table 11: Station 4 (Primula Avenue AAQMS) PM2.5 and PM10 percentiles (24 hour average)
Parameter Concentration (µg/m3)A
Air quality objectiveB
Maximum 99th 98th 95th 90th 75th 50th (µg/m3)
PM2.5 26 25 23 21 17 15 9.2 36
PM10 116 116 115 98 80 61 34 60
Note: A Micrograms per cubic metre at 0°C and 101.3 kPa B SEPP(AQM) Intervention level
Figure 5: Station 4 PM2.5 and PM10 concentration (24 hour average) – January 2019

March 2019 1789878-006-R-Rev0
14
6.1.5 Station 5 – Donald McLean Reserve Table 12: Station 5 (Donald McLean Reserve AAQMS) PM2.5 and PM10 percentiles (24 hour average)
Parameter Concentration (µg/m3)A
Air quality objectiveB
Maximum 99th 98th 95th 90th 75th 50th (µg/m3)
PM2.5 18 18 17 17 14 12 8.8 36
PM10 59 55 51 45 39 32 24 60
Note: A Micrograms per cubic metre at 0°C and 101.3 kPa B SEPP(AQM) Intervention level
Figure 6: Station 5 PM2.5 and PM10 concentration (24 hour average) – January 2019

March 2019 1789878-006-R-Rev0
15
6.1.6 Station 6 – Millers Road Table 13: Station 6 (Millers Road AAQMS) PM2.5 and PM10 percentiles (24 hour average)
Parameter Concentration (µg/m3)A
Air quality objectiveB
Maximum 99th 98th 95th 90th 75th 50th (µg/m3)
PM2.5 20 19 18 16 15 13 9.6 36
PM10 88 78 69 53 48 37 26 60
Note: A Micrograms per cubic metre at 0°C and 101.3 kPa B SEPP(AQM) Intervention level
Figure 7: Station 6 PM2.5 and PM10 concentration (24 hour average) – January 2019

March 2019 1789878-006-R-Rev0
16
6.1.7 Combined PM2.5 mass concentrations
Combined plots of the AAQMS PM2.5 and PM10 are presented in Figure 8 and Figure 9 respectively.
Figure 8: Combined PM2.5 concentration (24 hour average) – January 2019
Figure 9: Combined PM10 concentration (24 hour average) – January 2019
March 2019 1789878-006-R-Rev0
17
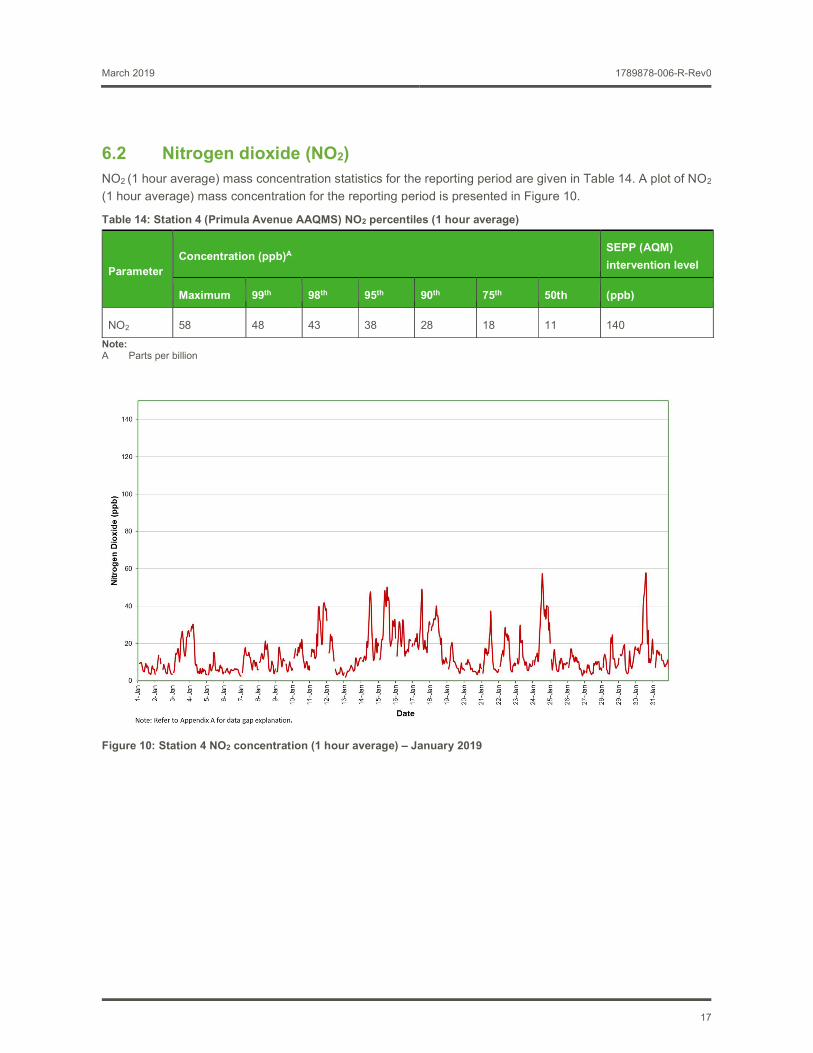
6.2 Nitrogen dioxide (NO2) NO2 (1 hour average) mass concentration statistics for the reporting period are given in Table 14. A plot of NO2
(1 hour average) mass concentration for the reporting period is presented in Figure 10.
Table 14: Station 4 (Primula Avenue AAQMS) NO2 percentiles (1 hour average)
Parameter Concentration (ppb)A
SEPP (AQM)
intervention level
Maximum 99th 98th 95th 90th 75th 50th (ppb)
NO2 58 48 43 38 28 18 11 140
Note: A Parts per billion
Figure 10: Station 4 NO2 concentration (1 hour average) – January 2019
March 2019 1789878-006-R-Rev0
18
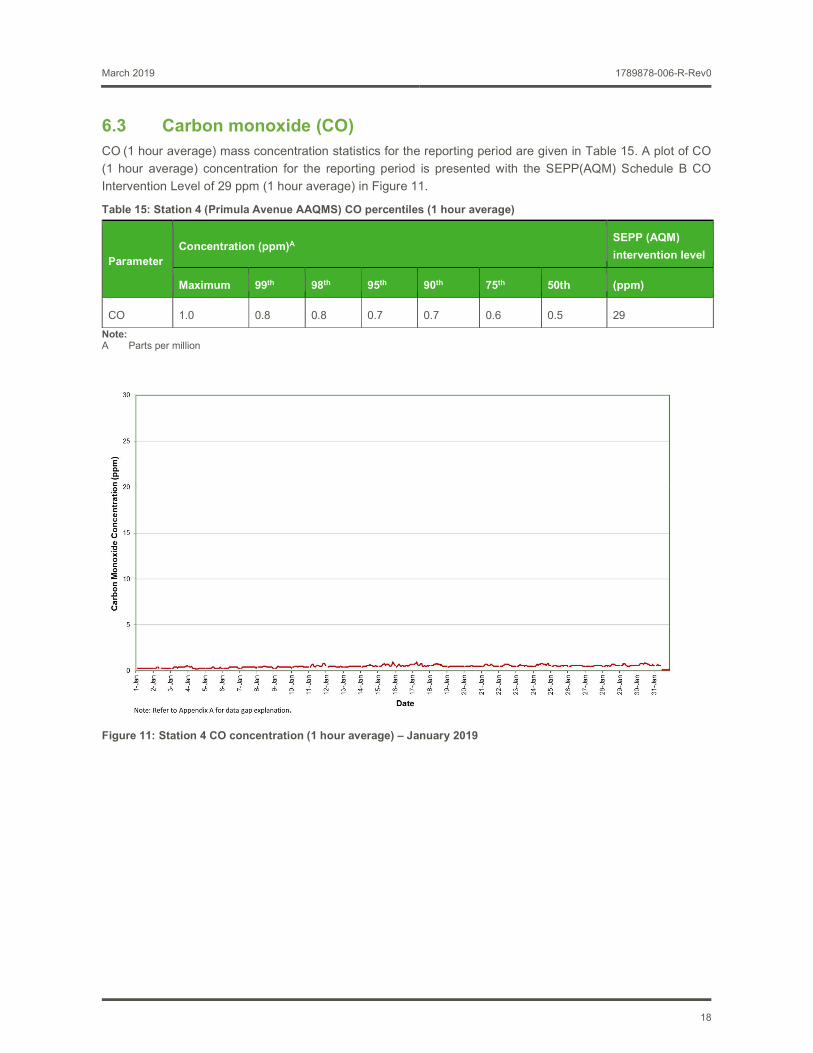
6.3 Carbon monoxide (CO) CO (1 hour average) mass concentration statistics for the reporting period are given in Table 15. A plot of CO
(1 hour average) concentration for the reporting period is presented with the SEPP(AQM) Schedule B CO
Intervention Level of 29 ppm (1 hour average) in Figure 11.
Table 15: Station 4 (Primula Avenue AAQMS) CO percentiles (1 hour average)
Parameter Concentration (ppm)A
SEPP (AQM)
intervention level
Maximum 99th 98th 95th 90th 75th 50th (ppm)
CO 1.0 0.8 0.8 0.7 0.7 0.6 0.5 29
Note: A Parts per million
Figure 11: Station 4 CO concentration (1 hour average) – January 2019

March 2019 1789878-006-R-Rev0
19
6.4 Volatile organic compounds (BTEX) VOC samples were collected from Station 4 (Primula Avenue), in an evacuated electro-polished and passivated
stainless steel canister. Analysis involves separation by gas chromatography (GC) and measurement by mass
selective (MS) detector.
The procedure for sampling Volatile Organic Compounds (VOCs) using evacuated canisters, and for the
subsequent analysis, is described in USEPA Method TO-15 ”Determination of Volatile Organic Compounds
(VOCs) in air collected in specially-prepared canisters and analysed by Gas Chromatography/Mass
Spectrometry (GC/MS)”.
Samples were analysed by Queensland Health (NATA Laboratory Accreditation No. 41) based on USEPA
method TO-15 (Laboratory Report Nos. SSP63190 and SSP63398).
The test method used was in accordance with Golder Source Test Method C9, "Canister (Evacuated) Sampling
for VOC: In Ambient Air and Source Emissions".
BTEX (24 hour average) concentration statistics for the reporting period are given in Table 16. Laboratory
certificates are presented in Appendix B.
Table 16: Station 4 - Primula Avenue AAQMS BTEX concentrations (24 hour average)
Note: A National Environment Protection Measure (Air Toxics) Monitoring Investigation Level B Annual average Sample analysis conducted by Queensland Health, NATA Accreditation No. 41
Date Benzene (ppb) Toluene (ppb) Ethylbenzene (ppb) Total xylene isomers (ppb)
09/01/2019 0.7 1.6 0.6 1.9
15/01/2019 <0.5 1.5 <0.7 <1
21/01/2019 <0.5 <0.5 <0.5 <1
27/01/2019 <0.5 <0.5 <0.5 <1
NEPM MILA 3.0B 1000 NA 250

March 2019 1789878-006-R-Rev0
20
6.5 Meteorological parameters 6.5.1 Temperature
Ambient Temperature data for all AAQMS sites are presented in Figure 12 for the reporting period.
Figure 12: Ambient temperature (1 hour average) All AAQMS – January 2019
6.5.2 Relative humidity
Relative Humidity data for all AAQMS sites are presented in Figure 13 for the reporting period.

March 2019 1789878-006-R-Rev0
21
Figure 13: Relative humidity (1 hour average) All AAQMs – January 2019
6.5.3 Atmospheric pressure
Atmospheric pressure data for Station 4 (Primula Avenue AAQMS) is presented in Figure 14 for the reporting
period.
Figure 14: Atmospheric pressure (1 hour average) Station 4 (Primula Avenue) – January 2019

March 2019 1789878-006-R-Rev0
22
6.5.4 Wind speed
Wind Speed data for all AAQMS sites are presented in Figure 15 for the reporting period.
Figure 15: Wind speed (1 hour average) All AAQMs – January 2019
6.5.5 Wind rose – Station 1 (Yarraville Gardens)
A wind rose (1 hour average) for Station 1 (Yarraville Gardens AAQMS) is presented in Figure 16.
Figure 16: Wind speed (1 hour average) Station 1 Yarraville Gardens AAQMs

March 2019 1789878-006-R-Rev0
23
6.5.6 Wind rose – Station 2 (Francis Street)
A wind rose (1 hour average) for Station 2 (Francis Street AAQMS) is presented in Figure 17.
Figure 17: Wind speed (1 hour average) Station 2 Francis Street AAQMs
6.5.7 Wind rose – Station 3 (Railway Reserve)
A wind rose (1 hour average) for Station 3 (Railway Reserve AAQMS) is presented in Figure 18.
Figure 18: Wind speed (1 hour average) Station 3 Railway Reserve AAQMs

March 2019 1789878-006-R-Rev0
24
6.5.8 Wind rose – Station 4 (Primula Avenue)
A wind rose (1 hour average) for Station 4 (Primula Avenue AAQMS) is presented in Figure 19.
Figure 19: Wind speed (1 hour average) Station 4 Primula Avenue AAQMs
6.5.9 Wind rose – Station 5 (Donald McLean Reserve)
A wind rose (1 hour average) for Station 5 (Donald McLean Reserve AAQMS) is presented in Figure 20.
Figure 20: Wind speed (1 hour average) Station 5 Donald McLean Reserve AAQMs

March 2019 1789878-006-R-Rev0
25
7.0 QUALITY ASSURANCE
7.1 Data capture Data capture is defined as the number of valid data periods collected divided by the number of available data
periods. Valid data excludes periods where the instrument is unavailable due to calibration and maintenance
and excludes periods where the data has been rejected due to quality assurance/data validation procedures.
Automatic calibrations are conducted for NO2 and CO daily to monitor and correct instrument drift where
necessary. NO2 and CO automatic calibrations are conducted once per day between 01:00 and 01:45 hours.
Data capture statistics for the reporting period 1 January to 31 January 2019 are shown in Table 17. Averages
were only collected for those periods where the 5 minute data constituted 75% data capture.
Data capture statistics for January 2019 were above 90 percent for all parameters at AAQMS 1, 2, 3, 4, 5 & 6.
Table 17: Data capture
Parameter Averaging period
Station Collected periods
Available periods
Data capture
PM2.5
24 hour 1 – Yarraville Gardens 31 31 100%
24 hour 2 – Francis Street 31 31 100%
24 hour 3 – Railway Reserve 31 31 100%
24 hour 4 – Primula Avenue 31 31 100%
24 hour 5 – Donald McLean Reserve 31 31 100%
24 hour 6 – Millers Road 31 31 100%
PM10
24 hour 1 – Yarraville Gardens 31 31 100%
24 hour 2 – Francis Street 31 31 100%
24 hour 3 – Railway Reserve 31 31 100%
24 hour 4 – Primula Avenue 31 31 100%
24 hour 5 – Donald McLean Reserve 31 31 100%
24 hour 6 – Millers Road 31 31 100%
NO2 1 hour 4 – Primula Avenue 711 744 95.6%
CO 1 hour 4 – Primula Avenue 712 744 95.7%
Ambient temperature & relative humidity
1 hour 1 – Yarraville Gardens 742 744 99.7%
1 hour 2 – Francis Street 743 744 99.9%
1 hour 3 – Railway Reserve 732 744 98.4%
1 hour 4 – Primula Avenue 744 744 100%
1 hour 5 – Donald McLean Reserve 741 744 99.6%
1 hour 6 – Millers Road 741 744 99.6%

March 2019 1789878-006-R-Rev0
26
7.2 Data validation Data contained in this report has been validated against performance and calibration requirements for each
instrument. Data during commissioning, maintenance and calibration periods has been removed from the
validated data sets. Appendix A lists the data exceptions for all AAQMS. Missing data periods during automatic
calibrations of the gaseous atmospheric contaminants NO2 and CO are not shown.
8.0 DISCUSSION Table 18 presents the maximum measured concentration during the reporting period at Station 1 for PM2.5 and
PM10 compared with the respective criteria.
Table 18: Station 1 Summary – January 2019
Parameter Units Averaging period Maximum concentration Air quality objectiveA
Exceedances
PM2.5 ug/m3 24 hour 20 25 Nil
PM10 ug/m3 24 hour 56 50 2
Notes: A - SEPP(AAQ) objective
Table 19 presents the maximum measured concentration during the reporting period at Station 2, Station 3,
Station 5 and Station 6 for PM2.5 and PM10 compared with the respective criteria.
Table 19: Station 2, Station 3, Station 5 and Station 6 Summary – January 2019
Parameter Units Averaging period
Maximum concentration Air quality objectiveA
Exceedances Station 2 Station 3 Station 5 Station 6
PM2.5 ug/m3 24 hour 19 18 18 20 36 Nil
PM10 ug/m3 24 hour 57 56 59 88 60 1
Notes: A- SEPP(AQM) Intervention level
Table 20 presents maximum measured concentration during the reporting period at Station 4 for PM2.5, PM10,
NO2, CO and BTEX compared with the respective criteria.
Table 20: Station 4 Summary – January 2019
Parameter Units Averaging period Maximum concentration Air quality objective
Exceedances
PM2.5 ug/m3 24 hour 26 36A Nil
Wind speed and direction
1 hour 1 – Yarraville Gardens 742 744 99.7%
1 hour 2 – Francis Street 744 744 100%
1 hour 3 – Railway Reserve 733 744 98.5% %
1 hour 4 – Primula Avenue 744 744 100%
1 hour 5 – Donald McLean Reserve 742 744 99.7%

March 2019 1789878-006-R-Rev0
27
Parameter Units Averaging period Maximum concentration Air quality objective
Exceedances
PM10 ug/m3 24 hour 116 60A 9
NO2 ppb 1 hour 58 140A Nil
CO ppm 1 hour 1.0 29A Nil
Benzene ppb 24 hour 0.7 3.0B Nil
Toluene ppb 24 hour 1.6 1000B Nil
Total xylene isomers
ppb 24 hour 1.9 250B Nil
Notes: A - SEPP(AQM) Intervention level B - Air NEPM Monitoring investigation level
Results for the January 2019 ambient air quality monitoring programme were less than the respective air quality
objectives for all parameters measured at stations 2, 3 and 5. Station 1 (Yarraville Gardens) exceeded the PM10
air quality objective on two days (17/01/2019 and 25/01/2019). Station 6 (Millers Road) exceeded the PM10 air
quality objective on one day (25/01/2019).
Station 4 (Primula Avenue) exceeded the PM10 air quality objective on nine days (11/01/2019, 14/01/2019,
15/01/2019, 16/01/2019, 17/01/2019, 24/01/2019, 25/01/2019, 30/01/2019 and 31/01/2019), all other
parameters monitored at station 4 were less than the respective air quality objectives.
Station 4 is now located in a construction area (Millers Road exit ramp and noise wall relocation) and the
measured PM10 concentrations may not be representative of impacts at the closest residential receptor.
9.0 IMPORTANT INFORMATION RELATING TO THIS REPORT Your attention is drawn to the document - “Important Information Relating to this Report” (LEG04, RL2), which is included in Appendix C of this report. The statements presented in this document are intended to advise you
of what your realistic expectations of this report should be. The document is not intended to reduce the level of
responsibility accepted by Golder, but rather to ensure that all parties who may rely on this report are aware of
the responsibilities each assumes in so doing. We would be pleased to answer any questions the reader may
have regarding this document.

March 2019 1789878-006-R-Rev0
28
Signature Page
Golder Associates Pty Ltd
Anthony Myszka Marl Tulau
Environmental Technician Senior Environmental Scientist
AM/MDT/am
Golder and the G logo are trademarks of Golder Associates Corporation
j:\2017\1789878 - cpb contractors westgate tunnel aaqms\correspondence out\1789878-006_2019 jan\1789878-006-r-rev0_aaqms_2019_january.docx

March 2019 1789878-006-R-Rev0
APPENDIX A
Data Exceptions

Data exceptions - January 2019
Date from Date to Station Parameters Reason
30-01-19 15:55 30-01-19 16:05 1 All Parameters Maintenance / calibration
30-01-19 15:10 30-01-19 15:25 2 All Parameters Maintenance / calibration
30-01-19 17:05 30-01-19 17:20 3 All Parameters Maintenance / calibration
09-01-19 12:55 09-01-19 14:30 4 PM10 Data logger error
09-01-19 14:30 09-01-19 14:45 4 NOX Data logger error
09-01-19 14:45 09-01-19 15:00 4 CO Data logger error
29-01-19 15:05 29-01-19 15:15 4 PM10 Data logger error
31-01-19 10:20 31-01-19 12:05 4 Temperature / RH Maintenance / calibration
31-01-19 10:40 31-01-19 11:30 4 PM25 Maintenance / calibration
31-01-19 10:40 31-01-19 12:10 4 PM10 Maintenance / calibration
31-01-19 10:40 31-01-19 12:10 4 NOX / CO Maintenance / calibration
31-01-19 10:40 31-01-19 12:10 4 NOX / CO Maintenance / calibration
31-01-19 09:00 31-01-19 09:20 5 PM2.5 / PM10 Maintenance / calibration
31-01-19 09:00 31-01-19 09:20 5 Temperature / RH Maintenance / calibration
03-01-19 23:20 04-01-19 00:05 6 All Parameters Data logger error
21-01-19 10:05 21-01-19 11:45 6 All Parameters Power Failure
31-01-19 12:00 31-01-19 12:25 6 All Parameters Maintenance / calibration

March 2019 1789878-006-R-Rev0
APPENDIX B
Laboratory Certificates


March 2019 1789878-006-R-Rev0
APPENDIX C
Important Information Relating to this Report

IMPORTANT INFORMATION RELATING TO THIS REPORT
The document (“Report”) to which this page is attached and which this page forms a part of, has been issued by Golder Associates Pty Ltd (“Golder”) subject to the important limitations and other qualifications set out below. This Report constitutes or is part of services (“Services”) provided by Golder to its client (“Client”) under and subject to a contract between Golder and its Client (“Contract”). The contents of this page are not intended to and do not alter Golder’s obligations (including any limits on those obligations) to its Client under the Contract. This Report is provided for use solely by Golder’s Client and persons acting on the Client’s behalf, such as its professional advisers. Golder is responsible only to its Client for this Report. Golder has no responsibility to any other person who relies or makes decisions based upon this Report or who makes any other use of this Report. Golder accepts no responsibility for any loss or damage suffered by any person other than its Client as a result of any reliance upon any part of this Report, decisions made based upon this Report or any other use of it. This Report has been prepared in the context of the circumstances and purposes referred to in, or derived from, the Contract and Golder accepts no responsibility for use of the Report, in whole or in part, in any other context or circumstance or for any other purpose. The scope of Golder’s Services and the period of time they relate to are determined by the Contract and are subject to restrictions and limitations set out in the Contract. If a service or other work is not expressly referred to in this Report, do not assume that it has been provided or performed. If a matter is not addressed in this Report, do not assume that any determination has been made by Golder in regards to it. At any location relevant to the Services conditions may exist which were not detected by Golder, in particular due to the specific scope of the investigation Golder has been engaged to undertake. Conditions can only be verified at the exact location of any tests undertaken. Variations in conditions may occur between tested locations and there may be conditions which have not been revealed by the investigation and which have not therefore been taken into account in this Report. Golder accepts no responsibility for and makes no representation as to the accuracy or completeness of the information provided to it by or on behalf of the Client or sourced from any third party. Golder has assumed that such information is correct unless otherwise stated and no responsibility is accepted by Golder for incomplete or inaccurate data supplied by its Client or any other person for whom Golder is not responsible. Golder has not taken account of matters that may have existed when the Report was prepared but which were only later disclosed to Golder. Having regard to the matters referred to in the previous paragraphs on this page in particular, carrying out the Services has allowed Golder to form no more than an opinion as to the actual conditions at any relevant location. That opinion is necessarily constrained by the extent of the information collected by Golder or otherwise made available to Golder. Further, the passage of time may affect the accuracy, applicability or usefulness of the opinions, assessments or other information in this Report. This Report is based upon the information and other circumstances that existed and were known to Golder when the Services were performed and this Report was prepared. Golder has not considered the effect of any possible future developments including physical changes to any relevant location or changes to any laws or regulations relevant to such location. Where permitted by the Contract, Golder may have retained subconsultants affiliated with Golder to provide some or all of the Services. However, it is Golder which remains solely responsible for the Services and there is no legal recourse against any of Golder’s affiliated companies or the employees, officers or directors of any of them. By date, or revision, the Report supersedes any prior report or other document issued by Golder dealing with any matter that is addressed in the Report. Any uncertainty as to the extent to which this Report can be used or relied upon in any respect should be referred to Golder for clarification.
GAP Form No. LEG04 RL2 July 2015 1/1

golder.com


![A New Kind of French Adventure School in the Alps · 6WXGHQWV DUULYLQJ DW *HQHYD RU D QHDUE\ UDLOZD\ VWDWLRQ ZLOO EH PHW E\ D WUDQVIHU UHSUHVHQWDWLYH DQG WUDQVSRUWHG WR 0RU]LQH Looking](https://img.pdfslide.net/doc/110x75/600049c30a78ec422178a4b6/a-new-kind-of-french-adventure-school-in-the-alps-6wxghqwv-duulylqj-dw-hqhyd-ru.jpg)


![Evonik- Cyro Post 65 Enrollment Brochure 9.08.20 FINAL...$*( H &\UR 3RVW 0HGLFDUH (OLJLEOH $QQXDO (QUROOPHQW x $XWKRUL]LQJ D UHSUHVHQWDWLYH RU 3RZHU RI $WWRUQH\ x 'HDWK QRWLILFDWLRQV](https://img.pdfslide.net/doc/110x75/60fb020527a9c66db01e0b26/evonik-cyro-post-65-enrollment-brochure-90820-final-h-ur-3rvw-0hglfduh.jpg)


![ACTACIENT ÍFICA - Wesleyan University · figure5. 9duldwlrq lq &g 3e &x dqg )h frqfhqwudwlrqv ryhu wlph \rxqjhvw sruwlrq ri yhuwlfdo ukl]rph dqg roghvw sruwlrq ri yhuwlfdo ukl]rph](https://img.pdfslide.net/doc/110x75/5e45aa0e3e25cb037b10594b/actacient-fica-wesleyan-university-figure5-9duldwlrq-lq-g-3e-x-dqg.jpg)
![Coyne - Sterility Testing FSHP Presentation...2016/02/20 · 'LVFODLPHU , DP VSHDNLQJ LQ DQ LQGLYLGXDO FDSDFLW\ DQG QRW DV D UHSUHVHQWDWLYH RI DQ\ RUJDQL]DWLRQ RU FRPPLWWHH UHJDUGOHVV](https://img.pdfslide.net/doc/110x75/5ea34e424b9e401f7e589d70/coyne-sterility-testing-fshp-presentation-20160220-lvfodlphu-dp-vshdnlqj.jpg)


![Case 19-40402-elm11 Doc 1 Filed 01/31/19 Entered 01/31/19 ...€¦ · ri dxwkrul]hg uhsuhvhqwdwlyh ri ghewru 7kh ghewru uhtxhvwv uholhi lq dffrugdqfh zlwk wkh fkdswhu ri wlwoh 8qlwhg](https://img.pdfslide.net/doc/110x75/60758c447a82c76a76350d94/case-19-40402-elm11-doc-1-filed-013119-entered-013119-ri-dxwkrulhg-uhsuhvhqwdwlyh.jpg)

![1 - Arti · d plqlpxp ri pp dqg d pd[lpxp ri pp *urvv suhflslwdwlrq wrwdol]hg pp ehlqj uhsuhvhqwdwlyh ri wkh orfdo dqqxdo suhflslwdwlrq zklfk](https://img.pdfslide.net/doc/110x75/5d04987188c99322638d1092/1-d-plqlpxp-ri-pp-dqg-d-pdlpxp-ri-pp-urvv-suhflslwdwlrq-wrwdolhg-pp-ehlqj.jpg)