Embed Size (px)
Citation preview
Lehrstuhl für Ernährungsphysiologie
Phenotype analysis of Caenorhabditis elegans lacking the intestinal peptide transporter
Barbara Meissner
Vollständiger Abdruck der von der Fakultät Wissenschaftszentrum Weihenstephan
für Ernährung, Landnutzung und Umwelt der Technischen Universität München
zur Erlangung des akademischen Grades eines
Doktors der Naturwissenschaften
(Dr. rer. nat.)
genehmigten Dissertation.
Vorsitzender: Univ.-Prof. Dr. M. Schemann Prüfer der Dissertation: 1. Univ.-Prof. Dr. H. Daniel
2. Univ.-Prof. Dr. R. Baumeister, Albert-Ludwigs-Universität Freiburg
3. Univ.-Prof. Dr. Alfons Gierl
Die Dissertation wurde am 01.03.2004 bei der Technischen Universität München
eingereicht und durch die Fakultät Wissenschaftszentrum Weihenstephan für
Ernährung, Landnutzung und Umwelt am 23.05.2004 angenommen.
Content I
1 Introduction ....................................................................................................... 1 1.1 Proton-coupled peptide transporters .................................................................. 1 1.2 The model organism Caenorhabditis elegans .................................................... 5 1.3 The alimentary tract and peptide transporters in C. elegans .............................. 7 1.4 Metabolism, aging and development in C. elegans .......................................... 11 1.5 Aim of the work................................................................................................. 14
2 Materials........................................................................................................... 16
2.1 Instruments....................................................................................................... 16 2.2 Chemicals and consumable supplies ............................................................... 16 2.3 Buffer and Media .............................................................................................. 17 2.4 Bacteria - and C. elegans strains, plasmids and primers.................................. 18
2.4.1 Bacteria strains......................................................................................... 18 2.4.2 C. elegans strains..................................................................................... 18 2.4.3 Plasmids................................................................................................... 19 2.4.4 Oligonucleotides ....................................................................................... 20
3 Methods............................................................................................................ 21
3.1 C. elegans methods.......................................................................................... 21 3.1.1 Breeding of C. elegans ............................................................................. 21 3.1.2 Genetic crosses........................................................................................ 21 3.1.3 Mutagenesis by Trimethylpsoralen/UV treatment ..................................... 21 3.1.4 Worm Lysis for Single Worm PCR (SW-PCR).......................................... 21 3.1.5 Transformation of C. elegans ................................................................... 22 3.1.6 X-ray-induced integration of extrachromosomal arrays ............................ 22 3.1.7 Staining for lacZ expression ..................................................................... 22 3.1.8 Feeding assay with ß-Ala-Lys-AMCA....................................................... 22 3.1.9 Assays for developmental and behavioral phenotypes............................. 23 3.1.10 Amino acid supplementation .................................................................... 24 3.1.11 Culturing aged, synchronized animals for protein carbonyl determination 25 3.1.12 Protein extraction from C. elegans ........................................................... 25 3.1.13 Protein carbonyl measurement................................................................. 25 3.1.14 RNA Interference (RNAi) experiments...................................................... 26 3.1.15 Uptake assay with radioactive labelled amino acids................................. 26
3.2 Molecular biology techniques ........................................................................... 27
Content II
4 Results ............................................................................................................. 28 4.1 Analysis of PEP-2, the low-affinity, high capacity peptide transporter in C. elegans ............................................................................................................. 28
4.1.1 Identification of pep-2 gene expression with GFP and lacZ reporter constructs ................................................................................................. 28 4.1.2 Identification of the mutant allele pep-2(lg601) ......................................... 30 4.1.3 Analysis of pep-2(lg601) mutant phenotype ............................................. 32
4.2 Analysis of PEP-1, the high-affinity, low capacity peptide transporter of C. elegans ............................................................................................................. 42
4.2.1 Localisation of pep-1 gene expression with a GFP reporter construct...... 42 4.2.2 Identification of the pep-1(lg501) mutant allele......................................... 44 4.2.3 Analysis of pep-1(lg501) and pep-1(lg501); pep-2(lg601) mutants........... 45
4.3 Influence of pep-2 on the regulation of development, metabolism and ageing. 47 4.3.1 pep-2 and the DAF-7/TGF-β signalling pathway ...................................... 47 4.3.2 Interaction between pep-2 and the DAF-2/insulin-like signalling pathway .................................................................................................... 48 4.3.3 Interaction between pep-2 and the TOR signalling pathway .................... 57
5 Discussion ....................................................................................................... 61
5.1 Expression and function of proton-coupled peptide transporter in C. elegans.. 61 5.2 Function of pep-2 in development, metabolism and ageing ............................. 65 5.3 Outlook ............................................................................................................. 73
6 Summary .......................................................................................................... 76
7 Zusammenfassung.......................................................................................... 77
8 Supplement...................................................................................................... 79
8.1 Crossing strategies........................................................................................... 79 8.2 Supplemental data............................................................................................ 80 8.3 List of tables ..................................................................................................... 81 8.4 List of figures .................................................................................................... 81 8.5 Abbreviations.................................................................................................... 84
9 References ....................................................................................................... 86
Introduction 1
1 Introduction 1.1 Proton-coupled peptide transporters
In the mid-1970s, the active absorption of short chain peptides in the mammalian gut
epithelium was shown for the first time (Addison et al. 1972; Matthews et al. 1974).
During the 1980s, the intestinal di- and tripeptide transport system was characterized
functionally and evidence accumulated that similar uptake processes are also
present in epithelial cells of the kidney tubule (Ganapathy and Leibach 1982). 1994,
an intestinal peptide transporter was cloned (Boll et al. 1994; Fei et al. 1994) followed
by other mammalian species, identified by homology screening and cloning (Liang et
al. 1995; Saito et al. 1995; Rubio-Aliaga et al. 2000). The intestinal isoform was
designated PEPT1, the renal isoform PEPT2. Both were the first mammalian nutrient
transporters to be identified that use an electrochemical proton gradient as their
driving force thus, substrate uptake depends strongly on extracellular pH and
membrane potential (Ganapathy and Leibach 1983).
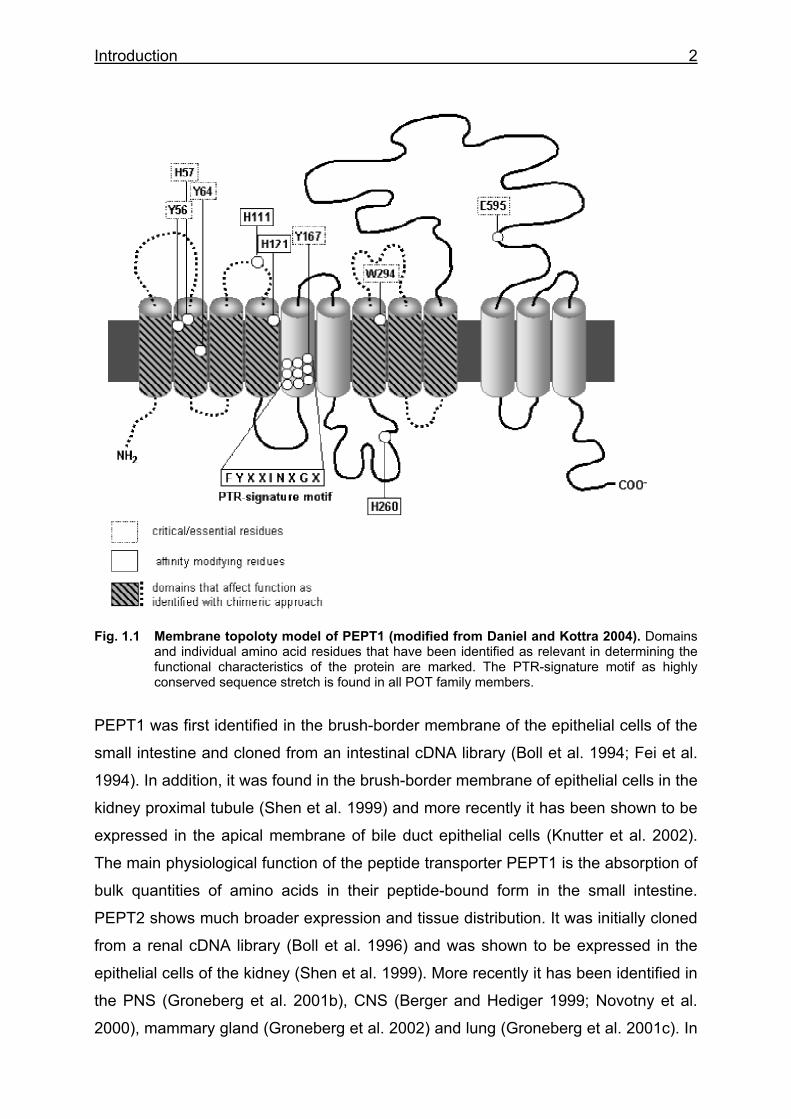
Peptide transporters are integral plasma membrane proteins that mediate the
cellular uptake of di- and tripeptides and a variety of peptidomimetics. The
transporter proteins contain 12 predicted transmembrane domains (TMD), the N- and
C-termini in the cytosol (Fig. 1.1). The peptide transporters in mammals - like in most
other species - are proton-dependent rheogenic carriers (Daniel 1996) and have
been grouped into the Proton-coupled Oligopeptide Transporter (POT) superfamily
which is also called Peptide TRansporter (PTR) family (Steiner et al. 1995). The
transport process is associated with proton translocation and movement of positive
charges and, thus, transport is always electrogenic, irrespective of the substrate’s net
charge. Substrate uptake at the intestinal brush border membrane causes proton
influx that in turn leads to increased proton efflux back to the lumen by the apical
sodium-proton exchanger NHE3 (Thwaites et al. 2002). Sodium influx via NHE3 is
compensated by export through the basolateral sodium-potassium ATPase and
potassium ions taken up leave the cell by the potassium channels.
Introduction 2
Fig. 1.1 Membrane topoloty model of PEPT1 (modified from Daniel and Kottra 2004). Domains and individual amino acid residues that have been identified as relevant in determining the functional characteristics of the protein are marked. The PTR-signature motif as highly conserved sequence stretch is found in all POT family members.
PEPT1 was first identified in the brush-border membrane of the epithelial cells of the
small intestine and cloned from an intestinal cDNA library (Boll et al. 1994; Fei et al.
1994). In addition, it was found in the brush-border membrane of epithelial cells in the
kidney proximal tubule (Shen et al. 1999) and more recently it has been shown to be
expressed in the apical membrane of bile duct epithelial cells (Knutter et al. 2002).
The main physiological function of the peptide transporter PEPT1 is the absorption of
bulk quantities of amino acids in their peptide-bound form in the small intestine.
PEPT2 shows much broader expression and tissue distribution. It was initially cloned
from a renal cDNA library (Boll et al. 1996) and was shown to be expressed in the
epithelial cells of the kidney (Shen et al. 1999). More recently it has been identified in
the PNS (Groneberg et al. 2001b), CNS (Berger and Hediger 1999; Novotny et al.
2000), mammary gland (Groneberg et al. 2002) and lung (Groneberg et al. 2001c). In
Introduction 3
the kidney, the peptide transporters contribute to the homeostasis of amino acids in
the organism along with several classes of amino acid transporters located as well in
the apical membrane of tubular cells (for a review, see Palacin et al. 1998). In brain
astrocytes, PEPT2 was proposed to contribute to brain glutathione metabolism by
providing cysteinyl-glycine derived from extracellular glutathione for glial glutathione
resynthesis (Dringen et al. 1998) or for removing neuroactive peptides such as
Kyotorphin (Hussain et al. 2001). The physiological role of PEPT2 in lung and
mammary gland epithelium is not yet known.
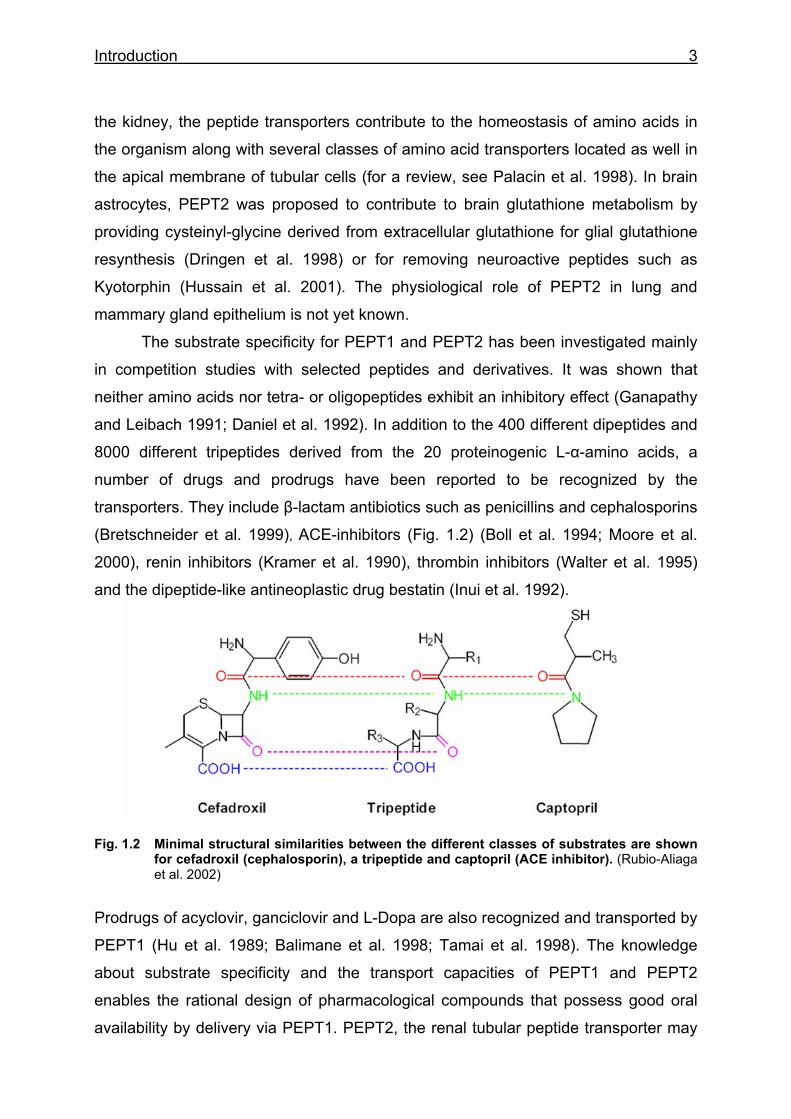
The substrate specificity for PEPT1 and PEPT2 has been investigated mainly
in competition studies with selected peptides and derivatives. It was shown that
neither amino acids nor tetra- or oligopeptides exhibit an inhibitory effect (Ganapathy
and Leibach 1991; Daniel et al. 1992). In addition to the 400 different dipeptides and
8000 different tripeptides derived from the 20 proteinogenic L-α-amino acids, a
number of drugs and prodrugs have been reported to be recognized by the
transporters. They include β-lactam antibiotics such as penicillins and cephalosporins
(Bretschneider et al. 1999), ACE-inhibitors (Fig. 1.2) (Boll et al. 1994; Moore et al.
2000), renin inhibitors (Kramer et al. 1990), thrombin inhibitors (Walter et al. 1995)
and the dipeptide-like antineoplastic drug bestatin (Inui et al. 1992).
Fig. 1.2 Minimal structural similarities between the different classes of substrates are shown for cefadroxil (cephalosporin), a tripeptide and captopril (ACE inhibitor). (Rubio-Aliaga et al. 2002)
Prodrugs of acyclovir, ganciclovir and L-Dopa are also recognized and transported by
PEPT1 (Hu et al. 1989; Balimane et al. 1998; Tamai et al. 1998). The knowledge
about substrate specificity and the transport capacities of PEPT1 and PEPT2
enables the rational design of pharmacological compounds that possess good oral
availability by delivery via PEPT1. PEPT2, the renal tubular peptide transporter may
Introduction 4
contribute to the renal clearance of drugs by efficient reabsorption, thus affecting
their pharmacokinetics.
Although similar in function, both proteins display major differences in
substrate affinity and transport capacity. PEPT1 can be considered as a low-affinity,
high-capacity system with apparent affinity constants (Km values) ranging form 200
µM to 10 mM, depending on the substrate. Under identical experimental conditions,
the affinity of PEPT2 is higher for most, but nor all, substrates. PEPT2 can be
considered as a high-affinity, low-capacity transport system with Km values of 5-500
µM, depending on the substrate (Daniel and Herget 1997).
The transport activity of PEPT1 can be modulated to meet physiological needs
either by regulation at the transcriptional level or by the translocation of preformed
transporter proteins to the cell surface. Dietary regulation of the intestinal peptide
transporter has been demonstrated in several studies (Erickson et al. 1995; Walker
et al. 1998; Shiraga et al. 1999). The translocation of preformed transporter proteins
to the cell surface was shown to occur in response to acute insulin or leptin treatment
(Buyse et al. 2001) or prolonged exposure to dipeptides in cell culture (Walker et al.
1998; Shiraga et al. 1999). In addition, a number of in vivo studies have shown that a
dietary protein load causes an increase in di- and tripeptide transport in rat (Erickson
et al. 1995) and mice small intestine (Ferraris et al. 1988). More recently, evidence
was presented that PEPT1 in rat intestine is upregulated after a short fast via an
increase in gene expression (Thamotharan et al. 1999; Ihara et al. 2000) and rats
made diabetic by streptozotocin showed increased PEPT1 activity and increased
protein levels most likely by enhanced stabilization of its mRNA (Gangopadhyay et
al. 2002).
Much is known about transport properties and substrate recognition of peptide
transporters, but their contribution to amino acid nitrogen absorption in concert with
amino acid transporter systems and their relevance for protein nutrition in vivo is not
known. Caenorhabditis elegans could provide a useful model system to investigate
the physiological importance of peptide transporters in vivo.
Introduction 5
1.2 The model organism Caenorhabditis elegans
In 1965, Sydney Brenner chose the free-living nematode Caenorhabditis elegans (C.
elegans) as a promising animal model for a concerted genetic, ultrastructural, and
behavioural investigation of the development and function of a simple nervous
system. C. elegans is a small (~ 1 mm), non parasitic, free-living soil nematode found
commonly in many parts of the world. C. elegans is easily maintained in the
laboratory, where it can be grown on nematode growth media (NGM) agar plates or
in liquid culture with Escherichia coli as a food source. It can also be grown
axenically in liquid media. Under standard laboratory conditions, growth of C. elegans
is rapid. The entire life cycle, from an egg to an adult that produces progeny, takes
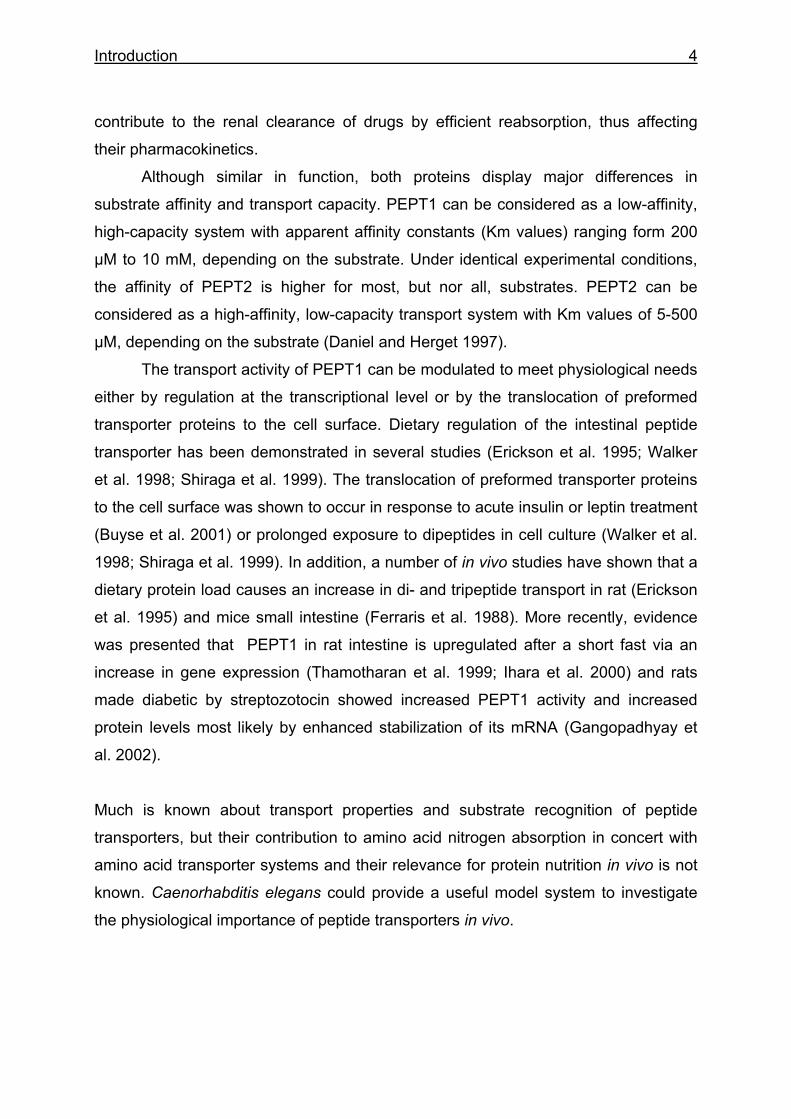
just about three days at 20°C (Byerly et al. 1976). Post-embryonic development
involves growth through four larval stages (L1 to L4) before the final molt to produce
the adults (Fig. 1.3). In the absence of food and/or at a high population density, an
alternative stage, the dauer, is formed at the second molt instead of the normal L3.
Dauer larvae can survive for several months and, once food becomes available, they
molt to develop into normal L4 larva (Fig. 1.3).
Fig. 1.3 Diagrammatic representation of the C. elegans life cycle, showing durations of developmental stages (modified from Schierenberg and Cassada 1986). Numbers on the outside of the circle indicate hours after fertilization at 20°C, the four larval molts are indicated inside the circle.
0h
fertilization embryogenesis (14h)
L1/L2 molt
hatch
L1 larva (15h)
L2 larva (9h)
L2/L3 molt
L3 larva (9h)
L4 larva (12h)
L3/L4 molt
L4/adult molt
adult animal
2-3 weeks
~ 300 progeny
20°C 14h
29h
38h
47h
59h
dauer
Introduction 6
C. elegans is diploid and has five pairs of autosomal chromosomes (I, II, III, IV and V)
and one pair of sex chromosomes (X). There are two sexes, male (X0) and
hermaphrodite (XX). The hermaphrodite produces both sperm and oocytes and can
reproduce by self-fertilization, without mating. Males naturally appear with a
frequency of ~ 0.2 % but can be generated experimentally, for example by heat
shock.
Further advantages for using C. elegans as a model organism, in addition to the
short generation time and self reproducing hermaphrodites, are:
• the complete genome is sequenced since 1998 (Consortium 1998)
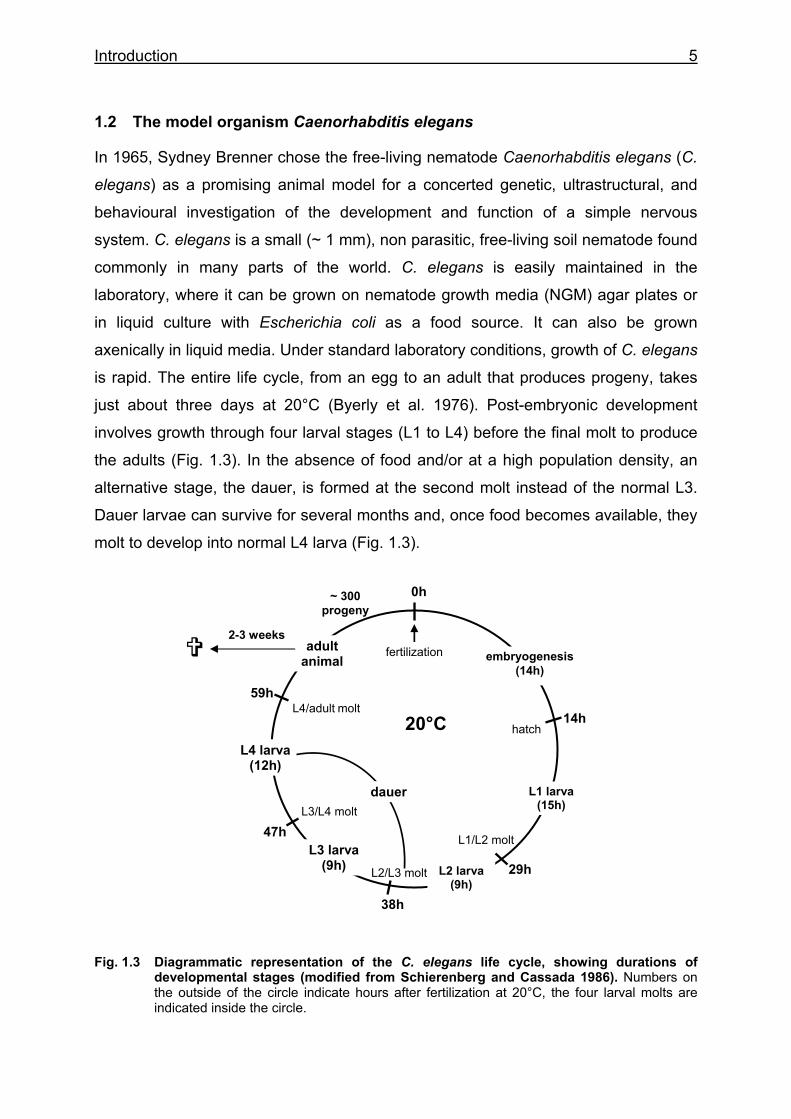
• animals have a transparent body, visible under a light microscope (Fig. 1.4)
• the cell lineage is completely known; hermaphrodites are composed of 959,
males of 1031 somatic cells
• animals (L1-larvae) can be frozen at -80°C or liquid nitrogen for several years
• many molecular biology techniques are applicable, for example:
- construction of transgenic animals by microinjection
- RNA Interference (RNAi)
- chemical mutagenesis for establishing deletion libraries (reverse
genetic approaches)
• a large variety of genetic phenotypes and markers are characterized
• a wide spectrum of behaviour patterns is analyzed
Fig. 1.4 Transmission light microscopic image of a young adult, wild type hermaphrodite
pharynx post. bulb
pharynx ant. bulb
gonad arm
vulvaintestine
spermatheca
anus
100µm
Introduction 7
1.3 The alimentary tract and peptide transporters in C. elegans
The alimentary system is divided into the foregut (the pharynx), the midgut (intestine),
and hindgut (rectum and anus) and contains 127 cells. The pharynx is a self-
containing system of muscles, epithelial cells, and nerves, bounded by a basement
membrane, which functions to ingest, concentrate, and process food before pumping
it into the gut (Seymour et al. 1983). In the terminal bulb of the pharynx, the grinder
squelches the food by muscle contraction and the debris is passed to the intestine
through the pharyngeal-intestinal valve, the connection between the pharynx and the
intestine.
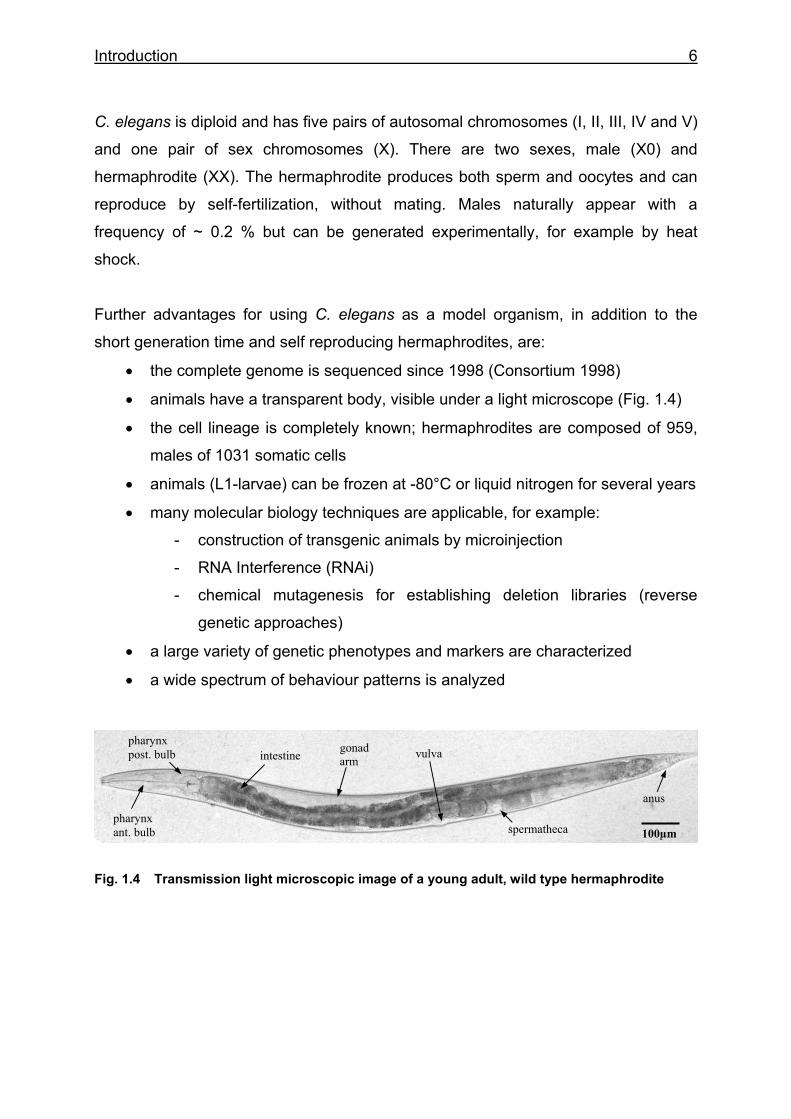
The intestine itself consists of a tube of 20 cells (Fig. 1.5) and is devoid of any
muscular structure in C. elegans. During defecation, the body wall muscles also
contribute to the control of internal pressure and concentration of the gut contents
before the expulsion of waste material.
Fig. 1.5 The C. elegans digestive tract (Avery and Thomas 1997). (Top) Schematic overview. The intestine connects to the posterior end of the pharynx and is a tube made up of a single layer of cells. (Bottom) Intestinal cells in the mid embryo (430 minutes). The bulk of the intestine is formed by the cell layers called int1 through int9. The four most anterior layers include the most posterior muscle of the pharynx (m8) and the pharyngeal-intestinal valve (vpi). At the posterior end of the intestine is a single layer that forms the intestinal-rectal valve (vir), followed by five layers of rectal epithelium (rep through hyp7). *cells with microvilli.
The intestinal cells are very large and many microvilli extend into the lumen from the
apical face, forming a brush border. In C. elegans, intestine carries out multiple
functions that are executed by distinct organs of higher eukaryotes. The primary
function of intestinal cells seems to be digestive since they secrete digestive
enzymes (e.g. cysteine protease, Britton et al. 1998) into the lumen and take up
processed material and nutrients. The intestine also seems to be a large storage
organ since it contains a large number of assorted storage granules (White 1988).
* * * * * * * * * * * *
Introduction 8
These granules change in size, shape and number during various developmental
stages of the animal. In hermaphrodites, it is also involved in synthesis and secretion
of yolk material, which is then transported to the oocytes through the body cavity
(Kimble and Sharrock 1983). Along with muscle, intestine is thought to be the major
organ where fatty acid metabolism takes place. Through the function of a glyoxylate
cyclase (SRH-1) yolk fatty acid-derived acetyl-coA is converted to succinate from
which carbohydrates are synthesized (Liu et al. 1995).
Nutrients must be absorbed with astonishing speed: Tracers such as mineral
oil or iron particles remain in the intestine for only a few minutes (Avery and Thomas
1997). A powerful muscular pump at the anterior end, the pharynx, is needed to force
food against pressure into the intestine. Smaller muscles at the posterior end of the
intestine control the opening of the anus, which facilitates the expulsion of intestinal
contents by the high internal pressure. Defecation is achieved by periodically
activating a stereotyped sequence of muscle contractions (Croll and Smith 1978).
Until now, nothing is known about active nutrient uptake in the C. elegans intestine
via transporters like PEPT1, amino acid or glucose transporters.
Three C. elegans oligopeptide transporters pep-1 (opt-1), pep-2 (opt-2) and opt-3
have been cloned and characterized by functional expression in Xenopus oocytes
(Fei et al. 1998; Fei et al. 2000). Full-length cDNA clones were expressed in
Xenopus laevis oocytes to assess the transport by measurement of [14C]-
glycylsarcosine (Gly-Sar) uptake and by determining peptide-induced transport
currents electrophysiologically. The kinetic analysis revealed PEP-1 as the high
affinity, low capacity, and PEP-2 as the low affinity, high capacity isoform (Fei et al.
1998), but also a transporter which functions predominantly as a H+ channel. The H+
channel activity of OPT-3 is ~3-4-fold greater than the H+/peptide cotransport (Fei et
al. 2000).
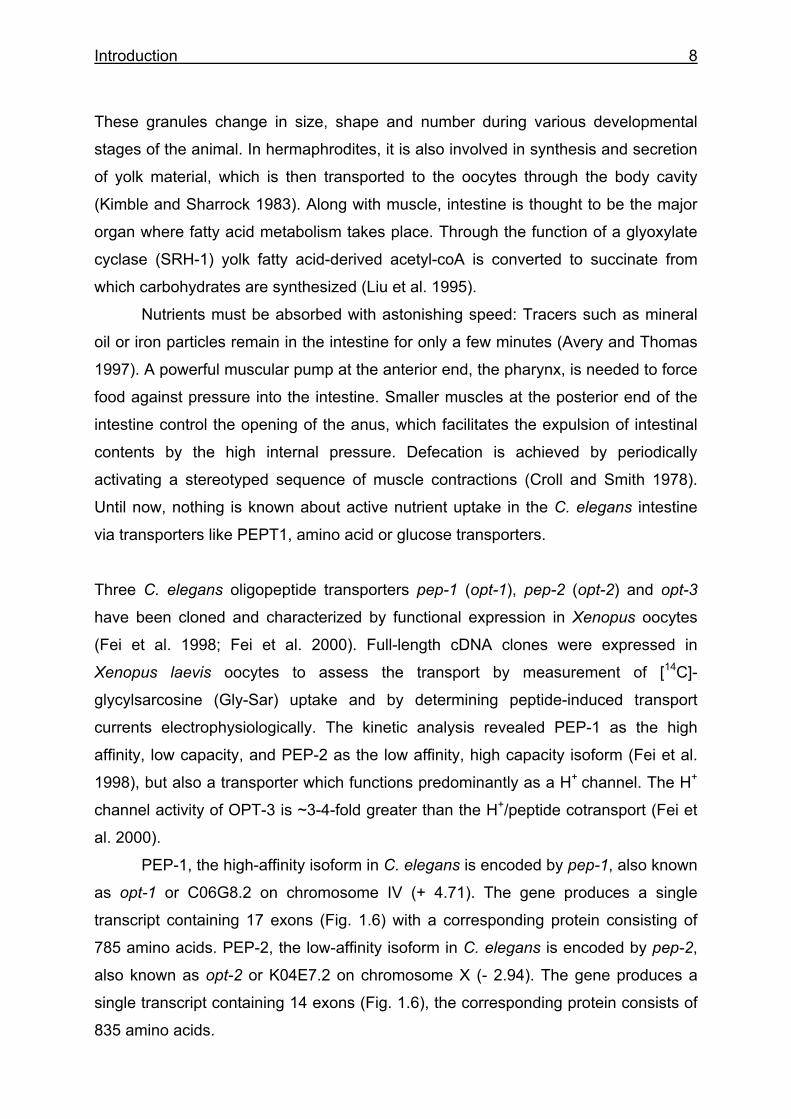
PEP-1, the high-affinity isoform in C. elegans is encoded by pep-1, also known
as opt-1 or C06G8.2 on chromosome IV (+ 4.71). The gene produces a single
transcript containing 17 exons (Fig. 1.6) with a corresponding protein consisting of
785 amino acids. PEP-2, the low-affinity isoform in C. elegans is encoded by pep-2,
also known as opt-2 or K04E7.2 on chromosome X (- 2.94). The gene produces a
single transcript containing 14 exons (Fig. 1.6), the corresponding protein consists of
835 amino acids.
Introduction 9
Fig. 1.6 Genomic organization of the C. elegans peptide transporter genes. Exon are indicated by filled boxes, introns are indicated by horizontal lines. The untranslated regions in exons are indicated by striated boxes.
opt-3, also known as F56F4.5 maps at chromosome I (+ 0.78), contains 13 exons
(Fig. 1.6) and is predicted to encode a single protein consisting of 701 amino acids.
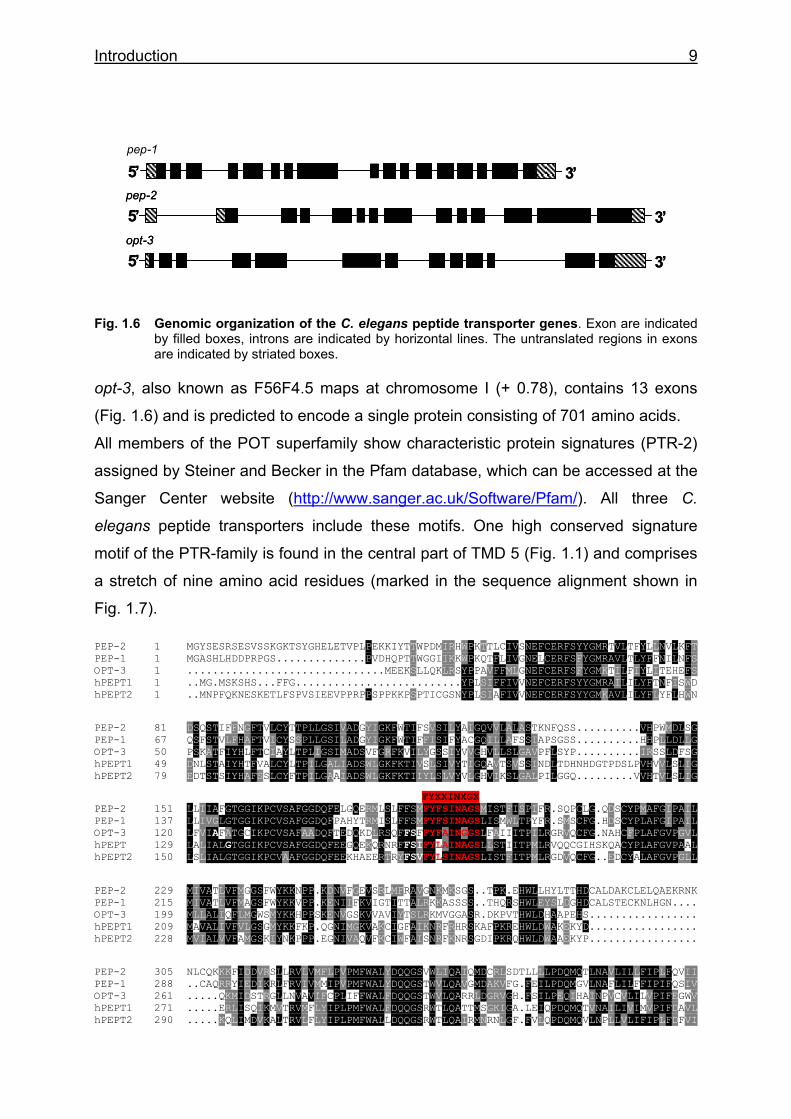
All members of the POT superfamily show characteristic protein signatures (PTR-2)
assigned by Steiner and Becker in the Pfam database, which can be accessed at the
Sanger Center website (http://www.sanger.ac.uk/Software/Pfam/). All three C.
elegans peptide transporters include these motifs. One high conserved signature
motif of the PTR-family is found in the central part of TMD 5 (Fig. 1.1) and comprises
a stretch of nine amino acid residues (marked in the sequence alignment shown in
Fig. 1.7).
PEP-2 1 MGYSESRSESVSSKGKTSYGHELETVPLPEKKIYTTWPDMIRHWPKTTLCIVSNEFCERFSYYGMRTVLTFYLLNVLKFT PEP-1 1 MGASHLHDDPRPGS..............PVDHQPTTWGGIIKKWPKQTFLIVGNELCERFSFYGMRAVLTLYFFNILNFS OPT-3 1 ...............................MEEKSLLQKLRSYPPAVFFMLGNEFCERFSFYGMKTILFIYLITEHEFS hPEPT1 1 ..MG.MSKSHS...FFG..........................YPLSIFFIVVNEFCERFSYYGMRAILILYFTNFISWD hPEPT2 1 ..MNPFQKNESKETLFSPVSIEEVPPRPPSPPKKPSPTICGSNYPLSIAFIVVNEFCERFSYYGMKAVLILYFLYFLHWN PEP-2 81 DSQSTIFFNGFTVLCYTTPLLGSIVADGYIGKFWTIFSVSILYAIGQVVLALASTKNFQSS..........VHPWMDLSG PEP-1 67 QSFSTVLFHAFTVICYSSPLLGSILADGYIGKFWTIFFISIFYACGQILLAFSSIAPSGSS..........HHPLLDLLG OPT-3 50 PSKATFIYHLFTCIAYLTPLIGSIMADSVFGRFKVILYGSSIYVVGHVLLSLGAVPFLSYP..........IRSSLDFSG hPEPT1 49 DNLSTAIYHTFVALCYLTPILGALIADSWLGKFKTIVSLSIVYTIGQAVTSVSSINDLTDHNHDGTPDSLPVHVVLSLIG hPEPT2 79 EDTSTSIYHAFSSLCYFTPILGAAIADSWLGKFKTIIYLSLVYVLGHVIKSLGALPILGGQ.........VVHTVLSLIG FYXXINXGX PEP-2 151 LLIIAFGTGGIKPCVSAFGGDQFELGQERMLSLFFSMFYFSINAGSMISTFISPIFR.SQPCLG.QDSCYPMAFGIPAIL PEP-1 137 LLIVGLGTGGIKPCVSAFGGDQFPAHYTRMISLFFSMFYFSINAGSLISMWLTPYFR.SMSCFG.HDSCYPLAFGIPAIL OPT-3 120 LFVIAFATGCIKPCVSAFAADQFTEDQKDLRSQFFSFFYFAINGGSLFAIIITPILRGRVQCFG.NAHCFPLAFGVPGVL hPEPT 129 LALIALGTGGIKPCVSAFGGDQFEEGQEKQRNRFFSIFYLAINAGSLLSTIITPMLRVQQCGIHSKQACYPLAFGVPAAL hPEPT2 150 LSLIALGTGGIKPCVAAFGGDQFEEKHAEERTRYFSVFYLSINAGSLISTFITPMLRGDVQCFG..EDCYALAFGVPGLL PEP-2 229 MIVATLVFMGGSFWYKKNPP.KDNVFGEVSRLMFRAVGNKMKSGS..TPK.EHWLLHYLTTHDCALDAKCLELQAEKRNK PEP-1 215 MIVATLVFMAGSFWYKKVPP.KENIIFKVIGTITTALRKKASSSS..THQRSHWLEYSLDGHDCALSTECKNLHGN.... OPT-3 199 MLLALIQFLMGWSMYKKHPPSKENVGSKVVAVIYTSLRKMVGGASR.DKPVTHWLDHAAPEHS................. hPEPT1 209 MAVALIVFVLGSGMYKKFKP.QGNIMGKVAKCIGFAIKNRFRHRSKAFPKREHWLDWAKEKYD................. hPEPT2 228 MVIALVVFAMGSKIYNKPPP.EGNIVAQVFKCIWFAISNRFKNRSGDIPKRQHWLDWAAEKYP................. PEP-2 305 NLCQKKKFIDDVRSLLRVLVMFLPVPMFWALYDQQGSVWLIQAIQMDCRLSDTLLLLPDQMQTLNAVLILLFIPLFQVII PEP-1 288 ..CAQRRYIEDIKRLFRVIVMMIPVPMFWALYDQQGSTWVLQAVGMDAKVFG.FEILPDQMGVLNAFLILFFIPIFQSIV OPT-3 261 .....QKMIDSTRGLLNVAVIFCPLIFFWALFDQQGSTWVLQARRLDGRVGH.FSILPEQIHAINPVCVLILVPIFEGWV hPEPT1 271 .....ERLISQIKMVTRVMFLYIPLPMFWALFDQQGSRWTLQATTMSGKIGA.LEIQPDQMQTVNAILIVIMVPIFDAVL hPEPT2 290 .....KQLIMDVKALTRVLFLYIPLPMFWALLDQQGSRWTLQAIRMNRNLGF.FVLQPDQMQVLNPLLVLIFIPLFDFVI
5 ’ 3 ’ pep - 1 5 ’ 3 ’ pep - 2
3’5 ’ pep - 2
3’
3’3’
5 ’ opt - 3 5 ’ opt - 3 5 ’
Introduction 10
PEP-2 385 YPVAAKC.VRLTPLRKMVTGGLLASLAFLITGFVQLQVNTTLPTLPEEGEASISFWNQFETDCTITVMSGIHKRVLPHDK PEP-1 365 YPTIEKLGFQMTMLRKMAGGGILTAVSFFVCGIVQLFVNPTLPYIPMANEAHLTIINTIPS.CDFNVLIDSRE....... OPT-3 335 YPALRKI.TRVTPLRKMAVGGLLTAFSFAIAGVLQLKVNETMEFPPSLGRIYLQRVGNESLISDFRYKSDGRLIG..... hPEPT1 345 YPLIAKCGFNFTSLKKMAVGMVLASMAFVVAAIVQVEIDKTLPVFPKGNEVQIKVLNIGNNTMNISLPG........... hPEPT2 364 YRLVSKCGINFSSLRKMAVGMILACLAFAVAAAVEIKINEMAPAQPGPQEVFLQVLNLADDEVKVTVVGNENNSL..... PEP-2 464 YLHEDKKNKSGIYNLFTTKSPAKGNGDWTLTYDLSYDGACGDTSKLEKTVKVTAKSKKIIYVGVGSFGYYQNTANTDKPT PEP-1 437 ..PFDLLRKSGIAPDDSVRKPISFTGDDFFQPNITFDNLAPNCPKFTAEPMLAPATSYVLTLSPNGWAY..NAVRPEKPK OPT-3 409 .DGMLPKGRTELDAGIYTFNTGLKNESQEIDISTPNKGYVMAVFRLKDAVEVVKFDYKVEKTDNGATRVFVVTAREDADT hPEPT1 414 ....EMVTLGPMSQTNAFMTFDVNKLTR.INISSPGS....PVTAVTDDFKQGQRHTLLVWAPN....HYQVVKDGLNQK hPEPT2 439 ....LIESIKSFQKTPHYSKLHLKTKSQDFHFHLKYH....NLSLYTEHSVQEKNWYSLVIREDGNSISSMMVKD.TESR PEP-2 544 DGTGEFSMGIVTVFNSS................YGGNFAMCRQNTSDFDVN.HPCNPRHPADFYFWETDYNSHTDDR... PEP-1 513 SGKGELSMGLNLIVPCDKIPSNVTWEQCNGTEGYSGAIALCKVESDVITDNNNVCDPTAKGKFYVLSNANPLDVHDF... OPT-3 488 .........LVYAINKK.................GKILSSCELKSGSYVDVIPGIISDPNVRLYWGPKNSCSGVDCPNTV hPEPT1 481 PEKGENGIRFVNTFNEL..................ITITMSGKVYANISS.YNASTYQFFPSGIKGFTISSTEIPPQCQP hPEPT2 510 TTNGMTTVRFVNTLHKD..................VNISLSTDTSLNVGEDYGVSAYRTVQRGEYPAVHCRTEDK...NF PEP-2 604 DQNATITGSLSSQPAVTYKQKSVKPGYWQLYYLLNTPKDVDRQTYNKTATLVAPTNYGFHRVKQGGVFIYALTGTYENPK PEP-1 590 SKKSTVT.....AFGRTYSPIEMKPGTYRLFYTD......DSRTHFTPLNLPP.....VQQDHMGGQYLITVSTRSKNDS OPT-3 542 TLN..........................................................AQMGAVHVLHIHPSTTEGD hPEPT1 542 NFN.......................................................TFYLEFGSAYTYIVQRKNDSCP hPEPT2 569 SLN.......................................................LGLLDFGAAYLFVITNNTNQGL PEP-2 684 ...IHELQIVQSNSVSILWQIPQIVVITAAEILFSITGYEFAYSQSAPSMKALVQALWLLTTAAGDSIIVVITILNLFE. PEP-1 654 EVLATTESLVSYNRVSILWQIPQYVILTAGEVLFSITGLEFAYTEASPQLKSVVQALWLFTTAIGDLIVVVIFMLNIFS. OPT-3 564 .....FNLLVRPNSVSILWSLPQYIIITLGEVLLSVTGLEFAYSQAAPNMKSVLTAMWLLTVFAGNLIDMMISGTRLIP. hPEPT1 567 ..EVKVFEDISANTVNMALQIPQYFLLTCGEVVFSVTGLEFSYSQAPSNMKSVLQAGWLLTVAVGNIIVLIVAGAGQFS. hPEPT2 594 ..QAWKIEDIPANKMSIAWQLPQYALVTAGEVMFSVTGLEFSYSQAPSGMKSVLQAAWLLTIAVGNIIVLVVA...QFSG PEP-2 760 .NMAVEFFVYAAAMFVVIAIFALLSIFYYTYNYYTTDEEDGEIGVDDEEEIEDHNPRYSIDNKGFHPDEKDTFDMHF PEP-1 733 DVAVQMFVFGGIMLFVIFVFILLAVFYYEYADYSNESE....VLTEKMIVDDDHTRI................... OPT-3 638 .HPALEFFFYSTLMVIVMGVFILLAMQYTYVEDNDDEITITESEKKDVIALTEIESGTATSDKKE............ hPEPT1 644 .KQWAEYILFAALLLVVCVIFAIMARFYTYINPAEIEAQFDEDEKKNRLEKSNPYFMSGANSQKQM........... hPEPT2 669 LVQWAEFILFSCLLLVICLIFSIMGYYYVPVKTEDMRGPADK.....HIPHIQGNMIKLETKKTKL...........
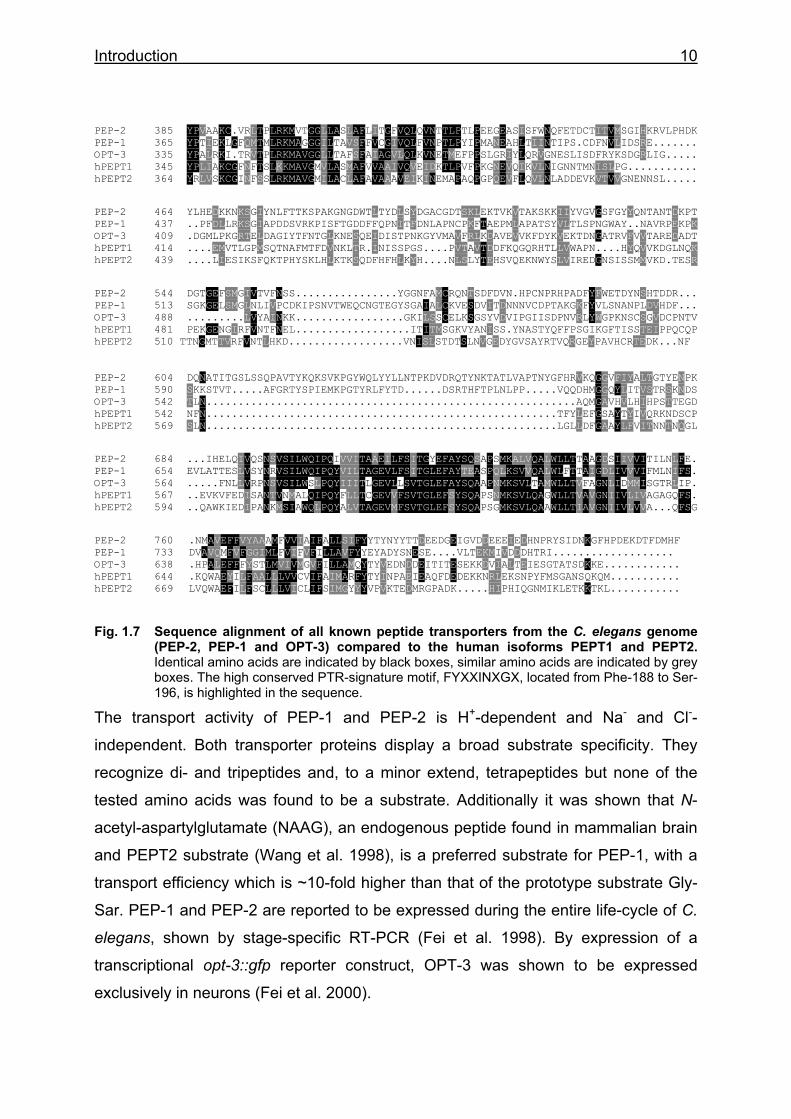
Fig. 1.7 Sequence alignment of all known peptide transporters from the C. elegans genome (PEP-2, PEP-1 and OPT-3) compared to the human isoforms PEPT1 and PEPT2. Identical amino acids are indicated by black boxes, similar amino acids are indicated by grey boxes. The high conserved PTR-signature motif, FYXXINXGX, located from Phe-188 to Ser- 196, is highlighted in the sequence.
The transport activity of PEP-1 and PEP-2 is H+-dependent and Na- and Cl--
independent. Both transporter proteins display a broad substrate specificity. They
recognize di- and tripeptides and, to a minor extend, tetrapeptides but none of the
tested amino acids was found to be a substrate. Additionally it was shown that N-
acetyl-aspartylglutamate (NAAG), an endogenous peptide found in mammalian brain
and PEPT2 substrate (Wang et al. 1998), is a preferred substrate for PEP-1, with a
transport efficiency which is ~10-fold higher than that of the prototype substrate Gly-
Sar. PEP-1 and PEP-2 are reported to be expressed during the entire life-cycle of C.
elegans, shown by stage-specific RT-PCR (Fei et al. 1998). By expression of a
transcriptional opt-3::gfp reporter construct, OPT-3 was shown to be expressed
exclusively in neurons (Fei et al. 2000).
Introduction 11
1.4 Metabolism, ageing and development in C. elegans
In C. elegans there are two pathways known to act in parallel to regulate C. elegans
metabolism and development, the DAF-2 (insulin/IGF receptor-like) (Kimura et al.
1997) and the DAF-7 (TGF-β-like) pathways (Ren et al. 1996; Schackwitz et al.
1996). A decrease in either of the signals causes dauer arrest, indicating that both
pathways are required for reproductive growth. Many mutants are known to be either
dauer-defective (Daf-d) or dauer-constitutive (Daf-c). Daf-d mutants are not able to
enter the dauer stage even in unfavourable conditions like high concentrations of
pheromone, absence of food and high temperature. In contrast, Daf-c mutants enter
the dauer stage even in the abundance of food and low pheromone concentrations.
The dauer larva exhibits a metabolism that is consistent with long-term survival in the
absence of food. They have reduced TCA cycle activity but high phosphofructokinase
activity relative to adults, indicating that dauer larvae have a greater capacity to
metabolize glycogen (O'Riordan and Burnell 1989). The decreased TCA cycle activity
relative to the glyoxylate cycle in dauer larvae indicates the importance of lipid
storage as an energy reserve in the dauer stage (Wadsworth and Riddle 1989;
O'Riordan and Burnell 1990; Kimura et al. 1997).
DAF-7, a TGF-β homologue, is secreted by the ASI neurons and signals through the
heteromeric TGF-β receptor complex of DAF-1 and DAF-4 (Georgi et al. 1990;
Estevez et al. 1993; Ren et al. 1996; Schackwitz et al. 1996). daf-7 loss-of-function
mutants exhibit a strong Daf-c phenotype, thus daf-7 function is necessary for proper
development (Swanson and Riddle 1981). Cell ablation and genetic studies suggest
that the ASI neurons have a basal level of DAF-7-secreting activity in the absence of
sensory inputs (Bargmann and Horvitz 1991). Dauer pheromone is thought to inhibit
this basal activity, allowing dauer formation, whereas attractive food cues might
antagonize pheromone action by stimulating ASI activity and DAF-7 release. A daf-
7::GFP fusion gene is predominately expressed in the ASI sensory neurons in well
fed animals, and the level of expression is downregulated by dauer pheromone and
upregulated by food signals (Ren et al. 1996; Schackwitz et al. 1996).
Introduction 12
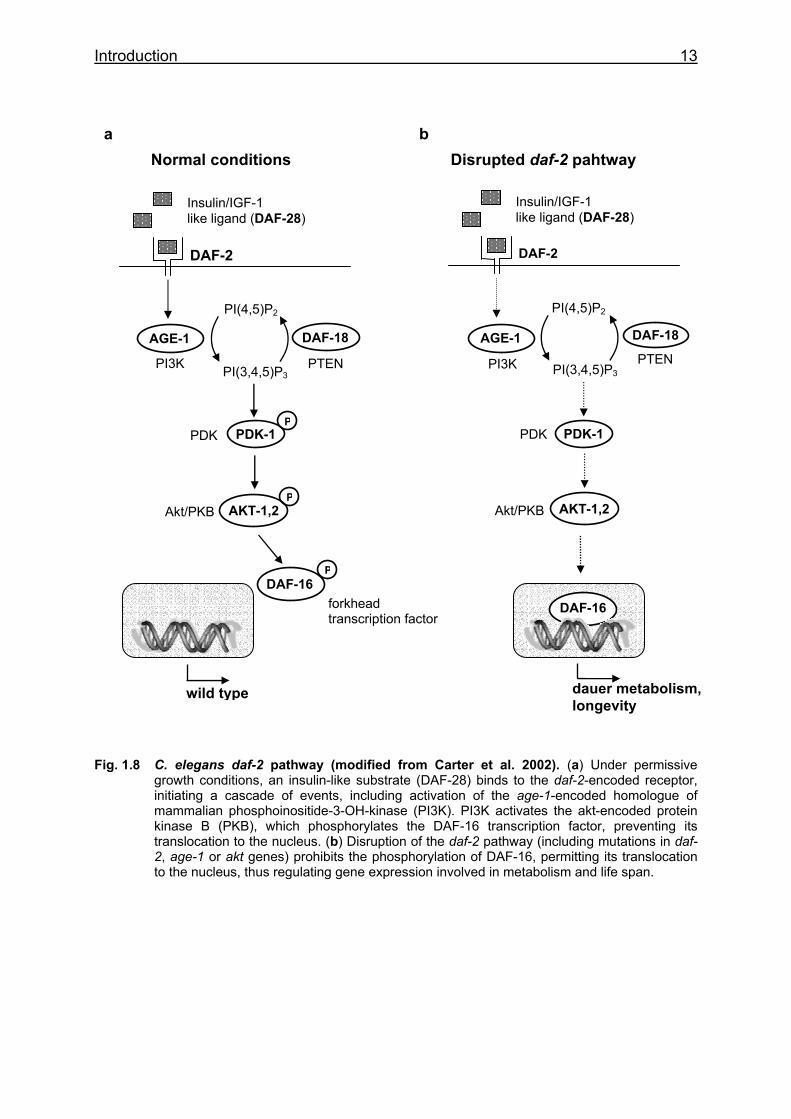
Dauer formation in C. elegans is also regulated by the DAF-2 insulin-like signalling
pathway, which is orthologous to the mammalian insulin and insulin-like growth factor
1 signalling (IGF-1) cascade. The daf-2 gene encodes an insulin/IGF receptor
(Kimura et al. 1997), the downstream components include the AGE-1/PI3 kinase
(Morris et al. 1996), PDK-1/PDK1 (Paradis et al. 1999), AKT-1 and AKT-2/Akt/PKB
(Paradis and Ruvkun 1998), DAF-18/PTEN (Ogg and Ruvkun 1998), and the DAF-
16/forkhead transcription factor (Lin et al. 1997; Ogg et al. 1997) (Fig. 1.8). Recently,
daf-28 was shown to encode an insulin-like protein which directly affects the daf-2
signalling pathway (Li et al. 2003). Down-regulation of DAF-2 results in nuclear
localization and thus activation of the DAF-16 transcription factor (Henderson and
Johnson 2001; Lee et al. 2001; Lin et al. 2001) regulating genes involved in
metabolism and ageing (Fig. 1.8).
In wild type animals, DAF-2 signalling activates reproductive growth, which is
associated with utilization of food for growth in cell number and size, and small stores
of fat. In daf-2 mutant animals, metabolism is shifted to the production of fat and
glycogen (Kimura et al. 1997) in intestinal and hypodermal cells. Even when a
temperature-sensitive daf-2 mutant allele is shifted to the nonpermissive temperature
at L4 or adult stage, metabolism is shifted toward storage of fat, similar to the
metabolic shift seen in daf-7 mutants (Kimura et al. 1997). In support of this
metabolic shift, in dauer larvae, enzymes that regulate glycolysis are down-regulated
while those that regulate glycogen and fat synthesis are up-regulated, and there is
ultrastructural evidence for increased lipid and glycogen storage (Popham and
Webster 1978; Wadsworth and Riddle 1989).
Introduction 13
Fig. 1.8 C. elegans daf-2 pathway (modified from Carter et al. 2002). (a) Under permissive growth conditions, an insulin-like substrate (DAF-28) binds to the daf-2-encoded receptor, initiating a cascade of events, including activation of the age-1-encoded homologue of mammalian phosphoinositide-3-OH-kinase (PI3K). PI3K activates the akt-encoded protein kinase B (PKB), which phosphorylates the DAF-16 transcription factor, preventing its translocation to the nucleus. (b) Disruption of the daf-2 pathway (including mutations in daf- 2, age-1 or akt genes) prohibits the phosphorylation of DAF-16, permitting its translocation to the nucleus, thus regulating gene expression involved in metabolism and life span.
DAF-2
Insulin/IGF-1 like ligand (DAF-28)
AGE-1
PDK-1
PI(4,5)P2
PI(3,4,5)P3 PI3K
DAF-18
PTEN
P
AKT-1,2
PDK
Akt/PKB P
DAF-16 P
forkhead transcription factor
Normal conditions
DAF-2
Insulin/IGF-1 like ligand (DAF-28)
PI(4,5)P2
PI(3,4,5)P3 PI3K PTEN
PDK
Akt/PKB
Disrupted daf-2 pahtway
DAF-18
PDK-1
AKT-1,2
DAF-16
wild type
AGE-1
dauer metabolism, longevity
a b
Introduction 14
Both, the TGF-β-like neuroendocrine and the insulin-like signalling pathway regulate
metabolism and dauer arrest but only the daf-2 insulin-like pathway has effects on
the stress resistance, fertility and longevity of reproductively growing adults.
Components of the insulin/IGF-1 pathway also regulate life span in flies, yeast, and
mice, suggesting that this system arose early in evolution (Kenyon 2001; Bluher et al.
2003; Holzenberger et al. 2003). In C. elegans, the life span in daf-2 and age-1
mutant animals is known to be significantly increased (Friedman and Johnson 1988;
Kenyon et al. 1993), but neither fat accumulation nor reduced fertility is required for
longevity (Kenyon et al. 1993; Wolkow et al. 2000). The longevity phenotype in daf-2
loss-of-function mutants was shown to be dependent on a functional DAF-16
transcription factor. Furthermore it was shown that the insulin-like signalling acts in
parallel to the caloric restriction, which is also known to enhance life span in C.
elegans like in many other organisms (Lakowski and Hekimi 1998).
daf-2 and age-1 adult animals exhibit high levels of catalase and superoxide
dismutase (SOD) activity, that may further increase with age (Larsen 1993;
Vanfleteren 1993; Vanfleteren and De Vreese 1995), and most consistently, these
mutants exhibit an increased resistant to oxygen (Adachi et al. 1998), hydrogen
peroxide (Larsen 1993) and the superoxide generator paraquat (methylviologen)
(Vanfleteren 1993) as compared to wild type animals. In contrast, mev-1 mutant
animals, in which the Cu/ZnSOD activity is reduced by 30-50%, are more sensitive to
paraquat and they have a life span that is reduced by 30% (Ishii et al. 1990; Ishii et
al. 1994; Adachi et al. 1998). In addition it was shown, that the accumulation of age
pigments and protein carbonyls, resulting from oxidative damage, is correlated
positively with ageing (Hosokawa et al. 1994; Adachi et al. 1998; Yasuda et al. 1999).
1.5 Aim of the work
Since 1968, when it was shown for the first time that amino acids offered as small
peptides can be absorbed in the gut much faster than a corresponding amino acid
mixture (Adibi 1968), the function and regulation of the peptide transporters have
been studied extensively in vivo and in vitro (for reviews see (Daniel 1996; Adibi
1997; Meredith and Boyd 2000). Nevertheless, nothing is known about the
physiological importance of intestinal peptide uptake in connection with the uptake of
free amino acids by a large number of different amino acid transporter systems.
Introduction 15
Recently two PEPT2-deficient mice lines have been reported (Rubio-Aliaga et al.
2003; Shen et al. 2003). They were found to be viable and displayed no obvious
abnormalities in kidney or brain. Functional deficiencies were shown by the almost
abolished uptake of model peptides in the choroid plexus (Shen et al. 2003) and the
kidney (Rubio-Aliaga et al. 2003). For PEPT1, no strains deficient in this protein have
been reported so far.
In this work, C. elegans was used to analyze the expression and function of PEP-1
and PEP-2 transporter proteins in vivo, with a main focus on the pep-2 gene.
Materials 16
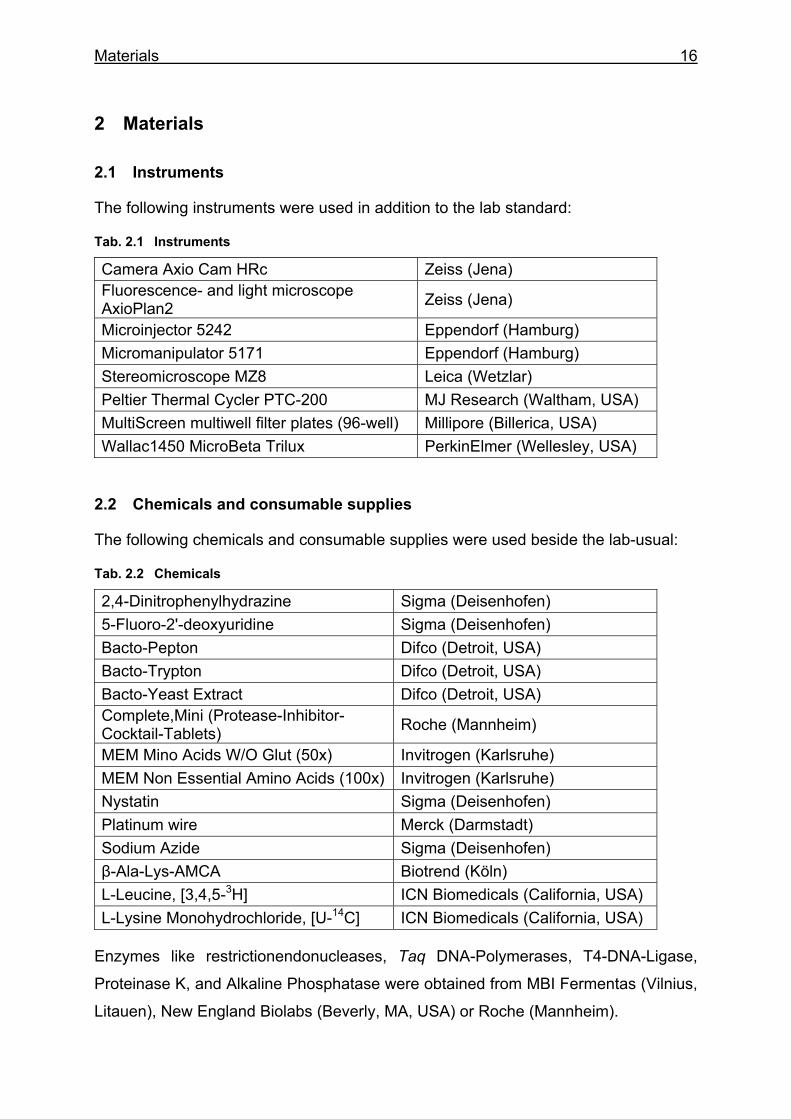
2 Materials 2.1 Instruments
The following instruments were used in addition to the lab standard:
Tab. 2.1 Instruments
Camera Axio Cam HRc Zeiss (Jena) Fluorescence- and light microscope AxioPlan2 Zeiss (Jena)
Microinjector 5242 Eppendorf (Hamburg) Micromanipulator 5171 Eppendorf (Hamburg) Stereomicroscope MZ8 Leica (Wetzlar) Peltier Thermal Cycler PTC-200 MJ Research (Waltham, USA) MultiScreen multiwell filter plates (96-well) Millipore (Billerica, USA) Wallac1450 MicroBeta Trilux PerkinElmer (Wellesley, USA)
2.2 Chemicals and consumable supplies
The following chemicals and consumable supplies were used beside the lab-usual:
Tab. 2.2 Chemicals
2,4-Dinitrophenylhydrazine Sigma (Deisenhofen) 5-Fluoro-2'-deoxyuridine Sigma (Deisenhofen) Bacto-Pepton Difco (Detroit, USA) Bacto-Trypton Difco (Detroit, USA) Bacto-Yeast Extract Difco (Detroit, USA) Complete,Mini (Protease-Inhibitor-Cocktail-Tablets) Roche (Mannheim)
MEM Mino Acids W/O Glut (50x) Invitrogen (Karlsruhe) MEM Non Essential Amino Acids (100x) Invitrogen (Karlsruhe) Nystatin Sigma (Deisenhofen) Platinum wire Merck (Darmstadt) Sodium Azide Sigma (Deisenhofen) β-Ala-Lys-AMCA Biotrend (Köln) L-Leucine, [3,4,5-3H] ICN Biomedicals (California, USA) L-Lysine Monohydrochloride, [U-14C] ICN Biomedicals (California, USA)
Enzymes like restrictionendonucleases, Taq DNA-Polymerases, T4-DNA-Ligase,
Proteinase K, and Alkaline Phosphatase were obtained from MBI Fermentas (Vilnius,
Litauen), New England Biolabs (Beverly, MA, USA) or Roche (Mannheim).
Materials 17
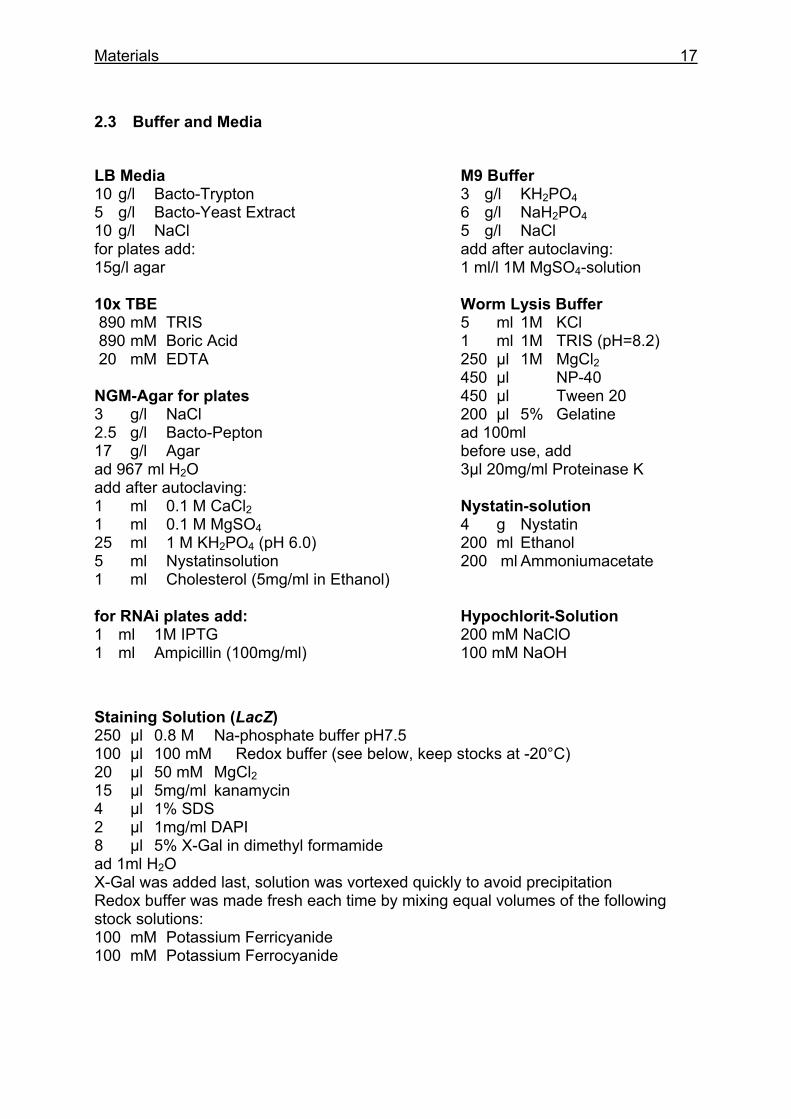
2.3 Buffer and Media
LB Media 10 g/l Bacto-Trypton 5 g/l Bacto-Yeast Extract 10 g/l NaCl for plates add: 15g/l agar 10x TBE 890 mM TRIS 890 mM Boric Acid 20 mM EDTA NGM-Agar for plates 3 g/l NaCl 2.5 g/l Bacto-Pepton 17 g/l Agar ad 967 ml H2O add after autoclaving: 1 ml 0.1 M CaCl2 1 ml 0.1 M MgSO4 25 ml 1 M KH2PO4 (pH 6.0) 5 ml Nystatinsolution 1 ml Cholesterol (5mg/ml in Ethanol) for RNAi plates add: 1 ml 1M IPTG 1 ml Ampicillin (100mg/ml)
M9 Buffer 3 g/l KH2PO4 6 g/l NaH2PO4 5 g/l NaCl add after autoclaving: 1 ml/l 1M MgSO4-solution Worm Lysis Buffer 5 ml 1M KCl 1 ml 1M TRIS (pH=8.2) 250 µl 1M MgCl2 450 µl NP-40 450 µl Tween 20 200 µl 5% Gelatine ad 100ml before use, add 3µl 20mg/ml Proteinase K Nystatin-solution 4 g Nystatin 200 ml Ethanol 200 ml Ammoniumacetate Hypochlorit-Solution 200 mM NaClO 100 mM NaOH
Staining Solution (LacZ) 250 µl 0.8 M Na-phosphate buffer pH7.5 100 µl 100 mM Redox buffer (see below, keep stocks at -20°C) 20 µl 50 mM MgCl2 15 µl 5mg/ml kanamycin 4 µl 1% SDS 2 µl 1mg/ml DAPI 8 µl 5% X-Gal in dimethyl formamide ad 1ml H2O X-Gal was added last, solution was vortexed quickly to avoid precipitation Redox buffer was made fresh each time by mixing equal volumes of the following stock solutions: 100 mM Potassium Ferricyanide 100 mM Potassium Ferrocyanide
Materials 18
2.4 Bacteria - and C. elegans strains, plasmids and primers
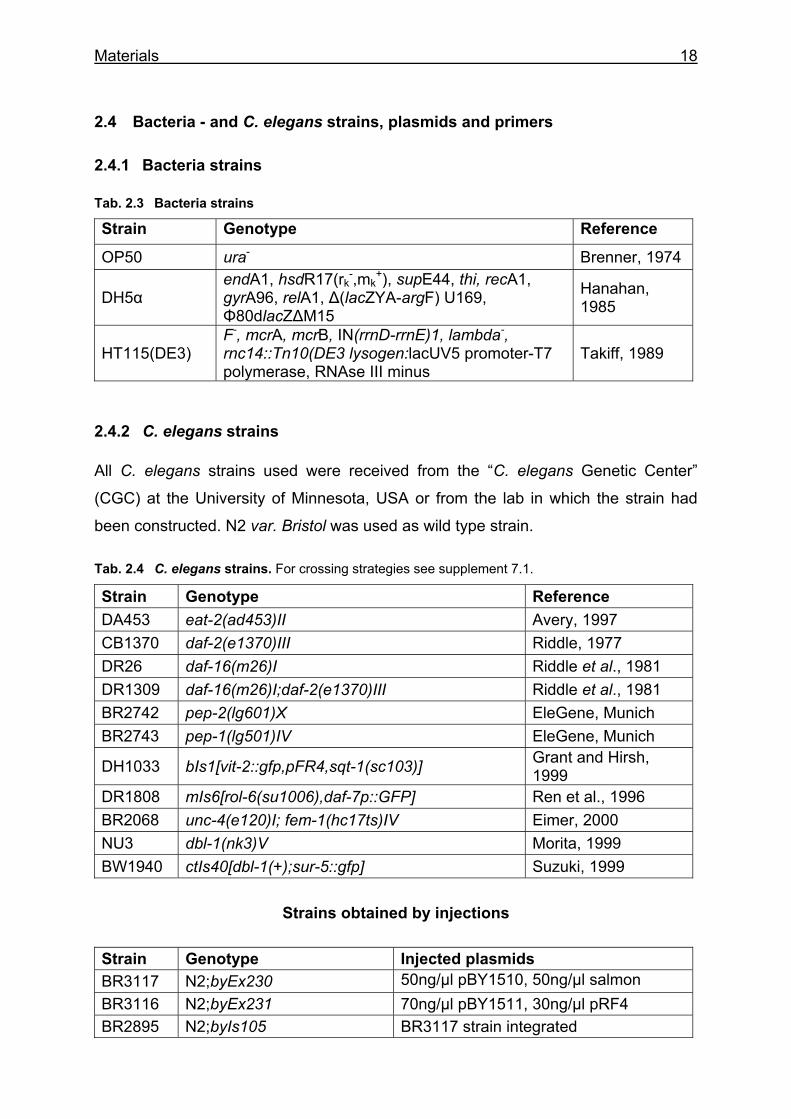
2.4.1 Bacteria strains
Tab. 2.3 Bacteria strains
Strain Genotype Reference
OP50 ura- Brenner, 1974
DH5α endA1, hsdR17(rk
-,mk+), supE44, thi, recA1,
gyrA96, relA1, ∆(lacZYA-argF) U169, Φ80dlacZ∆M15
Hanahan, 1985
HT115(DE3) F-, mcrA, mcrB, IN(rrnD-rrnE)1, lambda-, rnc14::Tn10(DE3 lysogen:lacUV5 promoter-T7 polymerase, RNAse III minus
Takiff, 1989
2.4.2 C. elegans strains
All C. elegans strains used were received from the “C. elegans Genetic Center”
(CGC) at the University of Minnesota, USA or from the lab in which the strain had
been constructed. N2 var. Bristol was used as wild type strain.
Tab. 2.4 C. elegans strains. For crossing strategies see supplement 7.1.
Strain Genotype Reference DA453 eat-2(ad453)II Avery, 1997 CB1370 daf-2(e1370)III Riddle, 1977 DR26 daf-16(m26)I Riddle et al., 1981 DR1309 daf-16(m26)I;daf-2(e1370)III Riddle et al., 1981 BR2742 pep-2(lg601)X EleGene, Munich BR2743 pep-1(lg501)IV EleGene, Munich
DH1033 bIs1[vit-2::gfp,pFR4,sqt-1(sc103)] Grant and Hirsh, 1999
DR1808 mIs6[rol-6(su1006),daf-7p::GFP] Ren et al., 1996 BR2068 unc-4(e120)I; fem-1(hc17ts)IV Eimer, 2000 NU3 dbl-1(nk3)V Morita, 1999 BW1940 ctIs40[dbl-1(+);sur-5::gfp] Suzuki, 1999
Strains obtained by injections
Strain Genotype Injected plasmids BR3117 N2;byEx230 50ng/µl pBY1510, 50ng/µl salmon BR3116 N2;byEx231 70ng/µl pBY1511, 30ng/µl pRF4 BR2895 N2;byIs105 BR3117 strain integrated
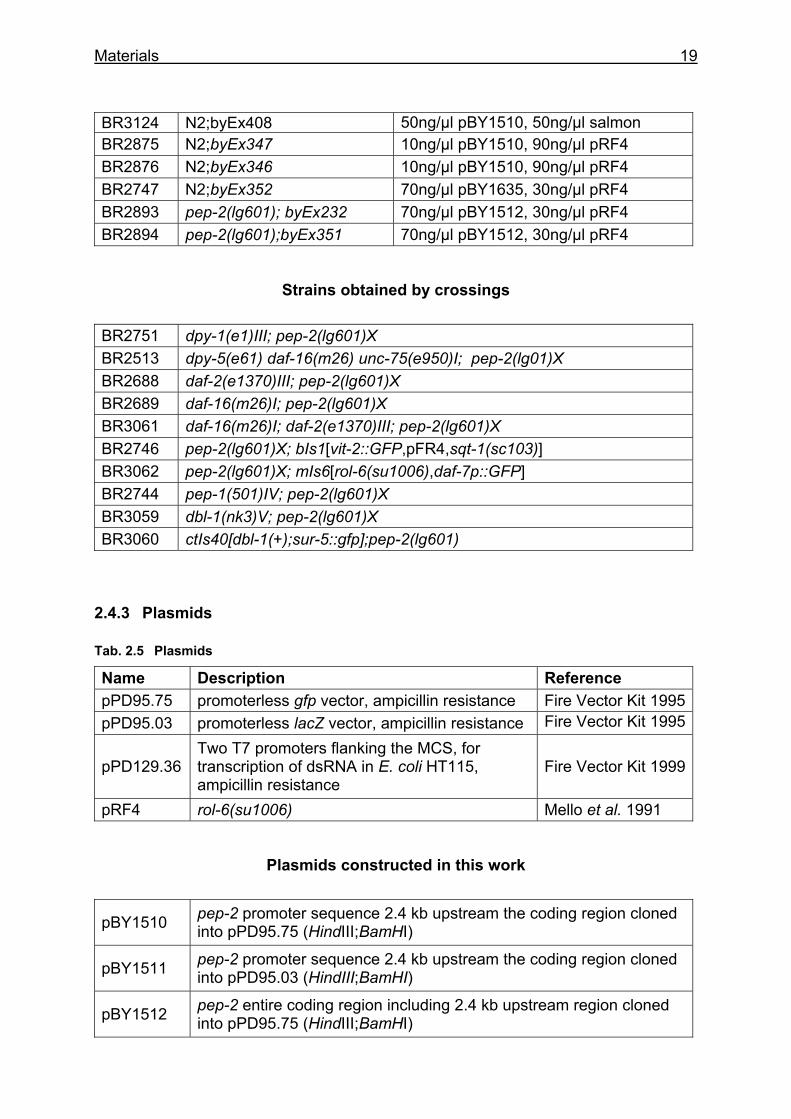
Materials 19
BR3124 N2;byEx408 50ng/µl pBY1510, 50ng/µl salmon BR2875 N2;byEx347 10ng/µl pBY1510, 90ng/µl pRF4 BR2876 N2;byEx346 10ng/µl pBY1510, 90ng/µl pRF4 BR2747 N2;byEx352 70ng/µl pBY1635, 30ng/µl pRF4 BR2893 pep-2(lg601); byEx232 70ng/µl pBY1512, 30ng/µl pRF4 BR2894 pep-2(lg601);byEx351 70ng/µl pBY1512, 30ng/µl pRF4
Strains obtained by crossings
BR2751 dpy-1(e1)III; pep-2(lg601)X BR2513 dpy-5(e61) daf-16(m26) unc-75(e950)I; pep-2(lg01)X BR2688 daf-2(e1370)III; pep-2(lg601)X BR2689 daf-16(m26)I; pep-2(lg601)X BR3061 daf-16(m26)I; daf-2(e1370)III; pep-2(lg601)X BR2746 pep-2(lg601)X; bIs1[vit-2::GFP,pFR4,sqt-1(sc103)] BR3062 pep-2(lg601)X; mIs6[rol-6(su1006),daf-7p::GFP] BR2744 pep-1(501)IV; pep-2(lg601)X BR3059 dbl-1(nk3)V; pep-2(lg601)X BR3060 ctIs40[dbl-1(+);sur-5::gfp];pep-2(lg601)
2.4.3 Plasmids
Tab. 2.5 Plasmids
Name Description Reference pPD95.75 promoterless gfp vector, ampicillin resistance Fire Vector Kit 1995pPD95.03 promoterless lacZ vector, ampicillin resistance Fire Vector Kit 1995
pPD129.36 Two T7 promoters flanking the MCS, for transcription of dsRNA in E. coli HT115, ampicillin resistance
Fire Vector Kit 1999
pRF4 rol-6(su1006) Mello et al. 1991
Plasmids constructed in this work
pBY1510 pep-2 promoter sequence 2.4 kb upstream the coding region cloned into pPD95.75 (HindIII;BamHI)
pBY1511 pep-2 promoter sequence 2.4 kb upstream the coding region cloned into pPD95.03 (HindIII;BamHI)
pBY1512 pep-2 entire coding region including 2.4 kb upstream region cloned into pPD95.75 (HindIII;BamHI)
Materials 20
pBY1635 pep-1 promoter sequence 3.8 kb upstream the translational start cloned into pPD95.75 (PstI;BamHI)
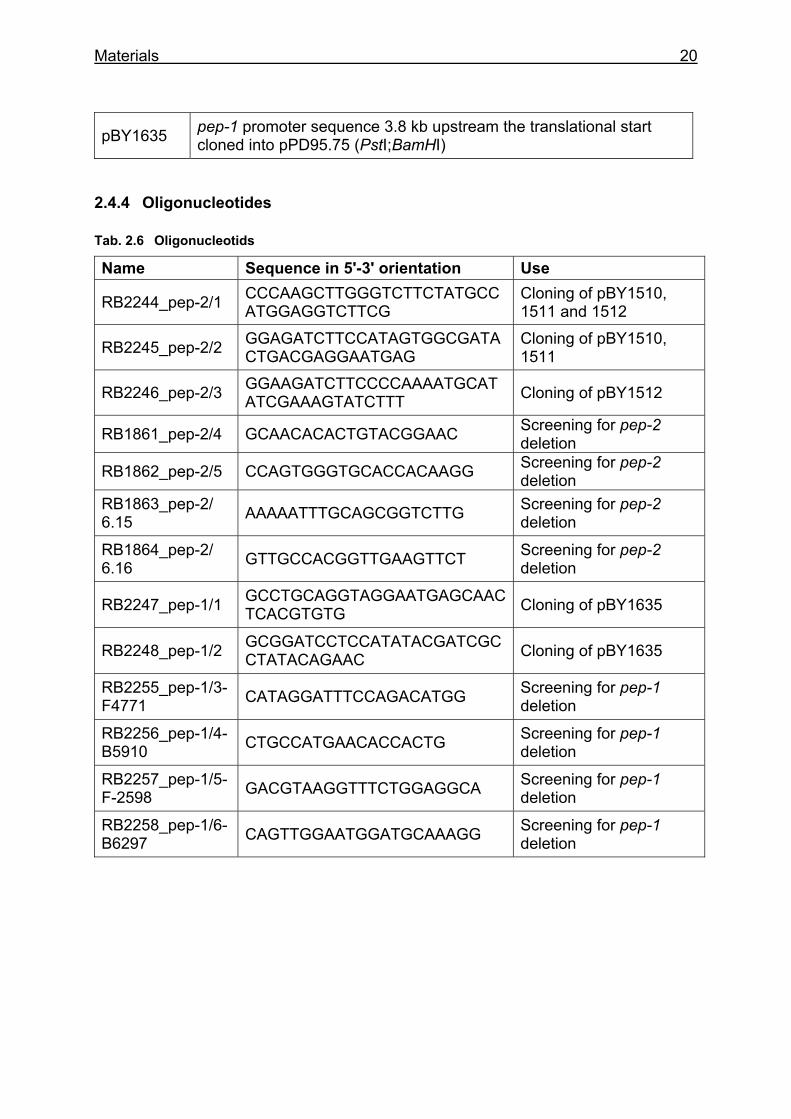
2.4.4 Oligonucleotides
Tab. 2.6 Oligonucleotids
Name Sequence in 5'-3' orientation Use
RB2244_pep-2/1 CCCAAGCTTGGGTCTTCTATGCCATGGAGGTCTTCG
Cloning of pBY1510, 1511 and 1512
RB2245_pep-2/2 GGAGATCTTCCATAGTGGCGATACTGACGAGGAATGAG
Cloning of pBY1510, 1511
RB2246_pep-2/3 GGAAGATCTTCCCCAAAATGCATATCGAAAGTATCTTT Cloning of pBY1512
RB1861_pep-2/4 GCAACACACTGTACGGAAC Screening for pep-2 deletion
RB1862_pep-2/5 CCAGTGGGTGCACCACAAGG Screening for pep-2 deletion
RB1863_pep-2/ 6.15 AAAAATTTGCAGCGGTCTTG Screening for pep-2
deletion
RB1864_pep-2/ 6.16 GTTGCCACGGTTGAAGTTCT Screening for pep-2
deletion
RB2247_pep-1/1 GCCTGCAGGTAGGAATGAGCAACTCACGTGTG Cloning of pBY1635
RB2248_pep-1/2 GCGGATCCTCCATATACGATCGCCTATACAGAAC Cloning of pBY1635
RB2255_pep-1/3-F4771 CATAGGATTTCCAGACATGG Screening for pep-1
deletion
RB2256_pep-1/4-B5910 CTGCCATGAACACCACTG Screening for pep-1
deletion
RB2257_pep-1/5-F-2598 GACGTAAGGTTTCTGGAGGCA Screening for pep-1
deletion
RB2258_pep-1/6-B6297 CAGTTGGAATGGATGCAAAGG Screening for pep-1
deletion
Methods 21
3 Methods 3.1 C. elegans methods
3.1.1 Breeding of C. elegans
The animals were maintained on NGM plates seeded with E. coli OP50 like
previously described (Brenner, 1974). Petri dishes with the diameters 3.5 cm, 5 cm
and 9 cm were used in this work. Animals were kept in air permeable cardboard
boxes at 15, 20 or 25°C. The basic culture methods (handling of C. elegans,
decontamination, freezing, preparation of synchronized cultures and specific stages)
were done as previously described (Lewis and Fleming 1995).
3.1.2 Genetic crosses
L4 hermaphrodites and males were placed on a small (3.5 cm) plate in a 1:3 ratio.
After 24, 48 and 72 hours, the adult hermaphrodites were transferred to a fresh plate,
the males were removed. Progeny laid within the first 24 hours were discarded,
because they were likely to represent self progeny, instead of cross progeny. About
ten of the following F1 animals were singled and their progeny (F2) were further
analysed. All strains obtained by crossings in this work are listed in Tab. 2.4.
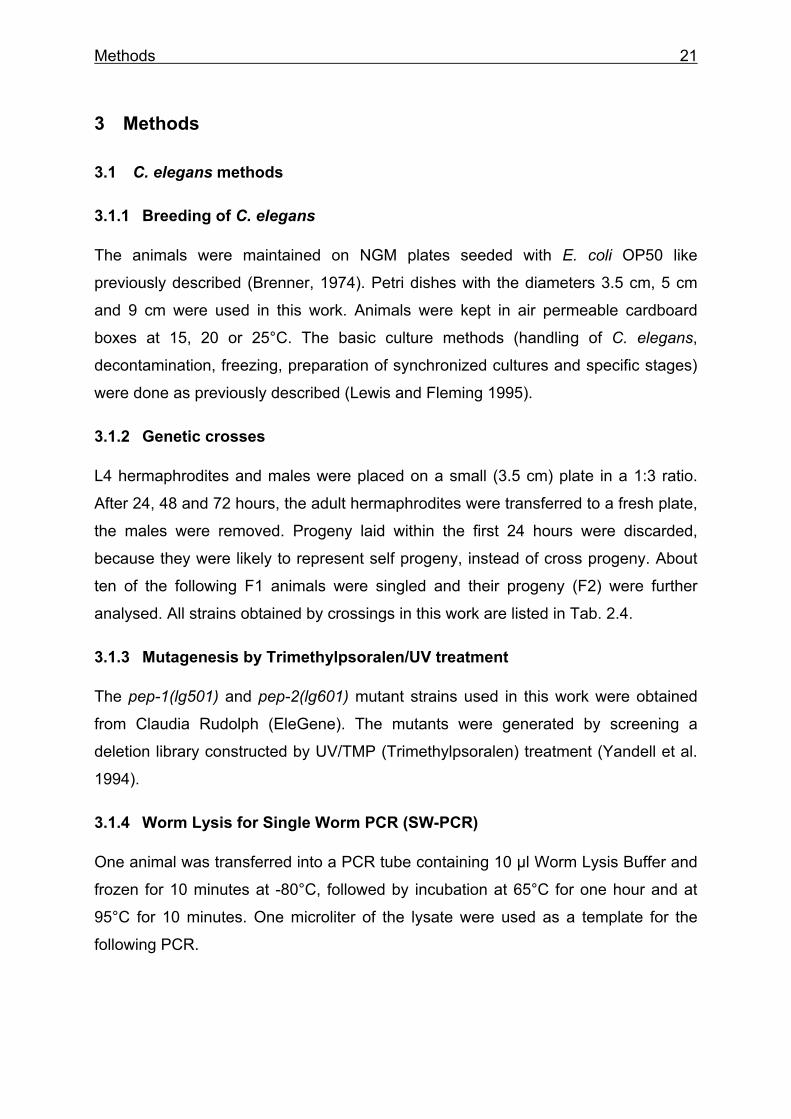
3.1.3 Mutagenesis by Trimethylpsoralen/UV treatment
The pep-1(lg501) and pep-2(lg601) mutant strains used in this work were obtained
from Claudia Rudolph (EleGene). The mutants were generated by screening a
deletion library constructed by UV/TMP (Trimethylpsoralen) treatment (Yandell et al.
1994).
3.1.4 Worm Lysis for Single Worm PCR (SW-PCR)
One animal was transferred into a PCR tube containing 10 µl Worm Lysis Buffer and
frozen for 10 minutes at -80°C, followed by incubation at 65°C for one hour and at
95°C for 10 minutes. One microliter of the lysate were used as a template for the
following PCR.
Methods 22
3.1.5 Transformation of C. elegans
DNA plasmids were transformed into the animals by microinjection as previously
described (Fire 1986; Mello et al. 1991). All transgenic lines generated during this
work are listed in Tab. 2.4.
3.1.6 X-ray-induced integration of extrachromosomal arrays
5 NGM plates (9 cm) with about 30 L4 larvae bearing the extrachromosomal array
were irradiated with x-rays (4500 rad). 3-5 days later, 100 F1s carrying the array
were singled to new plates (3.5 cm). From each F1 animal that had progeny, 4 F2s
were picked onto individual plates. After the F2 animals have grown up and
reproduced, the plates were examined to identify those that laid 100% transgene
progeny. To confirm that lines have integrated the array and to get rid of unwanted
mutations, integrated lines were crossed against wild type background.
3.1.7 Staining for lacZ expression
Worms were washed off 5 cm NGM plates, transferred into a 15 ml Falcon tube and
spun down for 1 min at 3000 rpm. The supernatant was removed, the animals were
transferred into a 1.5 ml Eppendorf tube and centrifuged for 1 min at 3000 rpm. After
removing the supernatant as carefully as possible, the Eppendorf tube was capped
and frozen in liquid nitrogen. Than, the caps were opened and the frozen animals
were lyophilized for about 30 minutes (speed-vac). 250 µl cold acetone was added
and the sample was incubated at -20°C for three minutes. The acetone was removed
and the probe was dried in the speed vac. After adding 200 µl of the staining solution
and incubation at 37°C (5 min to 1 hr), the staining was observed with normal light
microscopy using standard Nomarski optics.
3.1.8 Feeding assay with ß-Ala-Lys-AMCA
Mixed staged animals were washed off agar plates with M9 buffer. Equal amounts of
worms were incubated in a 1 mM ß-Ala-Lys-AMCA solution (in M9) for two to three
hours, followed by at least four washing steps with M9. As control, worms were
incubated in M9 buffer for the same time.
Methods 23
3.1.9 Assays for developmental and behavioral phenotypes
Body length measurements: Synchronized animals were collected at the L1 stage (t
= 0) and 20 individual worms were analyzed every day until adulthood (for body
length during larval development) or 0 – 5 days after L4 moulting (for body length
during adulthood). Pictures were taken with Axioplan 2 (Zeiss) and the precise body
length was measured with Axio Vision 3.0 software.
Postembryonic development: To determine the generation time of worms, 5-15 adult
hermaphrodites were placed on fresh plates for egg-laying. Measurements were
started after two to three hours. The P0 generation was removed and 10 to 50 worms
of the progeny were singled. After two or more days (depending on the strain), the F1
animals were monitored every 2 hours until they laid the first egg.
Embryonic development: Adult hermaphrodites were placed in a drop of water and
cut open with a razor blade. Eggs at the 2-cell stage were picked, placed individually
onto fresh plates and monitored every 30 min until hatching.
Self-brood size: Individual L4 larvae were placed onto fresh plated and incubated at
20°C until they had laid the first few eggs. Then, the hermaphrodites were transferred
onto fresh plates daily to prevent overcrowding. The progeny was counted two to
three days after removal of the P0.
Eggs per hour: Five hermaphrodites that had reached adulthood one day (wild type)
or two days (pep-2 mutant) before were allowed to lay eggs for 5 hours. Then, P0
were removed and the progeny (F1) was counted two to four days after removal of
the parents.
Yolk protein distribution: The distribution of yolk protein was analysed by visual
inspection of GFP expression in DH1033 bIs1[vit-2::gfp,pFR4,sqt-1(sc103)] (Grant
and Hirsh 1999) and BR2746 bIs1[vit-2::GFP,pFR4,sqt-1(sc103)]; pep-
2(lg601)X.animals.
Male mating test: unc-4(e120); fem-1(hc17ts) double mutants (BR2068) were grown
at 15°C, the permissive temperature. Eggs, collected by hypochlorite treatment, were
placed on fresh plates and incubated at 25°C, the restrictive temperature. Three
young adult unc-4(e120); fem-1(hc17ts) double mutants grown at 25°C were used for
the mating with either ten wild type or ten pep-2 mutant males per plate. After 14
Methods 24
hours, the males were removed from the plates and the progeny laid by the unc-
4(e120); fem-1(hc17ts) was scored.
Pharyngeal pumping: Pharyngeal pumping was visualized through the dissection
microscope. The animals were scored for 30 sec on OP50 and each animal was
scored twice.
Defecation: Hermaphrodites were maintained at 20°C and the length of their
defecation cycle was measured. Defecation cycle length was defined as the duration
between the first muscular contraction and the expulsion of one defecation. Ten
defecation cycles were measured for each animal.
Lifespan: For the lifespan analysis, 5 to 10 adult hermaphrodites were transferred
onto fresh plates for egg laying and after 8-10 hours, the starting point for life span
measurements, the parents were removed. Animals were cultured at 20°C and
examined every day until death. They were scored death when they did no longer
move in response to prodding them with a platinum pick. Each day, any dead worms
were removed from the plates and the deaths were recorded. Experiments were
started with 100 worms per genotype (10 per plate) and the wild type (N2) was
always included as a control. For the assays at 25°C, the animals were grown at
15°C until the L4 molt, then they were shifted to 25°C. The L4 molting was used as a
starting point for the measurement of adult life span at 25°C.
Heat tolerance: Thermotolerance of various strains was measured using young
adults at 35°C. Synchronously cultured animals were kept on NGM plates with OP50
at 20°C until the young adult stage. At the start of the thermotolerance assay, at least
20 worms from each strain were transferred to a fresh NGM plate with OP50, and
shifted to 35°C. Numbers of surviving and dead animals were scored every 2h.
3.1.10 Amino acid supplementation
For the experiments with amino acid supplementation, 300 µl amino acids (mixture
1:1 of MEM (100x) non-essential amino acids and MEM amino acids (50x) without L-
glutamine were added on the top of agar plates (35 mm) seeded with E.coli. Fresh
plates were prepared each day during the experiment.
Methods 25
3.1.11 Culturing aged, synchronized animals for protein carbonyl determination
Hermaphrodites of wild type and the different mutants were grown on NGM agar
plates seeded with E.coli OP50. Eggs were collected by using sodium hypochlorite
and allowed to hatch by incubating them overnight at 20°C in M9 buffer. Newly
hatched L1 larvae were cultured on 15 cm agar plates seeded with OP50. To prevent
reproduction, 5-fluoro-2’deoxyuridine (dFUR; Sigma Chemical, St. Louis, MO) was
added to the agar to a final concentration of 40 µM after animals had reached
adulthood.
3.1.12 Protein extraction from C. elegans
For protein extraction and carbonyl measurements, the animals were washed off the
agar plates with M9 buffer. Living animals were collected in 15 ml tubes by floating
on sucrose followed by four washing steps with M9 buffer. After washing, the
“wormpellet” was resuspended in 5 mM EDTA, centrifuged, and the supernatant was
discarded. The resulting “wormpellet” was frozen in liquid nitrogen and stored at -
80°C until use. The frozen pellet was allowed to thaw in the 15 ml tube on ice and
filled up to a total volume of 1.5 ml with 5 mM EDTA. 10 µl of a tablet with protease-
inhibitors (complete Mini, Roche) solved in 1 ml 5 mM EDTA were added to the
probe. A sterile mortar was cooled down with liquid nitrogen and the suspension was
dropped into the liquid nitrogen to get small frozen particles, followed by strong
pounding until the particles liquefied again. The suspension was quickly transferred
to a fresh 15 ml tube, kept on ice and sonified three times for one minute. Finally the
probe was spun down for 15 minutes with 4500 rpm at 4°C and the supernatant was
transferred to a fresh tube. Protein concentration was determined by the Bio-Rad
Protein Assay (BIO-RAD Laboratories GmbH, München)
3.1.13 Protein carbonyl measurement
Protein carbonyl content was measured by the method of Levine and colleagues
(Levine et al. 1990) with slight modifications. One ml of 20 % trichloroacetic acid
(TCA) was added to a 1 ml aliquot of the protein homogenate, and the mixture was
allowed to stand for 15 minutes at 4°C for protein precipitation. After centrifugation for
15 minutes at 12,000 g, the supernatant was discarded, and 500 µl of 10 mM 2,4-
Methods 26
dinitrophenylhydrazine (DNPH) dissolved in 2 M HCl was added to the pelleted
protein. In parallel, a blank was prepared by treatment with 2 M HCl without DNPH.
After 60 min incubation at 20°C, 500 µl of TCA was added to the sample and kept 15
minutes at 4°C. After centrifugation at 12,000 g for 15 minutes, the supernatant was
discarded and the pellets were washed three times by centrifugation with 1 ml of a
mixture (1:1 v/v) of 40% TCA with 100% ethanol and ethyl acetate to remove free
reagent. Before each centrifugation step, the samples were allowed to stand 15
minutes at 4°C. The precipitated protein was redissolved in 800 µl of 6 M guanidine
hydrochloride solution. After incubation for 3 hours at 37°C, the samples were
centrifuged at 600 g for 10 minutes. The amount of DNPH bound to protein was
quantified by absorbance at 380 nm and converted to nmoles DNPH using the molar
absorption coefficient of 22 mM-1cm-1. Three to nine separate determinations were
used to calculate the mean ± SEM in each different age group.
3.1.14 RNA Interference (RNAi) experiments
For RNAi-through-feeding experiments the partial cDNA from yk18c10 was cloned
into Vector pPD129.36. The resulting plasmid was a gift from A. Gartner, Munich,
and was used in RNAi feeding experiments like previously described (Kamath et al.
2001). L4-stage worms were placed on RNAi-producing plates and were allowed to
produce progeny. Adults were removed or transferred to new RNAi-producing plates.
First and third generation progeny grown on RNAi plates were scored for a TOR
phenotype and yielded identical results.
3.1.15 Uptake assay with radioactive labelled amino acids
For the measurements of 3H-Leucine and 14C-Lysine uptake, the animals have been
synchronized by hypochlorite treatment (3.1.11). For the uptake studies, the animals
were washed off the agar plates as young adults with M9 buffer, collected in 15 ml
tubes and washed two more times with M9 buffer. The wormpellet was diluted with
M9 buffer to get 100 respectively 200 animals in 100 µl wormsuspension. The uptake
of the labeled amino acids was performed in 96-well filter plates with 0.5 and 0.25
µCi/well for 3H-Leucine (specific activity: 170 Ci/mmol) and 0.1 µCi/well for 14C-Lysine
(specific activity: 322 mCi/mmol). To show inhibition of radioactive substrate uptake,
20 mM Leucine or 8 mM Lysine, respectively, were added to the incubation mixture.
After two hours of incubation with slightly shaking, the solution was sucked of and the
Methods 27
animals remaining on the filter were washed three times with M9 buffer. Finally the
radioactivity of each well was measured in a β-counter type 1450 MicroBeta Trilux.
3.2 Molecular biology techniques
Following methods were applied as previous described:
• Preparation of competent E. coli (DH5α, HT115) (Maniatis et al. 1982)
• Transformation of E. coli (Hanahan 1985)
• Plasmid preparation from E. coli (QIAgen, Hilden)
• Digestion of DNA with Restriction Endonucleases (Sambrook et al., 1989)
• Gel-Electrophoresis (Agarose) (Maniatis et al. 1982)
• Ligation of DNA fragments (Maniatis et al. 1982)
• Polymerase Chain Reaction (PCR) (Maniatis et al. 1982)
A representative PCR Mixture (50µl) contained:
- 10-100 ng template-DNA (C. elegans genomic DNA, cDNA, Plasmid-DNA or Worm-Lysate)
- 5 µl 10x Polymerase buffer mix with MgCl2 (accordingly to the used Taq-Polymerase)
- 10 pmol sense Oligonucleotide
- 10 pmol antisense Oligonucleotide
- 10 µl dNTP-Mix (each 2mM dATP, dCTP, dGTP, dTTP)
- 0.3-1µl Taq-Polymerase (2.5U)
Temperature Cycling:
Denaturation: 2 min at 94°C
30-35 cycles under following conditions:
- Primer annealing: 40 sec at 45-58°C depending on the melting temperature of the oligonucleotides
- Extending step: 1-3 min (depending on fragment size) at 68 or 72°C (depending on Taq DNA polymerase)
Final extending: 5 min at 68 or 72°C
Results 28
4 Results 4.1 Analysis of PEP-2, the low-affinity, high capacity peptide transporter in C.
elegans
4.1.1 Identification of pep-2 gene expression with GFP and lacZ reporter constructs
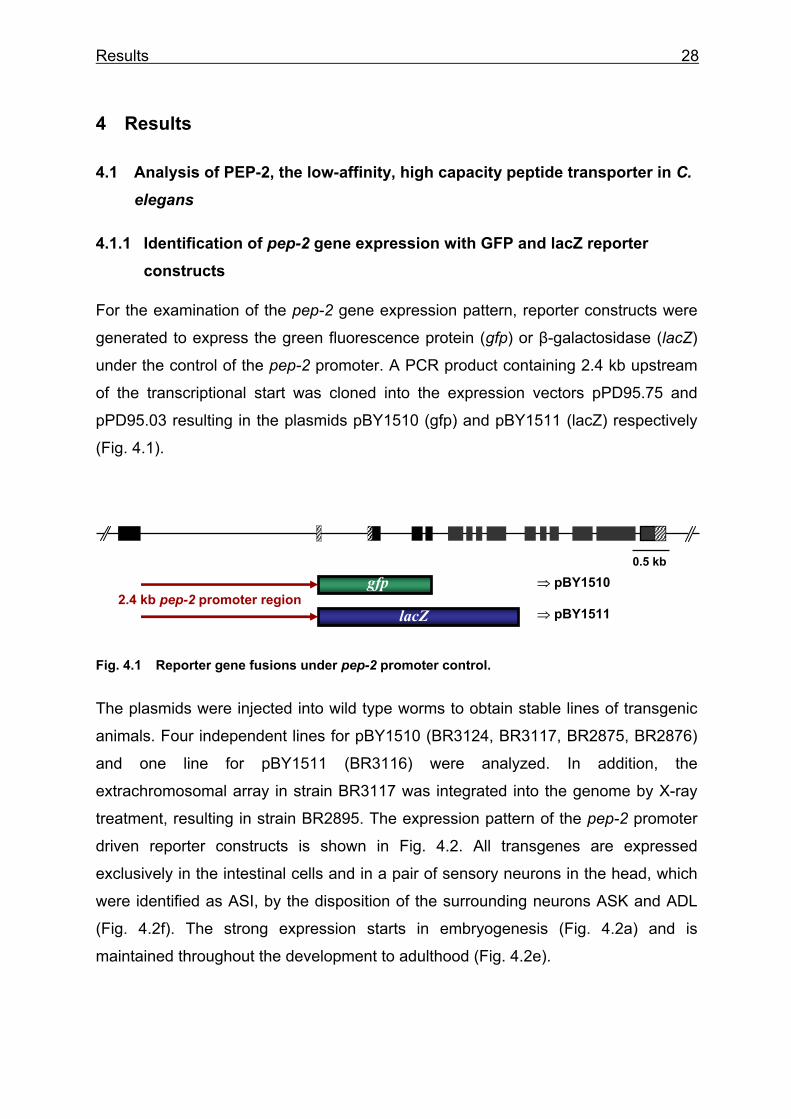
For the examination of the pep-2 gene expression pattern, reporter constructs were
generated to express the green fluorescence protein (gfp) or β-galactosidase (lacZ)
under the control of the pep-2 promoter. A PCR product containing 2.4 kb upstream
of the transcriptional start was cloned into the expression vectors pPD95.75 and
pPD95.03 resulting in the plasmids pBY1510 (gfp) and pBY1511 (lacZ) respectively
(Fig. 4.1).
Fig. 4.1 Reporter gene fusions under pep-2 promoter control.
The plasmids were injected into wild type worms to obtain stable lines of transgenic
animals. Four independent lines for pBY1510 (BR3124, BR3117, BR2875, BR2876)
and one line for pBY1511 (BR3116) were analyzed. In addition, the
extrachromosomal array in strain BR3117 was integrated into the genome by X-ray
treatment, resulting in strain BR2895. The expression pattern of the pep-2 promoter
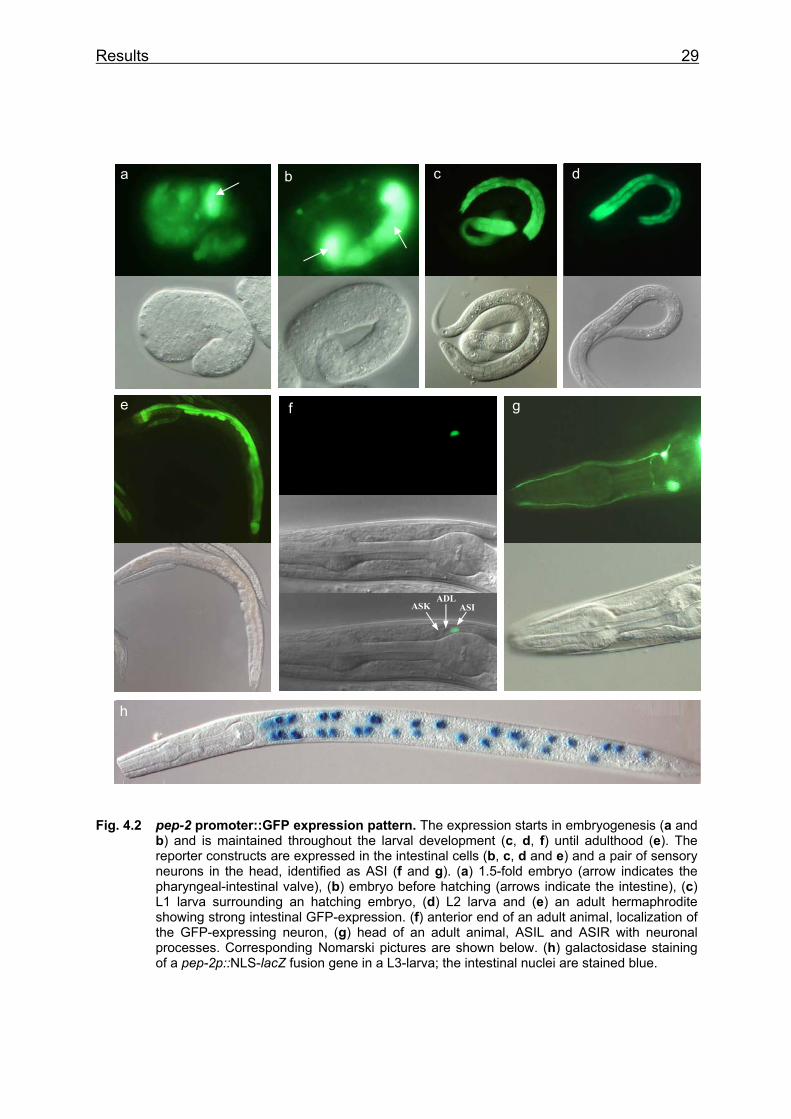
driven reporter constructs is shown in Fig. 4.2. All transgenes are expressed
exclusively in the intestinal cells and in a pair of sensory neurons in the head, which
were identified as ASI, by the disposition of the surrounding neurons ASK and ADL
(Fig. 4.2f). The strong expression starts in embryogenesis (Fig. 4.2a) and is
maintained throughout the development to adulthood (Fig. 4.2e).
2.4 kb pep-2 promoter region ⇒ pBY1510
⇒ pBY1511
gfp
lacZ
0.5 kb
Results 29
Fig. 4.2 pep-2 promoter::GFP expression pattern. The expression starts in embryogenesis (a and b) and is maintained throughout the larval development (c, d, f) until adulthood (e). The reporter constructs are expressed in the intestinal cells (b, c, d and e) and a pair of sensory neurons in the head, identified as ASI (f and g). (a) 1.5-fold embryo (arrow indicates the pharyngeal-intestinal valve), (b) embryo before hatching (arrows indicate the intestine), (c) L1 larva surrounding an hatching embryo, (d) L2 larva and (e) an adult hermaphrodite showing strong intestinal GFP-expression. (f) anterior end of an adult animal, localization of the GFP-expressing neuron, (g) head of an adult animal, ASIL and ASIR with neuronal processes. Corresponding Nomarski pictures are shown below. (h) galactosidase staining of a pep-2p::NLS-lacZ fusion gene in a L3-larva; the intestinal nuclei are stained blue.
b
g
a c d
f
ASI ASK ADL
h
b
e g
Results 30
4.1.2 Identification of the mutant allele pep-2(lg601)
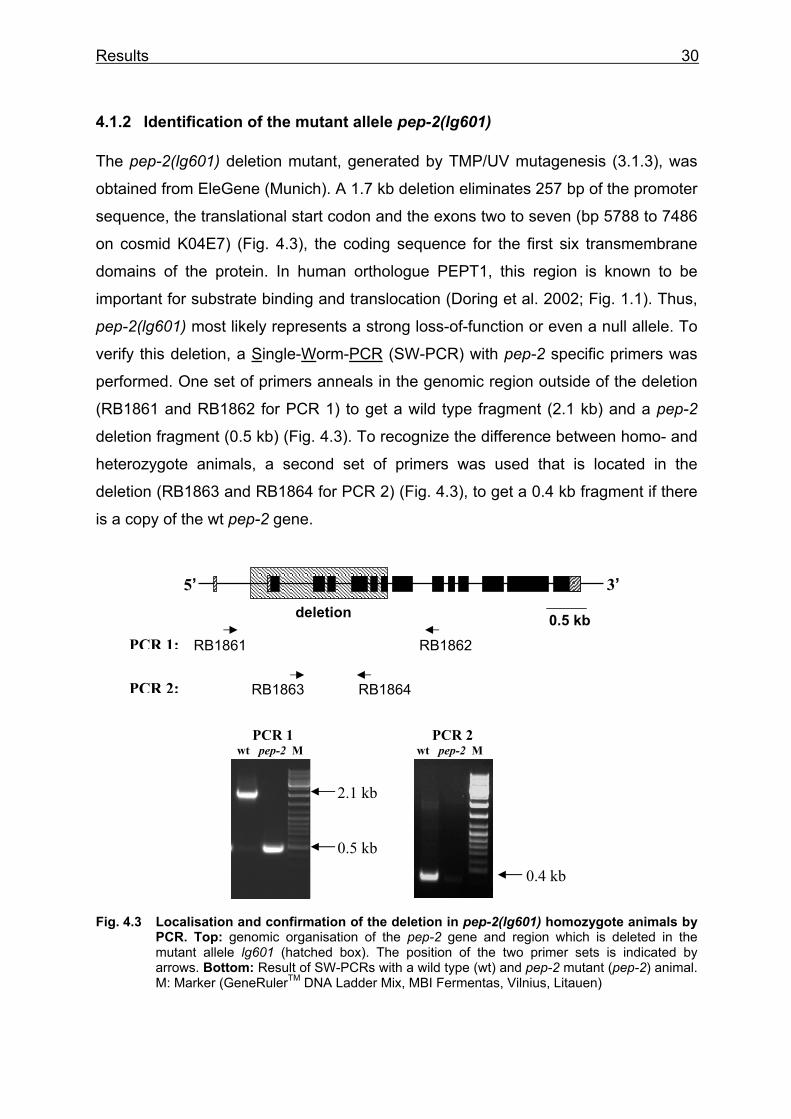
The pep-2(lg601) deletion mutant, generated by TMP/UV mutagenesis (3.1.3), was
obtained from EleGene (Munich). A 1.7 kb deletion eliminates 257 bp of the promoter
sequence, the translational start codon and the exons two to seven (bp 5788 to 7486
on cosmid K04E7) (Fig. 4.3), the coding sequence for the first six transmembrane
domains of the protein. In human orthologue PEPT1, this region is known to be
important for substrate binding and translocation (Doring et al. 2002; Fig. 1.1). Thus,
pep-2(lg601) most likely represents a strong loss-of-function or even a null allele. To
verify this deletion, a Single-Worm-PCR (SW-PCR) with pep-2 specific primers was
performed. One set of primers anneals in the genomic region outside of the deletion
(RB1861 and RB1862 for PCR 1) to get a wild type fragment (2.1 kb) and a pep-2
deletion fragment (0.5 kb) (Fig. 4.3). To recognize the difference between homo- and
heterozygote animals, a second set of primers was used that is located in the
deletion (RB1863 and RB1864 for PCR 2) (Fig. 4.3), to get a 0.4 kb fragment if there
is a copy of the wt pep-2 gene.
Fig. 4.3 Localisation and confirmation of the deletion in pep-2(lg601) homozygote animals by PCR. Top: genomic organisation of the pep-2 gene and region which is deleted in the mutant allele lg601 (hatched box). The position of the two primer sets is indicated by arrows. Bottom: Result of SW-PCRs with a wild type (wt) and pep-2 mutant (pep-2) animal. M: Marker (GeneRulerTM DNA Ladder Mix, MBI Fermentas, Vilnius, Litauen)
PCR 1 wt pep-2 M
2.1 kb
0.5 kb
PCR 2 wt pep-2 M
0.4 kb
5’ deletion 0.5 kb
RB1861 RB1862
RB1864RB1863
3’
PCR 1:
PCR 2:
Results 31
To eliminate background mutations in the pep-2(lg601) deletion mutant, the strain
was crossed against N2 wild type animals seven times. After the last crossing step, a
homozygote mutant was verified by SW-PCR again.
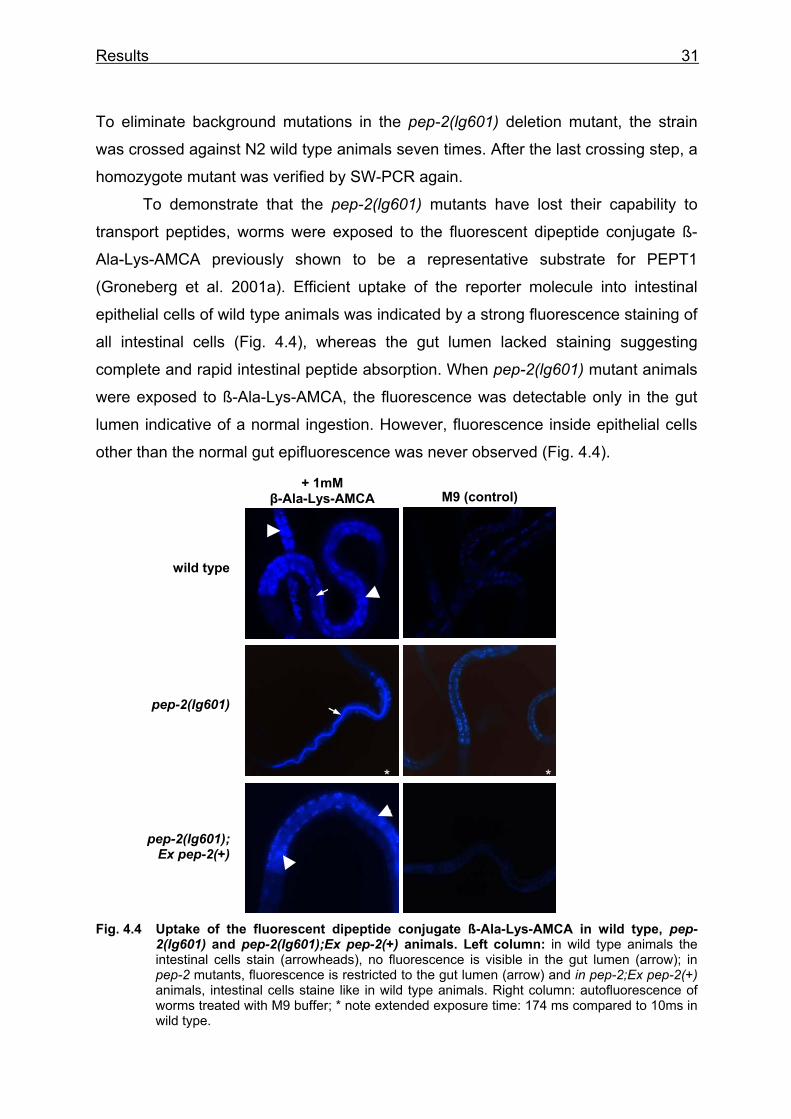
To demonstrate that the pep-2(lg601) mutants have lost their capability to
transport peptides, worms were exposed to the fluorescent dipeptide conjugate ß-
Ala-Lys-AMCA previously shown to be a representative substrate for PEPT1
(Groneberg et al. 2001a). Efficient uptake of the reporter molecule into intestinal
epithelial cells of wild type animals was indicated by a strong fluorescence staining of
all intestinal cells (Fig. 4.4), whereas the gut lumen lacked staining suggesting
complete and rapid intestinal peptide absorption. When pep-2(lg601) mutant animals
were exposed to ß-Ala-Lys-AMCA, the fluorescence was detectable only in the gut
lumen indicative of a normal ingestion. However, fluorescence inside epithelial cells
other than the normal gut epifluorescence was never observed (Fig. 4.4).
Fig. 4.4 Uptake of the fluorescent dipeptide conjugate ß-Ala-Lys-AMCA in wild type, pep- 2(lg601) and pep-2(lg601);Ex pep-2(+) animals. Left column: in wild type animals the intestinal cells stain (arrowheads), no fluorescence is visible in the gut lumen (arrow); in pep-2 mutants, fluorescence is restricted to the gut lumen (arrow) and in pep-2;Ex pep-2(+) animals, intestinal cells staine like in wild type animals. Right column: autofluorescence of worms treated with M9 buffer; * note extended exposure time: 174 ms compared to 10ms in wild type.
M9 (control) + 1mM
β-Ala-Lys-AMCA
**
wild type
pep-2(lg601)
pep-2(lg601); Ex pep-2(+)
Results 32
A plasmid containing the entire predicted coding region of the pep-2 gene and the
2.4 kb upstream region (pBY1512) was injected into pep-2 mutant animals. Two
independent lines carrying this transgene (pep-2(lg601);byEx232 and pep-
2(lg601);byEx351, pep-2;Ex pep-2(+) in Fig. 4.4) were also tested for β-Ala-Lys-
AMCA uptake. The staining in the intestinal cells in 28% of the transgenic animals
indicates that the expression of the wild type gene in the pep-2 mutant is sufficient to
restore intestinal peptide uptake. Thus the pep-2 deletion is responsible for the loss
of β-Ala-Lys-AMCA uptake.
4.1.3 Analysis of pep-2(lg601) mutant phenotype
pep-2(lg601) homozygous mutant animals are viable but display strong
developmental defects. During a first visual inspection, it became obvious that the
mutant animals grow much slower, have less progeny and are smaller compared to
wild type animals. For a detailed phenotypic description, the following assays were
performed.
4.1.3.1 Measurement of body size
In C. elegans, there are different mutants known with a variable body size (Brenner
1974). On the one hand dumpy (Dpy) and small (Sma) mutants are shorter than wild
type, on the other hand, long (Lon) mutants are longer (and thinner) compared to
wild type animals. To measure the body length of pep-2(lg601) mutant animals
during larval development, worms have been synchronized by hypochlorite treatment
(Lewis and Fleming 1995). The measurements were started in L1 larvae (t = 0) and
continued until the animals reached adulthood. In another experiment, the
measurements were started with L4 animals (t = 0) and continued through adulthood.
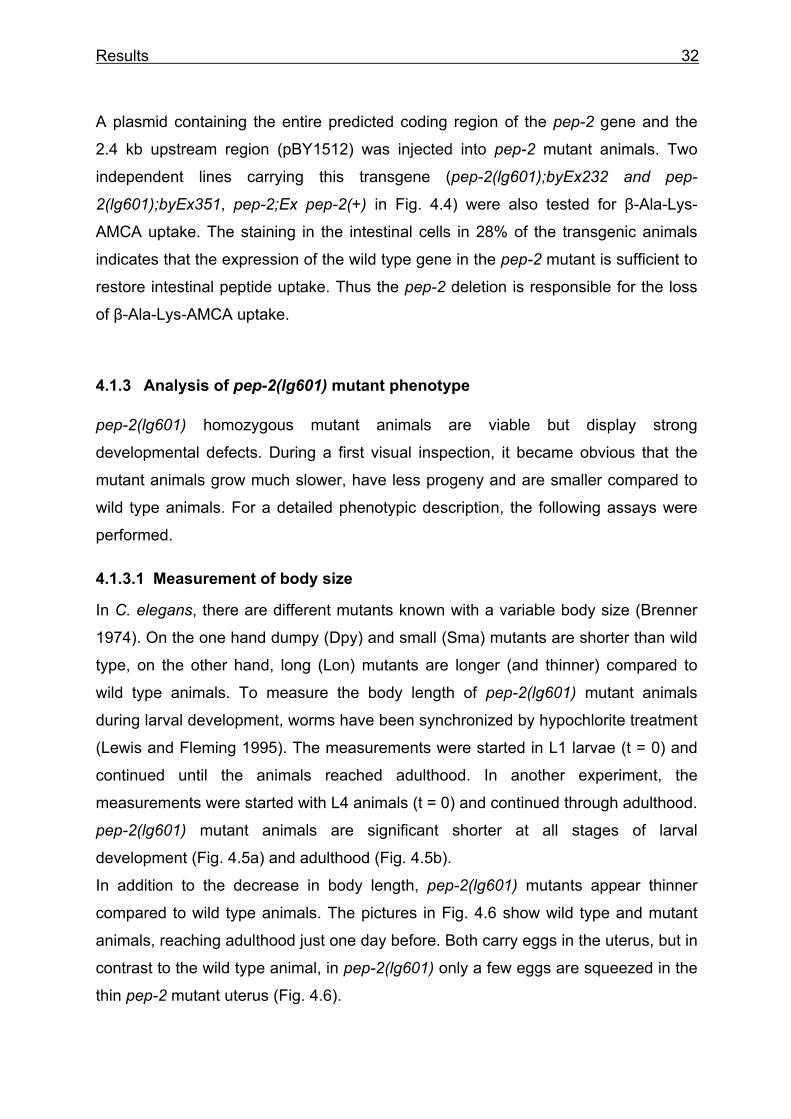
pep-2(lg601) mutant animals are significant shorter at all stages of larval
development (Fig. 4.5a) and adulthood (Fig. 4.5b).
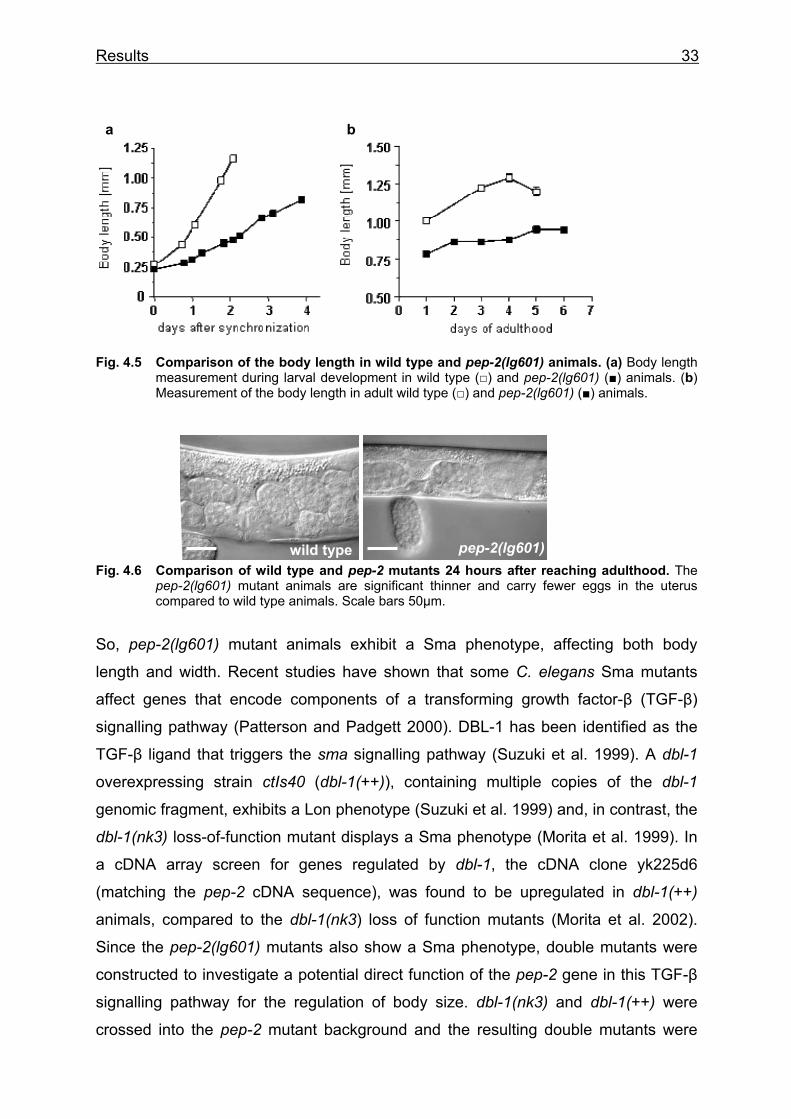
In addition to the decrease in body length, pep-2(lg601) mutants appear thinner
compared to wild type animals. The pictures in Fig. 4.6 show wild type and mutant
animals, reaching adulthood just one day before. Both carry eggs in the uterus, but in
contrast to the wild type animal, in pep-2(lg601) only a few eggs are squeezed in the
thin pep-2 mutant uterus (Fig. 4.6).
Results 33
Fig. 4.5 Comparison of the body length in wild type and pep-2(lg601) animals. (a) Body length measurement during larval development in wild type (□) and pep-2(lg601) (■) animals. (b) Measurement of the body length in adult wild type (□) and pep-2(lg601) (■) animals.
Fig. 4.6 Comparison of wild type and pep-2 mutants 24 hours after reaching adulthood. The pep-2(lg601) mutant animals are significant thinner and carry fewer eggs in the uterus compared to wild type animals. Scale bars 50µm.
So, pep-2(lg601) mutant animals exhibit a Sma phenotype, affecting both body
length and width. Recent studies have shown that some C. elegans Sma mutants
affect genes that encode components of a transforming growth factor-β (TGF-β)
signalling pathway (Patterson and Padgett 2000). DBL-1 has been identified as the
TGF-β ligand that triggers the sma signalling pathway (Suzuki et al. 1999). A dbl-1
overexpressing strain ctIs40 (dbl-1(++)), containing multiple copies of the dbl-1
genomic fragment, exhibits a Lon phenotype (Suzuki et al. 1999) and, in contrast, the
dbl-1(nk3) loss-of-function mutant displays a Sma phenotype (Morita et al. 1999). In
a cDNA array screen for genes regulated by dbl-1, the cDNA clone yk225d6
(matching the pep-2 cDNA sequence), was found to be upregulated in dbl-1(++)
animals, compared to the dbl-1(nk3) loss of function mutants (Morita et al. 2002).
Since the pep-2(lg601) mutants also show a Sma phenotype, double mutants were
constructed to investigate a potential direct function of the pep-2 gene in this TGF-β
signalling pathway for the regulation of body size. dbl-1(nk3) and dbl-1(++) were
crossed into the pep-2 mutant background and the resulting double mutants were
a b
wild type pep-2(lg601)
Results 34
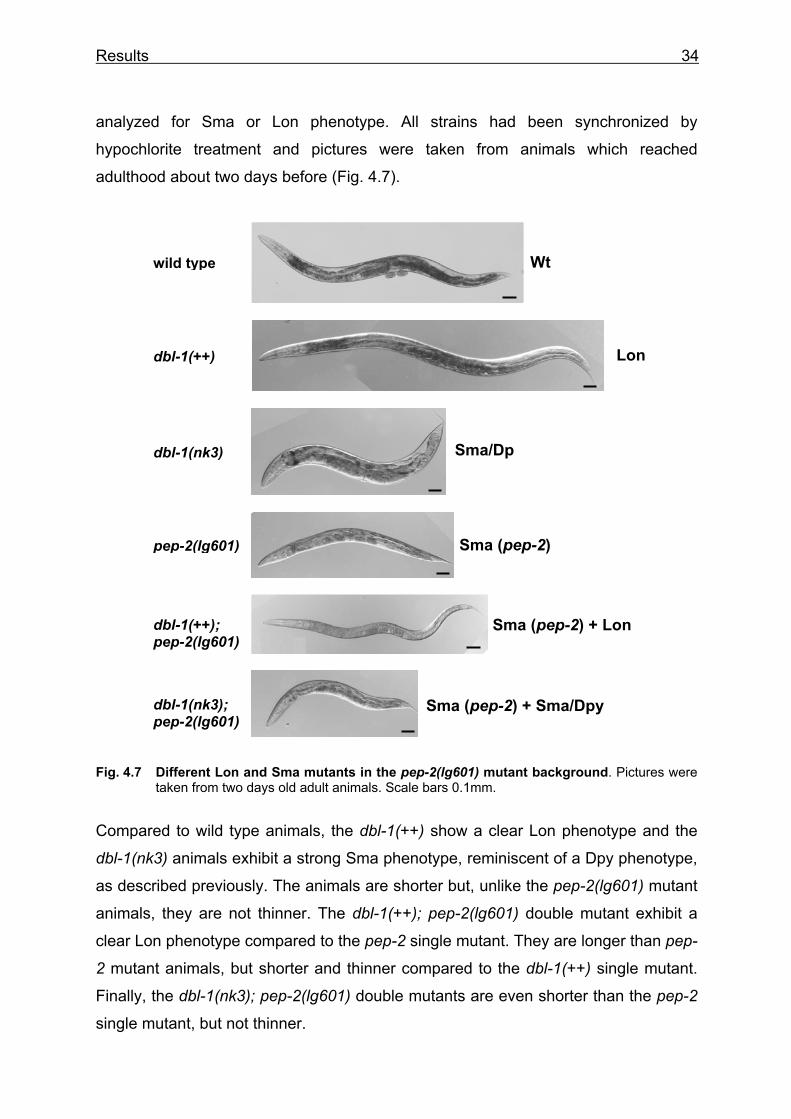
analyzed for Sma or Lon phenotype. All strains had been synchronized by
hypochlorite treatment and pictures were taken from animals which reached
adulthood about two days before (Fig. 4.7).
Fig. 4.7 Different Lon and Sma mutants in the pep-2(lg601) mutant background. Pictures were taken from two days old adult animals. Scale bars 0.1mm.
Compared to wild type animals, the dbl-1(++) show a clear Lon phenotype and the
dbl-1(nk3) animals exhibit a strong Sma phenotype, reminiscent of a Dpy phenotype,
as described previously. The animals are shorter but, unlike the pep-2(lg601) mutant
animals, they are not thinner. The dbl-1(++); pep-2(lg601) double mutant exhibit a
clear Lon phenotype compared to the pep-2 single mutant. They are longer than pep-
2 mutant animals, but shorter and thinner compared to the dbl-1(++) single mutant.
Finally, the dbl-1(nk3); pep-2(lg601) double mutants are even shorter than the pep-2
single mutant, but not thinner.
wild type
dbl-1(++)
dbl-1(nk3)
pep-2(lg601)
dbl-1(nk3); pep-2(lg601)
dbl-1(++); pep-2(lg601)
Lon
Sma/Dp
Wt
Sma (pep-2)
Sma (pep-2) + Lon
Sma (pep-2) + Sma/Dpy
Results 35
Thus, pep-2(lg601) cannot suppress the Lon phenotype in dbl-1(++) mutant animals
moreover the phenotype of the double mutants represents a clear additive effect of
each single mutant phenotype. This results leads to the conclusion that pep-2 is not
directly involved in the regulation of body size by the DBL-1/TGF-β signalling
pathway.
4.1.3.2 Analysis of embryonic and postembryonic development in pep-2(lg601) mutants
To analyze the postembryonic (larval) development, pep-2 mutant and wild type
animals have been synchronized by hypochlorite treatment. L1 larvae were grown at
20°C and were observed for up to seven days. At 13 time points between 7.5 and
168 hours after L1 synchronization the animals were analyzed for developmental
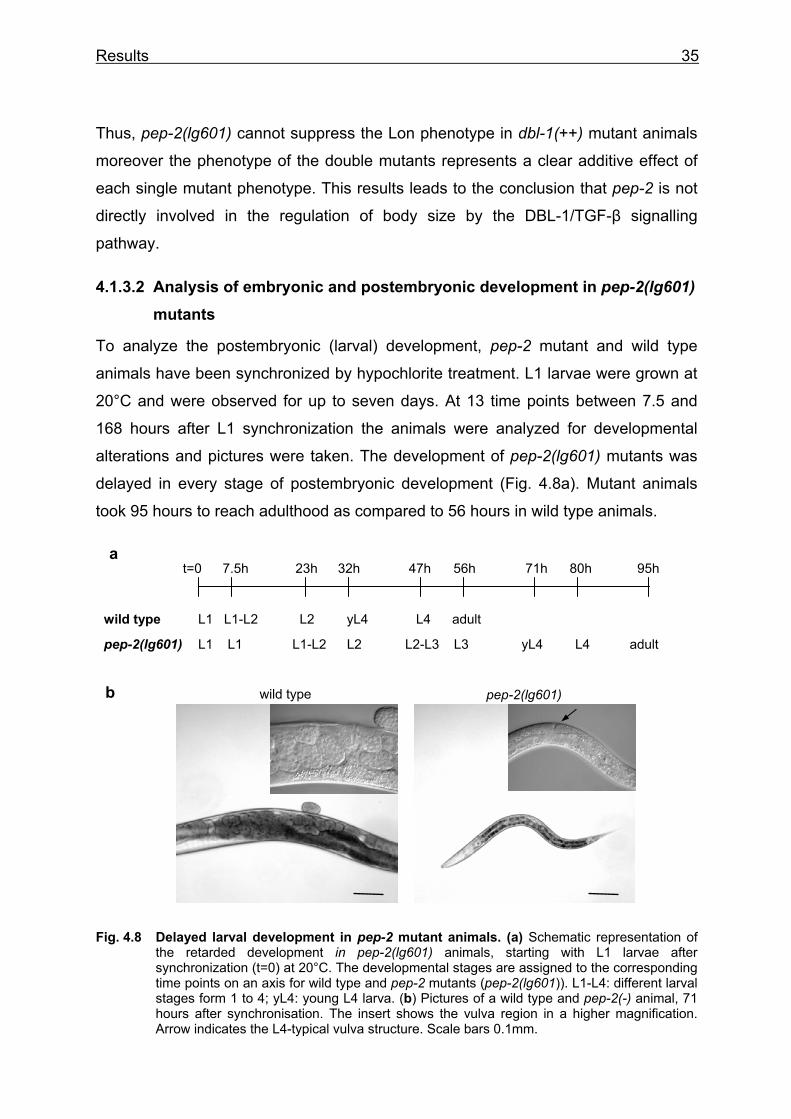
alterations and pictures were taken. The development of pep-2(lg601) mutants was
delayed in every stage of postembryonic development (Fig. 4.8a). Mutant animals
took 95 hours to reach adulthood as compared to 56 hours in wild type animals.
Fig. 4.8 Delayed larval development in pep-2 mutant animals. (a) Schematic representation of the retarded development in pep-2(lg601) animals, starting with L1 larvae after synchronization (t=0) at 20°C. The developmental stages are assigned to the corresponding time points on an axis for wild type and pep-2 mutants (pep-2(lg601)). L1-L4: different larval stages form 1 to 4; yL4: young L4 larva. (b) Pictures of a wild type and pep-2(-) animal, 71 hours after synchronisation. The insert shows the vulva region in a higher magnification. Arrow indicates the L4-typical vulva structure. Scale bars 0.1mm.
t=0 7.5h 23h 32h 47h 56h 80h 71h 95h
wild type L1 L1-L2 L2 yL4 L4 adult
pep-2(lg601) L1 L1 L1-L2 L2 L2-L3 L3 yL4 L4 adult
wild type pep-2(lg601) b
a
Results 36
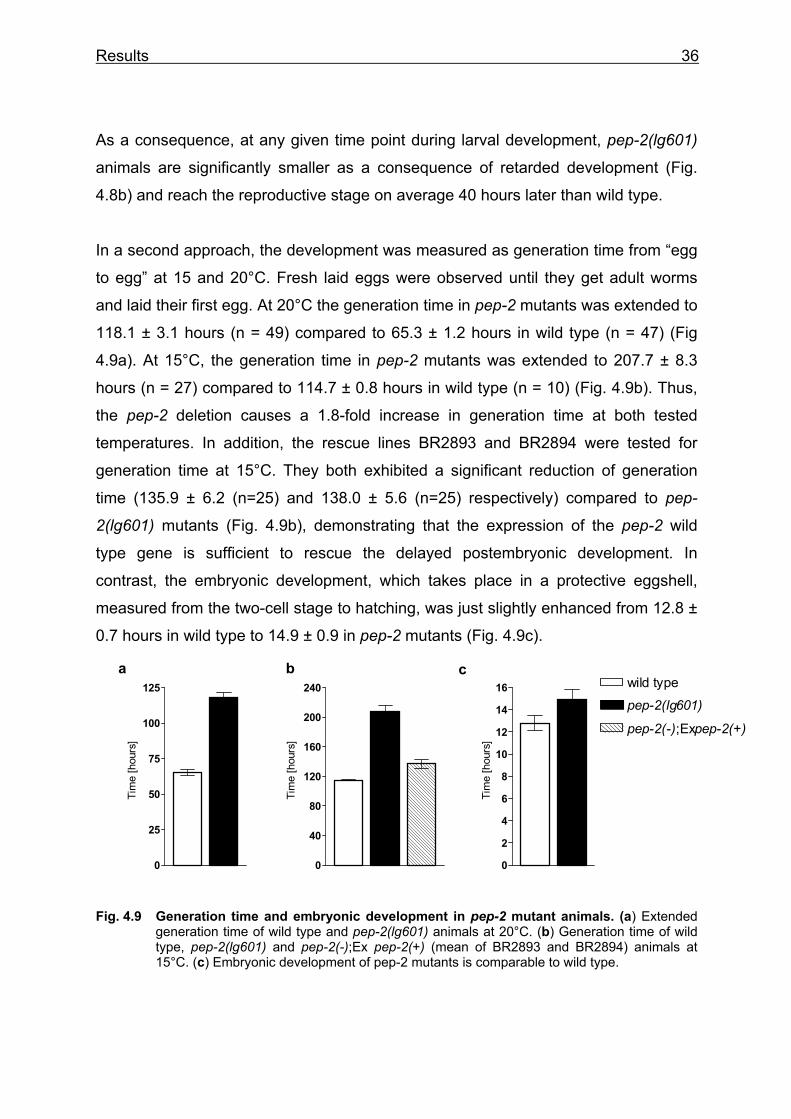
As a consequence, at any given time point during larval development, pep-2(lg601)
animals are significantly smaller as a consequence of retarded development (Fig.
4.8b) and reach the reproductive stage on average 40 hours later than wild type.
In a second approach, the development was measured as generation time from “egg
to egg” at 15 and 20°C. Fresh laid eggs were observed until they get adult worms
and laid their first egg. At 20°C the generation time in pep-2 mutants was extended to
118.1 ± 3.1 hours (n = 49) compared to 65.3 ± 1.2 hours in wild type (n = 47) (Fig
4.9a). At 15°C, the generation time in pep-2 mutants was extended to 207.7 ± 8.3
hours (n = 27) compared to 114.7 ± 0.8 hours in wild type (n = 10) (Fig. 4.9b). Thus,
the pep-2 deletion causes a 1.8-fold increase in generation time at both tested
temperatures. In addition, the rescue lines BR2893 and BR2894 were tested for
generation time at 15°C. They both exhibited a significant reduction of generation
time (135.9 ± 6.2 (n=25) and 138.0 ± 5.6 (n=25) respectively) compared to pep-
2(lg601) mutants (Fig. 4.9b), demonstrating that the expression of the pep-2 wild
type gene is sufficient to rescue the delayed postembryonic development. In
contrast, the embryonic development, which takes place in a protective eggshell,
measured from the two-cell stage to hatching, was just slightly enhanced from 12.8 ±
0.7 hours in wild type to 14.9 ± 0.9 in pep-2 mutants (Fig. 4.9c).
0
25
50
75
100
125
Tim
e [h
ours
]
0
40
80
120
160
200
240
Tim
e [h
ours
]
0
2
4
6
8
10
12
14
16
Tim
e [h
ours
]
Fig. 4.9 Generation time and embryonic development in pep-2 mutant animals. (a) Extended generation time of wild type and pep-2(lg601) animals at 20°C. (b) Generation time of wild type, pep-2(lg601) and pep-2(-);Ex pep-2(+) (mean of BR2893 and BR2894) animals at 15°C. (c) Embryonic development of pep-2 mutants is comparable to wild type.
a b wild type
pep-2(lg601)
pep-2(-);Expep-2(+)
c
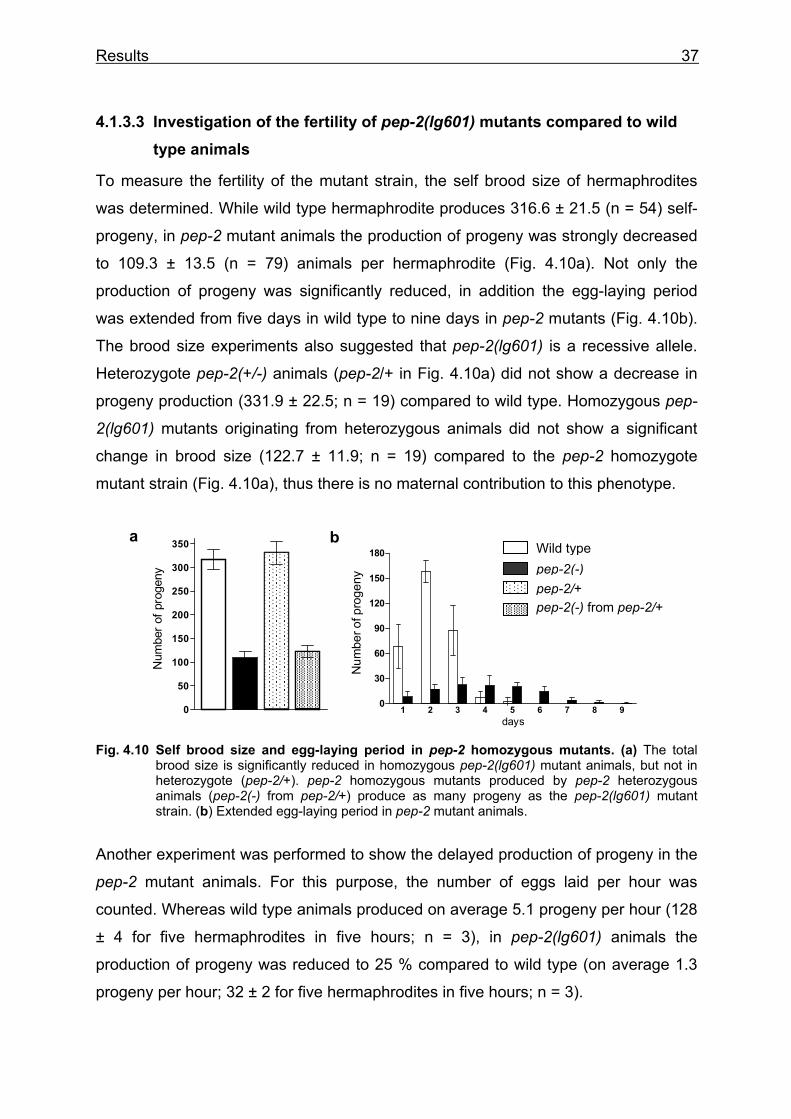
Results 37
a
0
50
100
150
200
250
300
350
Num
ber o
f pro
geny
1 2 3 4 5 6 7 8 90
30
60
90
120
150
180
days
Num
ber o
f pro
geny
b
4.1.3.3 Investigation of the fertility of pep-2(lg601) mutants compared to wild type animals
To measure the fertility of the mutant strain, the self brood size of hermaphrodites
was determined. While wild type hermaphrodite produces 316.6 ± 21.5 (n = 54) self-
progeny, in pep-2 mutant animals the production of progeny was strongly decreased
to 109.3 ± 13.5 (n = 79) animals per hermaphrodite (Fig. 4.10a). Not only the
production of progeny was significantly reduced, in addition the egg-laying period
was extended from five days in wild type to nine days in pep-2 mutants (Fig. 4.10b).
The brood size experiments also suggested that pep-2(lg601) is a recessive allele.
Heterozygote pep-2(+/-) animals (pep-2/+ in Fig. 4.10a) did not show a decrease in
progeny production (331.9 ± 22.5; n = 19) compared to wild type. Homozygous pep-
2(lg601) mutants originating from heterozygous animals did not show a significant
change in brood size (122.7 ± 11.9; n = 19) compared to the pep-2 homozygote
mutant strain (Fig. 4.10a), thus there is no maternal contribution to this phenotype.
Fig. 4.10 Self brood size and egg-laying period in pep-2 homozygous mutants. (a) The total brood size is significantly reduced in homozygous pep-2(lg601) mutant animals, but not in heterozygote (pep-2/+). pep-2 homozygous mutants produced by pep-2 heterozygous animals (pep-2(-) from pep-2/+) produce as many progeny as the pep-2(lg601) mutant strain. (b) Extended egg-laying period in pep-2 mutant animals.
Another experiment was performed to show the delayed production of progeny in the
pep-2 mutant animals. For this purpose, the number of eggs laid per hour was
counted. Whereas wild type animals produced on average 5.1 progeny per hour (128
± 4 for five hermaphrodites in five hours; n = 3), in pep-2(lg601) animals the
production of progeny was reduced to 25 % compared to wild type (on average 1.3
progeny per hour; 32 ± 2 for five hermaphrodites in five hours; n = 3).
Wild type pep-2(-) pep-2/+ pep-2(-) from pep-2/+
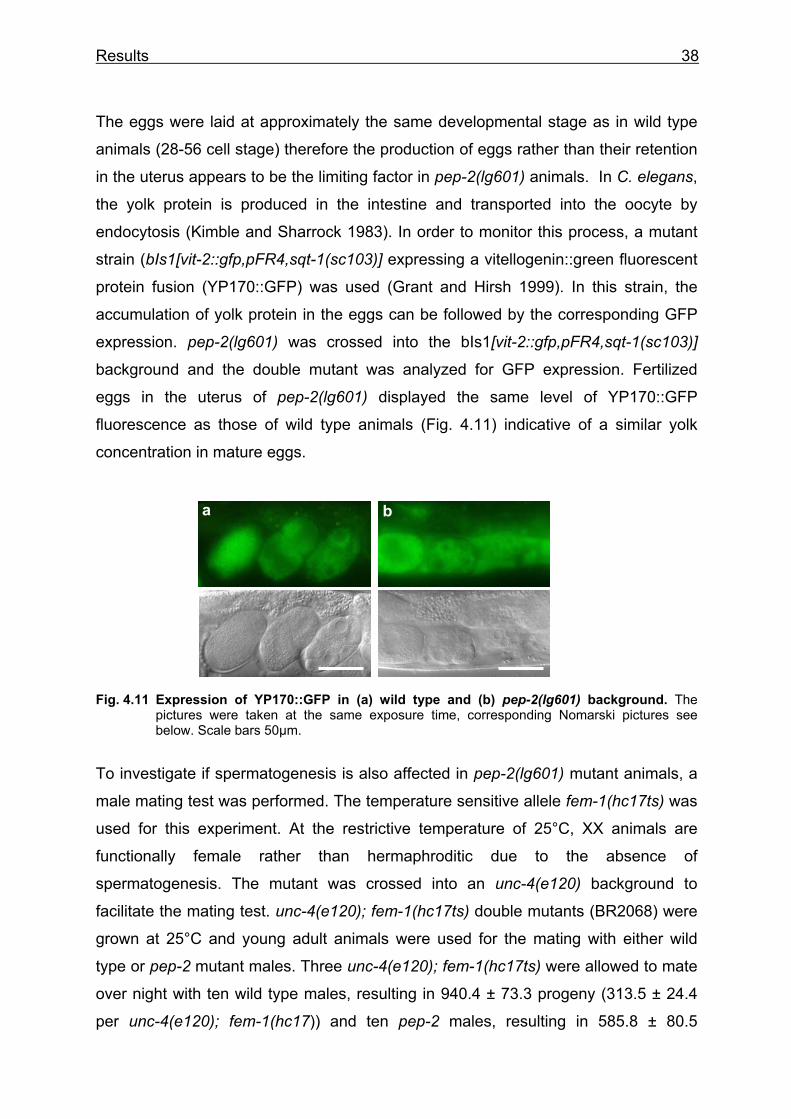
Results 38
The eggs were laid at approximately the same developmental stage as in wild type
animals (28-56 cell stage) therefore the production of eggs rather than their retention
in the uterus appears to be the limiting factor in pep-2(lg601) animals. In C. elegans,
the yolk protein is produced in the intestine and transported into the oocyte by
endocytosis (Kimble and Sharrock 1983). In order to monitor this process, a mutant
strain (bIs1[vit-2::gfp,pFR4,sqt-1(sc103)] expressing a vitellogenin::green fluorescent
protein fusion (YP170::GFP) was used (Grant and Hirsh 1999). In this strain, the
accumulation of yolk protein in the eggs can be followed by the corresponding GFP
expression. pep-2(lg601) was crossed into the bIs1[vit-2::gfp,pFR4,sqt-1(sc103)]
background and the double mutant was analyzed for GFP expression. Fertilized
eggs in the uterus of pep-2(lg601) displayed the same level of YP170::GFP
fluorescence as those of wild type animals (Fig. 4.11) indicative of a similar yolk
concentration in mature eggs.
Fig. 4.11 Expression of YP170::GFP in (a) wild type and (b) pep-2(lg601) background. The pictures were taken at the same exposure time, corresponding Nomarski pictures see below. Scale bars 50µm.
To investigate if spermatogenesis is also affected in pep-2(lg601) mutant animals, a
male mating test was performed. The temperature sensitive allele fem-1(hc17ts) was
used for this experiment. At the restrictive temperature of 25°C, XX animals are
functionally female rather than hermaphroditic due to the absence of
spermatogenesis. The mutant was crossed into an unc-4(e120) background to
facilitate the mating test. unc-4(e120); fem-1(hc17ts) double mutants (BR2068) were
grown at 25°C and young adult animals were used for the mating with either wild
type or pep-2 mutant males. Three unc-4(e120); fem-1(hc17ts) were allowed to mate
over night with ten wild type males, resulting in 940.4 ± 73.3 progeny (313.5 ± 24.4
per unc-4(e120); fem-1(hc17)) and ten pep-2 males, resulting in 585.8 ± 80.5
a b
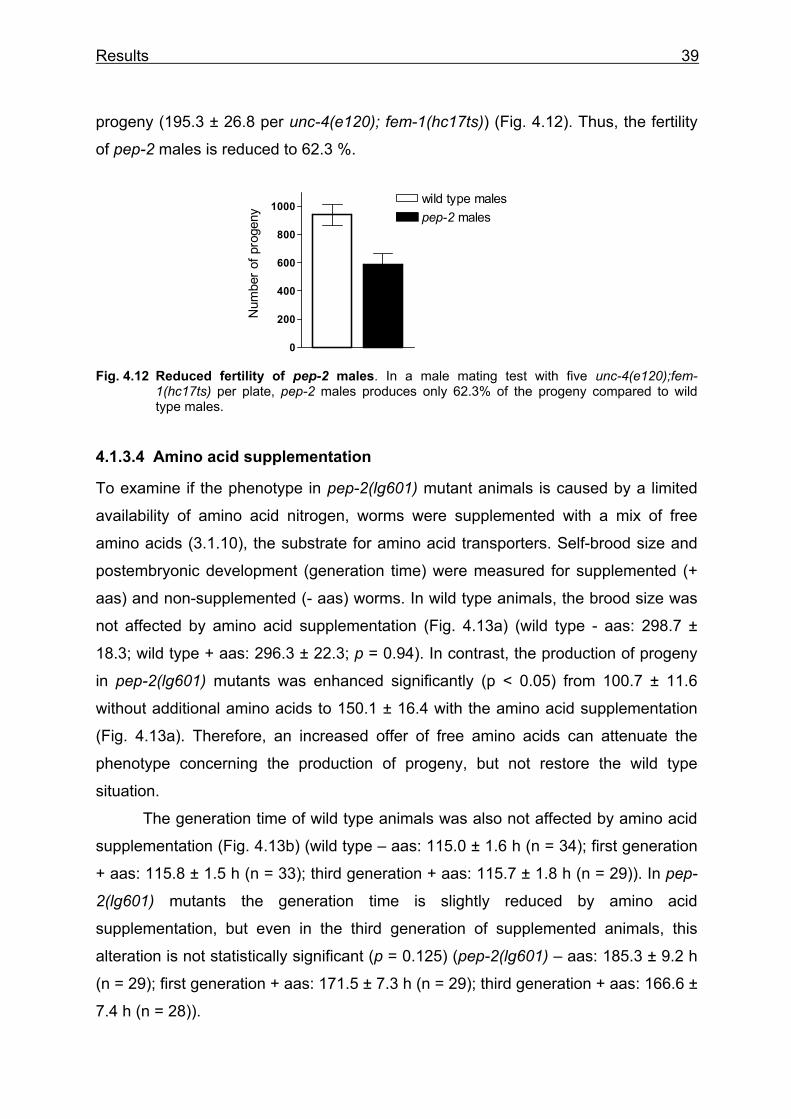
Results 39
progeny (195.3 ± 26.8 per unc-4(e120); fem-1(hc17ts)) (Fig. 4.12). Thus, the fertility
of pep-2 males is reduced to 62.3 %.
Fig. 4.12 Reduced fertility of pep-2 males. In a male mating test with five unc-4(e120);fem- 1(hc17ts) per plate, pep-2 males produces only 62.3% of the progeny compared to wild type males.
4.1.3.4 Amino acid supplementation
To examine if the phenotype in pep-2(lg601) mutant animals is caused by a limited
availability of amino acid nitrogen, worms were supplemented with a mix of free
amino acids (3.1.10), the substrate for amino acid transporters. Self-brood size and
postembryonic development (generation time) were measured for supplemented (+
aas) and non-supplemented (- aas) worms. In wild type animals, the brood size was
not affected by amino acid supplementation (Fig. 4.13a) (wild type - aas: 298.7 ±
18.3; wild type + aas: 296.3 ± 22.3; p = 0.94). In contrast, the production of progeny
in pep-2(lg601) mutants was enhanced significantly (p < 0.05) from 100.7 ± 11.6
without additional amino acids to 150.1 ± 16.4 with the amino acid supplementation
(Fig. 4.13a). Therefore, an increased offer of free amino acids can attenuate the
phenotype concerning the production of progeny, but not restore the wild type
situation.
The generation time of wild type animals was also not affected by amino acid
supplementation (Fig. 4.13b) (wild type – aas: 115.0 ± 1.6 h (n = 34); first generation
+ aas: 115.8 ± 1.5 h (n = 33); third generation + aas: 115.7 ± 1.8 h (n = 29)). In pep-
2(lg601) mutants the generation time is slightly reduced by amino acid
supplementation, but even in the third generation of supplemented animals, this
alteration is not statistically significant (p = 0.125) (pep-2(lg601) – aas: 185.3 ± 9.2 h
(n = 29); first generation + aas: 171.5 ± 7.3 h (n = 29); third generation + aas: 166.6 ±
7.4 h (n = 28)).
0
200
400
600
800
1000 wild type malespep-2 males
Num
ber o
f pro
geny

Results 40
Fig. 4.13 Brood size and postembryonic development with amino acid supplementation. The brood size (a) and the generation time (b) are not affected by amino acid supplementation in wild type animals. In pep-2(lg601) mutant animals, the number of progeny can be significantly increased (a), but the postembryonic development (b) is slightly reduced by additional availability of free amino acids. aa(1): first generation of supplemented animals; aa(3): third generation of supplemented animals.
Therefore, the strong phenotype observed in pep-2(lg601) mutant animals can only
be partially rescued by an increased supply of free amino acids that may serve as an
additional source for amino acid nitrogen.
4.1.3.5 Measurement of parameters for feeding and digestion
Pharyngeal pumping and defecation are two important parameters to investigate the
feeding behaviour in C. elegans. Rapid pharyngeal pumping is one of the
behavioural responses of a wild type worm to food and ensures a sufficient supply of
nutrient to the animal. Defecation is achieved through rhythmic activation of a
stereotyped cycle of muscle contractions and occurs approximately every 45
seconds at variable temperatures (Liu and Thomas 1994; Iwasaki et al. 1995). The
length of the defecation cycle is responsible for the resting time of nutrients in the
intestine. To investigate the feeding behaviour and food consumption in pep-2(lg601)
mutant animals, pharyngeal pumping and defecation cycle were measured in mutant
and wild type animals. The pharyngeal pumping was counted as pumps per minute
and was slightly reduced in pep-2(lg601) mutant animals (255.1 ± 14.7; n = 19)
compared to wild type control (271.3 ± 13.9; n = 20, p = 0.43) (Fig. 4.14a). The
frequency of defecation in pep-2(lg601) animals was not significantly changed
compared to wild type animals (46.3 ± 3.5 and 47.9 ± 2.1 respectively, p = 0.71; Fig.
4.14b).
wild typewild type+aa(1)wild type+aa(3)pep-2(lg601)pep-2(lg601)+aa(1)pep-2(lg601)+aa(3)
0
50
100
150
200
250
300
Num
ber o
f pro
geny
0
25
50
75
100
125
150
175
200
Tim
e [h
ours
]
a b
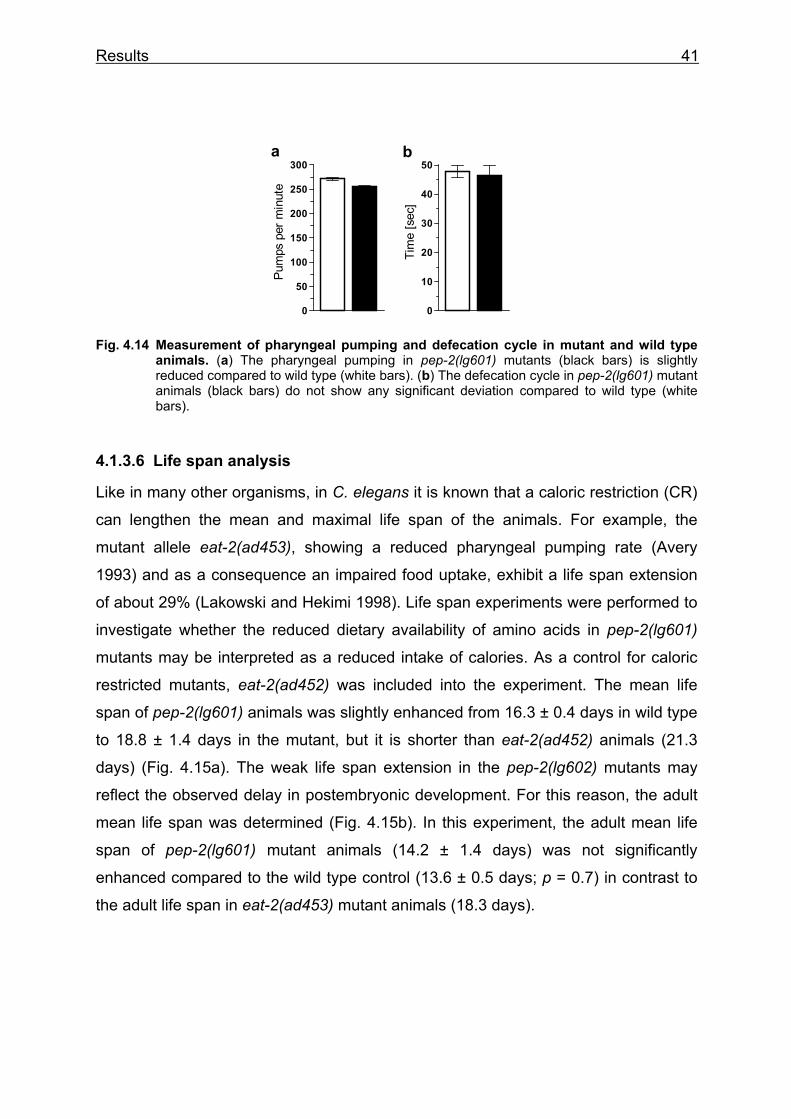
Results 41
Fig. 4.14 Measurement of pharyngeal pumping and defecation cycle in mutant and wild type animals. (a) The pharyngeal pumping in pep-2(lg601) mutants (black bars) is slightly reduced compared to wild type (white bars). (b) The defecation cycle in pep-2(lg601) mutant animals (black bars) do not show any significant deviation compared to wild type (white bars).
4.1.3.6 Life span analysis
Like in many other organisms, in C. elegans it is known that a caloric restriction (CR)
can lengthen the mean and maximal life span of the animals. For example, the
mutant allele eat-2(ad453), showing a reduced pharyngeal pumping rate (Avery
1993) and as a consequence an impaired food uptake, exhibit a life span extension
of about 29% (Lakowski and Hekimi 1998). Life span experiments were performed to
investigate whether the reduced dietary availability of amino acids in pep-2(lg601)
mutants may be interpreted as a reduced intake of calories. As a control for caloric
restricted mutants, eat-2(ad452) was included into the experiment. The mean life
span of pep-2(lg601) animals was slightly enhanced from 16.3 ± 0.4 days in wild type
to 18.8 ± 1.4 days in the mutant, but it is shorter than eat-2(ad452) animals (21.3
days) (Fig. 4.15a). The weak life span extension in the pep-2(lg602) mutants may
reflect the observed delay in postembryonic development. For this reason, the adult
mean life span was determined (Fig. 4.15b). In this experiment, the adult mean life
span of pep-2(lg601) mutant animals (14.2 ± 1.4 days) was not significantly
enhanced compared to the wild type control (13.6 ± 0.5 days; p = 0.7) in contrast to
the adult life span in eat-2(ad453) mutant animals (18.3 days).
a b
0
50
100
150
200
250
300
Pum
ps p
er m
inut
e
0
10
20
30
40
50
Tim
e [s
ec]
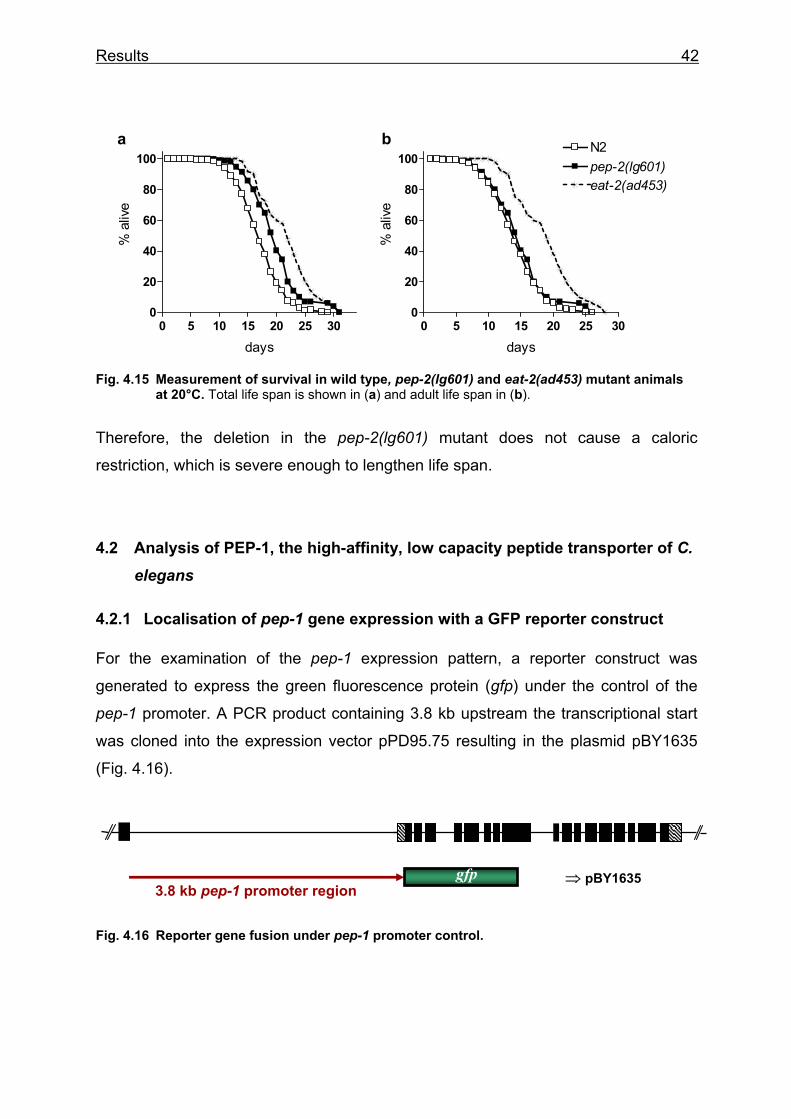
Results 42
Fig. 4.15 Measurement of survival in wild type, pep-2(lg601) and eat-2(ad453) mutant animals at 20°C. Total life span is shown in (a) and adult life span in (b).
Therefore, the deletion in the pep-2(lg601) mutant does not cause a caloric
restriction, which is severe enough to lengthen life span.
4.2 Analysis of PEP-1, the high-affinity, low capacity peptide transporter of C. elegans
4.2.1 Localisation of pep-1 gene expression with a GFP reporter construct
For the examination of the pep-1 expression pattern, a reporter construct was
generated to express the green fluorescence protein (gfp) under the control of the
pep-1 promoter. A PCR product containing 3.8 kb upstream the transcriptional start
was cloned into the expression vector pPD95.75 resulting in the plasmid pBY1635
(Fig. 4.16).
Fig. 4.16 Reporter gene fusion under pep-1 promoter control.
0 5 10 15 20 25 300
20
40
60
80
100
days
% a
live
0 5 10 15 20 25 300
20
40
60
80
100
days
% a
live
a b N2pep-2(lg601)eat-2(ad453)
3.8 kb pep-1 promoter regiongfp ⇒ pBY1635
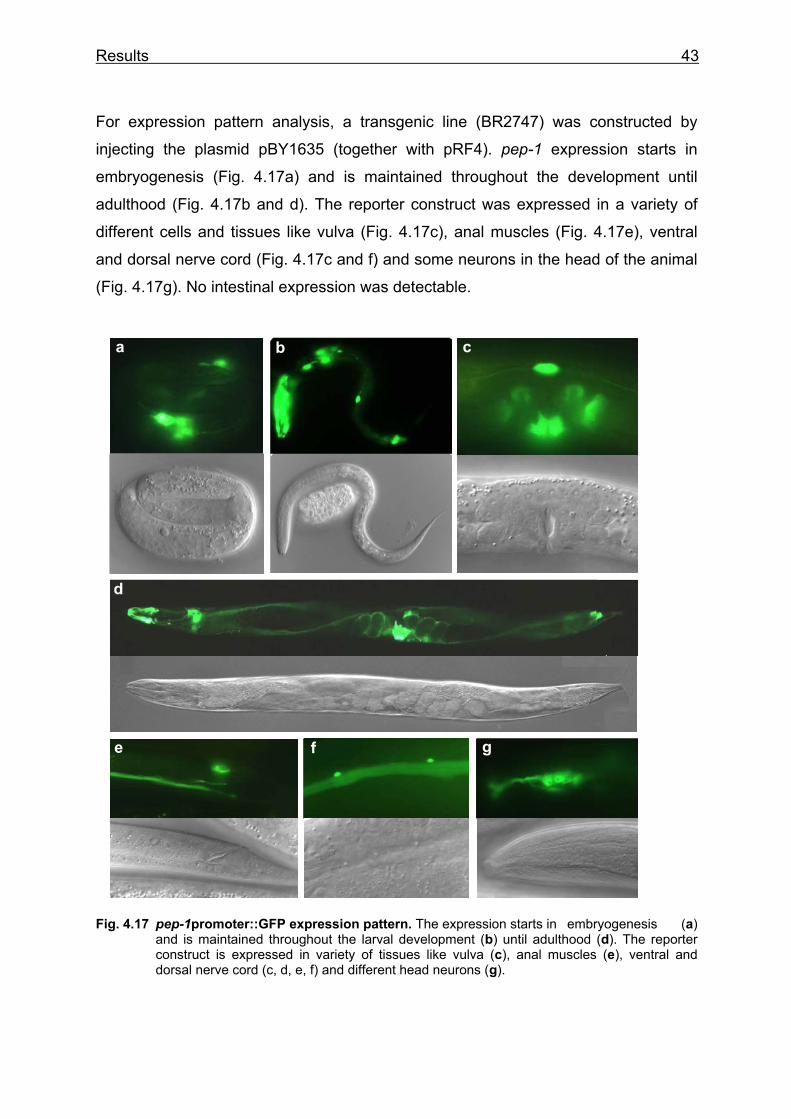
Results 43
For expression pattern analysis, a transgenic line (BR2747) was constructed by
injecting the plasmid pBY1635 (together with pRF4). pep-1 expression starts in
embryogenesis (Fig. 4.17a) and is maintained throughout the development until
adulthood (Fig. 4.17b and d). The reporter construct was expressed in a variety of
different cells and tissues like vulva (Fig. 4.17c), anal muscles (Fig. 4.17e), ventral
and dorsal nerve cord (Fig. 4.17c and f) and some neurons in the head of the animal
(Fig. 4.17g). No intestinal expression was detectable.
Fig. 4.17 pep-1promoter::GFP expression pattern. The expression starts in embryogenesis (a) and is maintained throughout the larval development (b) until adulthood (d). The reporter construct is expressed in variety of tissues like vulva (c), anal muscles (e), ventral and dorsal nerve cord (c, d, e, f) and different head neurons (g).
a b c
d
e f g
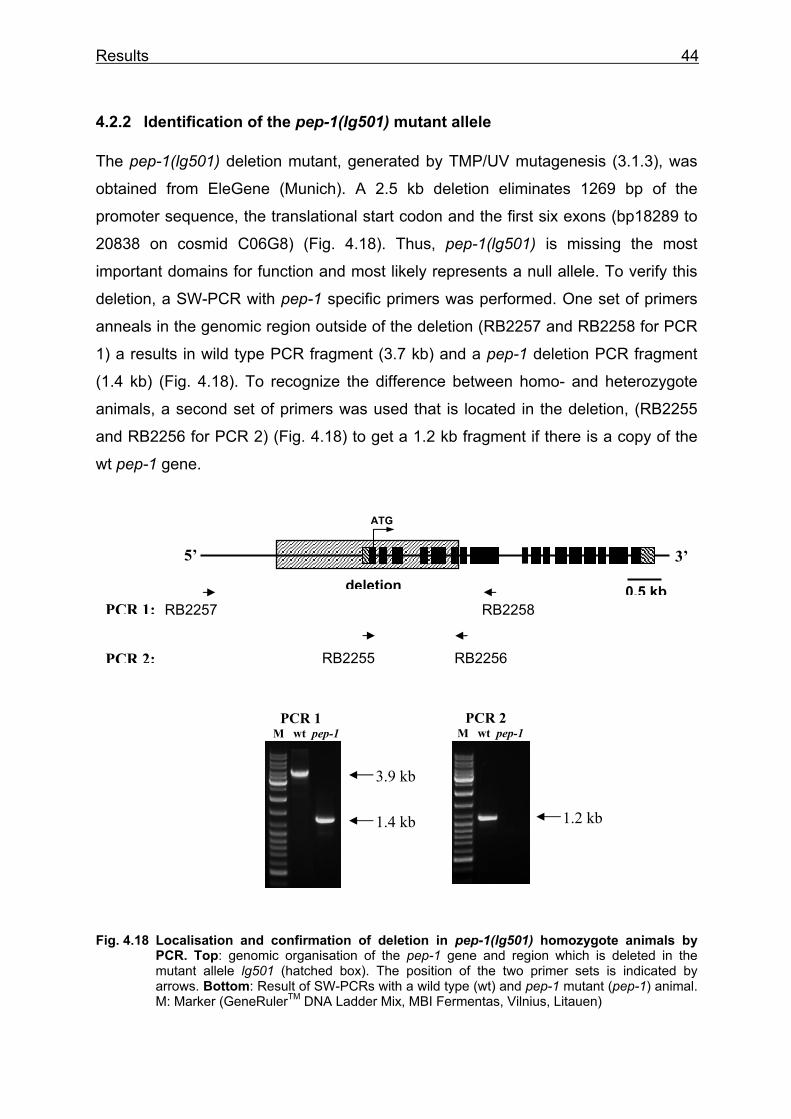
Results 44
4.2.2 Identification of the pep-1(lg501) mutant allele
The pep-1(lg501) deletion mutant, generated by TMP/UV mutagenesis (3.1.3), was
obtained from EleGene (Munich). A 2.5 kb deletion eliminates 1269 bp of the
promoter sequence, the translational start codon and the first six exons (bp18289 to
20838 on cosmid C06G8) (Fig. 4.18). Thus, pep-1(lg501) is missing the most
important domains for function and most likely represents a null allele. To verify this
deletion, a SW-PCR with pep-1 specific primers was performed. One set of primers
anneals in the genomic region outside of the deletion (RB2257 and RB2258 for PCR
1) a results in wild type PCR fragment (3.7 kb) and a pep-1 deletion PCR fragment
(1.4 kb) (Fig. 4.18). To recognize the difference between homo- and heterozygote
animals, a second set of primers was used that is located in the deletion, (RB2255
and RB2256 for PCR 2) (Fig. 4.18) to get a 1.2 kb fragment if there is a copy of the
wt pep-1 gene.
Fig. 4.18 Localisation and confirmation of deletion in pep-1(lg501) homozygote animals by PCR. Top: genomic organisation of the pep-1 gene and region which is deleted in the mutant allele lg501 (hatched box). The position of the two primer sets is indicated by arrows. Bottom: Result of SW-PCRs with a wild type (wt) and pep-1 mutant (pep-1) animal. M: Marker (GeneRulerTM DNA Ladder Mix, MBI Fermentas, Vilnius, Litauen)
5’
RB2257 RB2258
RB2256RB2255
PCR 1:
PCR 2:
0.5 kb
ATG
deletion
PCR 1 M wt pep-1
3.9 kb
1.4 kb
PCR 2 M wt pep-1
1.2 kb
3’
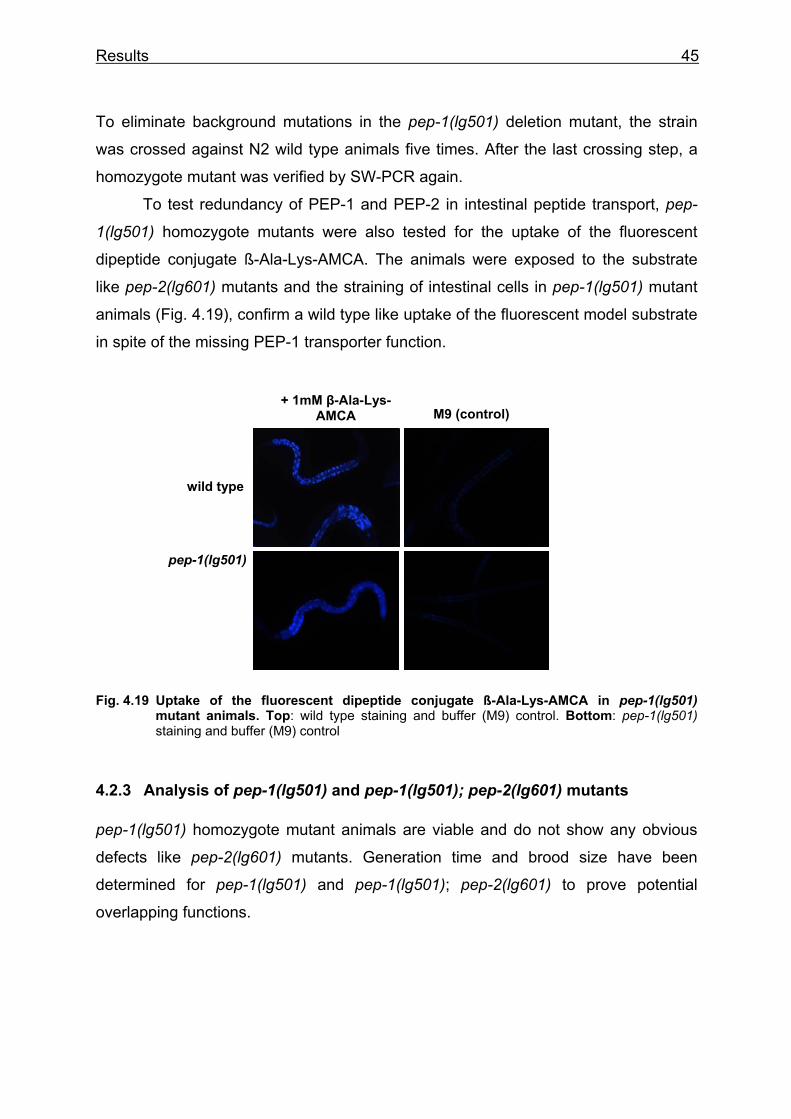
Results 45
To eliminate background mutations in the pep-1(lg501) deletion mutant, the strain
was crossed against N2 wild type animals five times. After the last crossing step, a
homozygote mutant was verified by SW-PCR again.
To test redundancy of PEP-1 and PEP-2 in intestinal peptide transport, pep-
1(lg501) homozygote mutants were also tested for the uptake of the fluorescent
dipeptide conjugate ß-Ala-Lys-AMCA. The animals were exposed to the substrate
like pep-2(lg601) mutants and the straining of intestinal cells in pep-1(lg501) mutant
animals (Fig. 4.19), confirm a wild type like uptake of the fluorescent model substrate
in spite of the missing PEP-1 transporter function.
Fig. 4.19 Uptake of the fluorescent dipeptide conjugate ß-Ala-Lys-AMCA in pep-1(lg501) mutant animals. Top: wild type staining and buffer (M9) control. Bottom: pep-1(lg501) staining and buffer (M9) control
4.2.3 Analysis of pep-1(lg501) and pep-1(lg501); pep-2(lg601) mutants
pep-1(lg501) homozygote mutant animals are viable and do not show any obvious
defects like pep-2(lg601) mutants. Generation time and brood size have been
determined for pep-1(lg501) and pep-1(lg501); pep-2(lg601) to prove potential
overlapping functions.
M9 (control) + 1mM β-Ala-Lys-
AMCA
wild type
pep-1(lg501)
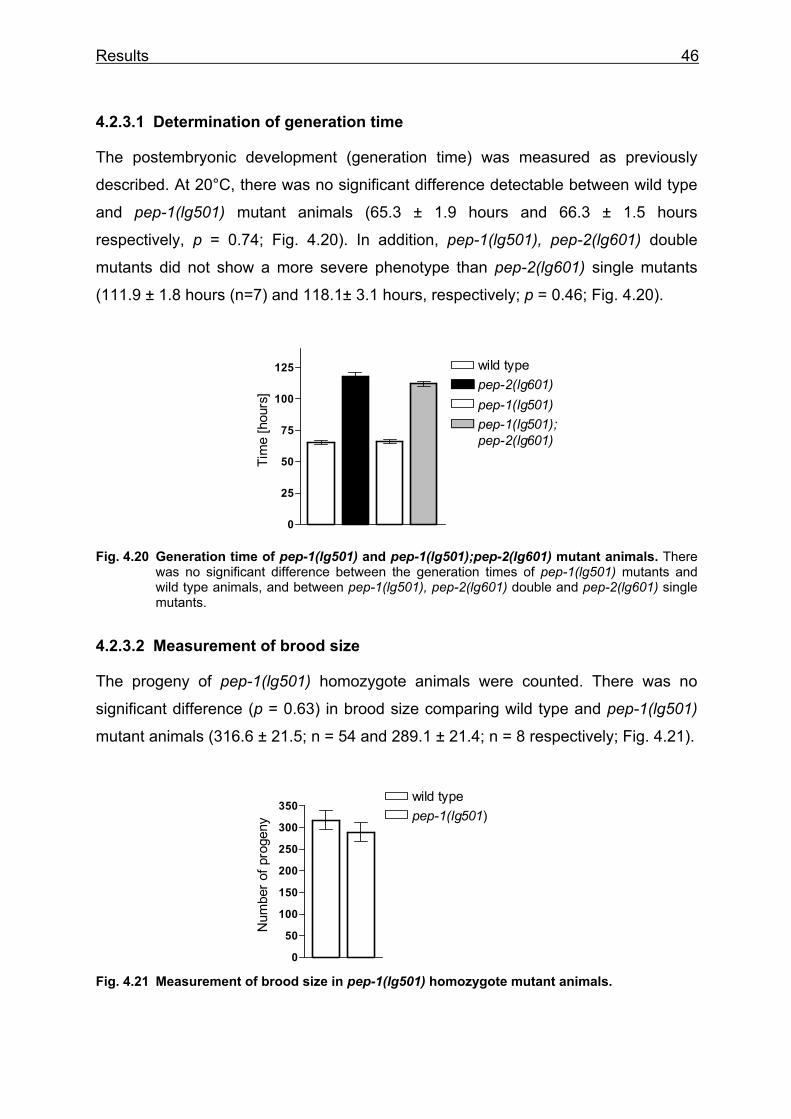
Results 46
4.2.3.1 Determination of generation time
The postembryonic development (generation time) was measured as previously
described. At 20°C, there was no significant difference detectable between wild type
and pep-1(lg501) mutant animals (65.3 ± 1.9 hours and 66.3 ± 1.5 hours
respectively, p = 0.74; Fig. 4.20). In addition, pep-1(lg501), pep-2(lg601) double
mutants did not show a more severe phenotype than pep-2(lg601) single mutants
(111.9 ± 1.8 hours (n=7) and 118.1± 3.1 hours, respectively; p = 0.46; Fig. 4.20).
Fig. 4.20 Generation time of pep-1(lg501) and pep-1(lg501);pep-2(lg601) mutant animals. There was no significant difference between the generation times of pep-1(lg501) mutants and wild type animals, and between pep-1(lg501), pep-2(lg601) double and pep-2(lg601) single mutants.
4.2.3.2 Measurement of brood size
The progeny of pep-1(lg501) homozygote animals were counted. There was no
significant difference (p = 0.63) in brood size comparing wild type and pep-1(lg501)
mutant animals (316.6 ± 21.5; n = 54 and 289.1 ± 21.4; n = 8 respectively; Fig. 4.21).
Fig. 4.21 Measurement of brood size in pep-1(lg501) homozygote mutant animals.
0
25
50
75
100
125 wild typepep-2(lg601)pep-1(lg501)pep-1(lg501);pep-2(lg601)
Tim
e [h
ours
]
0
50
100
150
200
250
300
350wild typepep-1(lg501)
Num
ber o
f pro
geny
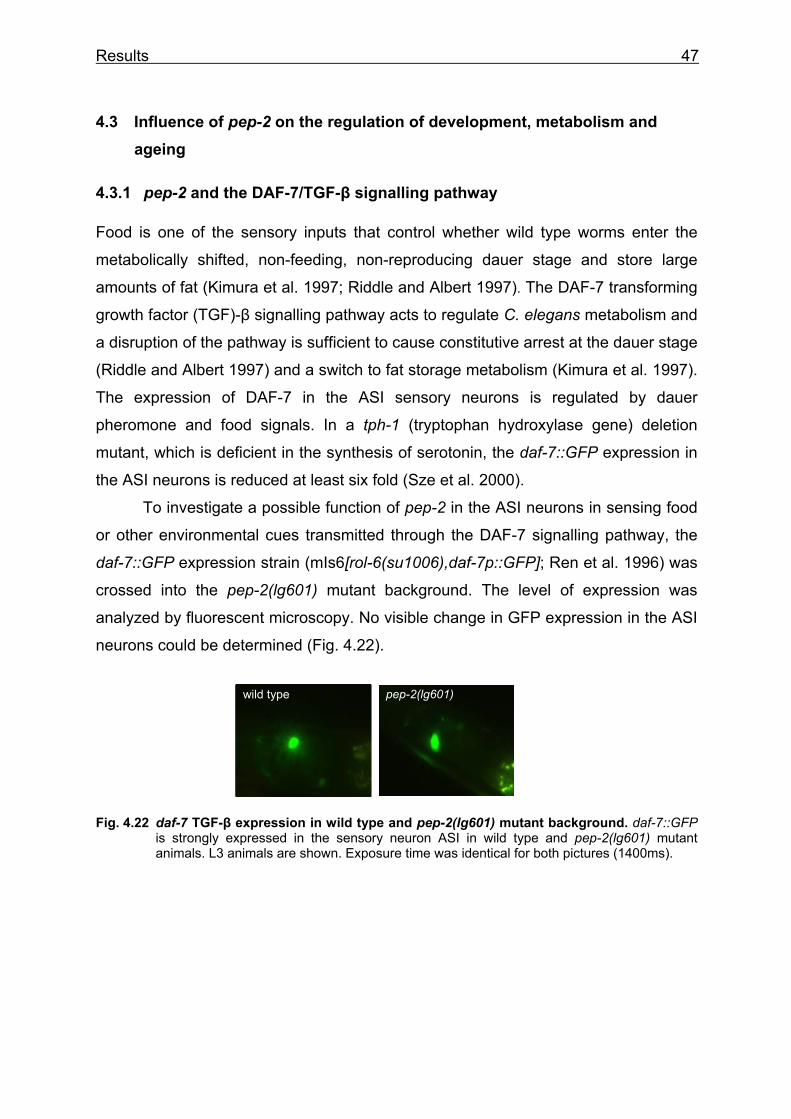
Results 47
4.3 Influence of pep-2 on the regulation of development, metabolism and ageing
4.3.1 pep-2 and the DAF-7/TGF-β signalling pathway
Food is one of the sensory inputs that control whether wild type worms enter the
metabolically shifted, non-feeding, non-reproducing dauer stage and store large
amounts of fat (Kimura et al. 1997; Riddle and Albert 1997). The DAF-7 transforming
growth factor (TGF)-β signalling pathway acts to regulate C. elegans metabolism and
a disruption of the pathway is sufficient to cause constitutive arrest at the dauer stage
(Riddle and Albert 1997) and a switch to fat storage metabolism (Kimura et al. 1997).
The expression of DAF-7 in the ASI sensory neurons is regulated by dauer
pheromone and food signals. In a tph-1 (tryptophan hydroxylase gene) deletion
mutant, which is deficient in the synthesis of serotonin, the daf-7::GFP expression in
the ASI neurons is reduced at least six fold (Sze et al. 2000).
To investigate a possible function of pep-2 in the ASI neurons in sensing food
or other environmental cues transmitted through the DAF-7 signalling pathway, the
daf-7::GFP expression strain (mIs6[rol-6(su1006),daf-7p::GFP]; Ren et al. 1996) was
crossed into the pep-2(lg601) mutant background. The level of expression was
analyzed by fluorescent microscopy. No visible change in GFP expression in the ASI
neurons could be determined (Fig. 4.22).
Fig. 4.22 daf-7 TGF-β expression in wild type and pep-2(lg601) mutant background. daf-7::GFP is strongly expressed in the sensory neuron ASI in wild type and pep-2(lg601) mutant animals. L3 animals are shown. Exposure time was identical for both pictures (1400ms).
wild type pep-2(lg601)
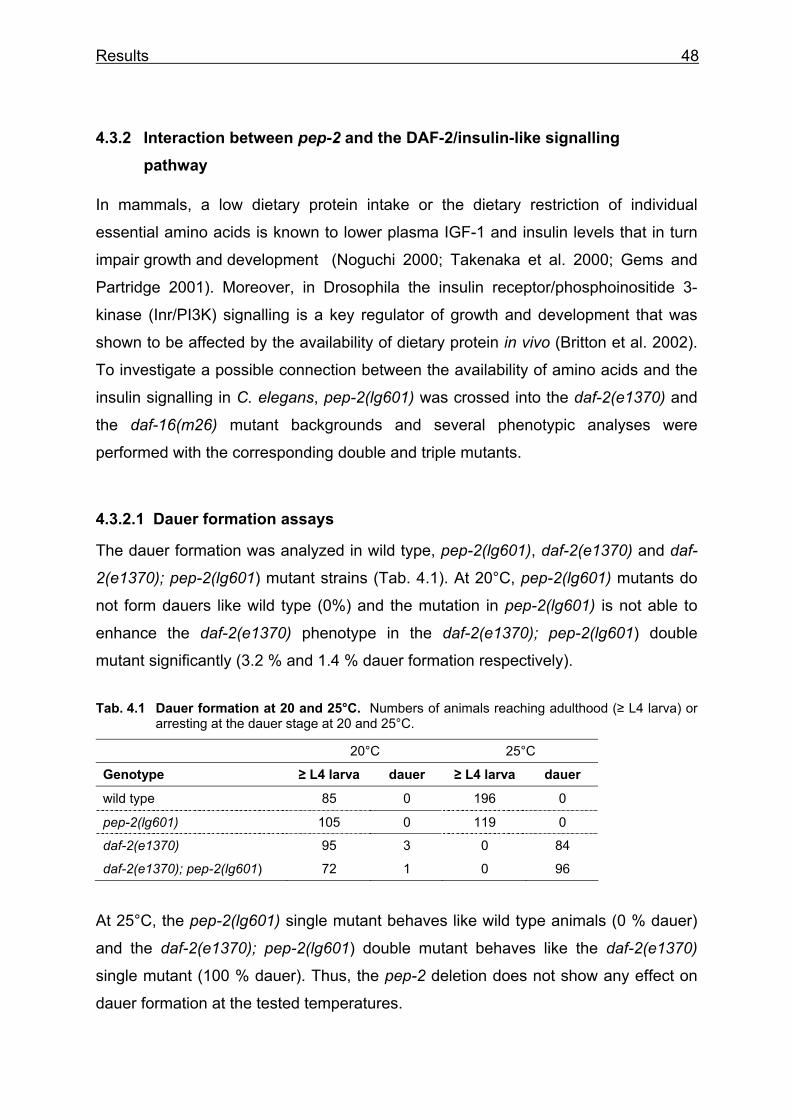
Results 48
4.3.2 Interaction between pep-2 and the DAF-2/insulin-like signalling pathway
In mammals, a low dietary protein intake or the dietary restriction of individual
essential amino acids is known to lower plasma IGF-1 and insulin levels that in turn
impair growth and development (Noguchi 2000; Takenaka et al. 2000; Gems and
Partridge 2001). Moreover, in Drosophila the insulin receptor/phosphoinositide 3-
kinase (Inr/PI3K) signalling is a key regulator of growth and development that was
shown to be affected by the availability of dietary protein in vivo (Britton et al. 2002).
To investigate a possible connection between the availability of amino acids and the
insulin signalling in C. elegans, pep-2(lg601) was crossed into the daf-2(e1370) and
the daf-16(m26) mutant backgrounds and several phenotypic analyses were
performed with the corresponding double and triple mutants.
4.3.2.1 Dauer formation assays
The dauer formation was analyzed in wild type, pep-2(lg601), daf-2(e1370) and daf-
2(e1370); pep-2(lg601) mutant strains (Tab. 4.1). At 20°C, pep-2(lg601) mutants do
not form dauers like wild type (0%) and the mutation in pep-2(lg601) is not able to
enhance the daf-2(e1370) phenotype in the daf-2(e1370); pep-2(lg601) double
mutant significantly (3.2 % and 1.4 % dauer formation respectively).
Tab. 4.1 Dauer formation at 20 and 25°C. Numbers of animals reaching adulthood (≥ L4 larva) or arresting at the dauer stage at 20 and 25°C.
20°C 25°C
Genotype ≥ L4 larva dauer ≥ L4 larva dauer
wild type 85 0 196 0
pep-2(lg601) 105 0 119 0
daf-2(e1370) 95 3 0 84
daf-2(e1370); pep-2(lg601) 72 1 0 96
At 25°C, the pep-2(lg601) single mutant behaves like wild type animals (0 % dauer)
and the daf-2(e1370); pep-2(lg601) double mutant behaves like the daf-2(e1370)
single mutant (100 % dauer). Thus, the pep-2 deletion does not show any effect on
dauer formation at the tested temperatures.
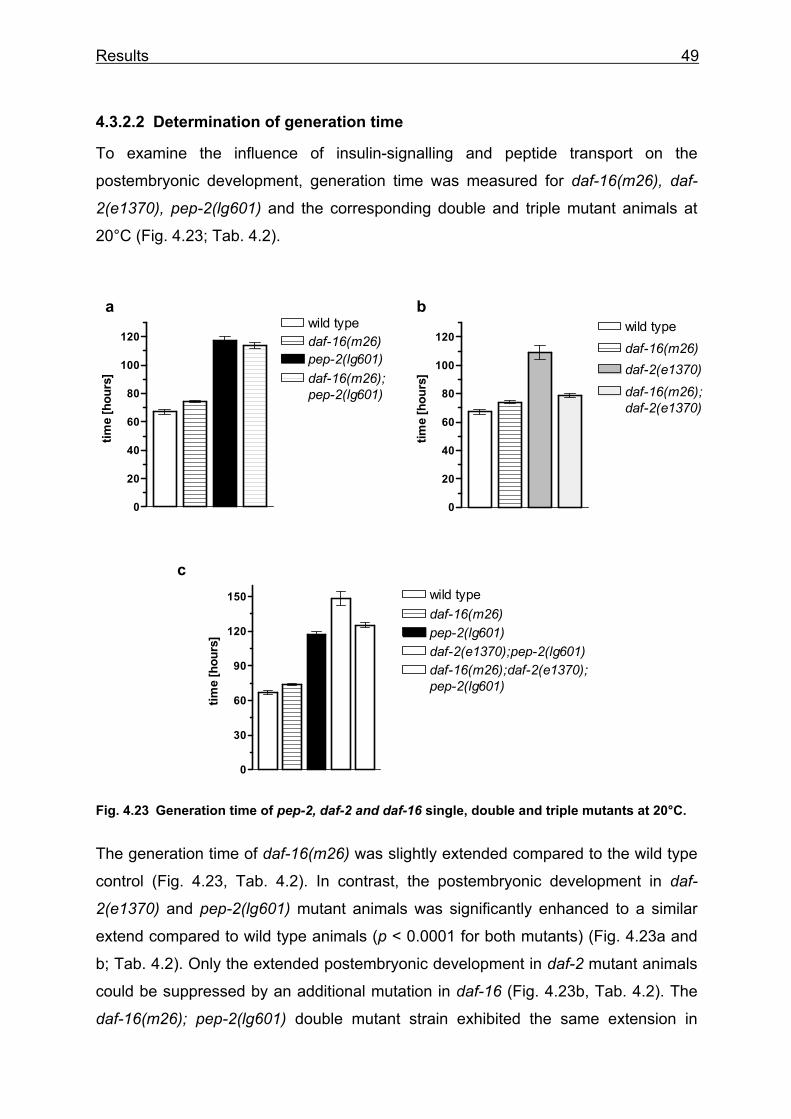
Results 49
4.3.2.2 Determination of generation time
To examine the influence of insulin-signalling and peptide transport on the
postembryonic development, generation time was measured for daf-16(m26), daf-
2(e1370), pep-2(lg601) and the corresponding double and triple mutant animals at
20°C (Fig. 4.23; Tab. 4.2).
Fig. 4.23 Generation time of pep-2, daf-2 and daf-16 single, double and triple mutants at 20°C.
The generation time of daf-16(m26) was slightly extended compared to the wild type
control (Fig. 4.23, Tab. 4.2). In contrast, the postembryonic development in daf-
2(e1370) and pep-2(lg601) mutant animals was significantly enhanced to a similar
extend compared to wild type animals (p < 0.0001 for both mutants) (Fig. 4.23a and
b; Tab. 4.2). Only the extended postembryonic development in daf-2 mutant animals
could be suppressed by an additional mutation in daf-16 (Fig. 4.23b, Tab. 4.2). The
daf-16(m26); pep-2(lg601) double mutant strain exhibited the same extension in
0
30
60
90
120
150 wild typedaf-16(m26)
daf-2(e1370);pep-2(lg601)daf-16(m26);daf-2(e1370);pep-2(lg601)
pep-2(lg601)
time
[hou
rs]
0
20
40
60
80
100
120wild type
pep-2(lg601)daf-16(m26)
daf-16(m26);pep-2(lg601)
time
[hou
rs]
0
20
40
60
80
100
120wild typedaf-16(m26)daf-2(e1370)daf-16(m26);daf-2(e1370)
time
[hou
rs]
a b
c
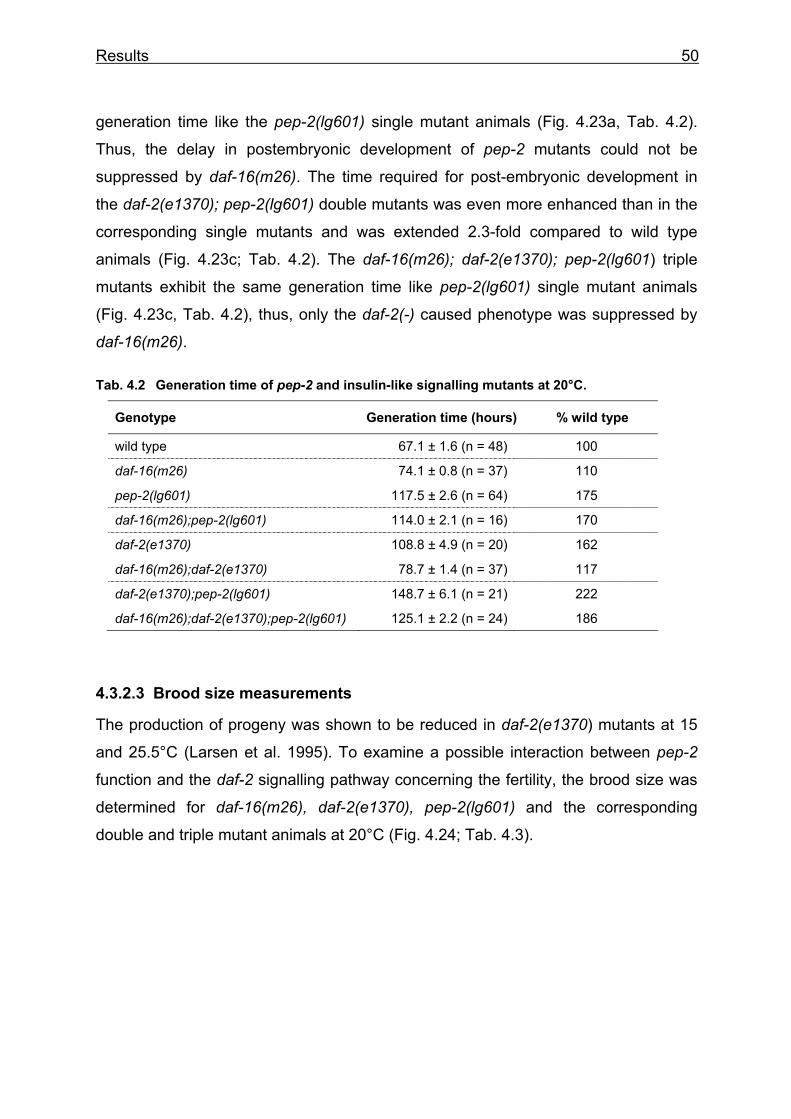
Results 50
generation time like the pep-2(lg601) single mutant animals (Fig. 4.23a, Tab. 4.2).
Thus, the delay in postembryonic development of pep-2 mutants could not be
suppressed by daf-16(m26). The time required for post-embryonic development in
the daf-2(e1370); pep-2(lg601) double mutants was even more enhanced than in the
corresponding single mutants and was extended 2.3-fold compared to wild type
animals (Fig. 4.23c; Tab. 4.2). The daf-16(m26); daf-2(e1370); pep-2(lg601) triple
mutants exhibit the same generation time like pep-2(lg601) single mutant animals
(Fig. 4.23c, Tab. 4.2), thus, only the daf-2(-) caused phenotype was suppressed by
daf-16(m26).
Tab. 4.2 Generation time of pep-2 and insulin-like signalling mutants at 20°C.
Genotype Generation time (hours) % wild type
wild type 67.1 ± 1.6 (n = 48) 100
daf-16(m26) 74.1 ± 0.8 (n = 37) 110
pep-2(lg601) 117.5 ± 2.6 (n = 64) 175
daf-16(m26);pep-2(lg601) 114.0 ± 2.1 (n = 16) 170
daf-2(e1370) 108.8 ± 4.9 (n = 20) 162
daf-16(m26);daf-2(e1370) 78.7 ± 1.4 (n = 37) 117
daf-2(e1370);pep-2(lg601) 148.7 ± 6.1 (n = 21) 222
daf-16(m26);daf-2(e1370);pep-2(lg601) 125.1 ± 2.2 (n = 24) 186
4.3.2.3 Brood size measurements
The production of progeny was shown to be reduced in daf-2(e1370) mutants at 15
and 25.5°C (Larsen et al. 1995). To examine a possible interaction between pep-2
function and the daf-2 signalling pathway concerning the fertility, the brood size was
determined for daf-16(m26), daf-2(e1370), pep-2(lg601) and the corresponding
double and triple mutant animals at 20°C (Fig. 4.24; Tab. 4.3).
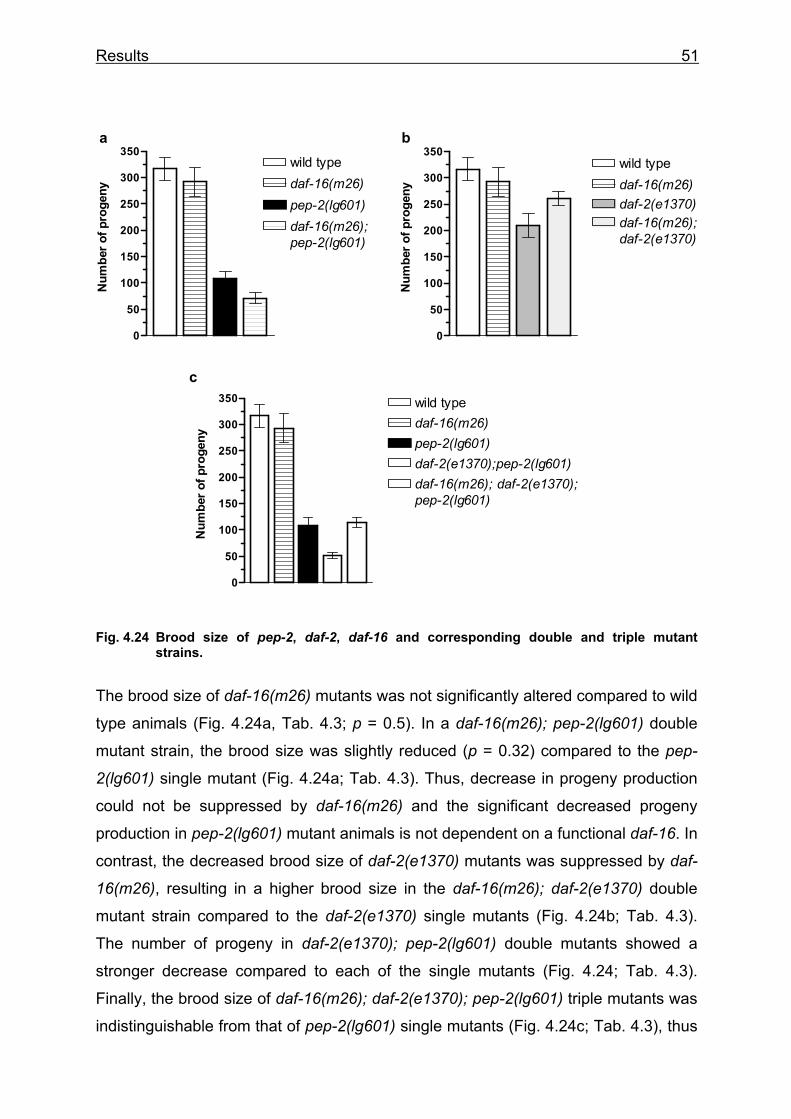
Results 51
Fig. 4.24 Brood size of pep-2, daf-2, daf-16 and corresponding double and triple mutant strains.
The brood size of daf-16(m26) mutants was not significantly altered compared to wild
type animals (Fig. 4.24a, Tab. 4.3; p = 0.5). In a daf-16(m26); pep-2(lg601) double
mutant strain, the brood size was slightly reduced (p = 0.32) compared to the pep-
2(lg601) single mutant (Fig. 4.24a; Tab. 4.3). Thus, decrease in progeny production
could not be suppressed by daf-16(m26) and the significant decreased progeny
production in pep-2(lg601) mutant animals is not dependent on a functional daf-16. In
contrast, the decreased brood size of daf-2(e1370) mutants was suppressed by daf-
16(m26), resulting in a higher brood size in the daf-16(m26); daf-2(e1370) double
mutant strain compared to the daf-2(e1370) single mutants (Fig. 4.24b; Tab. 4.3).
The number of progeny in daf-2(e1370); pep-2(lg601) double mutants showed a
stronger decrease compared to each of the single mutants (Fig. 4.24; Tab. 4.3).
Finally, the brood size of daf-16(m26); daf-2(e1370); pep-2(lg601) triple mutants was
indistinguishable from that of pep-2(lg601) single mutants (Fig. 4.24c; Tab. 4.3), thus
0
50
100
150
200
250
300
350wild type
pep-2(lg601)daf-16(m26)
daf-16(m26);pep-2(lg601)
Num
ber o
f pro
geny
0
50
100
150
200
250
300
350wild typedaf-16(m26)daf-2(e1370)daf-16(m26);daf-2(e1370)
Num
ber o
f pro
geny
0
50
100
150
200
250
300
350 wild typedaf-16(m26)
daf-2(e1370);pep-2(lg601)daf-16(m26); daf-2(e1370);pep-2(lg601)
pep-2(lg601)
Num
ber o
f pro
geny
a b
c
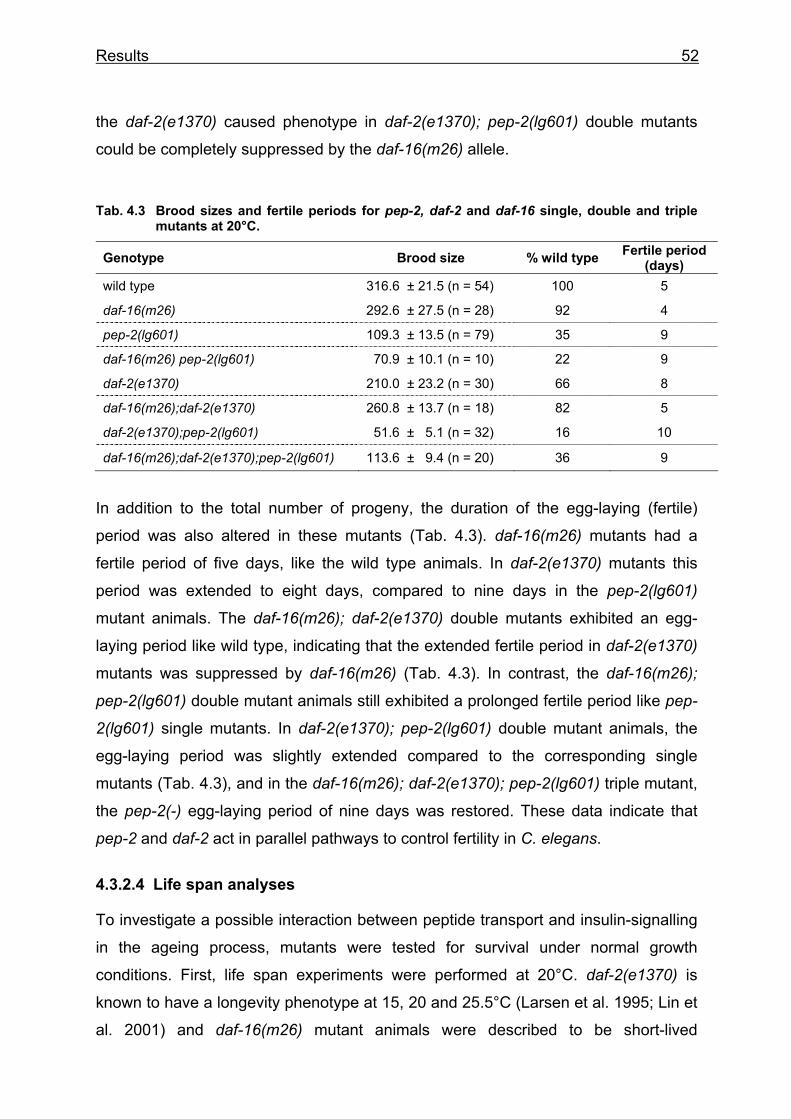
Results 52
the daf-2(e1370) caused phenotype in daf-2(e1370); pep-2(lg601) double mutants
could be completely suppressed by the daf-16(m26) allele.
Tab. 4.3 Brood sizes and fertile periods for pep-2, daf-2 and daf-16 single, double and triple mutants at 20°C.
Genotype Brood size % wild type Fertile period (days)
wild type 316.6 ± 21.5 (n = 54) 100 5
daf-16(m26) 292.6 ± 27.5 (n = 28) 92 4
pep-2(lg601) 109.3 ± 13.5 (n = 79) 35 9
daf-16(m26) pep-2(lg601) 70.9 ± 10.1 (n = 10) 22 9
daf-2(e1370) 210.0 ± 23.2 (n = 30) 66 8
daf-16(m26);daf-2(e1370) 260.8 ± 13.7 (n = 18) 82 5
daf-2(e1370);pep-2(lg601) 51.6 ± 5.1 (n = 32) 16 10
daf-16(m26);daf-2(e1370);pep-2(lg601) 113.6 ± 9.4 (n = 20) 36 9
In addition to the total number of progeny, the duration of the egg-laying (fertile)
period was also altered in these mutants (Tab. 4.3). daf-16(m26) mutants had a
fertile period of five days, like the wild type animals. In daf-2(e1370) mutants this
period was extended to eight days, compared to nine days in the pep-2(lg601)
mutant animals. The daf-16(m26); daf-2(e1370) double mutants exhibited an egg-
laying period like wild type, indicating that the extended fertile period in daf-2(e1370)
mutants was suppressed by daf-16(m26) (Tab. 4.3). In contrast, the daf-16(m26);
pep-2(lg601) double mutant animals still exhibited a prolonged fertile period like pep-
2(lg601) single mutants. In daf-2(e1370); pep-2(lg601) double mutant animals, the
egg-laying period was slightly extended compared to the corresponding single
mutants (Tab. 4.3), and in the daf-16(m26); daf-2(e1370); pep-2(lg601) triple mutant,
the pep-2(-) egg-laying period of nine days was restored. These data indicate that
pep-2 and daf-2 act in parallel pathways to control fertility in C. elegans.
4.3.2.4 Life span analyses
To investigate a possible interaction between peptide transport and insulin-signalling
in the ageing process, mutants were tested for survival under normal growth
conditions. First, life span experiments were performed at 20°C. daf-2(e1370) is
known to have a longevity phenotype at 15, 20 and 25.5°C (Larsen et al. 1995; Lin et
al. 2001) and daf-16(m26) mutant animals were described to be short-lived
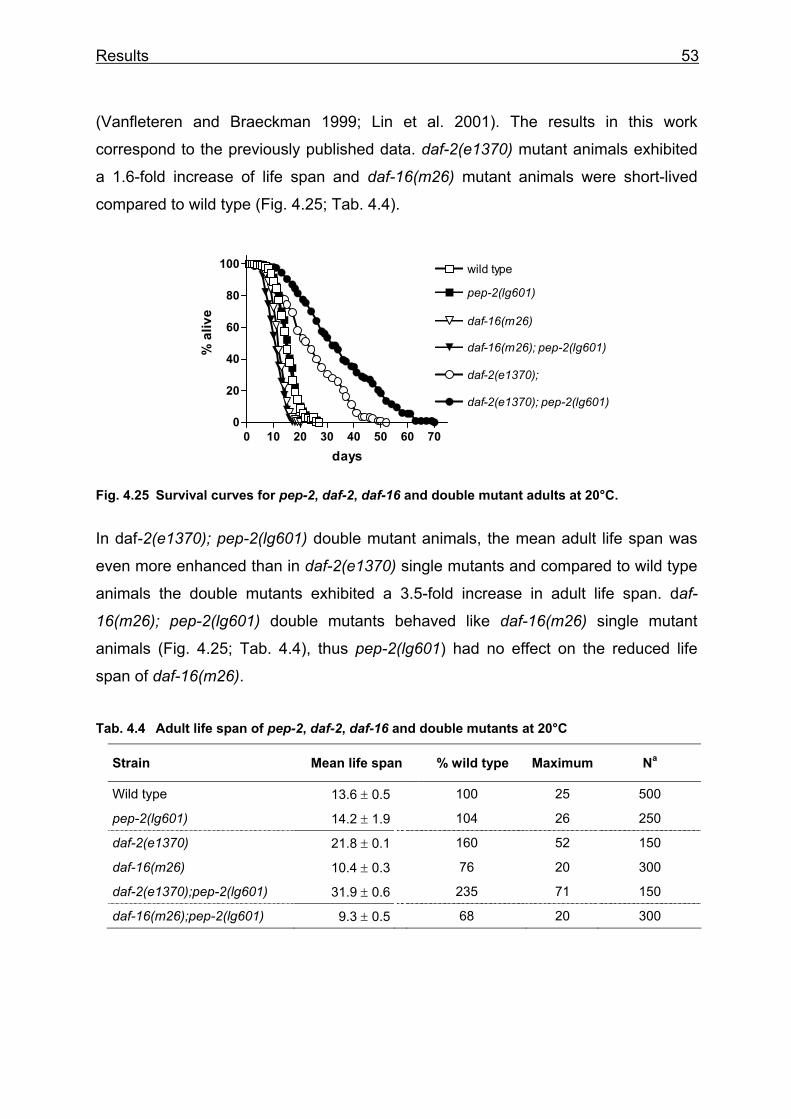
Results 53
(Vanfleteren and Braeckman 1999; Lin et al. 2001). The results in this work
correspond to the previously published data. daf-2(e1370) mutant animals exhibited
a 1.6-fold increase of life span and daf-16(m26) mutant animals were short-lived
compared to wild type (Fig. 4.25; Tab. 4.4).
Fig. 4.25 Survival curves for pep-2, daf-2, daf-16 and double mutant adults at 20°C.
In daf-2(e1370); pep-2(lg601) double mutant animals, the mean adult life span was
even more enhanced than in daf-2(e1370) single mutants and compared to wild type
animals the double mutants exhibited a 3.5-fold increase in adult life span. daf-
16(m26); pep-2(lg601) double mutants behaved like daf-16(m26) single mutant
animals (Fig. 4.25; Tab. 4.4), thus pep-2(lg601) had no effect on the reduced life
span of daf-16(m26).
Tab. 4.4 Adult life span of pep-2, daf-2, daf-16 and double mutants at 20°C
Strain Mean life span % wild type Maximum Na
Wild type 13.6 ± 0.5 100 25 500
pep-2(lg601) 14.2 ± 1.9 104 26 250
daf-2(e1370) 21.8 ± 0.1 160 52 150
daf-16(m26) 10.4 ± 0.3 76 20 300
daf-2(e1370);pep-2(lg601) 31.9 ± 0.6 235 71 150
daf-16(m26);pep-2(lg601) 9.3 ± 0.5 68 20 300
0 10 20 30 40 50 60 700
20
40
60
80
100
daf-16(m26)
pep-2(lg601)
wild type
daf-16(m26); pep-2(lg601)
daf-2(e1370);
daf-2(e1370); pep-2(lg601)
days
% a
live
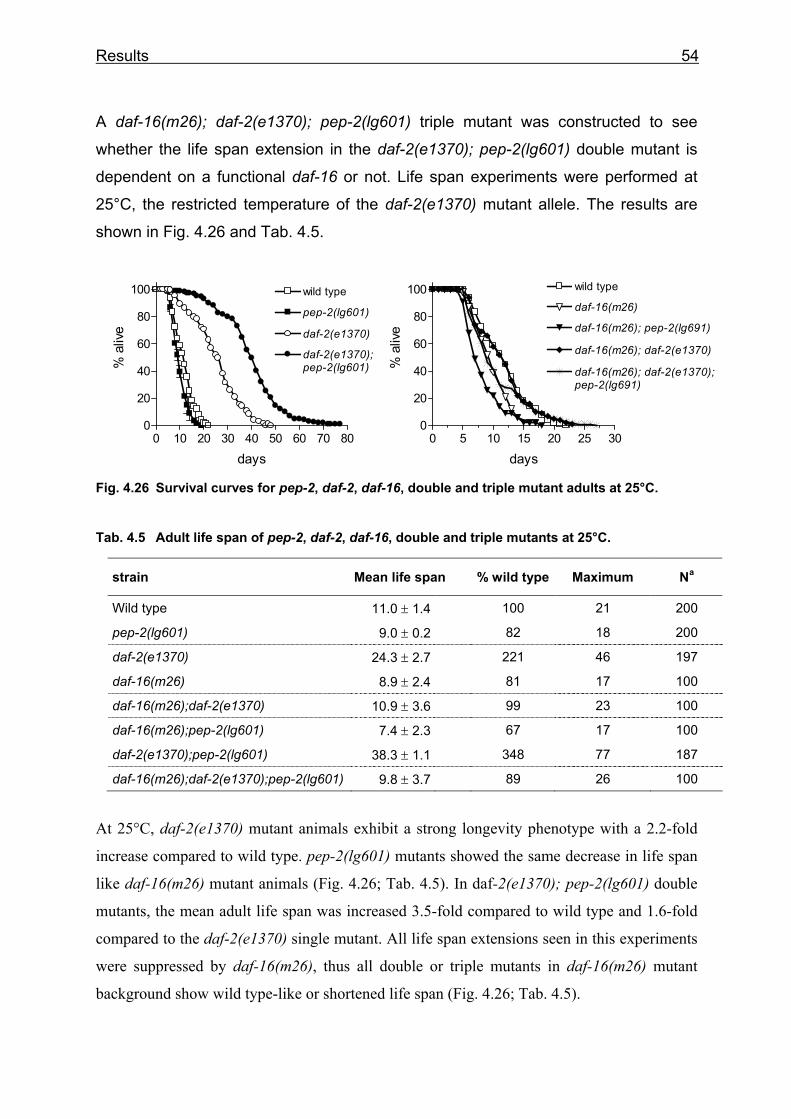
Results 54
A daf-16(m26); daf-2(e1370); pep-2(lg601) triple mutant was constructed to see
whether the life span extension in the daf-2(e1370); pep-2(lg601) double mutant is
dependent on a functional daf-16 or not. Life span experiments were performed at
25°C, the restricted temperature of the daf-2(e1370) mutant allele. The results are
shown in Fig. 4.26 and Tab. 4.5.
Fig. 4.26 Survival curves for pep-2, daf-2, daf-16, double and triple mutant adults at 25°C.
Tab. 4.5 Adult life span of pep-2, daf-2, daf-16, double and triple mutants at 25°C.
At 25°C, daf-2(e1370) mutant animals exhibit a strong longevity phenotype with a 2.2-fold
increase compared to wild type. pep-2(lg601) mutants showed the same decrease in life span
like daf-16(m26) mutant animals (Fig. 4.26; Tab. 4.5). In daf-2(e1370); pep-2(lg601) double
mutants, the mean adult life span was increased 3.5-fold compared to wild type and 1.6-fold
compared to the daf-2(e1370) single mutant. All life span extensions seen in this experiments
were suppressed by daf-16(m26), thus all double or triple mutants in daf-16(m26) mutant
background show wild type-like or shortened life span (Fig. 4.26; Tab. 4.5).
strain Mean life span % wild type Maximum Na
Wild type 11.0 ± 1.4 100 21 200
pep-2(lg601) 9.0 ± 0.2 82 18 200
daf-2(e1370) 24.3 ± 2.7 221 46 197
daf-16(m26) 8.9 ± 2.4 81 17 100
daf-16(m26);daf-2(e1370) 10.9 ± 3.6 99 23 100
daf-16(m26);pep-2(lg601) 7.4 ± 2.3 67 17 100
daf-2(e1370);pep-2(lg601) 38.3 ± 1.1 348 77 187
daf-16(m26);daf-2(e1370);pep-2(lg601) 9.8 ± 3.7 89 26 100
0 5 10 15 20 25 300
20
40
60
80
100
daf-16(m26); pep-2(lg691)
daf-16(m26); daf-2(e1370);pep-2(lg691)
daf-16(m26)
daf-16(m26); daf-2(e1370)
wild type
days
% a
live
0 10 20 30 40 50 60 70 800
20
40
60
80
100
daf-2(e1370);pep-2(lg601)
wild type
daf-2(e1370)
pep-2(lg601)
days
% a
live
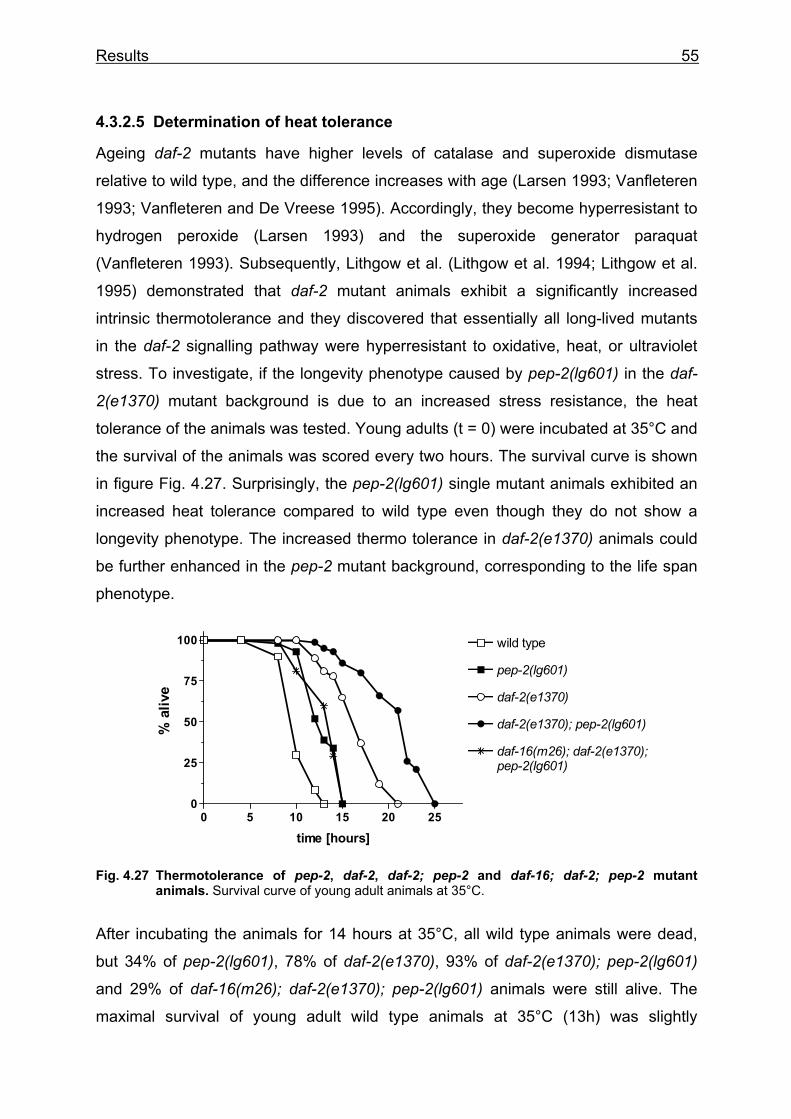
Results 55
4.3.2.5 Determination of heat tolerance
Ageing daf-2 mutants have higher levels of catalase and superoxide dismutase
relative to wild type, and the difference increases with age (Larsen 1993; Vanfleteren
1993; Vanfleteren and De Vreese 1995). Accordingly, they become hyperresistant to
hydrogen peroxide (Larsen 1993) and the superoxide generator paraquat
(Vanfleteren 1993). Subsequently, Lithgow et al. (Lithgow et al. 1994; Lithgow et al.
1995) demonstrated that daf-2 mutant animals exhibit a significantly increased
intrinsic thermotolerance and they discovered that essentially all long-lived mutants
in the daf-2 signalling pathway were hyperresistant to oxidative, heat, or ultraviolet
stress. To investigate, if the longevity phenotype caused by pep-2(lg601) in the daf-
2(e1370) mutant background is due to an increased stress resistance, the heat
tolerance of the animals was tested. Young adults (t = 0) were incubated at 35°C and
the survival of the animals was scored every two hours. The survival curve is shown
in figure Fig. 4.27. Surprisingly, the pep-2(lg601) single mutant animals exhibited an
increased heat tolerance compared to wild type even though they do not show a
longevity phenotype. The increased thermo tolerance in daf-2(e1370) animals could
be further enhanced in the pep-2 mutant background, corresponding to the life span
phenotype.
Fig. 4.27 Thermotolerance of pep-2, daf-2, daf-2; pep-2 and daf-16; daf-2; pep-2 mutant animals. Survival curve of young adult animals at 35°C.
After incubating the animals for 14 hours at 35°C, all wild type animals were dead,
but 34% of pep-2(lg601), 78% of daf-2(e1370), 93% of daf-2(e1370); pep-2(lg601)
and 29% of daf-16(m26); daf-2(e1370); pep-2(lg601) animals were still alive. The
maximal survival of young adult wild type animals at 35°C (13h) was slightly
0 5 10 15 20 250
25
50
75
100 wild type
daf-2(e1370)
pep-2(lg601)
daf-2(e1370); pep-2(lg601)
daf-16(m26); daf-2(e1370);pep-2(lg601)
time [hours]
% a
live
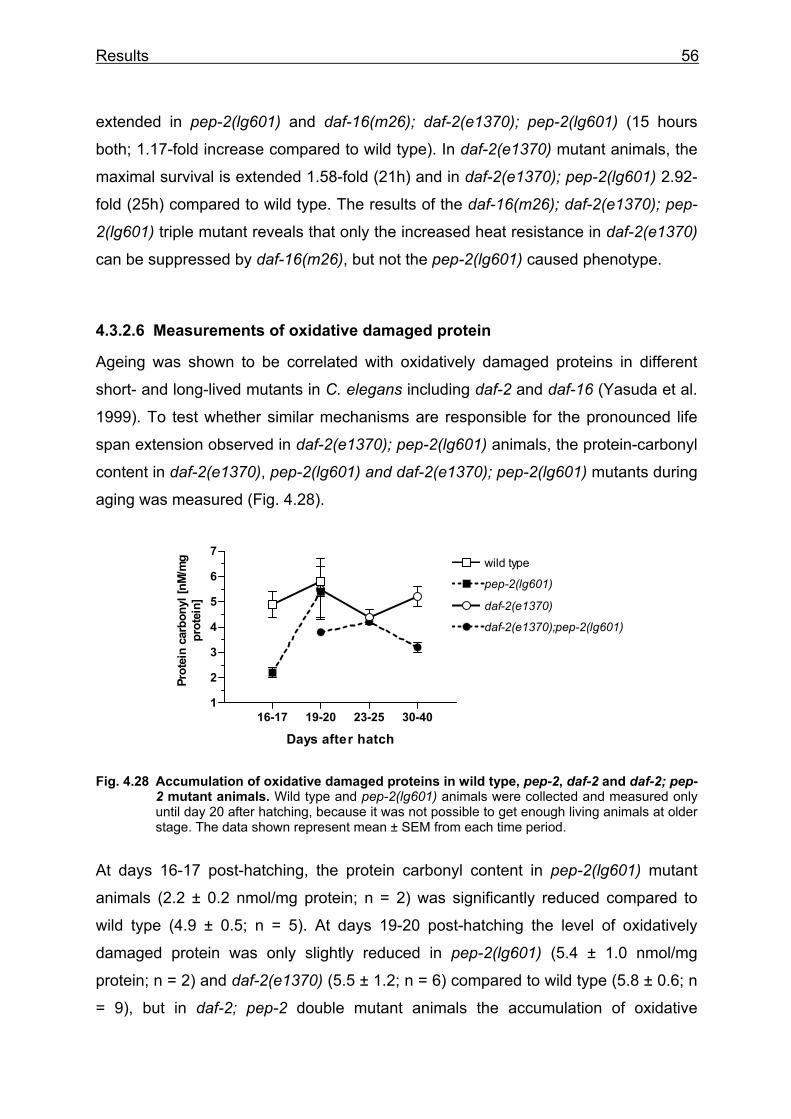
Results 56
extended in pep-2(lg601) and daf-16(m26); daf-2(e1370); pep-2(lg601) (15 hours
both; 1.17-fold increase compared to wild type). In daf-2(e1370) mutant animals, the
maximal survival is extended 1.58-fold (21h) and in daf-2(e1370); pep-2(lg601) 2.92-
fold (25h) compared to wild type. The results of the daf-16(m26); daf-2(e1370); pep-
2(lg601) triple mutant reveals that only the increased heat resistance in daf-2(e1370)
can be suppressed by daf-16(m26), but not the pep-2(lg601) caused phenotype.
4.3.2.6 Measurements of oxidative damaged protein
Ageing was shown to be correlated with oxidatively damaged proteins in different
short- and long-lived mutants in C. elegans including daf-2 and daf-16 (Yasuda et al.
1999). To test whether similar mechanisms are responsible for the pronounced life
span extension observed in daf-2(e1370); pep-2(lg601) animals, the protein-carbonyl
content in daf-2(e1370), pep-2(lg601) and daf-2(e1370); pep-2(lg601) mutants during
aging was measured (Fig. 4.28).
Fig. 4.28 Accumulation of oxidative damaged proteins in wild type, pep-2, daf-2 and daf-2; pep- 2 mutant animals. Wild type and pep-2(lg601) animals were collected and measured only until day 20 after hatching, because it was not possible to get enough living animals at older stage. The data shown represent mean ± SEM from each time period.
At days 16-17 post-hatching, the protein carbonyl content in pep-2(lg601) mutant
animals (2.2 ± 0.2 nmol/mg protein; n = 2) was significantly reduced compared to
wild type (4.9 ± 0.5; n = 5). At days 19-20 post-hatching the level of oxidatively
damaged protein was only slightly reduced in pep-2(lg601) (5.4 ± 1.0 nmol/mg
protein; n = 2) and daf-2(e1370) (5.5 ± 1.2; n = 6) compared to wild type (5.8 ± 0.6; n
= 9), but in daf-2; pep-2 double mutant animals the accumulation of oxidative
16-17 19-20 23-25 30-401
2
3
4
5
6
7wild type
pep-2(lg601)
daf-2(e1370)
daf-2(e1370);pep-2(lg601)
Days after hatch
Prot
ein
carb
onyl
[nM
/mg
prot
ein]
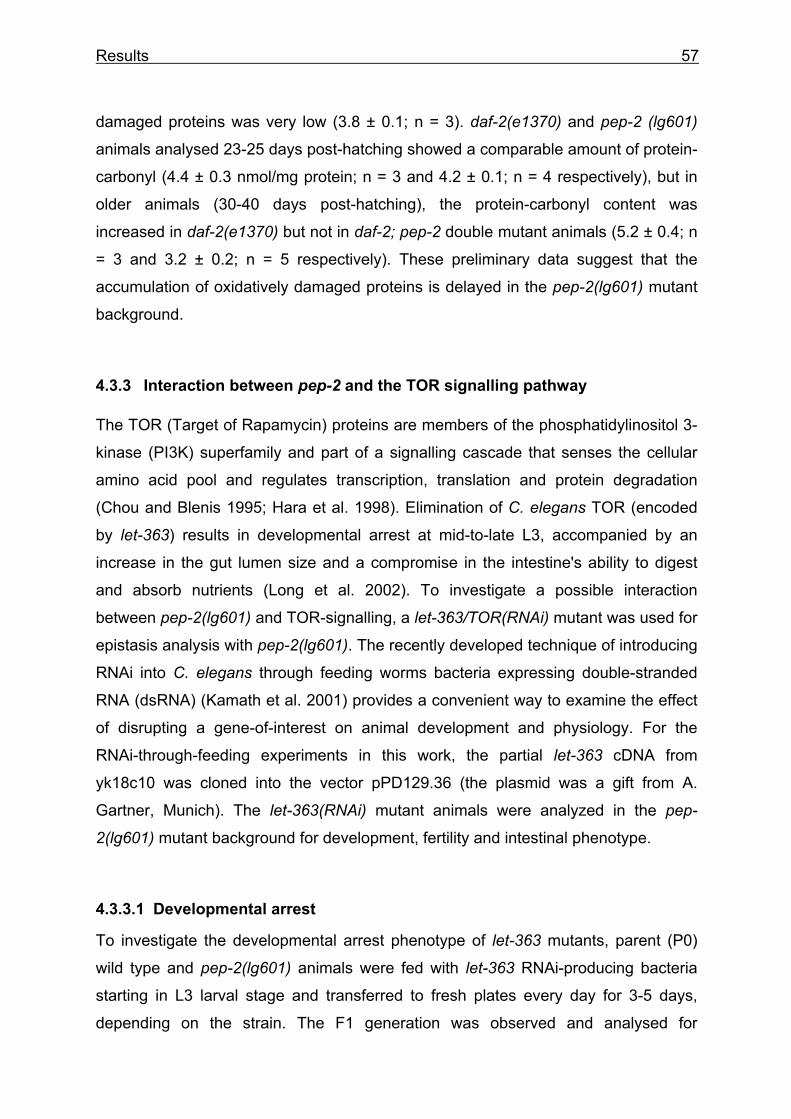
Results 57
damaged proteins was very low (3.8 ± 0.1; n = 3). daf-2(e1370) and pep-2 (lg601)
animals analysed 23-25 days post-hatching showed a comparable amount of protein-
carbonyl (4.4 ± 0.3 nmol/mg protein; n = 3 and 4.2 ± 0.1; n = 4 respectively), but in
older animals (30-40 days post-hatching), the protein-carbonyl content was
increased in daf-2(e1370) but not in daf-2; pep-2 double mutant animals (5.2 ± 0.4; n
= 3 and 3.2 ± 0.2; n = 5 respectively). These preliminary data suggest that the
accumulation of oxidatively damaged proteins is delayed in the pep-2(lg601) mutant
background.
4.3.3 Interaction between pep-2 and the TOR signalling pathway
The TOR (Target of Rapamycin) proteins are members of the phosphatidylinositol 3-
kinase (PI3K) superfamily and part of a signalling cascade that senses the cellular
amino acid pool and regulates transcription, translation and protein degradation
(Chou and Blenis 1995; Hara et al. 1998). Elimination of C. elegans TOR (encoded
by let-363) results in developmental arrest at mid-to-late L3, accompanied by an
increase in the gut lumen size and a compromise in the intestine's ability to digest
and absorb nutrients (Long et al. 2002). To investigate a possible interaction
between pep-2(lg601) and TOR-signalling, a let-363/TOR(RNAi) mutant was used for
epistasis analysis with pep-2(lg601). The recently developed technique of introducing
RNAi into C. elegans through feeding worms bacteria expressing double-stranded
RNA (dsRNA) (Kamath et al. 2001) provides a convenient way to examine the effect
of disrupting a gene-of-interest on animal development and physiology. For the
RNAi-through-feeding experiments in this work, the partial let-363 cDNA from
yk18c10 was cloned into the vector pPD129.36 (the plasmid was a gift from A.
Gartner, Munich). The let-363(RNAi) mutant animals were analyzed in the pep-
2(lg601) mutant background for development, fertility and intestinal phenotype.
4.3.3.1 Developmental arrest
To investigate the developmental arrest phenotype of let-363 mutants, parent (P0)
wild type and pep-2(lg601) animals were fed with let-363 RNAi-producing bacteria
starting in L3 larval stage and transferred to fresh plates every day for 3-5 days,
depending on the strain. The F1 generation was observed and analysed for
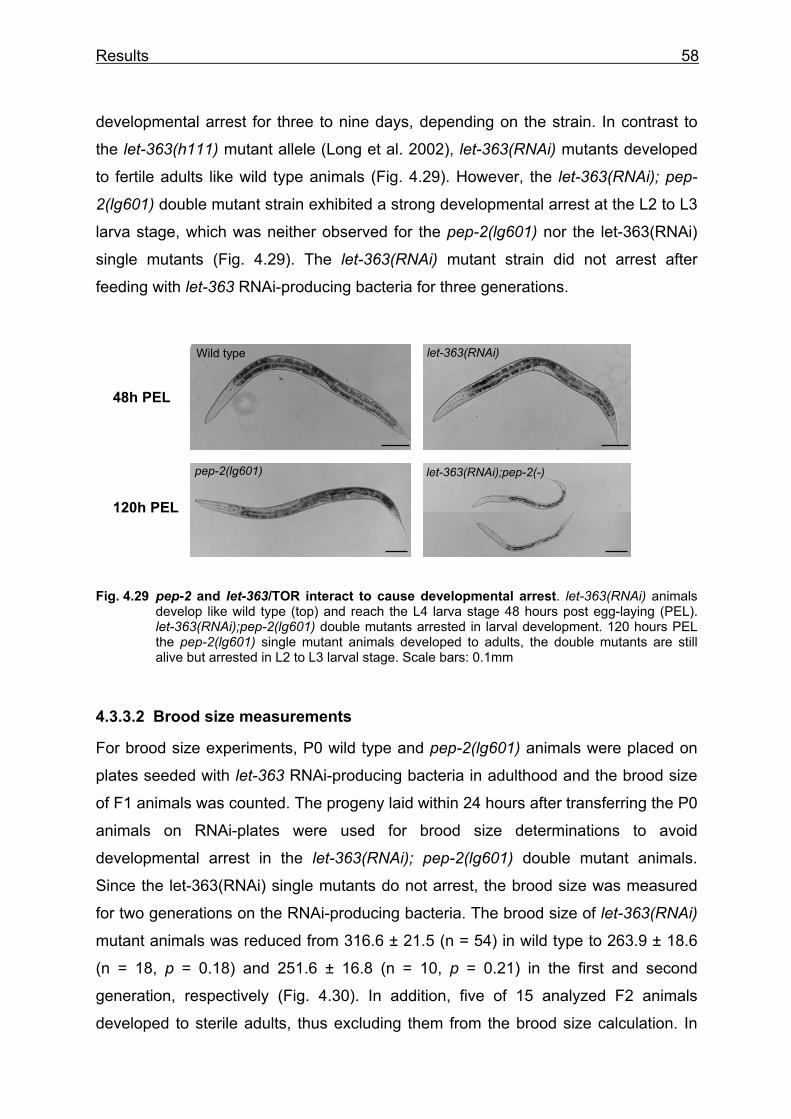
Results 58
developmental arrest for three to nine days, depending on the strain. In contrast to
the let-363(h111) mutant allele (Long et al. 2002), let-363(RNAi) mutants developed
to fertile adults like wild type animals (Fig. 4.29). However, the let-363(RNAi); pep-
2(lg601) double mutant strain exhibited a strong developmental arrest at the L2 to L3
larva stage, which was neither observed for the pep-2(lg601) nor the let-363(RNAi)
single mutants (Fig. 4.29). The let-363(RNAi) mutant strain did not arrest after
feeding with let-363 RNAi-producing bacteria for three generations.
Fig. 4.29 pep-2 and let-363/TOR interact to cause developmental arrest. let-363(RNAi) animals develop like wild type (top) and reach the L4 larva stage 48 hours post egg-laying (PEL). let-363(RNAi);pep-2(lg601) double mutants arrested in larval development. 120 hours PEL the pep-2(lg601) single mutant animals developed to adults, the double mutants are still alive but arrested in L2 to L3 larval stage. Scale bars: 0.1mm
4.3.3.2 Brood size measurements
For brood size experiments, P0 wild type and pep-2(lg601) animals were placed on
plates seeded with let-363 RNAi-producing bacteria in adulthood and the brood size
of F1 animals was counted. The progeny laid within 24 hours after transferring the P0
animals on RNAi-plates were used for brood size determinations to avoid
developmental arrest in the let-363(RNAi); pep-2(lg601) double mutant animals.
Since the let-363(RNAi) single mutants do not arrest, the brood size was measured
for two generations on the RNAi-producing bacteria. The brood size of let-363(RNAi)
mutant animals was reduced from 316.6 ± 21.5 (n = 54) in wild type to 263.9 ± 18.6
(n = 18, p = 0.18) and 251.6 ± 16.8 (n = 10, p = 0.21) in the first and second
generation, respectively (Fig. 4.30). In addition, five of 15 analyzed F2 animals
developed to sterile adults, thus excluding them from the brood size calculation. In
Wild type
48h PEL
120h PEL
let-363(RNAi)
pep-2(lg601) let-363(RNAi);pep-2(-)
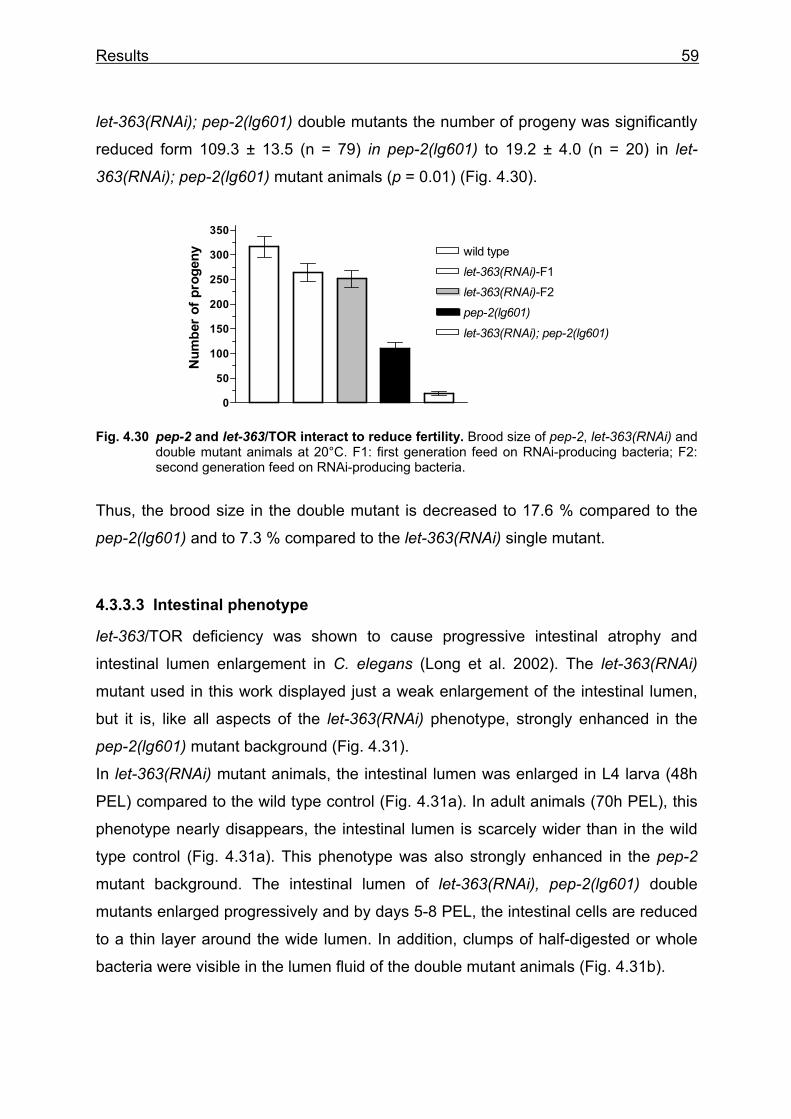
Results 59
let-363(RNAi); pep-2(lg601) double mutants the number of progeny was significantly
reduced form 109.3 ± 13.5 (n = 79) in pep-2(lg601) to 19.2 ± 4.0 (n = 20) in let-
363(RNAi); pep-2(lg601) mutant animals (p = 0.01) (Fig. 4.30).
Fig. 4.30 pep-2 and let-363/TOR interact to reduce fertility. Brood size of pep-2, let-363(RNAi) and double mutant animals at 20°C. F1: first generation feed on RNAi-producing bacteria; F2: second generation feed on RNAi-producing bacteria.
Thus, the brood size in the double mutant is decreased to 17.6 % compared to the
pep-2(lg601) and to 7.3 % compared to the let-363(RNAi) single mutant.
4.3.3.3 Intestinal phenotype
let-363/TOR deficiency was shown to cause progressive intestinal atrophy and
intestinal lumen enlargement in C. elegans (Long et al. 2002). The let-363(RNAi)
mutant used in this work displayed just a weak enlargement of the intestinal lumen,
but it is, like all aspects of the let-363(RNAi) phenotype, strongly enhanced in the
pep-2(lg601) mutant background (Fig. 4.31).
In let-363(RNAi) mutant animals, the intestinal lumen was enlarged in L4 larva (48h
PEL) compared to the wild type control (Fig. 4.31a). In adult animals (70h PEL), this
phenotype nearly disappears, the intestinal lumen is scarcely wider than in the wild
type control (Fig. 4.31a). This phenotype was also strongly enhanced in the pep-2
mutant background. The intestinal lumen of let-363(RNAi), pep-2(lg601) double
mutants enlarged progressively and by days 5-8 PEL, the intestinal cells are reduced
to a thin layer around the wide lumen. In addition, clumps of half-digested or whole
bacteria were visible in the lumen fluid of the double mutant animals (Fig. 4.31b).
0
50
100
150
200
250
300
350
wild typelet-363(RNAi)-F1
pep-2(lg601)let-363(RNAi); pep-2(lg601)
let-363(RNAi)-F2
Num
ber
of p
roge
ny
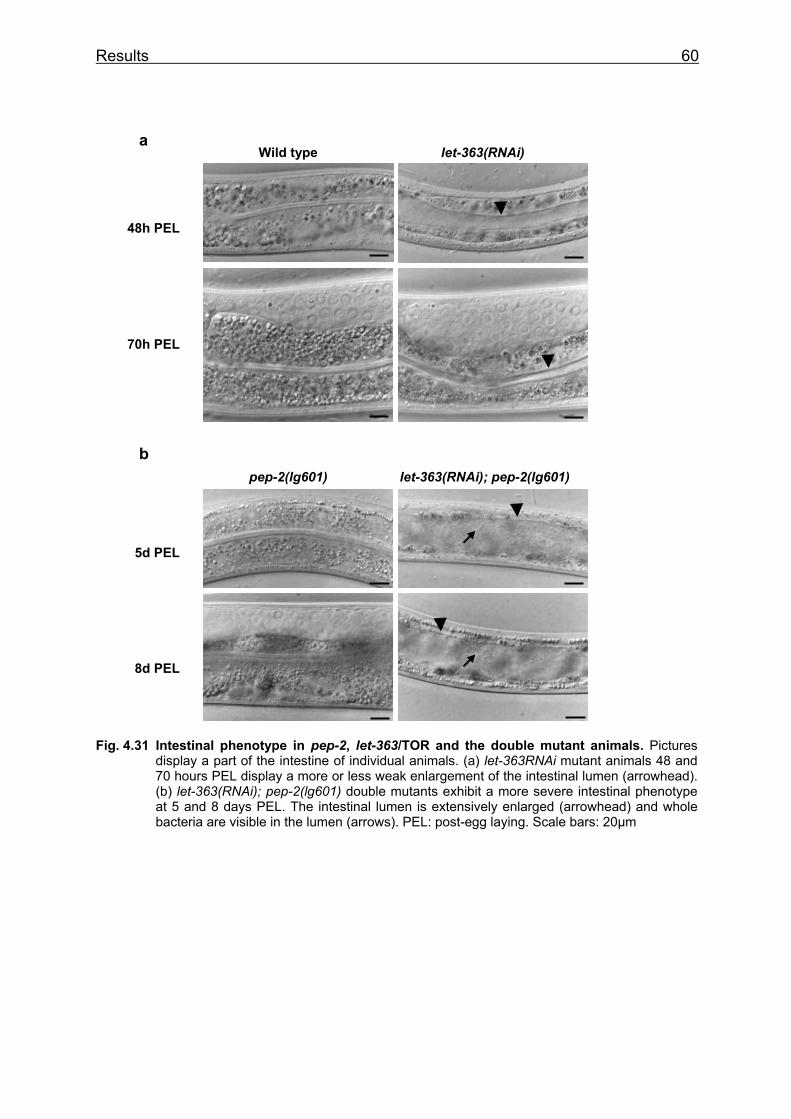
Results 60
Fig. 4.31 Intestinal phenotype in pep-2, let-363/TOR and the double mutant animals. Pictures display a part of the intestine of individual animals. (a) let-363RNAi mutant animals 48 and 70 hours PEL display a more or less weak enlargement of the intestinal lumen (arrowhead). (b) let-363(RNAi); pep-2(lg601) double mutants exhibit a more severe intestinal phenotype at 5 and 8 days PEL. The intestinal lumen is extensively enlarged (arrowhead) and whole bacteria are visible in the lumen (arrows). PEL: post-egg laying. Scale bars: 20µm
Wild type let-363(RNAi)
pep-2(lg601) let-363(RNAi); pep-2(lg601)
48h PEL
70h PEL
5d PEL
8d PEL
a
b
Discussion 61
5 Discussion Although the function of mammalian peptide transporters has been studied
extensively in vitro, less is known about the physiological importance of the proteins
in living organisms. The intestinal isoform is thought to mediate uptake of di-and
tripeptides from luminal protein break-down but its contribution to overall amino acid
absorption in the gut and protein nutrition in vivo remained unknown. In 1998, two C.
elegans oligopeptide transporters have been cloned and characterized by functional
expression in Xenopus leavis oocytes and shown to resemble the two isoforms found
in mammals (Fei et al. 1998).
In the present work, the model organism C. elegans was used to study the
transporter proteins in vivo by analysing
- the expression pattern by generating transgenic animals that express reporter
genes under the control of the specific promoters.
- the phenotype of deletion mutant strains for developmental and reproductive
defects
- the interplay of transporter-dependent amino acid nutrition and signalling
pathways involved in protein homeostasis employing animals with different
genetic backgrounds.
5.1 Expression and function of proton-coupled peptide transporter in C.
elegans
PEP-2, the functional homologue of the mammalian PEPT1, is expressed in intestinal
cells throughout all developmental stages of C. elegans, starting in embryogenesis.
This expression pattern is consistent with the proposed physiological function of
PEP-2 in the intestinal uptake of di- and tripeptides derived from digestion of dietary
proteins. An expression was also observed in the ASI sensory neurons in the head.
This pair of neurons is known to be important for the transmission of environmental
cues necessary for proper development of the animal, suggesting a possible link of
pep-2 to theses processes.
PEP-1 shows a much broader expression and tissue distribution, similar to its
mammalian homologue PEPT2. The pep-1 promoter-driven reporter construct is
expressed in several tissues of C. elegans including vulva and nerve cord. A strong
Discussion 62
neuronal expression is reminiscent of the tissue distribution of the mammalian
PEPT2 protein, which has been identified in the rat peripheral and central nervous
system. The function of this proton-coupled peptide transporters in neuronal cells
remains to be determined.
To analyse the function of the C. elegans peptide transporter in vivo, deletion
mutant strains for pep-1 and pep-2 were generated. The pep-1(lg501) mutant allele
lacks 2.5 kb including 1269 bp of the promoter sequence, the translational start
codon and the first six exons. The pep-2(lg601) mutant allele lacks 1.7 kb, including
257 bp of the promoter sequence, the translational start codon and the first six
exons. Even if the proteins were produced in the mutants, they would lack most of
the essential amino acid residues and domains known to be important for substrate
binding and transport, mainly located in the N-terminal part. Thus, the reported
mutant alleles most likely represent loss-of-function or null alleles.
To investigate the function of the C. elegans peptide transporter proteins in the
intestine, both mutant strains were tested for the uptake of β-Ala-Lys-AMCA, a
fluorescent model substrate, in feeding trials. Efficient uptake of the reporter
molecule in pep-1(lg501) mutant animals was shown by a strong fluorescent staining
in all intestinal cells as in wild type animals. In contrast, pep-2(lg601) mutant animals
lacked this staining. The fluorescence was here detectable only in the intestinal
lumen, indicating normal ingestion but lack of absorption of the reporter molecules.
This experiment reveals that only a functional PEP-2 but not a PEP-1 protein is
necessary for the uptake of β-Ala-Lys-AMCA and other di-/tripeptides across the
apical membrane into the intestinal cells. Thus, PEP-1 seems not to be functional in
the intestine and there is no redundancy of pep-1 and pep-2 with respect to the
intestinal peptide transport in C. elegans.
Since the pep-2(lg601) mutant strain is viable, the intestinal peptide transport
via PEP-2 is not essential for life, but the mutant animals show strong developmental
and reproductive defects as analysed by various assays. The homozygote pep-
2(lg601) mutant animals are smaller and display a prolonged postembryonic
development compared to wild type animals. These data suggest that the intestinal
peptide transporter PEP-2 represents a very important delivery system for peptide-
bound amino acids during periods of a high demand for amino acids such as during
growth and development. In addition, the pep-2(lg601) mutant strain exhibits strong
defects in reproduction. It was shown that in pep-2(-) animals the number of eggs laid
Discussion 63
per hour and the number of eggs in the uterus is decreased, and the egg-laying
period is strongly extended. Since the oocytes in the mutant hermaphrodites
accumulate as much yolk protein as the wild type control, it seems likely that the
accumulation of yolk in the oocytes takes longer than in wild type animals. In
addition, the total amount of progeny in pep-2(lg601) animals is reduced to 35% of
that in wild type animals, indicative of a limited availability of amino acid nitrogen for
the production of progeny. The limited fertility of pep-2 males shown by a male
mating test may be explained by a delayed or decreased production of sperm caused
by amino acid deprivation. Since the feeding behaviour, measured by pharyngeal
pumping and defecation cycle, is not affected in the mutant animals, the missing
intestinal absorption of amino acid nitrogen via the peptide transporter seems to be
the only limiting factor. Although the brush border transporters for free amino acids
could provide sufficient essential amino acids for life, they obviously can not
compensate for the lack of PEP-2 function to enable proper development, growth and
reproduction.
To examine if a higher availability of free amino acids may prevent the
phenotype in mutants lacking the intestinal peptide transporter, pep-2(lg601) animals
were fed on amino acid supplemented agar plates. The supplemented mutant
animals exhibited a partial rescue of the brood size and developmental delays.
Therefore, when the dietary availability of free amino acids is increased, uptake via
the different amino acid transporters can compensate partially the missing peptide
transporter activity. Nevertheless, this is not sufficient to restore the wild type
situation. This could be due to the insufficient activity of amino acid transporters in
the intestinal membrane, or the insufficient ingestion of the supplemented amino
acids into the gut. Interestingly, the rescue for the progeny production with an
increase of 50% compared to pep-2(lg601) mutant animals without supplementation
is much higher than the rescue achieved in the delayed postembryonic development.
Even in the second generation of amino acid supplemented animals, the prolonged
generation time in pep-2(-) animals was decreased only by about 10% compared to
the non-supplemented animals. This might reflect an even higher demand for amino
acid nitrogen during development as compared to reproduction.
To demonstrate finally that the deletion in the pep-2 gene is responsible for the
phenotype described, transgenic mutant animals carrying an extrachromosomal copy
of the pep-2 wild type gene were constructed. Two transgenic lines were analyzed for
Discussion 64
β-Ala-Lys-AMCA staining and generation time and it was shown that a wild type copy
of the pep-2 gene is sufficient to rescue the pep-2 mutant phenotype. Since an
extrachromosomal array result in a mosaic expression in the animal, a complete
reconstitution of the wild type situation is improbable.
There are several possible explanations for the observed phenotype of pep-
2(lg601) mutant animals. The defects described above may be caused by a limited
availability of amino acids as energy substrates resulting in caloric restriction, or a
more specific effect by an insufficient supply of essential amino acids for protein
synthesis. The consequences of a limited amino acid intake for the ageing process in
an organism have not been addressed before, but it is known that restricting energy
or glucose availability or perturbing the underlying signalling pathways prolongs
lifespan in eukaryotes (Lin et al. 2000). The observation that a caloric restriction in
rodents can modify the rate of ageing has been demonstrated repeatedly since the
first report of McCay in 1935 (McCay et al. 1935) and the increase in life span was
shown for a variety of animals (Weindruch and Walford 1988). About 25 years ago it
was reported that life span of C. elegans can be extended by about 50% by growth in
liquid cultures with relatively low concentrations of bacteria (Klass 1977). In addition,
life span is known to be coupled to the rate of feeding in C. elegans. Some eat
mutants that ingest bacteria less efficiently than wild type, which mimicks caloric
restriction, live up to 50% longer (Lakowski and Hekimi 1998). Since pep-2(lg601)
animals do not show a significant change in adult life span as compared to wild type
or eat-2(ad453) as a positive control, the abolished intestinal peptide uptake does
seemingly not cause a caloric restriction which is severe enough to lengthen life
span.
The pep-1(lg501) mutant strain was analyzed for generation time and brood
size. Neither in the single mutant strain nor in the pep-1(lg501); pep-2(lg601) double
mutant, the deletion of pep-1 did show any effect. These results lead to the
conclusion that PEP-1, in contrast to PEP-2 is not necessary for proper growth,
development and reproduction in C. elegans.
Discussion 65
5.2 Function of pep-2 in development, metabolism and aging
C. elegans has a dynamic ability to sense and respond to its environment, often
integrating multiple sensory signals to generate one response. For example, dauer
formation is induced by conditions of high dauer pheromone levels (crowding),
starvation, and high temperature and is regulated by the activity of the chemosensory
neurons ASI, ADF, and ASJ. DAF-7, a TGF-ß homologue, is constitutively expressed
in the ASI neurons, to maintain normal reproductive growth. At high pheromone
levels, the expression of daf-7 is significantly downregulated and laser ablation of the
ASI neurons was shown to cause dauer formation (Bargmann and Horvitz 1991). In
addition, the metabolic dysregulation in tph-1 mutants, which are defective in
serotonin synthesis, is, in part, due to the downregulation of daf-7 in the ASI neurons
(Sze et al. 2000). Since pep-2 was shown to be expressed in the ASI neurons it
could be possible that the peptide transporter might function as a kind of food sensor
and transmit signals via the DAF-7 pathway. For this reason, the expression of a daf-
7::GFP reporter construct was analyzed in the pep-2 mutant background. But unlike
in tph-1 mutants no reduction of daf-7::GFP expression was visible in the pep-2
mutants. Thus, pep-2 appears not to be directly involved in the regulation of the TGF-
β homologue DAF-7 to control development and therefore the function of PEP-2 in
the ASI neurons still remains unclear.
In C. elegans, a second pathway is known to regulate metabolism, the DAF-2
(Insulin/IGF-like signalling) pathway. The availability of dietary protein or amino acids
is known to affect this pathway in Drosophila (Britton et al. 2002) and mammals
(Takenaka et al. 2000; Gems and Partridge 2001) to regulate growth and
development. On the other side, the mammalian peptide transporter PEPT1 is known
to be regulated by insulin treatment (Thamotharan et al. 1999). In addition, pep-2
was reported to be downregulated in a daf-2(-) mutant background (Murphy et al.
2003). To analyze a possible interaction of pep-2 and daf-2 in vivo, a double mutant
was generated in this work. If double mutants show a phenotype approximated by
adding the strength of the single mutant phenotypes, the effect of the single
mutations is additive. On the other hand, a much more intense phenotype in a double
mutant defines a synergistic effect (Hekimi 2000). The analysis of the daf-2(-); pep-
2(-) double mutant strain revealed additive and synergistic effects as compared to the
single mutant phenotypes, depending on the phenotype observed.
Discussion 66
In daf-2(-) animals, the brood size is reduced and generation time is enhanced at
20°C, like in the pep-2(lg601) mutant strain. In a daf-2(-); pep-2(-) double mutants,
both phenotypes are significantly stronger compared to each of the single mutant
strains, reflecting an additive effect. To further confirm this effect, daf-2(-), pep-2(-)
and the daf-2(-); pep-2(-) mutants were analyzed for suppression by daf-16(-). All daf-
2(-) mutant phenotypes are known to be dependent on a functional DAF-16 forkhead
transcription factor, the main downstream target of the daf-2 insulin-like signalling,
resulting in a suppression of the daf-2(-) phenotype in a daf-16(-); daf-2(-) double
mutant. This was also shown for brood size and postembryonic development in this
work. In contrast, the decreased production of progeny and the increased generation
time in the pep-2(lg601) mutant stain was not suppressed in the daf-16(-)
background. Finally the daf-16(-); daf-2(-); pep-2(-) triple mutant behaves like the
pep-2 single mutant. Taken these data together leads to the conclusion that the
impairments found in the pep-2(lg601) mutant phenotype are not directly transmitted
via the daf-2 insulin-like signalling pathway since they are not dependent on a
functional DAF-16. Thus, pep-2 is acting in parallel to daf-2 to control development
and reproduction (Fig. 5.1).
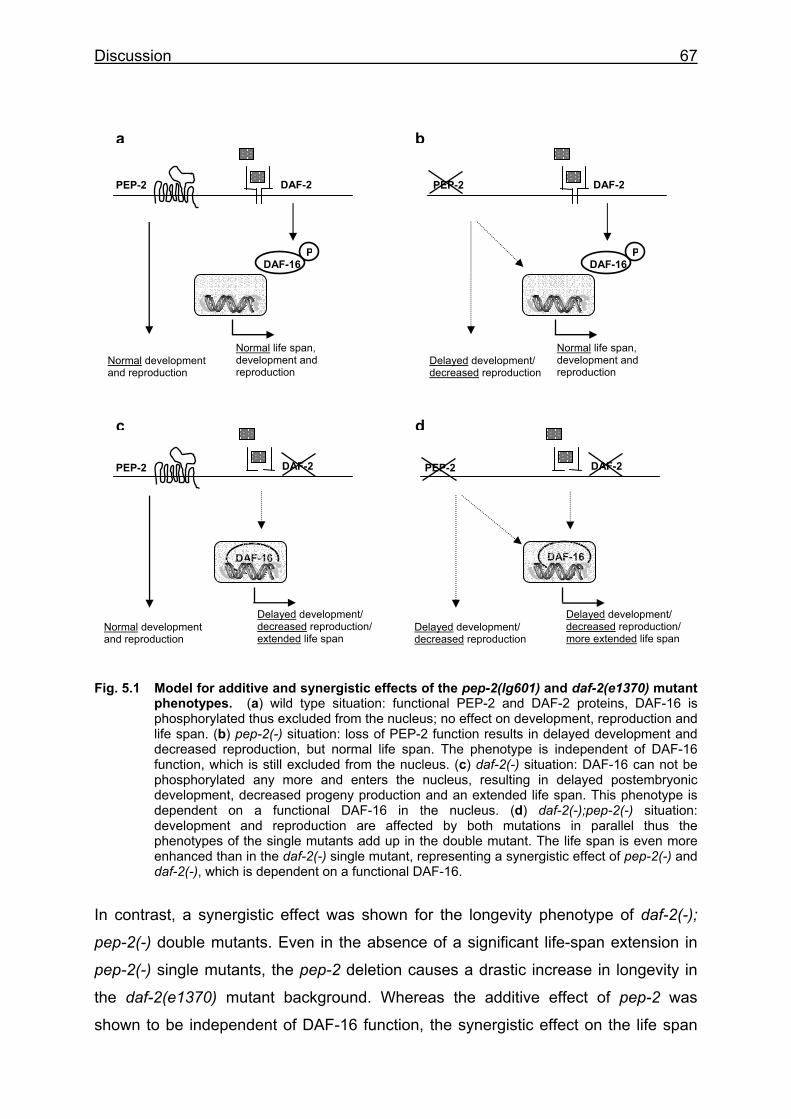
Discussion 67
Fig. 5.1 Model for additive and synergistic effects of the pep-2(lg601) and daf-2(e1370) mutant phenotypes. (a) wild type situation: functional PEP-2 and DAF-2 proteins, DAF-16 is phosphorylated thus excluded from the nucleus; no effect on development, reproduction and life span. (b) pep-2(-) situation: loss of PEP-2 function results in delayed development and decreased reproduction, but normal life span. The phenotype is independent of DAF-16 function, which is still excluded from the nucleus. (c) daf-2(-) situation: DAF-16 can not be phosphorylated any more and enters the nucleus, resulting in delayed postembryonic development, decreased progeny production and an extended life span. This phenotype is dependent on a functional DAF-16 in the nucleus. (d) daf-2(-);pep-2(-) situation: development and reproduction are affected by both mutations in parallel thus the phenotypes of the single mutants add up in the double mutant. The life span is even more enhanced than in the daf-2(-) single mutant, representing a synergistic effect of pep-2(-) and daf-2(-), which is dependent on a functional DAF-16.
In contrast, a synergistic effect was shown for the longevity phenotype of daf-2(-);
pep-2(-) double mutants. Even in the absence of a significant life-span extension in
pep-2(-) single mutants, the pep-2 deletion causes a drastic increase in longevity in
the daf-2(e1370) mutant background. Whereas the additive effect of pep-2 was
shown to be independent of DAF-16 function, the synergistic effect on the life span
DAF-16
PEP-2
DAF-16 P
Normal life span, development and reproduction
DAF-2
Normal development and reproduction
DAF-2 PEP-2
Delayed development/ decreased reproduction/ extended life span
Normal development and reproduction
DAF-2 PEP-2
DAF-16
Delayed development/ decreased reproduction/ more extended life span
Delayed development/ decreased reproduction
PEP-2
DAF-16 P
Normal life span, development and reproduction
DAF-2
Delayed development/ decreased reproduction
a b
c d
Discussion 68
could be completely suppressed by an additional mutation in the daf-16 gene.
Therefore, it seems likely that life span extension in pep-2 mutant animals is only
possible if there is a functional, nuclear localized DAF-16 transcription factor. In a
pep-2 single mutant, the daf-2 signalling cascade is obviously able to phosphorylate
DAF-16, resulting in inactivation by exclusion from nuclear translocation. Only in a
daf-2 mutant background the effects caused by the pep-2 deletion can be transmitted
via the active DAF-16 transcription factor in the nucleus to regulate longevity (Fig.
5.1).
To find an explanation for the life span effect seen in the daf-2(-); pep-2(-) double
mutant strain, the animals were analysed for heat tolerance and oxidatively damaged
proteins. Both parameters were shown to be directly correlated to ageing in C.
elegans. Most of the long-lived mutant strains described before display greater
resistance to one or more forms of environmental stress like oxidative stress
(Vanfleteren 1993), heat (Lithgow et al. 1994) or UV light (Murakami and Johnson
1996). A positive correlation between stress resistance and life span and the role of
oxidative damage and environmental stresses on aging are well studied subjects in
C. elegans (Martin et al. 1996; Lithgow 2000; Johnson et al. 2001).
Lithgow et al. 1995 showed that mutants of the insulin-like signalling pathway
(daf-2 and age-1) display a higher resistance to thermal stress. To investigate a
correlation between the extended life span in the daf-2(-); pep-2(-) double mutants
and their thermoresistance, the heat tolerance for wild type, pep-2(-), daf-2(-), daf-2(-
); pep-2(-) and daf-16(-); daf-2(-); pep-2(-) has been determined in this work. This
experiment revealed that the daf-2(-); pep-2(-) double mutants exhibited a higher
thermotolerance as compared to each of the single mutants, corresponding to the life
span phenotype observed for these mutant strains. Surprisingly, in pep-2(-) single
mutants the tolerance is slightly increased even if their life span is not extended. The
increased heat resistance measured in the daf-2(-); pep-2(-) double mutant seems to
be additive rather than synergistic, in contrast to the synergistic effect shown for the
ageing phenotype. Again, the daf-16(-); daf-2(-); pep-2(-) triple mutant strain behaves
like the pep-2(-) single mutants. Thus, the weakly increased thermotolerance in pep-
2(lg601) animals is not depended on a functional DAF-16 and is, therefore,
independent of the daf-2 signalling pathway. Taken these data together leads to the
conclusion that an elevated thermotolerance appears to be important but not
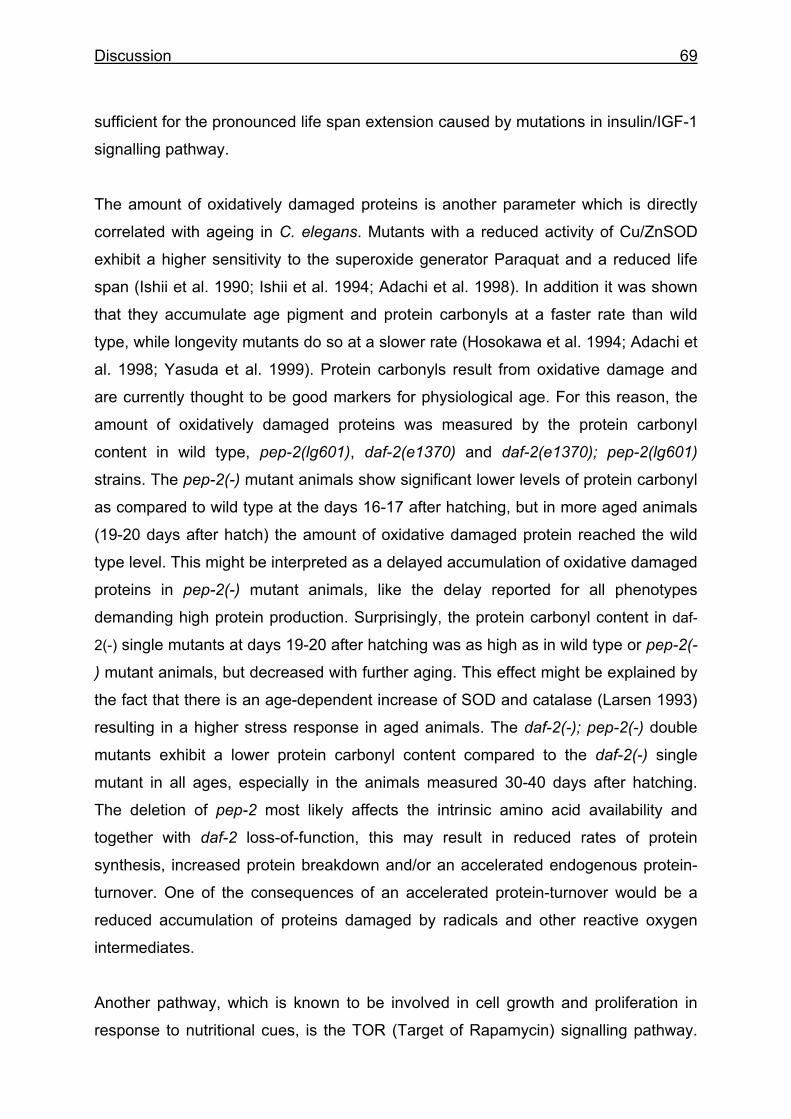
Discussion 69
sufficient for the pronounced life span extension caused by mutations in insulin/IGF-1
signalling pathway.
The amount of oxidatively damaged proteins is another parameter which is directly
correlated with ageing in C. elegans. Mutants with a reduced activity of Cu/ZnSOD
exhibit a higher sensitivity to the superoxide generator Paraquat and a reduced life
span (Ishii et al. 1990; Ishii et al. 1994; Adachi et al. 1998). In addition it was shown
that they accumulate age pigment and protein carbonyls at a faster rate than wild
type, while longevity mutants do so at a slower rate (Hosokawa et al. 1994; Adachi et
al. 1998; Yasuda et al. 1999). Protein carbonyls result from oxidative damage and
are currently thought to be good markers for physiological age. For this reason, the
amount of oxidatively damaged proteins was measured by the protein carbonyl
content in wild type, pep-2(lg601), daf-2(e1370) and daf-2(e1370); pep-2(lg601)
strains. The pep-2(-) mutant animals show significant lower levels of protein carbonyl
as compared to wild type at the days 16-17 after hatching, but in more aged animals
(19-20 days after hatch) the amount of oxidative damaged protein reached the wild
type level. This might be interpreted as a delayed accumulation of oxidative damaged
proteins in pep-2(-) mutant animals, like the delay reported for all phenotypes
demanding high protein production. Surprisingly, the protein carbonyl content in daf-
2(-) single mutants at days 19-20 after hatching was as high as in wild type or pep-2(-
) mutant animals, but decreased with further aging. This effect might be explained by
the fact that there is an age-dependent increase of SOD and catalase (Larsen 1993)
resulting in a higher stress response in aged animals. The daf-2(-); pep-2(-) double
mutants exhibit a lower protein carbonyl content compared to the daf-2(-) single
mutant in all ages, especially in the animals measured 30-40 days after hatching.
The deletion of pep-2 most likely affects the intrinsic amino acid availability and
together with daf-2 loss-of-function, this may result in reduced rates of protein
synthesis, increased protein breakdown and/or an accelerated endogenous protein-
turnover. One of the consequences of an accelerated protein-turnover would be a
reduced accumulation of proteins damaged by radicals and other reactive oxygen
intermediates.
Another pathway, which is known to be involved in cell growth and proliferation in
response to nutritional cues, is the TOR (Target of Rapamycin) signalling pathway.
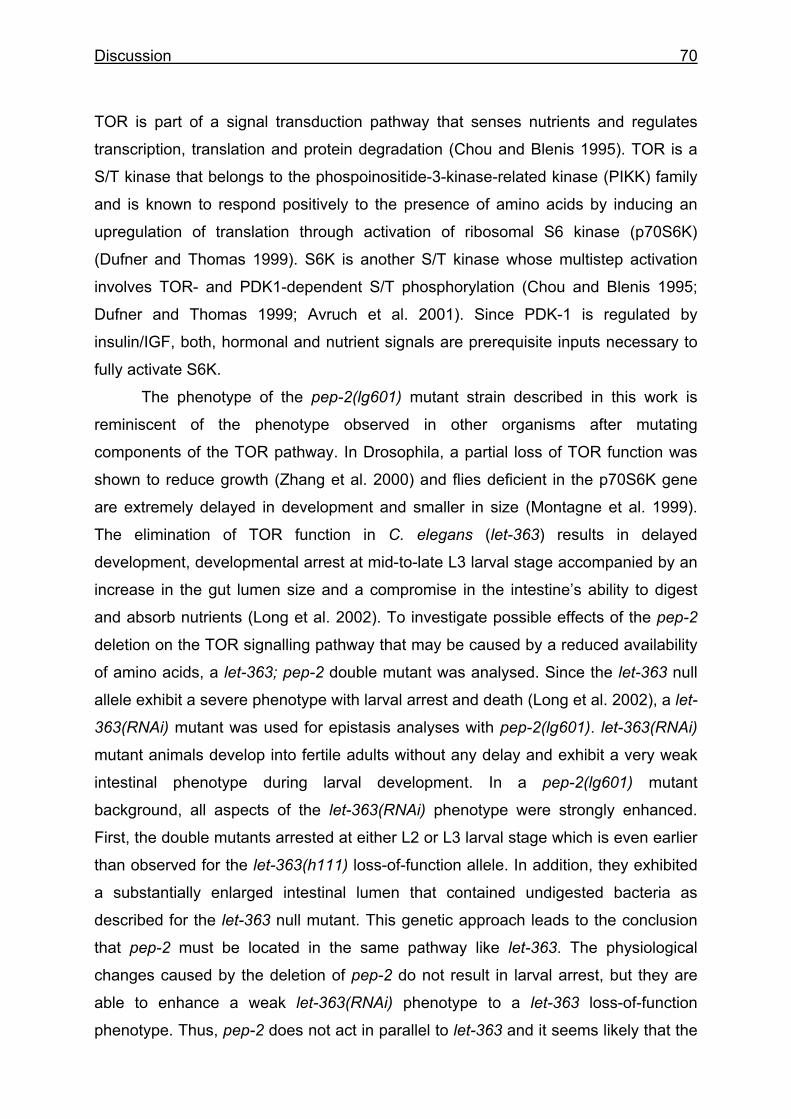
Discussion 70
TOR is part of a signal transduction pathway that senses nutrients and regulates
transcription, translation and protein degradation (Chou and Blenis 1995). TOR is a
S/T kinase that belongs to the phospoinositide-3-kinase-related kinase (PIKK) family
and is known to respond positively to the presence of amino acids by inducing an
upregulation of translation through activation of ribosomal S6 kinase (p70S6K)
(Dufner and Thomas 1999). S6K is another S/T kinase whose multistep activation
involves TOR- and PDK1-dependent S/T phosphorylation (Chou and Blenis 1995;
Dufner and Thomas 1999; Avruch et al. 2001). Since PDK-1 is regulated by
insulin/IGF, both, hormonal and nutrient signals are prerequisite inputs necessary to
fully activate S6K.
The phenotype of the pep-2(lg601) mutant strain described in this work is
reminiscent of the phenotype observed in other organisms after mutating
components of the TOR pathway. In Drosophila, a partial loss of TOR function was
shown to reduce growth (Zhang et al. 2000) and flies deficient in the p70S6K gene
are extremely delayed in development and smaller in size (Montagne et al. 1999).
The elimination of TOR function in C. elegans (let-363) results in delayed
development, developmental arrest at mid-to-late L3 larval stage accompanied by an
increase in the gut lumen size and a compromise in the intestine’s ability to digest
and absorb nutrients (Long et al. 2002). To investigate possible effects of the pep-2
deletion on the TOR signalling pathway that may be caused by a reduced availability
of amino acids, a let-363; pep-2 double mutant was analysed. Since the let-363 null
allele exhibit a severe phenotype with larval arrest and death (Long et al. 2002), a let-
363(RNAi) mutant was used for epistasis analyses with pep-2(lg601). let-363(RNAi)
mutant animals develop into fertile adults without any delay and exhibit a very weak
intestinal phenotype during larval development. In a pep-2(lg601) mutant
background, all aspects of the let-363(RNAi) phenotype were strongly enhanced.
First, the double mutants arrested at either L2 or L3 larval stage which is even earlier
than observed for the let-363(h111) loss-of-function allele. In addition, they exhibited
a substantially enlarged intestinal lumen that contained undigested bacteria as
described for the let-363 null mutant. This genetic approach leads to the conclusion
that pep-2 must be located in the same pathway like let-363. The physiological
changes caused by the deletion of pep-2 do not result in larval arrest, but they are
able to enhance a weak let-363(RNAi) phenotype to a let-363 loss-of-function
phenotype. Thus, pep-2 does not act in parallel to let-363 and it seems likely that the
Discussion 71
pep-2 mediated reduction in amino acid availability affects secondarily the TOR/S6K
pathway to impair growth and development.
TOR has been implicated in the insulin/IGF network based on cell culture
experiments (Scott et al. 1998; Raught et al. 2001) and in Drosophila it was shown
that TOR is required for the growth-stimulating effect of the PI3K pathway (Zhang et
al. 2000). However, this convergence is not yet evident in C. elegans, the data in this
work suggest a connection between insulin signalling, amino acid availability and
TOR signalling. A model showing the possible crosstalk between the pathways is
provided in figure Fig. 5.2.
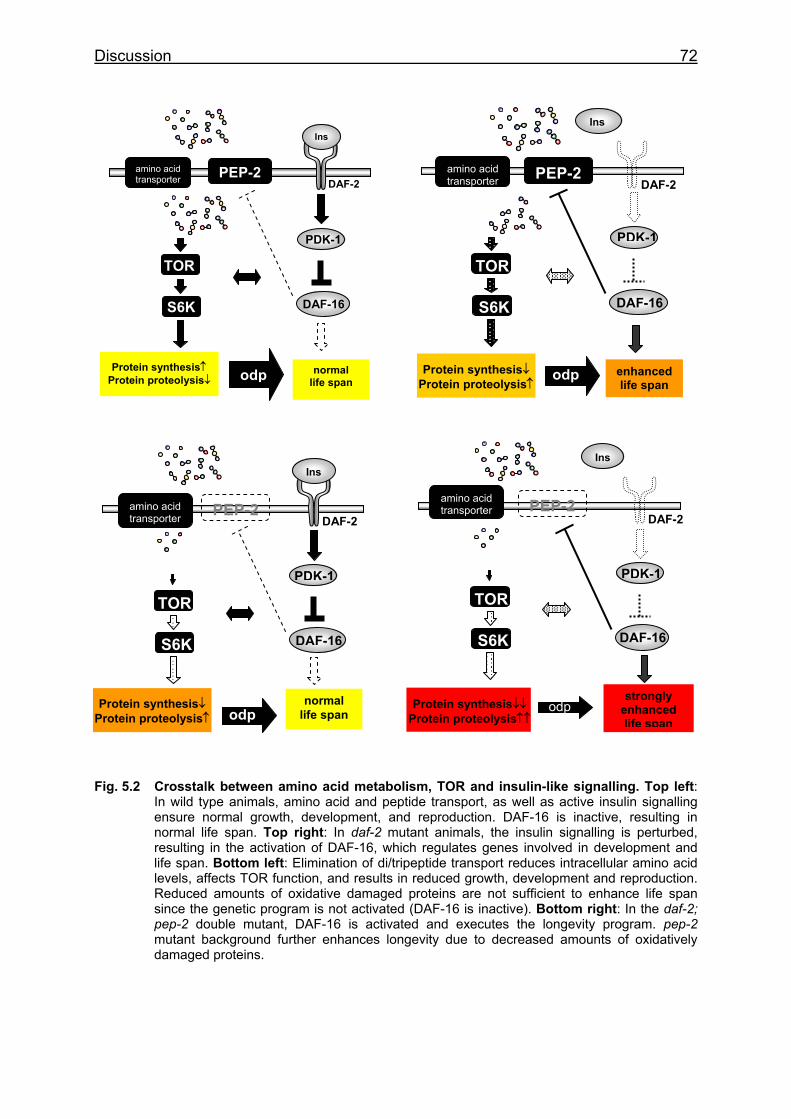
Discussion 72
Fig. 5.2 Crosstalk between amino acid metabolism, TOR and insulin-like signalling. Top left: In wild type animals, amino acid and peptide transport, as well as active insulin signalling ensure normal growth, development, and reproduction. DAF-16 is inactive, resulting in normal life span. Top right: In daf-2 mutant animals, the insulin signalling is perturbed, resulting in the activation of DAF-16, which regulates genes involved in development and life span. Bottom left: Elimination of di/tripeptide transport reduces intracellular amino acid levels, affects TOR function, and results in reduced growth, development and reproduction. Reduced amounts of oxidative damaged proteins are not sufficient to enhance life span since the genetic program is not activated (DAF-16 is inactive). Bottom right: In the daf-2; pep-2 double mutant, DAF-16 is activated and executes the longevity program. pep-2 mutant background further enhances longevity due to decreased amounts of oxidatively damaged proteins.
normal life span odp
PEP-2 amino acid transporter
Ins
DAF-2
PDK-1
DAF-16
TOR
S6K
Protein synthesis↑ Protein proteolysis↓
Protein synthesis↓ Protein proteolysis↑
PEP-2
Ins
DAF-2
PDK-1
DAF-16
amino acidtransporter
TOR
S6K
enhancedlife span
odp
normallife span
PEP-2 amino acid transporter
Ins
DAF-2
PDK-1
DAF-16
TOR
S6K
Protein synthesis↓ Protein proteolysis↑ odp
S6K
Protein synthesis↓↓ Protein proteolysis↑↑
odp strongly
enhanced life span
PEP-2
TOR
Ins
DAF-2
PDK-1
DAF-16
amino acidtransporter
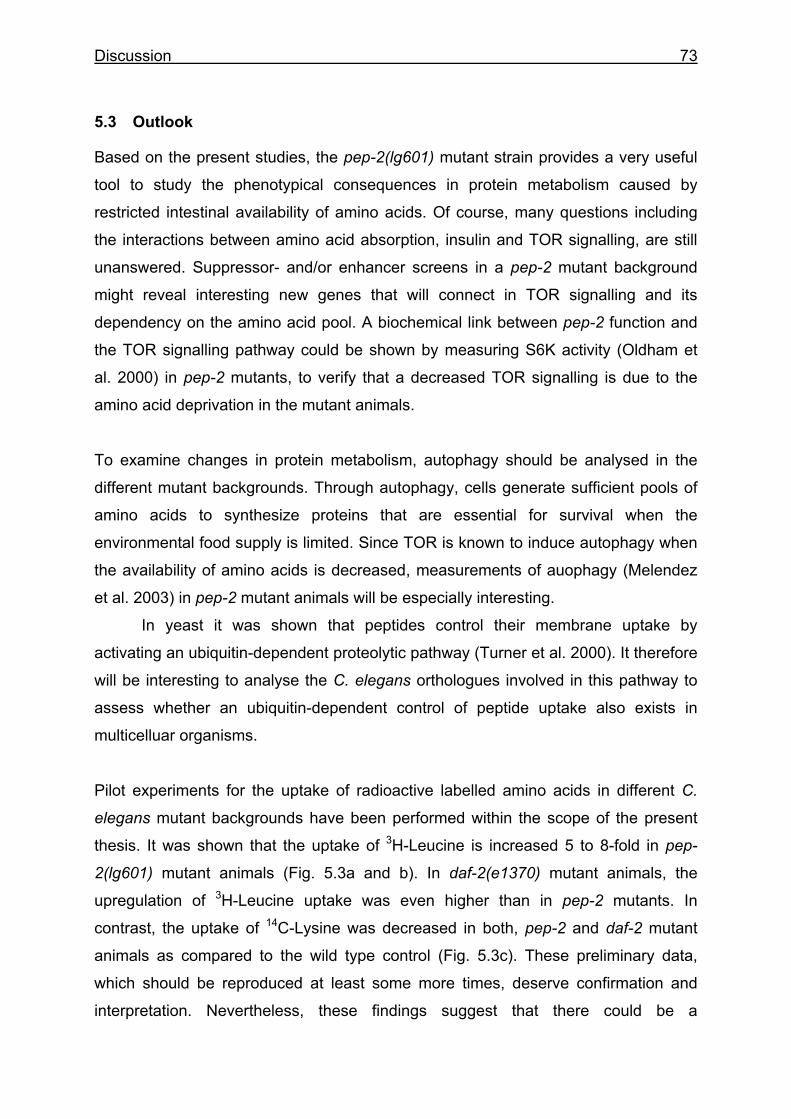
Discussion 73
5.3 Outlook
Based on the present studies, the pep-2(lg601) mutant strain provides a very useful
tool to study the phenotypical consequences in protein metabolism caused by
restricted intestinal availability of amino acids. Of course, many questions including
the interactions between amino acid absorption, insulin and TOR signalling, are still
unanswered. Suppressor- and/or enhancer screens in a pep-2 mutant background
might reveal interesting new genes that will connect in TOR signalling and its
dependency on the amino acid pool. A biochemical link between pep-2 function and
the TOR signalling pathway could be shown by measuring S6K activity (Oldham et
al. 2000) in pep-2 mutants, to verify that a decreased TOR signalling is due to the
amino acid deprivation in the mutant animals.
To examine changes in protein metabolism, autophagy should be analysed in the
different mutant backgrounds. Through autophagy, cells generate sufficient pools of
amino acids to synthesize proteins that are essential for survival when the
environmental food supply is limited. Since TOR is known to induce autophagy when
the availability of amino acids is decreased, measurements of auophagy (Melendez
et al. 2003) in pep-2 mutant animals will be especially interesting.
In yeast it was shown that peptides control their membrane uptake by
activating an ubiquitin-dependent proteolytic pathway (Turner et al. 2000). It therefore
will be interesting to analyse the C. elegans orthologues involved in this pathway to
assess whether an ubiquitin-dependent control of peptide uptake also exists in
multicelluar organisms.
Pilot experiments for the uptake of radioactive labelled amino acids in different C.
elegans mutant backgrounds have been performed within the scope of the present
thesis. It was shown that the uptake of 3H-Leucine is increased 5 to 8-fold in pep-
2(lg601) mutant animals (Fig. 5.3a and b). In daf-2(e1370) mutant animals, the
upregulation of 3H-Leucine uptake was even higher than in pep-2 mutants. In
contrast, the uptake of 14C-Lysine was decreased in both, pep-2 and daf-2 mutant
animals as compared to the wild type control (Fig. 5.3c). These preliminary data,
which should be reproduced at least some more times, deserve confirmation and
interpretation. Nevertheless, these findings suggest that there could be a
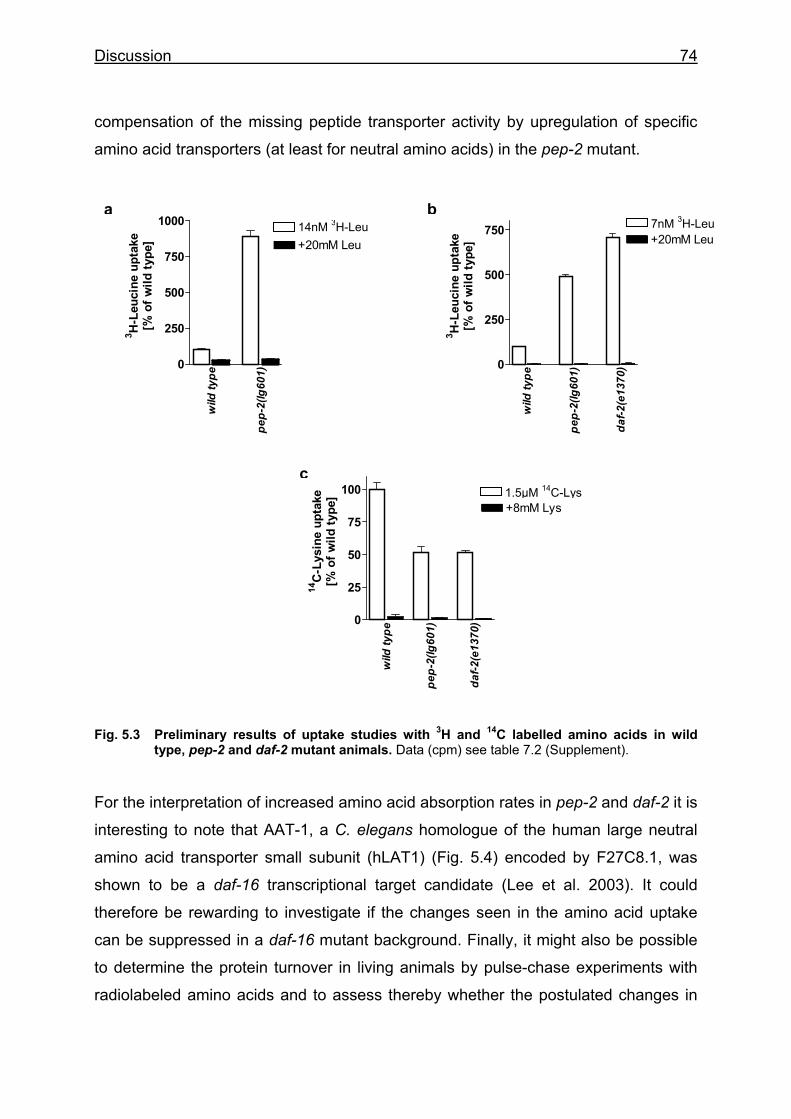
Discussion 74
compensation of the missing peptide transporter activity by upregulation of specific
amino acid transporters (at least for neutral amino acids) in the pep-2 mutant.
Fig. 5.3 Preliminary results of uptake studies with 3H and 14C labelled amino acids in wild type, pep-2 and daf-2 mutant animals. Data (cpm) see table 7.2 (Supplement).
For the interpretation of increased amino acid absorption rates in pep-2 and daf-2 it is
interesting to note that AAT-1, a C. elegans homologue of the human large neutral
amino acid transporter small subunit (hLAT1) (Fig. 5.4) encoded by F27C8.1, was
shown to be a daf-16 transcriptional target candidate (Lee et al. 2003). It could
therefore be rewarding to investigate if the changes seen in the amino acid uptake
can be suppressed in a daf-16 mutant background. Finally, it might also be possible
to determine the protein turnover in living animals by pulse-chase experiments with
radiolabeled amino acids and to assess thereby whether the postulated changes in
a b
c
wild
type
pep-
2(lg
601)
daf-2
(e13
70)0
25
50
75
100 0.1µCi+8mM Lys
14C
-Lys
ine
upta
ke[%
of w
ild ty
pe]
wild
type
pep-
2(lg
601)
0
250
500
750
10000.5 µCi+20mM Leu
3 H-L
euci
ne u
ptak
e[%
of w
ild ty
pe]
wild
type
pep-
2(lg
601)
daf-2
(e13
70)0
250
500
750 0.1µCi+20mM Leu
3 H-L
euci
ne u
ptak
e[%
of w
ild ty
pe]
14nM 3H-Leu 7nM 3H-Leu
1.5µM 14C-Lys
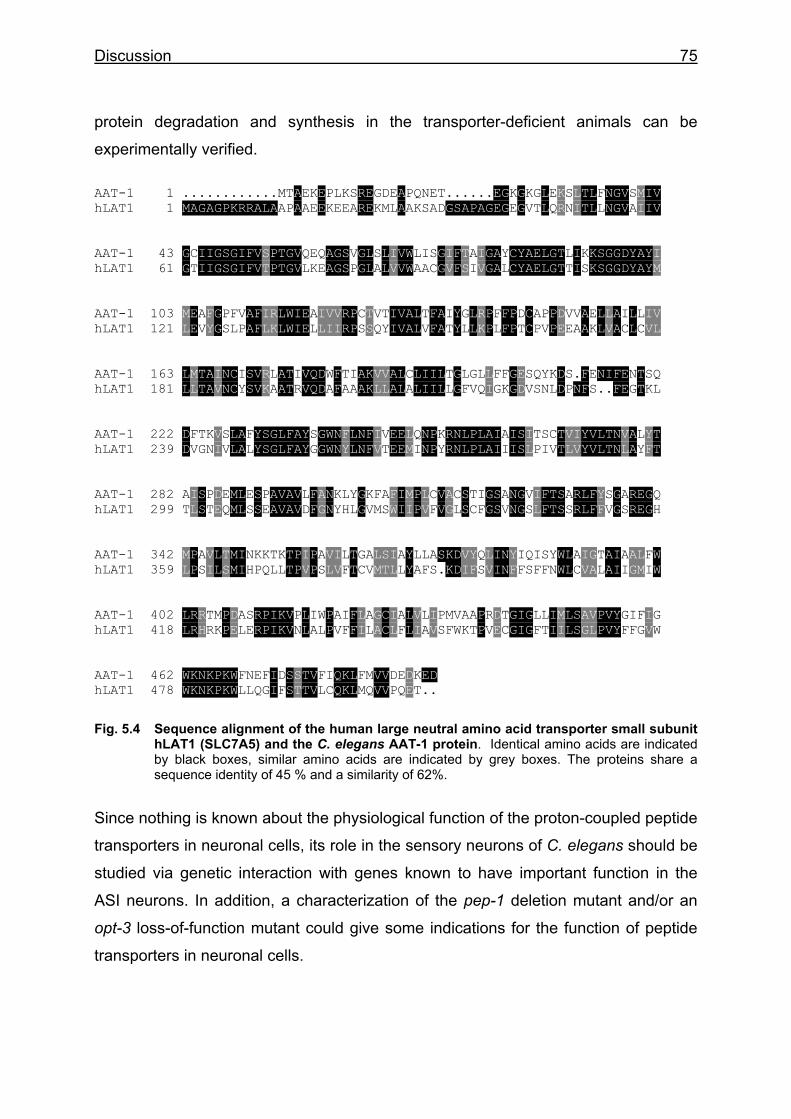
Discussion 75
protein degradation and synthesis in the transporter-deficient animals can be
experimentally verified. AAT-1 1 ............MTAEKEPLKSREGDEAPQNET......EGKGKGLEKSLTLFNGVSMIV hLAT1 1 MAGAGPKRRALAAPAAEEKEEAREKMLAAKSADGSAPAGEGEGVTLQRNITLLNGVAIIV AAT-1 43 GCIIGSGIFVSPTGVQEQAGSVGLSLIVWLISGIFTAIGAYCYAELGTLIKKSGGDYAYI hLAT1 61 GTIIGSGIFVTPTGVLKEAGSPGLALVVWAACGVFSIVGALCYAELGTTISKSGGDYAYM AAT-1 103 MEAFGPFVAFIRLWIEAIVVRPCTVTIVALTFAIYGLRPFFPDCAPPDVVAELLAILLIV hLAT1 121 LEVYGSLPAFLKLWIELLIIRPSSQYIVALVFATYLLKPLFPTCPVPEEAAKLVACLCVL AAT-1 163 LMTAINCISVRLATIVQDWFTIAKVVALCLIILTGLGLLFFGESQYKDS.FENIFENTSQ hLAT1 181 LLTAVNCYSVKAATRVQDAFAAAKLLALALIILLGFVQIGKGDVSNLDPNFS..FEGTKL AAT-1 222 DFTKVSLAFYSGLFAYSGWNFLNFIVEELQNPKRNLPLAIAISITSCTVIYVLTNVALYT hLAT1 239 DVGNIVLALYSGLFAYGGWNYLNFVTEEMINPYRNLPLAIIISLPIVTLVYVLTNLAYFT AAT-1 282 AISPDEMLESPAVAVLFANKLYGKFAFIMPLCVACSTIGSANGVIFTSARLFYSGAREGQ hLAT1 299 TLSTEQMLSSEAVAVDFGNYHLGVMSWIIPVFVGLSCFGSVNGSLFTSSRLFFVGSREGH AAT-1 342 MPAVLTMINKKTKTPIPAVILTGALSIAYLLASKDVYQLINYIQISYWLAIGTAIAALFW hLAT1 359 LPSILSMIHPQLLTPVPSLVFTCVMTLLYAFS.KDIFSVINFFSFFNWLCVALAIIGMIW AAT-1 402 LRRTMPDASRPIKVPLIWPAIFLAGCIALVLIPMVAAPRDTGIGLLIMLSAVPVYGIFIG hLAT1 418 LRHRKPELERPIKVNLALPVFFILACLFLIAVSFWKTPVECGIGFTIILSGLPVYFFGVW AAT-1 462 WKNKPKWFNEFIDSSTVFIQKLFMVVDEDKED hLAT1 478 WKNKPKWLLQGIFSTTVLCQKLMQVVPQET..
Fig. 5.4 Sequence alignment of the human large neutral amino acid transporter small subunit hLAT1 (SLC7A5) and the C. elegans AAT-1 protein. Identical amino acids are indicated by black boxes, similar amino acids are indicated by grey boxes. The proteins share a sequence identity of 45 % and a similarity of 62%.
Since nothing is known about the physiological function of the proton-coupled peptide
transporters in neuronal cells, its role in the sensory neurons of C. elegans should be
studied via genetic interaction with genes known to have important function in the
ASI neurons. In addition, a characterization of the pep-1 deletion mutant and/or an
opt-3 loss-of-function mutant could give some indications for the function of peptide
transporters in neuronal cells.
Summary 76
6 Summary
The mammalian intestinal peptide transporter PEPT1 mediates the uptake of di- and
tripeptides from the gut lumen into intestinal epithelial cells and acts in parallel to
amino acid transporters. In this work, C. elegans was used to study the physiological
role of the intestinal peptide transporter for overall amino acid absorption in the gut
and for the delivery of protein nutrition in vivo. By expression pattern analysis it was
shown that pep-2, the functional homologue of hPEPT1, is expressed in the intestinal
cells and a pair of sensory neurons in the head of the animal. To study the
physiological function and importance of the PEP-2 transporter in vivo, a C. elegans
pep-2 deletion mutant was constructed. Uptake studies with a fluorescent labelled
model substrate have shown that the pep-2(lg601) mutant animals are incapable of
taking up intact peptides from the gut lumen. This lack of intestinal peptide transport
may result in a reduced availability of amino acids, which affects the TOR signalling
pathway regulating protein synthesis. Indeed, the pep-2 mutant phenotype
characterized in this work is reminiscent of the phenotype observed in other
organisms after mutating components of the TOR pathway. The consequences are
severely retarded development, reduced body size and markedly decreased
production of progeny in the pep-2(lg601) mutant animals. In addition it was shown
that PEP-2 function directly affects the TOR signalling pathway, because the weak
let-363/TOR (RNAi) phenotype in C. elegans was enhanced significantly in the pep-
2(lg601) mutant background.
The developmental defects in pep-2(-) animals are not dependent on a
functional DAF-16 forkhead transcription factor, the main downstream target of the
DAF-2/insulin like signalling pathway. However, a crosstalk between both pathways
was shown by a pronounced increase in adult life span of daf-2(-); pep-2(-) double
mutants in the absence of an ageing phenotype in the pep-2 single mutant. This
suggests a link between the availability of dietary amino acids and the insulin/IGF
signalling pathway in C. elegans and provides direct evidence for a predominant role
of the intestinal peptide transporter not only in the delivery of amino acids for growth
and development but also for signalling pathways that regulate metabolism and
ageing.

Zusammenfassung 77
7 Zusammenfassung
Der intestinale Peptidtransporter PEPT1 vermittelt die Aufnahme von Di- und
Tripeptiden sowie Peptidomimetika über die apikale Membran der Darmepithelzellen
in Säugetieren. Dieser Transport ist H+-gekoppelt, sekundär aktiv und operiert
parallel zu einer großen Anzahl von Aminosäuretransport-Systemen. Um die
Bedeutung von PEPT1 für die Proteinversorgung eines Organismus und damit für
Wachstum und Entwicklung in vivo zu bestimmen, wurde die Funktion des
homologen Proteins PEP-2 in C. elegans untersucht. Mittels pep-2 promotor-
gesteuerter Reporterkonstrukte wurde gezeigt, dass pep-2 in den Darmzellen und
einem Paar sensorischer Neuronen im Kopf des Tieres exprimiert wird.
Um die physiologische Bedeutung des Transporters in vivo zu untersuchen, wurde
ein Mutantenstamm mit einem Defekt im pep-2 Genlocus generiert. Transportstudien
mit einem fluoreszenzmarkierten Modellsubstrat konnten zeigen, dass die pep-2
Mutante keine Dipeptide resorbieren kann. Dies könnte zu einer verringerten
Verfügbarkeit von Aminosäuren im Organismus und somit zu einer veränderten
Regulation der Proteinsynthese durch den TOR-Signaltransduktionsweg führen. Der
Phänotyp der pep-2 Mutante ist charakterisiert durch eine stark verzögerte
postembryonale Entwicklungsphase, eine reduzierte Körperlänge und eine drastisch
verminderte Nachkommenzahl, ähnlich der Phänotypen anderer Organismen mit
Defekten im TOR Signalweg. Außerdem konnte gezeigt werden, dass die Funktion
von PEP-2 einen direkten Einfluss auf den TOR Signalweg hat, da der sehr
schwache Phänotyp einer TOR(RNAi) Mutante in C. elegans im pep-2-mutierten
Hintergrund signifikant verstärkt wurde. Die Entwicklungsstörungen in der pep-2
Mutante erwiesen sich als unabhängig von DAF-16, einem Transkriptionsfaktor der
als zentrales Zielprotein des DAF-2/Insulin-/IGF-ähnlichen Signalwegs in C. elegans
identifiziert wurde. Dennoch konnte mittels Experimenten zur Lebensdauer eine
gegenseitige Beeinflussung beider Signalwege aufgezeigt werden. Die Mutation im
pep-2 Genlocus, welche per se keinen Effekt auf die Lebensdauer verursacht, führte
in der daf-2; pep-2 Doppelmutante zu einer signifikanten Verstärkung des daf-2
Phänotyps.

Zusammenfassung 78
Somit konnte belegt werden, dass der intestinale Peptidtansporter eine sehr wichtige
Rolle bei der Bereitstellung von Aminosäuren für Wachstum und Entwicklung spielt.
Weiterhin weisen die Befunde auf eine enge Verbindung des
Aminosäurestoffwechsels mit dem Insulin-/IGF Signalweg und Alterungsprozessen
hin.
Supplement 79
8 Supplement 8.1 Crossing strategies
BR2513: dpy-5(e61) daf-16(m26) unc-75(e950)I ;pep-2(lg601)X dpy-5(e61) daf-16(m26) unc-75(e950) I hermaphrodites were crossed with pep-2(lg601) males. The F2 generation was scored for Dpy, Unc and slow growing (the pep-2 phenotype). The mutation in pep-2 was additionally verified by PCR. The resulting strain dpy-5(e61) daf-16(m26) unc-75(e950)I ;pep-2(lg601)X was used for the generation of BR2689. BR2751: dpy-1(e1)III; pep-2(lg601)X dpy-1(e1)III hermaphrodites were crossed with pep-2(lg601)X males. The F2 generation was scored for Dpy and slow growing. The resulting strain dpy-1(e1)III; pep-2(lg601)X was used for the generation of BR2688. BR2688: daf-2(e1370)III; pep-2(lg601)X BR2751 hermaphrodites were crossed with daf-2(e1370)III males. The F2 generation was scored for non-Dpy, Daf-c and slow growing. BR2689: daf-16(m26)I; pep-2(lg601)X BR2513 hermaphrodites were crossed with daf-16(m26)I males. The F2 generation was scored for non-Dpy, non-Unc and slow growing. BR3061: daf-16(m26)I; daf-2(e1370)III; pep-2(lg601)X dpy-5(e61) unc-55(e1170)I; daf-2(e1370)III; pep-2(lg601)X was generated by crossing BR1472 (dpy-5(e61) unc-55(e1170)I) hermaphrodites with daf-2(e1370)III; pep-2(lg601)X males. dpy-5(e61) unc-55(e1170)I; daf-2(e1370)III; pep-2(lg601)X hermaphrodites were then crossed with daf-16(m26)I; daf-2(e1370)III males. The F2 generation was scored for non-Dpy, non-Unc and slow growing for pep-2. The mutation in pep-2 was additionally verified by PCR. BR2746: bIs1[vit-2::gfp,pRF4,sqt-1(sc103)]; pep-2(lg601) bIs1[vit-2::gfp,pRF4,sqt-1(sc103)] hermaphrodites were crossed with pep-2(lg601)X males. The F2 generation was scored for slow-growing rollers (phenotype of the marker pRF4). BR3059: dbl-1(nk3)V; pep-2(lg601)X dbl-1(nk3) hermaphrodites were crossed with pep-2(lg601) males. The F2 generation was scored for slow-growing small, somewhat dumpy animals. The pep-2 deletion was confirmed by SW-PCR. BR3060: ctIs40[dbl-1(+);sur-5::gfp]; pep-2(lg601)X ctIs40[dbl-1(+);sur-5::gfp] hermaphrodites were crossed wit pep-2(lg601) males. The F2 generation was scored for long, slow growing animals and the sur-5::gfp marker. The pep-2 deletion was confirmed by SW-PCR.
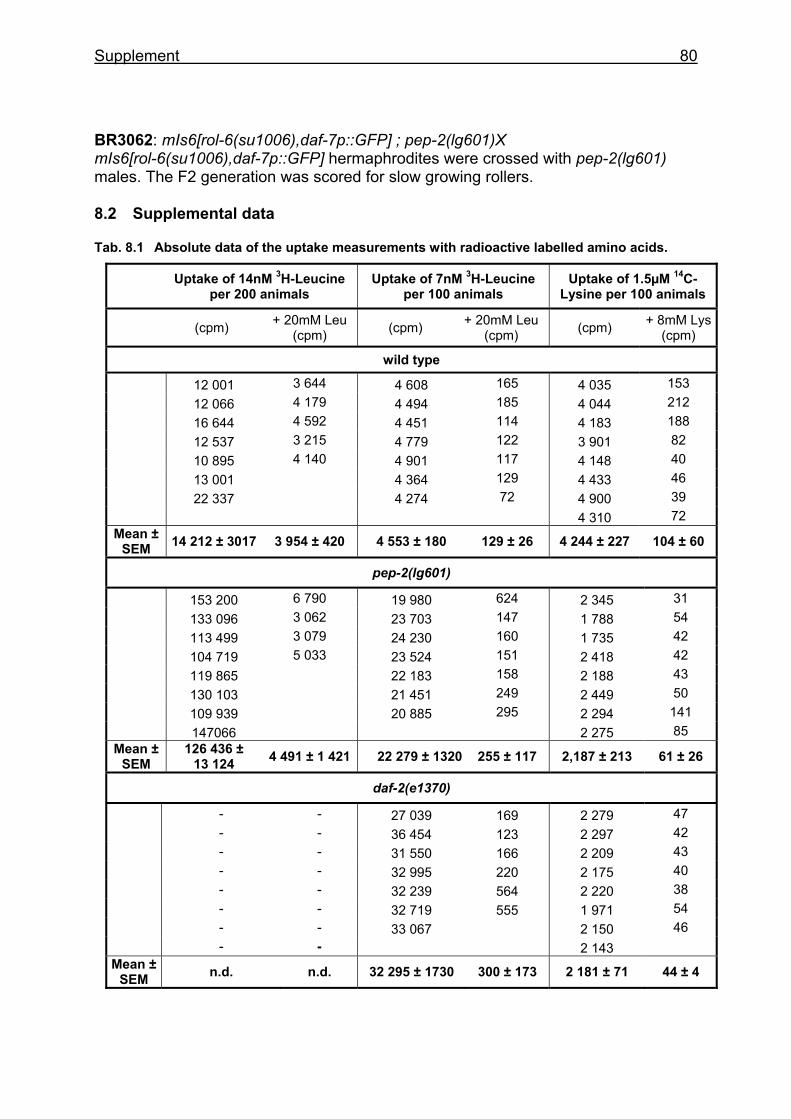
Supplement 80
BR3062: mIs6[rol-6(su1006),daf-7p::GFP] ; pep-2(lg601)X mIs6[rol-6(su1006),daf-7p::GFP] hermaphrodites were crossed with pep-2(lg601) males. The F2 generation was scored for slow growing rollers. 8.2 Supplemental data
Tab. 8.1 Absolute data of the uptake measurements with radioactive labelled amino acids.
Uptake of 14nM 3H-Leucine
per 200 animals Uptake of 7nM 3H-Leucine
per 100 animals Uptake of 1.5µM 14C-
Lysine per 100 animals
(cpm) + 20mM Leu
(cpm) (cpm) + 20mM Leu (cpm) (cpm) + 8mM Lys
(cpm)
wild type
12 001 3 644 4 608 165 4 035 153 12 066 4 179 4 494 185 4 044 212 16 644 4 592 4 451 114 4 183 188 12 537 3 215 4 779 122 3 901 82 10 895 4 140 4 901 117 4 148 40 13 001 4 364 129 4 433 46 22 337 4 274 72 4 900 39 4 310 72 Mean ±
SEM 14 212 ± 3017 3 954 ± 420 4 553 ± 180 129 ± 26 4 244 ± 227 104 ± 60
pep-2(lg601)
153 200 6 790 19 980 624 2 345 31 133 096 3 062 23 703 147 1 788 54 113 499 3 079 24 230 160 1 735 42 104 719 5 033 23 524 151 2 418 42 119 865 22 183 158 2 188 43 130 103 21 451 249 2 449 50 109 939 20 885 295 2 294 141 147066 2 275 85 Mean ±
SEM 126 436 ±
13 124 4 491 ± 1 421 22 279 ± 1320 255 ± 117 2,187 ± 213 61 ± 26
daf-2(e1370)
- - 27 039 169 2 279 47 - - 36 454 123 2 297 42 - - 31 550 166 2 209 43 - - 32 995 220 2 175 40 - - 32 239 564 2 220 38 - - 32 719 555 1 971 54 - - 33 067 2 150 46 - - 2 143 Mean ±
SEM n.d. n.d. 32 295 ± 1730 300 ± 173 2 181 ± 71 44 ± 4
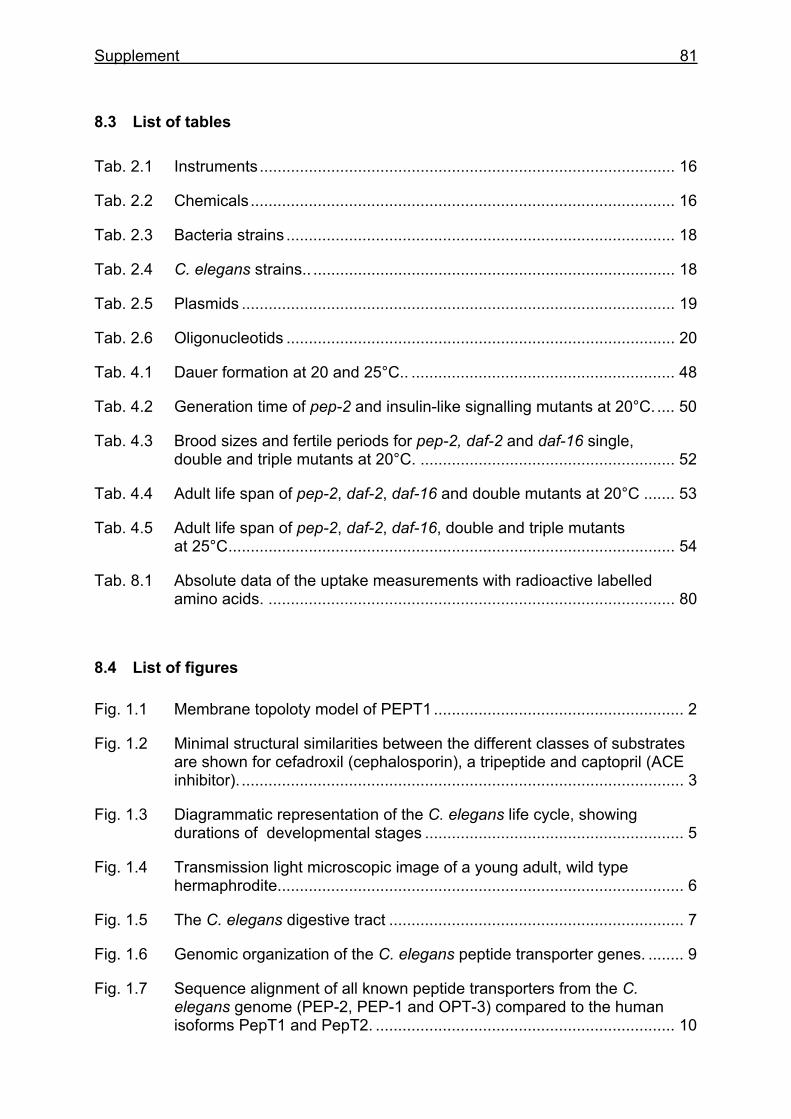
Supplement 81
8.3 List of tables
Tab. 2.1 Instruments............................................................................................. 16
Tab. 2.2 Chemicals............................................................................................... 16
Tab. 2.3 Bacteria strains ....................................................................................... 18
Tab. 2.4 C. elegans strains.. ................................................................................. 18
Tab. 2.5 Plasmids ................................................................................................. 19
Tab. 2.6 Oligonucleotids ....................................................................................... 20
Tab. 4.1 Dauer formation at 20 and 25°C.. ........................................................... 48
Tab. 4.2 Generation time of pep-2 and insulin-like signalling mutants at 20°C. .... 50
Tab. 4.3 Brood sizes and fertile periods for pep-2, daf-2 and daf-16 single, double and triple mutants at 20°C. ......................................................... 52
Tab. 4.4 Adult life span of pep-2, daf-2, daf-16 and double mutants at 20°C ....... 53
Tab. 4.5 Adult life span of pep-2, daf-2, daf-16, double and triple mutants at 25°C.................................................................................................... 54
Tab. 8.1 Absolute data of the uptake measurements with radioactive labelled amino acids. ........................................................................................... 80
8.4 List of figures
Fig. 1.1 Membrane topoloty model of PEPT1 ........................................................ 2
Fig. 1.2 Minimal structural similarities between the different classes of substrates are shown for cefadroxil (cephalosporin), a tripeptide and captopril (ACE inhibitor). ................................................................................................... 3
Fig. 1.3 Diagrammatic representation of the C. elegans life cycle, showing durations of developmental stages .......................................................... 5
Fig. 1.4 Transmission light microscopic image of a young adult, wild type hermaphrodite........................................................................................... 6
Fig. 1.5 The C. elegans digestive tract .................................................................. 7
Fig. 1.6 Genomic organization of the C. elegans peptide transporter genes. ........ 9
Fig. 1.7 Sequence alignment of all known peptide transporters from the C. elegans genome (PEP-2, PEP-1 and OPT-3) compared to the human isoforms PepT1 and PepT2. ................................................................... 10
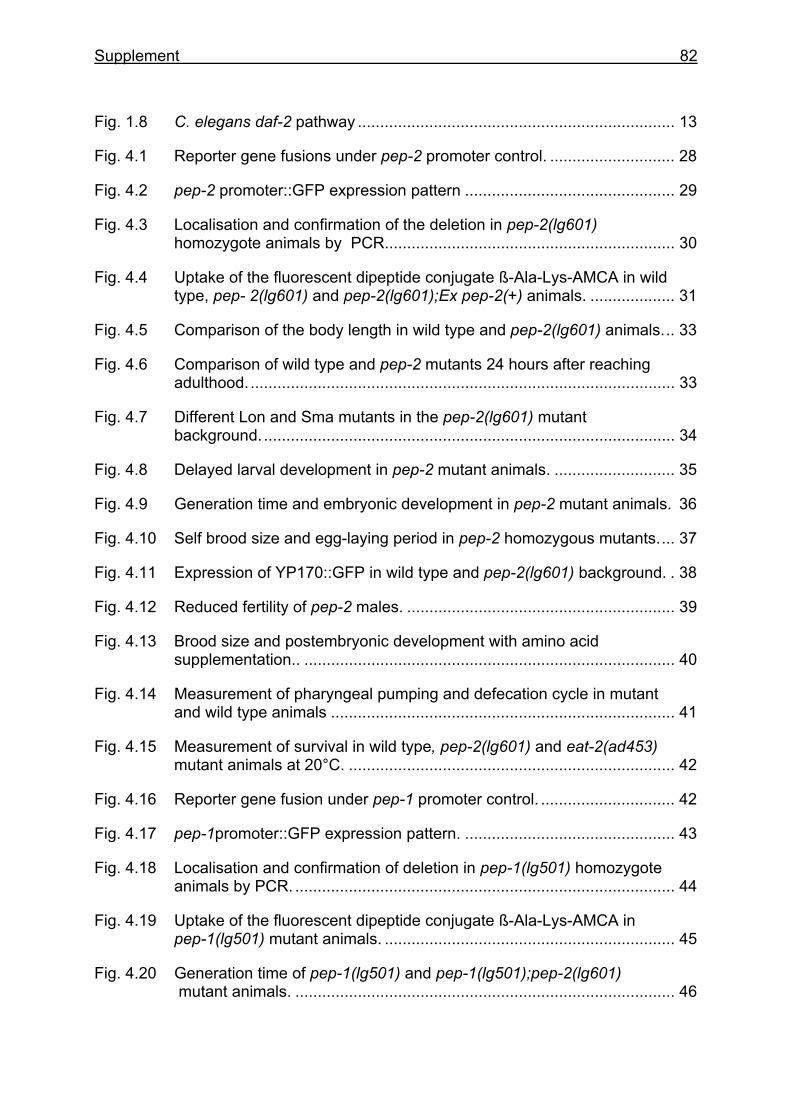
Supplement 82
Fig. 1.8 C. elegans daf-2 pathway ....................................................................... 13
Fig. 4.1 Reporter gene fusions under pep-2 promoter control. ............................ 28
Fig. 4.2 pep-2 promoter::GFP expression pattern ............................................... 29
Fig. 4.3 Localisation and confirmation of the deletion in pep-2(lg601) homozygote animals by PCR................................................................. 30
Fig. 4.4 Uptake of the fluorescent dipeptide conjugate ß-Ala-Lys-AMCA in wild type, pep- 2(lg601) and pep-2(lg601);Ex pep-2(+) animals. ................... 31
Fig. 4.5 Comparison of the body length in wild type and pep-2(lg601) animals... 33
Fig. 4.6 Comparison of wild type and pep-2 mutants 24 hours after reaching adulthood................................................................................................ 33
Fig. 4.7 Different Lon and Sma mutants in the pep-2(lg601) mutant background. ............................................................................................ 34
Fig. 4.8 Delayed larval development in pep-2 mutant animals. ........................... 35
Fig. 4.9 Generation time and embryonic development in pep-2 mutant animals. 36
Fig. 4.10 Self brood size and egg-laying period in pep-2 homozygous mutants.... 37
Fig. 4.11 Expression of YP170::GFP in wild type and pep-2(lg601) background. . 38
Fig. 4.12 Reduced fertility of pep-2 males. ............................................................ 39
Fig. 4.13 Brood size and postembryonic development with amino acid supplementation.. ................................................................................... 40
Fig. 4.14 Measurement of pharyngeal pumping and defecation cycle in mutant and wild type animals ............................................................................. 41
Fig. 4.15 Measurement of survival in wild type, pep-2(lg601) and eat-2(ad453) mutant animals at 20°C. ......................................................................... 42
Fig. 4.16 Reporter gene fusion under pep-1 promoter control. .............................. 42
Fig. 4.17 pep-1promoter::GFP expression pattern. ............................................... 43
Fig. 4.18 Localisation and confirmation of deletion in pep-1(lg501) homozygote animals by PCR. ..................................................................................... 44
Fig. 4.19 Uptake of the fluorescent dipeptide conjugate ß-Ala-Lys-AMCA in pep-1(lg501) mutant animals. ................................................................. 45
Fig. 4.20 Generation time of pep-1(lg501) and pep-1(lg501);pep-2(lg601) mutant animals. ..................................................................................... 46
Supplement 83
Fig. 4.21 Measurement of brood size in pep-1(lg501) homozygote mutant animals ....................................................................................... 46
Fig. 4.22 daf-7 TGF-β expression in wild type and pep-2(lg601) mutant background. ............................................................................................ 47
Fig. 4.23 Generation time of pep-2, daf-2 and daf-16 single, double and triple mutants at 20°C. ..................................................................................... 49
Fig. 4.24 Brood size of pep-2, daf-2, daf-16 and corresponding double and triple mutant strains. ....................................................................................... 51
Fig. 4.25 Survival curves for pep-2, daf-2, daf-16 and double mutant adults at 20°C.................................................................................................... 53
Fig. 4.26 Survival curves for pep-2, daf-2, daf-16, double and triple mutant adults at 25°C. ........................................................................................ 54
Fig. 4.27 Thermotolerance of different mutant animals. ....................................... 55
Fig. 4.28 Accumulation of oxidative damaged proteins in wild type, pep-2, daf-2 and daf-2; pep- 2 mutant animals. ................................................. 56
Fig. 4.29 pep-2 and let-363/TOR interact to cause developmental arrest. ............ 58
Fig. 4.30 pep-2 and let-363/TOR interact to reduce fertility. .................................. 59
Fig. 4.31 Intestinal phenotype in pep-2, let-363/TOR and the double mutant animals. .................................................................................................. 61
Fig. 5.1 Model for additive and synergistic effects of the pep-2(lg601) and daf-2(e1370) mutant phenotypes........................................................... 67
Fig. 5.2 Crosstalk between amino acid metabolim, TOR and insulin-like signalling................................................................................................. 72
Fig. 5.3 Preliminary results of uptake studies with 3H and 14C labelled amino acids in wild type, pep-2 and daf-2 mutant animals ............................... 74
Fig. 5.4 Sequence alignment of the human large neutral amino acid transporter small subunit hLAT1 (SLC7A5) and the C. elegans AAT-1 protein........ 75
Supplement 84
8.5 Abbreviations
°C degree celcius µg microgram µl microlitre µM micromolar ACE angiotensin-converting-enzyme Acetyl-coA Acetyl-coenzymA Age ageing abnormal (C. elegans mutant phenotype) C. elegans Caenorhabditis elegans cDNA complementary deoxyribonucleic acid CNS central nervous system Daf abnormal dauer formation (C. elegans mutant phenotype) DNA deoxyribonucleic acid DNPH dinitrophenylhydrazine Dpy dumpy ( C. elegans mutant phenotype, shorter than wild type) Eat eating abnormal (C. elegans mutant phenotype) EDTA ethylenediaminetetraacetic acid GFP green fluorescence protein IGF insulin-like growth factor kb kilobase L(1-4) C. elegans larval stages (1-4) lacZ β-galactosidase Lon long (C. elegans mutant phenotype) ml millilitre mM millimolar mRNA messenger ribonucleic acid NGM nematode growth media NHE3 sodium/hydrogen exchanger OP50 Escherichia coli strain, food source for C. elegans PCR polymerase chain reaction PDK phosphtidylinositol-dependent kinase PEP peptidetransporter ( protein in C. elegans) PEPT peptidetransporter (protein in mammals)
Supplement 85
PI3K phosphoinositide 3-kinase PNS peripheral nervous system POT proton-coupled oligopeptide transporter RNA ribonucleic acid RNAi RNA interference rpm revolutions per minute RT-PCR reverse transcriptase polymerase chain reaction Sma small (C. elegans mutant phenotype) SOD super oxide dismutase TCA tricarboxylic acid cycle TMD transmembrane domain TOR target of rapamycin β-Ala-Lys-AMCA β-Alanin-Lysine-N(epsilon)-7-amino-4-methylcoumarin-3-acetic acid.
References 86
9 References Adachi H., Fujiwara Y. and Ishii N. (1998) Effects of oxygen on protein carbonyl and aging in Caenorhabditis elegans mutants with long (age-1) and short (mev-1) life spans. J.Gerontol: Biological Sciences 53A, B240-B244.
Addison J. M., Burston D. and Matthews D. M. (1972) Evidence for active transport of the dipeptide glycylsarcosine by hamster jejunum in vitro. Clin Sci 43, 907-911.
Adibi S. A. (1968) Influence of dietary deprivations on plasma concentration of free amino acids of man. J Appl Physiol 25, 52-57.
Adibi S. A. (1997) The oligopeptide transporter (Pept-1) in human intestine: biology and function. Gastroenterology 113, 332-340.
Avery L. (1993) The genetics of feeding in Caenorhabditis elegans. Genetics 133, 897-917.
Avery L. and Thomas J. H. (1997) Feeding and Defecation, in C. elegans II, Vol. Monograph 33, pp 680-681. Cold Spring Harbor Laboratory Press, New York.
Avruch J., Belham C., Weng Q., Hara K. and Yonezawa K. (2001) The p70 S6 kinase integrates nutrient and growth signals to control translational capacity. Prog Mol Subcell Biol 26, 115-154.
Balimane P. V., Tamai I., Guo A., Nakanishi T., Kitada H., Leibach F. H., Tsuji A. and Sinko P. J. (1998) Direct evidence for peptide transporter (PepT1)-mediated uptake of a nonpeptide prodrug, valacyclovir. Biochem Biophys Res Commun 250, 246-251.
Bargmann C. I. and Horvitz H. R. (1991) Control of larval development by chemosensory neurons in Caenorhabditis elegans. Science 251, 1243-1246.
Berger U. V. and Hediger M. A. (1999) Distribution of peptide transporter PEPT2 mRNA in the rat nervous system. Anat Embryol (Berl) 199, 439-449.
Bluher M., Kahn B. B. and Kahn C. R. (2003) Extended longevity in mice lacking the insulin receptor in adipose tissue. Science 299, 572-574.
Boll M., Markovich D., Weber W. M., Korte H., Daniel H. and Murer H. (1994) Expression cloning of a cDNA from rabbit small intestine related to proton-coupled transport of peptides, beta-lactam antibiotics and ACE- inhibitors. Pflugers Arch. 429, 146-149.
Boll M., Herget M., Wagener M., Weber W. M., Markovich D., Biber J., Clauss W., Murer H. and Daniel H. (1996) Expression cloning and functional characterization of the kidney cortex high-affinity proton-coupled peptide transporter. Proc Natl Acad Sci U S A 93, 284-289.
Brenner S. (1974) The genetics of Caenorhabditis elegans. Genetics 77, 71-94.
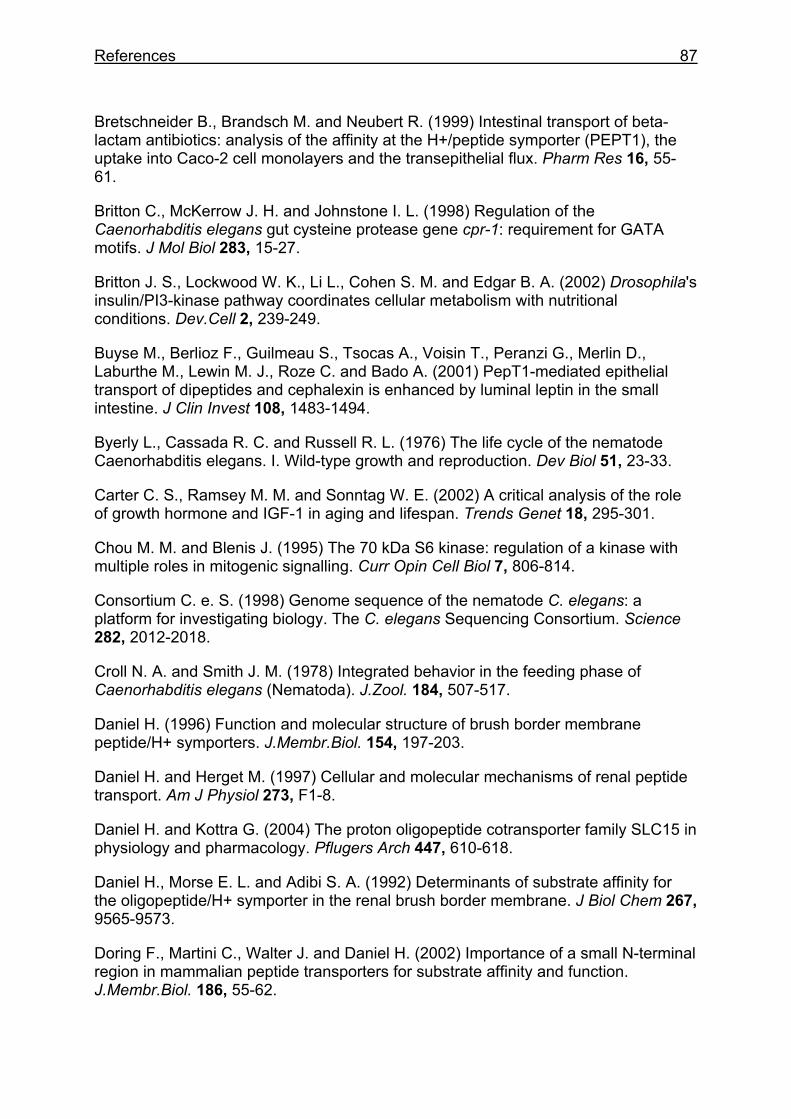
References 87
Bretschneider B., Brandsch M. and Neubert R. (1999) Intestinal transport of beta-lactam antibiotics: analysis of the affinity at the H+/peptide symporter (PEPT1), the uptake into Caco-2 cell monolayers and the transepithelial flux. Pharm Res 16, 55-61.
Britton C., McKerrow J. H. and Johnstone I. L. (1998) Regulation of the Caenorhabditis elegans gut cysteine protease gene cpr-1: requirement for GATA motifs. J Mol Biol 283, 15-27.
Britton J. S., Lockwood W. K., Li L., Cohen S. M. and Edgar B. A. (2002) Drosophila's insulin/PI3-kinase pathway coordinates cellular metabolism with nutritional conditions. Dev.Cell 2, 239-249.
Buyse M., Berlioz F., Guilmeau S., Tsocas A., Voisin T., Peranzi G., Merlin D., Laburthe M., Lewin M. J., Roze C. and Bado A. (2001) PepT1-mediated epithelial transport of dipeptides and cephalexin is enhanced by luminal leptin in the small intestine. J Clin Invest 108, 1483-1494.
Byerly L., Cassada R. C. and Russell R. L. (1976) The life cycle of the nematode Caenorhabditis elegans. I. Wild-type growth and reproduction. Dev Biol 51, 23-33.
Carter C. S., Ramsey M. M. and Sonntag W. E. (2002) A critical analysis of the role of growth hormone and IGF-1 in aging and lifespan. Trends Genet 18, 295-301.
Chou M. M. and Blenis J. (1995) The 70 kDa S6 kinase: regulation of a kinase with multiple roles in mitogenic signalling. Curr Opin Cell Biol 7, 806-814.
Consortium C. e. S. (1998) Genome sequence of the nematode C. elegans: a platform for investigating biology. The C. elegans Sequencing Consortium. Science 282, 2012-2018.
Croll N. A. and Smith J. M. (1978) Integrated behavior in the feeding phase of Caenorhabditis elegans (Nematoda). J.Zool. 184, 507-517.
Daniel H. (1996) Function and molecular structure of brush border membrane peptide/H+ symporters. J.Membr.Biol. 154, 197-203.
Daniel H. and Herget M. (1997) Cellular and molecular mechanisms of renal peptide transport. Am J Physiol 273, F1-8.
Daniel H. and Kottra G. (2004) The proton oligopeptide cotransporter family SLC15 in physiology and pharmacology. Pflugers Arch 447, 610-618.
Daniel H., Morse E. L. and Adibi S. A. (1992) Determinants of substrate affinity for the oligopeptide/H+ symporter in the renal brush border membrane. J Biol Chem 267, 9565-9573.
Doring F., Martini C., Walter J. and Daniel H. (2002) Importance of a small N-terminal region in mammalian peptide transporters for substrate affinity and function. J.Membr.Biol. 186, 55-62.
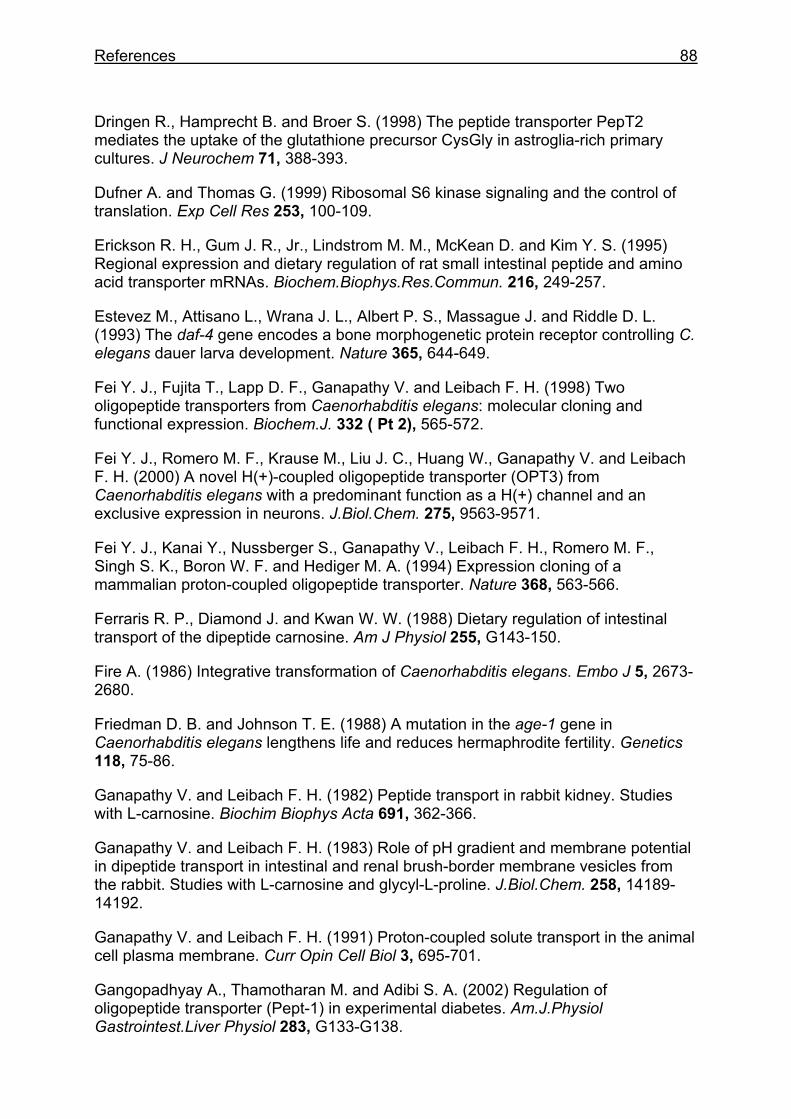
References 88
Dringen R., Hamprecht B. and Broer S. (1998) The peptide transporter PepT2 mediates the uptake of the glutathione precursor CysGly in astroglia-rich primary cultures. J Neurochem 71, 388-393.
Dufner A. and Thomas G. (1999) Ribosomal S6 kinase signaling and the control of translation. Exp Cell Res 253, 100-109.
Erickson R. H., Gum J. R., Jr., Lindstrom M. M., McKean D. and Kim Y. S. (1995) Regional expression and dietary regulation of rat small intestinal peptide and amino acid transporter mRNAs. Biochem.Biophys.Res.Commun. 216, 249-257.
Estevez M., Attisano L., Wrana J. L., Albert P. S., Massague J. and Riddle D. L. (1993) The daf-4 gene encodes a bone morphogenetic protein receptor controlling C. elegans dauer larva development. Nature 365, 644-649.
Fei Y. J., Fujita T., Lapp D. F., Ganapathy V. and Leibach F. H. (1998) Two oligopeptide transporters from Caenorhabditis elegans: molecular cloning and functional expression. Biochem.J. 332 ( Pt 2), 565-572.
Fei Y. J., Romero M. F., Krause M., Liu J. C., Huang W., Ganapathy V. and Leibach F. H. (2000) A novel H(+)-coupled oligopeptide transporter (OPT3) from Caenorhabditis elegans with a predominant function as a H(+) channel and an exclusive expression in neurons. J.Biol.Chem. 275, 9563-9571.
Fei Y. J., Kanai Y., Nussberger S., Ganapathy V., Leibach F. H., Romero M. F., Singh S. K., Boron W. F. and Hediger M. A. (1994) Expression cloning of a mammalian proton-coupled oligopeptide transporter. Nature 368, 563-566.
Ferraris R. P., Diamond J. and Kwan W. W. (1988) Dietary regulation of intestinal transport of the dipeptide carnosine. Am J Physiol 255, G143-150.
Fire A. (1986) Integrative transformation of Caenorhabditis elegans. Embo J 5, 2673-2680.
Friedman D. B. and Johnson T. E. (1988) A mutation in the age-1 gene in Caenorhabditis elegans lengthens life and reduces hermaphrodite fertility. Genetics 118, 75-86.
Ganapathy V. and Leibach F. H. (1982) Peptide transport in rabbit kidney. Studies with L-carnosine. Biochim Biophys Acta 691, 362-366.
Ganapathy V. and Leibach F. H. (1983) Role of pH gradient and membrane potential in dipeptide transport in intestinal and renal brush-border membrane vesicles from the rabbit. Studies with L-carnosine and glycyl-L-proline. J.Biol.Chem. 258, 14189-14192.
Ganapathy V. and Leibach F. H. (1991) Proton-coupled solute transport in the animal cell plasma membrane. Curr Opin Cell Biol 3, 695-701.
Gangopadhyay A., Thamotharan M. and Adibi S. A. (2002) Regulation of oligopeptide transporter (Pept-1) in experimental diabetes. Am.J.Physiol Gastrointest.Liver Physiol 283, G133-G138.
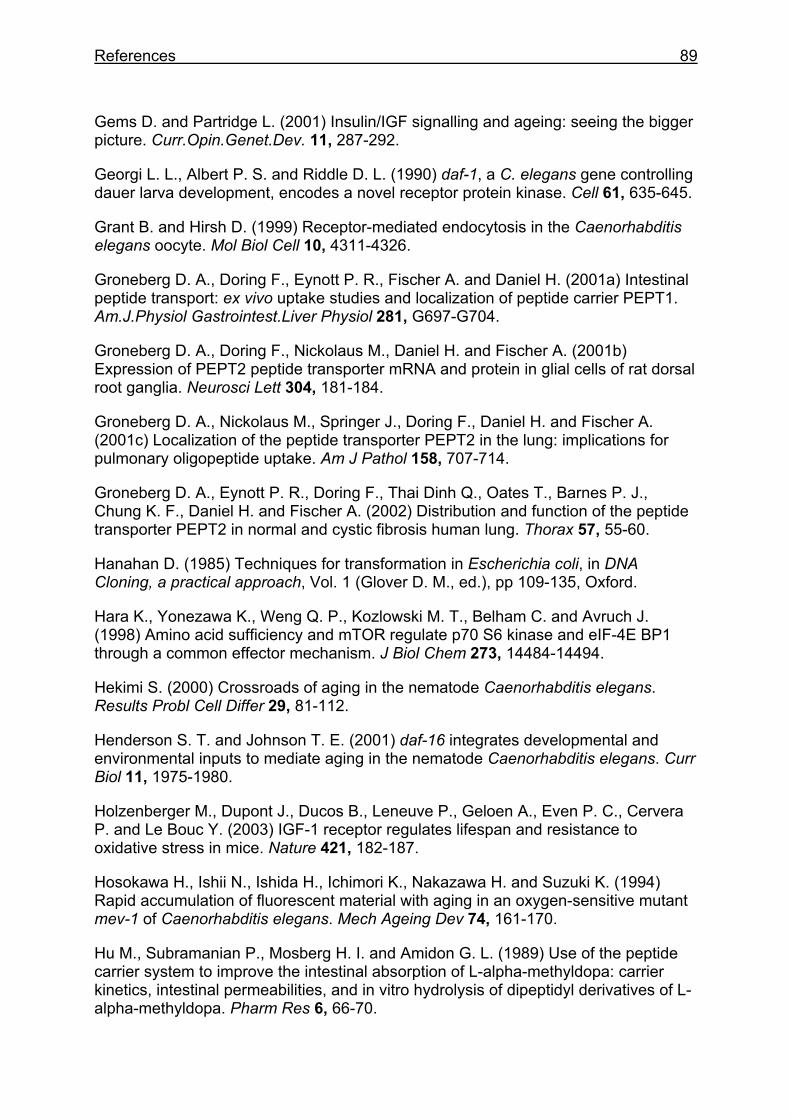
References 89
Gems D. and Partridge L. (2001) Insulin/IGF signalling and ageing: seeing the bigger picture. Curr.Opin.Genet.Dev. 11, 287-292.
Georgi L. L., Albert P. S. and Riddle D. L. (1990) daf-1, a C. elegans gene controlling dauer larva development, encodes a novel receptor protein kinase. Cell 61, 635-645.
Grant B. and Hirsh D. (1999) Receptor-mediated endocytosis in the Caenorhabditis elegans oocyte. Mol Biol Cell 10, 4311-4326.
Groneberg D. A., Doring F., Eynott P. R., Fischer A. and Daniel H. (2001a) Intestinal peptide transport: ex vivo uptake studies and localization of peptide carrier PEPT1. Am.J.Physiol Gastrointest.Liver Physiol 281, G697-G704.
Groneberg D. A., Doring F., Nickolaus M., Daniel H. and Fischer A. (2001b) Expression of PEPT2 peptide transporter mRNA and protein in glial cells of rat dorsal root ganglia. Neurosci Lett 304, 181-184.
Groneberg D. A., Nickolaus M., Springer J., Doring F., Daniel H. and Fischer A. (2001c) Localization of the peptide transporter PEPT2 in the lung: implications for pulmonary oligopeptide uptake. Am J Pathol 158, 707-714.
Groneberg D. A., Eynott P. R., Doring F., Thai Dinh Q., Oates T., Barnes P. J., Chung K. F., Daniel H. and Fischer A. (2002) Distribution and function of the peptide transporter PEPT2 in normal and cystic fibrosis human lung. Thorax 57, 55-60.
Hanahan D. (1985) Techniques for transformation in Escherichia coli, in DNA Cloning, a practical approach, Vol. 1 (Glover D. M., ed.), pp 109-135, Oxford.
Hara K., Yonezawa K., Weng Q. P., Kozlowski M. T., Belham C. and Avruch J. (1998) Amino acid sufficiency and mTOR regulate p70 S6 kinase and eIF-4E BP1 through a common effector mechanism. J Biol Chem 273, 14484-14494.
Hekimi S. (2000) Crossroads of aging in the nematode Caenorhabditis elegans. Results Probl Cell Differ 29, 81-112.
Henderson S. T. and Johnson T. E. (2001) daf-16 integrates developmental and environmental inputs to mediate aging in the nematode Caenorhabditis elegans. Curr Biol 11, 1975-1980.
Holzenberger M., Dupont J., Ducos B., Leneuve P., Geloen A., Even P. C., Cervera P. and Le Bouc Y. (2003) IGF-1 receptor regulates lifespan and resistance to oxidative stress in mice. Nature 421, 182-187.
Hosokawa H., Ishii N., Ishida H., Ichimori K., Nakazawa H. and Suzuki K. (1994) Rapid accumulation of fluorescent material with aging in an oxygen-sensitive mutant mev-1 of Caenorhabditis elegans. Mech Ageing Dev 74, 161-170.
Hu M., Subramanian P., Mosberg H. I. and Amidon G. L. (1989) Use of the peptide carrier system to improve the intestinal absorption of L-alpha-methyldopa: carrier kinetics, intestinal permeabilities, and in vitro hydrolysis of dipeptidyl derivatives of L-alpha-methyldopa. Pharm Res 6, 66-70.
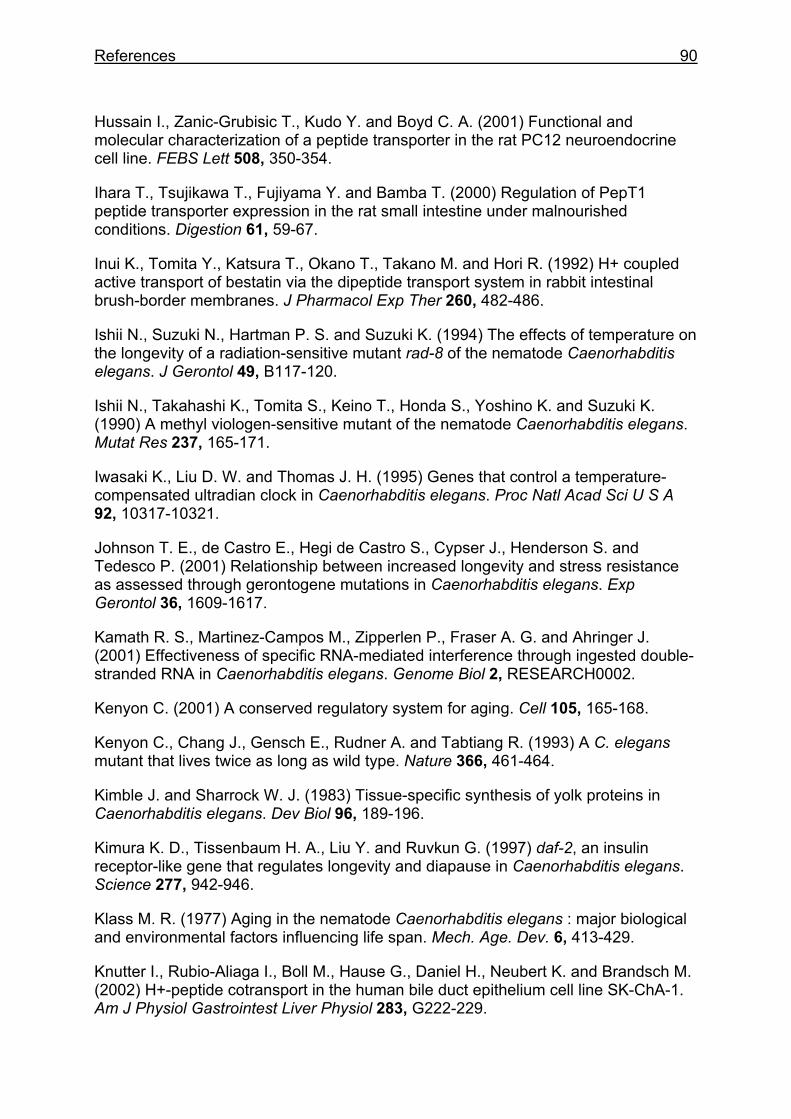
References 90
Hussain I., Zanic-Grubisic T., Kudo Y. and Boyd C. A. (2001) Functional and molecular characterization of a peptide transporter in the rat PC12 neuroendocrine cell line. FEBS Lett 508, 350-354.
Ihara T., Tsujikawa T., Fujiyama Y. and Bamba T. (2000) Regulation of PepT1 peptide transporter expression in the rat small intestine under malnourished conditions. Digestion 61, 59-67.
Inui K., Tomita Y., Katsura T., Okano T., Takano M. and Hori R. (1992) H+ coupled active transport of bestatin via the dipeptide transport system in rabbit intestinal brush-border membranes. J Pharmacol Exp Ther 260, 482-486.
Ishii N., Suzuki N., Hartman P. S. and Suzuki K. (1994) The effects of temperature on the longevity of a radiation-sensitive mutant rad-8 of the nematode Caenorhabditis elegans. J Gerontol 49, B117-120.
Ishii N., Takahashi K., Tomita S., Keino T., Honda S., Yoshino K. and Suzuki K. (1990) A methyl viologen-sensitive mutant of the nematode Caenorhabditis elegans. Mutat Res 237, 165-171.
Iwasaki K., Liu D. W. and Thomas J. H. (1995) Genes that control a temperature-compensated ultradian clock in Caenorhabditis elegans. Proc Natl Acad Sci U S A 92, 10317-10321.
Johnson T. E., de Castro E., Hegi de Castro S., Cypser J., Henderson S. and Tedesco P. (2001) Relationship between increased longevity and stress resistance as assessed through gerontogene mutations in Caenorhabditis elegans. Exp Gerontol 36, 1609-1617.
Kamath R. S., Martinez-Campos M., Zipperlen P., Fraser A. G. and Ahringer J. (2001) Effectiveness of specific RNA-mediated interference through ingested double-stranded RNA in Caenorhabditis elegans. Genome Biol 2, RESEARCH0002.
Kenyon C. (2001) A conserved regulatory system for aging. Cell 105, 165-168.
Kenyon C., Chang J., Gensch E., Rudner A. and Tabtiang R. (1993) A C. elegans mutant that lives twice as long as wild type. Nature 366, 461-464.
Kimble J. and Sharrock W. J. (1983) Tissue-specific synthesis of yolk proteins in Caenorhabditis elegans. Dev Biol 96, 189-196.
Kimura K. D., Tissenbaum H. A., Liu Y. and Ruvkun G. (1997) daf-2, an insulin receptor-like gene that regulates longevity and diapause in Caenorhabditis elegans. Science 277, 942-946.
Klass M. R. (1977) Aging in the nematode Caenorhabditis elegans : major biological and environmental factors influencing life span. Mech. Age. Dev. 6, 413-429.
Knutter I., Rubio-Aliaga I., Boll M., Hause G., Daniel H., Neubert K. and Brandsch M. (2002) H+-peptide cotransport in the human bile duct epithelium cell line SK-ChA-1. Am J Physiol Gastrointest Liver Physiol 283, G222-229.
References 91
Kramer W., Girbig F., Gutjahr U., Kleemann H. W., Leipe I., Urbach H. and Wagner A. (1990) Interaction of renin inhibitors with the intestinal uptake system for oligopeptides and beta-lactam antibiotics. Biochim Biophys Acta 1027, 25-30.
Lakowski B. and Hekimi S. (1998) The genetics of caloric restriction in Caenorhabditis elegans. Proc.Natl.Acad.Sci.U.S.A 95, 13091-13096.
Larsen P. L. (1993) Aging and resistance to oxidative damage in Caenorhabditis elegans. Proc Natl Acad Sci U S A 90, 8905-8909.
Larsen P. L., Albert P. S. and Riddle D. L. (1995) Genes that regulate both development and longevity in Caenorhabditis elegans. Genetics 139, 1567-1583.
Lee R. Y., Hench J. and Ruvkun G. (2001) Regulation of C. elegans DAF-16 and its human ortholog FKHRL1 by the daf-2 insulin-like signaling pathway. Curr Biol 11, 1950-1957.
Lee S. S., Kennedy S., Tolonen A. C. and Ruvkun G. (2003) DAF-16 target genes that control C. elegans life-span and metabolism. Science 300, 644-647.
Levine R. L., Garland D., Oliver C. N., Amici A., Climent I., Lenz A. G., Ahn B. W., Shaltiel S. and Stadtman E. R. (1990) Determination of carbonyl content in oxidatively modified proteins. Methods Enzymol 186, 464-478.
Lewis J. A. and Fleming J. T. (1995) Basic culture methods. Methods Cell Biol 48, 3-29.
Li W., Kennedy S. G. and Ruvkun G. (2003) daf-28 encodes a C. elegans insulin superfamily member that is regulated by environmental cues and acts in the DAF-2 signaling pathway. Genes Dev 17, 844-858.
Liang R., Fei Y. J., Prasad P. D., Ramamoorthy S., Han H., Yang-Feng T. L., Hediger M. A., Ganapathy V. and Leibach F. H. (1995) Human intestinal H+/peptide cotransporter. Cloning, functional expression, and chromosomal localization. J.Biol.Chem. 270, 6456-6463.
Lin K., Dorman J. B., Rodan A. and Kenyon C. (1997) daf-16: An HNF-3/forkhead family member that can function to double the life-span of Caenorhabditis elegans. Science 278, 1319-1322.
Lin K., Hsin H., Libina N. and Kenyon C. (2001) Regulation of the Caenorhabditis elegans longevity protein DAF-16 by insulin/IGF-1 and germline signaling. Nat Genet 28, 139-145.
Lin S. J., Defossez P. A. and Guarente L. (2000) Requirement of NAD and SIR2 for life-span extension by calorie restriction in Saccharomyces cerevisiae. Science 289, 2126-2128.
Lithgow G. J. (2000) Stress response and aging in Caenorhabditis elegans. Results Probl Cell Differ 29, 131-148.
References 92
Lithgow G. J., White T. M., Hinerfeld D. A. and Johnson T. E. (1994) Thermotolerance of a long-lived mutant of Caenorhabditis elegans. J Gerontol 49, B270-276.
Lithgow G. J., White T. M., Melov S. and Johnson T. E. (1995) Thermotolerance and extended life-span conferred by single-gene mutations and induced by thermal stress. Proc Natl Acad Sci U S A 92, 7540-7544.
Liu D. W. and Thomas J. H. (1994) Regulation of a periodic motor program in C. elegans. J Neurosci 14, 1953-1962.
Liu F., Thatcher J. D., Barral J. M. and Epstein H. F. (1995) Bifunctional glyoxylate cycle protein of Caenorhabditis elegans: a developmentally regulated protein of intestine and muscle. Dev Biol 169, 399-414.
Long X., Spycher C., Han Z. S., Rose A. M., Muller F. and Avruch J. (2002) TOR deficiency in C. elegans causes developmental arrest and intestinal atrophy by inhibition of mRNA translation. Curr Biol 12, 1448-1461.
Maniatis T., Fritsch E. F. and Sambrook J. (1982) Molecular Cloning: A Laboratory Manual. Cod Spring Harbor, New York.
Martin G. M., Austad S. N. and Johnson T. E. (1996) Genetic analysis of ageing: role of oxidative damage and environmental stresses. Nat Genet 13, 25-34.
Matthews D. M., Addison J. M. and Burston D. (1974) Evidence for active transport of the dipeptide carnosine (beta-alanyl-L-histidine) by hamster jejunum in vitro. Clin Sci Mol Med 46, 693-705.
McCay C. M., Crowell M. F. and Maynard L. A. (1935) The effect of retarded growth upon the length of life-span and ultimate body size. J.Nutr. 10, 63-79.
Melendez A., Talloczy Z., Seaman M., Eskelinen E. L., Hall D. H. and Levine B. (2003) Autophagy genes are essential for dauer development and life-span extension in C. elegans. Science 301, 1387-1391.
Mello C. C., Kramer J. M., Stinchcomb D. and Ambros V. (1991) Efficient gene transfer in C. elegans: extrachromosomal maintenance and integration of transforming sequences. Embo J 10, 3959-3970.
Meredith D. and Boyd C. A. (2000) Structure and function of eukaryotic peptide transporters. Cell Mol.Life Sci. 57, 754-778.
Montagne J., Stewart M. J., Stocker H., Hafen E., Kozma S. C. and Thomas G. (1999) Drosophila S6 kinase: a regulator of cell size. Science 285, 2126-2129.
Moore V. A., Irwin W. J., Timmins P., Lambert P. A., Chong S., Dando S. A. and Morrison R. A. (2000) A rapid screening system to determine drug affinities for the intestinal dipeptide transporter 2: affinities of ACE inhibitors. Int J Pharm 210, 29-44.
References 93
Morita K., Chow K. L. and Ueno N. (1999) Regulation of body length and male tail ray pattern formation of Caenorhabditis elegans by a member of TGF-beta family. Development 126, 1337-1347.
Morita K., Flemming A. J., Sugihara Y., Mochii M., Suzuki Y., Yoshida S., Wood W. B., Kohara Y., Leroi A. M. and Ueno N. (2002) A Caenorhabditis elegans TGF-beta, DBL-1, controls the expression of LON-1, a PR-related protein, that regulates polyploidization and body length. Embo J 21, 1063-1073.
Morris J. Z., Tissenbaum H. A. and Ruvkun G. (1996) A phosphatidylinositol-3-OH kinase family member regulating longevity and diapause in Caenorhabditis elegans. Nature 382, 536-539.
Murakami S. and Johnson T. E. (1996) A genetic pathway conferring life extension and resistance to UV stress in Caenorhabditis elegans. Genetics 143, 1207-1218.
Murphy C. T., McCarroll S. A., Bargmann C. I., Fraser A., Kamath R. S., Ahringer J., Li H. and Kenyon C. (2003) Genes that act downstream of DAF-16 to influence the lifespan of Caenorhabditis elegans. Nature 424, 277-283.
Noguchi T. (2000) Protein nutrition and insulin-like growth factor system. Br.J.Nutr. 84 Suppl 2, S241-S244.
Novotny A., Xiang J., Stummer W., Teuscher N. S., Smith D. E. and Keep R. F. (2000) Mechanisms of 5-aminolevulinic acid uptake at the choroid plexus. J.Neurochem. 75, 321-328.
Ogg S. and Ruvkun G. (1998) The C. elegans PTEN homolog, DAF-18, acts in the insulin receptor-like metabolic signaling pathway. Mol Cell 2, 887-893.
Ogg S., Paradis S., Gottlieb S., Patterson G. I., Lee L., Tissenbaum H. A. and Ruvkun G. (1997) The Fork head transcription factor DAF-16 transduces insulin-like metabolic and longevity signals in C. elegans. Nature 389, 994-999.
Oldham S., Montagne J., Radimerski T., Thomas G. and Hafen E. (2000) Genetic and biochemical characterization of dTOR, the Drosophila homolog of the target of rapamycin. Genes Dev 14, 2689-2694.
O'Riordan V. and Burnell A. M. (1989) Intermediary metabolism in the dauer larva of the nematode C. elegans. I. Glycolysis, gluconeogenesis, oxidative phosphorylation and the tricarboxylic acid cycle. Comp Biochem Physiol 92B, 233-238.
O'Riordan V. and Burnell A. M. (1990) Intermediary metabolism in the dauer larva of the nematode C. elegans. II. The glyocylate cycle and fatty acid oxidation. Comp Biochem Physiol 95B, 125-130.
Palacin M., Estevez R., Bertran J. and Zorzano A. (1998) Molecular biology of mammalian plasma membrane amino acid transporters. Physiol Rev 78, 969-1054.
Paradis S. and Ruvkun G. (1998) Caenorhabditis elegans Akt/PKB transduces insulin receptor-like signals from AGE-1 PI3 kinase to the DAF-16 transcription factor. Genes Dev 12, 2488-2498.
References 94
Paradis S., Ailion M., Toker A., Thomas J. H. and Ruvkun G. (1999) A PDK1 homolog is necessary and sufficient to transduce AGE-1 PI3 kinase signals that regulate diapause in Caenorhabditis elegans. Genes Dev 13, 1438-1452.
Patterson G. I. and Padgett R. W. (2000) TGF beta-related pathways. Roles in Caenorhabditis elegans development. Trends Genet 16, 27-33.
Popham J. D. and Webster J. M. (1978) An alternative interpretation of the fine structure of the basal zone of the cuticle of the dauerlarva of the nematode Caenorhabditis elegans (Nematoda). Can J Zool 56, 1556-1563.
Raught B., Gingras A. C. and Sonenberg N. (2001) The target of rapamycin (TOR) proteins. Proc Natl Acad Sci U S A 98, 7037-7044.
Ren P., Lim C. S., Johnsen R., Albert P. S., Pilgrim D. and Riddle D. L. (1996) Control of C. elegans larval development by neuronal expression of a TGF-beta homolog. Science 274, 1389-1391.
Riddle D. L. and Albert P. S. (1997) Genetic and Environmental Regulation of Daure Larva Development, in C. elegans II. Cold Spring Harbor Laboratory Press, New York.
Rubio-Aliaga I., Boll M. and Daniel H. (2000) Cloning and characterization of the gene encoding the mouse peptide transporter PEPT2. Biochem Biophys Res Commun 276, 734-741.
Rubio-Aliaga I. and Daniel H. (2002) Mammalian peptide transporters as targets for drug delivery. Trends Pharmacol Sci 23, 434-440.
Rubio-Aliaga I., Frey I., Boll M., Groneberg D. A., Eichinger H. M., Balling R. and Daniel H. (2003) Targeted disruption of the peptide transporter Pept2 gene in mice defines its physiological role in the kidney. Mol Cell Biol 23, 3247-3252.
Saito H., Okuda M., Terada T., Sasaki S. and Inui K. (1995) Cloning and characterization of a rat H+/peptide cotransporter mediating absorption of beta-lactam antibiotics in the intestine and kidney. J.Pharmacol.Exp.Ther. 275, 1631-1637.
Schackwitz W. S., Inoue T. and Thomas J. H. (1996) Chemosensory neurons function in parallel to mediate a pheromone response in C. elegans. Neuron 17, 719-728.
Schierenberg E. and Cassada R. C. (1986) Der Nematode Caenorhabditis elegans. Biologie unserer Zeit 16, 1-7.
Scott P. H., Brunn G. J., Kohn A. D., Roth R. A. and Lawrence J. C., Jr. (1998) Evidence of insulin-stimulated phosphorylation and activation of the mammalian target of rapamycin mediated by a protein kinase B signaling pathway. Proc Natl Acad Sci U S A 95, 7772-7777.
Seymour M. K., Wright K. A. and Doncaster C. C. (1983) The action of the anterior feeding apparatus of Caenorhabditis elegans. J.Zool.Soc.Lond. 201, 527-539.
References 95
Shen H., Smith D. E., Keep R. F., Xiang J. and Brosius F. C., 3rd (2003) Targeted disruption of the PEPT2 gene markedly reduces dipeptide uptake in choroid plexus. J Biol Chem 278, 4786-4791.
Shen H., Smith D. E., Yang T., Huang Y. G., Schnermann J. B. and Brosius F. C., III (1999) Localization of PEPT1 and PEPT2 proton-coupled oligopeptide transporter mRNA and protein in rat kidney. Am.J.Physiol 276, F658-F665.
Shiraga T., Miyamoto K., Tanaka H., Yamamoto H., Taketani Y., Morita K., Tamai I., Tsuji A. and Takeda E. (1999) Cellular and molecular mechanisms of dietary regulation on rat intestinal H+/Peptide transporter PepT1. Gastroenterology 116, 354-362.
Steiner H. Y., Naider F. and Becker J. M. (1995) The PTR family: a new group of peptide transporters. Mol Microbiol 16, 825-834.
Suzuki Y., Yandell M. D., Roy P. J., Krishna S., Savage-Dunn C., Ross R. M., Padgett R. W. and Wood W. B. (1999) A BMP homolog acts as a dose-dependent regulator of body size and male tail patterning in Caenorhabditis elegans. Development 126, 241-250.
Swanson M. M. and Riddle D. L. (1981) Critical periods in the development of the Caenorhabditis elegans dauer larva. Dev Biol 84, 27-40.
Sze J. Y., Victor M., Loer C., Shi Y. and Ruvkun G. (2000) Food and metabolic signalling defects in a Caenorhabditis elegans serotonin-synthesis mutant. Nature 403, 560-564.
Takenaka A., Oki N., Takahashi S. I. and Noguchi T. (2000) Dietary restriction of single essential amino acids reduces plasma insulin-like growth factor-I (IGF-I) but does not affect plasma IGF- binding protein-1 in rats. J.Nutr. 130, 2910-2914.
Tamai I., Nakanishi T., Nakahara H., Sai Y., Ganapathy V., Leibach F. H. and Tsuji A. (1998) Improvement of L-dopa absorption by dipeptidyl derivation, utilizing peptide transporter PepT1. J Pharm Sci 87, 1542-1546.
Thamotharan M., Bawani S. Z., Zhou X. and Adibi S. A. (1999) Hormonal regulation of oligopeptide transporter pept-1 in a human intestinal cell line. Am.J.Physiol 276, C821-C826.
Thwaites D. T., Kennedy D. J., Raldua D., Anderson C. M., Mendoza M. E., Bladen C. L. and Simmons N. L. (2002) H/dipeptide absorption across the human intestinal epithelium is controlled indirectly via a functional Na/H exchanger. Gastroenterology 122, 1322-1333.
Turner G. C., Du F. and Varshavsky A. (2000) Peptides accelerate their uptake by activating a ubiquitin-dependent proteolytic pathway. Nature 405, 579-583.
Vanfleteren J. R. (1993) Oxidative stress and ageing in Caenorhabditis elegans. Biochem J 292 ( Pt 2), 605-608.
References 96
Vanfleteren J. R. and De Vreese A. (1995) The gerontogenes age-1 and daf-2 determine metabolic rate potential in aging Caenorhabditis elegans. Faseb J 9, 1355-1361.
Vanfleteren J. R. and Braeckman B. P. (1999) Mechanisms of life span determination in Caenorhabditis elegans. Neurobiol Aging 20, 487-502.
Wadsworth W. G. and Riddle D. L. (1989) Developmental regulation of energy metabolism in Caenorhabditis elegans. Dev Biol 132, 167-173.
Walker D., Thwaites D. T., Simmons N. L., Gilbert H. J. and Hirst B. H. (1998) Substrate upregulation of the human small intestinal peptide transporter, hPepT1. J Physiol 507 ( Pt 3), 697-706.
Walter E., Kissel T., Reers M., Dickneite G., Hoffmann D. and Stuber W. (1995) Transepithelial transport properties of peptidomimetic thrombin inhibitors in monolayers of a human intestinal cell line (Caco-2) and their correlation to in vivo data. Pharm Res 12, 360-365.
Wang H., Fei Y. J., Ganapathy V. and Leibach F. H. (1998) Electrophysiological characteristics of the proton-coupled peptide transporter PEPT2 cloned from rat brain. Am J Physiol 275, C967-975.
Weindruch R. and Walford R. L. (1988) The retardation of aging and disease by dietary restriction. Thomas, C.C., Springfield, IL.
White J. (1988) The Anatomy, in The Nematode Caenorhabditis elegans, Vol. Monograph 17, pp 81-122, New York.
Wolkow C. A., Kimura K. D., Lee M. S. and Ruvkun G. (2000) Regulation of C. elegans life-span by insulinlike signaling in the nervous system. Science 290, 147-150.
Yandell M. D., Edgar L. G. and Wood W. B. (1994) Trimethylpsoralen induces small deletion mutations in Caenorhabditis elegans. Proc Natl Acad Sci U S A 91, 1381-1385.
Yasuda K., Adachi H., Fujiwara Y. and Ishii N. (1999) Protein carbonyl accumulation in aging dauer formation-defective (daf) mutants of Caenorhabditis elegans. J.Gerontol.A Biol.Sci.Med.Sci. 54, B47-B51.
Zhang H., Stallock J. P., Ng J. C., Reinhard C. and Neufeld T. P. (2000) Regulation of cellular growth by the Drosophila target of rapamycin dTOR. Genes Dev 14, 2712-2724.
Acknowledgements
The work presented was carried out under supervision of Prof. Dr. Hannelore Daniel,
Molecular Nutrition Unit at Technical University Munich (Weihenstephan) and Prof.
Dr. Ralf Baumeister, Molecular Neurogenetics at Ludwig-Maximilian-University
Munich.
I would like to thank Prof. Dr. Hannerlore Daniel for the opportunity to work on this
exciting subject and for her guidance, support and confidence during all the time.
I also would like to thank Prof. Dr. Ralf Baumeister for the possibility to prepare the
main part of this work at his laboratory, for his scientific support and helpful
discussions in completing this thesis.
Thanks to Dr. Michael Boll and Martin Foltz for getting the project started at the
Technical University in Weihenstephan and to Claudia Rudolph (EleGene) for
generating the pep-1 and pep-2 C. elegans mutant strains.
I am grateful that I got the possibility to join the C. elegans lab of Prof. Dr. Ralf
Baumeister in Munich and I would like to thank all lab members for accepting me as
a member of their group, for a nice working atmosphere and for patient scientific
support. Special thanks to Bernard for helping me with worm genetics and Giuseppe
for his advice.
Further, I wish to thank Maren for her help, fruitful discussions about insulin-signalling
and for being a friend also outside the lab.
Thanks to Britta and Agata for having nice, not only scientific gossip and to Tine and
Kathy for preparing thousands of plates used in this work.
I just named a few here, but many thanks to all people for their financial, scientific,
psychical and physical help during the last 4 years.
Lebenslauf Name Meissner Vorname Barbara Geburtsort Rosenheim Geburtstag 23.03.1972 Schulbildung 1978-1982 Grundschule Vogtareuth 1982-1991 Finsterwalder-Gymnasium Rosenheim Juli 1991 Abitur Studium 04/1993 - 04/1995 Grundstudium der Haushalts- und
Ernährungswissenschaften an der Justus-Liebig-Universität in Giessen
04/1995 – 10/1997 Hauptstudium mit dem Schwerpunkt
Ernährungswissenschaft 10/1997 – 04/1999 Praktische Diplomarbeit in der Arbeitsgruppe von Prof.
Dr. Hannelore Daniel am Institut für Ernährungswissenschaft in Giessen
Thema der Arbeit: Funktionelle Charakterisierung der Arginin-Aufnahme
in die humane Coloncarcinomzelllinie Caco-2 30.09.1999 Abschluss zur Diplom-Oecotrophologin seit 02/2000 Anfertigung der Doktorarbeit am Lehrstuhl für
Ernährunsphysiologie der Technischen Universität München in Kooperation mit dem Labor von Prof. Dr. Ralf Baumeister an der Ludwig-Maximilians-Universität in München
seit 11/2003 Wissenschaftliche Mitarbeiterin im Labor von Prof. Dr.
Ralf Baumeister, Lehrstuhl für Stoffwechselbiochemie, an der Ludwig-Maximilians-Universität in München
Teile der Ergebnisse dieser Arbeit wurden bereits veröffentlicht: Publikation: Barbara Meissner, Michael Boll, Hannelore Daniel and Ralf Baumeister (2004) Deletion of the Intestinal Peptide Transporter Affects Insulin and TOR Signaling in C. elegans. J. Biol. Chem., 10.1074/jbc.M403415200, published online ahead of print May 19. Vorträge: Barbara Meissner, Giuseppe Cassata, Michael Boll, Hannelore Daniel, and Ralf Baumeister (2001) The knock-out of the peptide transporter gene pep-2 results in delayed development and extended life-span in Caenorhabditis elegans. 7th International Congress on Amino Acids and Proteins in Vienna, Austria. Barbara Meissner, Hannelore Daniel and Ralf Baumeister (2003) Peptidtransporter-KO in C. elegans – influence in development, reproduction and life-span. Colloquium at the WZW - Center of life science, Freising-Weihenstephan, Germany. Barbara Meissner, Giuseppe Cassata, Michael Boll, Hannelore Daniel, and Ralf Baumeister (2003) The intestinal peptide transporter controls development, reproduction and aging in C. elegans. 14th International C. elegans Meeting, University of California, Los Angeles. Posterbeiträge: Rudolph C, Daniel H, Weidner G, Boll M, Meissner B, Angelova M, Foltz M (2000) Disruption of peptide transporter genes in Caenorhabditis elegans. European Worm Meeting in Blankenberge, Belgium. Meissner B., Cassata G., Boll M., Daniel H. and Baumeister R. (2001) The knock-out of the peptide transporter gene pep-2 results in delayed development and extended life-span in Caenorhabditis elegans. 13th International C. elegans Meeting, University of California, Los Angeles, USA. B. Meissner, G. Cassata, M. Boll, H. Daniel, and R. Baumeister (2002) The knock-out of the peptide transporter gene pep-2 results in delayed development and reduced brood size in Caenorhabditis elegans. Internationales Symposium on Membrane Transport and Transporters, Kloster Seeon, Germany.
Erklärung
Hiermit versichere ich, dass ich die vorliegende Arbeit
Phenotype analysis of Caenorhabditis elegans lacking the intestinal peptide transporter
selbstständig verfasst und keine anderen als die angegebenen Quellen und
Hilfsmittel benutzt habe. Die den benutzten Quellen wörtlich oder inhaltlich
entnommenen Stellen sind als solche kenntlich gemacht.
Die Arbeit hat in gleicher oder ähnlicher Form noch keiner anderen Prüfungsbehörde
vorgelegen.
München,
Barbara Meissner