Embed Size (px)
Citation preview

RESEARCH ARTICLE
Phenotypic delay in the evolution of bacterial
antibiotic resistance: Mechanistic models and
their implications
Martın Carballo-Pacheco1☯, Michael D. NicholsonID1,2,3☯, Elin E. Lilja1, Rosalind
J. AllenID1,4, Bartlomiej WaclawID
1,4*
1 School of Physics and Astronomy, The University of Edinburgh, Edinburgh, United Kingdom, 2 Department of
Data Sciences, Dana-Farber Cancer Institute, Boston, Massachusetts, United States of America, 3 Department
of Biostatistics, Harvard T.H. Chan School of Public Health, Boston, Massachusetts, United States of America,
4 Centre for Synthetic and Systems Biology, The University of Edinburgh, Edinburgh, United Kingdom
☯ These authors contributed equally to this work.
Abstract
Phenotypic delay—the time delay between genetic mutation and expression of the corre-
sponding phenotype—is generally neglected in evolutionary models, yet recent work sug-
gests that it may be more common than previously assumed. Here, we use computer
simulations and theory to investigate the significance of phenotypic delay for the evolution of
bacterial resistance to antibiotics. We consider three mechanisms which could potentially
cause phenotypic delay: effective polyploidy, dilution of antibiotic-sensitive molecules and
accumulation of resistance-enhancing molecules. We find that the accumulation of resistant
molecules is relevant only within a narrow parameter range, but both the dilution of sensitive
molecules and effective polyploidy can cause phenotypic delay over a wide range of param-
eters. We further investigate whether these mechanisms could affect population survival
under drug treatment and thereby explain observed discrepancies in mutation rates esti-
mated by Luria-Delbruck fluctuation tests. While the effective polyploidy mechanism does
not affect population survival, the dilution of sensitive molecules leads both to decreased
probability of survival under drug treatment and underestimation of mutation rates in fluctua-
tion tests. The dilution mechanism also changes the shape of the Luria-Delbruck distribution
of mutant numbers, and we show that this modified distribution provides an improved fit to
previously published experimental data.
Author summary
Understanding precisely how some bacteria survive exposure to antibiotics is a major
research focus. Specific mutations in the bacterial genome are known to provide protec-
tion. However, it remains unclear how much time passes between a bacterium acquiring
the genetic change and being able to tolerate antibiotics—termed the phenotypic delay—
and what controls this delay. Here, using computer simulations and mathematical argu-
ments we discuss three biologically plausible mechanisms of phenotypic delay. We
PLOS COMPUTATIONAL BIOLOGY
PLOS Computational Biology | https://doi.org/10.1371/journal.pcbi.1007930 May 29, 2020 1 / 24
a1111111111
a1111111111
a1111111111
a1111111111
a1111111111
OPEN ACCESS
Citation: Carballo-Pacheco M, Nicholson MD, Lilja
EE, Allen RJ, Waclaw B (2020) Phenotypic delay in
the evolution of bacterial antibiotic resistance:
Mechanistic models and their implications. PLoS
Comput Biol 16(5): e1007930. https://doi.org/
10.1371/journal.pcbi.1007930
Editor: Mark M. Tanaka, University of New South
Wales, AUSTRALIA
Received: February 6, 2020
Accepted: May 6, 2020
Published: May 29, 2020
Peer Review History: PLOS recognizes the
benefits of transparency in the peer review
process; therefore, we enable the publication of
all of the content of peer review and author
responses alongside final, published articles. The
editorial history of this article is available here:
https://doi.org/10.1371/journal.pcbi.1007930
Copyright: © 2020 Carballo-Pacheco et al. This is
an open access article distributed under the terms
of the Creative Commons Attribution License,
which permits unrestricted use, distribution, and
reproduction in any medium, provided the original
author and source are credited.
Data Availability Statement: All numerical values
used to generate graphs are included in the
Supplementary Information in the form of an Excel
spreadsheet. The work uses published data of Ref.

investigate how each mechanism would affect the outcome of laboratory experiments
often used to study the evolution of antibiotic resistance, and we highlight how the delay
might be detected in such experiments. We also show that the existence of the delay could
explain an observed discrepancy in the measurement of mutation rates, and demonstrate
that one of our models provides a superior fit to experimental data. Our work exposes
how molecular details at the intracellular level can have a direct effect on evolution at the
population level.
Introduction
The emergence of resistance to drugs is a significant problem in the treatment of diseases such
as cancer [1], and viral [2] and bacterial infections [3]. In infections with high pathogen load,
the occurrence of de novo genetic mutations leading to resistance is a significant problem [4];
examples include endocarditis infections caused by Staphylococcus aureus [5, 6], Pseudomonasaeruginosa infections of cystic fibrosis patients [7, 8], as well as Burkholderia dolosa [4, 9]
infections.
The emergence and spread of resistant variants in populations of pathogenic cells has
received much experimental [10–14] and theoretical attention [15–18]. However, most mathe-
matical models assume that a genetic mutation immediately transforms a sensitive cell into a
resistant cell [19–24]. In reality, a new allele (genetic variant) must be expressed to a sufficient
level before the cell becomes phenotypically resistant. The time between the occurrence of a
genetic mutation and its phenotypic expression is called phenotypic delay. This is also referred
to as delayed phenotypic expression, phenotypic lag, cytoplasmic lag or phenomic lag.
Phenotypic delay was first observed in 1934 by Sonnenborn and Lynch when studying the
effect of conjugation on the fission rate of Paramecium aurelia [25]. Phenotypic delay was fur-
ther studied during the 1940s and 1950s, both theoretically [26] and experimentally [27, 28].
Interestingly, in their hallmark work on the randomness of mutations in bacteria [29], Luria
and Delbruck discussed the possible effect of a phenotypic delay on the estimation of mutation
rates. However, interest in phenotypic delay waned for the next seventy years, mostly because
experimental data failed to reveal evidence for such delay [29, 30]. However, Sun et al. [31]
recently demonstrated the existence of a phenotypic delay of 3-4 generations in the evolution
of resistance of Escherichia coli to the antibiotics rifampicin, nalidixic acid and streptomycin.
Sun et al. attributed this delay to effective polyploidy.
Here, we generalize these observations and also investigate other mechanisms that may lead
to phenotypic delay. We consider three mechanisms: (i) effective polyploidy as in Sun et al.
[31], (ii) the dilution of sensitive molecules targeted by the drug, and (iii) the accumulation of
resistance-enhancing molecules. We speculate on the relevance of these mechanisms for differ-
ent antibiotics in Table 1.
Effective polyploidy refers to the fact that a single cell can contain multiple copies of a given
gene. This can be due to gene duplication events or carriage of multicopy plasmids; it also
occurs in fast-growing bacteria, which initiate new rounds of DNA replication before the pre-
vious round has finished, allowing for a shorter generation time than the time needed to repli-
cate the chromosome [32–34]. Since a de novo resistance mutation happens in only one of the
multiple gene copies, it may take several generations before a cell emerges in which all gene
copies contain the mutated allele. Until then, sensitive and resistant variants of the target pro-
tein coexist in the cell. A phenotypic delay occurs when the resistance mutation is recessive,
i.e., the sensitive variant must be replaced by the resistant variant for the cell to become
PLOS COMPUTATIONAL BIOLOGY Phenotypic delay in the evolution of antibiotic resistance
PLOS Computational Biology | https://doi.org/10.1371/journal.pcbi.1007930 May 29, 2020 2 / 24
[47]: Boe L, Tolker-Nielsen T, Eegholm KM, Spliid
H, Vrang A. Fluctuation analysis of mutations to
nalidixic acid resistance in Escherichia coli. J
Bacteriol. 1994;176(10):2781–2787. doi:10.1128/
jb.176.10.2781-2787.1994. The data is also
included in the supplementary Excel table (included
in this submission), S1 Table, sheet "Fig 5", panel b,
column "Experimental data". All algorithms used to
process the data are described in the manuscript.
Funding: RJA, MCP, and EL received funding from
the European Research Council under Consolidator
grant 682237 EVOSTRUC, https://erc.europa.eu/.
BW received funding from the Royal Society of
Edinburgh Personal Research Fellowship, https://
www.rse.org.uk/. MN received funding from the
EPSRC DTA PhD studentship, https://epsrc.ukri.
org/. The funders had no role in the study design,
data collection and analysis, decision to publish, or
preparation of the manuscript.
Competing interests: The authors have declared
that no competing interests exist.

resistant. This is the case for antibiotics which form toxic adducts with their targets [35, 36].
Examples are quinolones that lock the enzyme DNA gyrase onto the DNA and prevent DNA
replication [37], and polymixins that bind to lipids in the outer membrane which causes mem-
brane perforation [38, 39]. Effective polyploidy also changes the per-cell mutation rate, because
it alters the number of gene copies per cell [31]. However, as shown both by Sun et al [31] and
in this paper, it does not alter the distribution of mutant numbers that are observed in fluctua-
tion tests.
The dilution mechanism also assumes the mutation to be recessive, but in contrast to the
polyploidy mechanism it focuses on the removal of the sensitive target protein through the
process of cell growth and division. As a mutated cell grows, the resistant version of the protein
accumulates; a subsequent division creates two cells in which the fraction of the sensitive vari-
ant is less than in the parent cell. Even if the relevant gene is present only in a single copy (rul-
ing out effective polyploidy), there may still be a considerable delay if the number of sensitive
proteins to dilute out is large before resistance can be established.
The accumulation mechanism posits that sufficient copies of the resistant variants of a pro-
tein must be produced to cause resistance. This is likely to apply to mutations that enhance the
expression of drug efflux pumps [40], β-lactamase enzymes that hydrolyse β-lactam antibiotics
[41, 42], or mutations that protect ribosomes from tetracycline [43], hence restoring the active
ribosome pool [44]. In these cases, a phenotypic delay could emerge due to the time required
for the resistance-enhancing protein to accumulate in the cell to a level high enough to cause
resistance.
We first analyse the three mechanisms using computer simulations and analytic calcula-
tions. We find that the accumulation of resistance-enhancing molecules only leads to pheno-
typic delay within a limited parameter range, while effective polyploidy and the dilution of
sensitive molecules lead to phenotypic delay for a broad range of parameters. We also show
that while the effective polyploidy mechanism does not affect the probability that a population
survives antibiotic challenge, dilution of sensitive protein leads to decreased probability of sur-
vival under drug treatment.
We then investigate the possibility of detecting a phenotypic delay experimentally. We first
show that the dilution mechanism would cause an underestimation of mutation rates in Luria-
Delbruck fluctuation tests compared to the true genetic rate of mutations. In a fluctuation test,
one measures the distribution of mutant numbers in replicate populations that have been
allowed to grow and evolve for a fixed number of generations. The mutation rate is then esti-
mated by fitting a population dynamics model to the experimental distribution [29, 45]. Our
result is consistent with the fact that the mutation rate of Escherichia coli obtained in fluctua-
tion tests has been found to be an order of magnitude smaller than the rate obtained by DNA
sequencing [46].
Table 1. Postulated mechanism of phenotypic lag for different antibiotics discussed in this work.
Antibiotic Target Mechanism of resistance Postulated phenotypic lag model
rifampicin RNA polymerase target mutation (rpoB), recessive dilution+polyploidy
fluoroquinolones DNA topoisomerases target mutation (gyrA, gyrB, parC), recessive dilution+polyploidy
polymixins lipo-poly-saccharide (LPS) mutations in enzymes modifying the structure of LPS dilution+polyploidy
beta-lactams enzymes in cell wall synthesis inactivation by beta-lactamase, dominant accumulation
tetracycline ribosomes efflux upregulation, production of a protective protein accumulation
many antibiotics different targets upregulation of efflux pumps, dominant accumulation
https://doi.org/10.1371/journal.pcbi.1007930.t001
PLOS COMPUTATIONAL BIOLOGY Phenotypic delay in the evolution of antibiotic resistance
PLOS Computational Biology | https://doi.org/10.1371/journal.pcbi.1007930 May 29, 2020 3 / 24

We also show that the dilution mechanism subtly alters the shape of the Luria-Delbruck dis-
tribution of mutant numbers. Discrepancies between the shapes of the experimental and theo-
retically predicted mutant number distributions have been observed since the original
experiments of Luria and Delbruck [26, 29, 30, 47], but have never been satisfactorily
explained. Using an experimental data set reported by Boe et al. [47] for E. coli and for fluoro-
quinolone antibiotics, we show that a mathematical model that includes the dilution mecha-
nism fits the data better than the no-delay Luria-Delbruck model, thus providing indirect
evidence for the existence of this type of phenotypic delay in the de novo evolution of resistance
to fluoroquinolones.
Results
Modeling the emergence of phenotypic delay
To explore the characteristic features of the three different phenotypic delay mechanisms—
dilution of sensitive molecules, effective polyploidy, and accumulation of the resistant
variant—we first simulate an idealised mutagenesis experiment (Fig 1a). We suppose that at
the start of the experiment a population of sensitive bacteria is exposed to a mutagen (e.g., UV
radiation [48, 49]) which instantaneously induces mutations in a small fraction of the cells [50,
51]. Cells immediately begin to express the mutated allele, but because of the existence of phe-
notypic delay, they remain sensitive to the antibiotic for some time; phenotypically resistant
cells emerge only after a few generations.
We investigate the emergence of resistance in two different ways. The first approach is to
follow a random lineage, starting from a single mutant bacterium (i.e., at each division we fol-
low one of the randomly selected daughter cells) and to measure the waiting time before a phe-
notypically resistant cell emerges in that lineage (S1 Fig). The second approach is to track the
entire population post mutagenesis, and examine the waiting time before the first phenotypi-
cally resistant cell emerges in the whole population. Fig 1b shows the conceptual difference
between these two approaches.
Dilution of antibiotic-sensitive molecules. Even in the absence of polyploidy, if the resis-
tance mutation is recessive such that a small number of sensitive target molecules are enough
to cause antibiotic sensitivity, a phenotypic delay can arise from the time taken to replace sen-
sitive target molecules by resistant ones. To model this, we assume that each cell has a number
n of target molecules that are initially sensitive. Once a mutation has happened, production of
sensitive molecules ceases and only resistant molecules are produced. We suppose that, upon
cell division, the nmolecules are partitioned stochastically without bias between the two
daughter cells (Fig 1c). For simplicity, in this work cells are considered phenotypically resistant
only when they contain no sensitive molecules, i.e., the number of sensitive molecules that
need to be diluted out is n.
For this mechanism, the length of the phenotypic delay increases approximately logarithmi-
cally with the number n of sensitive molecules that need to be diluted for resistance to emerge
(Fig 1d). To understand this, suppose momentarily that n is a power of 2 and stochasticity can
be neglected so that each daughter cell receives exactly half the number of molecules of the par-
ent cell. Then for any lineage stemming from a genetically mutant cell, the number of inherited
sensitive molecules will be 2n−1, 2n−2, . . ., as the generations progress. After log2 n generations
all cells will have a single sensitive molecule and hence the first phenotypically resistant cell
will then emerge after 1 + log2 n generations. In this deterministic setting, 1 + log2 n will also
be the number of generations for the population to become resistant.
In the more realistic case of stochastic segregation of molecules, the probability of resistance
along a random lineage after g generations is approximately exp(−2−gn) (S1 Text, Section 1.1).
PLOS COMPUTATIONAL BIOLOGY Phenotypic delay in the evolution of antibiotic resistance
PLOS Computational Biology | https://doi.org/10.1371/journal.pcbi.1007930 May 29, 2020 4 / 24

Fig 1. Models of phenotypic delay. (a) Schematic representation of a simulated experiment, in which a mutagen (e.g., UV radiation) induces
resistant mutations at a particular moment in time. Mutants initially remain sensitive to the antibiotic, only becoming resistant after a few
generations. (b) Two ways of determining the time to resistance: tracking a single random lineage (dotted line), and tracking the whole
population. In this example, resistance emerges in generations 3 and 2, respectively. (c) The dilution mechanism: blue/brown dots denote
sensitive/resistant variants of the target molecule. When a wild-type cell (blue) mutates, it initially remains sensitive (green) and becomes
resistant (red) when all sensitive molecules are diluted out. (d) Probability that at least one cell in an exponentially growing population starting
with 100 newly genetically mutated cells is phenotypically resistant (dilution model) as a function of the number of generations since the genetic
mutation (dots: simulation; lines: theory). Phenotypic delay increases with the number of molecules n to be diluted. (e) The effective polyploidy
mechanism: chromosomes are represented as black ellipses, with a sensitive/resistant allele marked blue/red. (f) Same as in (d) but for the
effective polyploidy mechanism. Phenotypic delay increases with ploidy c. (g) The accumulation mechanism: blue/red dots denote sensitive/
resistant mutants of the resistant-enhancing molecule. Cells become resistant (red) when the cell contains enough resistant molecules. (h) Same
as in (d) but for the accumulation model. Phenotypic delay decreases with increasing ratiom of the number of molecules produced during cell
cycle and the number of molecules required for resistance.
https://doi.org/10.1371/journal.pcbi.1007930.g001
PLOS COMPUTATIONAL BIOLOGY Phenotypic delay in the evolution of antibiotic resistance
PLOS Computational Biology | https://doi.org/10.1371/journal.pcbi.1007930 May 29, 2020 5 / 24

Hence the probability of resistance emerging in a lineage is negligible until generation g set by
2g� n, when the probability rapidly rises to 1. Therefore, in line with our deterministic reason-
ing, resistance along a random lineage will emerge after g� log2 n generations. Interestingly,
however, we obtain a different result for the probability that the population as a whole pro-
duces at least one resistant cell. If we start from x genetically mutated cells in the population,
the first phenotypically resistant cell in the population emerges, on average, after an approxi-
mate time 1 + log2(n/log(xn)) (S1 Text, Section 1.1). We can also calculate the resistance prob-
ability through a recursion relation (S1 Text, Section 1.1); the results fully reproduce the
simulations (Fig 1d). The emergence of resistance at the population level is thus accelerated
compared to what one would obtain based on deterministic dilution. We have assumed for
simplicity that each of the x cells initially has the same number n of sensitive molecules; this is
only a crude approximation for real bacteria. An extended model in which molecules are dis-
tributed in a biased way between the two daughter cells, inspired by recent evidence on accu-
mulation of membrane proteins in the daughter cell with the older pole [52–55], leads to a
similar result (S1 Text, Section 3). However, the bias decreases slightly the phenotypic delay at
a population level (S3 Fig); this is because the bias creates lineages which are low in the number
of resistant molecules.
Effective polyploidy. Rapidly dividing bacteria can become effectively polyploid when
they initiate a round of DNA replication before the previous round has finished; this leads to
the presence of multiple copies of at least some parts of the chromosome [32] (Fig 1e). Cru-
cially, the degree of polyploidy (number of gene copies) depends on the bacterial growth rate,
as well as on other factors such as the genetic locus. To model phenotypic delay caused by
effective polyploidy, we assume that each cell has a number c of chromosome copies that is
growth-rate dependent according to the well-established Cooper-Helmstetter model of E. colichromosome replication [32] (Methods). Each chromosome copy contains a single allele,
encoding the antibiotic target, that can be either sensitive or resistant. Initially all chromo-
somes have the sensitive allele but a mutation changes one allele from sensitive to resistant.
We then simulate the process of DNA replication and cell division, taking account of the fact
that duplicated resistant alleles are co-inherited—for example, if a cell has two chromosome
copies, one with a resistant allele and the other with a sensitive allele, then upon replication
and division, one daughter cell will have two sensitive alleles and the other daughter cell will
have two resistant alleles [33] (Methods). We assume that a cell becomes phenotypically resis-
tant when none of its chromosomes contain the sensitive allele (i.e., the resistant allele is
assumed to be recessive). In this model, the waiting time until a cell acquires a full suite of
resistant chromosomes is log2 c generations (Fig 1f). This phenotypic delay time is the same
whether we track a given lineage or the entire population (since it is deterministic). However,
resistance will not occur in all lineages; of the c lineages descended from the original mutant
cell, resistance will eventually occur in only one of them [31] (S1 Fig).
We note that effective polyploidy generally causes a shorter delay than dilution of sensitive
molecules: 2 to 3 generations for rapidly growing bacteria (c = 4 or 8 [31, 32]), versus 5 genera-
tions for the dilution mechanism (assuming n� 500, which is typical for the gyrase enzyme
targeted by fluoroquinolones [56, 57]). The transition in the probability of resistance as a func-
tion of time is also sharper for effective polyploidy than for the dilution mechanism in which
stochasticity of the segregation process smooths out the transition (compare Fig 1d and 1f).
Finally, for effective polyploidy, we expect only one in every c lineages to become resistant,
while for dilution of sensitive molecules, all lineages will eventually become resistant.
Accumulation of resistance-enhancing molecules. Phenotypic delay can also emerge
due to the time needed to accumulate resistance-enhancing molecules to a sufficiently high
level (Fig 1g). To model this mechanism, we suppose that during each cell cycle a genetically
PLOS COMPUTATIONAL BIOLOGY Phenotypic delay in the evolution of antibiotic resistance
PLOS Computational Biology | https://doi.org/10.1371/journal.pcbi.1007930 May 29, 2020 6 / 24

resistant cell producesMp resistance-enhancing molecules, which are randomly distributed
between daughter cells at division. A cell becomes resistant when it hasMr or more resistance-
enhancing molecules. Interestingly, considering either a single lineage (S1 Fig) or the entire
population (Fig 1h), we find that phenotypic delay emerges only within a limited parameter
range: 1 ≲m≲ 2, wherem ¼ MpMr
is the ratio of the number of molecules produced during a cell
cycle and the number of molecules needed for resistance. The origin of this limited parameter
range is most easily explained by considering a single lineage. Tracking a lineage arising from
a single mutant cell, the cell in the gth generation will be born with an average ofMp(1 − 2−g)
molecules (S1 Text, Section 1.2). The steady-state number of molecules (found by taking g!1) isMp. Thus ifm< 1, the steady state number of molecules will be always smaller than the
minimum required numberMr, and the lineage will never become phenotypically resistant.
Conversely, ifm> 1, phenotypic resistance will emerge after approximately τ = −log2(1 − 1/
m) generations when the average number of resistance-enhancing molecules exceedsMr. But
for the delay to be at least one generation long (τ� 1), we requirem� 2. Considering now the
scenario where we track the entire population, we again expect the steady-state molecule num-
berMp to be rapidly reached by all cells, so that there will be no phenotypic resistance for
m< 1. Further, if resistance does emerge (form> 1), it will do so more quickly in the entire
population than along the random lineage (as resistance may be acquired in any lineage). We
thus expect an even tighter upper bound on the value ofm for phenotypic delay to manifest
itself on the population level in this model.
Since our analysis shows that, for this mechanism, phenotypic delay only emerges in a nar-
row parameter range, we conclude that the accumulation of resistance-enhancing molecules is
unlikely to be biologically relevant in causing phenotypic delay. Therefore we do not explore
this mechanism further.
Combining effective polyploidy and dilution
In reality, for a recessive resistance mutation, we expect both the effective polyploidy and dilu-
tion mechanisms to contribute to the phenotypic delay. To understand the implications of
this, we simulated a model combining the two mechanisms, tracking the emergence of resis-
tance at a single-cell and population level. Our simulations predict a phenotypic delay with
characteristics of both mechanisms (Fig 2).
Focusing first on a single lineage (Fig 2a and 2b), we observe that the long-term probability
of phenotypic resistance depends on the ploidy c, tending to 1/c, as expected for the effective
polyploidy mechanism, while the approach to this value is gradual as expected for the dilution
mechanism. Combining both mechanisms increases the length of the delay compared to either
mechanism acting in isolation.
Following Sun et al. [31], we also calculate the phenotypic penetrance, defined as the pro-
portion of genetic mutants which are phenotypically resistant in the entire population. The
expected phenotypic penetrance (see S1 Text Section 1.3 for derivation) is:
0 0 � g < log 2c;
ð1 � 2� gÞnQlog2c� 1
i¼0ð1 � 2� ðg� iÞÞ
nð1� 2i=cÞ log 2c � g:
8<
:ð1Þ
Note that n = 0 corresponds to only the effective polyploidy mechanism, while c = 1 corre-
sponds to only the dilution mechanism being present. The piecewise form of Eq (1) arises
because no cell can become phenotypically resistant until all its chromosomes have the resis-
tant allele. Fig 2d shows that the phenotypic penetrance predicted by Eq (1) increases gradually
PLOS COMPUTATIONAL BIOLOGY Phenotypic delay in the evolution of antibiotic resistance
PLOS Computational Biology | https://doi.org/10.1371/journal.pcbi.1007930 May 29, 2020 7 / 24
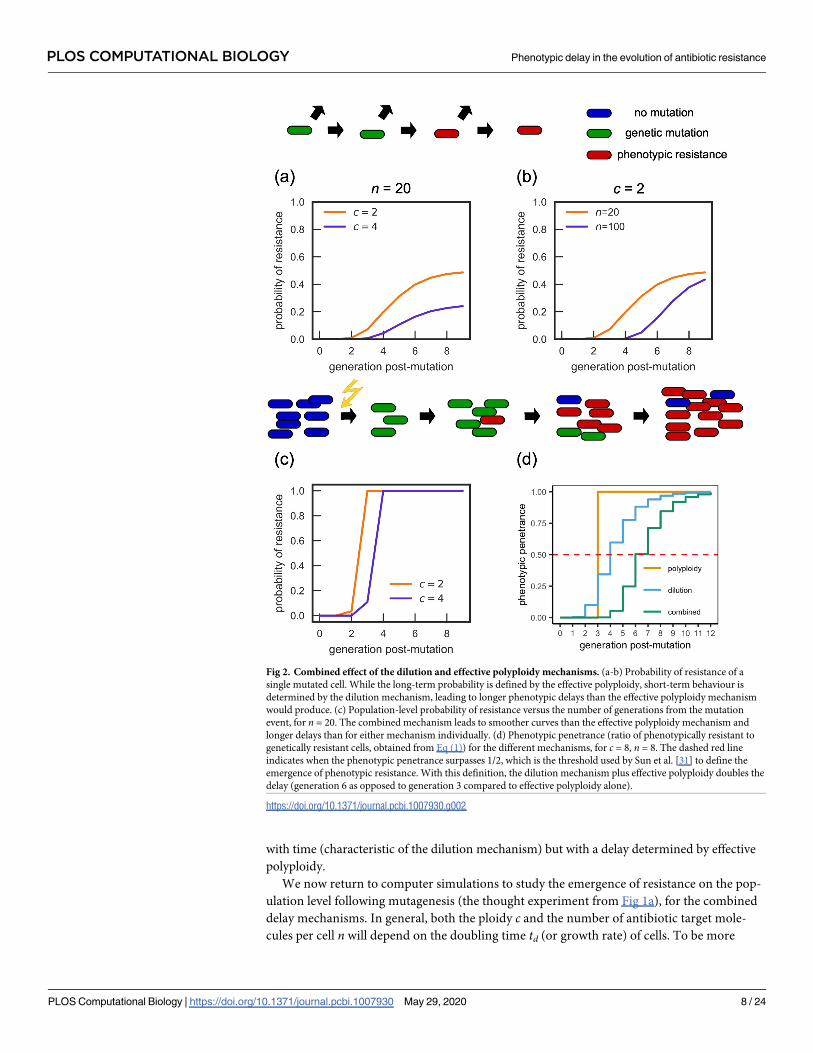
with time (characteristic of the dilution mechanism) but with a delay determined by effective
polyploidy.
We now return to computer simulations to study the emergence of resistance on the pop-
ulation level following mutagenesis (the thought experiment from Fig 1a), for the combined
delay mechanisms. In general, both the ploidy c and the number of antibiotic target mole-
cules per cell n will depend on the doubling time td (or growth rate) of cells. To be more
Fig 2. Combined effect of the dilution and effective polyploidy mechanisms. (a-b) Probability of resistance of a
single mutated cell. While the long-term probability is defined by the effective polyploidy, short-term behaviour is
determined by the dilution mechanism, leading to longer phenotypic delays than the effective polyploidy mechanism
would produce. (c) Population-level probability of resistance versus the number of generations from the mutation
event, for n = 20. The combined mechanism leads to smoother curves than the effective polyploidy mechanism and
longer delays than for either mechanism individually. (d) Phenotypic penetrance (ratio of phenotypically resistant to
genetically resistant cells, obtained from Eq (1)) for the different mechanisms, for c = 8, n = 8. The dashed red line
indicates when the phenotypic penetrance surpasses 1/2, which is the threshold used by Sun et al. [31] to define the
emergence of phenotypic resistance. With this definition, the dilution mechanism plus effective polyploidy doubles the
delay (generation 6 as opposed to generation 3 compared to effective polyploidy alone).
https://doi.org/10.1371/journal.pcbi.1007930.g002
PLOS COMPUTATIONAL BIOLOGY Phenotypic delay in the evolution of antibiotic resistance
PLOS Computational Biology | https://doi.org/10.1371/journal.pcbi.1007930 May 29, 2020 8 / 24

specific, we consider resistance of E. coli to fluoroquinolone antibiotics, that arises through
mutations in DNA gyrase (protein targeted by the antibiotic). Gyrase abundance as a fraction
of the proteome (i.e. gyrase concentration in the cell) has been found to be independent of
the growth rate [58]. We therefore assume that the number n of gyrases per cell is propor-
tional to the cell volume V. We model the volume as V / 2l=l0 , where λ = (ln 2)/td is the
growth rate and λ0 = 1h−1 [59–62], and we model polyploidy using the Cooper-Helmstetter
model [32] (see Methods and model for details). Suppose that for slow-growing cells (td =
60 min), c = 2 and n = 20. Then, for fast-growing cells (td = 30 min), we have c = 4 and n = 40.
Note that here we do not assume realistic values of n because the minimum number nr of poi-
soned sensitive gyrase molecules required to inhibit growth is probably much higher than
nr = 1 assumed in the model. n should be therefore interpreted more correctly as the number
of “units” of gyrase, with one unit equivalent to nr molecules. Fig 2c shows that the pheno-
typic delay is longer for the fast-growing population, and that this is mostly caused by the
increase in the number of molecules n (S4 Fig). We also observe that protein dilution leads to
a smoother transition between sensitivity and resistance than the transition due to effective
polyploidy alone.
The dilution mechanism, but not effective polyploidy, affects the
probability of clearing an infection
To understand better the practical significance of phenotypic delay, we simulated antibiotic
treatment of an idealised bacterial infection (Fig 3). We assume for simplicity that, before
treatment, the population of bacteria grows exponentially in discrete generations, and cells
mutate with probability μ = 10−7 per cell per replication. When the population size reaches
107, an antibiotic is introduced; this causes all phenotypically sensitive bacteria to die, leaving
only the phenotypically resistant cells (Fig 3b). We are interested in the probability that the
bacterial infection survives the antibiotic treatment, a concept closely related to evolutionary
rescue probability, i.e., the probability that cells can survive a sudden environmental change
thanks to an adaptive mutation [31, 63, 64]. Since sensitive cells do not reproduce in our simu-
lations in the presence of the antibiotic, survival can only be due to pre-existing mutations
(standing genetic variation).
We first consider the effective polyploidy model, with ploidy c controlled by the doubling
time td. In agreement with Sun et al. [31], we find that td has no effect on the survival probabil-
ity (Fig 3c). This is due to a cancellation of two effects: the increased number of gene copies
increases the per-cell chance of genetic mutation, but also increases the length of the pheno-
typic delay (see Section 2.2.1 of the SI of Ref. [31] for a mathematical derivation). In contrast,
phenotypic delay caused by the dilution of sensitive molecules does affect the survival proba-
bility (Fig 3d). The survival probability strongly depends on n, and decreases significantly
from 0.69 for n = 0 to 0.06 for n = 100.
We also simulated the mixed case where both the effective polyploidy and dilution mecha-
nisms are combined, with ploidy c and molecule number n determined by the doubling time tdas described in Sec. Combining effective polyploidy and dilution. In this case the survival proba-
bility does depend on the doubling time (Fig 3e; blue line). This is mostly caused by the change
in the molecular number n as a function of doubling time. If we neglect the dependence of non td, the effect is much smaller, although there is still some dependence on td because the rate
of resistant protein production depends on the resistant gene copy number, which increases
en route to the full suite of resistant chromosomes (S4 Fig).
PLOS COMPUTATIONAL BIOLOGY Phenotypic delay in the evolution of antibiotic resistance
PLOS Computational Biology | https://doi.org/10.1371/journal.pcbi.1007930 May 29, 2020 9 / 24

Phenotypic delay due to dilution changes the Luria-Delbruck distribution
and biases mutation rate estimates
The scenario discussed in the previous section is equivalent to the Luria-Delbruck fluctuation
test [29, 65], which has been extensively studied theoretically [45, 66–73]. In the fluctuation
test, a small number of sensitive bacteria are allowed to grow until the population reaches a
certain size. The cells are then plated on a selective medium (often an antibiotic) to reveal the
number of mutated bacteria in the population. The distribution of the number of mutants
(measured over replicate experiments) is termed the Luria-Delbruck distribution. This distri-
bution has a power-law tail caused by mutational “jackpot” events [29, 65, 72] in which rare,
early-occurring mutants produce many descendants in the population. The fluctuation test,
fitted to corresponding mathematical models, is widely used to estimate mutation rates in bac-
teria. Here, we discuss the effect of phenotypic delay on the Luria-Delbruck distribution and
on the resulting mutation rate estimate.
Fig 3. Phenotypic delay decreases the probability of a bacterial infection surviving antibiotic treatment. (a-b) A
schematic of the simulated infection: a population of exponentially replicating sensitive cells is exposed to an antibiotic
when the population reaches 107 cells. Only phenotypically resistant cells survive the antibiotic. Time and antibiotic
concentration in panel (b) have arbitrary units. (c) The probability of survival for the effective polyploidy mechanism is
independent of the doubling time (and hence the ploidy). (d) For the dilution mechanism, the probability of survival
decreases with the number of molecules n which need to be diluted out before the cell becomes phenotypically
resistant. (e) In a combined dilution-and-effective polyploidy model, the survival probability increases with the
doubling time.
https://doi.org/10.1371/journal.pcbi.1007930.g003
PLOS COMPUTATIONAL BIOLOGY Phenotypic delay in the evolution of antibiotic resistance
PLOS Computational Biology | https://doi.org/10.1371/journal.pcbi.1007930 May 29, 2020 10 / 24
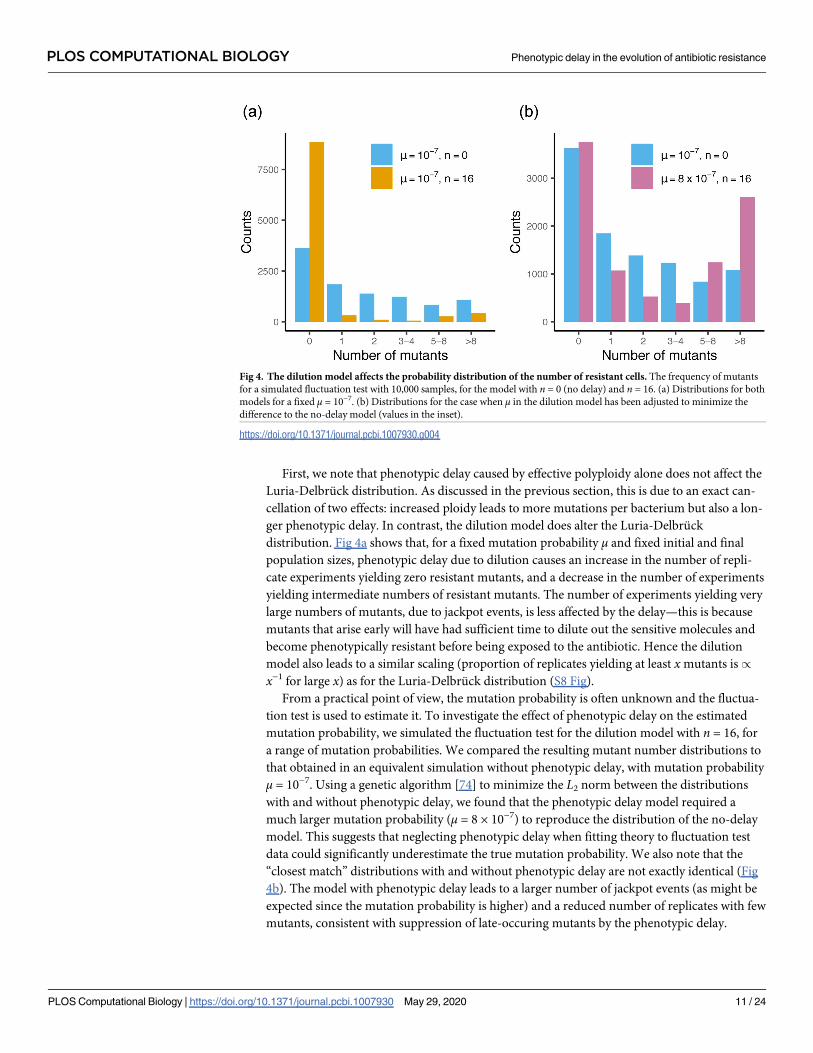
First, we note that phenotypic delay caused by effective polyploidy alone does not affect the
Luria-Delbruck distribution. As discussed in the previous section, this is due to an exact can-
cellation of two effects: increased ploidy leads to more mutations per bacterium but also a lon-
ger phenotypic delay. In contrast, the dilution model does alter the Luria-Delbruck
distribution. Fig 4a shows that, for a fixed mutation probability μ and fixed initial and final
population sizes, phenotypic delay due to dilution causes an increase in the number of repli-
cate experiments yielding zero resistant mutants, and a decrease in the number of experiments
yielding intermediate numbers of resistant mutants. The number of experiments yielding very
large numbers of mutants, due to jackpot events, is less affected by the delay—this is because
mutants that arise early will have had sufficient time to dilute out the sensitive molecules and
become phenotypically resistant before being exposed to the antibiotic. Hence the dilution
model also leads to a similar scaling (proportion of replicates yielding at least xmutants is/
x−1 for large x) as for the Luria-Delbruck distribution (S8 Fig).
From a practical point of view, the mutation probability is often unknown and the fluctua-
tion test is used to estimate it. To investigate the effect of phenotypic delay on the estimated
mutation probability, we simulated the fluctuation test for the dilution model with n = 16, for
a range of mutation probabilities. We compared the resulting mutant number distributions to
that obtained in an equivalent simulation without phenotypic delay, with mutation probability
μ = 10−7. Using a genetic algorithm [74] to minimize the L2 norm between the distributions
with and without phenotypic delay, we found that the phenotypic delay model required a
much larger mutation probability (μ = 8 × 10⁻⁷) to reproduce the distribution of the no-delay
model. This suggests that neglecting phenotypic delay when fitting theory to fluctuation test
data could significantly underestimate the true mutation probability. We also note that the
“closest match” distributions with and without phenotypic delay are not exactly identical (Fig
4b). The model with phenotypic delay leads to a larger number of jackpot events (as might be
expected since the mutation probability is higher) and a reduced number of replicates with few
mutants, consistent with suppression of late-occuring mutants by the phenotypic delay.
Fig 4. The dilution model affects the probability distribution of the number of resistant cells. The frequency of mutants
for a simulated fluctuation test with 10,000 samples, for the model with n = 0 (no delay) and n = 16. (a) Distributions for both
models for a fixed μ = 10−7. (b) Distributions for the case when μ in the dilution model has been adjusted to minimize the
difference to the no-delay model (values in the inset).
https://doi.org/10.1371/journal.pcbi.1007930.g004
PLOS COMPUTATIONAL BIOLOGY Phenotypic delay in the evolution of antibiotic resistance
PLOS Computational Biology | https://doi.org/10.1371/journal.pcbi.1007930 May 29, 2020 11 / 24

Our result could explain an apparent discrepancy between mutation probabilities estimated
by different methods. In particular, Lee et al. measured the mutation probability of E. coliusing both fluctuation tests (with the fluoroquinolone nalidixic acid as selective agent) and
whole-genome sequencing [46]. The fluctuation test underestimated the mutation probability
by a factor of 9.5; Lee et al. suggested that this could be caused by phenotypic delay [46]. To see
whether our dilution model could explain this, we simulated the 40-replicate, 20 generation
fluctuation test experiment of Lee et al. [46], using the mutation probability as estimated by
whole-genome sequencing (μ = 3.98 × 10⁻⁹, total for all mutations producing sufficient resis-
tance to nalidixic acid), for differing values of the number n of target “units” (“effective” gyrase
molecules). For each n we simulated 1000 realisations of the 40-replicate experiment, and for
each realisation we estimated the mutation probability under the no-delay model using the
maximum likelihood method [45] (the same as used by Lee et al.) implemented in the package
flan [75]. This procedure correctly reproduced the mutation probability for data from simula-
tions without delay (n = 0; S6 Fig). For the model with delay, the maximum likelihood fit
returned a mutation probability that was lower than the true one (Fig 5a); the discrepancy
increased with the phenotypic delay. To obtain an apparent mutation probability that is under-
estimated by a factor of 9.5, as observed by Lee et al. [46], we require n� 30; i.e. roughly 30
sensitive ‘units’ of the antibiotic target must be diluted out before a cell becomes phenotypi-
cally resistant. Thus, while our simulations do not prove that phenotypic delay is responsible
for the discrepancy observed by Lee et al., they suggest that it is a plausible explanation.
Mutant number distributions may support the existence of phenotypic
delay
Our results suggest that a phenotypic delay caused by dilution produces a characteristic
(though small) change in the shape of the observed mutant number distribution (Fig 4b). This
deviation should, in principle be detectable in experiments. To check this, we used the dataset
of Boe et al. [47] who performed a 1104-replicate fluctuation test, using the bacterium E. coliwith the fluoroquinolone antibiotic nalidixic acid as the selective agent. Nalidixic acid targets
DNA gyrase. As explained in Sec. Combining effective polyploidy and dilution, we expect that a
small number of wild-type DNA gyrases should be enough for a bacterial cell to be sensitive to
the antibiotic, suggesting that phenotypic delay via gyrase dilution may be likely. Boe et al. [47]
report an unsatisfactory fit of their mutant number distribution data to the theoretical predic-
tions of two different variants of the Luria-Delbruck model (the Lea-Coulson and Haldane
models); in comparison to these models, Boe et al. observed too many experiments yielding
either no mutants or a high number of mutants (greater than 16), and a dearth of experiments
resulting in intermediate mutant counts (1-16). Qualitatively, this seems to be consistent with
our expectations for the dilution model (Fig 4).
To see if the dilution model of phenotypic delay indeed provides a superior fit to Boe et al’s
data, we used an approximate Bayesian computation (ABC) approach [76] (Methods). We
simulated a 1104-replicate fluctuation experiment 104 times, for the models with and without
delay, with initial and final population sizes of 1.2 × 10⁴ and 1.2 × 10⁹ matching those of Boe
et al. [47]. We then determined the posterior Bayesian probability that the experimental data is
generated by the delay model as opposed to the no-delay model, and tested the validity of our
approach using synthetic data (Methods and models). We find that the probability of the
experimental data coming from the model with phenotypic delay is 0.97, as opposed to the
model without phenotypic delay (Fig 5b). We thus conclude that the Boe et al. data supports
the existence of phenotypic delay caused by the dilution mechanism.
PLOS COMPUTATIONAL BIOLOGY Phenotypic delay in the evolution of antibiotic resistance
PLOS Computational Biology | https://doi.org/10.1371/journal.pcbi.1007930 May 29, 2020 12 / 24

Discussion
Quantitative models for de novo evolution of drug resistance are an important tool in tackling
bacterial antimicrobial resistance, as well as viral infections and cancer. However, our quanti-
tative understanding of how resistance emerges is still limited. The possibility of a phenotypic
delay between the occurrence of a genetic mutation and its phenotypic expression has long
been discussed [25–29], but its relevance for bacterial evolution has been questioned until
recently [31]. Here, we have used computer simulations and theory to study the effects of phe-
notypic delay on the emergence of bacterial resistance to antibiotics. We investigated three dif-
ferent mechanisms that could lead to phenotypic delay: (i) dilution of antibiotic-sensitive
molecules, (ii) effective polyploidy, and (iii) accumulation of resistance-enhancing molecules.
We observe that the third mechanism only leads to phenotypic delay under a limited range of
parameters, which makes it unlikely to be biologically relevant. The other two mechanisms
have different “control parameters” (the degree of ploidy c versus the number of target mole-
cules n) and different effects on the population dynamics. In particular, we show that protein
dilution, but not effective polyploidy, can affect the probability that a growing population sur-
vives antibiotic treatment. This in turn can bias the estimated mutation rate in a Luria-Del-
bruck fluctuation test. Effective polyploidy does not play a role here because of two cancelling
effects: increased ploidy increases the number of mutations per cell in the growing population,
but also increases the length of the phenotypic delay. These effects counterbalance such that
the Luria-Delbruck distribution remains unaffected [31].
Effect of the dilution mechanism on the lineage/population survival
probability
We have shown that the various mechanisms affect the survival of whole populations, and of
random lineages, in different ways. In the case of effective polyploidy, the duration of the phe-
notypic lag is the same for a random lineage as it is for the entire population. However, only
Fig 5. Phenotypic delay due to the dilution mechanism explains observed discrepancy in mutation rates and provides superior fit
to fluctuation experiment data. (a) We simulated the fluctuation experiment of Ref. [46], where the authors report a factor of 9.5
difference between the values of μ obtained by DNA sequencing and fluctuation tests. For each n we simulated 1000 experiments with
the sequencing-derived mutation probability μ = 3.98 × 10⁻⁹ and then used the same estimation procedure as Ref. [46] to infer μassuming no delay exists. n = 30 sensitive molecules are required to account for the discrepancy observed. Error bars are 1.96 × standard
error. (b) The experimental cumulative mutant frequency distribution reported by Boe et al. [47] (black points) and the best-fit
simulated distribution (green line) for the dilution phenotypic delay model. The staircase-like shape of the simulated distribution is
caused by the fixed division time and strictly synchronous division of the mutated cells. (c) Histograms of the probability of the delay
model obtained by applying the approximate Bayesian computation scheme to simulated data. Our classification algorithm correctly
discriminates between the models.
https://doi.org/10.1371/journal.pcbi.1007930.g005
PLOS COMPUTATIONAL BIOLOGY Phenotypic delay in the evolution of antibiotic resistance
PLOS Computational Biology | https://doi.org/10.1371/journal.pcbi.1007930 May 29, 2020 13 / 24

one in c lineages becomes resistant and can survive antibiotic treatment. In contrast, in the
dilution mechanism every lineage becomes resistant and survives, as long as the time before
antibiotic exposure is much longer than the phenotypic lag. However, the length of the pheno-
typic lag for each lineage is now a random variable. The time to resistance at the population
level is thus determined by the shortest phenotypic lag among all the lineages.
Effect of the dilution mechanism on fluctuation test data
Luria-Delbruck fluctuation tests remain the standard microbiological method for estimating
mutation rates, yet it has often been noted that the measured distributions of mutant numbers
are not precisely fit by the theoretical distribution [26, 29, 30, 47]. A comparison with a more
direct approach (DNA sequencing) suggests that fluctuation tests can significantly underesti-
mate mutation rates [46]. Although phenotypic delay has been suggested as a possible explana-
tion for these effects [29, 46], our study is the first to investigate in detail how specific
mechanisms of phenotypic delay alter the shape of the Luria-Delbruck distribution, and to
demonstrate that it can indeed produce a mutation rate estimate that is biased in the same way
as that observed experimentally [46]. We also show that the simulated distribution of mutant
numbers from the dilution model fits the experimental fluctuation test data of Boe et al. [47]
better than the standard model without phenotypic delay. We note that this result should how-
ever be taken cautiously. Boe et al.’s experimental protocol is not ideal for detecting phenotypic
delay: for example, their bacterial cultures were allowed to reach stationary phase before plat-
ing. Moreover, our work shows that while phenotypic delay due to dilution affects the mutant
number distribution, the change is subtle, requiring many replicate experiments to produce
statistically significant results. While the usual number of replicates in a fluctuation test is less
than 100, recent developments in automated culture methods should make it possible to run
fluctuation tests with many more replicates, which may provide a way to probe the effects of
phenotypic delay on the Luria-Delbruck distribution in more detail.
From molecular detail to evolutionary population dynamics
Our work presents an example of how molecular details at the intracellular level (here, protein
dilution and the details of DNA replication) can have a direct effect on evolution at the popula-
tion level [77–79]. This observation complements other work showing, for example, that
molecular processes such as transcription and translation affect population-level distributions
of protein numbers [80, 81] and that noise in gene expression can directly affect the survival of
populations in a fluctuating environment [82].
Importantly, both the effective polyploidy mechanism and the dilution mechanism cause a
phenotypic delay only if the resistance mutation is recessive. For effective polyploidy this
means that a cell must contain only resistant alleles in order to be phenotypically resistant,
while for the dilution mechanism we have assumed that sensitive target molecules need to be
diluted out (or otherwise removed). This implies that we would expect to see phenotypic delay
in the evolution of resistance to some antibiotics, but not to others. In particular, we would
expect phenotypic delay due to dilution if the antibiotic acts by binding to its molecular target
to make a toxic adduct, and resistance involves production of a resistant target. This is the case
for fluoroquinolone antibiotics, which bind to DNA gyrase, causing DNA double-strand
breaks (Table 1); resistance is caused by production of mutant gyrase with lower affinity to the
antibiotic [83]. The fact that both Boe et al. [47] and Lee et al. [46] observed discrepancies in
fluctuation test data for resistance to the fluoroquinolone nalidixic acid is consistent with this
expectation.
PLOS COMPUTATIONAL BIOLOGY Phenotypic delay in the evolution of antibiotic resistance
PLOS Computational Biology | https://doi.org/10.1371/journal.pcbi.1007930 May 29, 2020 14 / 24

Assumptions of the model
Our simulations and theoretical calculations have involved a number of simplifying assump-
tions. Firstly, we ignore any possible fitness costs of mutations, assuming equal growth rates
for wild-type and mutant cells in the absence of the antibiotic. While resistance mutations can
incur a fitness cost [84, 85], many clinically-relevant mutations have either no cost or even pro-
vide a small growth advantage [85, 86].
For the molecular dilution mechanism, we have assumed that the degradation rate of target
molecules is negligible, so that sensitive molecules can only be removed through cell division
and dilution. While this seems to be (mostly) the case for bacterial enzymes targeted by antibi-
otics [87, 88], it may not be true for mammalian cells in which degradation plays a bigger role
than dilution [89].
We have also assumed here that in the dilution mechanism, all sensitive molecules need to
be removed for the cell to become phenotypically resistant, and that each cell has initially the
same number of sensitive molecules. In reality, resistance is likely to gradually increase as the
number of sensitive molecules decreases, and the total number of target molecules may vary
among different cells. Our general conclusions remain valid in this case, but the mutant distri-
bution may change. To construct more accurate models, we need measurements of the degree
of antibiotic sensitivity as a function of the intracellular numbers of resistant and sensitive
antibiotic targets. While technically challenging, such measurements could be carried out e.g.
by fluorescent labelling of target molecules [57]. A starting point for such a detailed model
could be to assume the production of sensitive molecules follows the model for protein pro-
duction of the accumulation mechanism. The value of n per cell would then depend on the
number of molecules at the time of mutation, which fluctuates around the mean number of
molecules produced per cell division (S1 Text, Section 1.2).
Experimental tests for phenotypic delay
Sun et al. have demonstrated phenotypic delay by tracking expression of a genetically engi-
neered fluorescent marker in bacterial lineages, and they attributed it to polyploidy [31]. How-
ever, their work did not involve de novomutations. Detecting and explaining the mechanism
of phenotypic lag due to spontaneous mutations would be much more challenging. Our work
suggests that, at least in principle, the mutant number distribution obtained in fluctuation tests
could be used to detect the existence of a phenotypic delay caused by molecular dilution,
although this would require many replicate experiments. Another possible method could rely
on differences in the probability and timing of phenotypic resistance in random lineages. A
mother-machine type of experiment in which many lineages can be tracked and exposed to an
antibiotic at controlled times could help to determine the contribution of different mecha-
nisms to phenotypic lag. Yet another approach would be an experiment similar to the thought
experiment from Fig 1, in which a mutagen such as UV irradiation creates a burst of mutants.
Other signatures of phenotypic delay may be detected in experiments where the timing of anti-
biotic exposure, and of resistance evolution, can be precisely controlled, for example in turbi-
dostat-like continuous culture devices [90].
Broader significance of phenotypic delay
We have shown here that phenotypic delay (caused by molecular dilution) can affect mutation
rate estimates from fluctuation tests, as well as the probability that a bacterial infection survives
antibiotic treatment. Phenotypic delay may also affect other processes. For example, it was
recently shown that a delay in evolutionary adaptation can lead to coexistence of spatial popu-
lations, in cases where immediate adaptation would eradicate coexistence [91, 92]. A delay in
PLOS COMPUTATIONAL BIOLOGY Phenotypic delay in the evolution of antibiotic resistance
PLOS Computational Biology | https://doi.org/10.1371/journal.pcbi.1007930 May 29, 2020 15 / 24

evolutionary adaptation has also been postulated to explain the effect of antibiotic pulses of dif-
ferent lengths on the probability of resistance emerging [93]. Thus, mechanistic understanding
of phenotypic delay may be of broad relevance in bacterial evolution.
Methods and models
In all our simulations we use an agent-based model to simulate how mutated cells gain pheno-
typic resistance. Each cell has a number of attributes depending on the studied mechanism,
such as the numbers of sensitive and mutated DNA copies, and the numbers of sensitive and
resistant proteins, as specified below. Cells divide after time td since last division.
In our population-level simulations (sectionModelling the emergence of phenotypic delay),we simulate 100 cells which have just become genetically resistant. Population-level simula-
tions are repeated 1,000 times and single-cell simulations are repeated 10,000 times.
Modelling effective polyploidy
To describe how the copy number (ploidy) c changes during cell growth and division we use
the Cooper-Helmstetter model [32]. We assume that it takes t1 = 40 min for a DNA replication
fork to travel from the origin of replication to the replication terminus, and that the cell divides
t2 = 20 min after DNA replication termination (t1 = C and t2 = D in the original nomenclature
of Ref. [32]; values representative for Escherichia coli strain B/r). During balanced (“steady
state”) growth assumed in this work, the number of chromosomes must double during the
time td between cell divisions (population doubling time). This means that for any td< t1 +
t2 = 60 min, the cell must have multiple replication forks and more than one copy of the chro-
mosome. The number of chromosomes will change during cell growth: it will double some
time before division, and halve just after the division. If tini is the time, since the last division,
at which new replication forks are initiated, we must have ((tini + t1) mod td = td − t2). This
equation states that the time when a replication round, initiated in the parent cell, finishes in
the offspring cell ((tini + t1) mod td) must be the same as the time td − t2 when the cell division
process (lasting t2 min) is initiated. It can be shown that this gives (tini = td − (t1 + t2) mod td).We proceed in a similar way to determine the time trep at which a gene which confers resis-
tance is replicated. If the gene is located in the middle of the genome, as is the case for the gyrAgene relevant for fluoroquinolone resistance, it will be copied t1/2 minutes after chromosome
replication initiation. This implies that
trep ¼ td � t2 þt12
� �
mod td
� �
: ð2Þ
At this time point during the cell cycle the copy number of the gene of interest will double.
The effective polyploidy immediately after this event is maximal and equal to
c ¼ 2dt1=2þt2tde; ð3Þ
where d. . .e denotes the ceiling function. We use c from Eq (3) as the control variable in simu-
lations of the polyploidy model.
To simulate a cell or a population of cells with effective polyploidy we use the following
algorithm. We initialize the simulation with all cells having c/2 sensitive alleles. Cells replicate
in discrete generations every td minutes. The number of allele copies doubles at trep (Eq (2))
since the last division in such a way that a sensitive/resistant allele gives rise to a sensitive/resis-
tant copy, respectively. Sensitive alleles have a probability μ of mutating to a resistant allele.
When a cell divides, the copies are split between the two daughter cells, with those linked by
PLOS COMPUTATIONAL BIOLOGY Phenotypic delay in the evolution of antibiotic resistance
PLOS Computational Biology | https://doi.org/10.1371/journal.pcbi.1007930 May 29, 2020 16 / 24

the most recent replication fork ending up in the same cell. We assume that the resistance
mutation is recessive, which implies that a cell becomes resistant when all of its gene copies are
resistant.
Modelling the dilution of sensitive molecules
For the dilution mechanism, we track the number of sensitive target molecules in each cell.
We assume that at time zero, all cells have n sensitive target molecules and no resistant ones.
When a mutation happens, we suppose that the mutated cell begins to produce resistant target
molecules and ceases to produce new sensitive molecules. At cell division, the sensitive mole-
cules are partitioned between the two daughter cells following a binomial distribution with
probability 0.5. We consider that a cell becomes phenotypically resistant when it contains no
sensitive molecules. In S1 Text we relax this assumption and study the case where a cell is con-
sidered resistant when the number of sensitive molecules falls below a (non-zero) threshold
value (S5 Fig).
Modelling the accumulation of resistance-enhancing molecules
To model the accumulation of resistance-enhancing molecules, we explicitly simulate the pro-
duction ofMp resistance-enhancing molecules per cell cycle and their stochastic division
between daughter cells, via a binomial distribution, at cell division. A cell is considered resis-
tant when it contains more thanMr resistance-enhancing molecules. In all simulations we fix
Mr = 1000 and varyMp to explore a range ofm ¼ MpMr
between 0.1 and 2.
Combining effective polyploidy and molecular dilution
To include both effective polyploidy and molecular dilution, we track explicitly the total
gene copies, the resistant gene copies and the number of sensitive proteins, as explained in
Secs. Modelling effective polyploidy and Modelling the dilution of sensitive molecules. We
assume that the number of resistant proteins produced in one cell cycle is proportional
to the ratio of resistant to total gene copies. Both types of proteins (sensitive and resistant)
are partitioned at cell division following a binomial distribution with probability 0.5. We
consider that a cell becomes phenotypically resistant when it contains no sensitive
molecules.
Simulating a growing infection
We start our simulations with 100 sensitive bacteria. Bacteria reproduce in discrete generations
with doubling time td. Upon reproduction, each bacterium can mutate with probability μ =
10−7. When the population reaches 107 cells, all phenotypically sensitive cells are removed
(killed); this represent antimicrobial therapy. We repeat the simulation 1000 times to obtain
the survival probability as a fraction of simulations in which phenotypically resistant cells
emerge before the population dies out.
Simulating Luria-Delbruck fluctuation tests
To generate mutant size distributions for realistically large population sizes of sensitive cells
required for comparing the model with experimental data, we use an algorithm based on Cin-
lar’s method [94, 95]. The algorithm does not simulate the sensitive population explicitly, but
it generates a set of times {ti} at which mutants emerge from the exponentially growing sensi-
tive population:
PLOS COMPUTATIONAL BIOLOGY Phenotypic delay in the evolution of antibiotic resistance
PLOS Computational Biology | https://doi.org/10.1371/journal.pcbi.1007930 May 29, 2020 17 / 24

Algorithm 1:1 Initialize t = 0, s = 0 ti = [];2 while t � tf do3 s s − log(U(0, 1));
4 t 1
lslog 1� m
mNisþ 1
� �;
5 ti.extend(t)6 end7 return ti
Here tf ¼lnðNf =NiÞ
lsis the final time, Nf is the final population size, Ni is the initial population
size, ls ¼lnð2Þtdð1 � mÞ is the growth rate of the sensitive bacteria, td is the doubling time, μ is
the mutation probability and U(0, 1) is a random variable uniformly distributed between 0 and
1. Formally, {ti} are the times generated from a Poisson process over the interval [0, tf] with
rate ðmlselsð1� mÞtÞ0�t�tf .
For each ti, we then calculate the number of generations until the final time tf as
gi ¼tf � titd
: ð4Þ
For all of the simulations in sections Phenotypic delay due to dilution changes the Luria-Del-brück distribution and biases mutation rate estimates andMutant number distributions maysupport the existence of phenotypic delay, we assume td = 60 min. We then simulate each clone
for gi generations, including dilution of sensitive target molecules, and measure the number of
resistant cells for each clone. Finally, we measure the number of resistant cells for each repli-
cate by summing up over all clones.
Approximate Bayesian computation
We use an approximate Bayesian computation method to determine the posterior probabilities
of the non-delay and the dilution model. Briefly, the method relies on generating many (here:
104) independent samples of the simulated experiment mimicking Boe et al. [47] for both
models. Model parameters are sampled from suitable prior distributions, we then select sam-
ples that approximate well the real data, and calculate the fraction of best-fit samples corre-
sponding to each model.
A single sample corresponds to 1104 simulated replicates of the fluctuation experiment at
fixed parameters, for a given model. For each sample, parameters are randomly chosen from
the following prior distributions: log10(μ) uniform on [−10, −8], and log2(n) uniform on [0, 8]
(for the delay model). The tail cumulative mutation function
FðkÞ ¼ Number of experiments yielding � k mutants; 0 � k � 513; ð5Þ
is calculated for each sample i (Fi), and also for the experimental data from Boe et al. [47]
(Fobs). F is undefined for k� 514 as the authors of [47] grouped replicates yielding more than
512 mutants. We then select 100 out of the 2 × 10⁴ (104 from each model) generated samples
with the smallest Euclidean distance ||Fi − Fobs||2 (simulated distributions closest to the experi-
mental data). The proportion of these which come from the phenotypic delay model is an
approximation of the posterior probability that the experimental data was generated by the
delay model (under the assumption that the experimental data was generated by one of the
models). In reality the data generation process is likely to be far more complex than our ideal-
ised models, but the posterior probability of 0.97 implies the delay model provides a superior
explanation compared with the model with no delay.
PLOS COMPUTATIONAL BIOLOGY Phenotypic delay in the evolution of antibiotic resistance
PLOS Computational Biology | https://doi.org/10.1371/journal.pcbi.1007930 May 29, 2020 18 / 24

To examine the validity of our approach, we performed cross validation. For each model we
randomly chose one sample corresponding to that model. We then computed the probability
the simulated data was generated by the model with phenotypic delay, via the approximate
method detailed above. This was carried out 500 times for each model. The proportion of sim-
ulations that were misclassified (as being with delay when they were not, or vice versa) was low
(0.007, Fig 5c), showing that our model selection framework is able to discriminate between
the two models. We provide a further sensitivity analysis of this inference method in S1 Text,
Section 7.
Supporting information
S1 Text. Supplementary information. Mathematical derivations, additional model variants,
sensitivity analysis.
(PDF)
S1 Table. Numerical values used to generate all graphs. An Excel spreadsheet with multiple
tabs, each corresponding to a single figure.
(XLSX)
S1 Fig. Single-lineage probability of developing resistance. (a) We follow a single bacterium
which has just mutated and has the resistant allele in one of its chromosomes. When it divides,
we choose one of the two daughter cells at random. After a few generations, this cell can
become phenotypically resistant. (b) The probability of the cell being resistant as a function of
the number of generations from the genetic mutation for the dilution mechanism (dots: simu-
lation, lines: theory Eq (S1)). (c) Same as (b) for the effective polyploidy mechanism. (d) Same
as (b) for the accumulation mechanism (only simulations).
(TIF)
S2 Fig. Expected number of generations until a phenotypically resistant cell emerges. We
start with x = 100 cells that just mutated, and repeat the simulation 500 times for each data
point. “Analytic approximation” refers to Eq (S6).
(TIF)
S3 Fig. Biasing the segregation of sensitive molecules at division leads to a decrease in the
phenotypic delay both at the (a) single-cell and (b) population level. Blue curve represents
an unbiased case (p = 0.5), orange curves is the biased case (p = 0.62). In all cases, n = 1000.
(TIF)
S4 Fig. Effect of dependence of the number of target molecules on the doubling time td for
the combined model. (a) Probability of resistance as a function of time (generations) for dif-
ferent doubling times (determined by ploidy c) when the number of target molecules ndepends on td. (b) Same as (a) but for the model in which n does not depend on td. (c) Proba-
bility of survival for a simulated infection (see section 2.3 and Fig 3 in the main text) for a com-
bined model when the number of target molecules depends on the growth rate. (d) Same as
(c) but for the model in which n does not depend on td.(TIF)
S5 Fig. A partial dilution mechanism decreases the phenotypic delay. (a) Single-cell and
(b) population level simulated experiments as a function of nr, the number of sensitive mole-
cules allowed for resistance to emerge. In all cases, the total number of molecules n = 1000.
(TIF)
PLOS COMPUTATIONAL BIOLOGY Phenotypic delay in the evolution of antibiotic resistance
PLOS Computational Biology | https://doi.org/10.1371/journal.pcbi.1007930 May 29, 2020 19 / 24

S6 Fig. Maximum likelihood estimates of μ from 1000 simulations mimicking the experi-
ment of Ref. [46] with known μ = 3.98 × 10⁻⁹ (black vertical line) for the no-delay model.
The mutation probability can be underestimated by a factor of 2 (95% of simulations yielded
estimates between red vertical lines), whereas Ref. [46] reports a factor of 9.5 difference
between μ obtained from DNA sequencing and fluctuation tests. The Lee et al. result [46] can-
not be thus explained by the no-delay model.
(TIF)
S7 Fig. Sensitivity analysis for model selection. (a) The probability of the Boe et al. data [47]
coming from the delay model as a function of the number of simulation runs. The runs were
randomly sampled from the original bank of simulations and the probability of the delay
model was estimated. The process was repeated 10 times. Error bars are the maximum and
minimum probability estimated, with the centred dot as the mean. (b) The probability estimate
for the probability of the data [47] coming from the delay model as a function of Nthresh.
(TIF)
S8 Fig. Full distribution for the Luria-Delbruck simulations of the dilution model pre-
sented in Fig 4 in the main text. a) Distributions for both models for a fixed μ = 10−7. (b) Dis-
tributions for the case when μ in the dilution model has been adjusted to minimize the
difference to the no-delay model.
(TIF)
Acknowledgments
We thank Helen Alexander (University of Edinburgh) for helpful discussions.
Author Contributions
Conceptualization: Martın Carballo-Pacheco, Michael D. Nicholson, Elin E. Lilja, Rosalind J.
Allen, Bartlomiej Waclaw.
Data curation: Martın Carballo-Pacheco, Michael D. Nicholson.
Formal analysis: Martın Carballo-Pacheco, Michael D. Nicholson.
Funding acquisition: Rosalind J. Allen, Bartlomiej Waclaw.
Investigation: Martın Carballo-Pacheco, Michael D. Nicholson.
Methodology: Martın Carballo-Pacheco, Michael D. Nicholson, Bartlomiej Waclaw.
Project administration: Rosalind J. Allen, Bartlomiej Waclaw.
Resources: Rosalind J. Allen, Bartlomiej Waclaw.
Software: Martın Carballo-Pacheco, Michael D. Nicholson.
Supervision: Rosalind J. Allen, Bartlomiej Waclaw.
Validation: Martın Carballo-Pacheco, Michael D. Nicholson.
Visualization: Martın Carballo-Pacheco, Michael D. Nicholson.
Writing – original draft: Martın Carballo-Pacheco, Michael D. Nicholson.
Writing – review & editing: Martın Carballo-Pacheco, Michael D. Nicholson, Elin E. Lilja,
Rosalind J. Allen, Bartlomiej Waclaw.
PLOS COMPUTATIONAL BIOLOGY Phenotypic delay in the evolution of antibiotic resistance
PLOS Computational Biology | https://doi.org/10.1371/journal.pcbi.1007930 May 29, 2020 20 / 24

References1. Holohan C, Van Schaeybroeck S, Longley DB, Johnston PG. Cancer drug resistance: an evolving para-
digm. Nat Rev Cancer. 2013; 13:714–726. https://doi.org/10.1038/nrc3599
2. Hill AL, Rosenbloom DIS, Nowak MA, Siliciano RF. Insight into treatment of HIV infection from viral
dynamics models. Immunol Rev. 2018; 285(1):9–25. https://doi.org/10.1111/imr.12698
3. Brown ED, Wright GD. Antibacterial drug discovery in the resistance era. Nature. 2016; 529:336–343.
https://doi.org/10.1038/nature17042
4. Lieberman TD, Flett KB, Yelin I, Martin TR, McAdam AJ, Priebe GP, et al. Genetic variation of a bacte-
rial pathogen within individuals with cystic fibrosis provides a record of selective pressures. Nat Genet.
2014; 46:82–87. https://doi.org/10.1038/ng.2848 PMID: 24316980
5. van Hal SJ, Steen JA, Espedido BA, Grimmond SM, Cooper MA, Holden MTG, et al. In vivo evolution of
antimicrobial resistance in a series of Staphylococcus aureus patient isolates: the entire picture or a
cautionary tale? J Antimicrob Chemother. 2014; 69(2):363–367. https://doi.org/10.1093/jac/dkt354
PMID: 24047554
6. Mwangi MM, Wu SW, Zhou Y, Sieradzki K, de Lencastre H, Richardson P, et al. Tracking the in vivo
evolution of multidrug resistance in Staphylococcus aureus by whole-genome sequencing. Proc Natl
Acad Sci USA. 2007; 104(22):9451–9456. https://doi.org/10.1073/pnas.0609839104 PMID: 17517606
7. Wong A, Kassen R. Parallel evolution and local differentiation in quinolone resistance in Pseudomonas
aeruginosa. Microbiology. 2011; 157(4):937–944. https://doi.org/10.1099/mic.0.046870-0
8. Smith EE, Buckley DG, Wu Z, Saenphimmachak C, Hoffman LR, D’Argenio DA, et al. Genetic adapta-
tion by Pseudomonas aeruginosa to the airways of cystic fibrosis patients. Proc Natl Acad Sci USA.
2006; 103(22):8487–8492. https://doi.org/10.1073/pnas.0602138103 PMID: 16687478
9. Lieberman TD, Michel JB, Aingaran M, Potter-Bynoe G, Roux D, Davis MR Jr, et al. Parallel bacterial
evolution within multiple patients identifies candidate pathogenicity genes. Nat Genet. 2011; 43:1275–
1280. https://doi.org/10.1038/ng.997 PMID: 22081229
10. Zhang Q, Lambert G, Liao D, Kim H, Robin K, Tung CK, et al. Acceleration of emergence of bacterial
antibiotic resistance in connected microenvironments. Science. 2011; 333(6050):1764–1767. https://
doi.org/10.1126/science.1208747 PMID: 21940899
11. Toprak E, Veres A, Michel JB, Chait R, Hartl DL, Kishony R. Evolutionary paths to antibiotic resistance
under dynamically sustained drug selection. Nat Genet. 2012; 44:101–105. https://doi.org/10.1038/ng.
1034
12. Salverda MLM, Dellus E, Gorter FA, Debets AJM, van der Oost J, Hoekstra RF, et al. Initial mutations
direct alternative pathways of protein evolution. PLoS Genet. 2011; 7(3):e1001321. https://doi.org/10.
1371/journal.pgen.1001321 PMID: 21408208
13. de Visser JAGM, Krug J. Empirical fitness landscapes and the predictability of evolution. Nat Rev
Genet. 2014; 15:480–490. https://doi.org/10.1038/nrg3744
14. MacLean RC, Hall AR, Perron GG, Buckling A. The population genetics of antibiotic resistance: inte-
grating molecular mechanisms and treatment contexts. Nat Rev Genet. 2010; 11:405–414. https://doi.
org/10.1038/nrg2778
15. Lukačisinova M, Bollenbach T. Toward a quantitative understanding of antibiotic resistance evolution.
Curr Opin Biotechnol. 2017; 46:90–97. https://doi.org/10.1016/j.copbio.2017.02.013
16. Allen R, Waclaw B. Antibiotic resistance: a physicist’s view. Phys Biol. 2016; 13(4):045001. https://doi.
org/10.1088/1478-3975/13/4/045001
17. Waclaw B, Bozic I, Pittman ME, Hruban RH, Vogelstein B, Nowak MA. A spatial model predicts that dis-
persal and cell turnover limit intratumour heterogeneity. Nature. 2015; 525:261–264. https://doi.org/10.
1038/nature14971
18. Nicholson MD, Antal T. Competing evolutionary paths in growing populations with applications to multi-
drug resistance. PLoS Comput Biol. 2019; 15(4):e1006866. https://doi.org/10.1371/journal.pcbi.
1006866
19. Nowak MA. Evolutionary Dynamics. Cambridge, Massachusetts: Harvard University Press; 2006.
20. Blythe RA, McKane AJ. Stochastic models of evolution in genetics, ecology and linguistics. J Stat
Mech: Theory Exp. 2007; 2007(07):P07018.
21. Altrock PM, Liu LL, Michor F. The mathematics of cancer: integrating quantitative models. Nat Rev Can-
cer. 2015; 15:730–745. https://doi.org/10.1038/nrc4029
22. Desai MM, Fisher DS, Murray AW. The speed of evolution and maintenance of variation in asexual pop-
ulations. Curr Biol. 2007; 17(5):385–394. https://doi.org/10.1016/j.cub.2007.01.072
23. Cvijović I, Good BH, Jerison ER, Desai MM. Fate of a mutation in a fluctuating environment. Proc Natl
Acad Sci USA. 2015; 112(36):E5021–E5028. https://doi.org/10.1073/pnas.1505406112
PLOS COMPUTATIONAL BIOLOGY Phenotypic delay in the evolution of antibiotic resistance
PLOS Computational Biology | https://doi.org/10.1371/journal.pcbi.1007930 May 29, 2020 21 / 24

24. Paixão T, Badkobeh G, Barton N, CoruşD, Dang DC, Friedrich T, et al. Toward a unifying framework
for evolutionary processes. J Theor Biol. 2015; 383:28–43. https://doi.org/10.1016/j.jtbi.2015.07.011
PMID: 26215686
25. Sonneborn TM, Lynch RS. Hybridization and segregation in Paramecium aurelia. J Exp Zool. 1934; 67
(1):1–72. https://doi.org/10.1002/jez.1400670102
26. Armitage P. The statistical theory of bacterial populations subject to mutation. J Royal Stat Soc. 1952;
14(1):1–40.
27. Newcombe HB. Delayed phenotypic expression of spontaneous mutations in Escherichia coli. Genet-
ics. 1948; 33(5):447–476.
28. Davis BD. The isolation of biochemically deficient mutants of bacteria by means of penicillin. Proc Natl
Acad Sci USA. 1949; 35:1–10. https://doi.org/10.1073/pnas.35.1.1
29. Luria SE, Delbruck M. Mutations of bacteria from virus sensitivity to virus resistance. Genetics. 1943; 28
(6):491–511.
30. Ryan FJ. Phenotypic (phenomic) lag in bacteria. Am Nat. 1955; 89(846):159–162. https://doi.org/10.
1086/281875
31. Sun L, Alexander HK, Bogos B, Kiviet DJ, Ackermann M, Bonhoeffer S. Effective polyploidy causes
phenotypic delay and influences bacterial evolvability. PLoS Biol. 2018; 16(2):e2004644. https://doi.
org/10.1371/journal.pbio.2004644
32. Cooper S, Helmstetter CE. Chromosome replication and the division cycle of Escherichia coli B/r. J Mol
Biol. 1968; 31(3):519–540. https://doi.org/10.1016/0022-2836(68)90425-7
33. Nielsen HJ, Youngren B, Hansen FG, Austin S. Dynamics of Escherichia coli chromosome segregation
during multifork replication. J Bacteriol. 2007; 189(23):8660–8666. https://doi.org/10.1128/JB.01212-07
34. Wang JD, Levin PA. Metabolism, cell growth and the bacterial cell cycle. Nat Rev Microbiol. 2009;
7:822–827. https://doi.org/10.1038/nrmicro2202
35. Silver LL, Bostian KA. Discovery and development of new antibiotics: the problem of antibiotic resis-
tance. Antimicrob Agents Chemother. 1993; 37(3):377–383. https://doi.org/10.1128/AAC.37.3.377
36. Andersson DI, Hughes D. Persistence of antibiotic resistance in bacterial populations. FEMS Microbiol
Rev. 2011; 35(5):901–911. https://doi.org/10.1111/j.1574-6976.2011.00289.x
37. Aldred KJ, Kerns RJ, Osheroff N. Mechanism of quinolone action and resistance. Biochemistry. 2014;
53(10):1565–1574. https://doi.org/10.1021/bi5000564
38. Helander IM, Kilpelainen I, Vaara M. Increased substitution of phosphate groups in lipopolysaccharides
and lipid A of the polymyxin-resistant pmrA mutants of Salmonella typhimurium: a 31P-NMR study. Mol
Microbiol. 1994; 11(3):481–487. https://doi.org/10.1111/j.1365-2958.1994.tb00329.x
39. Beceiro A, Llobet E, Aranda J, Bengoechea JA, Doumith M, Hornsey M, et al. Phosphoethanolamine
modification of lipid A in colistin-resistant variants of Acinetobacter baumannii mediated by the pmrAB
two-component regulatory system. Antimicrob Agents Chemother. 2011; 55(7):3370–3379. https://doi.
org/10.1128/AAC.00079-11 PMID: 21576434
40. Webber MA, Piddock LJV. The importance of efflux pumps in bacterial antibiotic resistance. J Antimi-
crob Chemother. 2003; 51(1):9–11. https://doi.org/10.1093/jac/dkg050
41. Bonomo RA. β-Lactamases: a focus on current challenges. Cold Spring Harbor Perspect Med. 2017; 7
(1):a025239.
42. Livermore DM. β-Lactamases: quantity and resistance. Clin Microbiol Infect. 1997; 3:4S10–4S19.
https://doi.org/10.1016/S1198-743X(14)65031-X
43. Speer BS, Shoemaker NB, Salyers AA. Bacterial resistance to tetracycline: mechanisms, transfer, and
clinical significance. Clin Microbiol Rev. 1992; 5(4):387–399. https://doi.org/10.1128/CMR.5.4.387
44. Greulich P, Scott M, Evans MR, Allen RJ. Growth-dependent bacterial susceptibility to ribosome-target-
ing antibiotics. Mol Syst Biol. 2015; 11:796. https://doi.org/10.15252/msb.20145949
45. Rosche WA, Foster PL. Determining mutation rates in bacterial populations. Methods. 2000; 20:4–17.
https://doi.org/10.1006/meth.1999.0901
46. Lee H, Popodi E, Tang H, Foster PL. Rate and molecular spectrum of spontaneous mutations in the
bacterium Escherichia coli as determined by whole-genome sequencing. Proc Natl Acad Sci USA.
2012; 109(41):E2774–E2783. https://doi.org/10.1073/pnas.1210309109
47. Boe L, Tolker-Nielsen T, Eegholm KM, Spliid H, Vrang A. Fluctuation analysis of mutations to nalidixic
acid resistance in Escherichia coli. J Bacteriol. 1994; 176(10):2781–2787. https://doi.org/10.1128/JB.
176.10.2781-2787.1994
48. Ikehata H, Ono T. The mechanisms of UV mutagenesis. J Radiat Res. 2011; 52(2):115–125. https://
doi.org/10.1269/jrr.10175
PLOS COMPUTATIONAL BIOLOGY Phenotypic delay in the evolution of antibiotic resistance
PLOS Computational Biology | https://doi.org/10.1371/journal.pcbi.1007930 May 29, 2020 22 / 24

49. Shibai A, Takahashi Y, Ishizawa Y, Motooka D, Nakamura S, Ying BW, et al. Mutation accumulation
under UV radiation in Escherichia coli. Sci Rep. 2017; 7(1):14531. https://doi.org/10.1038/s41598-017-
15008-1 PMID: 29109412
50. Bates H, Randall SK, Rayssiguier C, Bridges BA, Goodman MF, Radman M. Spontaneous and UV-
induced mutations in Escherichia coli K-12 strains with altered or absent DNA polymerase I. J Bacteriol.
1989; 171(5):2480–2484. https://doi.org/10.1128/JB.171.5.2480-2484.1989
51. Kai G, Weber AS. Streptomycin-resistant mutant production in a continuous-flow UV mutation device. J
Ind Microbiol. 1991; 8(2):107–112. https://doi.org/10.1007/BF01578761
52. Kleanthous C, Rassam P, Baumann CG. Protein–protein interactions and the spatiotemporal dynamics
of bacterial outer membrane proteins. Curr Opin Struct Biol. 2015; 35:109–115. https://doi.org/10.1016/
j.sbi.2015.10.007
53. Rassam P, Copeland NA, Birkholz O, Toth C, Chavent M, Duncan AL, et al. Supramolecular assem-
blies underpin turnover of outer membrane proteins in bacteria. Nature. 2015; 523:333–336. https://doi.
org/10.1038/nature14461 PMID: 26061769
54. de Pedro MA, Grunfelder CG, Schwarz H. Restricted mobility of cell surface proteins in the polar regions
of Escherichia coli. J Bacteriol. 2004; 186(9):2594–2602. https://doi.org/10.1128/JB.186.9.2594-2602.
2004
55. Bergmiller T, Andersson AMC, Tomasek K, Balleza E, Kiviet DJ, Hauschild R, et al. Biased partitioning
of the multidrug efflux pump AcrAB-TolC underlies long-lived phenotypic heterogeneity. Science. 2017;
356(6335):311–315. https://doi.org/10.1126/science.aaf4762 PMID: 28428424
56. Chong S, Chen C, Ge H, Xie XS. Mechanism of transcriptional bursting in bacteria. Cell. 2014;
158:314–326. https://doi.org/10.1016/j.cell.2014.05.038
57. Stracy M, Wollman AJM, Kaja E, Gapinski J, Lee JE, Leek VA, et al. Single-molecule imaging of DNA
gyrase activity in living Escherichia coli. Nucleic Acids Res. 2019; 47(1):210–220. https://doi.org/10.
1093/nar/gky1143 PMID: 30445553
58. Hui S, Silverman JM, Chen SS, Erickson DW, Basan M, Wang J, et al. Quantitative proteomic analysis
reveals a simple strategy of global resource allocation in bacteria. Mol Syst Biol. 2015; 11(2):784.
https://doi.org/10.15252/msb.20145697 PMID: 25678603
59. Schaechter M, Maaløe O, Kjeldgaard NO. Dependency on medium and temperature of cell size and
chemical composition during balanced growth of Salmonella typhimurium. J Gen Microbiol. 1958; 19
(3):592–606. https://doi.org/10.1099/00221287-19-3-592
60. Pierucci O. Dimensions of Escherichia coli at various growth rates: model for envelope growth. J Bacter-
iol. 1978; 135(2):559–574. https://doi.org/10.1128/JB.135.2.559-574.1978
61. Vadia S, Levin PA. Growth rate and cell size: a re-examination of the growth law. Curr Opin Microbiol.
2015; 24:96–103. https://doi.org/10.1016/j.mib.2015.01.011
62. Jun S, Si F, Pugatch R, Scott M. Fundamental principles in bacterial physiology–history, recent prog-
ress, and the future with focus on cell size control: a review. Rep Prog Phys. 2018; 81(5):056601.
https://doi.org/10.1088/1361-6633/aaa628
63. Alexander HK, Martin G, Martin OY, Bonhoeffer S. Evolutionary rescue: linking theory for conservation
and medicine. Evol Appl. 2014; 7(10):1161–1179. https://doi.org/10.1111/eva.12221
64. Bozic I, Nowak MA. Resisting resistance. Annu Rev Cancer Biol. 2017; 1(1):203–221. https://doi.org/
10.1146/annurev-cancerbio-042716-094839
65. Lea DE, Coulson CA. The distribution of the numbers of mutants in bacterial populations. J Genet.
1949; 49(3):264. https://doi.org/10.1007/BF02986080
66. Zheng Q. Progress of a half century in the study of the Luria-Delbruck distribution. Math Biosci. 1999;
162(1):1–32.
67. Sarkar S. Haldane’s solution of the Luria-Delbruck distribution. Genetics. 1991; 127(2):257–261.
68. Ma WT, Sandri GV, Sarkar S. Analysis of the Luria-Delbruck distribution using discrete convolution
powers. J Appl Probab. 1992; 29(2):255–267. https://doi.org/10.1017/S0021900200043023
69. Holmes CM, Ghafari M, Abbas A, Saravanan V, Nemenman I. Luria-Delbruck, revisited: the classic
experiment does not rule out Lamarckian evolution. Phys Biol. 2017; 14(5):055004. https://doi.org/10.
1088/1478-3975/aa8230
70. Keller P, Antal T. Mutant number distribution in an exponentially growing population. J Stat Mech: The-
ory Exp. 2015; 2015(1):P01011. https://doi.org/10.1088/1742-5468/2015/01/P01011
71. Nicholson MD, Antal T. Universal asymptotic clone size distribution for general population growth. Bull
Math Biol. 2016; 78:2243–2276. https://doi.org/10.1007/s11538-016-0221-x
PLOS COMPUTATIONAL BIOLOGY Phenotypic delay in the evolution of antibiotic resistance
PLOS Computational Biology | https://doi.org/10.1371/journal.pcbi.1007930 May 29, 2020 23 / 24

72. Fusco D, Gralka M, Kayser J, Anderson A, Hallatschek O. Excess of mutational jackpot events in
expanding populations revealed by spatial Luria–Delbruck experiments. Nat Commun. 2016; 7:12760.
https://doi.org/10.1038/ncomms12760
73. Cheek D, Antal T. Mutation frequencies in a birth–death branching process. Ann Appl Probab. 2018; 28
(6):3922–3947. https://doi.org/10.1214/18-AAP1413
74. Fortin FA, De Rainville FM, Gardner MA, Parizeau M, Gagne C. DEAP: Evolutionary algorithms made
easy. J Mach Learn Res. 2012; 13:2171–2175.
75. Mazoyer A, Drouilhet R, Despreaux S, Ycart B. flan: An R package for inference on mutation models.
The R Journal. 2017; 9(1):334–351. https://doi.org/10.32614/RJ-2017-029
76. Beaumont MA, Zhang W, Balding DJ. Approximate Bayesian Computation in population genetics.
Genetics. 2002; 162(4):2025–2035.
77. Noble D. Biophysics and systems biology. Philos Trans R Soc, A. 2010; 368(1914):1125–1139. https://
doi.org/10.1098/rsta.2009.0245
78. Vilar JMG, Saiz L. Systems biophysics of gene expression. Biophys J. 2013; 104(12):2574–2585.
https://doi.org/10.1016/j.bpj.2013.04.032
79. Sgro AE, Schwab DJ, Noorbakhsh J, Mestler T, Mehta P, Gregor T. From intracellular signaling to popu-
lation oscillations: bridging size- and time-scales in collective behavior. Mol Syst Biol. 2015; 11(1).
https://doi.org/10.15252/msb.20145352 PMID: 25617347
80. Brenner N, Braun E, Yoney A, Susman L, Rotella J, Salman H. Single-cell protein dynamics reproduce
universal fluctuations in cell populations. Eur Phys J E: Soft Matter Biol Phys. 2015; 38(9):102. https://
doi.org/10.1140/epje/i2015-15102-8
81. Brenner N, Newman CM, OsmanovićD, Rabin Y, Salman H, Stein DL. Universal protein distributions in
a model of cell growth and division. Phys Rev E. 2015; 92:042713. https://doi.org/10.1103/PhysRevE.
92.042713
82. Acar M, Mettetal JT, van Oudenaarden A. Stochastic switching as a survival strategy in fluctuating envi-
ronments. Nat Genet. 2008; 40:471. https://doi.org/10.1038/ng.110
83. Drlica K, Zhao X. DNA gyrase, topoisomerase IV, and the 4-quinolones. Microbiol Mol Biol Rev. 1997;
61(3):377–392.
84. Andersson DI, Levin BR. The biological cost of antibiotic resistance. Curr Opin Microbiol. 1999; 2
(5):489–493. https://doi.org/10.1016/S1369-5274(99)00005-3
85. Melnyk AH, Wong A, Kassen R. The fitness costs of antibiotic resistance mutations. Evol Appl. 2015; 8
(3):273–283. https://doi.org/10.1111/eva.12196
86. Bottger EC, Springer B, Pletschette M, Sander P. Fitness of antibiotic-resistant microorganisms and
compensatory mutations. Nat Med. 1998; 4:1343–1344. https://doi.org/10.1038/3906
87. Nath K, Koch AL. Protein degradation in Escherichia coli: I. Measurement of rapidly and slowly decaying
components. J Biol Chem. 1970; 245(11):2889–2900.
88. Hintsche M, Klumpp S. Dilution and the theoretical description of growth-rate dependent gene expres-
sion. J Biol Eng. 2013; 7(1):22. https://doi.org/10.1186/1754-1611-7-22
89. Eden E, Geva-Zatorsky N, Issaeva I, Cohen A, Dekel E, Danon T, et al. Proteome half-life dynamics in
living human cells. Science. 2011; 331(6018):764–768. https://doi.org/10.1126/science.1199784 PMID:
21233346
90. Ojkic N, Lilja E, Direito S, Dawson A, Allen RJ, Waclaw B. A roadblock-and-kill model explains the
dynamical response to the DNA-targeting antibiotic ciprofloxacin. bioRxiv. 2019; p. 791145.
91. Bauer M, Frey E. Multiple scales in metapopulations of public goods producers. Phys Rev E. 2018;
97:042307. https://doi.org/10.1103/PhysRevE.97.042307
92. Bauer M, Frey E. Delayed adaptation in stochastic metapopulation models. Europhys Lett. 2018; 122
(6):68002. https://doi.org/10.1209/0295-5075/122/68002
93. Lin WH, Kussell E. Complex interplay of physiology and selection in the emergence of antibiotic resis-
tance. Curr Biol. 2016; 26(11):1486–1493. https://doi.org/10.1016/j.cub.2016.04.015
94. Cinlar E. Introduction to Stochastic Processes. Mineola, New York: Dover Publications; 1975.
95. Pasupathy R. Generating nonhomogenous Poisson processes. In: Wiley Encyclopedia of Operations
Research and Management Science. Wiley; 2011. Available from: http://web.ics.purdue.edu/~
pasupath/PAPERS/2011pasB.pdf.
PLOS COMPUTATIONAL BIOLOGY Phenotypic delay in the evolution of antibiotic resistance
PLOS Computational Biology | https://doi.org/10.1371/journal.pcbi.1007930 May 29, 2020 24 / 24