Embed Size (px)
Citation preview
Dealing with 100 years of tribal knowledge*
phev.ucdavis.edu

PH&EV Center Research teams and research partners
Consumers • Lifestyle studies • Market demand • Usage patterns • CEC, BMW, ARB
Fleet Development • Market Segments • Fleet Operation • Energy Savings • Chrysler, DOE
Battery studies • Benchmark Testing • 2nd use • End of life • DOE, NREL,
Aerovironment, UCB, UCSD, SDGE
Spatial & Temporal PEV Energy Use • GIS analysis • Charging network
design • CEC, Nissan, INL,
ECOtality
Human Machine Interfaces • Response to HMI
design • Benchmarking • ARB, ORNL, CEC
Dr. Kurani Dr. Nesbitt Dr. Burke Dr. Nicholas & Dr. Tal
Dr. Stillwater

Beginning to compare regions & cities trying to make PEVs
happen 1. Partnership:
International Energy Agency, Clean Energy Ministerial Electric Vehicle
Initiative,(16 Energy Ministries), Clinton 40, Rocky Mountain Institute, PH&EV
Center
2. WECE Website 20-24 cities, data sharing, project
showcasing
3. WECE Conference Los Angeles May 5 2012
Amsterdam, Shanghai, Stockholm, Barcelona, Lisbon, Shenzhen, Tokyo,
Hamburg, Victoria, Portland, San Diego, Los Angeles

Automobility • 100 year system of petroleum, internal combustion, roads. • Important practical and lifestyle tool, mobility, public symbol of
household success. • 100 years of “tribal knowledge” of users, makers, etc.. • World total fleet 6-700 million / World Annual Sales 75 million • Many brands, types, 100s of models, brutally competitive, big
investments • Slow turnover (10-15 years) –saturation and declining sales in
US, Japan, Europe..first buyer sales in China, India, Eastern Europe, South America
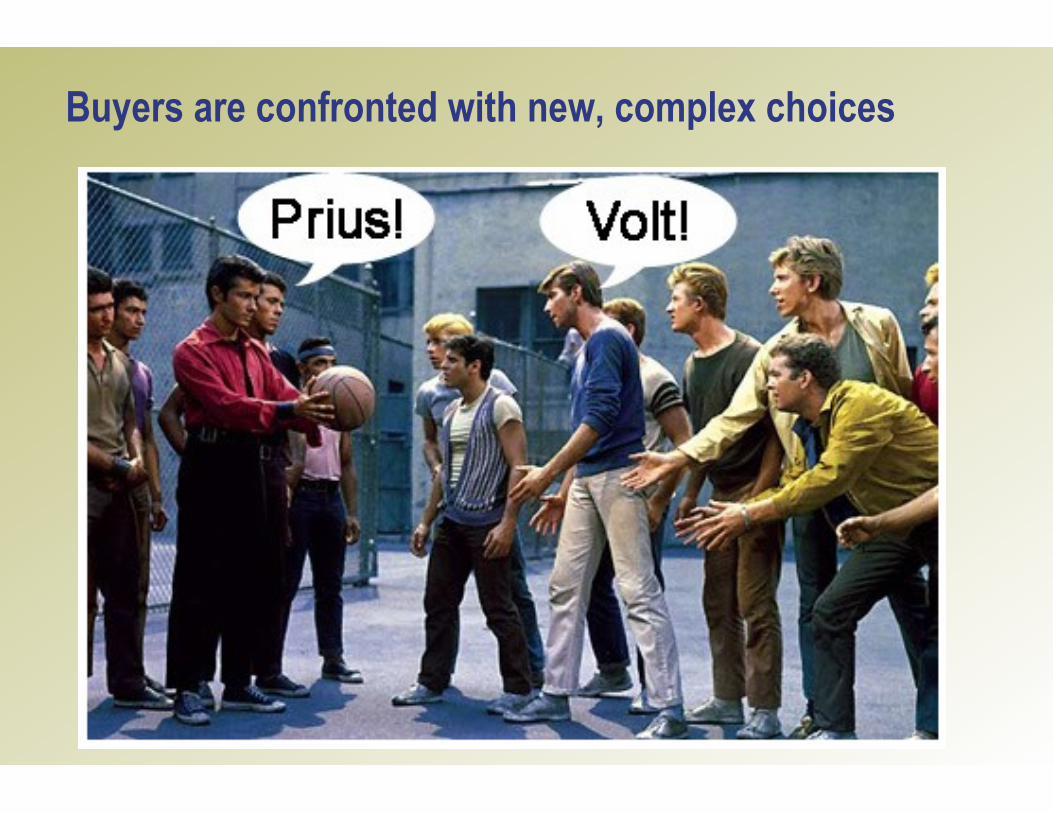
Buyers are confronted with new, complex choices

Difficult choices • Driving range & refueling:
• PHEV dual fueled, 20-100 km of EV range, blended designs
• BEVs – big range of ranges 50-300 km when full discharged
• Electricity: costs ($.03-.30 kWh),
dashboard displays, sounds; drive feel; plug in where they park,
• Vehicle uncertainty: safety, batteries, durability, cold and hot climates, will people think I’m smart?
• Complex social & environmental benefits: • Greatly reduce petroleum use; • Zero tailpipe for BEV, • GHG emissions vary by regions
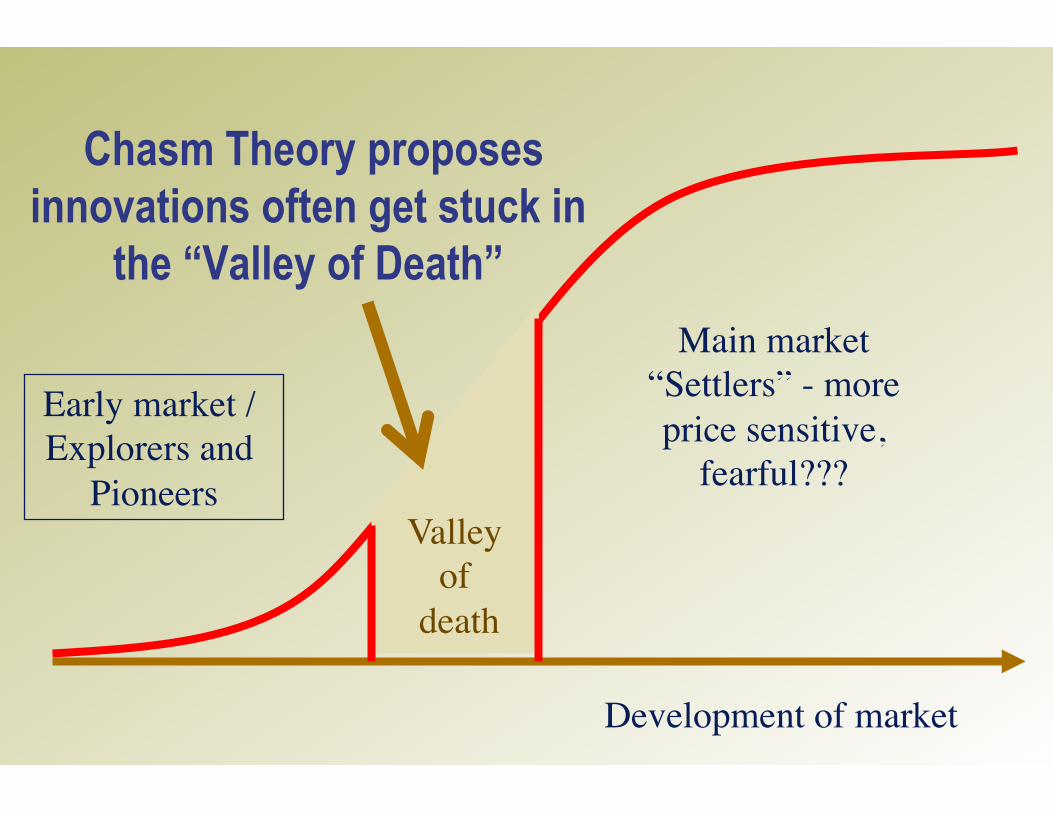
Chasm Theory proposes innovations often get stuck in
the “Valley of Death” Main market
“Settlers” - more price sensitive,
fearful???
Early market / Explorers and
Pioneers
Development of market
Valley of
death

Did HEVs cross the chasm in Japan? Why is the Prius the best selling vehicle in Japan?
(since 2009, 35,000-7% of sales in Feb 20112 20,500 12th in US)
• About $100,000 yen/ $1100 incentive
• Public values and knowledge were developed

Why are 50% of US Leaf & Volt sales in California/ • Price of vehicle is lower? More affluent? • Price of gas is higher? Lower price of electricity? • More incentives to buyers? (rebates, tax credits, HOV
lanes, free electricity/ parking?) • EV ready? (charge system in place?) • Regulations? (ZEV program) • Tree huggers..liberals..techies.. • 5 times as many innovators?

In 1090s, Tom and Ken study potential buyers of EVs, some buyers of CNG • Tom & Ken ..1990s: focus on practical decisions of fleets,
pioneers, probable buyers of CNG, diesel, EVs, PHEVs, about range, refuel/recharge, low speed EVs, “city “ EVs. Concept of range elusive without direct experience, households talk about “critical” trips, routine activity space, safety buffers, main market is probably “hybrid households”
• Buyers not interested in CNG, Methanol unless it saves money. • EV driving experience and concept of using electricity as fuel has
some spark

ITS researchers finally learn about real decisions.. • Heffner era- HEV “purchases”
• Buyers talk less about practical aspects. More about “meaning”
• Ken and Tom - Fuel economy decisions • No book keeping, no knowledge of annual fuel costs, focus on pump price
and tank price
• Axsen era – AFVs and PEVs in social networks. Two concepts: • Liminality: openness to change (decisions in life context)
• Translation: drivers fitting technology into their lives…
• Kurani and team – Focus on “narrative”, • the story driver’s construct to explain and direct their decisions…
• Turrentine and team – BMW MINI-E • “fun and clean”, “energy use mastery,” my EV space

1st Circle
2nd Circle
3rd Circle
4th Circle
Casual Acquaint.
Stranger
Close Neighbors
Close Family
Larry’s Work
Son’s School
Vacation Friends
Soci
al P
roxi
mity
to th
e R
hode
s
XX
XX
XX
XX
Not contacted by ego Lower influence interaction Mod influence interaction Higher influence interaction Interviewed contact Somewhat close tie Very close tie
Cheryl’s Running Group
Larry’s Martial
Arts
Former Colleagues
Larry and Cheryl Rhode
Axsen finds complex networks of influence

Hybrid
Prius
Civic Hybrid
Insight
Electric Drive “Stealth Mode”
More Efficient
Use Less Gasoline
Not Wasteful
Control, Empowerment, Independence
Not Paying Oil Companies
Sending Message to Automakers
Lower Emissions
Reduce Impact on Environment
Good for Future (Mine and
Kids’)
Fits Personal Values
Lifestyle Commitment
Community Involvement
Latest Technology
Smart Different
Technology Cachet
Obviously a Hybrid
“Techno-marvel”
Old technology as stupid; resisting innovations as stupid
So much is out of our control
Failing Democracy
Civic too subtle
Closer to Alternative Source of Power
Further from Fossil Fuel and Those Who
Produce It
Think differently about life, how their lives impact environment and community
Idling in traffic as “gross”
Oil companies as market manipulators blood-suckers, war-makers
“Whole other thing” “Whole other space”
“Technology lifestyle” Prius as “geek-a-rific”
Not a Performance Car
Not About Image
SUVs as “crazy status cars”
Not Selfish: “New American Mentality
Preserving the Environment
Embracing New Technology
Seeking Independence
Heffner discovers complexity and meaning

Car 1 (ICE) – Rela.ve Total Trips Car 2 (ICE) -‐ Rela.ve Total Trips
• Trip w
• Trip x
• Trip y
• Trip z
• Trip a
• Trip b
• Trip c
• Trip d
We learned how households change driving patterns with Mini E.

Car 2 (ICE) -‐ Rela.ve Total Trips
• Trip w
• Trip x
• Trip y
• Trip z
• Trip a
• Trip b
• Trip c
• Trip d
MINI E – Rela.ve Total Trips
Longer trips shifted to Car 2

• New Trips
Car 2 (ICE) -‐ Rela.ve Total Trips MINI E – Rela.ve Total Trips
• Trip x
• Trip y
• Trip z
• Trip c
• Trip d
• Trip a
• Trip b
• Trip w
Some of Car 2 trips shi>ed to Mini E

Recent survey - Gil Tal, Mike Nicholas and team
• EV project in San-Diego (Ecotality) • State rebate program (CCSE) Response numbers: Nissan Leaf 1076 Chevrolet Volt 32 Tesla Roadster 21 Total 1129 PEVs

Households Characteristics (based on an early subsample of 637) • 96% live in single family House
§ 95% own their house
• 42% have solar panels § 18% consider installation § 40% have no plan to install
• Average Household size 2.7 • 83% have yearly income income higher than $100K
§ 46% incomes is higher than $150K § 16% decline to state.

Average driver looks like Tom (with more money) • Average age of a LEAF driver is 50 years old but only
10% are over 65 (N=1003)
• In 80% of the households the main LEAF driver is Male.
• On average, the main driver is using the car 76% of the time.
• 22% of the vehicles are used by single driver.

Leaf buyers have smart phones and techy stuff..
0%
20%
40%
60%
80%
100%
Leaf General population
Have Smartphone
Have Smartphone No smartphone
0%
10%
20%
30%
40%
50%
60%
70%
iPhone Android Blackberry Windows other
Smartphone OS
leaf general pop q4 2011 acquires
0.00%
10.00%
20.00%
30.00%
40.00%
50.00%
60.00%
Win7 Vista Win2003 WinXP Linux Mac Mobile
Computer OS
General population Leaf
Leaf Owners Vs. General Population • More Smartphones • More IPhones • Newer Computers • More Macs

Households are combining HEVs and EVs
5%
49%
32%
10%
4%
0%
10%
20%
30%
40%
50%
60%
Leaf only 2 3 4 5+
Leaf only
2
3
4
5+
N=1115 • 23.8% of the EV household also own a Hybrid.
• 9.1% of LEAF owner have another Nissan.

Household Fleet Changes with the LEAF
• 19.4% of the replaced vehicles are hybrid § But 35% of those have a second Hybrid in the household
65%
7%
28%
0%
10%
20%
30%
40%
50%
60%
70%
Replaced Will Replace Additional vehicle
"Vehicle Change"
Replaced
Will Replace
Additional vehicle

Not using Level 2 very often (has much to do with 3.3 kW charger in Leaf)
0%
10%
20%
30%
40%
50%
60%
70%
Daily (+129) Once or twice a week (55-128)
Less than weekly (13-54)
Less than once a month(0-12)
Never
Public level 1 or Level 2
Public Level 2
Public Level 1

Most want DC fast charge
Charger 1
Charger 2
Charger 3
Charger 4
Charger 5
Total by Type
DC Fast 116 111 93 79 74 473
Level 2 66 37 32 24 17 176 Total
Chargers 182 148 125 103 91 649
271 Respondents

We are looking at energy feedback devices impact on driving and vehicle choices as well
• 2009 Scangauge field test (~6 drivers, 6 months).
• 2008-‐9 Prius field test with V2Green Gridpoint website
(~60 households, 1 month each).
• 2009-‐10 UC Davis custom HMI
(~40 drivers, 1 month each)

Tai and Ken are studying hardware … • Currently Running Large Sample (150 household)
feedback test along the I-‐80 Corridor funded by ORNL/DOE
• Using the DashDaq data display and logger • Custom screens test both the effect of “raw”
informa[on and contextual feedback • Direct test of 3 common designs
Screen Name Operational Description NHTSA Scores NHTSA Name and Image
“Accelerator” Instantaneous acceleration bar and
trip-level leaf representation of fuel
economy.
High comprehension, low load, high
satisfaction, uncommon in application
CSO2
“Shrubbery” Short term and trip-level leaf
representations of fuel economy. Moderate Comprehension, moderate load,
high on satisfaction, uncommon application CSO3
“Numbers” Instantaneous and trip-level fuel
economy in horizontal bar format. Moderate on comprehension, moderate load,
low on satisfaction, common in application CSO6
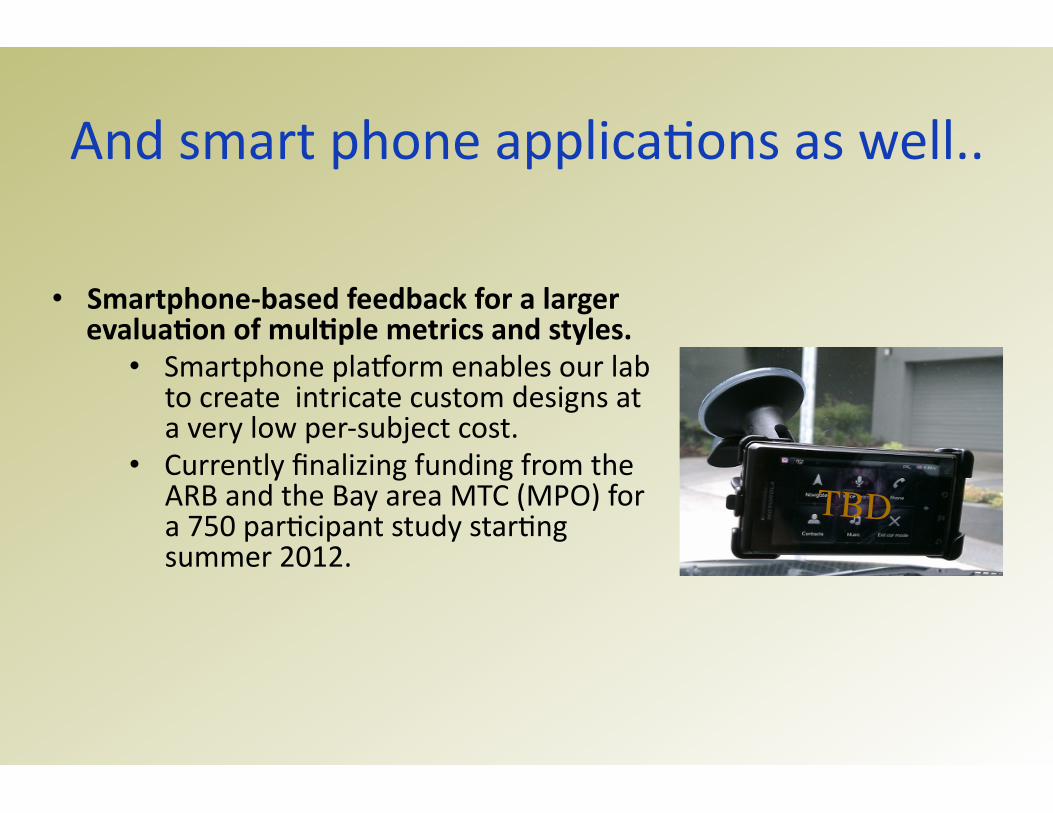
And smart phone applica[ons as well..
• Smartphone-‐based feedback for a larger evalua.on of mul.ple metrics and styles.
• Smartphone pla_orm enables our lab to create intricate custom designs at a very low per-‐subject cost.
• Currently finalizing funding from the ARB and the Bay area MTC (MPO) for a 750 par[cipant study star[ng summer 2012.
TBD