Embed Size (px)
Citation preview
Philatelic Shade Discrimination Based
on Measured Color
David L. Herendeen
President and Senior Fellow, Institute for Analytical Philately, Inc.
James A. Allen
Senior Fellow, Institute for Analytical Philately, Inc.
Thomas Lera
Winton M. Blount Chair in Research, Smithsonian National Postal Museum
Prepared by the Institute for Analytical Philately, Inc.
Report IAP-2010-1
November 2010
A version of this paper appeared in the
London Philatelist, Vol. 120, No. 1384, April 2011, pp. 105-117.

3
Abstract. Color shades are an important aspect of phil-atelic study for a number of reasons. The two most important of these are the identification of specific printings and printers of stamp issues, and the dis-crimination of fraudulent stamps. For nearly a century, the identification of color shades has been done using two basic methods: firstly, by having reference collec-tions of shades that can be compared to an unknown specimen; and, secondly, by training individuals with innate or intrinsic skills in color-matching to recognize the accepted shades as defined by earlier generations of such color experts.
This paper formulates a new methodology for shade identification using spectrographic measurements and color science. The methodology is then applied to a test case in order to validate its applicability.
Key words: color naming, color categories, philatelic color, shade discrimination, fuzzy set theory.
DEFINITIONS
Presented below are the definitions of a number of terms that are used throughout this paper.
Color System: also called “color-order system” is a system for arranging and describing color. At present, the most widely accepted color systems are those es-tablished by CIE (Commission Internationale de l‘Eclairage) in 1931 based on visual experiments. These color systems have been modified and im-proved (e.g. 1960, 1976) to better reflect human visu-
al perception of color.1,2
Colorimetry: is the science and technology used to quantify and describe physically the human color perception, which was also established by CIE in 1931. Even though limitations are well recognized,
the CIE system of colorimetry remains the only inter-nationally agreed metric for color measurement. This definition is taken from Ohno’s excellent and recom-
mended overview of colorimetry and the CIE color standards.3
Color Matching: is the process of determining if two colors match within a pre-determined tolerance, usu-
ally specified by some difference (i.e. distance) metric in one of the CIE color spaces.
Color Categorization: also called “color naming” or “color quantization” is the process of determining whether two colors can be visually discriminated, and then developing categories into which similar colors are placed.4
PHILATELIC COLOR
One of the most difficult technical issues facing ad-vanced philatelists is the identification of stamp shades. A minor shade difference may translate into an economic value that may vary by several orders of magnitude from other stamps of different shades.
In early 1978, a study by Tyler and Peck5 used diffuse reflectance spectroscopy to discriminate be-tween genuine, reprinted and forged stamps of the 1867-1868 Roman States issues. This was an appli-cation of colorimetry in which results were obtained by simple comparison of reflectance curves. The final sentence of this paper notes that:
It may be concluded that the method has con-siderable potential for application in the phila-telic field, permitting absolute characterization of shades of color which previously could be
determined only by subjective means.
In 1979 the Philatelic Foundation followed with a comprehensive effort to perform quantitative studies of color in philately.6 Norby (p. 116) notes, “The indis-criminate and in some instances incongruous naming of stamp colors must be resolved.” Unfortunately this situation persists now, thirty years later. This refer-ence work presents excellent background information on: color theory; ink chemistry; paper manufacture,
printing techniques; and nondestructive methods for
Philatelic Shade Discrimination Based
on Measured Color
David L. Herendeen*
President and Senior Fellow, Institute for Analytical Philately, Inc.
James A. Allen
Senior Fellow, Institute for Analytical Philately, Inc.
Thomas Lera
Winton M. Blount Chair in Research, Smithsonian National Postal Museum
*Correspondence to David L. Herendeen (e -mail: [email protected])
4
color measurement and analysis. It also includes eleven case studies of color in specific stamps from a variety of countries. These studies only addressed colorimetry tangentially. Instead, they focused more on aspects of various x-ray emission spectroscopy techniques that allow chemical analysis of inks.
The only substantive recommendation was a pro-posal to adopt a very complicated set of color desig-nations defined in the Munsell Book of Color.7,8 The findings of Kelly and Billmeyer7 were modified again in 1982, but the resulting complexity was far from
“user friendly,” and it is doubtful if any collectors ever adopted any of the proposed conventions.9
Several subsequent studies used similar approach-es.10,11 Chaplin et al.10 in particular gained wide-spread notice by using spectroscopic analysis to solve a long-standing controversy by distinguishing be-tween genuine and forged Hawaiian Missionary stamps.
THE SCIENCE OF COLOR
Physics and Psychology
Color science encompasses two distinct areas. The first is the pure physics of light and its measurement. For simplicity, this will be called spectrometric anal-yses. The second is the psycho-physical manifesta-tion of color by the human vision system, often called perception. Both of these areas have been widely studied because of their many applications including: pigments and dyes; inks; digital television; computer monitors; photography and many more. While exten-sive discussion of these areas is well beyond the scope of this study, specific important concepts and findings are presented as needed.
One of the most important aspects of spectrometry is the ability to measure color in an objective manner which, as noted earlier, is called colorimetry. Unfortu-nately, while the actual measurement of certain char-acteristics such as reflective or absorptive spectra is a well-defined physical phenomena, the perceptual
interpretation of this electromagnetic radiation by the human eye is far from exact. The identification and comparison of colors may vary dramatically between observers,12 under different circumstances for the same observer,12 between sexes,13,14 and between the young and the elderly.15
Thus, by definition, there is no exact answer to questions addressing human color perception. In-stead, semi-empirical methods, often related to a spe-
cific problem domain, must be developed and used to approximate an exact meaning of “color.” In this study, the manual techniques used by a trained phil-atelic color expert are analyzed.
Colorimetric Analysis
As introduced above, it is generally accepted that color is a result of a psycho-physiological perception rather than an independent physical phenomenon. Specifically, it is the stimulation of the human visual system by what is called visible light. This light is
simply electromagnetic radiation having wavelengths ranging from 380 nanometers (nm) to 780 nm.
While color can not be measured directly, the con-ditions leading to our perception of color sensations can be measured. As noted, the method for doing this was introduced in 1931 by the CIE. To measure the variables that create color sensations, the CIE estab-lished a reproducible, spectrophotometry based, de-vice-independent color model constructed from a light source, an observer, and an object. The results of a CIE-compliant measurement and transformation are coordinates that locate the specimen in a horse-shoe-shaped color space representing human color
perception. Such color spaces are called Chromaticity Diagrams, an example of such a diagram is shown later in Fig. 2. A more detailed discussion of these, and other, models is again beyond the scope of this paper (cf Refs. 1 and 2).
PHILATELIC COLOR CATEGORIZATION
The authors became involved in analytical color stud-ies for philately in a study performed with partial funding from the Smithsonian National Postal Muse-um. Preliminary study had suggested that the identi-fication of stamp shades was a problem in color matching. However, after collecting reflectance data for hundreds of samples, it became apparent that nearly every stamp (yes, even those in multiples) were different “colors” from a purely spectrographic per-spective, at least in terms of chromaticity coordi-nates. As described in the following sections, the tra-ditional manner in which shade determination has been made is actually through color categorization rather than matching. Therefore, the remainder of this paper formulates the theoretical basis for creat-ing such categories.
The manual determination of shades for a family of similarly colored stamps is a straight-forward process. However, this simple observation understates the re-quirement that one must have an expert philatelist whose color acuity has been honed by thousands of
hours of training. This requirement is supported by the extensive literature previously cited showing that the ability to distinguish and differentiate colors is ex-tremely variable between individuals.12-15
Generally, the color expert samples many hun-dreds of stamps of a given value and issue, say the U.S. 1851-1857 3c red stamp. For the vast majority of these stamps, there are many possible shades re-sulting from: different printings; different ink batch-es; different treatment of the printing plates such as
cleaning and inking; different dampening of the pa-per; different plate pressures during the print run; and many more environmental considerations. Each sample stamp is then placed in a specific category to which a name is traditionally given. While many of the color names were first defined in the 19th centu-ry, they are still in common use today. For example, shades including orange brown, deep orange brown, copper brown, dull red, claret and others are used. The result of this categorization is still more complex. Within each of these categories, which are generally determined by chroma, or basic color, there are many
5
gradations, for example from light to dark. While this primarily ad hoc procedure has been
refined through the years, the question remains: can a theoretical basis for this methodology be defined?
I. MATHEMATICAL DEVELOPMENT
Hypothetical Example
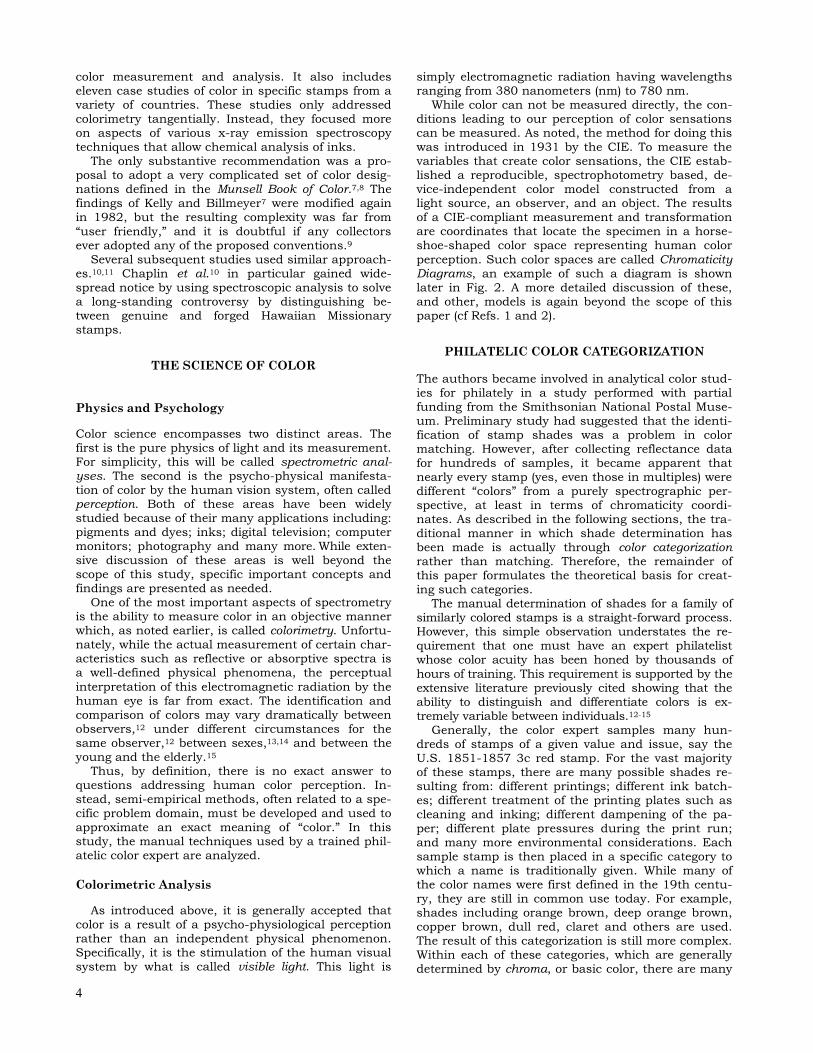
Consider the manual procedure outlined in the previ-ous section as applied to a universe, or population, of 38 samples of a specific stamp that appear to be shades of red. Assuming that the CIE 1976 u’, v’ chromaticity coordinates for each sample are known, the plot shown in Fig. 1 may be constructed. Alt-hough not considered in this manner, some envelope of the points defines a color gamut, G, in this chro-maticity space. The color expert has determined that
the 38 points represent three perceptual colors. The-se fall into three subsets of the gamut, A, B and C. As expected, the color categorization has partitioned the
gamut into three equivalence classes such that:
By philatelic convention, these colors have been named Carmine-red, Red-brown and Carmine.
Further, suppose that two of these 38 points, la-beled P and Q, lie outside of the three sets. The ex-pert feels that the colors represented by the two
points is inconsistent with the other colors. This problem could arise from many circumstances, exam-ples of which include: too small a data sample to en-compass all of the possible shades; environmental changes to the color of samples which have perma-nently changed them; or counterfeit or forged sam-ples printed in the wrong color. In any case, before continuing the analysis, it is necessary to resolve the problem with such points. For this hypothetical, the points will simply be ignored, i.e. eliminated.
The following steps present a methodology that is the equivalent to the manual approach except all of the steps are performed by colorimetric analysis of
spectrophotometry results.
Determining Chromaticity Coordinates
First, each stamp is sampled using a spectrophotom-eter. This device measures the resulting tristimulus values and converts them into points in the various
CIE color model spaces. Without loss of generality,
the CIE 1976 color space is used in this paper. Fig. 2 shows where the test samples, including the two eliminated points, lie in this full color space using the gamut defined by the color expert.
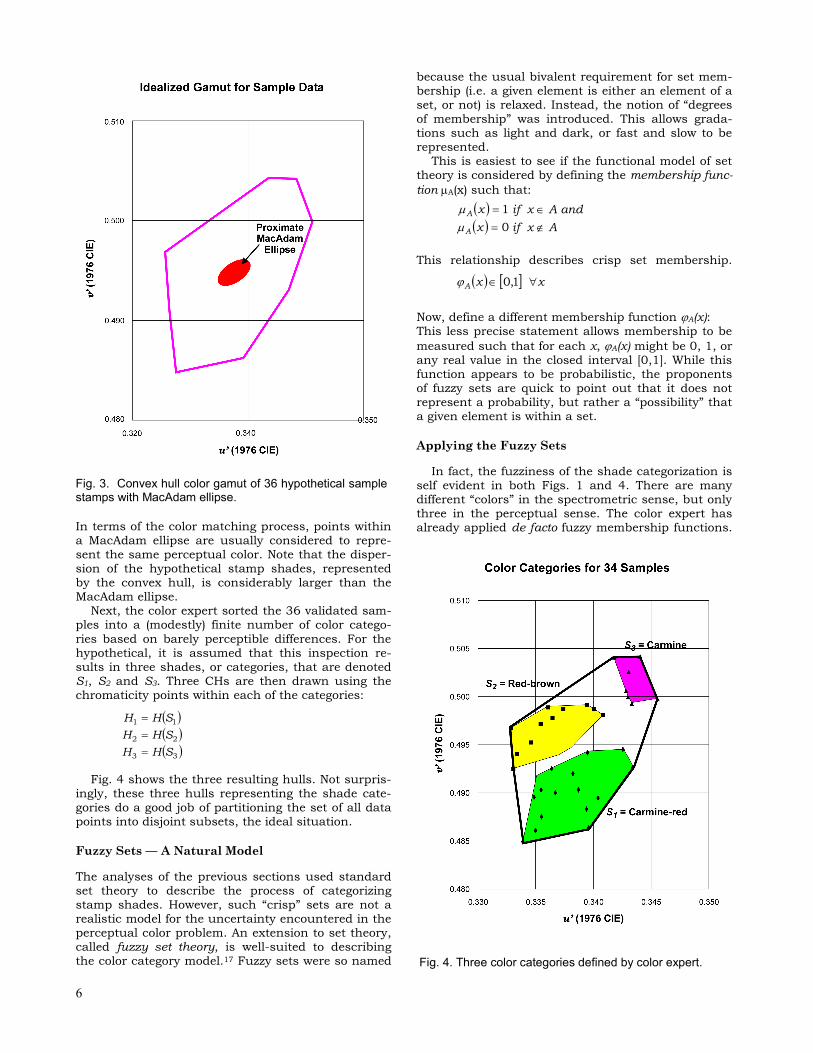
Now, in order to simplify the exposition, a mathe-matical idealization of this process is posed. Consider the polygon drawn in Fig. 3 to represent the color gamut covered by these samples. It has been con-structed by determining the convex hull (CH) of the set of data points. The CH is the minimal convex set containing the data points.16 Other models are possi-ble, and some were tested during this work. The con-vex hull was selected for simplicity. For any set X of chromaticity points, define H(X) as their convex hull.
The 36 data points, and the corresponding CH, are shown in Fig. 3. This is a very small area within the entire color space, as seen in Fig. 2. The small shad-ed ellipse shown in Fig. 3 is the proximate MacAdam ellipse.15 This is, the MacAdam ellipse closest to the algebraic center of the CH translated to that center.
G A B C
A B A C and B C ; ;
Fig. 2. The color gamut for the hypothetical sample space. Fig. 1. Three color categories defined by color expert.
6
In terms of the color matching process, points within a MacAdam ellipse are usually considered to repre-sent the same perceptual color. Note that the disper-sion of the hypothetical stamp shades, represented by the convex hull, is considerably larger than the MacAdam ellipse.
Next, the color expert sorted the 36 validated sam-ples into a (modestly) finite number of color catego-
ries based on barely perceptible differences. For the hypothetical, it is assumed that this inspection re-sults in three shades, or categories, that are denoted S1, S2 and S3. Three CHs are then drawn using the chromaticity points within each of the categories:
Fig. 4 shows the three resulting hulls. Not surpris-ingly, these three hulls representing the shade cate-
gories do a good job of partitioning the set of all data points into disjoint subsets, the ideal situation.
Fuzzy Sets — A Natural Model
The analyses of the previous sections used standard set theory to describe the process of categorizing stamp shades. However, such “crisp” sets are not a realistic model for the uncertainty encountered in the perceptual color problem. An extension to set theory, called fuzzy set theory, is well-suited to describing the color category model.17 Fuzzy sets were so named
because the usual bivalent requirement for set mem-bership (i.e. a given element is either an element of a set, or not) is relaxed. Instead, the notion of “degrees of membership” was introduced. This allows grada-tions such as light and dark, or fast and slow to be represented.
This is easiest to see if the functional model of set theory is considered by defining the membership func-
tion A(x) such that:
This relationship describes crisp set membership.
Now, define a different membership function A(x): This less precise statement allows membership to be
measured such that for each x, A(x) might be 0, 1, or any real value in the closed interval [0,1]. While this function appears to be probabilistic, the proponents of fuzzy sets are quick to point out that it does not represent a probability, but rather a “possibility” that a given element is within a set.
Applying the Fuzzy Sets
In fact, the fuzziness of the shade categorization is self evident in both Figs. 1 and 4. There are many different “colors” in the spectrometric sense, but only three in the perceptual sense. The color expert has already applied de facto fuzzy membership functions.
Fig. 3. Convex hull color gamut of 36 hypothetical sample stamps with MacAdam ellipse.
Fig. 4. Three color categories defined by color expert.
33
22
11
SHH
SHH
SHH
and
Ax
Ax
if
if
x
x
A
A
0
1
xxA 1,0
7
When one considers the size of the CHs relative to MacAdam ellipses it is clear that different experts might well disagree on which shades fit which catego-ries as the chromaticity moves away from the center of the individual CH.
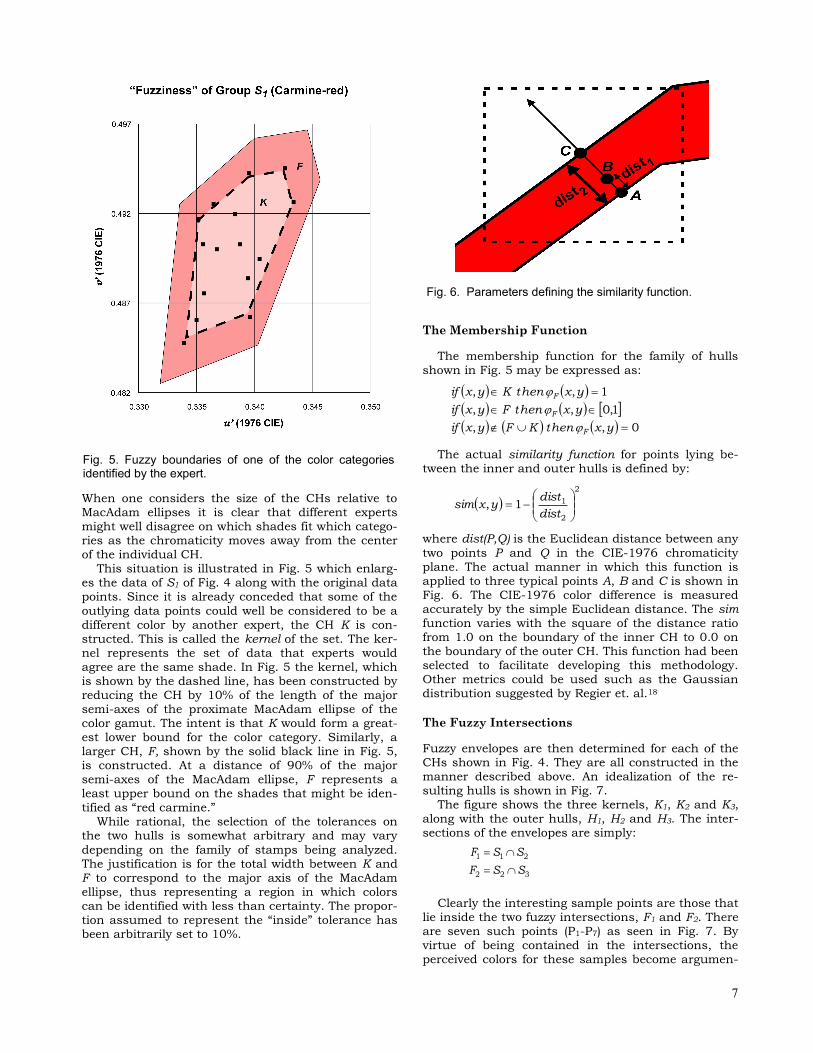
This situation is illustrated in Fig. 5 which enlarg-es the data of S1 of Fig. 4 along with the original data points. Since it is already conceded that some of the
outlying data points could well be considered to be a different color by another expert, the CH K is con-structed. This is called the kernel of the set. The ker-nel represents the set of data that experts would agree are the same shade. In Fig. 5 the kernel, which is shown by the dashed line, has been constructed by reducing the CH by 10% of the length of the major semi-axes of the proximate MacAdam ellipse of the color gamut. The intent is that K would form a great-est lower bound for the color category. Similarly, a larger CH, F, shown by the solid black line in Fig. 5, is constructed. At a distance of 90% of the major semi-axes of the MacAdam ellipse, F represents a least upper bound on the shades that might be iden-
tified as “red carmine.” While rational, the selection of the tolerances on
the two hulls is somewhat arbitrary and may vary
depending on the family of stamps being analyzed. The justification is for the total width between K and F to correspond to the major axis of the MacAdam ellipse, thus representing a region in which colors can be identified with less than certainty. The propor-tion assumed to represent the “inside” tolerance has been arbitrarily set to 10%.
The Membership Function
The membership function for the family of hulls shown in Fig. 5 may be expressed as:
The actual similarity function for points lying be-tween the inner and outer hulls is defined by:
where dist(P,Q) is the Euclidean distance between any
two points P and Q in the CIE-1976 chromaticity plane. The actual manner in which this function is applied to three typical points A, B and C is shown in Fig. 6. The CIE-1976 color difference is measured accurately by the simple Euclidean distance. The sim function varies with the square of the distance ratio from 1.0 on the boundary of the inner CH to 0.0 on the boundary of the outer CH. This function had been selected to facilitate developing this methodology. Other metrics could be used such as the Gaussian distribution suggested by Regier et. al.18
The Fuzzy Intersections
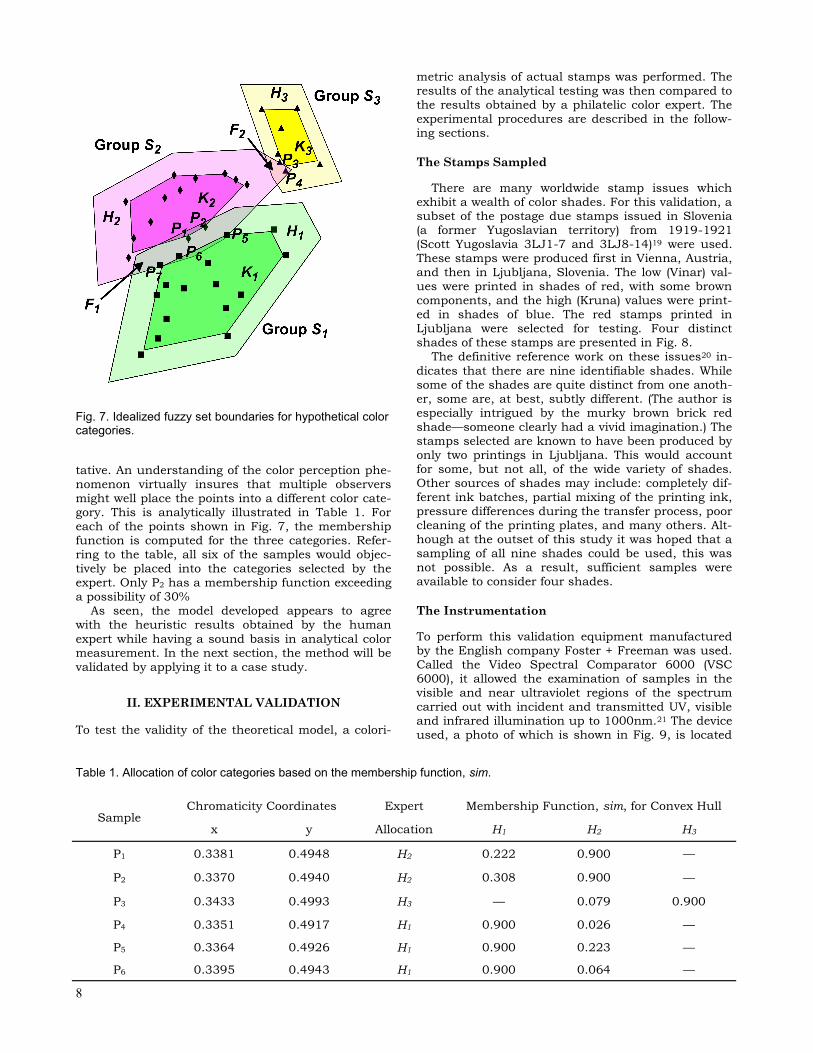
Fuzzy envelopes are then determined for each of the CHs shown in Fig. 4. They are all constructed in the manner described above. An idealization of the re-sulting hulls is shown in Fig. 7.
The figure shows the three kernels, K1, K2 and K3,
along with the outer hulls, H1, H2 and H3. The inter-sections of the envelopes are simply:
Clearly the interesting sample points are those that lie inside the two fuzzy intersections, F1 and F2. There are seven such points (P1-P7) as seen in Fig. 7. By virtue of being contained in the intersections, the perceived colors for these samples become argumen-
Fig. 5. Fuzzy boundaries of one of the color categories identified by the expert.
Fig. 6. Parameters defining the similarity function.
2
2
11,
dist
distyxsim
0,,
1,0,,
1,,
yxthenKFyxif
yxthenFyxif
yxthenKyxif
F
F
F
322
211
SSF
SSF
8
tative. An understanding of the color perception phe-nomenon virtually insures that multiple observers might well place the points into a different color cate-gory. This is analytically illustrated in Table 1. For each of the points shown in Fig. 7, the membership function is computed for the three categories. Refer-ring to the table, all six of the samples would objec-tively be placed into the categories selected by the expert. Only P2 has a membership function exceeding a possibility of 30%
As seen, the model developed appears to agree with the heuristic results obtained by the human
expert while having a sound basis in analytical color measurement. In the next section, the method will be validated by applying it to a case study.
II. EXPERIMENTAL VALIDATION
To test the validity of the theoretical model, a colori-
metric analysis of actual stamps was performed. The results of the analytical testing was then compared to the results obtained by a philatelic color expert. The experimental procedures are described in the follow-ing sections.
The Stamps Sampled
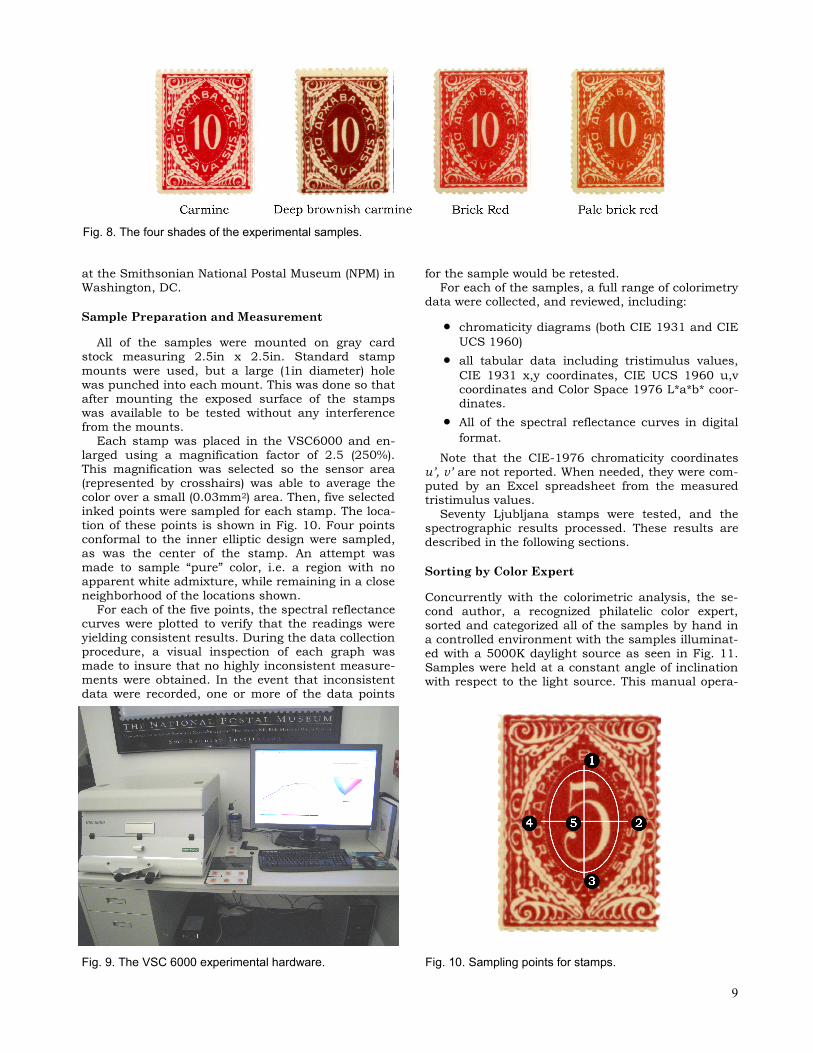
There are many worldwide stamp issues which exhibit a wealth of color shades. For this validation, a subset of the postage due stamps issued in Slovenia (a former Yugoslavian territory) from 1919-1921 (Scott Yugoslavia 3LJ1-7 and 3LJ8-14)19 were used. These stamps were produced first in Vienna, Austria, and then in Ljubljana, Slovenia. The low (Vinar) val-ues were printed in shades of red, with some brown components, and the high (Kruna) values were print-ed in shades of blue. The red stamps printed in Ljubljana were selected for testing. Four distinct shades of these stamps are presented in Fig. 8.
The definitive reference work on these issues20 in-
dicates that there are nine identifiable shades. While some of the shades are quite distinct from one anoth-er, some are, at best, subtly different. (The author is especially intrigued by the murky brown brick red shade—someone clearly had a vivid imagination.) The stamps selected are known to have been produced by only two printings in Ljubljana. This would account for some, but not all, of the wide variety of shades. Other sources of shades may include: completely dif-ferent ink batches, partial mixing of the printing ink, pressure differences during the transfer process, poor cleaning of the printing plates, and many others. Alt-hough at the outset of this study it was hoped that a sampling of all nine shades could be used, this was not possible. As a result, sufficient samples were available to consider four shades.
The Instrumentation
To perform this validation equipment manufactured by the English company Foster + Freeman was used. Called the Video Spectral Comparator 6000 (VSC 6000), it allowed the examination of samples in the visible and near ultraviolet regions of the spectrum carried out with incident and transmitted UV, visible and infrared illumination up to 1000nm.21 The device used, a photo of which is shown in Fig. 9, is located
Chromaticity Coordinates Expert Membership Function, sim, for Convex Hull Sample
x y Allocation H1 H2 H3
P1 0.3381 0.4948 H2 0.222 0.900 —
P2 0.3370 0.4940 H2 0.308 0.900 —
P3 0.3433 0.4993 H3 — 0.079 0.900
P4 0.3351 0.4917 H1 0.900 0.026 —
P5 0.3364 0.4926 H1 0.900 0.223 —
P6 0.3395 0.4943 H1 0.900 0.064 —
Table 1. Allocation of color categories based on the membership function, sim.
Fig. 7. Idealized fuzzy set boundaries for hypothetical color categories.
9
at the Smithsonian National Postal Museum (NPM) in Washington, DC.
Sample Preparation and Measurement
All of the samples were mounted on gray card
stock measuring 2.5in x 2.5in. Standard stamp
mounts were used, but a large (1in diameter) hole was punched into each mount. This was done so that after mounting the exposed surface of the stamps was available to be tested without any interference from the mounts.
Each stamp was placed in the VSC6000 and en-larged using a magnification factor of 2.5 (250%). This magnification was selected so the sensor area (represented by crosshairs) was able to average the color over a small (0.03mm2) area. Then, five selected inked points were sampled for each stamp. The loca-tion of these points is shown in Fig. 10. Four points conformal to the inner elliptic design were sampled, as was the center of the stamp. An attempt was made to sample “pure” color, i.e. a region with no apparent white admixture, while remaining in a close neighborhood of the locations shown.
For each of the five points, the spectral reflectance curves were plotted to verify that the readings were yielding consistent results. During the data collection procedure, a visual inspection of each graph was made to insure that no highly inconsistent measure-ments were obtained. In the event that inconsistent data were recorded, one or more of the data points
for the sample would be retested. For each of the samples, a full range of colorimetry
data were collected, and reviewed, including:
chromaticity diagrams (both CIE 1931 and CIE
UCS 1960)
all tabular data including tristimulus values,
CIE 1931 x,y coordinates, CIE UCS 1960 u,v coordinates and Color Space 1976 L*a*b* coor-dinates.
All of the spectral reflectance curves in digital
format.
Note that the CIE-1976 chromaticity coordinates u’, v’ are not reported. When needed, they were com-puted by an Excel spreadsheet from the measured tristimulus values.
Seventy Ljubljana stamps were tested, and the spectrographic results processed. These results are described in the following sections.
Sorting by Color Expert
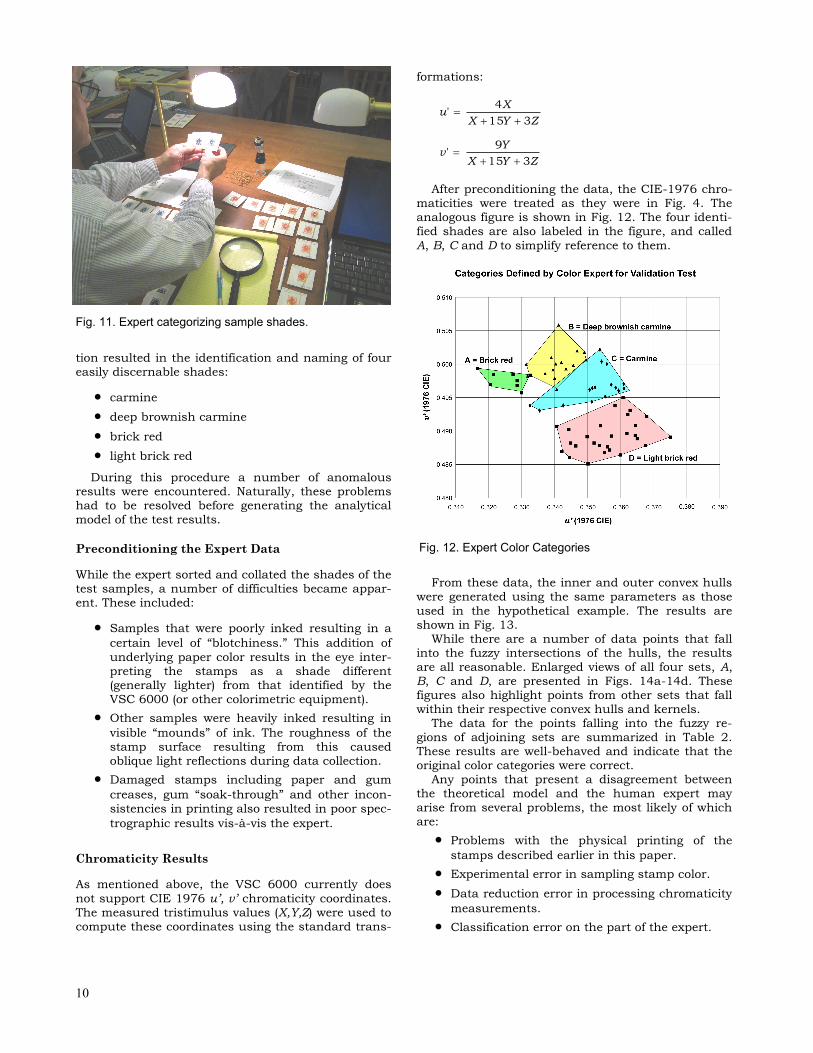
Concurrently with the colorimetric analysis, the se-cond author, a recognized philatelic color expert, sorted and categorized all of the samples by hand in a controlled environment with the samples illuminat-ed with a 5000K daylight source as seen in Fig. 11. Samples were held at a constant angle of inclination with respect to the light source. This manual opera-
Fig. 8. The four shades of the experimental samples.
Fig. 9. The VSC 6000 experimental hardware. Fig. 10. Sampling points for stamps.
10
tion resulted in the identification and naming of four easily discernable shades:
carmine
deep brownish carmine
brick red
light brick red
During this procedure a number of anomalous results were encountered. Naturally, these problems had to be resolved before generating the analytical model of the test results.
Preconditioning the Expert Data
While the expert sorted and collated the shades of the test samples, a number of difficulties became appar-ent. These included:
Samples that were poorly inked resulting in a
certain level of “blotchiness.” This addition of
underlying paper color results in the eye inter-preting the stamps as a shade different (generally lighter) from that identified by the VSC 6000 (or other colorimetric equipment).
Other samples were heavily inked resulting in
visible “mounds” of ink. The roughness of the stamp surface resulting from this caused oblique light reflections during data collection.
Damaged stamps including paper and gum
creases, gum “soak-through” and other incon-
sistencies in printing also resulted in poor spec-
trographic results vis-à-vis the expert.
Chromaticity Results
As mentioned above, the VSC 6000 currently does
not support CIE 1976 u’, v’ chromaticity coordinates. The measured tristimulus values (X,Y,Z) were used to compute these coordinates using the standard trans-
formations:
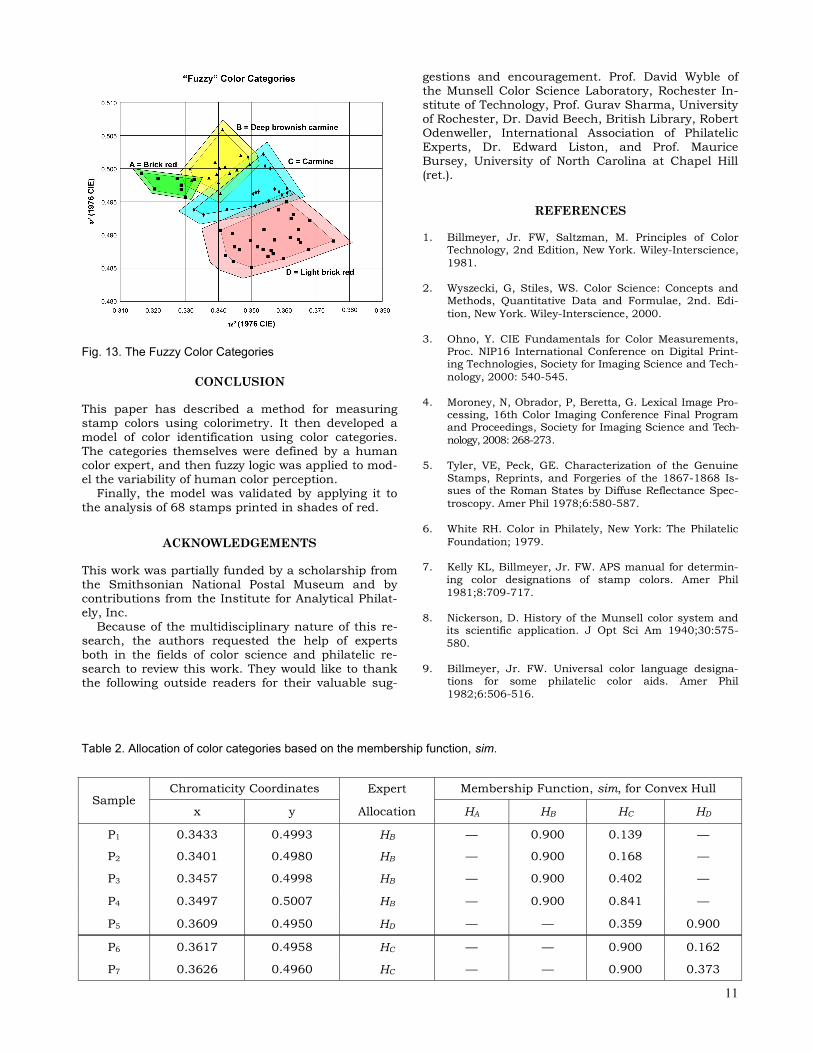
After preconditioning the data, the CIE-1976 chro-maticities were treated as they were in Fig. 4. The analogous figure is shown in Fig. 12. The four identi-fied shades are also labeled in the figure, and called
A, B, C and D to simplify reference to them.
From these data, the inner and outer convex hulls were generated using the same parameters as those
used in the hypothetical example. The results are shown in Fig. 13.
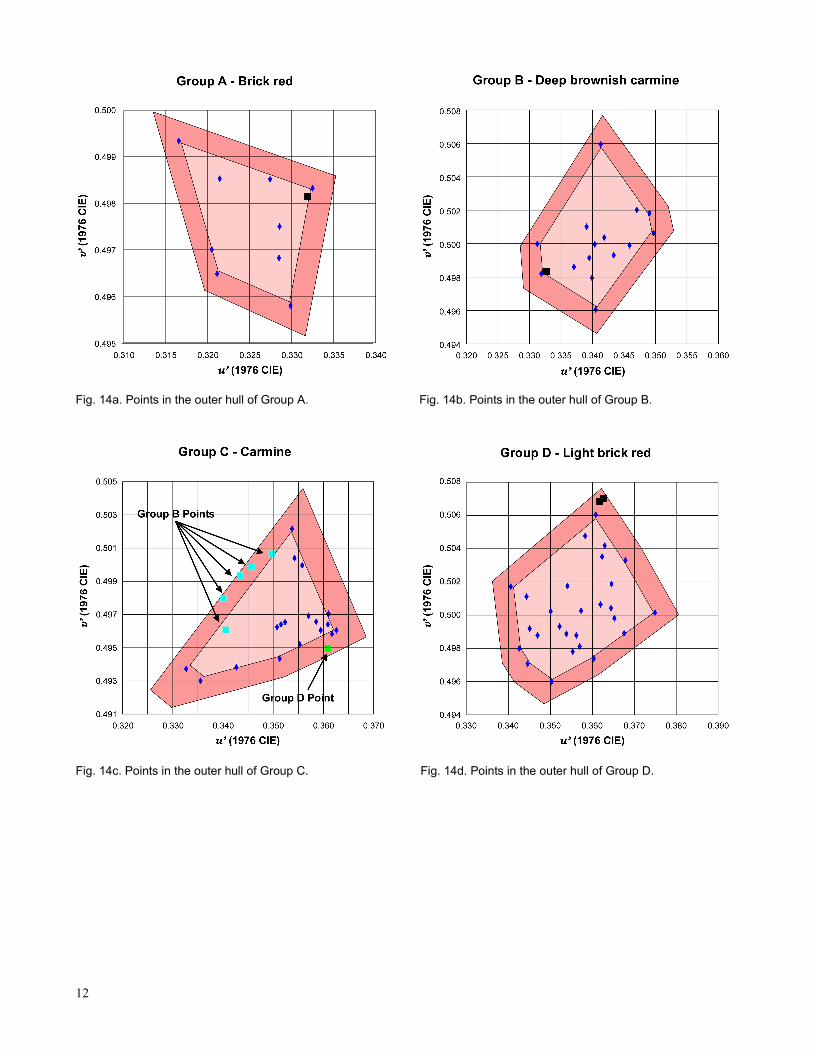
While there are a number of data points that fall into the fuzzy intersections of the hulls, the results are all reasonable. Enlarged views of all four sets, A, B, C and D, are presented in Figs. 14a-14d. These figures also highlight points from other sets that fall within their respective convex hulls and kernels.
The data for the points falling into the fuzzy re-gions of adjoining sets are summarized in Table 2. These results are well-behaved and indicate that the original color categories were correct.
Any points that present a disagreement between the theoretical model and the human expert may
arise from several problems, the most likely of which are:
Problems with the physical printing of the
stamps described earlier in this paper.
Experimental error in sampling stamp color.
Data reduction error in processing chromaticity
measurements.
Classification error on the part of the expert.
Fig. 11. Expert categorizing sample shades.
ZYX
Yv
ZYX
Xu
315
9'
315
4'
Fig. 12. Expert Color Categories
11
CONCLUSION
This paper has described a method for measuring stamp colors using colorimetry. It then developed a model of color identification using color categories. The categories themselves were defined by a human color expert, and then fuzzy logic was applied to mod-el the variability of human color perception.
Finally, the model was validated by applying it to the analysis of 68 stamps printed in shades of red.
ACKNOWLEDGEMENTS
This work was partially funded by a scholarship from the Smithsonian National Postal Museum and by contributions from the Institute for Analytical Philat-ely, Inc.
Because of the multidisciplinary nature of this re-search, the authors requested the help of experts both in the fields of color science and philatelic re-search to review this work. They would like to thank the following outside readers for their valuable sug-
gestions and encouragement. Prof. David Wyble of the Munsell Color Science Laboratory, Rochester In-stitute of Technology, Prof. Gurav Sharma, University of Rochester, Dr. David Beech, British Library, Robert Odenweller, International Association of Philatelic Experts, Dr. Edward Liston, and Prof. Maurice Bursey, University of North Carolina at Chapel Hill (ret.).
REFERENCES
1. Billmeyer, Jr. FW, Saltzman, M. Principles of Color
Technology, 2nd Edition, New York. Wiley-Interscience,
1981.
2. Wyszecki, G, Stiles, WS. Color Science: Concepts and
Methods, Quantitative Data and Formulae, 2nd. Edi-
tion, New York. Wiley-Interscience, 2000.
3. Ohno, Y. CIE Fundamentals for Color Measurements, Proc. NIP16 International Conference on Digital Print-ing Technologies, Society for Imaging Science and Tech-
nology, 2000: 540-545.
4. Moroney, N, Obrador, P, Beretta, G. Lexical Image Pro-cessing, 16th Color Imaging Conference Final Program and Proceedings, Society for Imaging Science and Tech-
nology, 2008: 268-273.
5. Tyler, VE, Peck, GE. Characterization of the Genuine
Stamps, Reprints, and Forgeries of the 1867-1868 Is-sues of the Roman States by Diffuse Reflectance Spec-
troscopy. Amer Phil 1978;6:580-587.
6. White RH. Color in Philately, New York: The Philatelic
Foundation; 1979.
7. Kelly KL, Billmeyer, Jr. FW. APS manual for determin-
ing color designations of stamp colors. Amer Phil
1981;8:709-717.
8. Nickerson, D. History of the Munsell color system and its scientific application. J Opt Sci Am 1940;30:575-
580.
9. Billmeyer, Jr. FW. Universal color language designa-tions for some philatelic color aids. Amer Phil
1982;6:506-516.
Fig. 13. The Fuzzy Color Categories
Sample Chromaticity Coordinates Expert Membership Function, sim, for Convex Hull
x y Allocation HA HB HC HD
P1 0.3433 0.4993 HB — 0.900 0.139 —
P2 0.3401 0.4980 HB — 0.900 0.168 —
P3 0.3457 0.4998 HB — 0.900 0.402 —
P4 0.3497 0.5007 HB — 0.900 0.841 —
P5 0.3609 0.4950 HD — — 0.359 0.900
P6 0.3617 0.4958 HC — — 0.900 0.162
P7 0.3626 0.4960 HC — — 0.900 0.373
Table 2. Allocation of color categories based on the membership function, sim.
12
Fig. 14a. Points in the outer hull of Group A. Fig. 14b. Points in the outer hull of Group B.
Fig. 14c. Points in the outer hull of Group C. Fig. 14d. Points in the outer hull of Group D.
13
10. Chaplin TD, Clark RJH, Beech DR. Comparison of gen-
uine (1851-1852 AD) and forged or reproduction Ha-waiian Missionary stamps using Raman microscopy. J.
Raman Spectrosc. 2002;32:424-428.
11. Chaplin TD, Jurado-Lopez A, Clark RJH, Beech DR. Identification by Ramen microscopy of pigments on early postage stamps: distinction between original 1847 and 1858-1862, forged and reproduction postage
stamps of Mauritius. J Raman Spectrosc 2004;35: 600
-604.
12. Kuehni, RG. Variability in estimation of suprathreshold
small color differences. Color Res Appl 2009;34:367-
374.
13. Bimler DL, Kirkland J, Jameson, KA. Quantifying varia-tions in personal color spaces: Are there sex differences
in color vision? Color Res Appl 2004;2:128-134.
14. Pérez-Carpinell, J, Camps, VJ, Trottini, M, Pérez-Baylach CM. Color memory in elderly adults. Color Res
Appl 2006;6:458-467.
15. MacAdam, D. Visual Sensitivities to Color Differences
in Daylight, J Op Soc Am 1942;5:247-274.
16. For an adequate, easy-to-access overview of the Convex Hull problem, see for example http://en.wikipedia.org/
wiki/Convex_hull.
17. Zadeh, LF. Fuzzy Sets, Information and Control,
1965;8:338-353.
18. Regier, T, Kay, P, Khetarpal, N. Color Naming Reflects Optimal Partition of Color Space. PNAS 2007;104
(4):1436-1441.
19. Scott 2003 Classic Specialized Catalogue of Stamps and Covers, 1840-1940, Sidney, OH, Scott Publishing
Co., 2003.
20. Cicerov, S. Slovenija Portovne Znamke 1919-1921,
Ljubljana, Slovenia, Masta Trade, 2008.
21. VSC 6000, Video Spectral Comparator Software Manu-
al, 2009, Foster + Freeman, Worcestershire, UK..


![The Philatelic Writing of reports.pdfA4 1 Report re9 2006 April Philatelic Bulletin Poll -Results regarding 2005 programme Philatelic Bulletin [GB] A5 5 Report re10 2006 May Philatelic](https://img.pdfslide.net/doc/110x75/5f89a4fbbd89bb69e409ac92/the-philatelic-writing-of-reportspdf-a4-1-report-re9-2006-april-philatelic-bulletin.jpg)