Embed Size (px)
Citation preview

PHILHEALTH
UPDATES
ISRAEL FRANCIS A. PARGAS, M.D. Acting Senior Vice President Health Finance Policy Sector

Outline
I. Updates on BenefitsII. Updates on Claims Processing
III. Updates on Accreditation

NEW
Children with
Disabilities
I. Updates on Benefits

Benefit Package for
Develop mental
Disability
Benefit Package for
Mobility Impairment
Benefit Package for
Visual Disabilities
Benefit Package for
Hearing Impairment
Benefit Packages for CWDs

P.C. No. 2018-0017
EXPANDED PRIMARY CARE
BENEFIT PACKAGE

P.C. No. 2018-0017
EXPANSION OF THE PRIMARY
CARE PACKAGE (EPCB) TO COVER
FORMAL ECONOMY, LIFETIME
MEMBERS AND SENIOR CITIZENS

7
23.0 M
(39.5M) Expansion

ePCB Package
Average
800.00
(Risk based capitation
fee)
Health Screening
and assessment/ consultation
Essential Services
Complete dose of medicines
8

9
PCB Providers
Private medical outpatient clinics
Level 1,2 and 3 government and private hospitals
Non-hospital facilities
(ASCs and infirmaries)

10
AGE, UTI, URTI,
Pneumonia (Low Risk),
Asthma, HYPERTENSION, DIABETES MELLITUS TYPE II
Covered
Disease Conditions

11
•Health screening and
assessment
•Diagnostics: (CBC, Urinalysis,
Fecalysis, Lipid Profile, FBS,
Chest X-ray, Sputum
microscopy, OGTT, Paps
smear/VIA, ECG)
•Complete dose of medicines
for the covered disease
conditions
Benefit Inclusions

Requirements for ePCB HCI
12
• Passed the accreditation standards
• Installed and operational electronic reporting system (online or offline)
• Extended consultation hours (until 9:00 pm on week days & week ends)

13
EXPANDED PCBVARIABLES
Payment Mechanism
Benefit Package Amount
Targets for payment release
Recording and Reporting
Capitation PLUS fixed co-payment
Average of Php 800.00 per family per year
(Risk-based capitation)SC/LF – Php 900.00 per family per year
FE – PhP 700.00 per family per year
Assignment (60%)
Achieve at least 4 performance targets (40%)
Electronic PCB data recording system

15

16

17

BENEFITS IN THE PIPELINE
EXPANDED
NEWBORN
CARE
PACKAGE

BENEFITS IN THE PIPELINE
Outpatient
Benefit for
Rheumatic
Heart Disease

CLAIMS STATISTICS
II. Updates on Claims Processing

PROAve. Daily
ReceivedNCR-North
2,466
NCR-Central
3,410
NCR-South
2,297
IV-A 3,185
IV-B 2,434
V 1,691
16%
22%
15%
20%
16%
11%
AREA2 AVERAGE CLAIMS RECEIVED
NCR-North NCR-Central NCR-South
IV-A IV-B V

6,973,234
7,306,805
7,806,329
2016 2017 2018
Comparative National Yearly Received Claims January -August
12%
increase
from
2016

31% incease from jan
received
0
200,000
400,000
600,000
800,000
1,000,000
1,200,000
1,400,000
Jan Feb March April May June July August
2018 monthly claims received nationwide
23% increase from January
Jan Feb March April May June July August
815,574 805,631 1,043,578 856,177 976,729 1,045,335 1,170,533 1,003,319

TURN AROUND TIME
Number of days to process claims
from general receiving to Check
Generation
As per IRR: 60 days

68 days
44 days
JANUARY AUGUST
2018 NATIONAL TURN AROUND TIME

2018 MONTHLY TURN AROUND TIME PER REGION
PRO JANUARY FEBRUARY MARCH APRIL MAY JUNE JULY AUGUST
NCR-North 60 50 32 34 30 36 36 31
NCR-Central 84 77 77 72 59 53 44 42
NCR-South 32 40 31 48 59 55 49 50
IV-A 51 55 54 83 63 65 47 20
IV-B 52 65 63 63 96 59 58 50
NATIONAL 68 61 53 59 63 60 56 44

58 days
56 days
government private
Turn Around Time per HCI Sector

83 days
37 days
manual eclaims
TURN AROUND TIME MODE of SUBMISSION

• Claims processing through eClaims
submission
HITP (third party)
PhilHealth Information Claims System (PHICS)
Sclaims
Initiatives Undertaken to Reduce TAT

Electronic Eligibility
Check (Initial)
ElectronicClaim
Submission
HCI PHIC
ElectronicPayment
ElectronicAdjudication
ElectronicEligibility
Check (Final)
Electronic Claim Status Verification
Module 1
Module 2 Module 4
Module 5
Module 3
ECL A I
M S
ACPS
ADVANTAGES of eCLAIMS Submission

mode jan feb march april may june july aug
manual 67% 48% 42% 16% 9% 6% 3% 2%
eclaims 33% 52% 58% 84% 91% 94% 97% 98%
0%
20%
40%
60%
80%
100%
120%
jan feb march april may june july aug
2018 Monthly National ECLAIMS COMPLIANCE
manual eclaims

• Electronic Payment through
Auto Credit Payment Scheme (ACPS)
Initiatives Undertaken to Reduce TAT

What is the implication of ACPS Noncompliance?
PhilHealth Circular No. 2017-0020
All Claims of noncompliant facilities to ACPS
shall be processed by the PROs until check
generation but the printed checks shall
not be released to the HCIs until
they have complied with the
requirements of the ACPS policy.

PRO % compliance
NCR Central 100%
NCR North 98%
NCR South 100%
PRO CAR 96%
PRO I 100%
PRO II 100%
PRO III-A 99%
PRO III-B 98%
PRO IV-A 98%
PRO IV-B 100%
PRO V 100%
PRO VI 100%
88
47
57
25
81
63
87 85
126
84
52
61
88
46
57
24
81
63
8683
124
84
52
61
LUZON ACPS COMPLIANCE
HCIs ACPS

6,718,374 6,706,822
7,243,272
2016 2017 2018
Comparative Yearly Paid Claim Count January-August
8%
increase
from year
2016

65,235,083,332.47
66,595,737,390.05
70,068,123,968.11
2016 2017 2018
Comparative Yearly Paid Claim Amount January-August
7%
increase
from year
2016

Comparative AGEING of PAID CLAIMS
49%51%
January 2018
<60 days >60 days
79%
21%
AUGUST 2018
<60 days >60 days

0%
10%
20%
30%
40%
50%
60%
70%
80%
90%
jan feb march april may june july aug
2018 monthly ageing of paid claims nationwide
within 60 days more than 60 days
AGEING jan feb march april may june july aug
within 60 days
51% 58% 70% 66% 61% 65% 71% 79%
more than 60 days
49% 42% 30% 34% 39% 35% 29% 21%

42%
58%
PERCENTAGE OF PAID CLAIMS HCI SECTOR
government private
HCI Sector count amount
government 3,084,628 30.8M
private 4,315,508 40.7M

Summary of Claims Status Report (SCSR)
submitted to facility through email
Reconciliation Summary Module (RSM)
accessed through HCI Portal
Avenues to Reconcile Paid and Unpaid HCI claims

PHILHEALTH ABS CBN HOSPITAL
gross

HFPS Forum, <date>
JASPERSAM MEDICAL CENTER
JASPERSAM MEDICAL CENTER

REMINDERS:
PAYABLES : CLAIMS IN PROCESS
NON-PAYABLE : DENIED CLAIMS
RTH CLAIMS
UNLESS REFILED

January February March April May June July August
RTH Denied RTH Denied Denied Denied Denied RTH RTH Denied Denied Denied Denied RTH RTH Denied
4% 4% 5% 5% 7% 5% 9% 5% 10% 5% 8% 4% 6% 2% 8% 1%
jan feb march april may june july aug
2018 Monthly RTH DENIED claims nationwide
RTH denied

PRO January February March April May June July August
RTH Denied RTH Denied Denied Denied Denied RTH RTH Denied Denied Denied Denied RTH RTH Denied
NCR-N 5% 4% 11% 5% 10% 5% 14% 4% 12% 5% 6% 2% 1% 1% 4% 1%
NCR-C 2% 4% 2% 4% 3% 4% 15% 4% 22% 5% 10% 4% 4% 2% 12% 1%
NCR-S 6% 3% 9% 3% 18% 3% 21% 6% 23% 6% 20% 4% 6% 1% 10% 0%
IV-A 3% 3% 9% 7% 10% 11% 12% 10% 14% 5% 14% 4% 12% 3% 13% 1%
IV-B 2% 2% 4% 3% 4% 2% 8% 2% 6% 2% 2% 1% 2% 0% 5% 0%
V 4% 12% 4% 15% 5% 17% 6% 11% 18% 15% 18% 11% 16% 6% 11% 2%
national 4% 4% 5% 5% 7% 5% 9% 5% 10% 5% 8% 4% 6% 2% 8% 1%

TOP REASONS FOR RETURN TO HOSPITAL CLAIMS
Electronic Submission
Not Properly Accomplished SOA
encoding of CSF & CF2 (not properly accomplished - attached files)
no attachment of Chart (for PCF, AGE, Pneumonia, UTI & Sepsis
Wrong use of PhilHealth Accreditation Number of Health Care Institution
(eg. Claiming of animal bite package but the HCI used the PAN for PCB
accreditation)
Require properly accomplished valid claim signature form
Scanned Documents submitted-Unviewable/cannot be loaded
Required Medical Documents (No Clinical chart attached, No NBS
Sticker and Hearing Test result, No CPSA IOL Sticker)
Discrepancy on charges in Form 2 part III vs SOA
Failed the membership data validation check
TOP REASONS FOR DENIED CLAIMS
VIOLATION OF SINGLE PERIOD POLICY
CASE NOT COMPENSABLE AS PER CIRCULAR
FILED BEYOND 60 DAYS STATUTORY PERIOD
CASE RATE CLAIM ATTENDED BY NOT ACCREDITED
DOCTOR
CONFINEMENT NOT WITHIN HOSPITAL
ACCREDITATION PERIOD
LENGTH OF STAY (LOS) REQUIREMENT NOT MET
EXHAUSTED 45 COMPENSABLE DAYS
PATIENT NOT REGISTERED IN PHILHEALTH DIALYSIS
DATABASE
CONFINEMENT NOT WITHIN CLAIM ELIGIBILITY
PERIOD
MEDICAL CASE RATE ADMITTED LESS THAN 24
HOURS
DOUBLE FILING/SAME DAY CONFINEMENT
OVERLAPPING CONFINEMENT
EXPIRED VALIDITY
NON-COMPLIANT TO 3/6 RULE

Claims without SOA
Circular 2017 0014
TB DOTS
Malaria package
OHAT
Z Benefit package

ACCREDITATION STATS AS OF August 2018
III. Updates on Accreditation

NCR I II III IVA IVB V VI VII VIII IX X XI XIIARM
MCAR
CARAGA
L3 57 4 1 10 3 4 3 9 9 2 1 2 5 3 0 2 0
L2 44 23 13 43 49 20 17 16 15 8 8 22 19 15 2 5 10
L1 92 54 49 119 77 60 33 37 34 39 25 46 33 43 29 18 12
INF/DISP 37 36 34 35 26 46 56 30 51 39 28 41 60 55 17 32 33
ASC 79 7 7 19 7 2 3 5 7 2 2 3 6 3 0 2 4
FDC 113 19 10 55 29 16 10 12 14 10 3 7 13 5 0 5 4
0
20
40
60
80
100
120
140
Co
un
tCY 2018

NCR I II III IVA IVB V VI VII VIII IX X XI XIIARM
MCAR
CARAGA
PCB 424 129 93 277 93 118 103 134 157 174 77 106 52 48 110 94 67
MCP 352 129 114 278 283 102 176 117 200 216 91 120 154 127 135 95 80
DOTS 262 149 101 191 74 94 69 140 142 170 73 78 55 42 110 93 73
ABTC 29 32 26 36 48 30 20 35 31 28 20 5 9 19 6 28 8
0
50
100
150
200
250
300
350
400
450
Co
un
tCY 2018

2010 2011 2012 2013 2014 2015 2016 2017 2018
Physician 21529 23390 26358 27070 30812 32008 29822 29860 30135
Dentist 177 201 232 242 356 384 338 328 331
Midwife 354 518 824 1195 2159 1984 1654 1581 1579
0
5000
10000
15000
20000
25000
30000
35000
Nu
mb
er
Professionals, 2010 to 2018 (March 31, 2018)
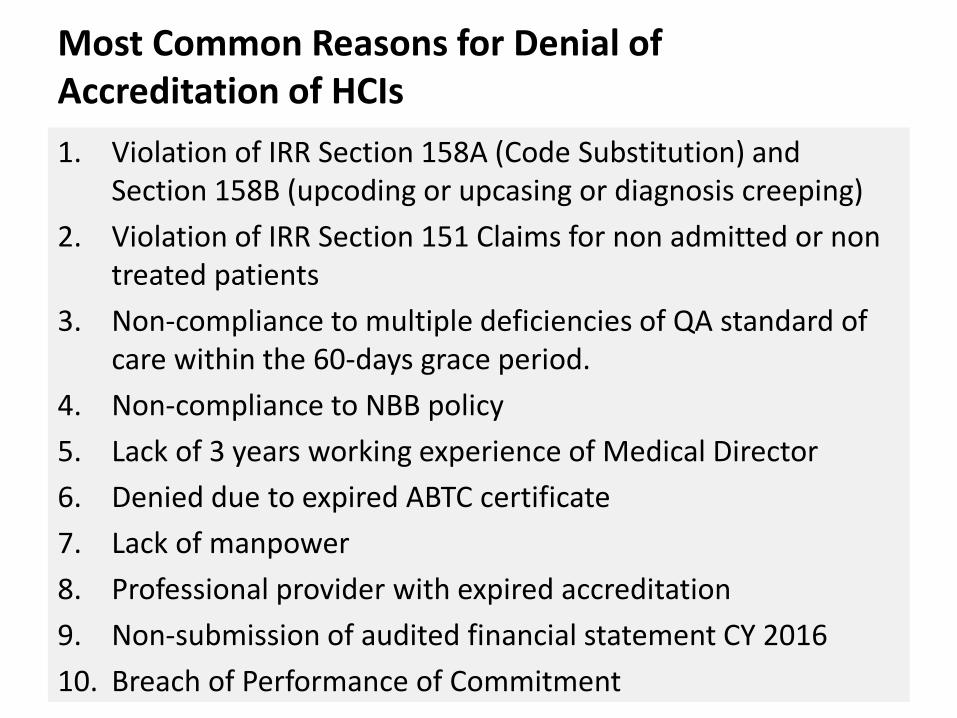
Most Common Reasons for Denial of Accreditation of HCIs
1. Violation of IRR Section 158A (Code Substitution) and Section 158B (upcoding or upcasing or diagnosis creeping)
2. Violation of IRR Section 151 Claims for non admitted or non treated patients
3. Non-compliance to multiple deficiencies of QA standard of care within the 60-days grace period.
4. Non-compliance to NBB policy
5. Lack of 3 years working experience of Medical Director
6. Denied due to expired ABTC certificate
7. Lack of manpower
8. Professional provider with expired accreditation
9. Non-submission of audited financial statement CY 2016
10. Breach of Performance of Commitment

Most Commons Reasons for denial of Accreditation of Professionals
1. Claims for non-admitted/non-treated patients
2. Misrepresentation
3. Other Integrity Issues based on adverse findings
4. for midwives: Admission of high risk patients (<19 and >35 y/o)

Recent IssuancesPC 2018-0014
• Contains policy on Medical Prepayment Review: (admissibility and use of non-PNF)– Use of CF4 on all claims
– Admissibility criteria for 4 conditions
– Deduction of applicable amount to claims with non-PNF drugs
• Effective for admissions starting September 1, 2018.

Clarification on Deferment
• Also includes deferment of deduction of PNF drugs, however, monitoring will continue (status quo) until further notice


Health Care
Professional Portal
Monitor/Track PhilHealth
benefits of patients
Check status of claims filed by
health care facilities and date of
reimbursement
Register thru https://partners.philhealth.gov.ph

PhilHealth Circular No.0035, s. 2013
(ACR Policy No. 2)
• Distribution of the reimbursement within thirty (30) calendar days from the date of receipt of the
same by the HCI…• Subject to monitoring thru HCP
PAS

IDC Digital Transformation Awards 2018
Information Visionary Leader (PhilHealth)
Digital Transformation Leader (CIO Jovita Aragona)

69
The best way to find
yourself is to lose yourself
in the service of others…
Mahatma Gandhi