Embed Size (px)
Citation preview
DISCLOSURE APPENDIX AT THE BACK OF THIS REPORT CONTAINS IMPORTANT DISCLOSURES, ANALYST CERTIFICATIONS, AND THE STATUS OF NON-US ANALYSTS. US Disclosure: Credit Suisse does and seeks to do business with companies covered in its research reports. As a result, investors should be aware that the Firm may have a conflict of interest that could affect the objectivity of this report. Investors should consider this report as only a single factor in making their investment decision.
CREDIT SUISSE SECURITIES RESEARCH & ANALYTICS BEYOND INFORMATION®
Client-Driven Solutions, Insights, and Access
30 September 2014
Asia Pacific/Philippines
Equity Research
Casinos & Gaming (Hotels/Restaurants/Gaming PH (Asia))
Philippine Gaming Sector ASSUMING COVERAGE
All the right cards
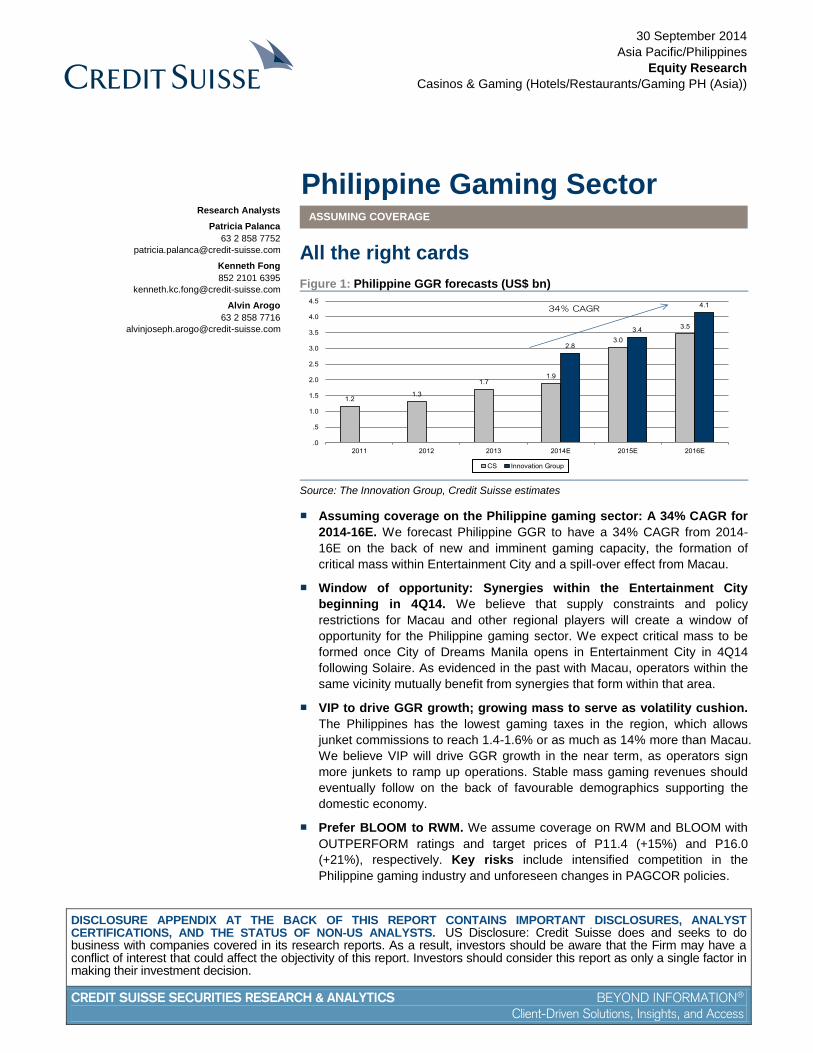
Figure 1: Philippine GGR forecasts (US$ bn)
1.21.3
1.71.9
3.0
3.5
2.8
3.4
4.1
.0
.5
1.0
1.5
2.0
2.5
3.0
3.5
4.0
4.5
2011 2012 2013 2014E 2015E 2016E
CS Innovation Group
34% CAGR
Source: The Innovation Group, Credit Suisse estimates
■ Assuming coverage on the Philippine gaming sector: A 34% CAGR for
2014-16E. We forecast Philippine GGR to have a 34% CAGR from 2014-
16E on the back of new and imminent gaming capacity, the formation of
critical mass within Entertainment City and a spill-over effect from Macau.
■ Window of opportunity: Synergies within the Entertainment City
beginning in 4Q14. We believe that supply constraints and policy
restrictions for Macau and other regional players will create a window of
opportunity for the Philippine gaming sector. We expect critical mass to be
formed once City of Dreams Manila opens in Entertainment City in 4Q14
following Solaire. As evidenced in the past with Macau, operators within the
same vicinity mutually benefit from synergies that form within that area.
■ VIP to drive GGR growth; growing mass to serve as volatility cushion.
The Philippines has the lowest gaming taxes in the region, which allows
junket commissions to reach 1.4-1.6% or as much as 14% more than Macau.
We believe VIP will drive GGR growth in the near term, as operators sign
more junkets to ramp up operations. Stable mass gaming revenues should
eventually follow on the back of favourable demographics supporting the
domestic economy.
■ Prefer BLOOM to RWM. We assume coverage on RWM and BLOOM with
OUTPERFORM ratings and target prices of P11.4 (+15%) and P16.0
(+21%), respectively. Key risks include intensified competition in the
Philippine gaming industry and unforeseen changes in PAGCOR policies.
Research Analysts
Patricia Palanca
63 2 858 7752
Kenneth Fong
852 2101 6395
Alvin Arogo
63 2 858 7716
30 September 2014
Philippine Gaming Sector 2
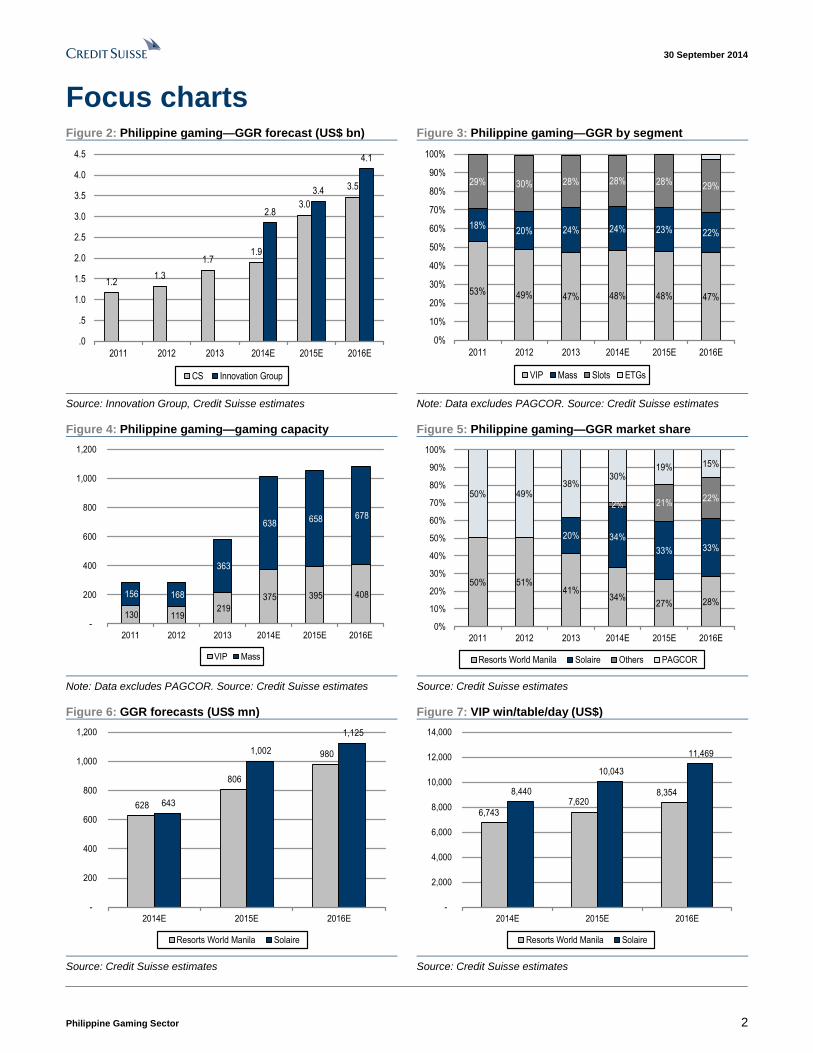
Focus charts Figure 2: Philippine gaming—GGR forecast (US$ bn) Figure 3: Philippine gaming—GGR by segment
1.21.3
1.71.9
3.0
3.5
2.8
3.4
4.1
.0
.5
1.0
1.5
2.0
2.5
3.0
3.5
4.0
4.5
2011 2012 2013 2014E 2015E 2016E
CS Innovation Group
53% 49% 47% 48% 48% 47%
18%20% 24% 24% 23% 22%
29% 30% 28% 28% 28% 29%
0%
10%
20%
30%
40%
50%
60%
70%
80%
90%
100%
2011 2012 2013 2014E 2015E 2016E
VIP Mass Slots ETGs
Source: Innovation Group, Credit Suisse estimates Note: Data excludes PAGCOR. Source: Credit Suisse estimates
Figure 4: Philippine gaming—gaming capacity Figure 5: Philippine gaming—GGR market share
130 119 219
375 395 408 156 168
363
638 658 678
-
200
400
600
800
1,000
1,200
2011 2012 2013 2014E 2015E 2016E
VIP Mass
50% 51%41%
34%27% 28%
20% 34%
33% 33%
2% 21%22%50% 49%
38%30%
19% 15%
0%
10%
20%
30%
40%
50%
60%
70%
80%
90%
100%
2011 2012 2013 2014E 2015E 2016E
Resorts World Manila Solaire Others PAGCOR
Note: Data excludes PAGCOR. Source: Credit Suisse estimates Source: Credit Suisse estimates
Figure 6: GGR forecasts (US$ mn) Figure 7: VIP win/table/day (US$)
628
806
980
643
1,002
1,125
-
200
400
600
800
1,000
1,200
2014E 2015E 2016E
Resorts World Manila Solaire
6,743 7,620
8,354 8,440
10,043
11,469
-
2,000
4,000
6,000
8,000
10,000
12,000
14,000
2014E 2015E 2016E
Resorts World Manila Solaire
Source: Credit Suisse estimates Source: Credit Suisse estimates
30 September 2014
Philippine Gaming Sector 3
All the right cards A 34% CAGR in GGR from 2014-16E
We estimate Philippine gross gaming revenue (GGR) to double from US$1.7 bn in 2013 to
US$3.5 bn in 2016E, or a CAGR of 34% over 2014-16E. A total of 440 tables (+76% from
now) will be added in 4Q14 with the opening of City of Dreams Manila and Solaire's Phase 1A
expansion.
Window of opportunity: Synergies within
Entertainment City beginning in 4Q14
We believe that the limited number of new casino projects and additional gaming supply
within the region will provide a window of opportunity for the Philippine gaming industry.
We expect it to receive spill-over from Macau, as Chinese VIP players look outside of
Macau, at least in the near term, on the back of newly implemented policy restrictions.
Also, new gaming capacity in Macau will only open by mid-2015 at the earliest. Macau's
gaming table expansion is limited to 3% YoY growth for the next ten years. Likewise,
Genting Highlands remains the sole venue for legalised casino gambling in Malaysia and
the Singapore casino gaming market is still limited to a duopoly through 2017. It is our
view that the Philippines is well-positioned to capitalise on the constrained capacity of
regional competitors. City of Dreams Manila and Solaire's Phase1A expansion are
scheduled to be launched in 4Q14 and should be able to build critical mass in the area as
was witnessed in the past with Macau. We expect that the two integrated resorts will also
derive benefits from the strong retail base of Melco's partner in CoD Manila, the SM group.
The group's largest mall—SM Mall of Asia—generates average foot traffic of around
200,000 people daily and is roughly 1km away from CoD Manila.
VIP to drive GGR growth; growing mass to serve as
volatility cushion
The Philippines has the lowest gaming taxes in the region, which allows junket
commissions to reach 1.4-1.6% or as much as 14% over that of Macau. Moreover, the
Philippines is also relatively more attractive versus its regional counterparts due to: (1) the
imminent supply of gaming capacity; (2) a shorter travel time from China; and (3) evident
government support of gaming and tourism. According to a study by the United Nations,
the Philippines will also enter a "demographic window" by 2015 whereby most of the
population will be of working age (15-65 years old). We expect that such favourable
demographics will eventually provide earnings stability in the form of mass gaming
revenues and soften the earnings volatility from the VIP segment.
Prefer BLOOM (+21%) over RWM (+15%)
We assume coverage on RWM and BLOOM with OUTPERFORM ratings and target
prices of P11.4 and P16.0, respectively. BLOOM has the first mover advantage inside
Entertainment City and should benefit from the synergies with the opening of CoD Manila
in 4Q14. We believe most of the forecast growth in the industry will be captured by the
new players—Solaire and CoD Manila—and we expect RWM and PAGCOR-owned
casinos to lose some market share. We estimate BLOOM will achieve leading market
share by 2015E. Despite a lack of catalysts and low margins for RWM, we retain an
OUTPERFORM rating, as the company has substantial expansion plans, albeit not in the
near term. Key risks include intensified competition in the Philippine gaming industry and
unforeseen changes in PAGCOR policies.
Philippine GGR to double to
US$3.5 bn in 2016E
Critical mass to build up in
the Entertainment City as
synergies form within the
area
The VIP segment to drive
near-term growth while the
mass market gradually
builds up
BLOOM is well-positioned to
capitalise on the industry
positives that we see on the
horizon

30 September 2014
Philippine Gaming Sector 4
Valuation comparison Figure 8: Valuation summary
Share Up/dwn P/E EPS growth EV/EBITDA ROE Div. yield
Company Mkt cap CS price TP pot. (x) (%) (x) (%) (%)
name Ticker (US$ mn) rat. (l.c.) (l.c.) (%) 14E 15E 14E 215E 14E 15E 14E 15E 14E 15E
Philippines 33.9 25.6 -185.2 32.0 16.9 11.1 27.2 28.5 0.4 0.3
Bloomberry BLOOM.PS 3,127 O 13.3 16.0 20 30.2 22.4 (439) 34 17.3 10.8 28.8 29.0 - -
Travellers RWM.PS 3,469 O 9.9 11.4 15 37.3 28.5 44 30 16.6 11.4 25.8 28.0 0.8 0.5
Macau 16.1 14.4 15.0 11.8 12.7 11.7 48.8 48.8 4.7 5.2
MGM China 2282.HK 11,261 O 23.0 30.0 30 14.3 14.1 15 1 12.4 12.8 90.5 81.0 5.3 5.7
Sands China 1928.HK 43,130 O 41.5 57.1 38 15.6 13.6 25 14 13.2 12.0 42.4 46.4 6.4 7.3
Wynn Macau 1128.HK 16,970 N 25.4 29.0 14 17.0 16.6 0 2 14.8 15.0 89.6 88.3 5.0 4.8
Galaxy 0027.HK 25,340 N 46.4 55.0 19 17.1 15.1 16 13 13.2 11.2 32.8 31.1 1.8 2.1
SJM 0880.HK 11,179 N 15.3 17.6 15 12.1 10.8 (9) 13 7.8 7.2 27.7 26.4 6.0 6.8
Melco International 0200.HK 3,660 O 18.2 22.8 25 15.1 12.3 15 23 n/a n/a 14.8 16.1 1.3 1.6
Macau Legend 1680.HK 3,292 N 4.0 3.9 (2) 32.8 23.4 36 40 23.3 18.5 11.6 13.1 - -
Other Asia 18.2 16.7 12.5 9.0 7.4 6.6 8.5 8.8 1.3 1.4
NagaCorp Limited 3918.HK 1,641 O 5.6 7.5 34 11.6 10.6 (1) 9 9.1 7.3 23.4 26.9 5.3 6.6
Genting Malaysia GENM.KL 7,568 N 4.2 4.0 (4) 16.6 15.2 (7) 9 9.4 8.2 9.4 9.8 1.8 1.8
Genting Singapore GENS.SI 10,947 O 1.1 1.7 49 22.0 19.9 4 11 8.9 8.1 6.4 6.6 0.9 0.9
Genting Berhad GENT.KL 10,685 O 9.3 11.0 18 16.5 15.4 37 7 4.2 3.8 7.9 7.5 0.7 0.7
Sector average 22.8 18.9 -52.5 17.6 12.3 9.8 28.2 28.7 2.1 2.3
Note: Pricing as of 29 September 2014.
Source: Company data, Credit Suisse estimates
30 September 2014
Philippine Gaming Sector 5
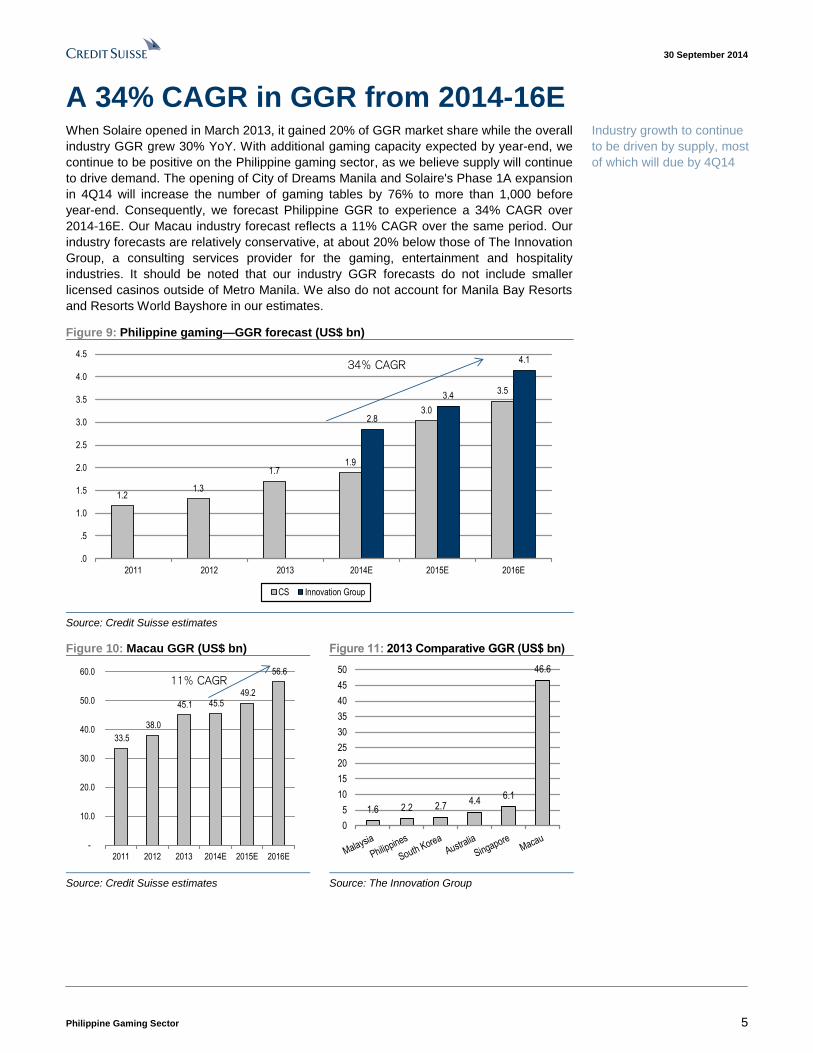
A 34% CAGR in GGR from 2014-16E When Solaire opened in March 2013, it gained 20% of GGR market share while the overall
industry GGR grew 30% YoY. With additional gaming capacity expected by year-end, we
continue to be positive on the Philippine gaming sector, as we believe supply will continue
to drive demand. The opening of City of Dreams Manila and Solaire's Phase 1A expansion
in 4Q14 will increase the number of gaming tables by 76% to more than 1,000 before
year-end. Consequently, we forecast Philippine GGR to experience a 34% CAGR over
2014-16E. Our Macau industry forecast reflects a 11% CAGR over the same period. Our
industry forecasts are relatively conservative, at about 20% below those of The Innovation
Group, a consulting services provider for the gaming, entertainment and hospitality
industries. It should be noted that our industry GGR forecasts do not include smaller
licensed casinos outside of Metro Manila. We also do not account for Manila Bay Resorts
and Resorts World Bayshore in our estimates.
Figure 9: Philippine gaming—GGR forecast (US$ bn)
1.21.3
1.71.9
3.0
3.5
2.8
3.4
4.1
.0
.5
1.0
1.5
2.0
2.5
3.0
3.5
4.0
4.5
2011 2012 2013 2014E 2015E 2016E
CS Innovation Group
34% CAGR
Source: Credit Suisse estimates
Figure 10: Macau GGR (US$ bn) Figure 11: 2013 Comparative GGR (US$ bn)
33.5
38.0
45.1 45.5 49.2
56.6
-
10.0
20.0
30.0
40.0
50.0
60.0
2011 2012 2013 2014E 2015E 2016E
11% CAGR
1.6 2.2 2.74.4
6.1
46.6
0
5
10
15
20
25
30
35
40
45
50
Source: Credit Suisse estimates Source: The Innovation Group
Industry growth to continue
to be driven by supply, most
of which will due by 4Q14
30 September 2014
Philippine Gaming Sector 6
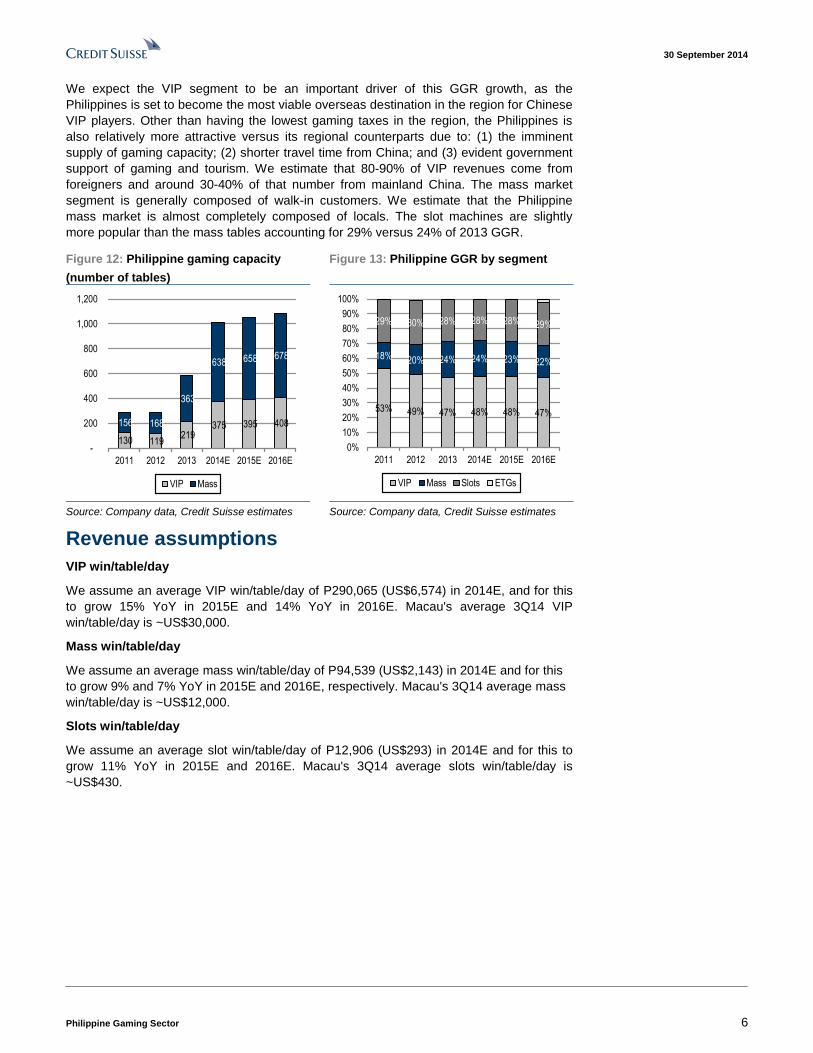
We expect the VIP segment to be an important driver of this GGR growth, as the
Philippines is set to become the most viable overseas destination in the region for Chinese
VIP players. Other than having the lowest gaming taxes in the region, the Philippines is
also relatively more attractive versus its regional counterparts due to: (1) the imminent
supply of gaming capacity; (2) shorter travel time from China; and (3) evident government
support of gaming and tourism. We estimate that 80-90% of VIP revenues come from
foreigners and around 30-40% of that number from mainland China. The mass market
segment is generally composed of walk-in customers. We estimate that the Philippine
mass market is almost completely composed of locals. The slot machines are slightly
more popular than the mass tables accounting for 29% versus 24% of 2013 GGR.
Figure 12: Philippine gaming capacity
(number of tables)
Figure 13: Philippine GGR by segment
130 119 219
375 395 408 156 168
363
638 658 678
-
200
400
600
800
1,000
1,200
2011 2012 2013 2014E 2015E 2016E
VIP Mass
53% 49% 47% 48% 48% 47%
18% 20% 24% 24% 23% 22%
29% 30% 28% 28% 28% 29%
0%
10%
20%
30%
40%
50%
60%
70%
80%
90%
100%
2011 2012 2013 2014E 2015E 2016E
VIP Mass Slots ETGs
Source: Company data, Credit Suisse estimates Source: Company data, Credit Suisse estimates
Revenue assumptions
VIP win/table/day
We assume an average VIP win/table/day of P290,065 (US$6,574) in 2014E, and for this
to grow 15% YoY in 2015E and 14% YoY in 2016E. Macau's average 3Q14 VIP
win/table/day is ~US$30,000.
Mass win/table/day
We assume an average mass win/table/day of P94,539 (US$2,143) in 2014E and for this
to grow 9% and 7% YoY in 2015E and 2016E, respectively. Macau's 3Q14 average mass
win/table/day is ~US$12,000.
Slots win/table/day
We assume an average slot win/table/day of P12,906 (US$293) in 2014E and for this to
grow 11% YoY in 2015E and 2016E. Macau's 3Q14 average slots win/table/day is
~US$430.

30 September 2014
Philippine Gaming Sector 7
Figure 14: Philippine gaming—GGR forecasts (P mn)
GGR (P mn) 2011 2012 2013 2014E 2015E 2016E
Resorts World Manila 25,428 28,058 30,004 27,714 34,754 42,225
YoY 10% 7% -8% 25% 21%
VIP 13,475 13,708 15,120 13,030 15,968 19,241
YoY 2% 10% -14% 23% 20%
Mass 4,544 5,683 6,117 6,093 7,150 8,260
YoY 25% 8% 0% 17% 16%
Slots 7,358 8,639 8,758 8,313 11,344 14,419
YoY 17% 1% -2% 36% 27%
Breakdown
VIP 53% 49% 50% 47% 46% 46%
Mass 18% 20% 20% 22% 21% 20%
Slots 29% 31% 29% 30% 33% 34%
Solaire 14,774 28,366 43,192 48,479
YoY 52% 52% 12%
VIP 6,096 14,271 26,070 29,770
YoY 0% 85% 83% 14%
Mass 4,627 7,050 7,747 7,927
YoY 0% 21% 10% 2%
Slots 4,051 7,045 9,375 10,782
YoY 0% 38% 33% 15%
Breakdown
VIP 41% 50% 60% 61%
Mass 31% 25% 18% 16%
Slots 27% 25% 22% 22%
Others 25,010 27,479 27,583 26,323 52,478 57,928
Total 50,438 55,537 72,361 82,403 130,425 148,631
YoY 10% 30% 14% 58% 14%
Source: Company data, Credit Suisse estimates
Valuation versus Macau
Considering the different gearing ratios and capex schedules, we use EV/EBITDA for peer
comparison. Bloomberry's 2015E EV/EBITDA of 10.8x and Traveller's 11.4x are both at a
discount to Macau's 11.7x. At a 2015E P/E of 25.4x, Philippine gaming names are trading
at a 44% premium to the Philippine Stock Exchange Index (PSEi). This is a lower premium
compared to Macau, which is trading at a 2015E P/E of 14.7x or a premium of 47% to the
Hang Seng Index (HSI). However, since the Philippine operators are still heavy on capex
this year, it will take some time before they yield any significant dividend.
Figure 15: Philippine gaming versus Macau
Company Mkt cap Share TP P/E (x) EV/EBITDA (x) Dividend yield (%)
name (US$ mn) price (l.c.) (l.c.) 2014E 2015E 2016E 2014E 2015E 2016E 2014E 2015E 2016E
Philippines 33.9 25.6 19.9 16.9 11.1 9.0 0.4 0.3 0.4
Bloomberry 3,127 13.3 16.0 30.2 22.4 18.1 17.3 10.8 9.1 - - -
Travellers 3,469 9.9 11.4 37.3 28.5 21.5 16.6 11.4 8.9 0.8 0.5 0.7
Macau 16.1 14.4 12.5 12.7 11.7 9.8 4.7 5.2 5.8
Note: Priced as of 29 September 2014. Source: Company data, Credit Suisse estimates
Our valuations are at a
slight discount to Macau
30 September 2014
Philippine Gaming Sector 8
Window of opportunity: Synergies within Entertainment City beginning in 4Q14 Critical mass in the Entertainment City formed by
mutualism
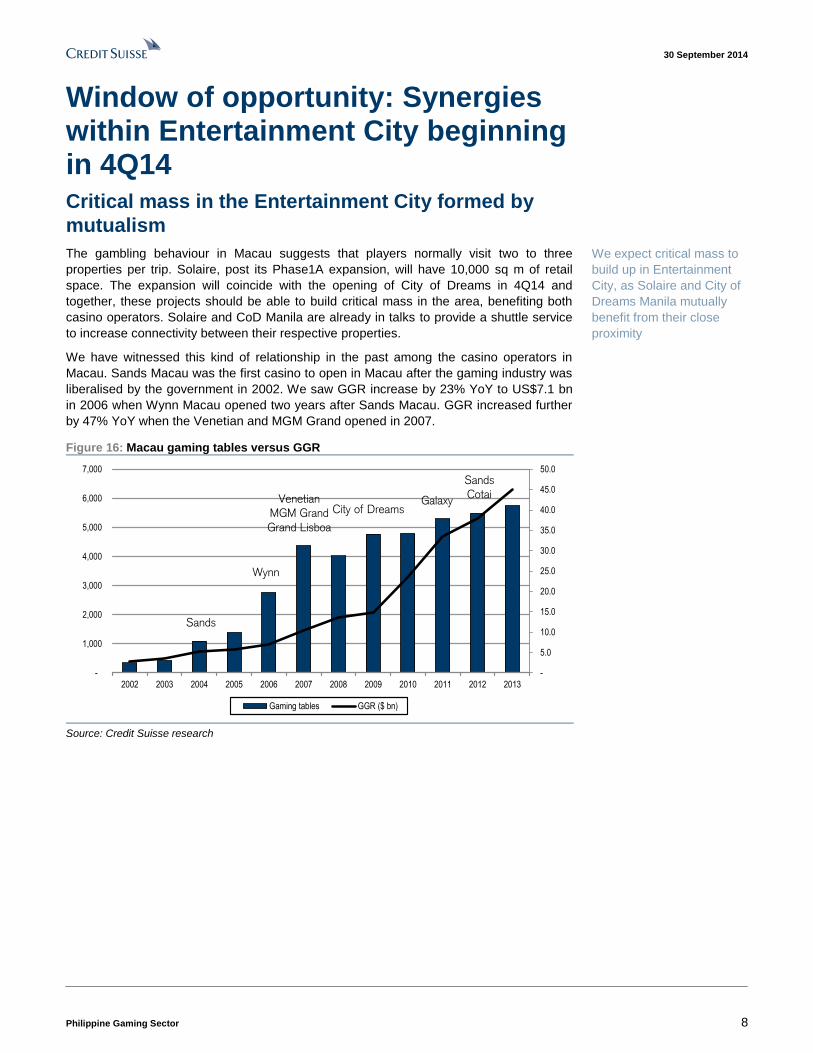
The gambling behaviour in Macau suggests that players normally visit two to three
properties per trip. Solaire, post its Phase1A expansion, will have 10,000 sq m of retail
space. The expansion will coincide with the opening of City of Dreams in 4Q14 and
together, these projects should be able to build critical mass in the area, benefiting both
casino operators. Solaire and CoD Manila are already in talks to provide a shuttle service
to increase connectivity between their respective properties.
We have witnessed this kind of relationship in the past among the casino operators in
Macau. Sands Macau was the first casino to open in Macau after the gaming industry was
liberalised by the government in 2002. We saw GGR increase by 23% YoY to US$7.1 bn
in 2006 when Wynn Macau opened two years after Sands Macau. GGR increased further
by 47% YoY when the Venetian and MGM Grand opened in 2007.
Figure 16: Macau gaming tables versus GGR
-
5.0
10.0
15.0
20.0
25.0
30.0
35.0
40.0
45.0
50.0
-
1,000
2,000
3,000
4,000
5,000
6,000
7,000
2002 2003 2004 2005 2006 2007 2008 2009 2010 2011 2012 2013
Gaming tables GGR ($ bn)
Sands
Wynn
Venetian
MGM Grand
Grand Lisboa
City of DreamsGalaxy
Sands
Cotai
Source: Credit Suisse research
We expect critical mass to
build up in Entertainment
City, as Solaire and City of
Dreams Manila mutually
benefit from their close
proximity
30 September 2014
Philippine Gaming Sector 9
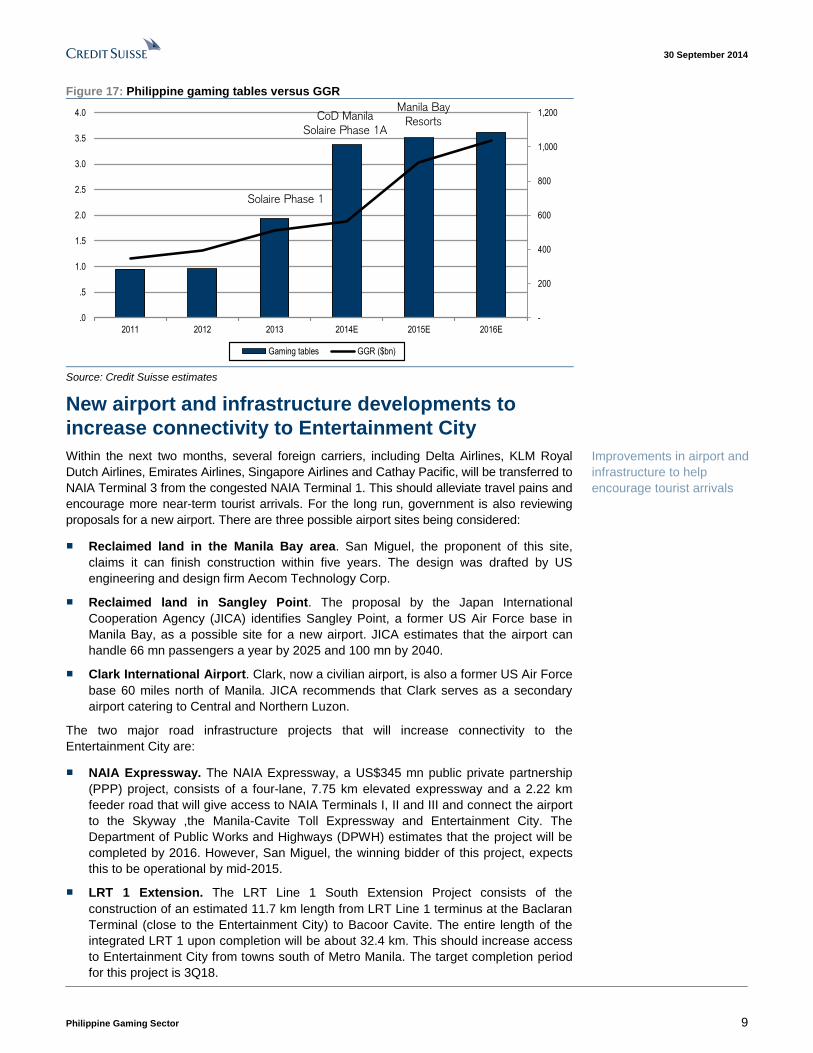
Figure 17: Philippine gaming tables versus GGR
-
200
400
600
800
1,000
1,200
.0
.5
1.0
1.5
2.0
2.5
3.0
3.5
4.0
2011 2012 2013 2014E 2015E 2016E
Gaming tables GGR ($bn)
CoD Manila
Solaire Phase 1A
Manila Bay
Resorts
Solaire Phase 1
Source: Credit Suisse estimates
New airport and infrastructure developments to
increase connectivity to Entertainment City
Within the next two months, several foreign carriers, including Delta Airlines, KLM Royal
Dutch Airlines, Emirates Airlines, Singapore Airlines and Cathay Pacific, will be transferred to
NAIA Terminal 3 from the congested NAIA Terminal 1. This should alleviate travel pains and
encourage more near-term tourist arrivals. For the long run, government is also reviewing
proposals for a new airport. There are three possible airport sites being considered:
■ Reclaimed land in the Manila Bay area. San Miguel, the proponent of this site,
claims it can finish construction within five years. The design was drafted by US
engineering and design firm Aecom Technology Corp.
■ Reclaimed land in Sangley Point. The proposal by the Japan International
Cooperation Agency (JICA) identifies Sangley Point, a former US Air Force base in
Manila Bay, as a possible site for a new airport. JICA estimates that the airport can
handle 66 mn passengers a year by 2025 and 100 mn by 2040.
■ Clark International Airport. Clark, now a civilian airport, is also a former US Air Force
base 60 miles north of Manila. JICA recommends that Clark serves as a secondary
airport catering to Central and Northern Luzon.
The two major road infrastructure projects that will increase connectivity to the
Entertainment City are:
■ NAIA Expressway. The NAIA Expressway, a US$345 mn public private partnership
(PPP) project, consists of a four-lane, 7.75 km elevated expressway and a 2.22 km
feeder road that will give access to NAIA Terminals I, II and III and connect the airport
to the Skyway ,the Manila-Cavite Toll Expressway and Entertainment City. The
Department of Public Works and Highways (DPWH) estimates that the project will be
completed by 2016. However, San Miguel, the winning bidder of this project, expects
this to be operational by mid-2015.
■ LRT 1 Extension. The LRT Line 1 South Extension Project consists of the
construction of an estimated 11.7 km length from LRT Line 1 terminus at the Baclaran
Terminal (close to the Entertainment City) to Bacoor Cavite. The entire length of the
integrated LRT 1 upon completion will be about 32.4 km. This should increase access
to Entertainment City from towns south of Metro Manila. The target completion period
for this project is 3Q18.
Improvements in airport and
infrastructure to help
encourage tourist arrivals
30 September 2014
Philippine Gaming Sector 10
VIP to drive GGR growth; growing mass to serve as volatility cushion Low gaming taxes to attract junkets
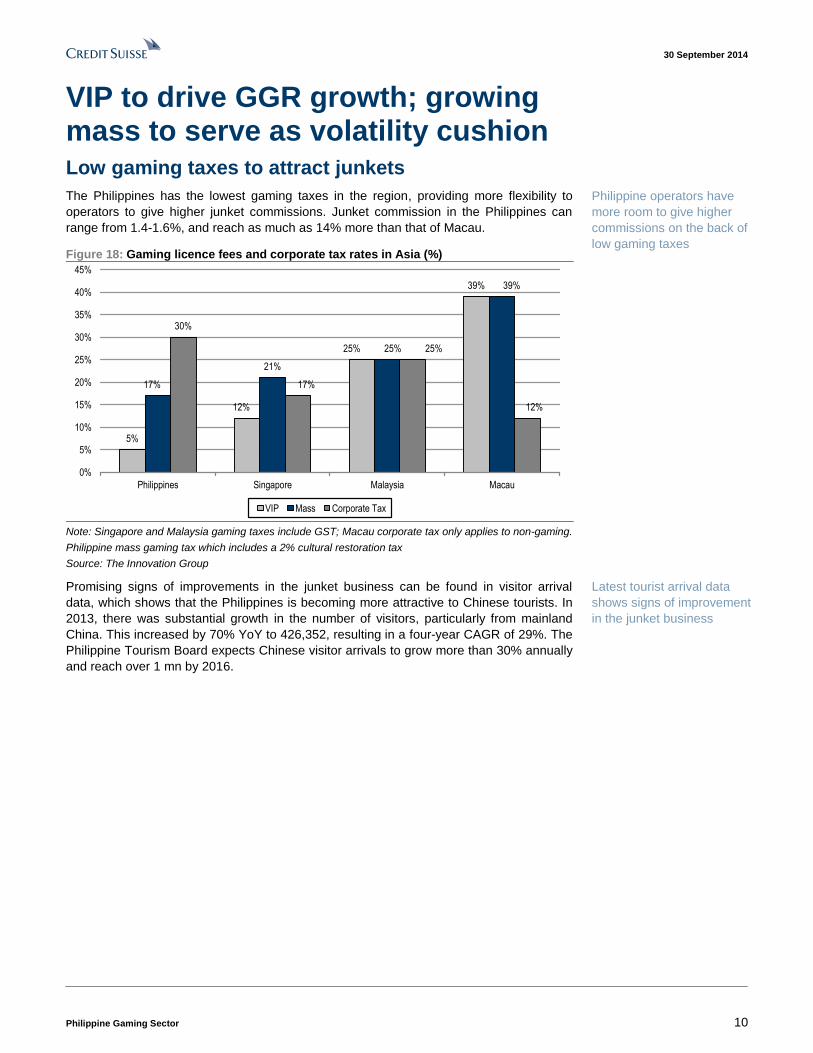
The Philippines has the lowest gaming taxes in the region, providing more flexibility to
operators to give higher junket commissions. Junket commission in the Philippines can
range from 1.4-1.6%, and reach as much as 14% more than that of Macau.
Figure 18: Gaming licence fees and corporate tax rates in Asia (%)
5%
12%
25%
39%
17%
21%
25%
39%
30%
17%
25%
12%
0%
5%
10%
15%
20%
25%
30%
35%
40%
45%
Philippines Singapore Malaysia Macau
VIP Mass Corporate Tax
Note: Singapore and Malaysia gaming taxes include GST; Macau corporate tax only applies to non-gaming.
Philippine mass gaming tax which includes a 2% cultural restoration tax
Source: The Innovation Group
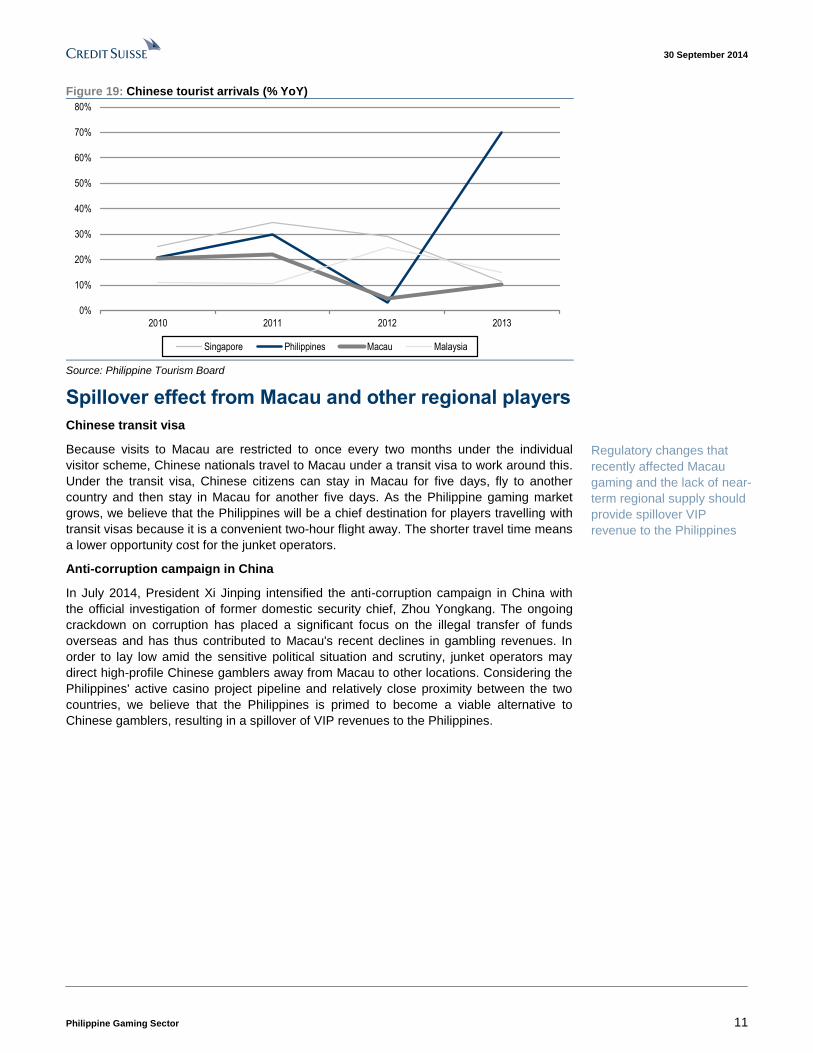
Promising signs of improvements in the junket business can be found in visitor arrival
data, which shows that the Philippines is becoming more attractive to Chinese tourists. In
2013, there was substantial growth in the number of visitors, particularly from mainland
China. This increased by 70% YoY to 426,352, resulting in a four-year CAGR of 29%. The
Philippine Tourism Board expects Chinese visitor arrivals to grow more than 30% annually
and reach over 1 mn by 2016.
Philippine operators have
more room to give higher
commissions on the back of
low gaming taxes
Latest tourist arrival data
shows signs of improvement
in the junket business
30 September 2014
Philippine Gaming Sector 11
Figure 19: Chinese tourist arrivals (% YoY)
0%
10%
20%
30%
40%
50%
60%
70%
80%
2010 2011 2012 2013
Singapore Philippines Macau Malaysia
Source: Philippine Tourism Board
Spillover effect from Macau and other regional players
Chinese transit visa
Because visits to Macau are restricted to once every two months under the individual
visitor scheme, Chinese nationals travel to Macau under a transit visa to work around this.
Under the transit visa, Chinese citizens can stay in Macau for five days, fly to another
country and then stay in Macau for another five days. As the Philippine gaming market
grows, we believe that the Philippines will be a chief destination for players travelling with
transit visas because it is a convenient two-hour flight away. The shorter travel time means
a lower opportunity cost for the junket operators.
Anti-corruption campaign in China
In July 2014, President Xi Jinping intensified the anti-corruption campaign in China with
the official investigation of former domestic security chief, Zhou Yongkang. The ongoing
crackdown on corruption has placed a significant focus on the illegal transfer of funds
overseas and has thus contributed to Macau's recent declines in gambling revenues. In
order to lay low amid the sensitive political situation and scrutiny, junket operators may
direct high-profile Chinese gamblers away from Macau to other locations. Considering the
Philippines' active casino project pipeline and relatively close proximity between the two
countries, we believe that the Philippines is primed to become a viable alternative to
Chinese gamblers, resulting in a spillover of VIP revenues to the Philippines.
Regulatory changes that
recently affected Macau
gaming and the lack of near-
term regional supply should
provide spillover VIP
revenue to the Philippines
30 September 2014
Philippine Gaming Sector 12
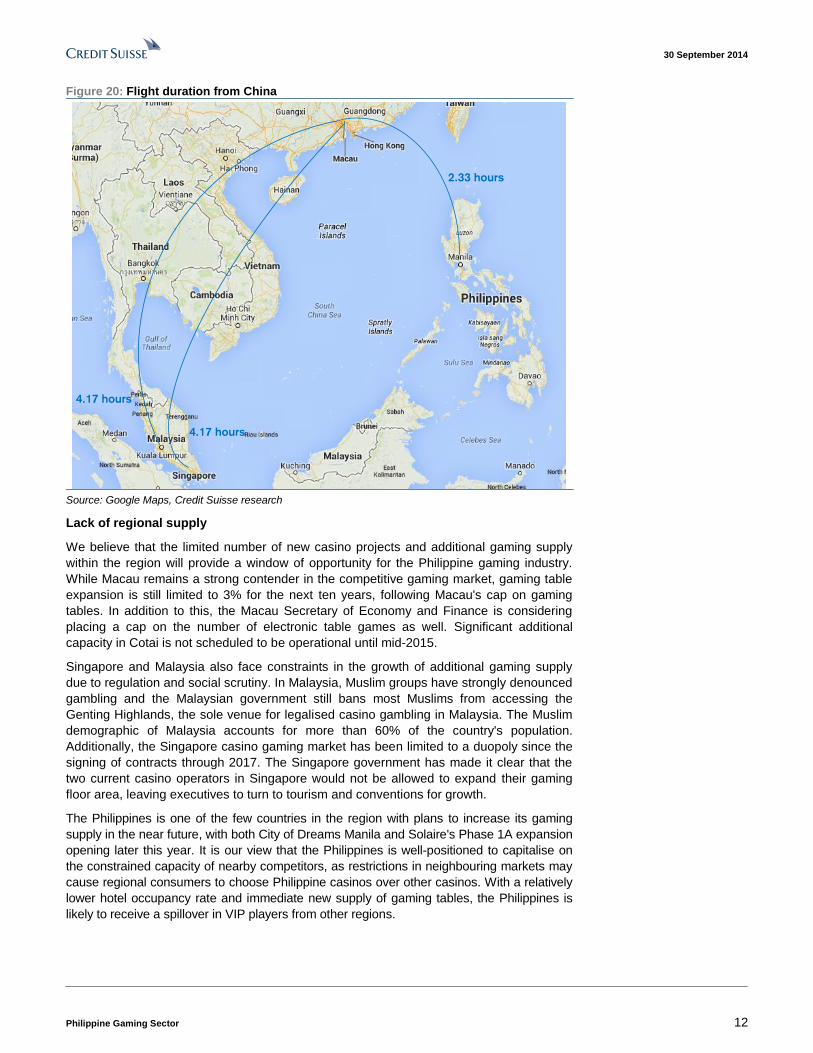
Figure 20: Flight duration from China
2.33 hours
4.17 hours
4.17 hours
Source: Google Maps, Credit Suisse research
Lack of regional supply
We believe that the limited number of new casino projects and additional gaming supply
within the region will provide a window of opportunity for the Philippine gaming industry.
While Macau remains a strong contender in the competitive gaming market, gaming table
expansion is still limited to 3% for the next ten years, following Macau's cap on gaming
tables. In addition to this, the Macau Secretary of Economy and Finance is considering
placing a cap on the number of electronic table games as well. Significant additional
capacity in Cotai is not scheduled to be operational until mid-2015.
Singapore and Malaysia also face constraints in the growth of additional gaming supply
due to regulation and social scrutiny. In Malaysia, Muslim groups have strongly denounced
gambling and the Malaysian government still bans most Muslims from accessing the
Genting Highlands, the sole venue for legalised casino gambling in Malaysia. The Muslim
demographic of Malaysia accounts for more than 60% of the country's population.
Additionally, the Singapore casino gaming market has been limited to a duopoly since the
signing of contracts through 2017. The Singapore government has made it clear that the
two current casino operators in Singapore would not be allowed to expand their gaming
floor area, leaving executives to turn to tourism and conventions for growth.
The Philippines is one of the few countries in the region with plans to increase its gaming
supply in the near future, with both City of Dreams Manila and Solaire's Phase 1A expansion
opening later this year. It is our view that the Philippines is well-positioned to capitalise on
the constrained capacity of nearby competitors, as restrictions in neighbouring markets may
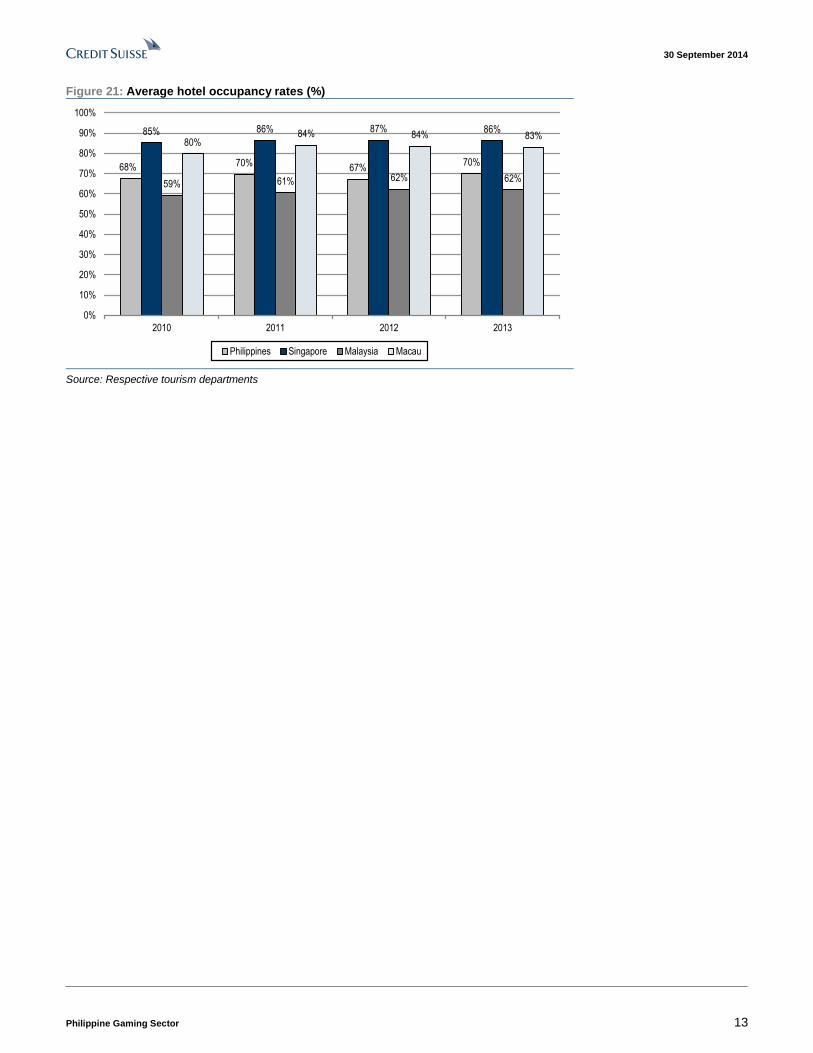
cause regional consumers to choose Philippine casinos over other casinos. With a relatively
lower hotel occupancy rate and immediate new supply of gaming tables, the Philippines is
likely to receive a spillover in VIP players from other regions.
30 September 2014
Philippine Gaming Sector 13
Figure 21: Average hotel occupancy rates (%)
68% 70%67%
70%
85% 86% 87% 86%
59% 61% 62% 62%
80%84% 84% 83%
0%
10%
20%
30%
40%
50%
60%
70%
80%
90%
100%
2010 2011 2012 2013
Philippines Singapore Malaysia Macau
Source: Respective tourism departments
30 September 2014
Philippine Gaming Sector 14
Favourable demographics provide volatility cushion Demographic window in 2015
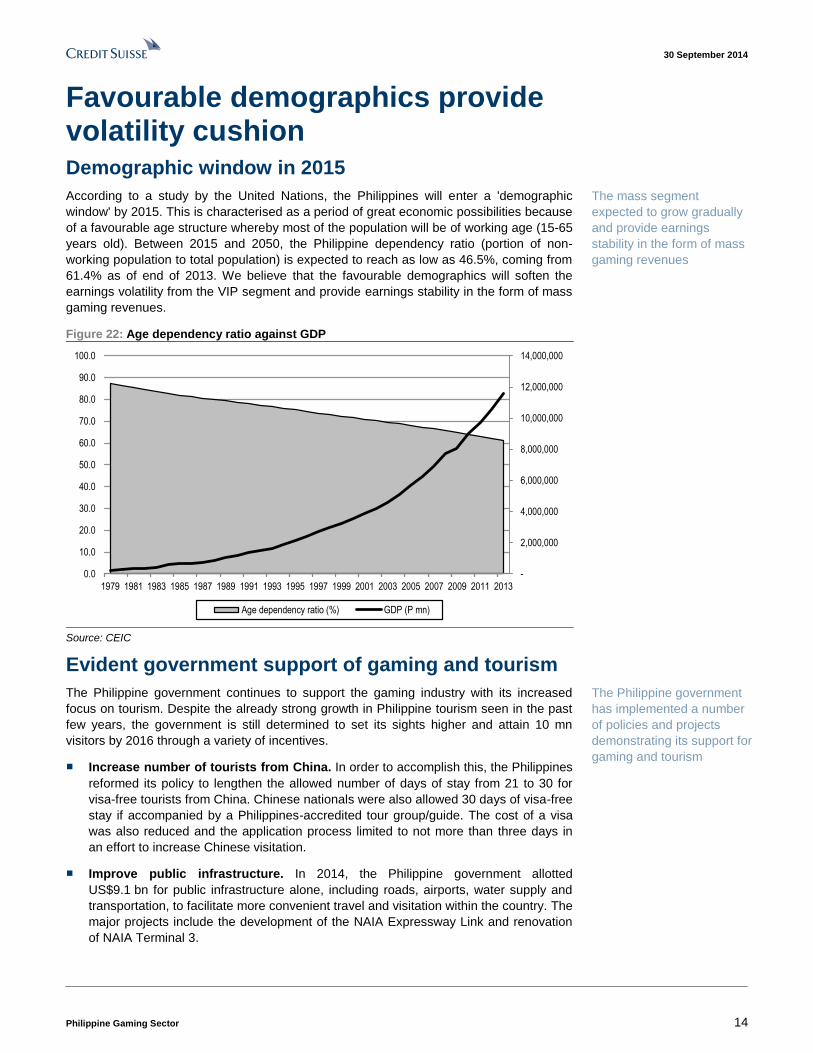
According to a study by the United Nations, the Philippines will enter a 'demographic
window' by 2015. This is characterised as a period of great economic possibilities because
of a favourable age structure whereby most of the population will be of working age (15-65
years old). Between 2015 and 2050, the Philippine dependency ratio (portion of non-
working population to total population) is expected to reach as low as 46.5%, coming from
61.4% as of end of 2013. We believe that the favourable demographics will soften the
earnings volatility from the VIP segment and provide earnings stability in the form of mass
gaming revenues.
Figure 22: Age dependency ratio against GDP
-
2,000,000
4,000,000
6,000,000
8,000,000
10,000,000
12,000,000
14,000,000
0.0
10.0
20.0
30.0
40.0
50.0
60.0
70.0
80.0
90.0
100.0
1979 1981 1983 1985 1987 1989 1991 1993 1995 1997 1999 2001 2003 2005 2007 2009 2011 2013
Age dependency ratio (%) GDP (P mn)
Source: CEIC
Evident government support of gaming and tourism
The Philippine government continues to support the gaming industry with its increased
focus on tourism. Despite the already strong growth in Philippine tourism seen in the past
few years, the government is still determined to set its sights higher and attain 10 mn
visitors by 2016 through a variety of incentives.
■ Increase number of tourists from China. In order to accomplish this, the Philippines
reformed its policy to lengthen the allowed number of days of stay from 21 to 30 for
visa-free tourists from China. Chinese nationals were also allowed 30 days of visa-free
stay if accompanied by a Philippines-accredited tour group/guide. The cost of a visa
was also reduced and the application process limited to not more than three days in
an effort to increase Chinese visitation.
■ Improve public infrastructure. In 2014, the Philippine government allotted
US$9.1 bn for public infrastructure alone, including roads, airports, water supply and
transportation, to facilitate more convenient travel and visitation within the country. The
major projects include the development of the NAIA Expressway Link and renovation
of NAIA Terminal 3.
The mass segment
expected to grow gradually
and provide earnings
stability in the form of mass
gaming revenues
The Philippine government
has implemented a number
of policies and projects
demonstrating its support for
gaming and tourism
30 September 2014
Philippine Gaming Sector 15
■ Increase number of flights and air seats. The Philippines recently signed air service
agreements with Australia, Canada, France, Singapore, New Zealand, Myanmar, Italy,
Brazil, Japan, Macau, South Africa and Israel to increase flights to and from these
countries. Under the new air service pact, the Philippines and Macau have more seat
entitlements, up 56% from 4,500 seats to 7,020 seats. Philippine Airlines and Cebu
Pacific aim to increase seat entitlements to Singapore as well.
■ Marketing campaigns. The Department of Tourism's highly publicised promotion
campaign "It's more fun in the Philippines" was rolled out in 2012 and helped attract a
record 4.27 mn visitors that year. To supplement the campaign, the Department of
Tourism recently released four television commercials featuring Manila, Cebu, Davao
and Boracay.
We believe that these favourable government initiatives to support tourism will directly
benefit the Philippine gaming industry and provide it with a competitive advantage over
casinos in Singapore and Malaysia. It should also be noted that in April 2013, the Bureau
of Internal Revenue (BIR) issued a revenue memorandum circular (RMC) stating that the
Philippine Amusement and Gaming Corporation (PAGCOR), its contractees and licensees
are no longer exempt from corporate tax. Rather than breach the mutually agreed upon
provisions of the licence agreements, PAGCOR issued guidelines for a temporary 10%
income tax allocation (ITA) measure whereby the 25% and 15% licence fees were
reduced to 15% and 5%, respectively, inasmuch as 10% of licence fees was allocated for
income tax on gaming. The parties will revert to the original licence fee structure if the BIR
action is permanently restrained, corrected or withdrawn. This temporary measure to
neutralise the burden of additional tax liabilities on gaming operators can be viewed as
further proof of the Philippine government's favourable support of the gaming industry.

30 September 2014
Philippine Gaming Sector 16
Prefer BLOOM (+21%) over RWM (+15%) We assume coverage on RWM and BLOOM with OUTPERFORM ratings and DCF-based
target prices of P11.4 and P16.0, respectively.
Review of 1H14 results
RWM's 1H14 EBITDA stood at P4.7 bn, which accounts for only 40% of full-year
consensus estimates. This may pose downward earning revisions, which can limit price
appreciation in the near term. On the other hand, BLOOM's 1H14 results came in line with
expectations after analysts raised consensus estimates following strong 1Q14 results. We
see further boosts in 2H14 and in 2015, as synergies form between City of Dreams Manila
and Solaire's Phase 1A expansion, and critical mass starts to build in the area.
Figure 23: RWM vs BLOOM—1H14 EBITDA (P mn) vs 2014E CS and consensus forecasts
4,686 4,474
9,198 9,694
11,698
8,967
-
2,000
4,000
6,000
8,000
10,000
12,000
14,000
RWM BLOOM
1H14 CS Consensus
Source: Company data, Credit Suisse estimates
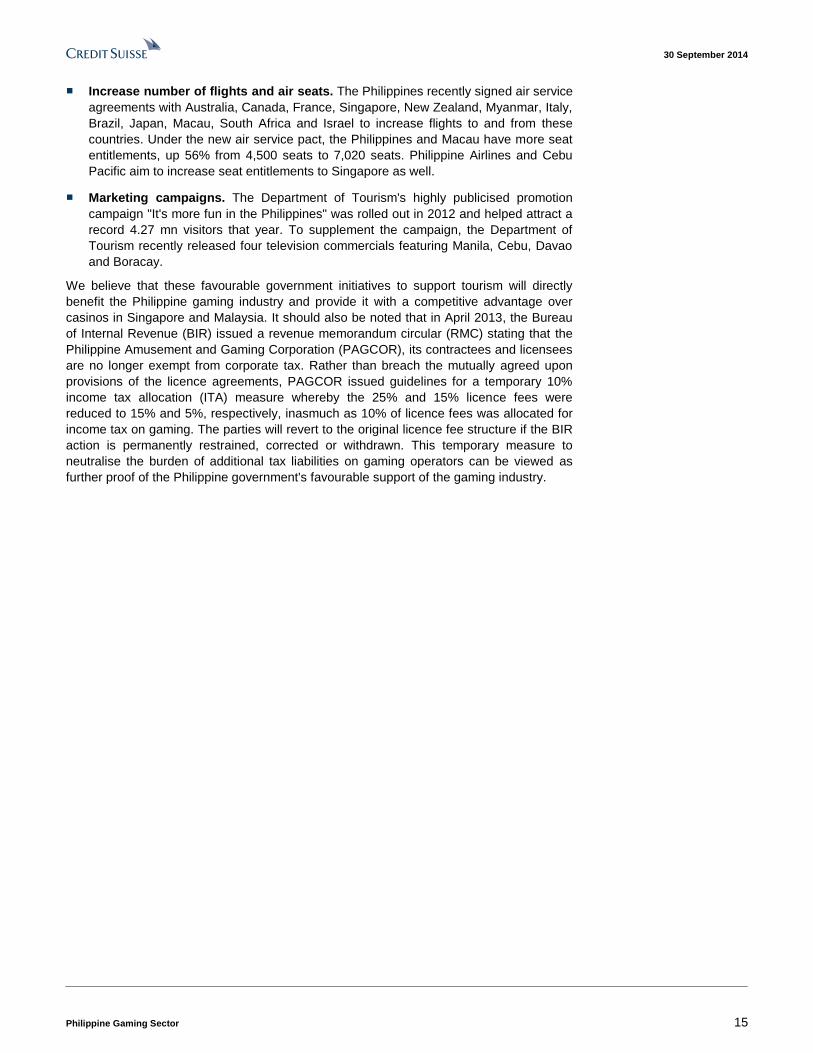
We believe the strong VIP revenue growth that Solaire recorded in 1H14 is on the back of
a credit extension to the junkets. This is reflected in the growth of its accounts receivable,
which appears to be continuously increasing. Based on the historical performance of
Macau casino operators, credit extension tends to yield the most revenue growth in the
first six months and tapers off thereafter. We believe that fresh credit injections, which we
see as a continuing trend for BLOOM, will be able to support its VIP growth momentum in
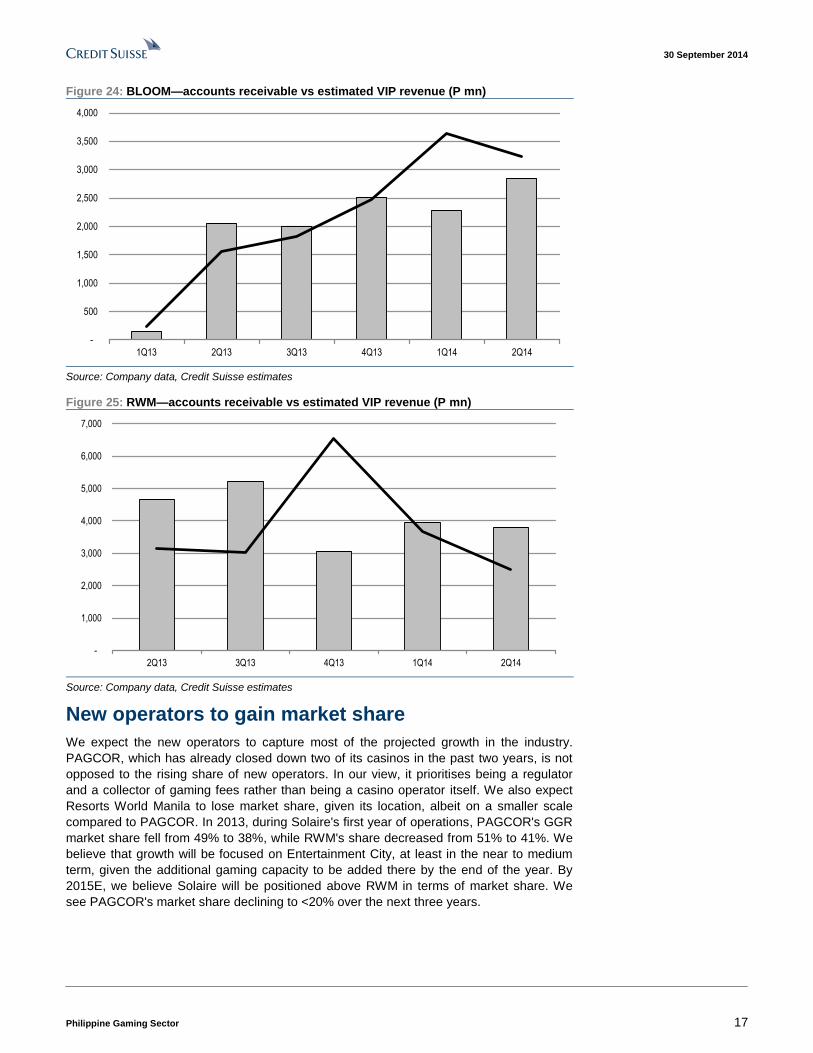
the near to medium term. On the other hand, RWM's accounts receivable seem to have
peaked in 3Q13 and hence we expect its VIP volume growth to slow down.
30 September 2014
Philippine Gaming Sector 17
Figure 24: BLOOM—accounts receivable vs estimated VIP revenue (P mn)
-
500
1,000
1,500
2,000
2,500
3,000
3,500
4,000
1Q13 2Q13 3Q13 4Q13 1Q14 2Q14
Source: Company data, Credit Suisse estimates
Figure 25: RWM—accounts receivable vs estimated VIP revenue (P mn)
-
1,000
2,000
3,000
4,000
5,000
6,000
7,000
2Q13 3Q13 4Q13 1Q14 2Q14
Source: Company data, Credit Suisse estimates
New operators to gain market share
We expect the new operators to capture most of the projected growth in the industry.
PAGCOR, which has already closed down two of its casinos in the past two years, is not
opposed to the rising share of new operators. In our view, it prioritises being a regulator
and a collector of gaming fees rather than being a casino operator itself. We also expect
Resorts World Manila to lose market share, given its location, albeit on a smaller scale
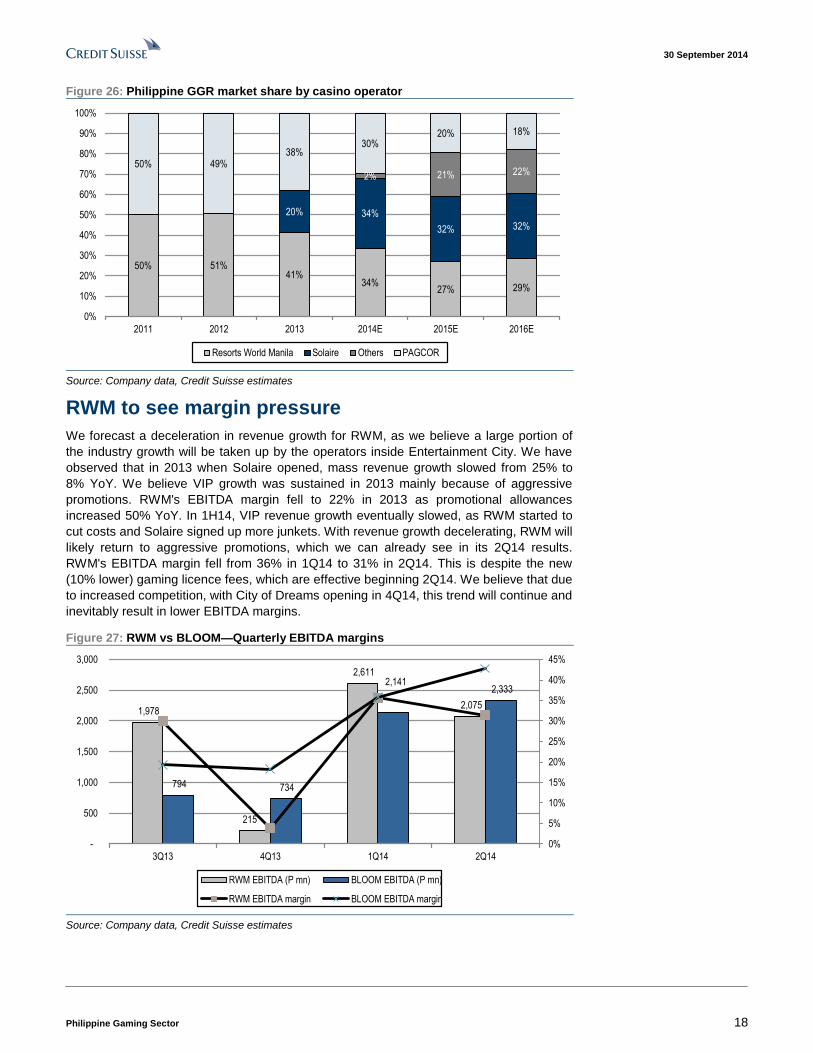
compared to PAGCOR. In 2013, during Solaire's first year of operations, PAGCOR's GGR
market share fell from 49% to 38%, while RWM's share decreased from 51% to 41%. We
believe that growth will be focused on Entertainment City, at least in the near to medium
term, given the additional gaming capacity to be added there by the end of the year. By
2015E, we believe Solaire will be positioned above RWM in terms of market share. We
see PAGCOR's market share declining to <20% over the next three years.
30 September 2014
Philippine Gaming Sector 18
Figure 26: Philippine GGR market share by casino operator
50% 51%41%
34%27% 29%
20% 34%
32% 32%
2% 21% 22%50% 49%
38%30%
20% 18%
0%
10%
20%
30%
40%
50%
60%
70%
80%
90%
100%
2011 2012 2013 2014E 2015E 2016E
Resorts World Manila Solaire Others PAGCOR
Source: Company data, Credit Suisse estimates
RWM to see margin pressure
We forecast a deceleration in revenue growth for RWM, as we believe a large portion of
the industry growth will be taken up by the operators inside Entertainment City. We have
observed that in 2013 when Solaire opened, mass revenue growth slowed from 25% to
8% YoY. We believe VIP growth was sustained in 2013 mainly because of aggressive
promotions. RWM's EBITDA margin fell to 22% in 2013 as promotional allowances
increased 50% YoY. In 1H14, VIP revenue growth eventually slowed, as RWM started to
cut costs and Solaire signed up more junkets. With revenue growth decelerating, RWM will
likely return to aggressive promotions, which we can already see in its 2Q14 results.
RWM's EBITDA margin fell from 36% in 1Q14 to 31% in 2Q14. This is despite the new
(10% lower) gaming licence fees, which are effective beginning 2Q14. We believe that due
to increased competition, with City of Dreams opening in 4Q14, this trend will continue and
inevitably result in lower EBITDA margins.
Figure 27: RWM vs BLOOM—Quarterly EBITDA margins
1,978
215
2,611
2,075
794 734
2,141 2,333
0%
5%
10%
15%
20%
25%
30%
35%
40%
45%
-
500
1,000
1,500
2,000
2,500
3,000
3Q13 4Q13 1Q14 2Q14
RWM EBITDA (P mn) BLOOM EBITDA (P mn)
RWM EBITDA margin BLOOM EBITDA margin
Source: Company data, Credit Suisse estimates
30 September 2014
Philippine Gaming Sector 19
No near-term catalysts for RWM
RWM has been registering low win rates since 2H13. However, we believe the anticipated
improvement in GGR on the back of normalised win rates will be tempered by a slower
increase in drop volume as we expect a majority of the visitors to favour the Entertainment
City. Moreover, RWM has no new significant expansion of gaming facilities in the near
term—except for the bonus VIP tables, which could potentially lead to added win rate
volatility.
RWM recently announced the acquisition of a 95% stake in Resorts World Bayshore City
Inc. (RWBCI), which holds the rights and obligations to the Resorts World Bayshore
project. RWM subscribed to 3.23 bn shares of RWBC for P16.15 bn, diluting the stake of
the existing shareholders—Genting HK and AGI—to 5%. Some 25% of the subscription
amount was already injected by RWM while the rest will be spread over the next three
years. While this should be positive for RWM in the long term, we have not accounted for
this project in our forecasts as the capex, which will be funded by both debt and equity, is
not yet definite. The project is targeted to begin construction before year-end and be
completed by 4Q18.
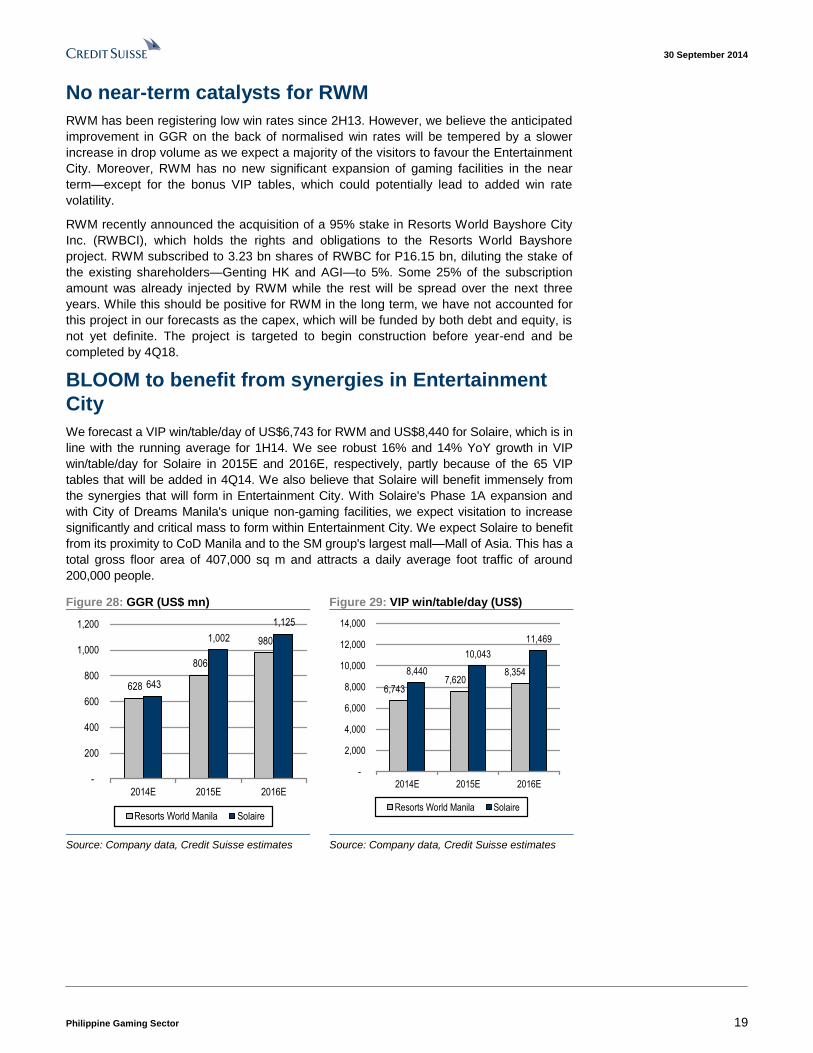
BLOOM to benefit from synergies in Entertainment
City
We forecast a VIP win/table/day of US$6,743 for RWM and US$8,440 for Solaire, which is in
line with the running average for 1H14. We see robust 16% and 14% YoY growth in VIP
win/table/day for Solaire in 2015E and 2016E, respectively, partly because of the 65 VIP
tables that will be added in 4Q14. We also believe that Solaire will benefit immensely from
the synergies that will form in Entertainment City. With Solaire's Phase 1A expansion and
with City of Dreams Manila's unique non-gaming facilities, we expect visitation to increase
significantly and critical mass to form within Entertainment City. We expect Solaire to benefit
from its proximity to CoD Manila and to the SM group's largest mall—Mall of Asia. This has a
total gross floor area of 407,000 sq m and attracts a daily average foot traffic of around
200,000 people.
Figure 28: GGR (US$ mn) Figure 29: VIP win/table/day (US$)
628
806
980
643
1,002
1,125
-
200
400
600
800
1,000
1,200
2014E 2015E 2016E
Resorts World Manila Solaire
6,743 7,620
8,354 8,440
10,043
11,469
-
2,000
4,000
6,000
8,000
10,000
12,000
14,000
2014E 2015E 2016E
Resorts World Manila Solaire
Source: Company data, Credit Suisse estimates Source: Company data, Credit Suisse estimates
30 September 2014
Philippine Gaming Sector 20
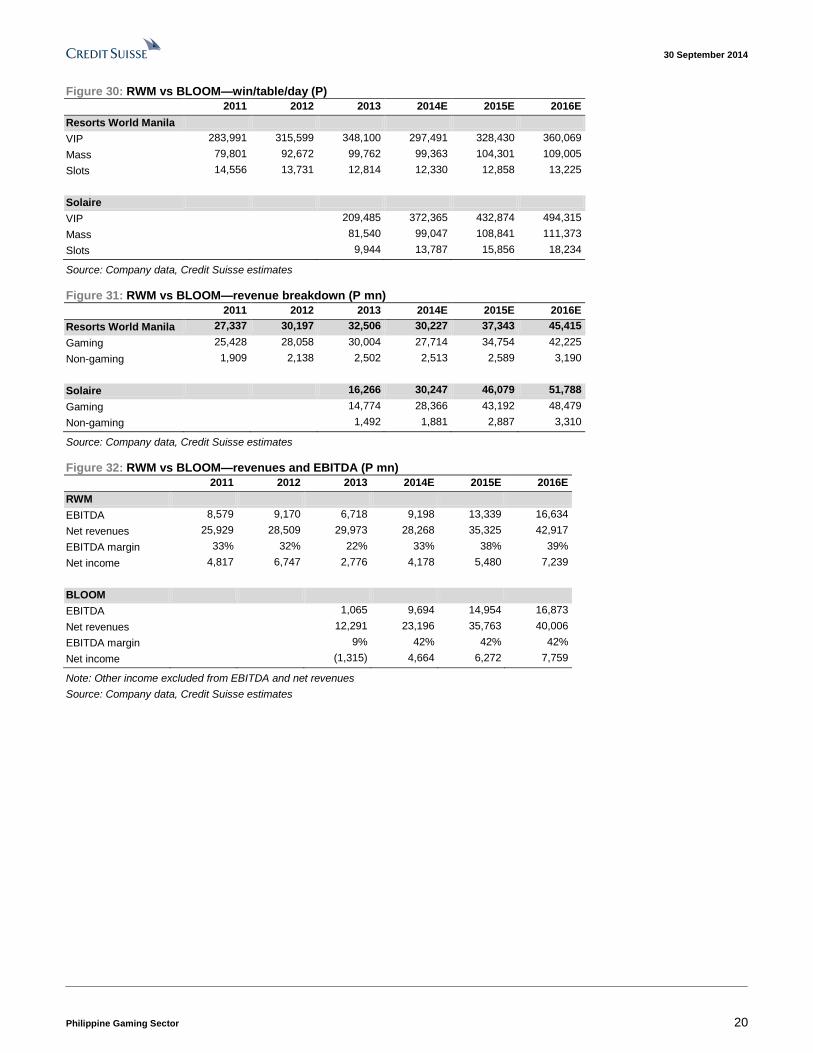
Figure 30: RWM vs BLOOM—win/table/day (P)
2011 2012 2013 2014E 2015E 2016E
Resorts World Manila
VIP 283,991 315,599 348,100 297,491 328,430 360,069
Mass 79,801 92,672 99,762 99,363 104,301 109,005
Slots 14,556 13,731 12,814 12,330 12,858 13,225
Solaire
VIP 209,485 372,365 432,874 494,315
Mass 81,540 99,047 108,841 111,373
Slots 9,944 13,787 15,856 18,234
Source: Company data, Credit Suisse estimates
Figure 31: RWM vs BLOOM—revenue breakdown (P mn)
2011 2012 2013 2014E 2015E 2016E
Resorts World Manila 27,337 30,197 32,506 30,227 37,343 45,415
Gaming 25,428 28,058 30,004 27,714 34,754 42,225
Non-gaming 1,909 2,138 2,502 2,513 2,589 3,190
Solaire 16,266 30,247 46,079 51,788
Gaming 14,774 28,366 43,192 48,479
Non-gaming 1,492 1,881 2,887 3,310
Source: Company data, Credit Suisse estimates
Figure 32: RWM vs BLOOM—revenues and EBITDA (P mn)
2011 2012 2013 2014E 2015E 2016E
RWM
EBITDA 8,579 9,170 6,718 9,198 13,339 16,634
Net revenues 25,929 28,509 29,973 28,268 35,325 42,917
EBITDA margin 33% 32% 22% 33% 38% 39%
Net income 4,817 6,747 2,776 4,178 5,480 7,239
BLOOM
EBITDA 1,065 9,694 14,954 16,873
Net revenues 12,291 23,196 35,763 40,006
EBITDA margin 9% 42% 42% 42%
Net income (1,315) 4,664 6,272 7,759
Note: Other income excluded from EBITDA and net revenues
Source: Company data, Credit Suisse estimates
30 September 2014
Philippine Gaming Sector 21
Key investment risks Regulatory risks
Revision of PAGCOR policies
PAGCOR states that the adjustment of gaming licence fees from 25% to 10% effective
1 April 2014 was done in order to address the BIR action to remove the exemption of
PAGCOR and its licensees from the 30% corporate tax. Any change in the BIR court ruling,
or other government policies affecting PAGCOR will likely result in a change in its
agreement with the licensees.
Suspension of gaming licence
PAGCOR may unilaterally suspend or terminate the provisional licences due to non-
compliance of the licensees with material provisions, failure to remit monthly licence fees
within 30 days of receipt of notice of default, delay in the construction of more than 50% of
schedule or bankruptcy or insolvency.
Implementation of casino entry fee
In September 2014, House Representative Peter Unabia proposed a bill seeking to
impose a P3,500 entrance fee for all Filipinos visiting local casinos. The congressman has
firmly maintained that if passed into law, the bill will prevent financially inadequate citizens
from entering casinos and gambling. Currently, the PAGCOR charter contains no
requirement of an entry fee for any person seeking to play in casinos.
Market risks
PAGCOR issuance of additional gaming licences
PAGCOR is not legally restricted to issue additional gaming licences. A new operator
within Entertainment City may result in increased competition and/or change the dynamics
among the existing operators.
Competition in attracting foreign junkets
Philippine gaming operators will need to provide more enticing incentives, relative to each
other and to regional competitors, in order to attract junket business.
Operational risks
Execution risks
The launch of City of Dreams Manila is slated for 4Q14. Any delays can negatively impact
our forecasts, as well as the public's perception on management's ability to execute.
Delays in infrastructure projects may temper growth
Infrastructure projects that are intended for ease of access to the Entertainment City are
expected to be operational by mid-2015. Significant delays can temper growth in the
medium term.
Negative perception on safety in the Philippines
Incidents that endanger tourists in the country, such as the 2010 bus hostage crisis that
left eight Hong Kong tourists dead, could discourage travel and hinder growth in gaming
revenues, particularly in the VIP segment.
Relations between China and the Philippines
Disputes between China and the Philippines, such as the territorial dispute over
Scarborough Shoal in 2012, can negatively affect visitor arrivals.
30 September 2014
Philippine Gaming Sector 22
Asia Pacific / Philippines
Casinos & Gaming
Bloomberry Resorts Corporation (BLOOM.PS / BLOOM PM)
ASSUMING COVERAGE
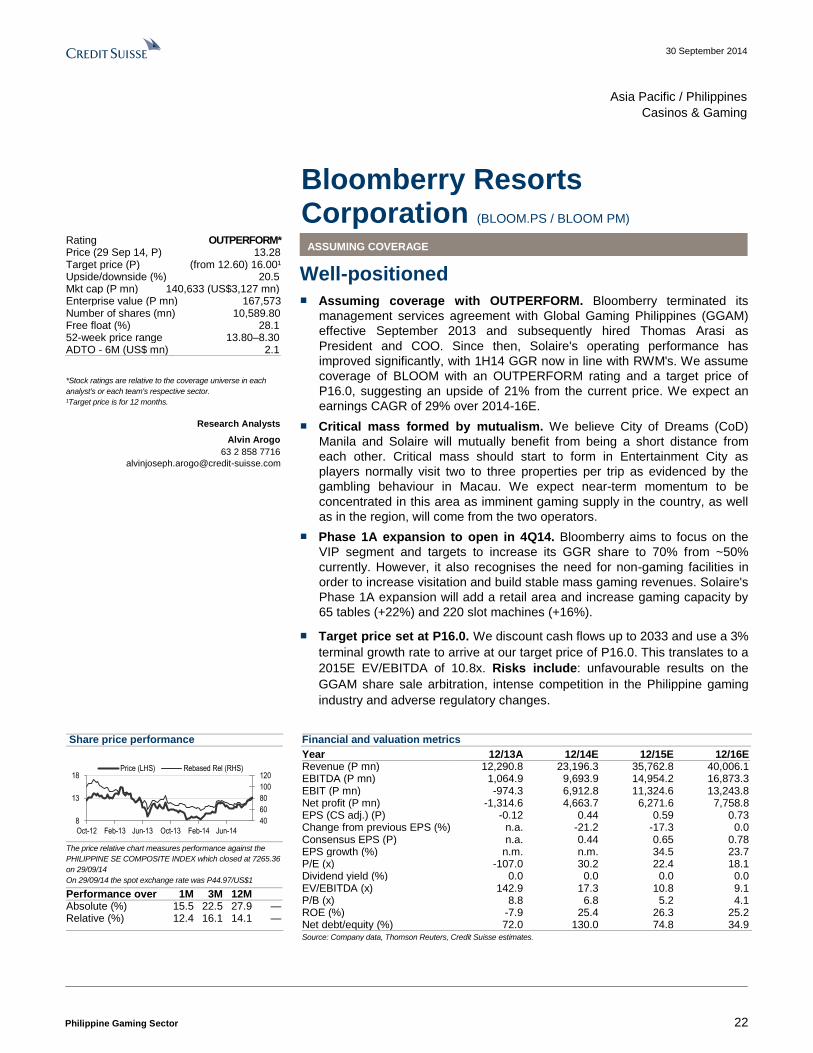
Well-positioned
■ Assuming coverage with OUTPERFORM. Bloomberry terminated its
management services agreement with Global Gaming Philippines (GGAM)
effective September 2013 and subsequently hired Thomas Arasi as
President and COO. Since then, Solaire's operating performance has
improved significantly, with 1H14 GGR now in line with RWM's. We assume
coverage of BLOOM with an OUTPERFORM rating and a target price of
P16.0, suggesting an upside of 21% from the current price. We expect an
earnings CAGR of 29% over 2014-16E.
■ Critical mass formed by mutualism. We believe City of Dreams (CoD)
Manila and Solaire will mutually benefit from being a short distance from
each other. Critical mass should start to form in Entertainment City as
players normally visit two to three properties per trip as evidenced by the
gambling behaviour in Macau. We expect near-term momentum to be
concentrated in this area as imminent gaming supply in the country, as well
as in the region, will come from the two operators.
■ Phase 1A expansion to open in 4Q14. Bloomberry aims to focus on the
VIP segment and targets to increase its GGR share to 70% from ~50%
currently. However, it also recognises the need for non-gaming facilities in
order to increase visitation and build stable mass gaming revenues. Solaire's
Phase 1A expansion will add a retail area and increase gaming capacity by
65 tables (+22%) and 220 slot machines (+16%).
■ Target price set at P16.0. We discount cash flows up to 2033 and use a 3%
terminal growth rate to arrive at our target price of P16.0. This translates to a
2015E EV/EBITDA of 10.8x. Risks include: unfavourable results on the
GGAM share sale arbitration, intense competition in the Philippine gaming
industry and adverse regulatory changes.
Share price performance
40
60
80
100
120
8
13
18
Oct-12 Feb-13 Jun-13 Oct-13 Feb-14 Jun-14
Price (LHS) Rebased Rel (RHS)
The price relative chart measures performance against the
PHILIPPINE SE COMPOSITE INDEX which closed at 7265.36
on 29/09/14
On 29/09/14 the spot exchange rate was P44.97/US$1
Performance over 1M 3M 12M Absolute (%) 15.5 22.5 27.9 — Relative (%) 12.4 16.1 14.1 —
Financial and valuation metrics
Year 12/13A 12/14E 12/15E 12/16E Revenue (P mn) 12,290.8 23,196.3 35,762.8 40,006.1 EBITDA (P mn) 1,064.9 9,693.9 14,954.2 16,873.3 EBIT (P mn) -974.3 6,912.8 11,324.6 13,243.8 Net profit (P mn) -1,314.6 4,663.7 6,271.6 7,758.8 EPS (CS adj.) (P) -0.12 0.44 0.59 0.73 Change from previous EPS (%) n.a. -21.2 -17.3 0.0 Consensus EPS (P) n.a. 0.44 0.65 0.78 EPS growth (%) n.m. n.m. 34.5 23.7 P/E (x) -107.0 30.2 22.4 18.1 Dividend yield (%) 0.0 0.0 0.0 0.0 EV/EBITDA (x) 142.9 17.3 10.8 9.1 P/B (x) 8.8 6.8 5.2 4.1 ROE (%) -7.9 25.4 26.3 25.2 Net debt/equity (%) 72.0 130.0 74.8 34.9
Source: Company data, Thomson Reuters, Credit Suisse estimates.
Rating OUTPERFORM* Price (29 Sep 14, P) 13.28 Target price (P) (from 12.60) 16.00¹ Upside/downside (%) 20.5 Mkt cap (P mn) 140,633 (US$3,127 mn) Enterprise value (P mn) 167,573 Number of shares (mn) 10,589.80 Free float (%) 28.1 52-week price range 13.80–8.30 ADTO - 6M (US$ mn) 2.1
*Stock ratings are relative to the coverage universe in each
analyst's or each team's respective sector.
¹Target price is for 12 months.
Research Analysts
Alvin Arogo
63 2 858 7716
30 September 2014
Philippine Gaming Sector 23
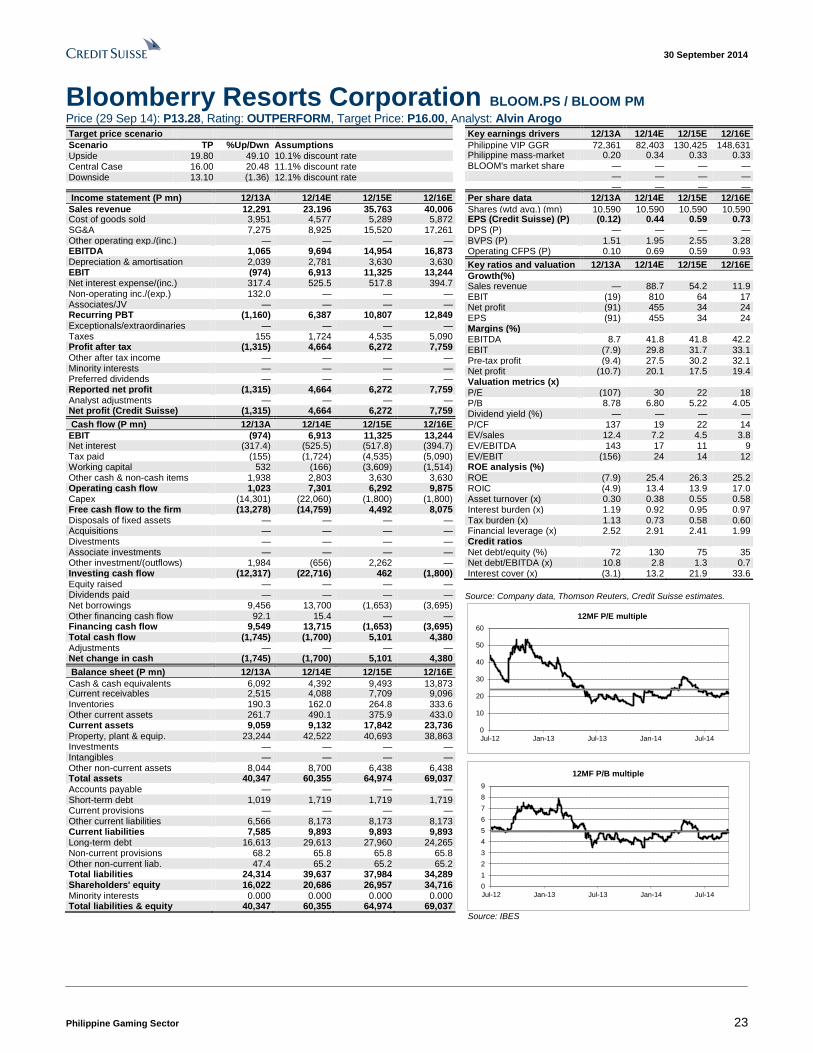
Bloomberry Resorts Corporation BLOOM.PS / BLOOM PM Price (29 Sep 14): P13.28, Rating: OUTPERFORM, Target Price: P16.00, Analyst: Alvin Arogo
Target price scenario
Scenario TP %Up/Dwn Assumptions Upside 19.80 49.10 10.1% discount rate Central Case 16.00 20.48 11.1% discount rate Downside 13.10 (1.36) 12.1% discount rate
Key earnings drivers 12/13A 12/14E 12/15E 12/16E
Philippine VIP GGR 72,361 82,403 130,425 148,631 Philippine mass-market GGR
0.20 0.34 0.33 0.33 BLOOM's market share — — — — — — — — — — — —
Income statement (P mn) 12/13A 12/14E 12/15E 12/16E
Sales revenue 12,291 23,196 35,763 40,006 Cost of goods sold 3,951 4,577 5,289 5,872 SG&A 7,275 8,925 15,520 17,261 Other operating exp./(inc.) — — — — EBITDA 1,065 9,694 14,954 16,873 Depreciation & amortisation 2,039 2,781 3,630 3,630 EBIT (974) 6,913 11,325 13,244 Net interest expense/(inc.) 317.4 525.5 517.8 394.7 Non-operating inc./(exp.) 132.0 — — — Associates/JV — — — — Recurring PBT (1,160) 6,387 10,807 12,849 Exceptionals/extraordinaries — — — — Taxes 155 1,724 4,535 5,090 Profit after tax (1,315) 4,664 6,272 7,759 Other after tax income — — — — Minority interests — — — — Preferred dividends — — — — Reported net profit (1,315) 4,664 6,272 7,759 Analyst adjustments — — — — Net profit (Credit Suisse) (1,315) 4,664 6,272 7,759
Cash flow (P mn) 12/13A 12/14E 12/15E 12/16E
EBIT (974) 6,913 11,325 13,244 Net interest (317.4) (525.5) (517.8) (394.7) Tax paid (155) (1,724) (4,535) (5,090) Working capital 532 (166) (3,609) (1,514) Other cash & non-cash items 1,938 2,803 3,630 3,630 Operating cash flow 1,023 7,301 6,292 9,875 Capex (14,301) (22,060) (1,800) (1,800) Free cash flow to the firm (13,278) (14,759) 4,492 8,075 Disposals of fixed assets — — — — Acquisitions — — — — Divestments — — — — Associate investments — — — — Other investment/(outflows) 1,984 (656) 2,262 — Investing cash flow (12,317) (22,716) 462 (1,800) Equity raised — — — — Dividends paid — — — — Net borrowings 9,456 13,700 (1,653) (3,695) Other financing cash flow 92.1 15.4 — — Financing cash flow 9,549 13,715 (1,653) (3,695) Total cash flow (1,745) (1,700) 5,101 4,380 Adjustments — — — — Net change in cash (1,745) (1,700) 5,101 4,380
Balance sheet (P mn) 12/13A 12/14E 12/15E 12/16E
Cash & cash equivalents 6,092 4,392 9,493 13,873 Current receivables 2,515 4,088 7,709 9,096 Inventories 190.3 162.0 264.8 333.6 Other current assets 261.7 490.1 375.9 433.0 Current assets 9,059 9,132 17,842 23,736 Property, plant & equip. 23,244 42,522 40,693 38,863 Investments — — — — Intangibles — — — — Other non-current assets 8,044 8,700 6,438 6,438 Total assets 40,347 60,355 64,974 69,037 Accounts payable — — — — Short-term debt 1,019 1,719 1,719 1,719 Current provisions — — — — Other current liabilities 6,566 8,173 8,173 8,173 Current liabilities 7,585 9,893 9,893 9,893 Long-term debt 16,613 29,613 27,960 24,265 Non-current provisions 68.2 65.8 65.8 65.8 Other non-current liab. 47.4 65.2 65.2 65.2 Total liabilities 24,314 39,637 37,984 34,289 Shareholders' equity 16,022 20,686 26,957 34,716 Minority interests 0.000 0.000 0.000 0.000 Total liabilities & equity 40,347 60,355 64,974 69,037
Per share data 12/13A 12/14E 12/15E 12/16E
Shares (wtd avg.) (mn) 10,590 10,590 10,590 10,590 EPS (Credit Suisse) (P) (0.12) 0.44 0.59 0.73 DPS (P) — — — — BVPS (P) 1.51 1.95 2.55 3.28 Operating CFPS (P) 0.10 0.69 0.59 0.93
Key ratios and valuation 12/13A 12/14E 12/15E 12/16E
Growth(%) Sales revenue — 88.7 54.2 11.9 EBIT (19) 810 64 17 Net profit (91) 455 34 24 EPS (91) 455 34 24 Margins (%) EBITDA 8.7 41.8 41.8 42.2 EBIT (7.9) 29.8 31.7 33.1 Pre-tax profit (9.4) 27.5 30.2 32.1 Net profit (10.7) 20.1 17.5 19.4 Valuation metrics (x) P/E (107) 30 22 18 P/B 8.78 6.80 5.22 4.05 Dividend yield (%) — — — — P/CF 137 19 22 14 EV/sales 12.4 7.2 4.5 3.8 EV/EBITDA 143 17 11 9 EV/EBIT (156) 24 14 12 ROE analysis (%) ROE (7.9) 25.4 26.3 25.2 ROIC (4.9) 13.4 13.9 17.0 Asset turnover (x) 0.30 0.38 0.55 0.58 Interest burden (x) 1.19 0.92 0.95 0.97 Tax burden (x) 1.13 0.73 0.58 0.60 Financial leverage (x) 2.52 2.91 2.41 1.99 Credit ratios Net debt/equity (%) 72 130 75 35 Net debt/EBITDA (x) 10.8 2.8 1.3 0.7 Interest cover (x) (3.1) 13.2 21.9 33.6
Source: Company data, Thomson Reuters, Credit Suisse estimates.
0
10
20
30
40
50
60
Jul-12 Jan-13 Jul-13 Jan-14 Jul-14
12MF P/E multiple
0
1
2
3
4
5
6
7
8
9
Jul-12 Jan-13 Jul-13 Jan-14 Jul-14
12MF P/B multiple
Source: IBES
30 September 2014
Philippine Gaming Sector 24
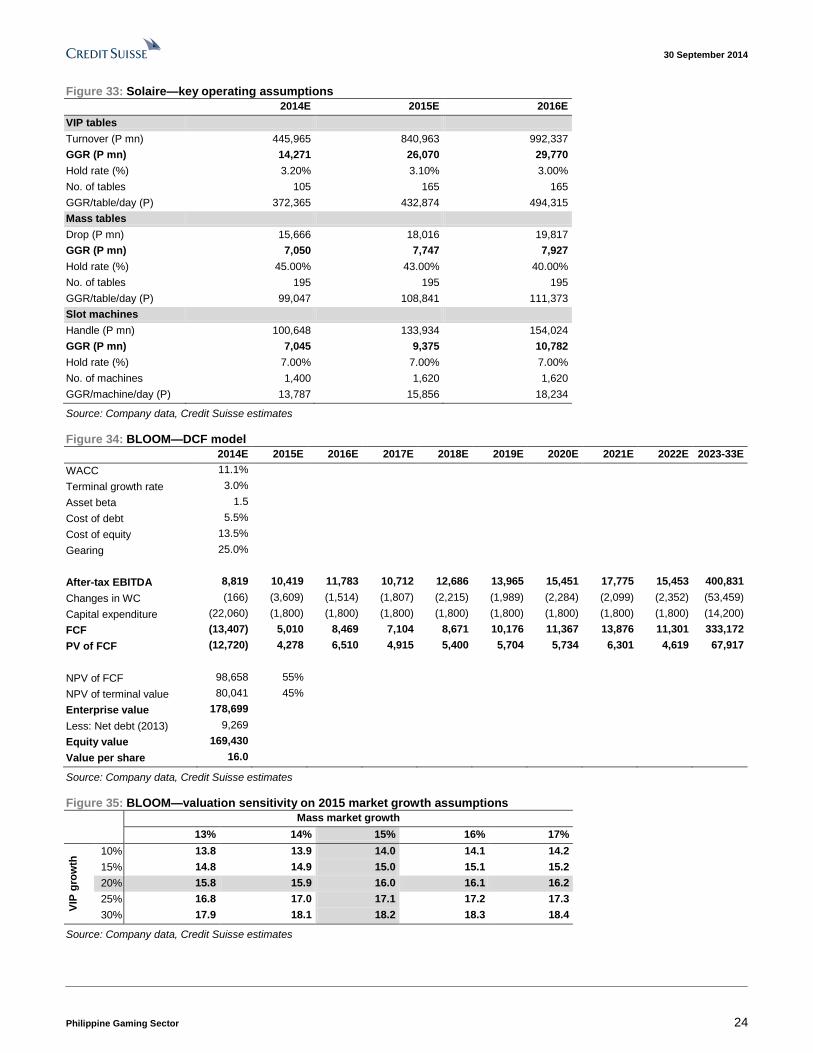
Figure 33: Solaire—key operating assumptions
2014E 2015E 2016E
VIP tables
Turnover (P mn) 445,965 840,963 992,337
GGR (P mn) 14,271 26,070 29,770
Hold rate (%) 3.20% 3.10% 3.00%
No. of tables 105 165 165
GGR/table/day (P) 372,365 432,874 494,315
Mass tables
Drop (P mn) 15,666 18,016 19,817
GGR (P mn) 7,050 7,747 7,927
Hold rate (%) 45.00% 43.00% 40.00%
No. of tables 195 195 195
GGR/table/day (P) 99,047 108,841 111,373
Slot machines
Handle (P mn) 100,648 133,934 154,024
GGR (P mn) 7,045 9,375 10,782
Hold rate (%) 7.00% 7.00% 7.00%
No. of machines 1,400 1,620 1,620
GGR/machine/day (P) 13,787 15,856 18,234
Source: Company data, Credit Suisse estimates
Figure 34: BLOOM—DCF model
2014E 2015E 2016E 2017E 2018E 2019E 2020E 2021E 2022E 2023-33E
WACC 11.1%
Terminal growth rate 3.0%
Asset beta 1.5
Cost of debt 5.5%
Cost of equity 13.5%
Gearing 25.0%
After-tax EBITDA 8,819 10,419 11,783 10,712 12,686 13,965 15,451 17,775 15,453 400,831
Changes in WC (166) (3,609) (1,514) (1,807) (2,215) (1,989) (2,284) (2,099) (2,352) (53,459)
Capital expenditure (22,060) (1,800) (1,800) (1,800) (1,800) (1,800) (1,800) (1,800) (1,800) (14,200)
FCF (13,407) 5,010 8,469 7,104 8,671 10,176 11,367 13,876 11,301 333,172
PV of FCF (12,720) 4,278 6,510 4,915 5,400 5,704 5,734 6,301 4,619 67,917
NPV of FCF 98,658 55%
NPV of terminal value 80,041 45%
Enterprise value 178,699
Less: Net debt (2013) 9,269
Equity value 169,430
Value per share 16.0
Source: Company data, Credit Suisse estimates
Figure 35: BLOOM—valuation sensitivity on 2015 market growth assumptions
Mass market growth
13% 14% 15% 16% 17%
VIP
gro
wth
10% 13.8 13.9 14.0 14.1 14.2
15% 14.8 14.9 15.0 15.1 15.2
20% 15.8 15.9 16.0 16.1 16.2
25% 16.8 17.0 17.1 17.2 17.3
30% 17.9 18.1 18.2 18.3 18.4
Source: Company data, Credit Suisse estimates

30 September 2014
Philippine Gaming Sector 25
Appendix I: Solaire Resort & Casino Project description
Figure 36: Solaire Phase 1
Source: Company data
Total land area: 8.3 hectares
Commencement of operations: 16 March 2013
Total cost: US$1.2 bn (Phase 1 and 1A)
Facilities
■ 488 hotel rooms, suites, and bayside villas.
■ Aggregate gaming floor area of 18,500 sq m containing approximately 1,400 slot
machines, 295 gaming tables and 88 ETGs.
■ 15 specialty restaurants and food & beverage outlets.
■ Grand ballroom with 1,000 seats.
■ Spa, fitness centre, and bayview promenade.
Expansion plans
Figure 37: Solaire Phase 1A (Opening date: 4Q14)
Gaming Non-gaming
220 slots 312-room all-suite hotel rooms
65 VIP gaming tables Retail promenade with 40 outlets
1,700-seat performance theatre
Additional F&B offerings
Nightclub, KTV and whisky bar
Spa, gym and salon
3,100 parking spaces
Source: Company data
Figure 38: Solaire Phase 2
Gaming Non-gaming
300 gaming tables Additional three hotels with 1,500 rooms
1,300 electronic gaming machines Event area for 15,000 people
100,000 sq m of exhibition space
35 F&B outlets
Source: Company data
30 September 2014
Philippine Gaming Sector 26
Company history
Bloomberry Resorts Corporation was incorporated in the Philippines and registered with
the Securities and Exchange Commission (SEC) on 3 May 1999. It was primarily engaged
in the manufacture and distribution of consumer communication and electronic equipment
within the Subic Bay Freeport Zone until 2003.
On 9 September 2011, Sureste and Bloomberry Resorts and Hotels, Inc. (BRHI) entered
into a Management Services Agreement (MSA) with Global Gaming Philippines, LLC
(GGAM) for technical assistance on all aspects of planning, design, layout and
construction of the Solaire project. Under the MSA, GGAM was granted the option to
purchase up to 921,184,056 shares of Bloomberry’s outstanding shares from PMHI.
GGAM exercised option to purchase under the MSA on 21 December 2012 and now owns
8.7% of outstanding capital stock in Bloomberry. Effective 12 September 2013, the MSA
with GGAM was terminated allegedly due to material breach by GGAM. GGAM however
alleged that it was BRHI and Sureste that violated the MSA. Both parties currently await
constitution of a three-member arbitration tribunal under the United Nations Commission
International Trade Law (UNCITRAL).
Enrique Razon Jr. indirectly owns 62% of Bloomberry through Prime Metroline Holdings, Inc.
and Sureste Properties, Inc. GGAM owns 8.7% of Bloomberry via Quasar Holdings, Inc.
Senior management
■ Enrique K. Razon, Jr. Chairman and Chief Executive Officer, age 54. Also the
President of Sureste, Chairman and President of International Container Terminal
Services, Inc. (ICTSI), and Chairman, President and Director of a number of ICTSI
subsidiaries and affiliates. He also serves as Chairman and President of Prime
Metroline, Chairman of the Board of Monte Oro Resources and Energy, Inc. and an
independent director of CLSA Exchange Capital Inc. He is a member of the American
Management Association, Management Association of the Philippines, World
Economic Forum and US Philippines Society.
■ Jose Eduardo J. Alarilla. Vice Chairman, age 62. Also President of BRHI, Lakeland
Village Holdings, Inc., Devoncourt Estates Inc., Eiffel House Inc., Manila Holdings and
Management, Inc. and Alpha Allied Holdings Ltd. He is also the President and CEO of
Mega Subic Terminal Services, Inc., Chairman of Mega Equipment International
Corp., as well as director of Monte Oro Resources and Energy, Inc. and International
Cleanvironment Systems Inc. He graduated with a Bachelor of Science degree in
Mechanical Engineering from De La Salle University and a Master’s degree in
Business Management from the Asian Institute of Management.
■ Thomas Arasi. Director, President and Chief Operating Officer from 11 October
2013 to present, age 56. Served as President and Chief Executive Officer of Marina
Bay Sands Pte Ltd. He graduated from Cornell University with a Bachelor of Arts
degree in Hotel and Restaurant Administration.
■ Estella Tuason-Occena. Chief Financial Officer and Treasurer, age 44. Chief
Financial Officer and Treasurer of BRHI as well as Director and Treasurer of Prime
Metroline. She serves as Executive Officer of ICTSI, Chief Financial Officer of Monte
Oro Resources and Energy, Inc., Director and Chief Financial Officer of International
Cleanvironment Systems, Inc., Treasurer of Sureste, Sureste Realty Corporation,
Lakeland Village Holdings Inc., Devoncourt Estates Inc., Achillion Holdings, Inc.,
Bloomberry Cultural Foundation, Inc. and Razon Industries, Inc. She graduated with
distinction from St. Scholastica’s College with a Bachelor's Degree in Commerce and
has an MBA from De La Salle University.
30 September 2014
Philippine Gaming Sector 27
■ Laurence Upton. Senior Vice President for International Marketing from 3 March
2014 to present, age 44. Served as Senior Vice President, VIP International
Marketing in Crown Ltd, Melbourne and was also connected with Star City Pty Ltd in a
number of senior management roles. He also serviced VVIP clients, the world’s largest
gaming customers including international celebrities.
■ Cyrus Sherafat. Senior Vice President for Casino Marketing from 17 March 2014
to present, age 31. Served as Vice President of Casino Marketing in Marina Bay
Sands in Singapore and brings with him ten years of experience in the gaming
industry through various marketing roles. He graduated from Cornell University’s
School of Hotel Administration.
■ Lorraine Koo Man Loo. Senior Vice President for VIP Services, age 37. She was
previously the Senior Manager then Assistant Vice President for Casino Customer
Service of the Galaxy Entertainment Group as well as Senior Executive Host at Marina
Bay Sands in Singapore. She is a graduate of Edith Cowan University in Australia with
a Bachelor of Arts degree in Communications Management.
■ Silverio Benny J. Tan. Corporate Secretary, age 57. He is a Managing Partner of
the law firm Picazo Buyco Tan Fider & Santos as well as Director and Corporate
Secretary of Prime Metroline, Bravo International Port Holdings Inc., Alpha
International Port Holdings Inc., Eiffel House Inc., Cycland Corp., OSA Industries
Philippines Inc. and Negros Perfect Circles Food Corp. Also a director of Celestial
Corporation, Skywide Assets Ltd., Monte Oro Resources and Energy Inc. Minerals
(SL) Ltd., and Dressline Holdings Inc. and its subsidiaries and affiliates. Also the
Corporate Secretary of Mapfre Insular Insurance Corporation, Cebu International
Container Terminal Inc., Sureste, BRHI, Lakeland Village Holdings Inc., and
Devoncourt Estates Inc. and Assistant Corporate Secretary of ICTSI, ICTSI Ltd., and
Monte Oro Resources and Energy, Inc. He graduated with a Bachelor of Arts Major
degree in Political Science, cum laude, from the University of the Philippines College
Iloilo and a Bachelor of Laws degree, cum laude, from the University of the Philippines
College of Law. Atty. Tan placed third in the 1982 Philippine Bar Exams.
■ Christine P. Base. Compliance Officer, age 43. Currently a Securities, Corporate
and Tax Lawyer at Pacis and Reyes, Attorneys and Managing Director of Legis
Forum, Inc. She is also Director and Corporate Secretary of Anchor Land Holdings,
Inc. and Corporate Secretary of Asiasec Equities, Inc., Araneta Properties, Inc. and
several private corporations. She graduated with a Bachelor of Science degree in
Commerce, major in Accounting from De La Salle University and is a Certified Public
Accountant. She earned her degree of Juris Doctor from Ateneo de Manila University
School of Law and is also a member of the Philippine Bar.
■ Christian R. Gonzalez. Director, age 38. Also a Director of Sureste and Prime
Metroline. He is Head of the Asia Pacific Region of International Container Terminal
Services, Inc., as well as Trustee and Auditor of ICTSI Foundation, Inc. He earned his
degree in Business Administration from Pepperdine University in California and his
Bilingual Masters in Business Administration from Instituto de Estudios Superiores de
la Empresa (IESE) Business School in Barcelona, Spain.
■ Donato C. Almeda. Director, age 59. He was President and CEO of Waterfront
Philippines Inc. as well as President of Waterfront Cebu City Hotel, Waterfront Mactan
Hotel, Fort Ilocandia Hotel and Insular Hotel in Davao. He was also the Managing
Director of Waterfront Promotions Ltd. He graduated with a degree in Engineering
from De La Salle University.
30 September 2014
Philippine Gaming Sector 28
■ Carlos C. Ejercito. Independent Director, age 68. Also an Independent Director of
Monte Oro Resources and Energy, Inc. He serves as Chairman and President of
Northern Access Mining Corporation, Forum Cebu Coal Corporation and
Morganhouse Holdings Inc. He is also a Governor of the Management Association of
the Philippines and a member of the Philippine Chamber of Commerce. He earned his
Bachelor’s degree in Business Administration, cum laude, from the University of the
East and is an MBA candidate of the Ateneo Graduate School of Business. He also
attended the Program for Management Development of Harvard Business School.
■ Jon Ramon Aboitiz. Independent Director, age 65. Also an Independent Director of
ICTSI. He is the Chairman of Aboitiz & Co., Inc and Aboitiz Equity Ventures, Inc. He
currently holds a number of varied positions in the Aboitiz Group such as President of
the Aboitiz Foundation, Vice Chairman of Unionbank of the Philippines and Chairman
of the Executive Committee, Risk Management Committee, Compensation and
Remuneration Committee, Nominations Committee, and Corporate Governance
Committee of Unionbank. He also serves as a member of the Board of Advisors of the
Coca-Cola Export Foundation, Trustee of the Philippine Business for Social Progress,
and Trustee of Santa Clara University.
30 September 2014
Philippine Gaming Sector 29
Asia Pacific / Philippines
Casinos & Gaming
Travellers International Hotel Group, Inc. (RWM.PS / RWM PM)
ASSUMING COVERAGE
Growth prospects intact
■ Assuming coverage with an OUTPERFORM rating. We assume coverage
of Travellers International Hotel Group (RWM) with an OUTPERFORM
rating and a P11.38 target price, indicating potential upside of 15%. We
forecast an earnings CAGR of 32% for 2014-16, taking into account the
improvement in win rates and its Phase 2 and 3 expansions.
■ Margin pressure from deceleration of revenue growth and intensifying
competition. We believe RWM will continue to be aggressive in its
promotions as most of the industry growth will be taken up by Solaire and
CoD Manila. RWM's near-term expansion involves mostly non-gaming
facilities. While this gives RWM a sizeable gaming inventory, as it has the
most number of hotel rooms, we believe its deployment could be delayed, as
critical mass could start to form in Entertainment City.
■ Resorts World Bayshore to begin construction before year-end.
Travellers recently announced the acquisition of a 95% stake in Resorts
World Bayshore City Inc. (RWBCI), which holds the rights and obligations to
the Resorts World Bayshore project. We have not accounted for this project
in our forecasts as the capex, which will be funded by both debt and equity,
is not yet definite. The project is targeted to begin construction before year-
end and completion by 4Q18.
■ Target price of P11.38. We discount cash flows up to 2033, and assume a
3% terminal growth rate to arrive at our target price of P11.38. Despite a lack
of catalysts, and margin pressure, we assume coverage of RWM with an
OUTPERFORM rating, as the company has substantial gaming expansion
plans post 2017. Key risks include intense competition in the Philippine
gaming industry and adverse regulatory changes.
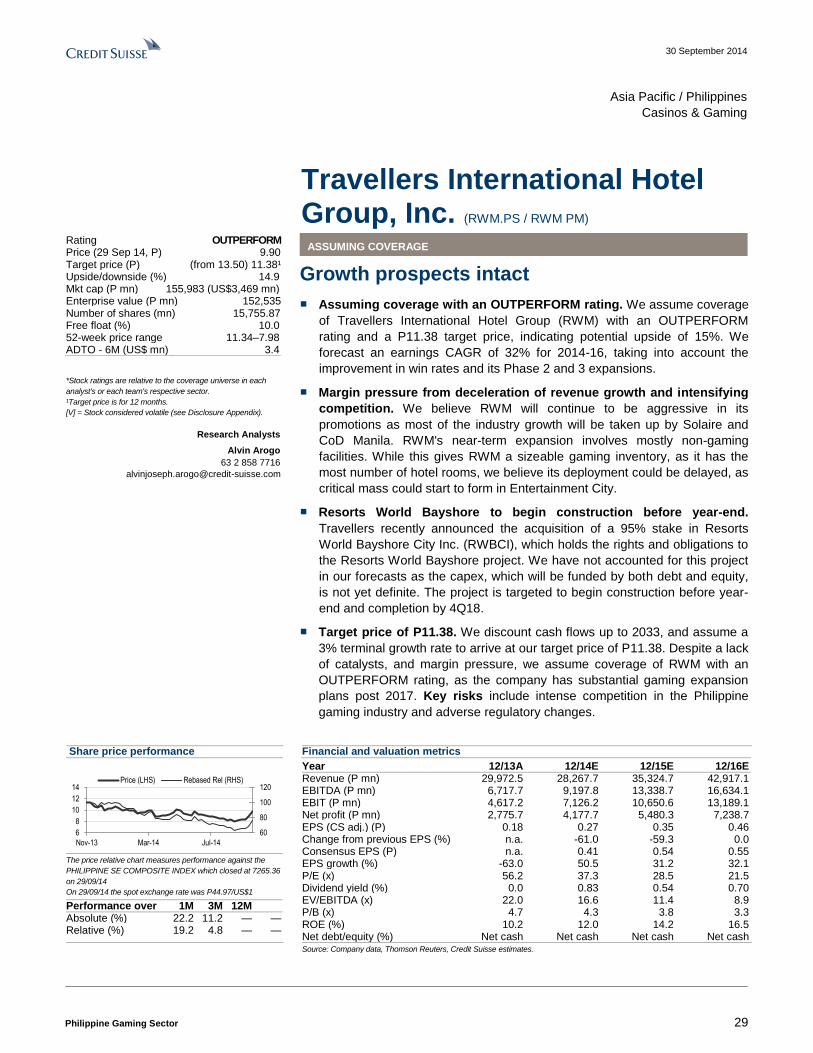
Share price performance
60
80
100
120
6
8
10
12
14
Nov-13 Mar-14 Jul-14
Price (LHS) Rebased Rel (RHS)
The price relative chart measures performance against the
PHILIPPINE SE COMPOSITE INDEX which closed at 7265.36
on 29/09/14
On 29/09/14 the spot exchange rate was P44.97/US$1
Performance over 1M 3M 12M Absolute (%) 22.2 11.2 — — Relative (%) 19.2 4.8 — —
Financial and valuation metrics
Year 12/13A 12/14E 12/15E 12/16E Revenue (P mn) 29,972.5 28,267.7 35,324.7 42,917.1 EBITDA (P mn) 6,717.7 9,197.8 13,338.7 16,634.1 EBIT (P mn) 4,617.2 7,126.2 10,650.6 13,189.1 Net profit (P mn) 2,775.7 4,177.7 5,480.3 7,238.7 EPS (CS adj.) (P) 0.18 0.27 0.35 0.46 Change from previous EPS (%) n.a. -61.0 -59.3 0.0 Consensus EPS (P) n.a. 0.41 0.54 0.55 EPS growth (%) -63.0 50.5 31.2 32.1 P/E (x) 56.2 37.3 28.5 21.5 Dividend yield (%) 0.0 0.83 0.54 0.70 EV/EBITDA (x) 22.0 16.6 11.4 8.9 P/B (x) 4.7 4.3 3.8 3.3 ROE (%) 10.2 12.0 14.2 16.5 Net debt/equity (%) Net cash Net cash Net cash Net cash
Source: Company data, Thomson Reuters, Credit Suisse estimates.
Rating OUTPERFORM Price (29 Sep 14, P) 9.90 Target price (P) (from 13.50) 11.38¹ Upside/downside (%) 14.9 Mkt cap (P mn) 155,983 (US$3,469 mn) Enterprise value (P mn) 152,535 Number of shares (mn) 15,755.87 Free float (%) 10.0 52-week price range 11.34–7.98 ADTO - 6M (US$ mn) 3.4
*Stock ratings are relative to the coverage universe in each
analyst's or each team's respective sector.
¹Target price is for 12 months.
[V] = Stock considered volatile (see Disclosure Appendix).
Research Analysts
Alvin Arogo
63 2 858 7716
30 September 2014
Philippine Gaming Sector 30
Travellers International Hotel Group RWM.PS / RWM PM Price (29 Sep 14): P9.90, Rating:: OUTPERFORM [V], Target Price: P11.38, Analyst: Alvin Arogo
Target price scenario
Scenario TP %Up/Dwn Assumptions Upside 12.00 21.21 10.1% discount rate Central Case 11.38 14.95 11.1% discount rate Downside 9.40 (5.05) 12.1% discount rate
Key earnings drivers 12/13A 12/14E 12/15E 12/16E
VIP drop volume (P mn) 72,361 82,403 130,425 148,631 Mass market drop volume (P mn)
— — — — Win rate — — — — 0.41 0.34 0.27 0.28 0.03 0.02 0.02 0.03
Income statement (P mn) 12/13A 12/14E 12/15E 12/16E
Sales revenue 29,972 28,268 35,325 42,917 Cost of goods sold 11,373 8,833 9,583 11,265 SG&A 12,757 11,211 13,432 16,114 Other operating exp./(inc.) (876) (975) (1,030) (1,096) EBITDA 6,718 9,198 13,339 16,634 Depreciation & amortisation 2,100 2,072 2,688 3,445 EBIT 4,617 7,126 10,651 13,189 Net interest expense/(inc.) 1,811 1,428 1,521 1,517 Non-operating inc./(exp.) — — — — Associates/JV — — — — Recurring PBT 2,806 5,698 9,130 11,672 Exceptionals/extraordinaries — — — — Taxes 67 1,521 3,649 4,434 Profit after tax 2,740 4,178 5,480 7,239 Other after tax income 36.2 — — — Minority interests — — — — Preferred dividends — — — — Reported net profit 2,776 4,178 5,480 7,239 Analyst adjustments — — — — Net profit (Credit Suisse) 2,776 4,178 5,480 7,239
Cash flow (P mn) 12/13A 12/14E 12/15E 12/16E
EBIT 4,617 7,126 10,651 13,189 Net interest (1,811) (1,428) (1,521) (1,517) Tax paid (66) (1,526) (3,649) (4,434) Working capital 1,332 (1,176) 97 104 Other cash & non-cash items 3,432 772 2,688 3,445 Operating cash flow 7,504 3,768 8,266 10,788 Capex (5,489) (7,200) (7,200) (5,400) Free cash flow to the firm 2,016 (3,432) 1,066 5,388 Disposals of fixed assets — — — — Acquisitions — — — — Divestments — — — — Associate investments — — — — Other investment/(outflows) (40.8) 62.9 (28.3) (2.1) Investing cash flow (5,529) (7,137) (7,228) (5,402) Equity raised 16,855 — — — Dividends paid (6,141) (1,299) (836) (1,096) Net borrowings (1,588) — — — Other financing cash flow (663.4) 8.4 9.2 10.1 Financing cash flow 8,463 (1,291) (826) (1,086) Total cash flow 10,438 (4,660) 211 4,300 Adjustments (1,576) — — — Net change in cash 8,862 (4,660) 211 4,300
Balance sheet (P mn) 12/13A 12/14E 12/15E 12/16E
Cash & cash equivalents 25,776 21,115 21,326 25,626 Current receivables 3,043 2,851 3,664 4,808 Inventories 207.2 208.1 214.4 264.2 Other current assets 445.7 443.9 454.5 448.0 Current assets 29,472 24,619 25,659 31,146 Property, plant & equip. 30,872 36,000 40,512 42,467 Investments 206.1 195.6 199.5 200.4 Intangibles — — — — Other non-current assets 676.4 624.0 648.4 649.6 Total assets 61,226 61,438 67,019 74,463 Accounts payable 7,313 6,013 6,905 8,214 Short-term debt 1,603 1,603 1,603 1,603 Current provisions 1,305 — — — Other current liabilities 162.0 91.8 126.9 109.3 Current liabilities 10,383 7,708 8,635 9,926 Long-term debt 16,064 16,064 16,064 16,064 Non-current provisions — — — — Other non-current liab. 1,351 1,360 1,369 1,379 Total liabilities 27,798 25,132 26,068 27,369 Shareholders' equity 33,381 36,260 40,905 47,047 Minority interests — — — — Total liabilities & equity 61,226 61,438 67,019 74,463
Per share data 12/13A 12/14E 12/15E 12/16E
Shares (wtd avg.) (mn) 15,756 15,756 15,756 15,756 EPS (Credit Suisse) (P) 0.18 0.27 0.35 0.46 DPS (P) — 0.08 0.05 0.07 BVPS (P) 2.12 2.30 2.60 2.99 Operating CFPS (P) 0.48 0.24 0.52 0.68
Key ratios and valuation 12/13A 12/14E 12/15E 12/16E
Growth(%) Sales revenue 5.1 (5.7) 25.0 21.5 EBIT (38.1) 54.3 49.5 23.8 Net profit (58.9) 50.5 31.2 32.1 EPS (63.0) 50.5 31.2 32.1 Margins (%) EBITDA 22.4 32.5 37.8 38.8 EBIT 15.4 25.2 30.2 30.7 Pre-tax profit 9.4 20.2 25.8 27.2 Net profit 9.3 14.8 15.5 16.9 Valuation metrics (x) P/E 56.2 37.3 28.5 21.5 P/B 4.67 4.30 3.81 3.32 Dividend yield (%) — 0.83 0.54 0.70 P/CF 20.8 41.4 18.9 14.5 EV/sales 4.93 5.40 4.31 3.45 EV/EBITDA 22.0 16.6 11.4 8.9 EV/EBIT 32.0 21.4 14.3 11.2 ROE analysis (%) ROE 10.2 12.0 14.2 16.5 ROIC 18.4 18.0 18.2 21.4 Asset turnover (x) 0.49 0.46 0.53 0.58 Interest burden (x) 0.61 0.80 0.86 0.88 Tax burden (x) 0.98 0.73 0.60 0.62 Financial leverage (x) 1.83 1.69 1.64 1.58 Credit ratios Net debt/equity (%) (24.3) (9.5) (8.9) (16.9) Net debt/EBITDA (x) (1.21) (0.37) (0.27) (0.48) Interest cover (x) 2.55 4.99 7.00 8.70
Source: Company data, Thomson Reuters, Credit Suisse estimates.
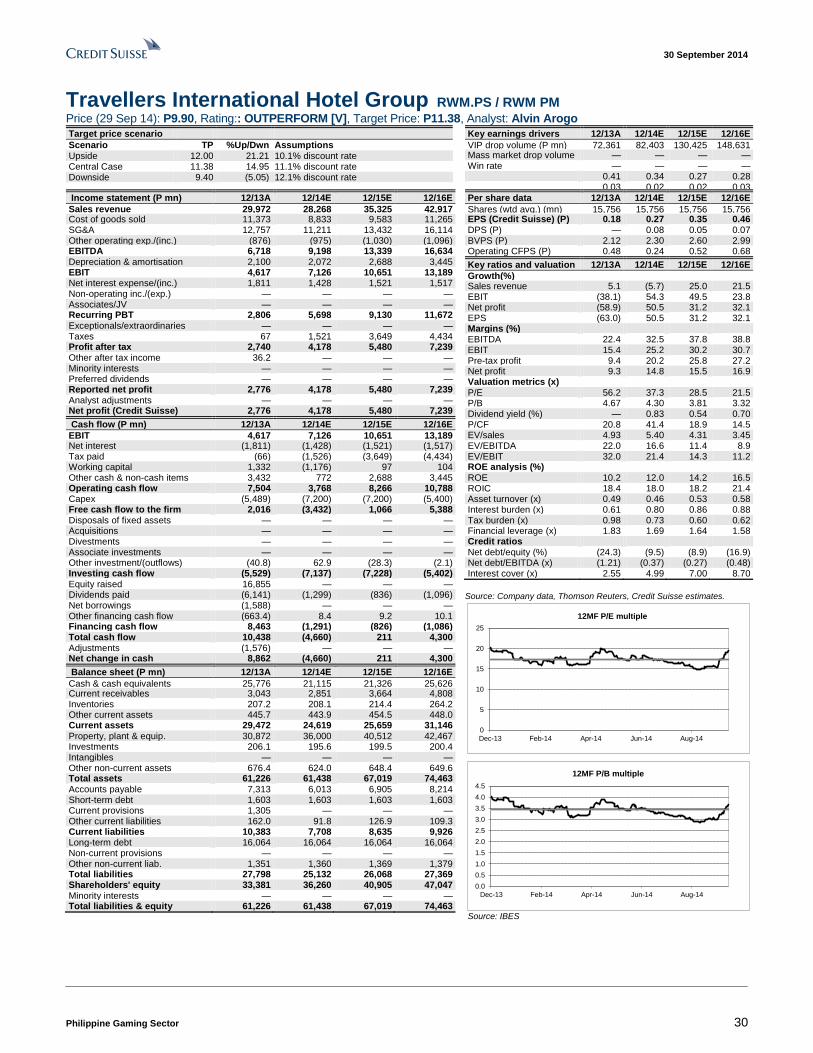
0
5
10
15
20
25
Dec-13 Feb-14 Apr-14 Jun-14 Aug-14
12MF P/E multiple
0.0
0.5
1.0
1.5
2.0
2.5
3.0
3.5
4.0
4.5
Dec-13 Feb-14 Apr-14 Jun-14 Aug-14
12MF P/B multiple
Source: IBES
30 September 2014
Philippine Gaming Sector 31
Figure 39: Resorts World Manila—key operating assumptions
2012 2013 2014E 2015E 2016E
VIP tables
Turnover (P mn) 456,935 581,527 592,278 665,318 740,025
GGR (P mn) 13,708 15,120 13,030 15,968 19,241
Hold rate (%) 3.00% 2.60% 2.20% 2.40% 2.60%
No. of tables 119 119 120 133 146
GGR/table/day (P) 315,599 348,100 297,491 328,430 360,069
Mass tables
Drop (P mn) 21,689 23,529 24,470 28,037 31,768
GGR (P mn) 5,683 6,117 6,093 7,150 8,260
Hold rate (%) 26.20% 26.00% 24.90% 25.50% 26.00%
No. of tables 168 168 168 188 208
GGR/table/day (P) 92,672 99,762 99,363 104,301 109,005
Slot machines
Handle (P mn) 108,207 110,669 113,871 151,247 189,720
GGR (P mn) 8,440 8,522 8,313 11,344 14,419
Hold rate (%) 7.80% 7.70% 7.30% 7.50% 7.60%
No. of machines 1,684 1,822 1,847 2,417 2,987
GGR/machine/day (P) 13,731 12,814 12,330 12,858 13,225
Source: Company data, Credit Suisse estimates
Figure 40: RWM—DCF model
2014E 2015E 2016E 2017E 2018E 2019E 2020E 2021E 2022E 2023-33E
WACC 11.1%
Terminal growth rate 3.0%
Asset beta 1.5
Cost of Debt 5.5%
Cost of Equity 13.5%
Gearing 25.0%
After-tax EBITDA 7,677 9,690 12,200 16,008 18,026 19,181 22,941 25,514 27,684 313,057
Changes in WC (1,176) 97 104 236 (1,157) (2,464) 1,570 1,273 1,340 10,102
Capital expenditure (7,200) (7,200) (5,400) (5,400) (2,500) (2,500) (2,500) (2,500) (2,500) (27,500)
FCF (699) 2,587 6,904 10,844 14,368 14,218 22,011 24,287 26,524 295,658
PV of FCF (663) 2,209 5,307 7,502 8,947 7,969 11,104 11,029 10,841 69,209
NPV of FCF 133,454 78%
NPV of terminal val. 37,738 22%
Enterprise value 171,193
Add: Net cash 8,109
Equity value 179,301
Value per share 11.4
Source: Credit Suisse estimates
Figure 41: RWM—valuation sensitivity on 2015 market growth assumptions
Mass market growth
1.5% 2.0% 2.5% 3.0% 3.5%
VIP
gro
wth
-1.5% 11.0 11.0 11.1 11.1 11.2
0.0% 11.2 11.2 11.2 11.3 11.3
1.2% 11.3 11.3 11.4 11.4 11.5
2.5% 11.4 11.5 11.5 11.6 11.6
5.0% 11.7 11.8 11.8 11.9 11.9
Source: Company data, Credit Suisse estimates
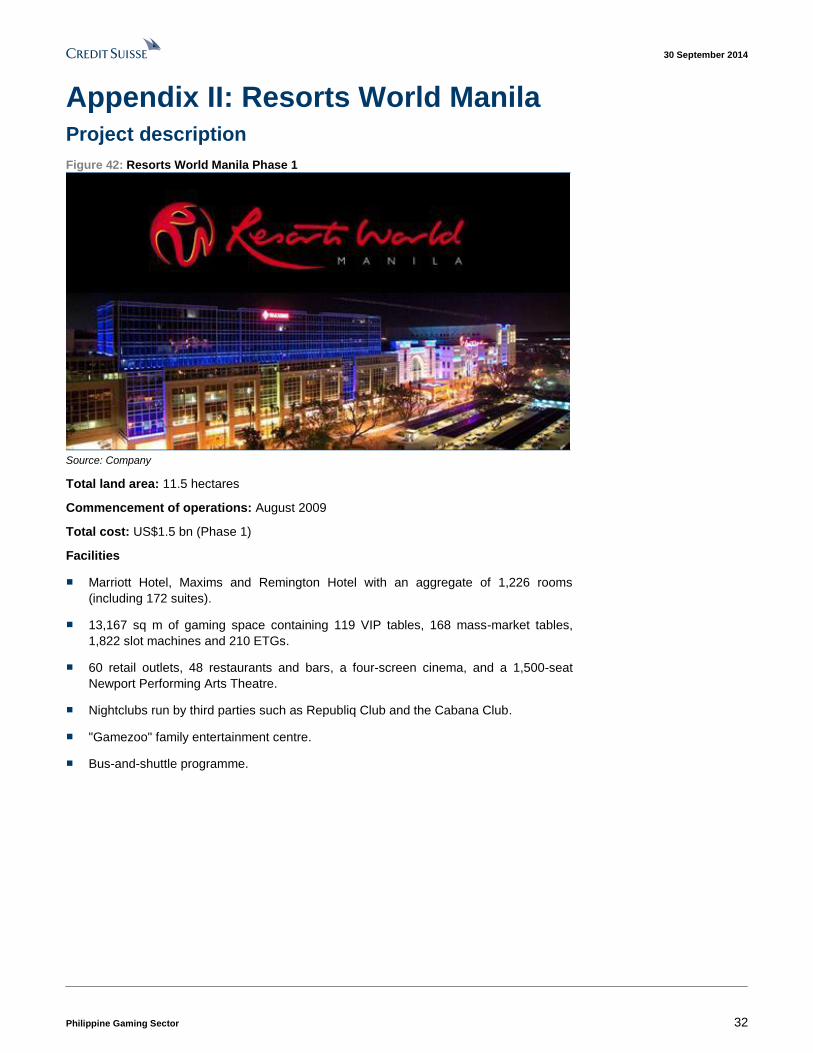
30 September 2014
Philippine Gaming Sector 32
Appendix II: Resorts World Manila Project description
Figure 42: Resorts World Manila Phase 1
Source: Company
Total land area: 11.5 hectares
Commencement of operations: August 2009
Total cost: US$1.5 bn (Phase 1)
Facilities
■ Marriott Hotel, Maxims and Remington Hotel with an aggregate of 1,226 rooms
(including 172 suites).
■ 13,167 sq m of gaming space containing 119 VIP tables, 168 mass-market tables,
1,822 slot machines and 210 ETGs.
■ 60 retail outlets, 48 restaurants and bars, a four-screen cinema, and a 1,500-seat
Newport Performing Arts Theatre.
■ Nightclubs run by third parties such as Republiq Club and the Cabana Club.
■ "Gamezoo" family entertainment centre.
■ Bus-and-shuttle programme.
30 September 2014
Philippine Gaming Sector 33
Expansion plans
Figure 43: Phase 2 expansion (opening late 2015)
Marriott Grand Ballroom Marriott West Wing
11,000 sq m in ground area Ten-storeyed annex to Marriott Hotel Manila
126,000 sq m in built-up space 3,000 sq m in ground area
Seating capacity of up to 2,000 31,000 sq m of built-up space
Four independent function rooms 227 rooms
Two boardrooms 29 junior suites
Six VIP breakaway rooms one presidential suite
17 meeting rooms VIP all day dining facility
Two wedding chapels Chinese restaurant
A number of F&B outlets Bar and lounge
1,532 underground parking spaces Pool, gym and spa facility
Footbridge to Marriott West Wing and Marriott Hotel Manila Golf terrace with direct access to Villamor golf course
127 additional parking spaces
Source: Company data
Figure 44: Phase 3 expansion (opening 2Q17)
Gaming Non-gaming
17,955 sq m of gaming space Hilton Manila with 352 rooms
Up to 285 gaming tables Sheraton Hotel Manila with 350 rooms
Up to 1,710 slots Maxims Hotel with additional 175 suites
Up to 1,710 ETGs Footbridge connecting new hotels and Maxims extension
1,750 sq m of retail space
1,500 parking spaces
Source: Company data
Figure 45: Resorts World Bayshore (opening 4Q18)
Gaming Non-gaming
~221 gaming tables 1,440 rooms (at least three hotels)
~1,323 slots Theatre
Retail shops
Possible "themed area"
Source: The Innovation Group
Company history
Travellers International Hotel Group, Inc. was incorporated in the Philippines on 17
December 2003 primarily to engage in the business of hotels, restaurants, leisure parks,
entertainment centres and other related businesses, including holding investments done in
and operating casinos and other gaming activities. The company was incorporated as a
wholly-owned subsidiary of AGI, which is a leading conglomerate in the Philippines listed
in the PSE.
On 2 June 2008, Travellers International Hotel Group, Inc. received one of the first
licences issued by the Philippine Amusement and Gaming Corporation (PAGCOR) to
construct and operate leisure and gaming facilities. The company thus commenced
business operations and the development of Resorts World Manila. GHK, an affiliate of the
Genting Group, acquired 50% interest in the company in July 2008, pursuant to their joint
venture agreement with AGI.
In August 2009, Resorts World Manila opened its casino and gaming facilities as well as
certain restaurants and shops, including the Newport Mall, the Newport Performing Arts
Theatre and the four-screen cinema. By 2012, full operations of Newport Mall commenced
with a total of 88 retail outlets. Also in 2012, the company began construction of several
structures for its Phase 2 and Phase 3 expansion plans.
30 September 2014
Philippine Gaming Sector 34
On 18 March 2013, the company entered into a Deed of Accession with Resorts World
Bayshore, Inc. (RWBCI) which led PAGCOR to recognise RWBCI as a co-licensee and
co-holder of the Joint Venture Agreement and provisional licence. Accordingly, on 28 June
2013, PAGCOR issued an Amended Certificate of Affiliation and Provisional Licence to
certify this. On 10 June 2013, the parties entered a Cooperation Agreement which
designated the parties’ rights, interests and obligations; this designated RWBCI to Site A
or Entertainment City and Travellers to Site B or Newport City.
Senior management
■ Chua Ming Huat. Chairman, Chief Executive Officer, and Director since 2008,
age 51. Mr Huat is currently President of GHK and a Director of Norwegian Cruise
Line Holdings Ltd. He has also worked as chief operating officer of Genting Berhad
and held a number of key management positions in international securities companies
in Malaysia, Singapore, and Hong Kong. Mr Huat holds a Bachelor of Arts degree in
Political Science and Economics from the Carleton University in Ottawa, Canada.
■ Kingson U Sian. President and Director since 2008, age 53. Mr Sian is also
President and Director of AGI as well as Director and President of Forbes Town
Properties & Holdings, Inc. and Chairman and President of Prestige Hotels & Resorts,
Inc. He is also a member and executive director of Megaworld Corporation. He
graduated with a Bachelor of Science degree in Business Economics from the
University of the Philippines and a Master's in Business Administration in Finance and
Business Policy from the University of Chicago.
■ Bernard Than Boon Teong.* Chief Financial Officer, age 43. Prior to his
appointment as Chief Financial Officer, he held the position of vice president for
treasury. He has over 18 years of working experience in external audit, hospitality
industry and casino/gaming/cruise line industries and was responsible for introducing
the Computerized Tracking Program for the calculation of VIP players, level of gaming,
and calculation of commission. Mr Teong graduated from Monash University in
Melbourne, Australia with a business degree.
■ Stephen James Reilly.* Chief Operating Officer since 1 January 2013 and
Executive Vice President since November 2011, age 48. Mr Reilly has also served
as country head (the Philippines) and senior vice president of GHK Group and was
responsible for the regional operating headquarters and GHK Group support services.
He had ten years of working experience in the United Kingdom where he was
responsible for the security and surveillance of gaming operations at the Regency and
Barracuda Casinos.
■ Ma. Georgina A Alvarez. Chief Legal Officer and Assistant Corporate Secretary,
age 43. Prior to joining the company, she was the senior vice president for Legal and
Corporate Services of Global-Estates Resort. She earned a Bachelor of Science
degree with a Commerce Major in Economics and Marketing from Saint Louis
University and graduated second in rank from San Beda College of Law. Ms Alvarez
also received with distinction her Masters in Management major in industrial relations
at the University of the Philippines.
■ Patricia May T Siy. Chief Corporate Planning Officer, age 53. Her last position held
and function was segment head (executive vice president) for commercial and retail
banking with oversight of commercial lending units, branch banking, transaction
banking, consumer lending and marketing and communications. Ms Siy has also
worked for Rustan’s Supercenter as its chief financial officer, as well as in various
positions in Security Bank Corporation and Standard Chartered Bank. She graduated
from De La Salle University with a Bachelor of Science degree in industrial
management engineering, minoring in chemical engineering.
30 September 2014
Philippine Gaming Sector 35
■ Andrew L Tan. Director, age 65. He is also the current Chairman and CEO of AGI,
Global Estate-Resorts, Inc. as well as Chairman of Empire East Land Holdings, Inc.,
Suntrust Properties, Inc., Emperador Distillers, Inc., Alliance Global Brands, Inc. and
Megaworld Foundation, Inc. Mr Tan is also Vice Chairman and Treasurer of Golden
Arches Realty Corporation. He graduated from the University of the East with a
Bachelor of Science degree in Business Administration (magna cum laude), and was
also awarded the Degree of Doctor of Humanities, honoris causa, from the University
of the East.
■ Tan Sri Lim Kok Thay. Director since 2009, age 62. He currently spearheads the
Genting Group as Chairman and Chief Executive Officer and has expanded the
company’s presence globally. Mr Thay's leadership has resulted in a number of global
leisure brands such as Resorts World Genting in Malaysia, the Burswood International
Resort & Casino in Perth and the Adelaide Casino in South Australia, Lucayan Beach
Resort & Casino in the Bahamas and the Subic Bay Resort & Casino in the
Philippines. He pioneered the Asian cruise industry with Star Cruises and has
expanded its focus from sea to land-based operations.
■ Jose Alvaro D Rubio. Director since 2009, age 61. He was senior vice president at
Philippine National Bank and has 35 years of experience in the banking industry,
including international banking. He was also a former member and director of the Bank
Administration Institute of the Philippines. He holds a Bachelor of Science in Business
Administration in Accounting degree (cum laude) from the University of the East.
■ Laurito E Serrano. Director since 8 June 2013, age 53. Mr Serrano is also a Director
of Philippine Veterans Bank and Atlas Consolidated Mining Corporation as well as
Managing Director of CibaCapital Philippines, Inc. He was also involved in a number of
projects where he acted as senior advisor like the project-management of a
securitisation program involving several shareholders in the Metro Rail Transit Group. Mr
Serrano was also a part of SGV in the Audit and Business Advisory Group and, later, a
partner. He graduated cum laude from the Polytechnic University of the Philippines with
a Bachelor of Science degree in commerce. Mr Serrano earned his Master’s degree in
Business Administration from Harvard Business School in Boston. He is a Certified
Public Accountant and ranked twelfth in the CPA licensure examination.
■ Enrique Soriano III. Director since 30 October 2013, age 46. Enrique Soriano III is
the Chairman of the Marketing Cluster of the Ateneo Graduate School of Business, as
well as a family business coach, book author, professor of global marketing, and
program director for real estate. He graduated from the University of the Philippines
with a BA in history and earned his Master's degree in Business Administration from
De La Salle University. He also took Doctorate Units at the UP National College of
Public Administration and studied a course in executive education from the National
University of Singapore Business School.
■ M Hakan Dagtas.* Chief Gaming Operations Officer, age 45. He has more than 24
years of experience in the hospitality industry and casino/gaming/cruise line industries.
Mr Dagtas began his career as a dealer in Hilton Casino before working in a variety of
casinos and gaming companies including Ramada Mersin Casino, Swiss Hotel
Bosphorus, Cinar Casino and Net Holding as well as serving in various positions with
Star Cruises Inc. He is a graduate from the School of Tourism and Hotel Management
of Cukurova University.
■ Stanley Chee.* Chief Surveillance and Systems Officer, age 53. He has over 27
years of casino experience coupled with a broad understanding of the Asian gaming
environment as he worked at Star Cruises as Director of Surveillance prior to joining
the company. Mr Chee is responsible for the installation of a state-of-the-art digital
CCTV system with more than 2,500 cameras and the set-up of a surveillance
monitoring room similar to those in Las Vegas.
30 September 2014
Philippine Gaming Sector 36
■ Ravi D Ganesan. * Chief Gaming Training and Development Officer, age 47. He
joined Resorts World Genting and was later appointed Assistant Manager TRD of
Casino de Genting, Resorts World. Mr Ganesan also served as Director of Casino
Administration and Training in Star Cruises. He has worked in the
casino/gaming/cruise line industries for approximately 25 years.
■ Armeen Basister Gomez. Chief Safety and Security Officer, age 38. He has more
than ten years of management and leadership experience in asset protection, fraud
control, safety administration, investigation and related functions and is a Board
Certified Protection Professional of the American Society for Industrial Security
International as well as a Licensed Security Consultant licensed by SAGSD, Philippine
National Police. Mr Gomez took a graduate course in Occupational Health and Safety
from the University of the Philippines and earned a Master's degree in Business
Administration from the International Academy of Management and Economics.
■ Randy Reyes. Chief Technology Officer. He has been with the company's IT group
for the last five years.
■ Allan Martin L Paz. Chief Integrated Marketing Officer, age 42. He has previously
worked as Client Service Director for DDB Worldwide, as well as Senior Brand
Director for Leo Burnett/Arc Worldwide in Shanghai. Prior to that, Mr Paz was senior
account director for 141 Worldwide in Vietnam and group account supervisor for Foote
Cone and Belding Advertising. He has also held various positions in Ace Saatchi &
Saatchi Advertising and has approximately 20 years of experience in integrated
communication, advertising and marketing. He graduated from the University of Santo
Tomas with a Bachelor of Arts degree in Communication Arts with an emphasis on
Advertising/Marketing.
■ W. Scott Sibley.** Chief Hotel Operations Officer, age 52. He started his career at
Marriott Hotel group and, since then, has gained experience in opening new hotels
and working in different cities such as Florida, California, Hawaii, Dubai, Vietnam,
Singapore, Cebu and Canada. Mr Sibley served as general manager of Marriott Hotel
Manila and has been a General Manager in Dubai, UAE; Toronto, Canada; Seoul,
Korea; and Guam, the US for the past 14 years. He has 28 years of working
experience in the hospitality and hotel industry.
■ Venetia T Sarmiento. Chief Human Resources Officer, age 52. She has worked in
human resource management for more than 15 years in various industries such as
directory publishing, advertising, manufacturing, insurance and BPO. Ms Sarmiento held
senior management positions in the field of business development, operations and
human resource management in the business process outsourcing industry for the last
15 years and was part of the pilot team that launched the offshore call centre operations
of Teleperformance Philippines. Her training in Six Sigma, ISO 9001, Project
Management and COPC has qualified her to lead process development, process
improvement and quality management initiatives. Ms Sarmiento is a graduate of the
University of Santo Tomas where she earned her degree in psychology before obtaining
an MBA degree in Human Resource Management at the Lyceum of the Philippines.
■ Eric Yaw Chee Cheow.*** Chief Business Development Officer, age 44. Previously
Senior Director for Business Development, Mr Cheow has approximately 20 years of
working experience in the casino industry, specifically in casino surveillance and casino
marketing operations. Prior to joining the company, he worked for a casino gaming
company in Subic Bay with a focus on the international gaming promoter business. He
has also headed the CCTV Department of Hyatt Hotel and Casino, Manila.
■ Jeffrey Rodrigo Lim Evora. Senior Director for Gaming Events, age 44. He has
nearly 20 years of experience working in the US, local, regional, Native America,
riverboat, and mega-resort casino operations. Prior to joining the company, Mr Evora
30 September 2014
Philippine Gaming Sector 37
was an auditor with Hyatt Regency—Maui, a casino analyst at Flamingo Hilton Las
Vegas, and a marketing manager of Lady Luck Gaming Corporation. He was also
director of database marketing of Boyd Gaming Corporation and Horseshoe Gaming
Holding Corporation as well as central division director of marketing, director of casino
marketing and director of Asian Communications at Harrah’s Entertainment. Mr Evora
also worked as executive director of Marketing at Seneca Niagara Casino and Hotel.
He graduated from the University of Phoenix with a business degree.
■ Mary Ann E. Moreno. Senior Director for Gaming Treasury, age 45. She worked
with the Gaming Treasury team of Star Cruises and has almost 20 years of working
experience in the casino/gaming industry. Ms Moreno earned her Bachelor of Science
degree with a major in Computer Data Processing Management from the Polytechnic
University of the Philippines.
■ Carlito B. Banaag. Director for Audit & Risk Management since July 2010, age
49. He has worked as operational risk management officer for China Banking
Corporation as well as internal audit head for Philippine Deposit Insurance Corporation
and risk management/compliance officer for several private banks. Mr Banaag is a
Certified Public Accountant and earned his bachelor’s degree in Accountancy from
Polytechnic University of the Philippines.
* Engaged as consultants pursuant to agreement between Star Cruises Hong Kong
Management Services (Philippines), Inc. and the company
** Engaged under Grand Venture Management Services, Inc.
*** Engaged under Bright Leisure Management, Inc.
Deed of accession and cooperation agreement
The company was initially granted the rights by PAGCOR to operate casinos and engage
in gaming activities in two sites—Site A (in Entertainment City, where Bayshore City is set
to rise) and Site B (in Newport City, where RWM is located).
On 18 March 2013, however, the company entered into a deed of accession with Resorts
World Bayshore City Inc. (RWBCI), which was incorporated by AGI and GHK to
independently develop Site A. The deed of accession was consented to by PAGCOR
under the following conditions:
■ RWBCI received the same rights, title, interest and obligations of the company under
the Provisional Licence.
■ RWBCI would be recognised and included as co-licensee and co-holder of the
Provisional Licence.
■ AGI and GHK would be jointly and severally liable in cases of material breach or
default of the Provisional Licence by RWBCI or the company.
■ AGI and GHK would collectively hold and maintain equity interest of no less than 51%
in RWBCI and the company.
* Note however that AGI and GHK are not parties to the deed of accession and there is no
assurance that PAGCOR will have any legal recourse against them.
On 10 June 2013, the company thus entered into a Cooperation Agreement with RWBCI
to formally designate their rights and obligations with respect to Sites A and B. The
Cooperation Agreement was mutually consented to under the following terms:
■ The company would have all rights and obligations under the Provisional Licence to
Site B while RWBCI would have all rights and obligations under the Provisional
Licence to Site A.
30 September 2014
Philippine Gaming Sector 38
■ Each party is to indemnify the other for any and all loss suffered in connection with a
breach of the Provisional Licence.
■ A breach by RWBCI or the company of their obligations could result in the suspension
or revocation of their Provisional Licence.
Option to acquire rights to Resorts World Bayshore
Furthermore, an addendum to the Cooperation Agreement was included on 16 October
2013, stating that the company had the option to reacquire all rights and obligations to Site
A from RWBCI, subject to the following requirements:
■ Option to acquire rights must be exercised no earlier than 1 January 2016 and no later
than one month prior to the opening date of Resorts World Bayshore or at a date
mutually agreed upon by the parties.
■ The company has the right of first offer and right of first refusal should the rights and
obligations to Site A be offered to a third party.
■ Terms and conditions for transfer of the rights and obligations to Site A will be
negotiated between parties on an arm's length basis, subject to fairness tests relevant
under Philippine law and reports of two international independent financial advisers.
On 24 September 2014, Travellers announced the purchase of a 95% stake in RWBCI for
a total consideration of P16.15 bn. Travellers has paid the minimum (25%) of P4.0375 bn
and will pay the balance over three years as and when needed. The capital expenditure
for the project, which will be funded by both debt and equity, has yet to be defined.
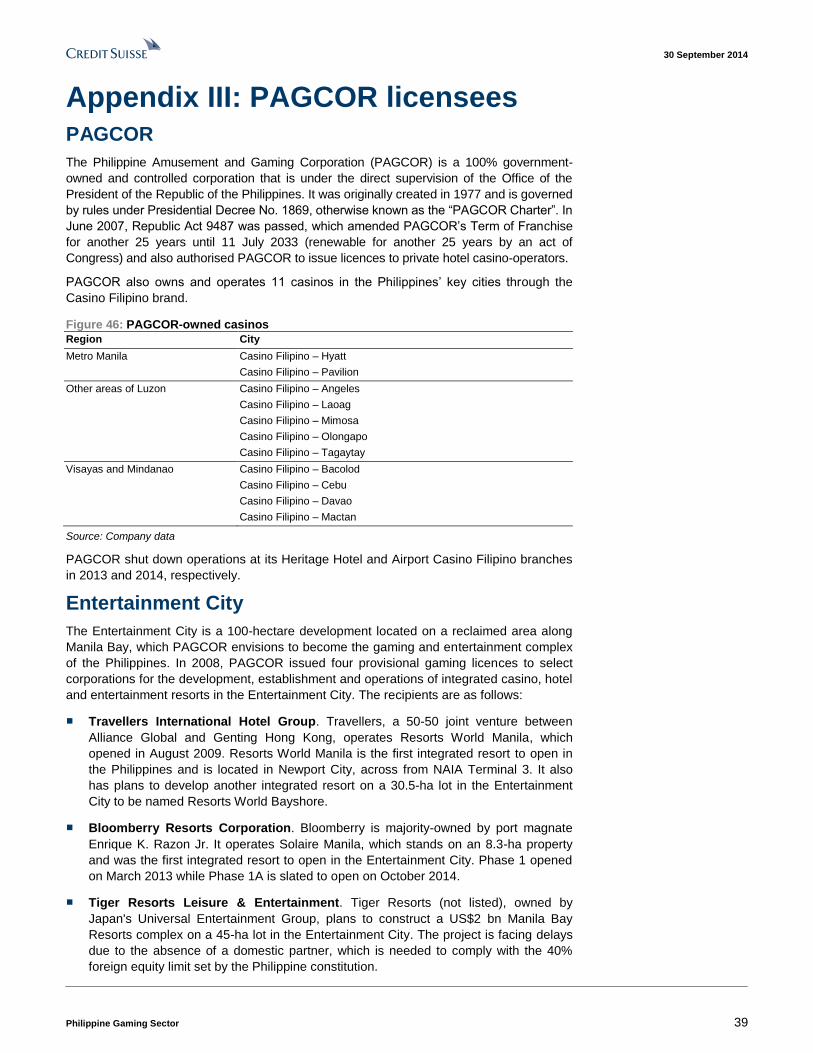
30 September 2014
Philippine Gaming Sector 39
Appendix III: PAGCOR licensees PAGCOR
The Philippine Amusement and Gaming Corporation (PAGCOR) is a 100% government-
owned and controlled corporation that is under the direct supervision of the Office of the
President of the Republic of the Philippines. It was originally created in 1977 and is governed
by rules under Presidential Decree No. 1869, otherwise known as the “PAGCOR Charter”. In
June 2007, Republic Act 9487 was passed, which amended PAGCOR’s Term of Franchise
for another 25 years until 11 July 2033 (renewable for another 25 years by an act of
Congress) and also authorised PAGCOR to issue licences to private hotel casino-operators.
PAGCOR also owns and operates 11 casinos in the Philippines’ key cities through the
Casino Filipino brand.
Figure 46: PAGCOR-owned casinos
Region City
Metro Manila Casino Filipino – Hyatt
Casino Filipino – Pavilion
Other areas of Luzon Casino Filipino – Angeles
Casino Filipino – Laoag
Casino Filipino – Mimosa
Casino Filipino – Olongapo
Casino Filipino – Tagaytay
Visayas and Mindanao Casino Filipino – Bacolod
Casino Filipino – Cebu
Casino Filipino – Davao
Casino Filipino – Mactan
Source: Company data
PAGCOR shut down operations at its Heritage Hotel and Airport Casino Filipino branches
in 2013 and 2014, respectively.
Entertainment City
The Entertainment City is a 100-hectare development located on a reclaimed area along
Manila Bay, which PAGCOR envisions to become the gaming and entertainment complex
of the Philippines. In 2008, PAGCOR issued four provisional gaming licences to select
corporations for the development, establishment and operations of integrated casino, hotel
and entertainment resorts in the Entertainment City. The recipients are as follows:
■ Travellers International Hotel Group. Travellers, a 50-50 joint venture between
Alliance Global and Genting Hong Kong, operates Resorts World Manila, which
opened in August 2009. Resorts World Manila is the first integrated resort to open in
the Philippines and is located in Newport City, across from NAIA Terminal 3. It also
has plans to develop another integrated resort on a 30.5-ha lot in the Entertainment
City to be named Resorts World Bayshore.
■ Bloomberry Resorts Corporation. Bloomberry is majority-owned by port magnate
Enrique K. Razon Jr. It operates Solaire Manila, which stands on an 8.3-ha property
and was the first integrated resort to open in the Entertainment City. Phase 1 opened
on March 2013 while Phase 1A is slated to open on October 2014.
■ Tiger Resorts Leisure & Entertainment. Tiger Resorts (not listed), owned by
Japan's Universal Entertainment Group, plans to construct a US$2 bn Manila Bay
Resorts complex on a 45-ha lot in the Entertainment City. The project is facing delays
due to the absence of a domestic partner, which is needed to comply with the 40%
foreign equity limit set by the Philippine constitution.
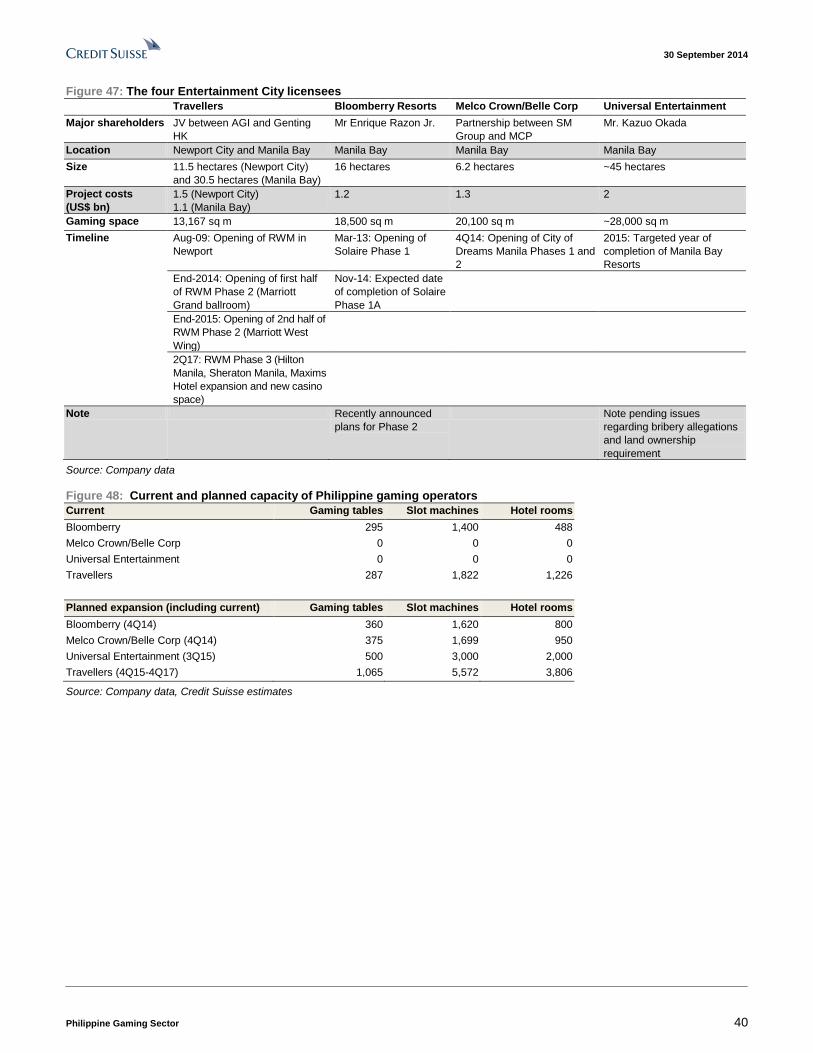
30 September 2014
Philippine Gaming Sector 40
Figure 47: The four Entertainment City licensees
Travellers Bloomberry Resorts Melco Crown/Belle Corp Universal Entertainment
Major shareholders JV between AGI and Genting
HK
Mr Enrique Razon Jr. Partnership between SM
Group and MCP
Mr. Kazuo Okada
Location Newport City and Manila Bay Manila Bay Manila Bay Manila Bay
Size 11.5 hectares (Newport City)
and 30.5 hectares (Manila Bay)
16 hectares 6.2 hectares ~45 hectares
Project costs
(US$ bn)
1.5 (Newport City)
1.1 (Manila Bay)
1.2 1.3 2
Gaming space 13,167 sq m 18,500 sq m 20,100 sq m ~28,000 sq m
Timeline Aug-09: Opening of RWM in
Newport
Mar-13: Opening of
Solaire Phase 1
4Q14: Opening of City of
Dreams Manila Phases 1 and
2
2015: Targeted year of
completion of Manila Bay
Resorts
End-2014: Opening of first half
of RWM Phase 2 (Marriott
Grand ballroom)
Nov-14: Expected date
of completion of Solaire
Phase 1A
End-2015: Opening of 2nd half of
RWM Phase 2 (Marriott West
Wing)
2Q17: RWM Phase 3 (Hilton
Manila, Sheraton Manila, Maxims
Hotel expansion and new casino
space)
Note Recently announced
plans for Phase 2
Note pending issues
regarding bribery allegations
and land ownership
requirement
Source: Company data
Figure 48: Current and planned capacity of Philippine gaming operators
Current Gaming tables Slot machines Hotel rooms
Bloomberry 295 1,400 488
Melco Crown/Belle Corp 0 0 0
Universal Entertainment 0 0 0
Travellers 287 1,822 1,226
Planned expansion (including current) Gaming tables Slot machines Hotel rooms
Bloomberry (4Q14) 360 1,620 800
Melco Crown/Belle Corp (4Q14) 375 1,699 950
Universal Entertainment (3Q15) 500 3,000 2,000
Travellers (4Q15-4Q17) 1,065 5,572 3,806
Source: Company data, Credit Suisse estimates
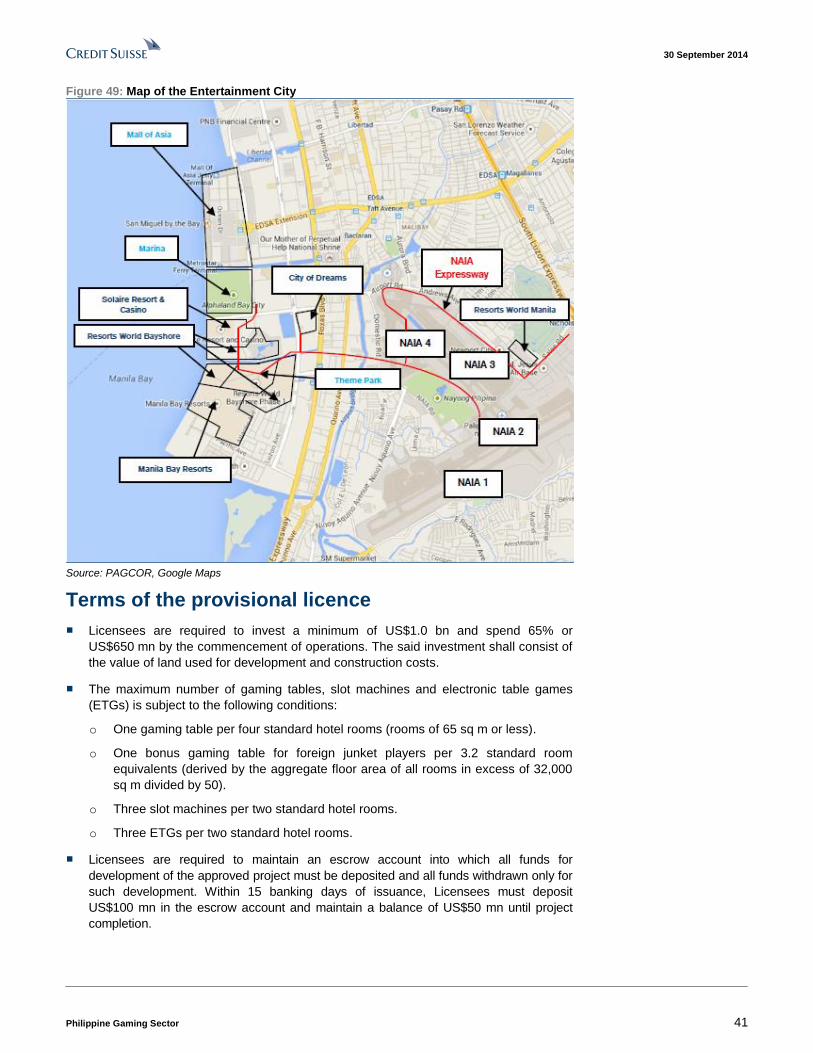
30 September 2014
Philippine Gaming Sector 41
Figure 49: Map of the Entertainment City
Source: PAGCOR, Google Maps
Terms of the provisional licence
■ Licensees are required to invest a minimum of US$1.0 bn and spend 65% or
US$650 mn by the commencement of operations. The said investment shall consist of
the value of land used for development and construction costs.
■ The maximum number of gaming tables, slot machines and electronic table games
(ETGs) is subject to the following conditions:
o One gaming table per four standard hotel rooms (rooms of 65 sq m or less).
o One bonus gaming table for foreign junket players per 3.2 standard room
equivalents (derived by the aggregate floor area of all rooms in excess of 32,000
sq m divided by 50).
o Three slot machines per two standard hotel rooms.
o Three ETGs per two standard hotel rooms.
■ Licensees are required to maintain an escrow account into which all funds for
development of the approved project must be deposited and all funds withdrawn only for
such development. Within 15 banking days of issuance, Licensees must deposit
US$100 mn in the escrow account and maintain a balance of US$50 mn until project
completion.

30 September 2014
Philippine Gaming Sector 42
■ Licensees are required to submit a bank guarantee, letter of credit or surety bond in the
amount of US$100 mn to guarantee project completion. Performance assurance will be
subject to forfeiture in case of delay in construction that exceeds 50.0% of schedule.
■ Licensees must also secure a surety bond of US$100 mn seven days prior to the
commencement of the project to ensure punctual remittance and payment of all
licence fees.
■ The licences require that 95% of employees be hired in the Philippines and 40% of its
gaming personnel be hired from PAGCOR.
■ Licensees are required to maintain a 70:30 debt to equity ratio.
■ Projects must have a minimum gross floor area of 250,000 sq m with the gaming
component not to exceed 7.5% of it and a minimum gross floor area of 20,000 sq m
for retail outlets.
■ Each project must have a minimum availability of 800 hotel rooms with each room
having an average gross floor area of 40 sq m.
■ The maximum number of bonus gaming tables for foreign junket players is also limited
to one bonus gaming for every 3.2 standard room equivalents.
■ Licensees are also required to invest at least $20.0 mn in a thematic attraction.
Revised gaming licence fees effective April 2014
The PAGCOR Charter (PD No. 1869) exempts PAGCOR from tax of any kind or form or
charge, apart from a 5.0% franchise tax of gross earnings from its operations. The
exemption also extends to corporations that PAGCOR has any kind of contractual
relationship with in connection to the operation of casinos authorised to be conducted
under the PAGCOR Charter.
The amendment to the National Internal Revenue Code in 2011 excludes PAGCOR from
the list of government-owned and controlled corporations. Consequently, on 23 April 2013,
the Bureau of Internal Revenue (BIR) issued a memorandum circular stating that
PAGCOR and its licenced casino operators are subject to the 30% income tax instead of
the 5% franchise tax on gross gaming revenues. PAGCOR has thus entered an
agreement with the licensees to adjust the fees by 10% of gross gaming revenues, subject
to a true-up mechanism obliging the licensees to remit to PAGCOR any savings from new
(lowered) licence fees over the actual income tax paid on the gaming revenues.
Licensees are required to remit the following licence fees (inclusive of franchise tax) to
PAGCOR on a monthly basis:
a) 5% (from 15% previously) of VIP gaming revenues
b) 15% (from 25% previously) of mass gaming revenues
The lowered licence fees are effective from 1 April 2014. Licensees are also required to
remit 2% of gross gaming revenues from non-junket tables on a monthly basis to a
foundation devoted to the restoration of Philippine cultural heritage.
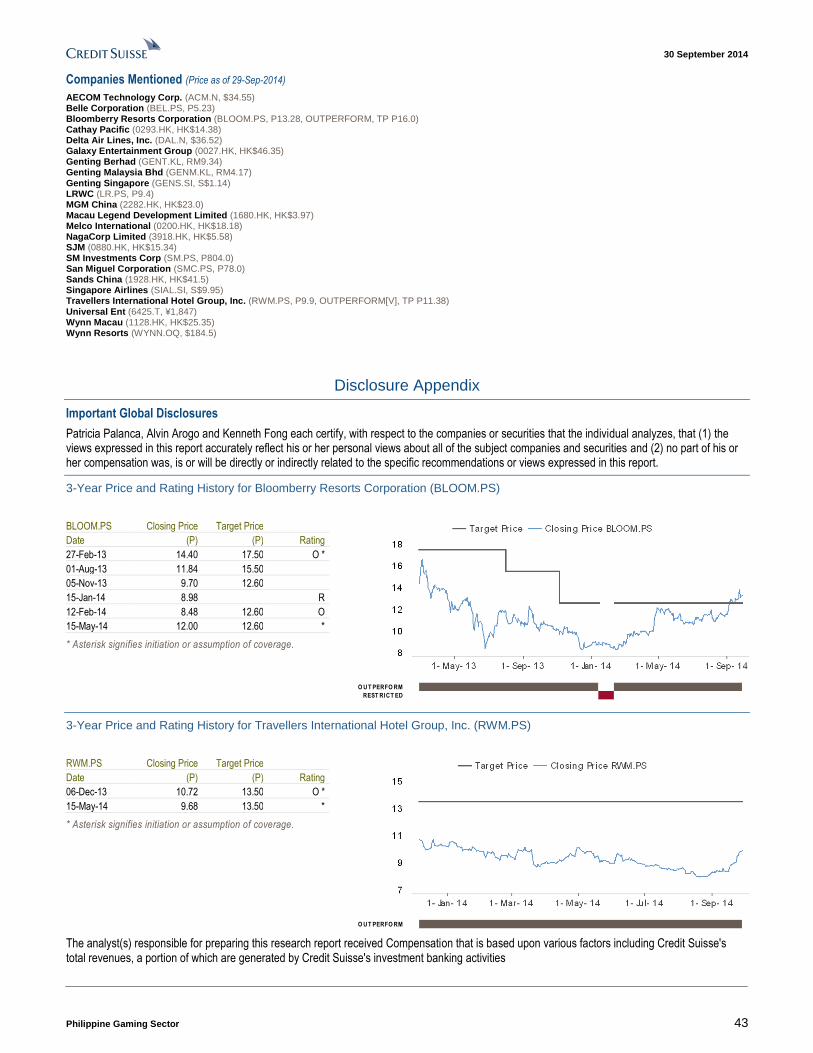
30 September 2014
Philippine Gaming Sector 43
Companies Mentioned (Price as of 29-Sep-2014)
AECOM Technology Corp. (ACM.N, $34.55) Belle Corporation (BEL.PS, P5.23) Bloomberry Resorts Corporation (BLOOM.PS, P13.28, OUTPERFORM, TP P16.0) Cathay Pacific (0293.HK, HK$14.38) Delta Air Lines, Inc. (DAL.N, $36.52) Galaxy Entertainment Group (0027.HK, HK$46.35) Genting Berhad (GENT.KL, RM9.34) Genting Malaysia Bhd (GENM.KL, RM4.17) Genting Singapore (GENS.SI, S$1.14) LRWC (LR.PS, P9.4) MGM China (2282.HK, HK$23.0) Macau Legend Development Limited (1680.HK, HK$3.97) Melco International (0200.HK, HK$18.18) NagaCorp Limited (3918.HK, HK$5.58) SJM (0880.HK, HK$15.34) SM Investments Corp (SM.PS, P804.0) San Miguel Corporation (SMC.PS, P78.0) Sands China (1928.HK, HK$41.5) Singapore Airlines (SIAL.SI, S$9.95) Travellers International Hotel Group, Inc. (RWM.PS, P9.9, OUTPERFORM[V], TP P11.38) Universal Ent (6425.T, ¥1,847) Wynn Macau (1128.HK, HK$25.35) Wynn Resorts (WYNN.OQ, $184.5)
Disclosure Appendix
Important Global Disclosures
Patricia Palanca, Alvin Arogo and Kenneth Fong each certify, with respect to the companies or securities that the individual analyzes, that (1) the views expressed in this report accurately reflect his or her personal views about all of the subject companies and securities and (2) no part of his or her compensation was, is or will be directly or indirectly related to the specific recommendations or views expressed in this report.
3-Year Price and Rating History for Bloomberry Resorts Corporation (BLOOM.PS)
BLOOM.PS Closing Price Target Price
Date (P) (P) Rating
27-Feb-13 14.40 17.50 O *
01-Aug-13 11.84 15.50
05-Nov-13 9.70 12.60
15-Jan-14 8.98 R
12-Feb-14 8.48 12.60 O
15-May-14 12.00 12.60 *
* Asterisk signifies initiation or assumption of coverage.
O U T PERFO RM
REST RICT ED
3-Year Price and Rating History for Travellers International Hotel Group, Inc. (RWM.PS)
RWM.PS Closing Price Target Price
Date (P) (P) Rating
06-Dec-13 10.72 13.50 O *
15-May-14 9.68 13.50 *
* Asterisk signifies initiation or assumption of coverage.
O U T PERFO RM
The analyst(s) responsible for preparing this research report received Compensation that is based upon various factors including Credit Suisse's total revenues, a portion of which are generated by Credit Suisse's investment banking activities
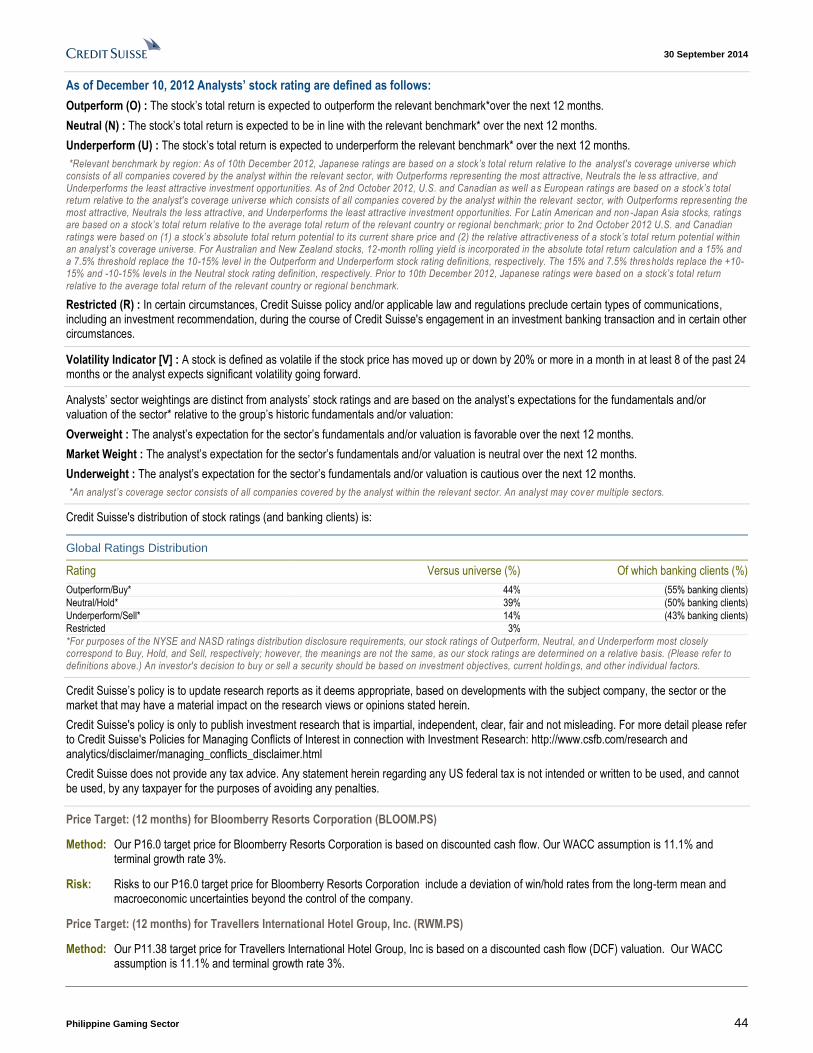
30 September 2014
Philippine Gaming Sector 44
As of December 10, 2012 Analysts’ stock rating are defined as follows:
Outperform (O) : The stock’s total return is expected to outperform the relevant benchmark*over the next 12 months.
Neutral (N) : The stock’s total return is expected to be in line with the relevant benchmark* over the next 12 months.
Underperform (U) : The stock’s total return is expected to underperform the relevant benchmark* over the next 12 months.
*Relevant benchmark by region: As of 10th December 2012, Japanese ratings are based on a stock’s total return relative to the analyst's coverage universe which consists of all companies covered by the analyst within the relevant sector, with Outperforms representing the most attractive, Neutrals the le ss attractive, and Underperforms the least attractive investment opportunities. As of 2nd October 2012, U.S. and Canadian as well a s European ratings are based on a stock’s total return relative to the analyst's coverage universe which consists of all companies covered by the analyst within the relevant sector, with Outperforms representing the most attractive, Neutrals the less attractive, and Underperforms the least attractive investment opportunities. For Latin American and non -Japan Asia stocks, ratings are based on a stock’s total return relative to the average total return of the relevant country or regional benchmark; prior to 2nd October 2012 U.S. and Canadian ratings were based on (1) a stock’s absolute total return potential to its current share price and (2) the relative attractiveness of a stock’s total return potential within an analyst’s coverage universe. For Australian and New Zealand stocks, 12-month rolling yield is incorporated in the absolute total return calculation and a 15% and a 7.5% threshold replace the 10-15% level in the Outperform and Underperform stock rating definitions, respectively. The 15% and 7.5% thresholds replace the +10-15% and -10-15% levels in the Neutral stock rating definition, respectively. Prior to 10th December 2012, Japanese ratings were based on a stock’s total return relative to the average total return of the relevant country or regional benchmark.
Restricted (R) : In certain circumstances, Credit Suisse policy and/or applicable law and regulations preclude certain types of communications, including an investment recommendation, during the course of Credit Suisse's engagement in an investment banking transaction and in certain other circumstances.
Volatility Indicator [V] : A stock is defined as volatile if the stock price has moved up or down by 20% or more in a month in at least 8 of the past 24 months or the analyst expects significant volatility going forward.
Analysts’ sector weightings are distinct from analysts’ stock ratings and are based on the analyst’s expectations for the fundamentals and/or valuation of the sector* relative to the group’s historic fundamentals and/or valuation:
Overweight : The analyst’s expectation for the sector’s fundamentals and/or valuation is favorable over the next 12 months.
Market Weight : The analyst’s expectation for the sector’s fundamentals and/or valuation is neutral over the next 12 months.
Underweight : The analyst’s expectation for the sector’s fundamentals and/or valuation is cautious over the next 12 months.
*An analyst’s coverage sector consists of all companies covered by the analyst within the relevant sector. An analyst may cover multiple sectors.
Credit Suisse's distribution of stock ratings (and banking clients) is:
Global Ratings Distribution
Rating Versus universe (%) Of which banking clients (%)
Outperform/Buy* 44% (55% banking clients)
Neutral/Hold* 39% (50% banking clients)
Underperform/Sell* 14% (43% banking clients)
Restricted 3%
*For purposes of the NYSE and NASD ratings distribution disclosure requirements, our stock ratings of Outperform, Neutral, an d Underperform most closely correspond to Buy, Hold, and Sell, respectively; however, the meanings are not the same, as our stock ratings are determined on a relative basis. (Please refer to definitions above.) An investor's decision to buy or sell a security should be based on investment objectives, current holdin gs, and other individual factors.
Credit Suisse’s policy is to update research reports as it deems appropriate, based on developments with the subject company, the sector or the market that may have a material impact on the research views or opinions stated herein.
Credit Suisse's policy is only to publish investment research that is impartial, independent, clear, fair and not misleading. For more detail please refer to Credit Suisse's Policies for Managing Conflicts of Interest in connection with Investment Research: http://www.csfb.com/research and analytics/disclaimer/managing_conflicts_disclaimer.html
Credit Suisse does not provide any tax advice. Any statement herein regarding any US federal tax is not intended or written to be used, and cannot be used, by any taxpayer for the purposes of avoiding any penalties.
Price Target: (12 months) for Bloomberry Resorts Corporation (BLOOM.PS)
Method: Our P16.0 target price for Bloomberry Resorts Corporation is based on discounted cash flow. Our WACC assumption is 11.1% and terminal growth rate 3%.
Risk: Risks to our P16.0 target price for Bloomberry Resorts Corporation include a deviation of win/hold rates from the long-term mean and macroeconomic uncertainties beyond the control of the company.
Price Target: (12 months) for Travellers International Hotel Group, Inc. (RWM.PS)
Method: Our P11.38 target price for Travellers International Hotel Group, Inc is based on a discounted cash flow (DCF) valuation. Our WACC assumption is 11.1% and terminal growth rate 3%.
30 September 2014
Philippine Gaming Sector 45
Risk: Key risks include: (1) an intensifying competitive environment which could result in slowing growth and declining market share; (2) the possibility of regional political tensions and other negative events that could have an adverse impact on property visitation by both locals and foreigners; and (3) changes in regulations which could have a negative impact on casino operations.
Please refer to the firm's disclosure website at https://rave.credit-suisse.com/disclosures for the definitions of abbreviations typically used in the target price method and risk sections.
See the Companies Mentioned section for full company names
The subject company (RWM.PS, 2282.HK, 1928.HK, 1128.HK, 0027.HK, 3918.HK, GENS.SI, BEL.PS, WYNN.OQ) currently is, or was during the 12-month period preceding the date of distribution of this report, a client of Credit Suisse.
Credit Suisse provided investment banking services to the subject company (RWM.PS, 1928.HK, 0027.HK) within the past 12 months.
Credit Suisse has managed or co-managed a public offering of securities for the subject company (RWM.PS) within the past 12 months.
Credit Suisse has received investment banking related compensation from the subject company (RWM.PS, 1928.HK, 0027.HK) within the past 12 months
Credit Suisse expects to receive or intends to seek investment banking related compensation from the subject company (RWM.PS, 2282.HK, 1928.HK, 1128.HK, 0027.HK, 3918.HK, GENS.SI, ACM.N, BEL.PS, WYNN.OQ, SIAL.SI, 0293.HK) within the next 3 months.
As of the date of this report, Credit Suisse makes a market in the following subject companies (ACM.N, WYNN.OQ, DAL.N).
Credit Suisse may have interest in (GENM.KL, GENT.KL)
As of the end of the preceding month, Credit Suisse beneficially own 1% or more of a class of common equity securities of (1680.HK).
Credit Suisse has a material conflict of interest with the subject company (0293.HK) . Jack So, a Senior Advisor of Credit Suisse, is an Independent Non-Executive Director of Cathay Pacific Airways Limited.
For other important disclosures concerning companies featured in this report, including price charts, please visit the website at https://rave.credit-suisse.com/disclosures or call +1 (877) 291-2683.
Important Regional Disclosures
Singapore recipients should contact Credit Suisse AG, Singapore Branch for any matters arising from this research report.
The analyst(s) involved in the preparation of this report have not visited the material operations of the subject company (BLOOM.PS, RWM.PS, 2282.HK, 1928.HK, 1128.HK, 0027.HK, 0880.HK, 0200.HK, 1680.HK, 3918.HK, GENM.KL, GENS.SI, GENT.KL, ACM.N, BEL.PS, WYNN.OQ, DAL.N, SIAL.SI, 0293.HK) within the past 12 months
Restrictions on certain Canadian securities are indicated by the following abbreviations: NVS--Non-Voting shares; RVS--Restricted Voting Shares; SVS--Subordinate Voting Shares.
Individuals receiving this report from a Canadian investment dealer that is not affiliated with Credit Suisse should be advised that this report may not contain regulatory disclosures the non-affiliated Canadian investment dealer would be required to make if this were its own report.
For Credit Suisse Securities (Canada), Inc.'s policies and procedures regarding the dissemination of equity research, please visit http://www.csfb.com/legal_terms/canada_research_policy.shtml.
Credit Suisse has acted as lead manager or syndicate member in a public offering of securities for the subject company (RWM.PS, 1680.HK, DAL.N, SIAL.SI) within the past 3 years.
As of the date of this report, Credit Suisse acts as a market maker or liquidity provider in the equities securities that are the subject of this report.
Principal is not guaranteed in the case of equities because equity prices are variable.
Commission is the commission rate or the amount agreed with a customer when setting up an account or at any time after that.
To the extent this is a report authored in whole or in part by a non-U.S. analyst and is made available in the U.S., the following are important disclosures regarding any non-U.S. analyst contributors: The non-U.S. research analysts listed below (if any) are not registered/qualified as research analysts with FINRA. The non-U.S. research analysts listed below may not be associated persons of CSSU and therefore may not be subject to the NASD Rule 2711 and NYSE Rule 472 restrictions on communications with a subject company, public appearances and trading securities held by a research analyst account.
Credit Suisse (Hong Kong) Limited .................................................................................................................................................... Kenneth Fong
Credit Suisse Securities (Philippines) Inc. ................................................................................................................ Patricia Palanca ; Alvin Arogo
For Credit Suisse disclosure information on other companies mentioned in this report, please visit the website at https://rave.credit-suisse.com/disclosures or call +1 (877) 291-2683.
30 September 2014
Philippine Gaming Sector 46
References in this report to Credit Suisse include all of the subsidiaries and affiliates of Credit Suisse operating under its investment banking division. For more information on our structure, please use the following link: https://www.credit-suisse.com/who_we_are/en/This report may contain material that is not directed to, or intended for distribution to or use by, any person or entity who is a citizen or resident of or located in any locality, state, country or other jurisdiction where such distribution, publication, availability or use would be contrary to law or regulation or which would subject Credit Suisse AG or its affiliates ("CS") to any registration or licensing requirement within such jurisdiction. All material presented in this report, unless specifically indicated otherwise, is under copyright to CS. None of the material, nor its content, nor any copy of it, may be altered in any way, transmitted to, copied or distributed to any other party, without the prior express written permission of CS. All trademarks, service marks and logos used in this report are trademarks or service marks or registered trademarks or service marks of CS or its affiliates. The information, tools and material presented in this report are provided to you for information purposes only and are not to be used or considered as an offer or the solicitation of an offer to sell or to buy or subscribe for securities or other financial instruments. CS may not have taken any steps to ensure that the securities referred to in this report are suitable for any particular investor. CS will not treat recipients of this report as its customers by virtue of their receiving this report. The investments and services contained or referred to in this report may not be suitable for you and it is recommended that you consult an independent investment advisor if you are in doubt about such investments or investment services. Nothing in this report constitutes investment, legal, accounting or tax advice, or a representation that any investment or strategy is suitable or appropriate to your individual circumstances, or otherwise constitutes a personal recommendation to you. CS does not advise on the tax consequences of investments and you are advised to contact an independent tax adviser. Please note in particular that the bases and levels of taxation may change. Information and opinions presented in this report have been obtained or derived from sources believed by CS to be reliable, but CS makes no representation as to their accuracy or completeness. CS accepts no liability for loss arising from the use of the material presented in this report, except that this exclusion of liability does not apply to the extent that such liability arises under specific statutes or regulations applicable to CS. This report is not to be relied upon in substitution for the exercise of independent judgment. CS may have issued, and may in the future issue, other communications that are inconsistent with, and reach different conclusions from, the information presented in this report. Those communications reflect the different assumptions, views and analytical methods of the analysts who prepared them and CS is under no obligation to ensure that such other communications are brought to the attention of any recipient of this report. Some investments referred to in this report will be offered solely by a single entity and in the case of some investments solely by CS, or an associate of CS or CS may be the only market maker in such investments. Past performance should not be taken as an indication or guarantee of future performance, and no representation or warranty, express or implied, is made regarding future performance. Information, opinions and estimates contained in this report reflect a judgment at its original date of publication by CS and are subject to change without notice. The price, value of and income from any of the securities or financial instruments mentioned in this report can fall as well as rise. The value of securities and financial instruments is subject to exchange rate fluctuation that may have a positive or adverse effect on the price or income of such securities or financial instruments. Investors in securities such as ADR's, the values of which are influenced by currency volatility, effectively assume this risk. Structured securities are complex instruments, typically involve a high degree of risk and are intended for sale only to sophisticated investors who are capable of understanding and assuming the risks involved. The market value of any structured security may be affected by changes in economic, financial and political factors (including, but not limited to, spot and forward interest and exchange rates), time to maturity, market conditions and volatility, and the credit quality of any issuer or reference issuer. Any investor interested in purchasing a structured product should conduct their own investigation and analysis of the product and consult with their own professional advisers as to the risks involved in making such a purchase. Some investments discussed in this report may have a high level of volatility. High volatility investments may experience sudden and large falls in their value causing losses when that investment is realised. Those losses may equal your original investment. Indeed, in the case of some investments the potential losses may exceed the amount of initial investment and, in such circumstances, you may be required to pay more money to support those losses. Income yields from investments may fluctuate and, in consequence, initial capital paid to make the investment may be used as part of that income yield. Some investments may not be readily realisable and it may be difficult to sell or realise those investments, similarly it may prove difficult for you to obtain reliable information about the value, or risks, to which such an investment is exposed. This report may provide the addresses of, or contain hyperlinks to, websites. Except to the extent to which the report refers to website material of CS, CS has not reviewed any such site and takes no responsibility for the content contained therein. Such address or hyperlink (including addresses or hyperlinks to CS's own website material) is provided solely for your convenience and information and the content of any such website does not in any way form part of this document. Accessing such website or following such link through this report or CS's website shall be at your own risk. This report is issued and distributed in Europe (except Switzerland) by Credit Suisse Securities (Europe) Limited, One Cabot Square, London E14 4QJ, England, which is authorised by the Prudential Regulation Authority and regulated by the Financial Conduct Authority and the Prudential Regulation Authority. This report is being distributed in Germany by Credit Suisse Securities (Europe) Limited Niederlassung Frankfurt am Main regulated by the Bundesanstalt fuer Finanzdienstleistungsaufsicht ("BaFin"). This report is being distributed in the United States and Canada by Credit Suisse Securities (USA) LLC; in Switzerland by Credit Suisse AG; in Brazil by Banco de Investimentos Credit Suisse (Brasil) S.A or its affiliates; in Mexico by Banco Credit Suisse (México), S.A. (transactions related to the securities mentioned in this report will only be effected in compliance with applicable regulation); in Japan by Credit Suisse Securities (Japan) Limited, Financial Instruments Firm, Director-General of Kanto Local Finance Bureau (Kinsho) No. 66, a member of Japan Securities Dealers Association, The Financial Futures Association of Japan, Japan Investment Advisers Association, Type II Financial Instruments Firms Association; elsewhere in Asia/ Pacific by whichever of the following is the appropriately authorised entity in the relevant jurisdiction: Credit Suisse (Hong Kong) Limited, Credit Suisse Equities (Australia) Limited, Credit Suisse Securities (Thailand) Limited, regulated by the Office of the Securities and Exchange Commission, Thailand, having registered address at 990 Abdulrahim Place, 27th Floor, Unit 2701, Rama IV Road, Silom, Bangrak, Bangkok 10500, Thailand, Tel. +66 2614 6000, Credit Suisse Securities (Malaysia) Sdn Bhd, Credit Suisse AG, Singapore Branch, Credit Suisse Securities (India) Private Limited (CIN no. U67120MH1996PTC104392) regulated by the Securities and Exchange Board of India (registration Nos. INB230970637; INF230970637; INB010970631; INF010970631), having registered address at 9th Floor, Ceejay House, Dr.A.B. Road, Worli, Mumbai - 18, India, T- +91-22 6777 3777, Credit Suisse Securities (Europe) Limited, Seoul Branch, Credit Suisse AG, Taipei Securities Branch, PT Credit Suisse Securities Indonesia, Credit Suisse Securities (Philippines ) Inc., and elsewhere in the world by the relevant authorised affiliate of the above. Research on Taiwanese securities produced by Credit Suisse AG, Taipei Securities Branch has been prepared by a registered Senior Business Person. Research provided to residents of Malaysia is authorised by the Head of Research for Credit Suisse Securities (Malaysia) Sdn Bhd, to whom they should direct any queries on +603 2723 2020. This report has been prepared and issued for distribution in Singapore to institutional investors, accredited investors and expert investors (each as defined under the Financial Advisers Regulations) only, and is also distributed by Credit Suisse AG, Singapore branch to overseas investors (as defined under the Financial Advisers Regulations). By virtue of your status as an institutional investor, accredited investor, expert investor or overseas investor, Credit Suisse AG, Singapore branch is exempted from complying with certain compliance requirements under the Financial Advisers Act, Chapter 110 of Singapore (the "FAA"), the Financial Advisers Regulations and the relevant Notices and Guidelines issued thereunder, in respect of any financial advisory service which Credit Suisse AG, Singapore branch may provide to you. This research may not conform to Canadian disclosure requirements. In jurisdictions where CS is not already registered or licensed to trade in securities, transactions will only be effected in accordance with applicable securities legislation, which will vary from jurisdiction to jurisdiction and may require that the trade be made in accordance with applicable exemptions from registration or licensing requirements. Non-U.S. customers wishing to effect a transaction should contact a CS entity in their local jurisdiction unless governing law permits otherwise. U.S. customers wishing to effect a transaction should do so only by contacting a representative at Credit Suisse Securities (USA) LLC in the U.S. Please note that this research was originally prepared and issued by CS for distribution to their market professional and institutional investor customers. Recipients who are not market professional or institutional investor customers of CS should seek the advice of their independent financial advisor prior to taking any investment decision based on this report or for any necessary explanation of its contents. This research may relate to investments or services of a person outside of the UK or to other matters which are not authorised by the Prudential Regulation Authority and regulated by the Financial Conduct Authority and the Prudential Regulation Authority or in respect of which the protections of the Prudential Regulation Authority and Financial Conduct Authority for private customers and/or the UK compensation scheme may not be available, and further details as to where this may be the case are available upon request in respect of this report. CS may provide various services to US municipal entities or obligated persons ("municipalities"), including suggesting individual transactions or trades and entering into such transactions. Any services CS provides to municipalities are not viewed as "advice" within the meaning of Section 975 of the Dodd-Frank Wall Street Reform and Consumer Protection Act. CS is providing any such services and related information solely on an arm's length basis and not as an advisor or fiduciary to the municipality. In connection with the provision of the any such services, there is no agreement, direct or indirect, between any municipality (including the officials, management, employees or agents thereof) and CS for CS to provide advice to the municipality. Municipalities should consult with their financial, accounting and legal advisors regarding any such services provided by CS. In addition, CS is not acting for direct or indirect compensation to solicit the municipality on behalf of an unaffiliated broker, dealer, municipal securities dealer, municipal advisor, or investment adviser for the purpose of obtaining or retaining an engagement by the municipality for or in connection with Municipal Financial Products, the issuance of municipal securities, or of an investment adviser to provide investment advisory services to or on behalf of the municipality. If this report is being distributed by a financial institution other than Credit Suisse AG, or its affiliates, that financial institution is solely responsible for distribution. Clients of that institution should contact that institution to effect a transaction in the securities mentioned in this report or require further information. This report does not constitute investment advice by Credit Suisse to the clients of the distributing financial institution, and neither Credit Suisse AG, its affiliates, and their respective officers, directors and employees accept any liability whatsoever for any direct or consequential loss arising from their use of this report or its content. Principal is not guaranteed. Commission is the commission rate or the amount agreed with a customer when setting up an account or at any time after that.
Copyright © 2014 CREDIT SUISSE AG and/or its affiliates. All rights reserved.
Investment principal on bonds can be eroded depending on sale price or market price. In addition, there are bonds on which investment principal can be eroded due to changes in redemption amounts. Care is required when investing in such instruments. When you purchase non-listed Japanese fixed income securities (Japanese government bonds, Japanese municipal bonds, Japanese government guaranteed bonds, Japanese corporate bonds) from CS as a seller, you will be requested to pay the purchase price only.
CS0751.doc