Embed Size (px)
Citation preview
Philippines: A Ship Recycling Nation?
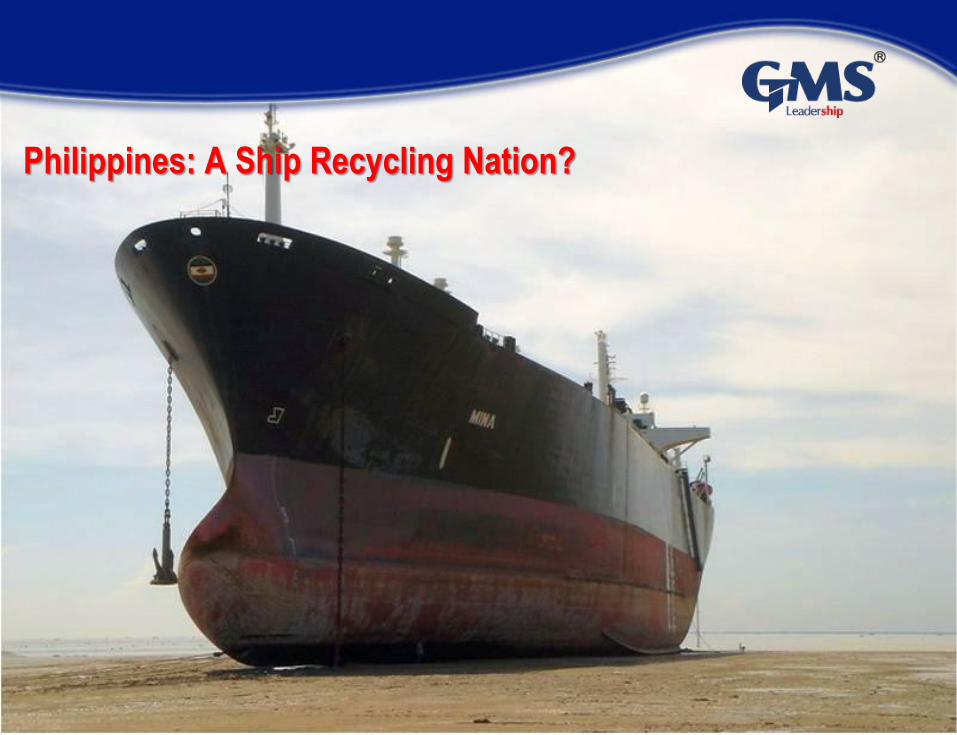
Cash Buyers – Who are they?
Cash Buyers are not brokers.
Cash Buyers are PRINCIPALS/TRADERS. They buy
vessels on cash basis from ship owners and resell to
ship recycling yards on Letters of Credit.
Cash Buyers take delivery of vessels on both “delivered”
and “as is where is” terms.
IMO’s Hong Kong Convention on Ship Recycling will
consider Cash Buyers as OWNERS of vessels.
2
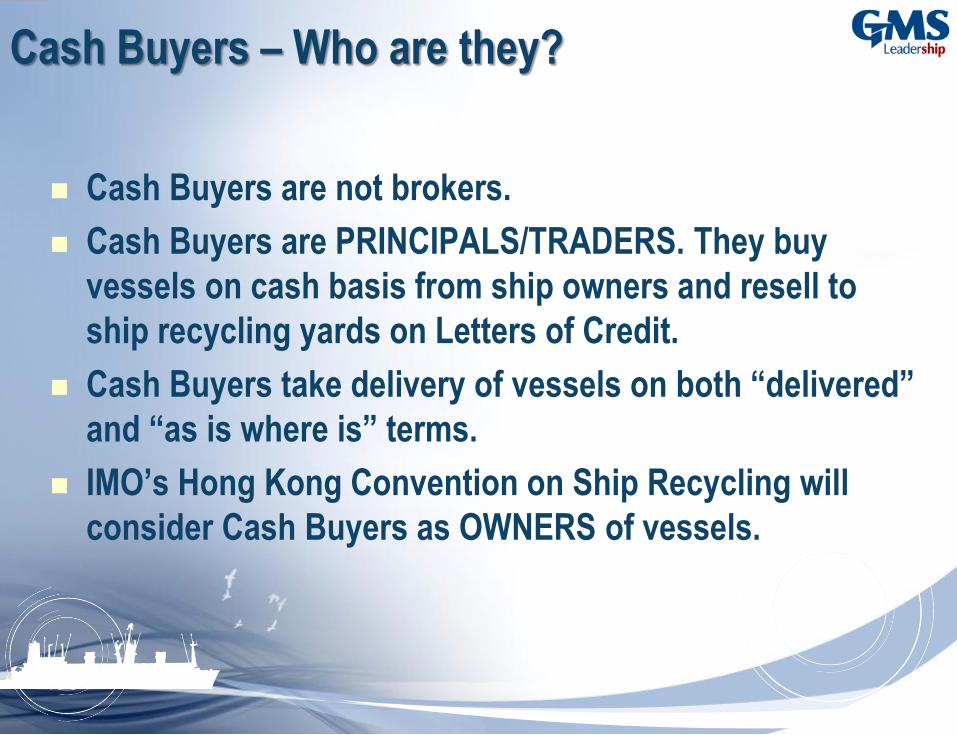
Agenda – Ship Recycling Potential in Philippines
1. Brief overview of the global Ship Recycling industry.
a. Where it is done
b. Supply, Capacity and Prices
2. How ship recycling started in countries where it is well established?
a. Established as a ‘substitute industry’ in the Far East to replace downfall
in ship building industry.
b. Started in the Indian subcontinent by accident (literally) and has taken
over previously well established ship recycling countries.
3. What are the basic ingredients / building blocks for establishing ship
recycling industry?
a) Supply and Demand and its interplay in determining choice of
country where ship recycling industry located.
b) Contribution to Socio economic development.
4. What model should Philippines follow?
a. Indian sub-continent vs. China
b. Beaching vs. Non beaching
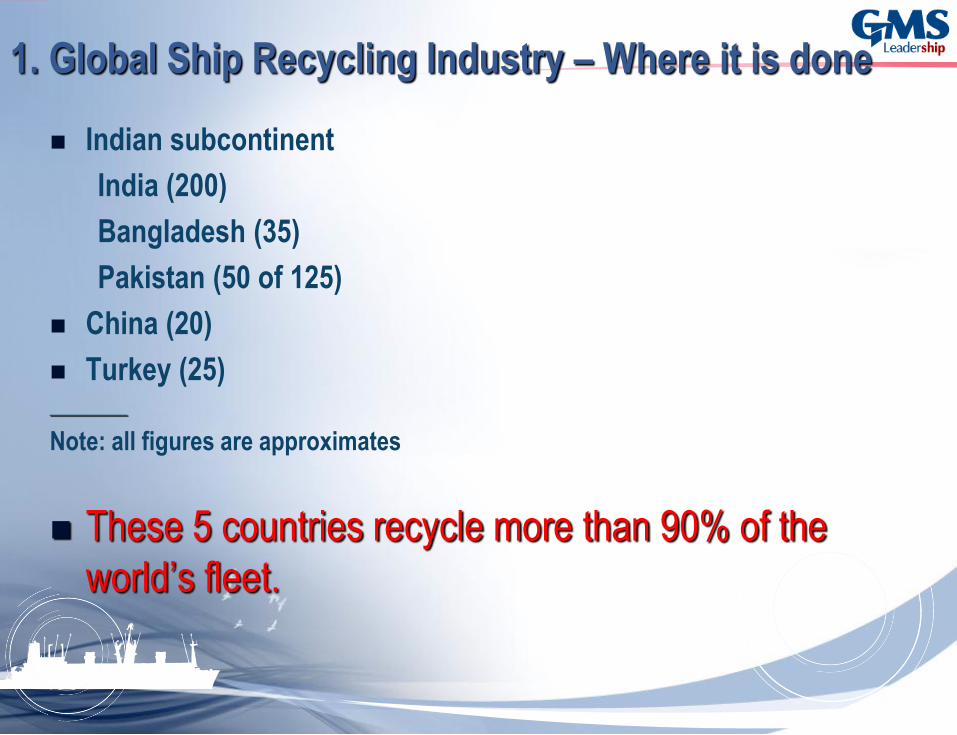
1. Global Ship Recycling Industry – Where it is done
Indian subcontinent
India (200)
Bangladesh (35)
Pakistan (50 of 125)
China (20)
Turkey (25) ________
Note: all figures are approximates
These 5 countries recycle more than 90% of the
world’s fleet.

1. The Global Ship Recycling Industry: INDIA
Coastal Location Arabian Sea, Gulf of Khambat, West Coast, India
Latitude 21 29.5’ N
Longitude 72 21.3' E
Number of Plots 200
Continues to lead the Ship Recycling industry in both
numbers and green capacity.
Greater focus on green ship recycling. About 70 yards
(37%) are fully ISO Certified.
Most ship recycling capacity/yards in the world
KEY ELEMENTS:
o Market Maker / Leader.
o Experienced Recyclers.
o Top price levels for Specialized Vessels.
o Premium for Bunkers, Non-Ferrous Items, certain
Machinery Items Such as Main Engine, Generators, etc.
o Wide Variety of Buyers. Buyers range from ULCC buyers to
the smallest fishing trawlers. Everything goes!
BEST MARKET FOR:
Specialized High Value Vessels such as ROROS , Reefers ,
Passenger Ships, Dry Vessels .
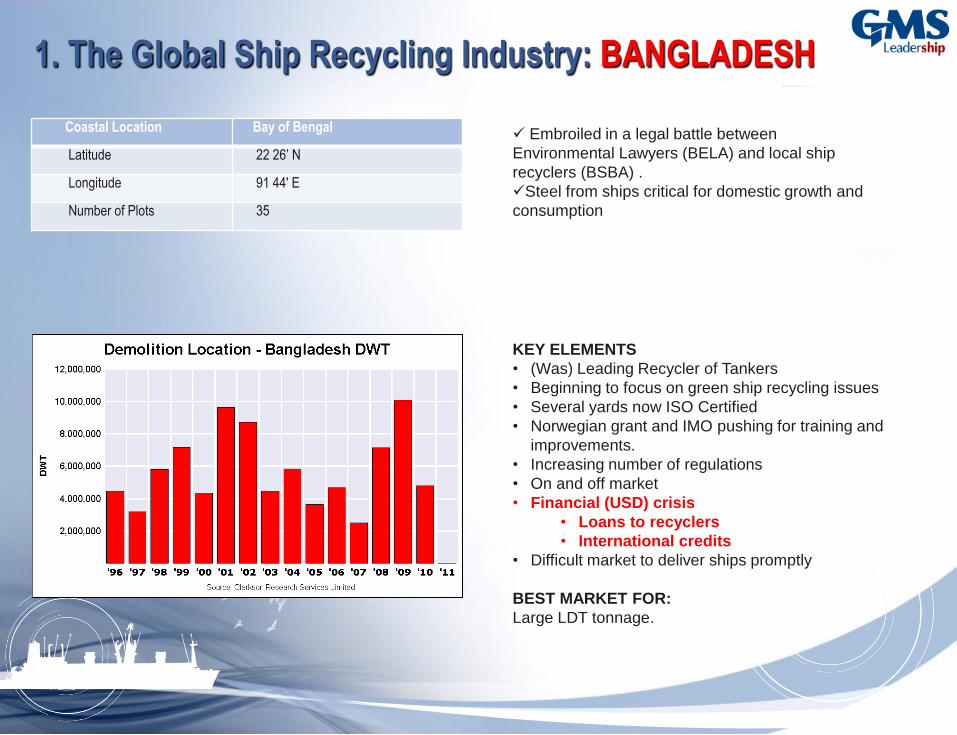
1. The Global Ship Recycling Industry: BANGLADESH
Coastal Location Bay of Bengal
Latitude 22 26’ N
Longitude 91 44' E
Number of Plots 35
Embroiled in a legal battle between
Environmental Lawyers (BELA) and local ship
recyclers (BSBA) .
Steel from ships critical for domestic growth and
consumption
KEY ELEMENTS
• (Was) Leading Recycler of Tankers
• Beginning to focus on green ship recycling issues
• Several yards now ISO Certified
• Norwegian grant and IMO pushing for training and
improvements.
• Increasing number of regulations
• On and off market
• Financial (USD) crisis
• Loans to recyclers
• International credits
• Difficult market to deliver ships promptly
BEST MARKET FOR:
Large LDT tonnage.
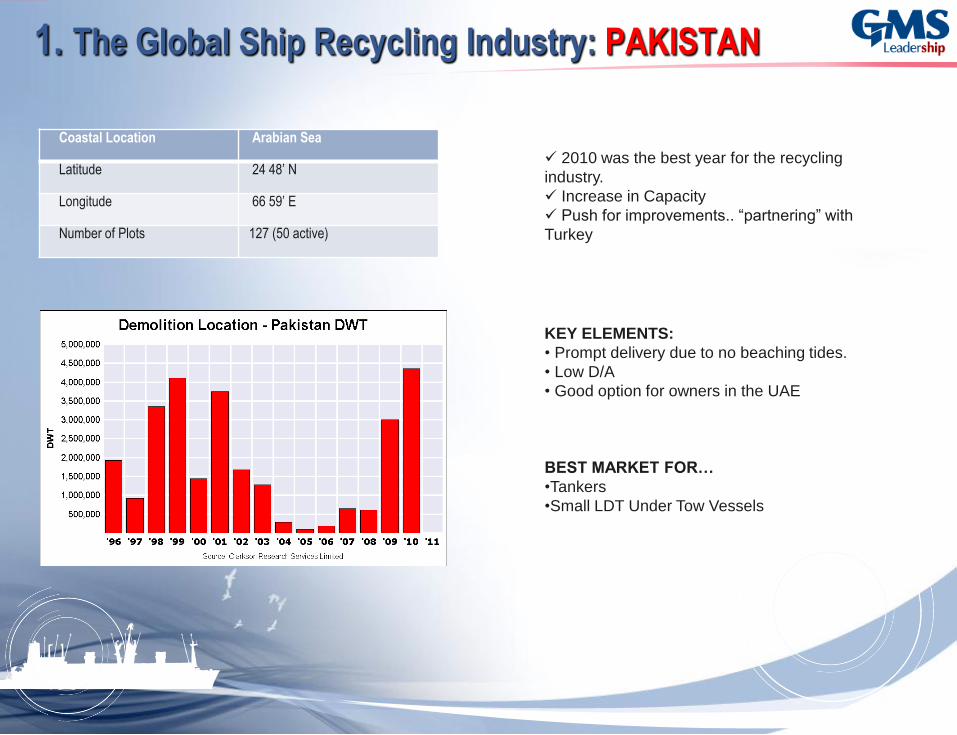
1. The Global Ship Recycling Industry: PAKISTAN
Coastal Location Arabian Sea
Latitude 24 48’ N
Longitude 66 59’ E
Number of Plots 127 (50 active)
2010 was the best year for the recycling
industry.
Increase in Capacity
Push for improvements.. “partnering” with
Turkey
KEY ELEMENTS:
• Prompt delivery due to no beaching tides.
• Low D/A
• Good option for owners in the UAE
BEST MARKET FOR…
•Tankers
•Small LDT Under Tow Vessels

1. The Global Ship Recycling Industry: CHINA
Latitude 113 4’ E
Longitude 22 19’ N
2010 has seen a significant decline in volume of
vessels recycled.
Leading destination for owners wanting green
recycling, CAPES and other vessels
discharging in China
KEY ELEMENTS:
• Advanced ship recycling market
• Large and emerging Capacity
• Volatility
DISADVANTAGES:
•High D/A Costs .
•Lower than Indian Sub-Continent prices.
•Not a keen buyer of Specialized Ships .
BEST MARKET FOR:
• Local vessels
November 8, 2011
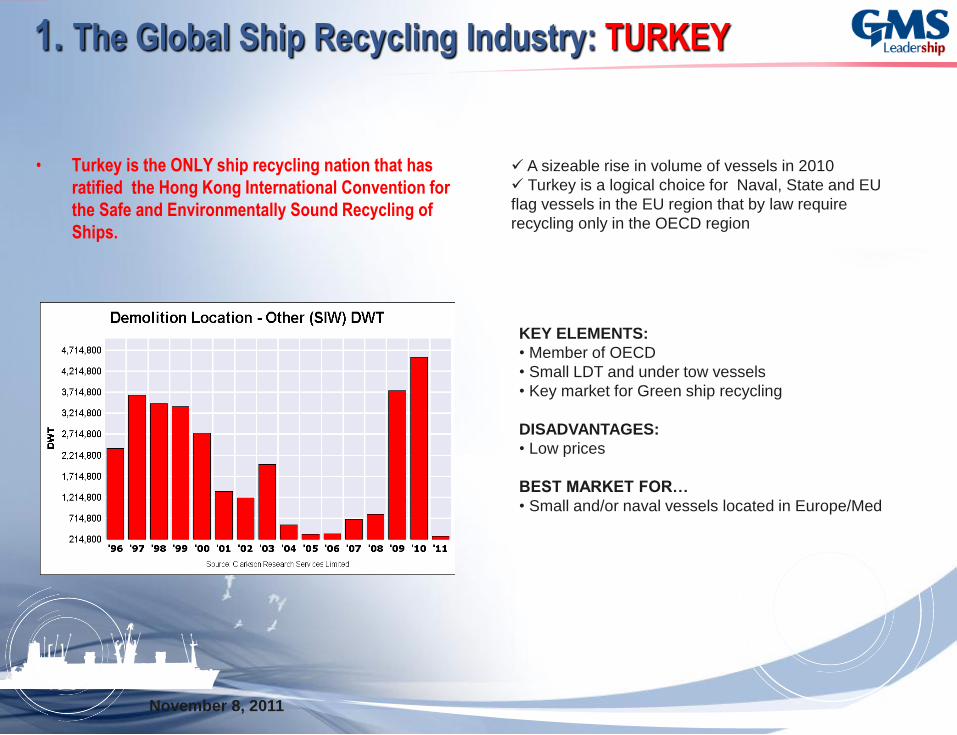
1. The Global Ship Recycling Industry: TURKEY
A sizeable rise in volume of vessels in 2010
Turkey is a logical choice for Naval, State and EU
flag vessels in the EU region that by law require
recycling only in the OECD region
KEY ELEMENTS:
• Member of OECD
• Small LDT and under tow vessels
• Key market for Green ship recycling
DISADVANTAGES:
• Low prices
BEST MARKET FOR…
• Small and/or naval vessels located in Europe/Med
• Turkey is the ONLY ship recycling nation that has
ratified the Hong Kong International Convention for
the Safe and Environmentally Sound Recycling of
Ships.
November 8, 2011

1. The Global Ship Recycling Industry: Fleet
Supply
• Next 3 years will be busy:
Massive Order books
Poor freight rates
Legislation
Selective charterers
High Scrap Prices
November 8, 2011
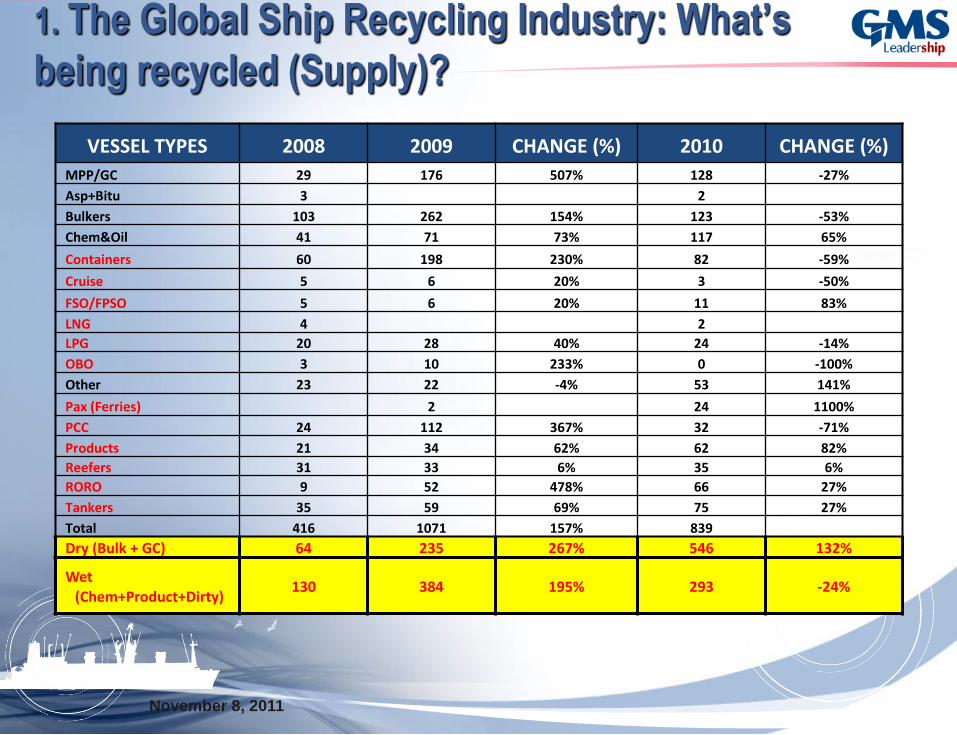
1. The Global Ship Recycling Industry: What’s
being recycled (Supply)?
VESSEL TYPES 2008 2009 CHANGE (%) 2010 CHANGE (%)
MPP/GC 29 176 507% 128 -27%
Asp+Bitu 3 2
Bulkers 103 262 154% 123 -53%
Chem&Oil 41 71 73% 117 65%
Containers 60 198 230% 82 -59%
Cruise 5 6 20% 3 -50%
FSO/FPSO 5 6 20% 11 83%
LNG 4 2
LPG 20 28 40% 24 -14%
OBO 3 10 233% 0 -100%
Other 23 22 -4% 53 141%
Pax (Ferries) 2 24 1100%
PCC 24 112 367% 32 -71%
Products 21 34 62% 62 82%
Reefers 31 33 6% 35 6%
RORO 9 52 478% 66 27%
Tankers 35 59 69% 75 27%
Total 416 1071 157% 839
Dry (Bulk + GC) 64 235 267% 546 132%
Wet
(Chem+Product+Dirty) 130 384 195% 293 -24%
November 8, 2011
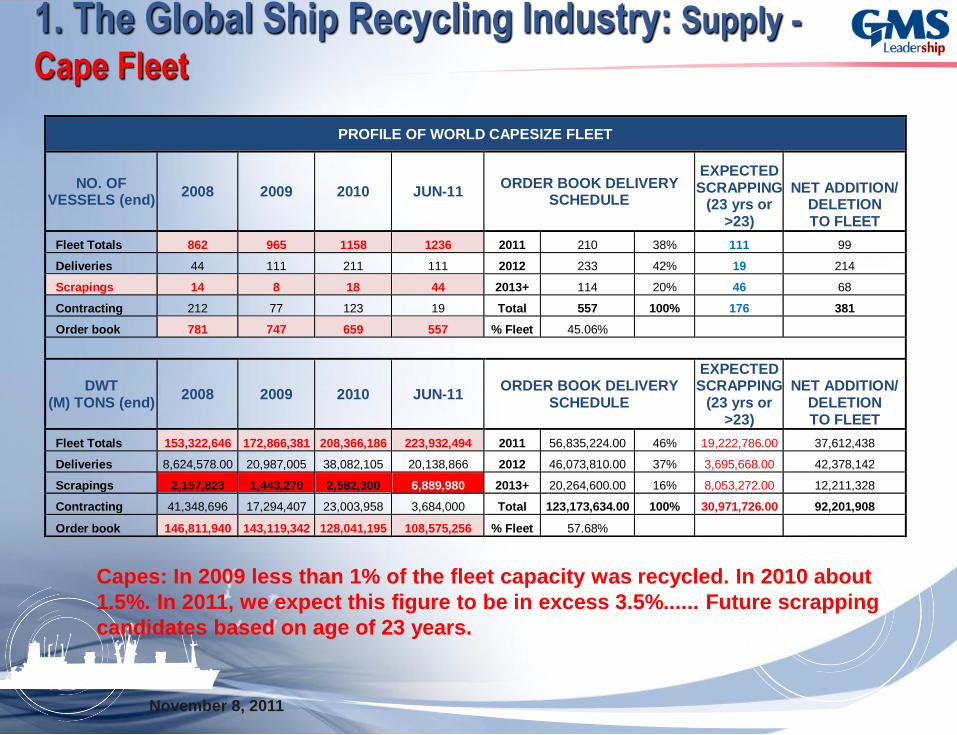
1. The Global Ship Recycling Industry: Supply -
Cape Fleet
Capes: In 2009 less than 1% of the fleet capacity was recycled. In 2010 about
1.5%. In 2011, we expect this figure to be in excess 3.5%...... Future scrapping
candidates based on age of 23 years.
PROFILE OF WORLD CAPESIZE FLEET
NO. OF VESSELS (end)
2008 2009 2010 JUN-11 ORDER BOOK DELIVERY
SCHEDULE
EXPECTED SCRAPPING
(23 yrs or >23)
NET ADDITION/ DELETION TO FLEET
Fleet Totals 862 965 1158 1236 2011 210 38% 111 99
Deliveries 44 111 211 111 2012 233 42% 19 214
Scrapings 14 8 18 44 2013+ 114 20% 46 68
Contracting 212 77 123 19 Total 557 100% 176 381
Order book 781 747 659 557 % Fleet 45.06%
DWT (M) TONS (end)
2008 2009 2010 JUN-11 ORDER BOOK DELIVERY
SCHEDULE
EXPECTED SCRAPPING
(23 yrs or >23)
NET ADDITION/ DELETION TO FLEET
Fleet Totals 153,322,646 172,866,381 208,366,186 223,932,494 2011 56,835,224.00 46% 19,222,786.00 37,612,438
Deliveries 8,624,578.00 20,987,005 38,082,105 20,138,866 2012 46,073,810.00 37% 3,695,668.00 42,378,142
Scrapings 2,157,823 1,443,270 2,582,300 6,889,980 2013+ 20,264,600.00 16% 8,053,272.00 12,211,328
Contracting 41,348,696 17,294,407 23,003,958 3,684,000 Total 123,173,634.00 100% 30,971,726.00 92,201,908
Order book 146,811,940 143,119,342 128,041,195 108,575,256 % Fleet 57.68%
November 8, 2011
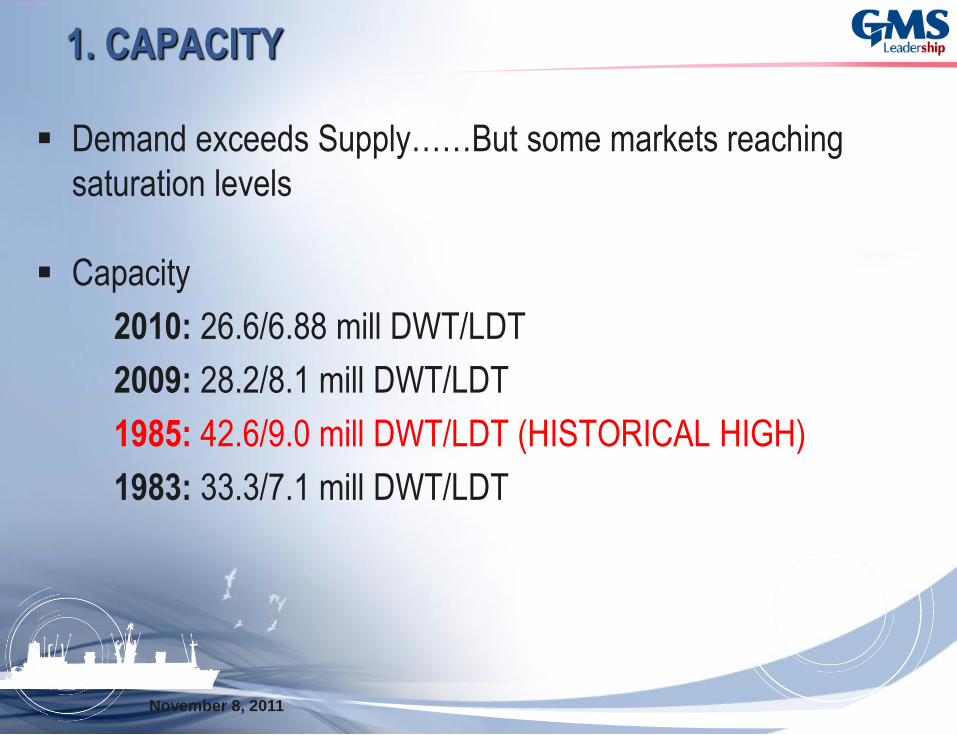
1. CAPACITY
Demand exceeds Supply……But some markets reaching
saturation levels
Capacity
2010: 26.6/6.88 mill DWT/LDT
2009: 28.2/8.1 mill DWT/LDT
1985: 42.6/9.0 mill DWT/LDT (HISTORICAL HIGH)
1983: 33.3/7.1 mill DWT/LDT
November 8, 2011
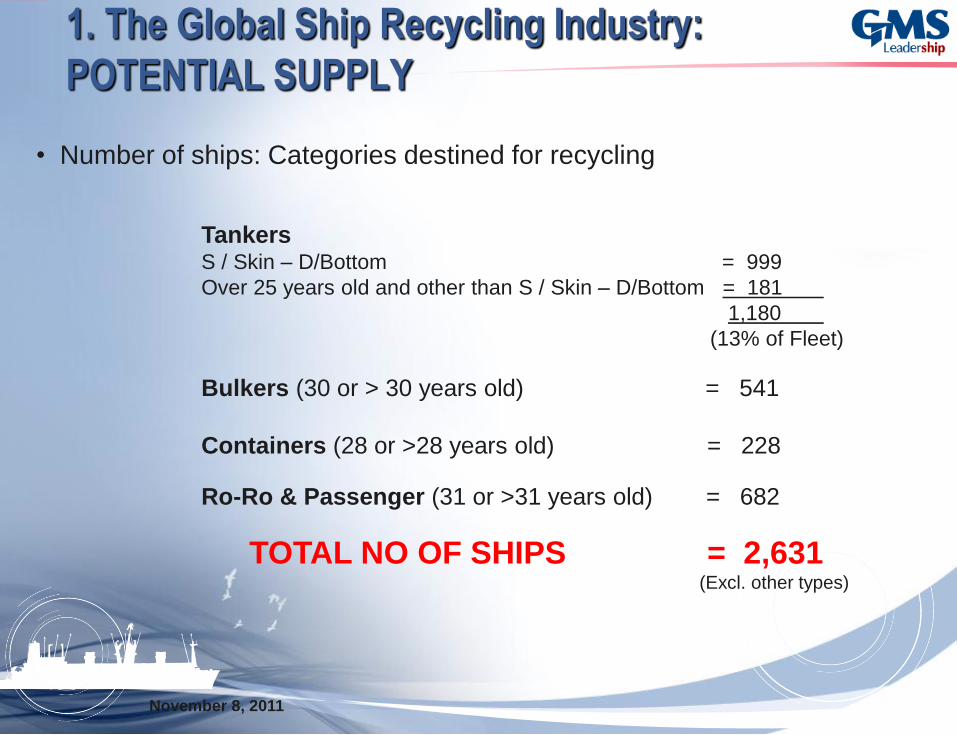
1. The Global Ship Recycling Industry:
POTENTIAL SUPPLY
• Number of ships: Categories destined for recycling
Tankers S / Skin – D/Bottom = 999
Over 25 years old and other than S / Skin – D/Bottom = 181
1,180
(13% of Fleet)
Bulkers (30 or > 30 years old) = 541
Containers (28 or >28 years old) = 228
Ro-Ro & Passenger (31 or >31 years old) = 682
TOTAL NO OF SHIPS = 2,631 (Excl. other types)
November 8, 2011
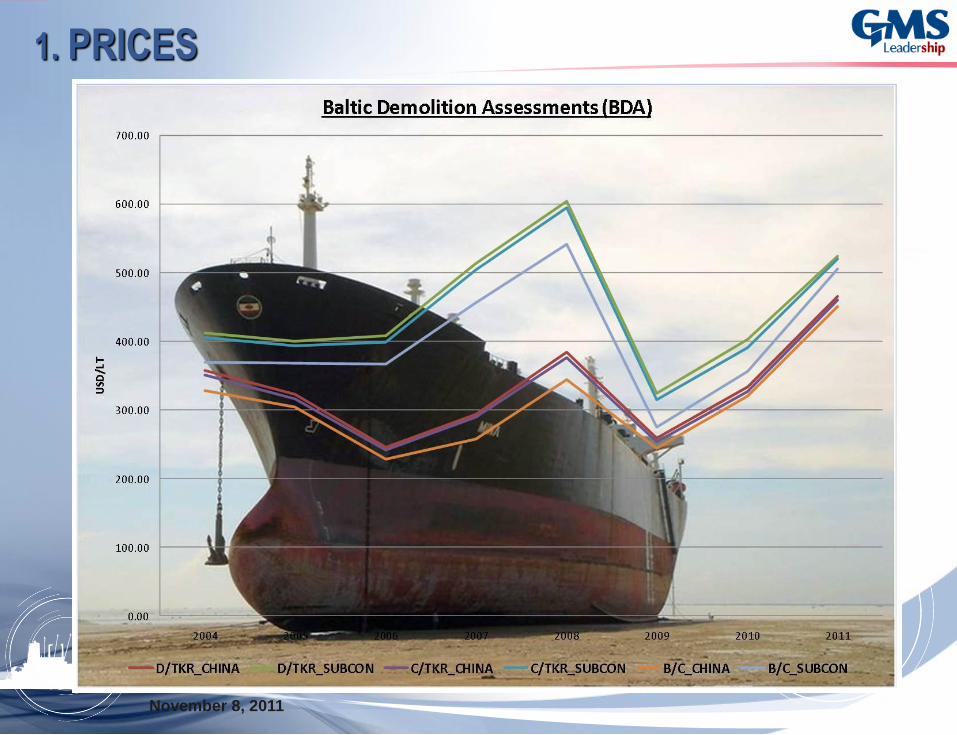
1. PRICES
November 8, 2011
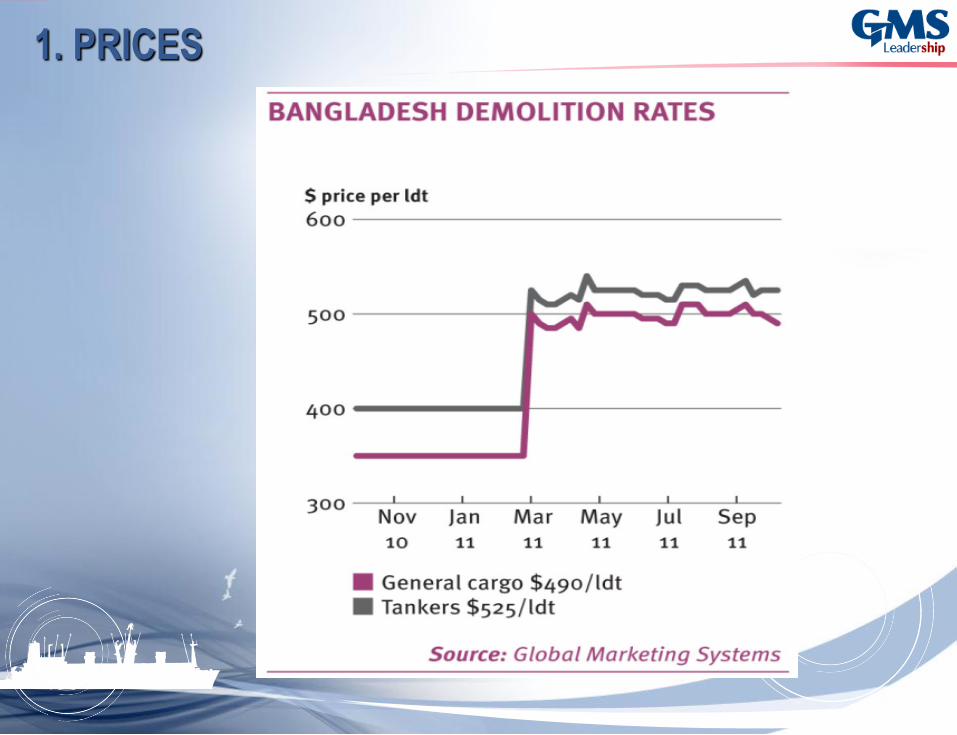
1. PRICES
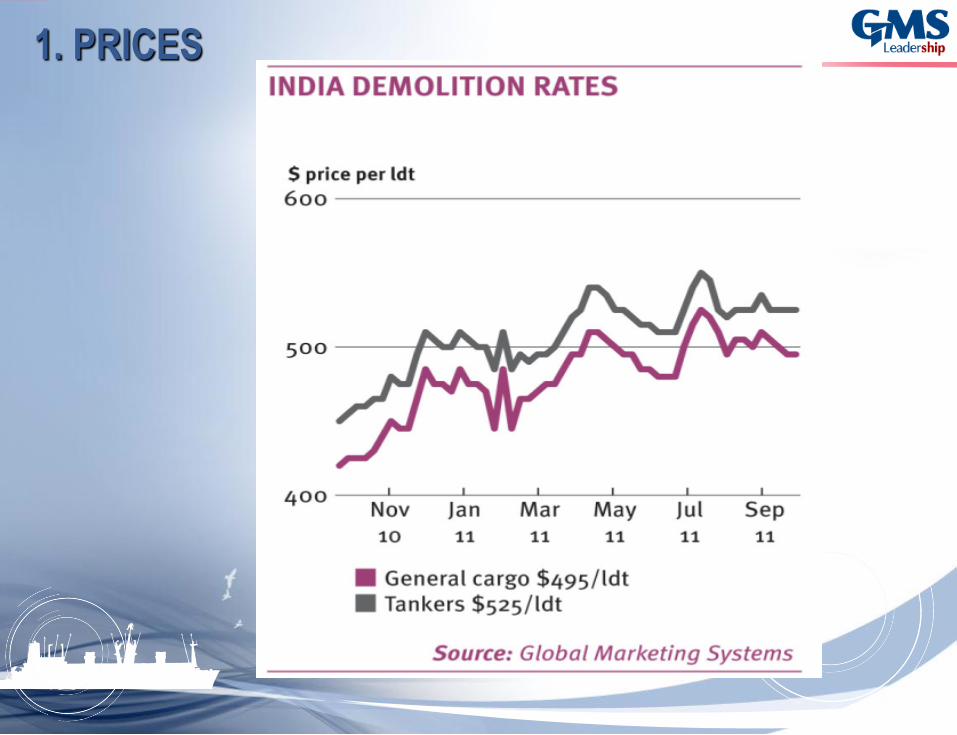
1. PRICES

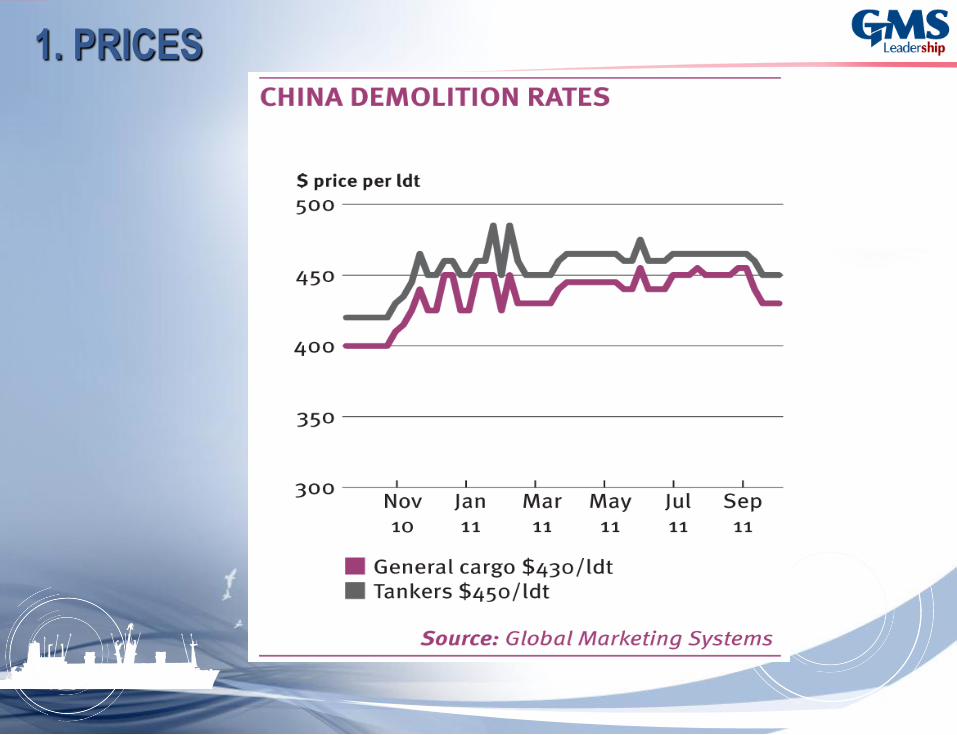
1. PRICES
1. PRICES
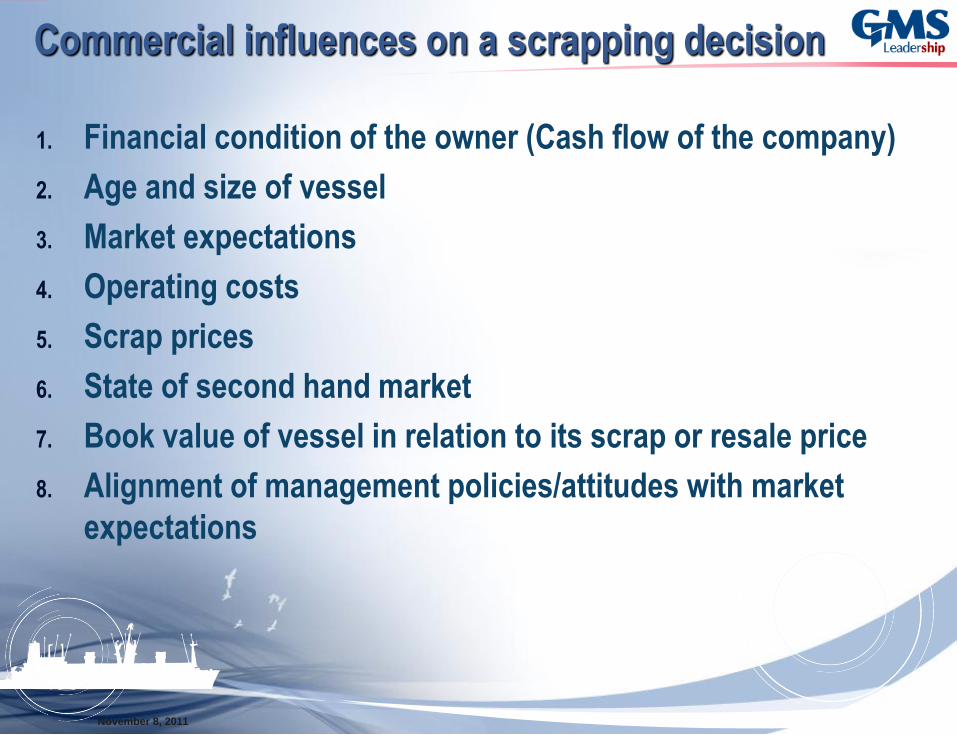
Commercial influences on a scrapping decision
November 8, 2011
1. Financial condition of the owner (Cash flow of the company)
2. Age and size of vessel
3. Market expectations
4. Operating costs
5. Scrap prices
6. State of second hand market
7. Book value of vessel in relation to its scrap or resale price
8. Alignment of management policies/attitudes with market
expectations
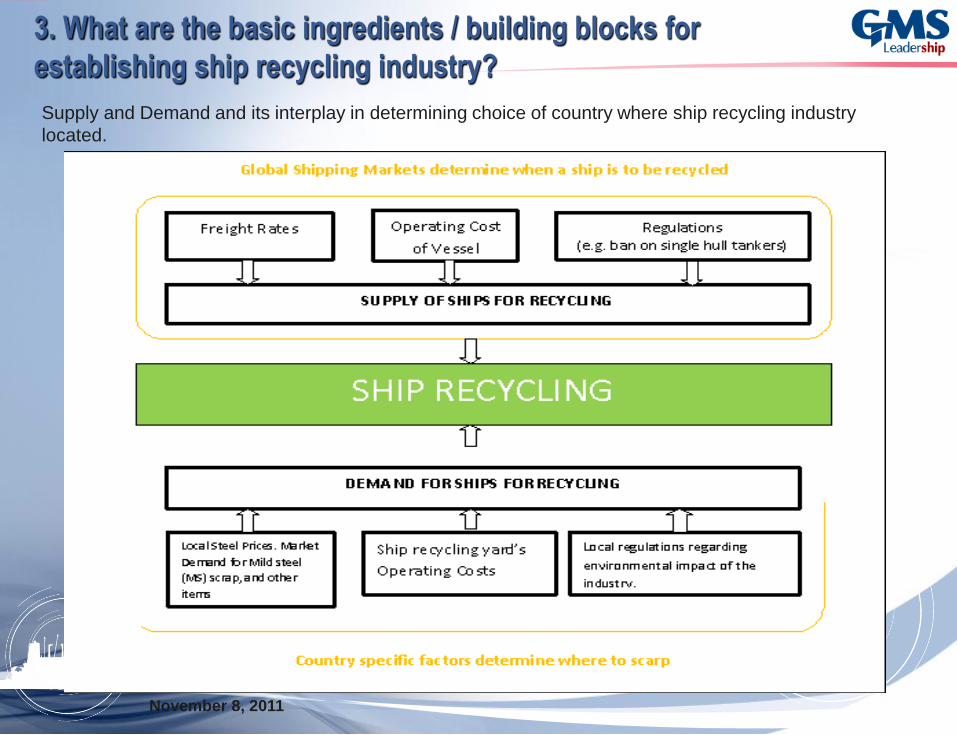
3. What are the basic ingredients / building blocks for
establishing ship recycling industry?
Source: World Bank (with some adaption)
Supply and Demand and its interplay in determining choice of country where ship recycling industry
located.
November 8, 2011

SOCIO – MACRO ECONOMIC BENEFITS OF SHIP RECYCLING
•Ship recycling forms part of the socioeconomic structure of the economies in Indian subcontinent. It is
responsible for creating jobs ranging from about 50,000 jobs directly on the yard to over 300,000 in the
supply chain, shops and re-rolling mills, with dependents in extended families estimated to reach over
500,000.
•Ship recycling provides more than half of Bangladesh’s steel supply, making it a strategic industry in that
country.
Bangladesh Pakistan
National steel production 2.2–2.5 m tons 3 m tons Scrap steel from ship breaking Up to 1.5 m tons Up to 800,000 tons Ship breaking steel’s contribution To production 50% 15%
No. of re-rolling mills 250 to 350 330
Scrap yards (total no.) 40 active 30 active (132) Estimated no. of workers in yards 22,000 6,000–8,000 Source: World Bank report of Dec 2010 titled "SHIP BREAKING AND RECYCLING INDUSTRY IN BANGLADESH AND PAKISTAN"
Ship recycling generates large amounts of revenue for various Government authorities through the payment of taxes.
Every year the Government of Bangladesh collects almost 9000 million taka (~ USD 119 M) in revenue from the ship
recycling industry through import duty, yards tax and other taxes.
November 8, 2011
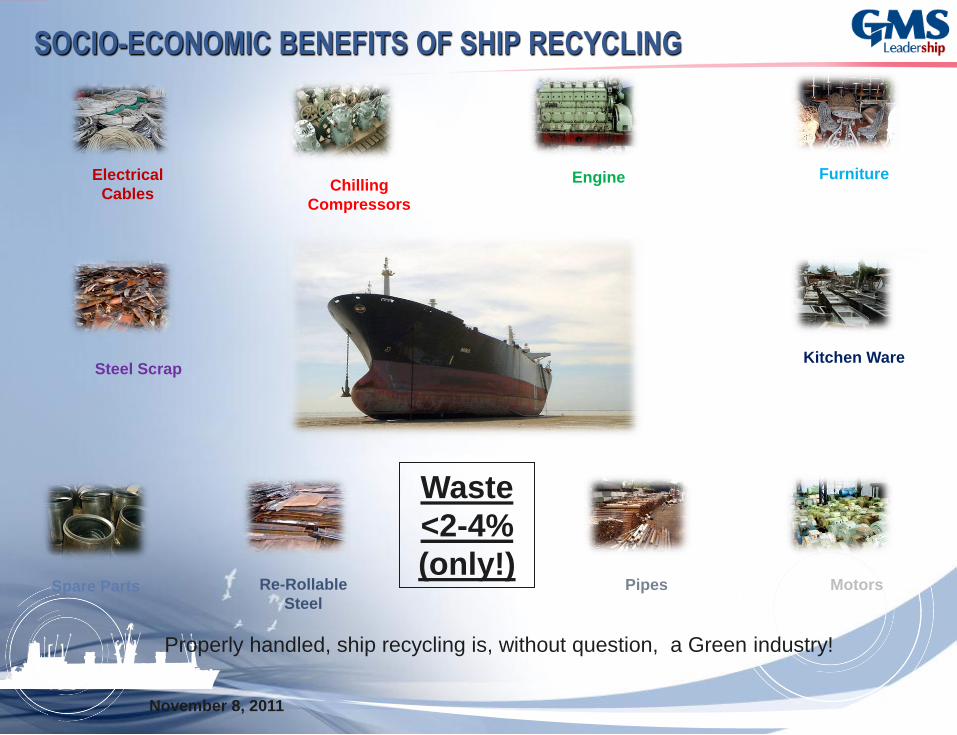
SOCIO-ECONOMIC BENEFITS OF SHIP RECYCLING
Electrical
Cables Chilling
Compressors
Engine Furniture
Kitchen Ware Steel Scrap
Spare Parts Re-Rollable
Steel
Pipes Motors
Properly handled, ship recycling is, without question, a Green industry!
Waste
<2-4%
(only!)
November 8, 2011

SHIP RECYCLING – Environmental
• Scrap steel reduces related water pollution, air pollution, and mining
wastes by about 70%.
• It takes four times as much energy to make steel from virgin ore.
• Benefits of using Iron and Steel (ferrous metals) instead of virgin ore to
make new steel:
• Savings in energy 74%
Savings in virgin materials 90%
Reduction in water use 40%
Reduction in water pollution 76%
Reduction in air pollution 86%
Reduction in mining wastes 97%
Reduction in consumer waste generated 105%
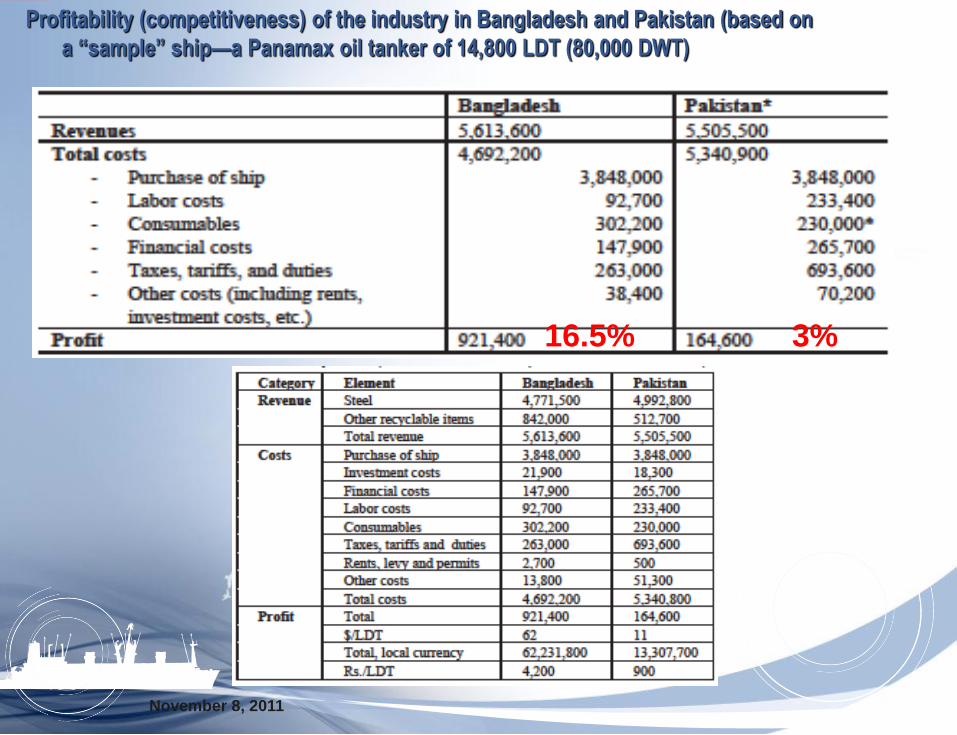
Profitability (competitiveness) of the industry in Bangladesh and Pakistan (based on
a “sample” ship—a Panamax oil tanker of 14,800 LDT (80,000 DWT)
November 8, 2011
16.5% 3%

Costs
November 8, 2011
1. Infrastructural Costs
2. Ship Prices
3. Cost of Capital
4. Labor Costs
5. Consumables
6. Exchange Rate
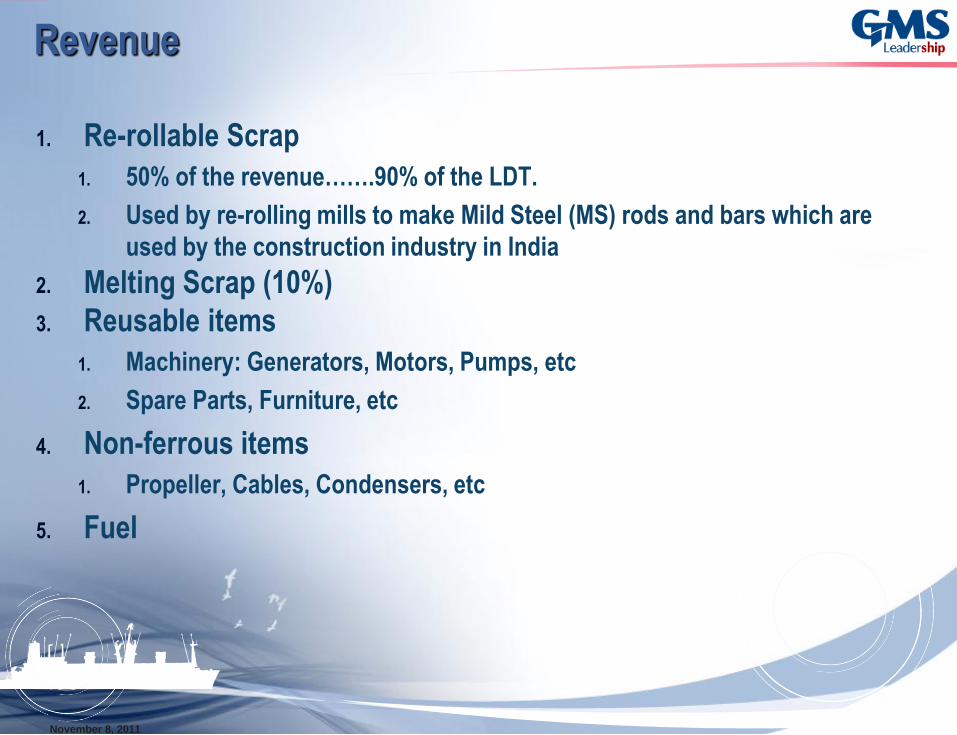
Revenue
November 8, 2011
1. Re-rollable Scrap
1. 50% of the revenue…….90% of the LDT.
2. Used by re-rolling mills to make Mild Steel (MS) rods and bars which are
used by the construction industry in India
2. Melting Scrap (10%)
3. Reusable items
1. Machinery: Generators, Motors, Pumps, etc
2. Spare Parts, Furniture, etc
4. Non-ferrous items
1. Propeller, Cables, Condensers, etc
5. Fuel
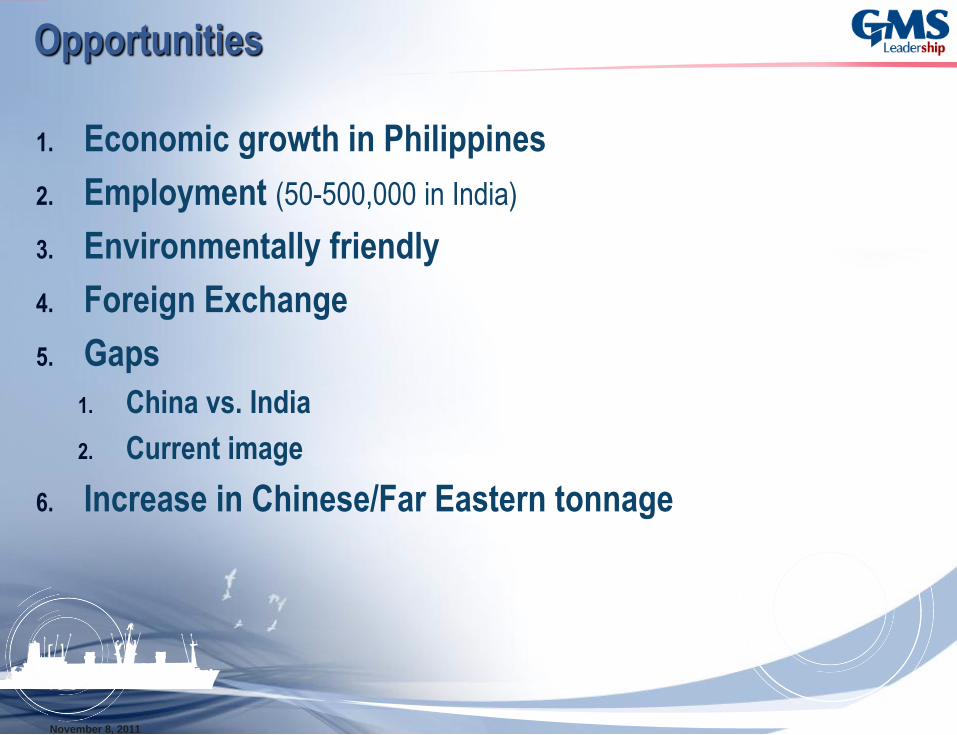
Opportunities
November 8, 2011
1. Economic growth in Philippines
2. Employment (50-500,000 in India)
3. Environmentally friendly
4. Foreign Exchange
5. Gaps
1. China vs. India
2. Current image
6. Increase in Chinese/Far Eastern tonnage

Threats
November 8, 2011
1. Price Competitive
2. Mature Industry (Pressure on profit margins)
3. Existing Capacity in the market (Demand exceeds Supply)
4. CSR in infancy
5. Growth of ancillary industries
6. Continued supply of ships
7. Downstream industries 1. Rolling mills
2. 2nd-hand markets
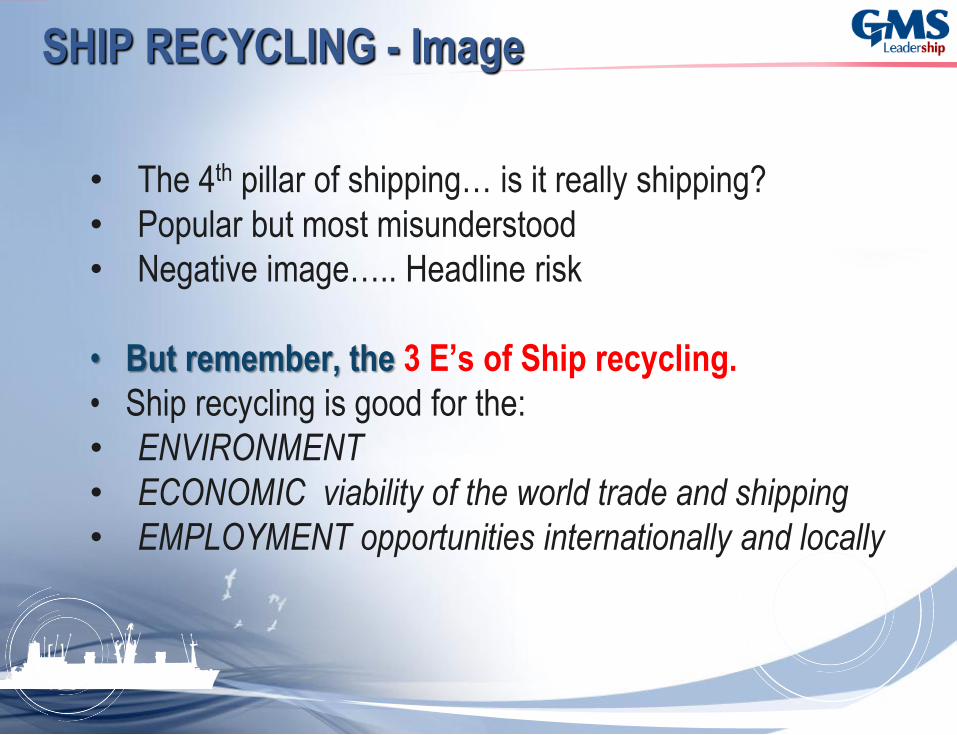
SHIP RECYCLING - Image
• The 4th pillar of shipping… is it really shipping?
• Popular but most misunderstood
• Negative image….. Headline risk
• But remember, the 3 E’s of Ship recycling.
• Ship recycling is good for the:
• ENVIRONMENT
• ECONOMIC viability of the world trade and shipping
• EMPLOYMENT opportunities internationally and locally
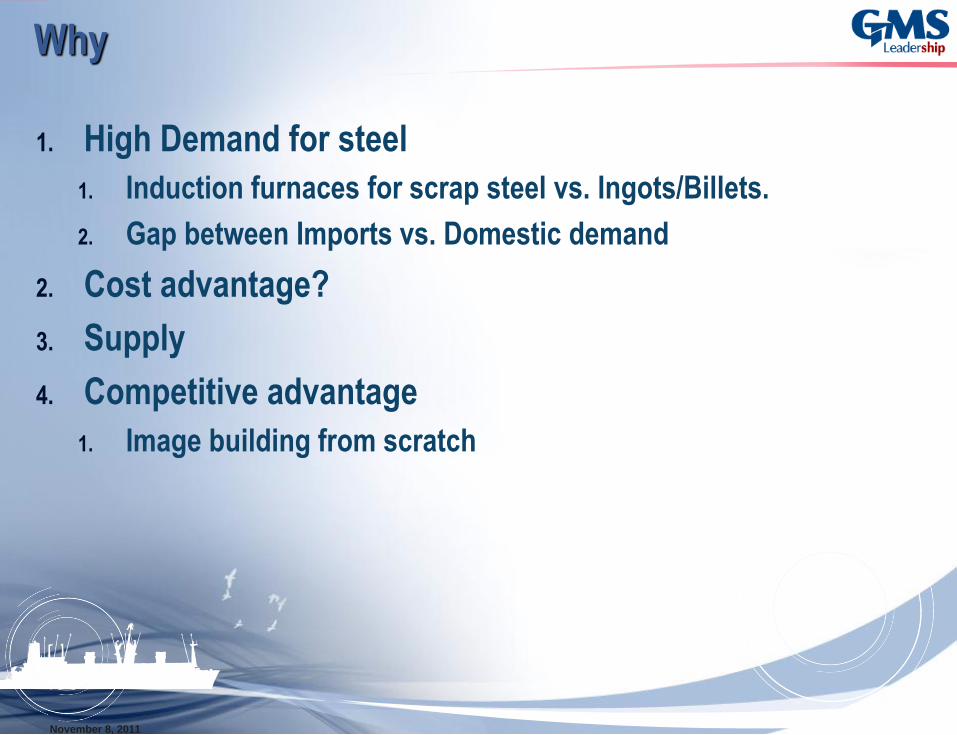
Why
November 8, 2011
1. High Demand for steel
1. Induction furnaces for scrap steel vs. Ingots/Billets.
2. Gap between Imports vs. Domestic demand
2. Cost advantage?
3. Supply
4. Competitive advantage
1. Image building from scratch
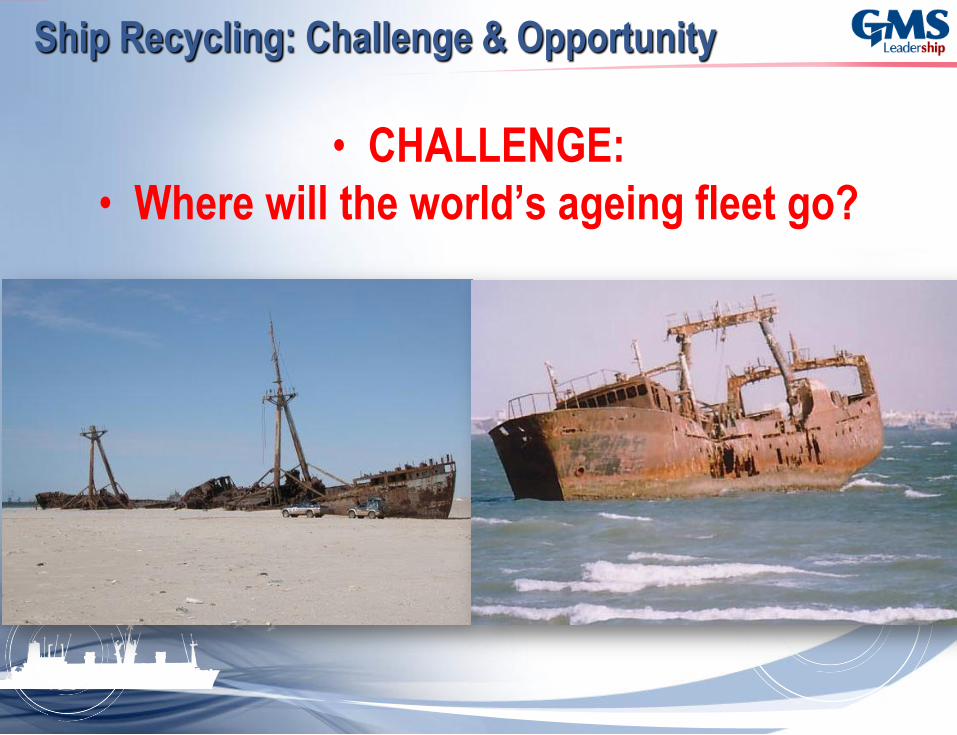
Ship Recycling: Challenge & Opportunity
• CHALLENGE:
• Where will the world’s ageing fleet go?
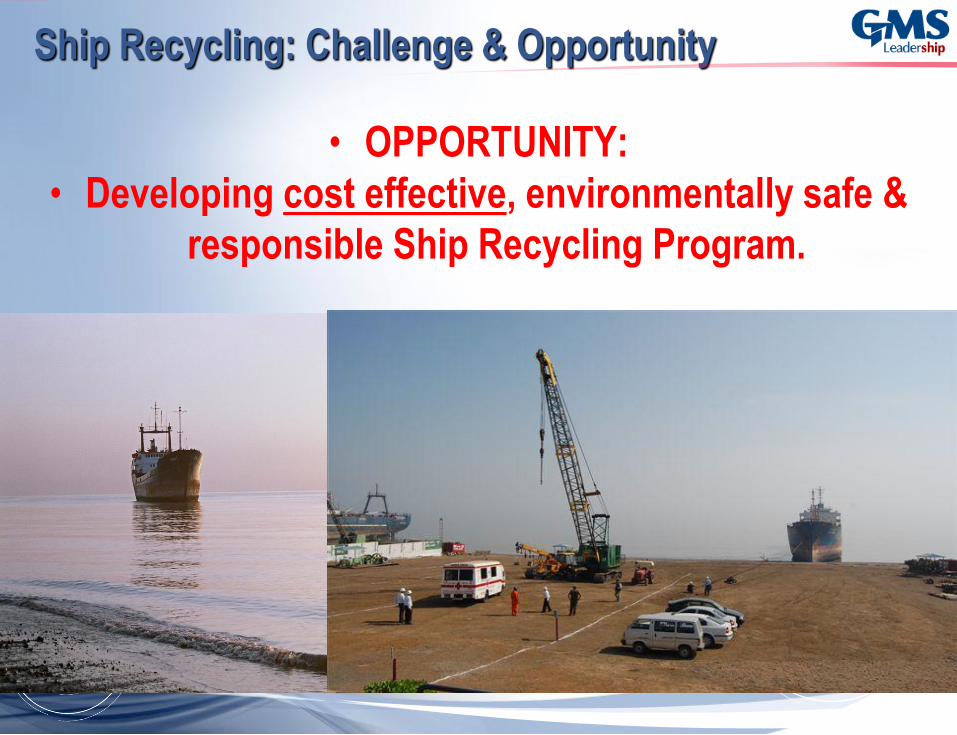
Ship Recycling: Challenge & Opportunity
• OPPORTUNITY:
• Developing cost effective, environmentally safe &
responsible Ship Recycling Program.
34
Closing Thought
The days are not too far when
Green Ship Recycling will
become the norm of the ship
recycling industry and will
contribute evenly more greatly
to the health of the environment
and safety of worker.
This will be achieved with a
unity of purpose between the
shipping industry, IMO, ship
recycling industry and all
environment advocates.
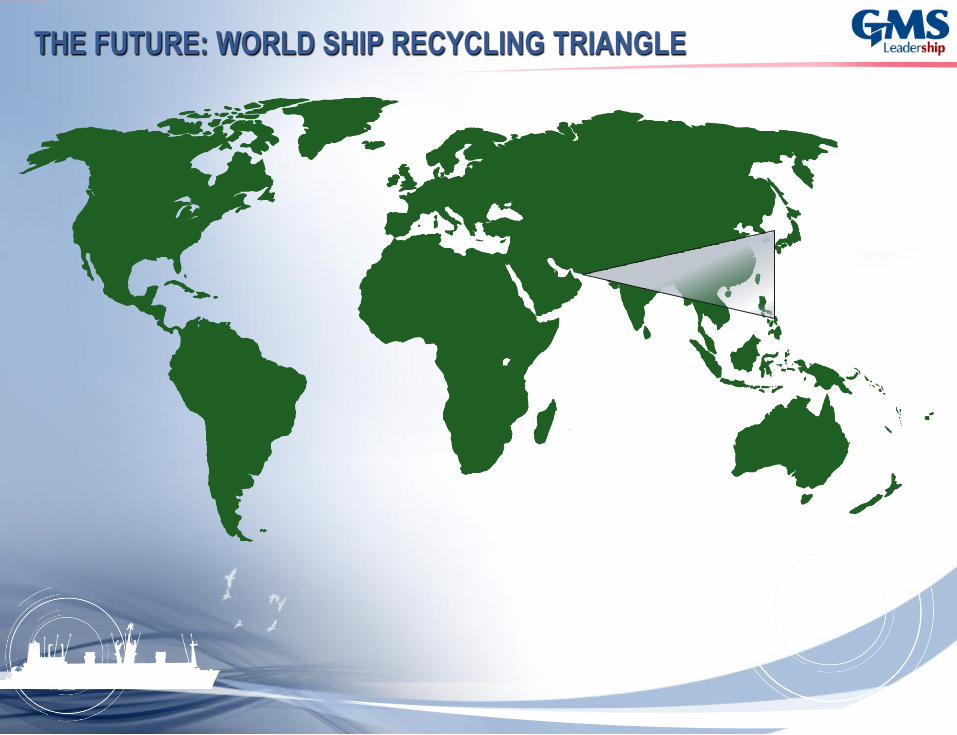
THE FUTURE: WORLD SHIP RECYCLING TRIANGLE

Thank you!