Embed Size (px)
Citation preview
Country Profile 2004
PhilippinesThis Country Profile is a reference work, analysing thecountry’s history, politics, infrastructure and economy. It isrevised and updated annually. The Economist IntelligenceUnit’s Country Reports analyse current trends and provide atwo-year forecast.
The full publishing schedule for Country Profiles is nowavailable on our website at http://www.eiu.com/schedule
The Economist Intelligence Unit15 Regent St, London SW1Y 4LRUnited Kingdom

The Economist Intelligence Unit
The Economist Intelligence Unit is a specialist publisher serving companies establishing and managingoperations across national borders. For over 50 years it has been a source of information on businessdevelopments, economic and political trends, government regulations and corporate practice worldwide.
The Economist Intelligence Unit delivers its information in four ways: through its digital portfolio, where itslatest analysis is updated daily; through printed subscription products ranging from newsletters to annualreference works; through research reports; and by organising seminars and presentations. The firm is amember of The Economist Group.
LondonThe Economist Intelligence Unit15 Regent StLondonSW1Y 4LRUnited KingdomTel: (44.20) 7830 1007Fax: (44.20) 7830 1023E-mail: [email protected]
New YorkThe Economist Intelligence UnitThe Economist Building111 West 57th StreetNew YorkNY 10019, USTel: (1.212) 554 0600Fax: (1.212) 586 0248E-mail: [email protected]
Hong KongThe Economist Intelligence Unit60/F, Central Plaza18 Harbour RoadWanchaiHong KongTel: (852) 2585 3888Fax: (852) 2802 7638E-mail: [email protected]
Website: www.eiu.com
Electronic deliveryThis publication can be viewed by subscribing online at www.store.eiu.com
Reports are also available in various other electronic formats, such as CD-ROM, Lotus Notes, on-line databasesand as direct feeds to corporate intranets. For further information, please contact your nearest EconomistIntelligence Unit office
Copyright© 2004 The Economist Intelligence Unit Limited. All rights reserved. Neither this publication norany part of it may be reproduced, stored in a retrieval system, or transmitted in any form or by any means,electronic, mechanical, photocopying, recording or otherwise, without the prior permissionof The Economist Intelligence Unit Limited.
All information in this report is verified to the best of the author’s and the publisher’s ability. However, theEconomist Intelligence Unit does not accept responsibility for any loss arising from reliance on it.
ISSN 0269-5979
Symbols for tables“n/a” means not available; “–” means not applicable
Printed and distributed by Patersons Dartford, Questor Trade Park, 151 Avery Way, Dartford, Kent DA1 1JS, UK.

Country Profile 2004 www.eiu.com © The Economist Intelligence Unit Limited 2004
Philippines 1
© The Economist Intelligence Unit Limited 2004 www.eiu.com Country Profile 2004
Contents
Philippines
3 Basic data
4 Politics4 Political background6 Recent political developments8 Constitution, institutions and administration9 Political forces12 International relations and defence
15 Resources and infrastructure15 Population16 Education17 Health17 Natural resources and the environment18 Transport, communications and the Internet20 Energy provision
21 The economy21 Economic structure22 Economic policy26 Economic performance29 Regional trends
30 Economic sectors30 Agriculture32 Mining and semi-processing32 Manufacturing34 Construction34 Financial services37 Other services
38 The external sector38 Trade in goods40 Invisibles and the current account41 Capital flows and foreign debt42 Foreign reserves and the exchange rate
44 Regional overview44 Membership of organisations
47 Appendices47 Sources of information48 Reference tables48 Population48 Labour force48 Structure of employment49 Transport statistics

2 Philippines
Country Profile 2004 www.eiu.com © The Economist Intelligence Unit Limited 2004
49 Energy consumption by source49 Outstanding public-sector debt50 Government revenue and expenditure50 Money supply and credit50 Interest rates51 Gross domestic product51 Gross domestic product by expenditure52 Gross domestic product by sector52 Prices52 Meat production53 Production of major crops53 Output of wood products53 Private construction54 Mineral production54 Manufacturing production54 Philippines Stock Exchange indicators55 Visitor arrivals by country/region of residence55 Exports55 Imports56 Key commodity exports56 Main trading partners57 Balance of payments, IMF series58 Balance of payments, national series59 External debt59 Net official development assistance60 Foreign reserves60 Exchange rates
Philippines 3
© The Economist Intelligence Unit Limited 2004 www.eiu.com Country Profile 2004
Philippines
Basic data
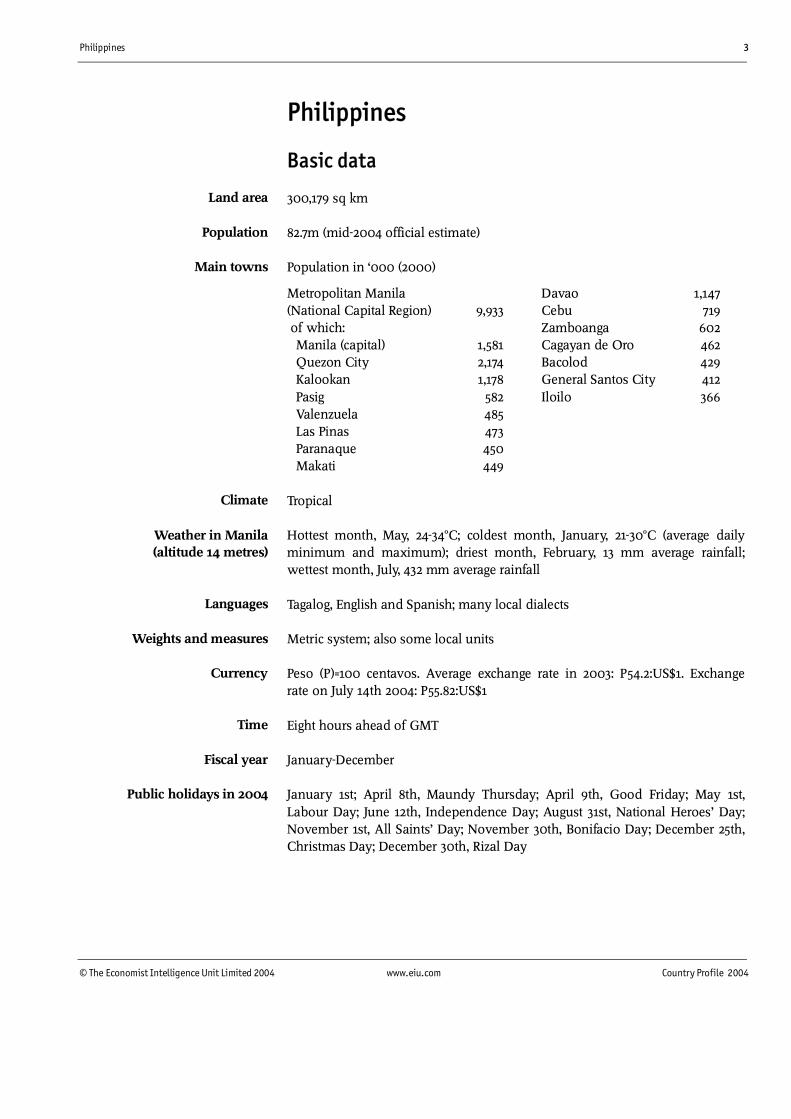
300,179 sq km
82.7m (mid-2004 official estimate)
Population in ‘000 (2000)
Metropolitan Manila Davao 1,147(National Capital Region) 9,933 Cebu 719 of which: Zamboanga 602 Manila (capital) 1,581 Cagayan de Oro 462 Quezon City 2,174 Bacolod 429 Kalookan 1,178 General Santos City 412 Pasig 582 Iloilo 366 Valenzuela 485 Las Pinas 473 Paranaque 450 Makati 449
Tropical
Hottest month, May, 24-34°C; coldest month, January, 21-30°C (average dailyminimum and maximum); driest month, February, 13 mm average rainfall;wettest month, July, 432 mm average rainfall
Tagalog, English and Spanish; many local dialects
Metric system; also some local units
Peso (P)=100 centavos. Average exchange rate in 2003: P54.2:US$1. Exchangerate on July 14th 2004: P55.82:US$1
Eight hours ahead of GMT
January-December
January 1st; April 8th, Maundy Thursday; April 9th, Good Friday; May 1st,Labour Day; June 12th, Independence Day; August 31st, National Heroes’ Day;November 1st, All Saints’ Day; November 30th, Bonifacio Day; December 25th,Christmas Day; December 30th, Rizal Day
Land area
Population
Main towns
Weather in Manila(altitude 14 metres)
Languages
Weights and measures
Currency
Time
Fiscal year
Public holidays in 2004
Climate
4 Philippines
Country Profile 2004 www.eiu.com © The Economist Intelligence Unit Limited 2004
Politics
The Philippines is a pluralist democracy modelled on the US, with an executivepresidency, a bicameral Congress and a Supreme Court that can rule on theconstitutionality of government actions. In January 2001 Gloria MacapagalArroyo, then vice-president, replaced the incumbent president, Joseph Estrada,in a civilian coup backed by the military. She served out the remainder of hissix-year term before winning re-election in her own right in the May 10th 2004presidential election. The congressional elections held on the same dayproduced a large pro-administration majority, headed by the president’s party,Lakas ng Edsa-National Union of Christian Democrats (Lakas), in the House ofRepresentatives (the lower house) and gave the president a larger majority inthe Senate (the upper house).
Political background
The Philippine islands, inhabited by Malay peoples, were a colony of Spainfrom the late 1500s until the end of the 19th century. In the early 19th centurythat export crops sugar, coconuts, abaca (Manila hemp) and tobacco weredeveloped. At the same time a Chinese entrepreneurial class evolved, marryinginto the indigenous population and forming an elite based on land ownership.Spanish colonial rule ended in December 1898 after the US intervened in apopular rebellion that had broken out two years earlier. Spain ceded thePhilippines to the US. Under US colonial rule democratic institutions wereintroduced, Filipinos increasingly took over all political and bureaucraticpositions, and English-language education was extended throughout thecountry. In 1934 the Philippines became an internally self-governingcommonwealth, with full independence scheduled for July 4th 1946. Thetransition to independence was interrupted by the Japanese invasion ofDecember 1941. The Japanese occupation and the battle for liberation, inwhich local guerrilla groups played a significant role, destroyed much of thePhilippines’ physical infrastructure.
The independent republic, inaugurated on schedule in 1946, maintainedpreferential economic relations with the US. The constitution was modelled onthat of the US and, as in Washington, power tended to alternate between twoparties, the Nationalists and the Liberals. The fairly peaceful alternation in powerwithin the political elite was interrupted in September 1972 as the president,Ferdinand Marcos, neared the end of his second term. Citing the threat from“subversive forces”, Mr Marcos imposed martial law.
For the next 13 years until 1986 the Philippines experienced “constitutionalauthoritarianism”. In a series of elections the president and the party that he hadcreated, the New Society Movement (Kilusan Bagong Lipunan), consistentlyrecorded overwhelming popular support, whether or not the oppositionparticipated in the electoral exercise. This owed something to the virtualmonopoly over the media exercised by the president and his close associates, butmore to manipulation and outright cheating at the polls. With many of its leaders
The colonial andcommonwealth periods
An independent republicclosely tied to the US
The Marcos autocracy
Philippines 5
© The Economist Intelligence Unit Limited 2004 www.eiu.com Country Profile 2004
in detention or voluntary exile, the moderate opposition seemed unable tomobilise feeling against the administration and its abuses of power. The mosteffective opposition came from the communist New People’s Army (NPA), whichwas active in rural areas, and from the southern areas, where a secessionistMuslim movement had been active since before the introduction of martial law.
The situation changed radically in August 1983, when Benigno Aquino, theopposition leader regarded as the most credible alternative to Mr Marcos, wasassassinated minutes after his return from exile and while under military escort.A series of massive demonstrations followed in which the disenchantment ofthe urban middle class, and notably the business community, was expressed forthe first time. To reassert his own supremacy, Mr Marcos called an earlypresidential election for February 1986. In a close-run contest he was narrowlydefeated by the candidate of a temporarily united opposition, Corazon Aquino,Mr Aquino’s widow. The attempt by Mr Marcos to hold on to power set off acoup attempt by the military, backed by the deputy chief of staff, Fidel Ramos,and the defence minister. This received critically important backing fromMrs Aquino’s People’s Power movement and the local Catholic Church. Underpressure from the US, Mr Marcos went into voluntary exile in Hawaii, where hedied in 1989.
Under the new regime civil liberties were restored, political prisoners werereleased and an attempt was made to negotiate with the NPA. A newconstitution, drawn up by a convention appointed by Mrs Aquino, largelyrestored the set-up that existed before 1972, but with new controls on thepresidency based on the experience of the Marcos years. From July 1986 therewas a series of attempted coups, and rumours of coups, in which elements ofthe military were involved. In all cases the loyalty of the then chief-of-staff,Mr Ramos, was critical. Meanwhile, the reform hopes of the early days faded.The much-vaunted land reform was stalled by bureaucratic delay and landlordopposition, widespread corruption continued and the government wasperceived as ineffectual.
Mr Ramos won the mid-1992 presidential election. Within months of coming tothe power, he had built up a large pro-government majority in Congress,secured a cessation of hostilities by dissident military groups and begun theprocess of peace negotiations with both communist and Muslim secessionistrebels. A ceasefire was agreed with the Muslim rebels in late 1993, and thecommunist insurgency began to weaken as fissures within the leadershipemerged and active membership fell. However, deep-rooted economic andsocial problems remained largely unresolved. The president came underincreasing pressure from some of his supporters to stand for a second term in 1998.However, this would have required a revision of the 1987 constitution (seeConstitution, institutions and administration), and was strongly opposed by theCatholic Church, opposition politicians and some prominent members of thebusiness community, all of whom feared a drift to a constitutionally riggedautocracy on the Marcos precedent. The persistent speculation about thepresident’s intentions was only put to rest when Mr Ramos endorsed thesecretary-general of Lakas as his nominee for the presidency in November 1997.
The return to a free democracy
Political stability underFidel Ramos
6 Philippines
Country Profile 2004 www.eiu.com © The Economist Intelligence Unit Limited 2004
Recent political developments
In the presidential election of May 1998 the administration’s candidate was beatenby a wide margin by the popular vice-president and former film star, JosephEstrada. Mr Estrada, who was backed by an alliance of the two opposition parties,the Nationalist People’s Coalition (NPC) and Laban ng Demokratikong Pilipino(Laban, or Struggle for a Democratic Philippines; the pro-administration partyunder Mrs Aquino), won 40% of the vote in a field of ten candidates. The Lakascandidate for the vice-presidency, Gloria Macapagal Arroyo, won even moreresoundingly, with 50% support. The coalition backing Mr Estrada won onlyaround 60 of the 208 directly elected seats in the House of Representatives, but asthe party of the presidential incumbent, renamed Laban ng Masang Pilipino(LAMP, Struggle of the Filipino Masses), it attracted enough defections from Lakasto build a large majority in the lower house by end-1998.
The worst fears of a lurch towards populist policies under the self-proclaimed“president for the poor” were not borne out in the first two years of the Estradaadministration as it maintained the macroeconomic targets and liberalisingstance of its predecessor. However, policy formulation and implementationwere often incoherent and unco-ordinated. Cronyism re-emerged on a majorscale, and the president himself was implicated in a stockmarket scandal inJanuary 2000. Although the president boosted his personal popularity bylaunching an all-out attack in March 2000 on Muslim rebels in Mindanao,sentiment in the business community, both foreign and domestic, deterioratedfurther as allegations of corruption by the president came to light. Theseculminated in October 2000 when a disaffected presidential crony claimed thatMr Estrada had been receiving multi-million-peso monthly pay-offs from theproceeds of illegal gambling as well as a slice of government funds for tobaccoindustry support.
On November 13th 2000 the House of Representatives voted through articles ofimpeachment on four counts: bribery, graft and corruption, betrayal of publictrust and culpable violation of the constitution. However, on January 16th 2001pro-Estrada senators won a vote in the Senate rejecting as inadmissibleevidence that could have led to Mr Estrada’s impeachment. The opposition wasnot prepared to accept a de facto acquittal on these terms. Mass streetdemonstrations immediately began, on the pattern of February 1986, and as in1986 civilians and the military came together. The heads of all the armedservices and of the national police joined the call for the president to resign.Besieged in the presidential palace, Mr Estrada agreed to leave the premisesalthough he refused to resign formally. He was deemed by the Supreme Courtto have abandoned the office of president, and Gloria Macapagal Arroyo wassworn in as president on January 20th 2001.
The ouster of Mr Estrada prompted a rebound of confidence among thepolitical and business elite. In May 2001 followers of the deposed presidentattempted to storm the presidential palace after Mr Estrada was arrested on acharge of “economic plunder” a capital offence. The administration secured astrong popular mandate in the congressional election in mid-May 2001, with a
Joseph Estrada is electedpresident by a wide margin
Inefficiency and corruptionlead to Mr Estrada’s ouster
The new governmentgradually gains legitimacy

Philippines 7
© The Economist Intelligence Unit Limited 2004 www.eiu.com Country Profile 2004
sizeable majority in the House of Representatives and a slim, but viable,majority in the Senate. Hopes that Ms Macapagal Arroyo’s first administrationwould achieve rapid progress on economic reform were, however,disappointed, as the government grappled with the ballooning budget deficitinherited from the Estrada government and the security situation in the southof the country remained dire. Ms Macapagal Arroyo has come to relyincreasingly heavily on the US in counter-insurgency activities within thePhilippines. In the wake of the September 11th 2001 terrorist attacks in the US,Abu Sayyaf, an extremist Muslim rebel group in Mindanao (see Political forces)was linked by the US to the al-Qaida terrorist network. This paved the way fora resumption of US military aid, in the form both of hardware and of technicalassistance, agreed in December 2001, and the deployment of US personnel onthe ground from January 2002 in support of the Philippine military’s campaignagainst the rebels.
On December 30th 2002 Ms Macapagal Arroyo announced that she would notrun for a second presidential term. However, many political analysts continuedto expect her to contest the May 10th 2004 presidential election, and she finallyreversed her decision in November 2003. In the final year of her first term inoffice, there was a gradual increase in political instability as pro-Estrada forcesreadied themselves to right what they saw as the wrong of January 2001. InJuly 2003 junior officers mutinied in the Makati financial district of Manila, butthe attempted coup was quickly defeated, and Ms Macapagal Arroyo managedto hold the government together in the run-up to the elections. Her main rivalwas a film star and political novice, Fernando Poe, an associate of Mr Estrada.Mr Poe initially rode high in the opinion polls, but the candidacy of PanfiloLacson, the police chief in Mr Estrada’s administration, split the oppositionvote, allowing Ms Macapagal Arroyo to win re-election by a margin of around1m votes on May 10th. She was sworn in for a fresh six-year term on June 30th,despite the fact that Mr Poe’s supporters continued to contest the legitimacy ofthe result. Ms Macapagal Arroyo can claim some improvement in negotiationswith insurgent rebels both Muslim separatist groups in Mindanao and theCommunist Party of the Philippines and peace talks with a number of groupsare likely to take place in the near future.
Important recent events
March 2000
The government launches a campaign that clears the most active Muslimsecessionist movement at that time, the Moro Islamic Liberation Front (MILF), out ofits bases in Mindanao.
November 2000
The House of Representatives (the lower house) votes to approve the articles ofimpeachment of the president, Joseph Estrada, on charges of bribery and corruption.
January 2001
Mr Estrada is removed from office after mass street demonstrations demanding hisresignation are backed by the military high command. His vice-president, GloriaMacapagal Arroyo, becomes president.
Ms Macapagal Arroyo wins asecond term
8 Philippines
Country Profile 2004 www.eiu.com © The Economist Intelligence Unit Limited 2004
May 2001
Mid-term elections give the administration a comfortable majority in the House ofRepresentatives and a narrow majority in the Senate (the upper house).
August 2001
A ceasefire is agreed with the MILF, as the preliminary to peace negotiations.
January 2002
US forces return to the Philippines to assist the military campaign against a smallextremist Muslim rebel group, Abu Sayyaf.
June 2002
The defection of one senator ends the government’s majority in the upper house.The government regains its majority in July, when opposition senators cross the floorto the government side.
December 2002
Ms Macapagal Arroyo announces that she will not stand for a new term in the 2004presidential election. But speculation continues that she will do so.
May 2003
The Philippines is declared a Major Non-NATO Ally during a visit by Ms MacapagalArroyo to the US. Both countries commit themselves to crushing the Abu Sayyafguerrilla group.
July 2003
An attempted coup by more than 300 junior officers and soldiers in the Makatifinancial district of Manila is crushed, but security-related jitters continue.
November 2003
Fernando Poe, a film star with no political experience, announces his candidacy inthe 2004 presidential election. Ms Macapagal Arroyo reverses her decision not tostand for re-election.
May 2004
Ms Macapagal Arroyo wins re-election and has the support of an enhanced majorityin the Senate.
Constitution, institutions and administration
The constitution introduced in 1987 provides for a single six-year presidentialterm. The president is chief executive, head of state and commander-in-chief.The legislature is bicameral, with a Senate of 24 members elected “at large” (ona nationwide ballot), and a House of Representatives composed of 212members directly elected by district and up to 52 members chosen by partylist. Senators have six-year terms and representatives three-year terms. Thepresident may not abolish Congress, and the presidential veto can beoverridden by a two-thirds majority in the legislature. The judiciary, which isindependent of the executive, rules on the constitutionality of presidentialdecrees. A permanent, independent commission oversees compliance with abill of rights contained in the constitution.
A structure on the US model
Philippines 9
© The Economist Intelligence Unit Limited 2004 www.eiu.com Country Profile 2004
The president selects the members of the cabinet, but, in line with theseparation of powers, they must be from outside Congress. All cabinet appoint-ments require congressional approval, but, once approved, an incumbent canbe removed only by the president. The National Economic DevelopmentAuthority (NEDA), headed ex officio by the planning secretary, co-ordinatespolicy and decisions in all areas relevant to the economic development plan.
The institutional structure is transparent, but its operation is far from open. Thisstems from the deeply entrenched patronage system that pervades Philippinesociety, where a favour granted requires a favour in return. Although this canhave a benign aspect, preserving social stability in the short term, it seriouslyundermines the quality of policy formulation and implementation.
Traditionally, government in the Philippines has been highly centralised.However, the 1987 constitution made provision for the establishment ofautonomous regions in two areas with distinct historical and culturalheritages the Cordillera region of northern Luzon, and Mindanao if the localpopulation voted by referendum for such status. Both autonomous regionshave been established, although the autonomous region in Mindanao is limitedto the five provinces (out of 13) in Mindanao that voted for inclusion. Theautonomous authorities have powers in the areas of personal and propertyrelations, regional and urban planning, education, and economic and socialdevelopment. The Local Government Code of 1991 also devolved some fiscalpowers, in the form of the oversight and control of government spending, tolocal governments.
Political forces
Political parties in the Philippines are based on personalities rather thanideologies. All those represented in Congress support the existing political andsocial structures, espouse a market economy (until it threatens sectoralinterests), and are nationalistic, to varying degrees. There are thus continualshifts in allegiance. The president tends to attract a greater following inCongress than the election results would indicate, at least in the early years ofhis term. In the final years of a presidential term of office the parties tend tosplinter as presidential hopefuls emerge and the president has only limitedpatronage to offer.
After the congressional elections in May 2004 the three major partiesrepresented in Congress were as follows.
The president’s party is Lakas ng Edsa-National Union of Christian Democrats(Lakas), which was formed in 1992 to support the presidential candidacy ofMr Ramos. Its strength in Congress was eroded after the May 1998 election,which brought Joseph Estrada to power, but surged once more in the 2001 mid-term election following Ms Macapagal Arroyo’s assumption of the presidency.Lakas won 91 of 212 directly elected seats in the House of Representatives in theMay 2004 election.
Parties based aroundpersonalities
Lakas
Two autonomous regions

10 Philippines
Country Profile 2004 www.eiu.com © The Economist Intelligence Unit Limited 2004
The Nationalist People’s Coalition (NPC) was originally formed to support thepresidential candidacy of Eduardo Cojuangco (a former Marcos crony) in 1992.In the 1998 election it backed Mr Estrada’s presidential candidacy and was thelargest component of the pro-administration coalition, Laban ng MasangPilipino (LAMP, now defunct). The NPC remained part of the pro-administration coalition led by Lakas under Ms Macapagal Arroyo, and won 58seats in the May 2004 election. Altogether pro-administration parties won 181of the 212 directly elected seats in the May poll.
Laban ng Demokratikong Pilipino (Laban, Struggle for a Democratic Philippines)was formed in 1988 to back the Aquino presidency. After the 1992 election itsposition as the largest party in the House of Representatives soon collapsedowing to defections to the new administration party, Lakas. The party gave itssupport to Mr Estrada in 1998 after its leader, Edgardo Angara, abandoned hisown presidential ambitions to run for the vice-presidency. The LDP is currentlythe largest opposition party in the House of Representatives, although it wononly 15 seats in the May 2004 election.
Outside the mainstream of congressional politics are political forces for whichideology is the determining factor, as follows.
The National Democratic Front (NDF) is the umbrella organisation for theMaoist Communist Party and its military wing, the New People’s Army (NPA).The Philippines has a long tradition of rural rebellion, and the NPA, founded in1969, took up the fight waged by the Hukbalahap rebel movement in Luzon inthe mid-1950s. The NPA expanded rapidly under martial law, the number of itsregulars rising to an estimated 25,000 by mid-1985. It was then thought tocontrol one-fifth of villages and to be active in 60 of the 75 provinces, as well asin the Manila region. Its attachment to the Maoist dogma that revolution mustcome from the countryside meant that it played no role as an organisation inthe overthrow of Mr Marcos. The post-Marcos regimes have eroded its popularbase by offering amnesties, the legalisation of the Communist Party (in late1992), and land and jobs to surrendering rebels, while maintaining an activemilitary campaign. Peace negotiations with the government are intermittentlyunder way, although a full resolution of the NDF insurgency may take sometime to reach.
Another more heavily armed but less cohesive rebel movement is that of theMuslim secessionists in Mindanao. In the past, the main rebel group was theMoro National Liberation Front (MNLF). The Moro Islamic Liberation Front(MILF) has been more active in recent years. The secessionist movement has ahistory stretching back several centuries. There is no easy solution to demandsfor secession or autonomy for Mindanao, since migration from Luzon and theVisayas in the 1950s and 1960s has created a Christian majority or near-parity in a number of provinces in the region.
A referendum on autonomy was held in Mindanao in August 2001, but it failed toproduce an agreement that the whole of Mindanao should come under thecontrol of an autonomous administration. The MILF has taken part in peace talkswith the government, and these are expected to continue, but hardliners within
The NPC
Laban
The NDF rebels
The rebels in Mindanao
Philippines 11
© The Economist Intelligence Unit Limited 2004 www.eiu.com Country Profile 2004
the rebel movement may delay progress towards a peace accord. A more extremegroup, Abu Sayyaf, periodically kidnaps foreigners for ransom and is not open tothe possibility of dialogue with the government.
Another important political force is that represented by the Catholic Church. Itplayed an active part in the civilian opposition to the Marcos regime, andhelped the military rebellion that brought Mrs Aquino to power by bringing thepopulation out on to the streets of Manila in its support. The church also tookthe lead in demands for Mr Estrada’s resignation in the wake of the corruptionallegations in late 2000. The church has given its blessing to the disputedvictory of Ms Macapagal Arroyo in the May 2004 presidential election.
Main political figures
Gloria Macapagal Arroyo
President, brought to power in January 2001 in a civilian coup backed by the military.She had been elected vice-president in May 1998, with more than 50% of the vote. Shecompleted the presidential term of the ousted president, Joseph Estrada, and wonre-election in her own right in May 2004. Ms Macapagal Arroyo’s first term wasdisappointing in terms of economic reform. Her supporters hope that she will movemore determinedly to implement a reform agenda over the next six years.
Noli de Castro
Elected as vice-president in May 2004. Despite having served as a senator, Mr deCastro is a former TV broadcaster, and this constituted his chief appeal to theelectorate.
Fidel Ramos
A former president and retired general, Mr Ramos continues to play the role of elderstatesman. His influence may be crucial in encouraging the new administration toimplement its reform agenda.
Joseph Estrada
The former president, elected in May 1998 for a six-year term with strong popularbacking. Deposed in January 2001 after the collapse of his impeachment trial inthe Senate, he remains under arrest on charges of perjury and economic plunder.
Fernando Poe
A film star and associate of Mr Estrada, Mr Poe failed to win the presidency inMay 2004 and continues to dispute the result.
Raul Roco
A former education secretary, Mr Roco topped opinion polls at one stage in therecent presidential election campaign. Concerns over his health and a lack of financeled his campaign to collapse in the spring. He came fourth in the poll.
Panfilo Lacson
A former police chief in the Estrada administration, Mr Lacson insisted on mountinga separate presidential bid to that of Mr Poe, thus splitting the opposition vote andhanding victory to Ms Macapagal Arroyo. Mr Lacson is surrounded by accusations
The Catholic Church
12 Philippines
Country Profile 2004 www.eiu.com © The Economist Intelligence Unit Limited 2004
that the Presidential Anti-Crime Commission murdered 11 criminals while heheaded it.
Organised labour has little power in the Philippines. Only around one in fiveworkers was a member of a trade union in the late 1990s, although the ratewas significantly higher in multinational firms, where union membership wasaround one in three. A tiny proportion (only 4% of the 11.8m salaried workersin the mid-1990s) were covered by collective-bargaining agreements. Thisreflects the weak bargaining position of workers in a labour-surplus economy.
International relations and defence
A continuing foreign policy priority has been the strengthening of relationswith fellow members of the Association of South-East Asian Nations, orASEAN (see Regional overview: Membership of organisations). Membershipof this organisation gives the Philippines a regional identity independent ofrelations with the US. Another priority for the Philippine government isparticipation in a regional force to counterbalance China, which is seen as athreat, notably in the dispute over the Spratly Islands in the South China Sea.
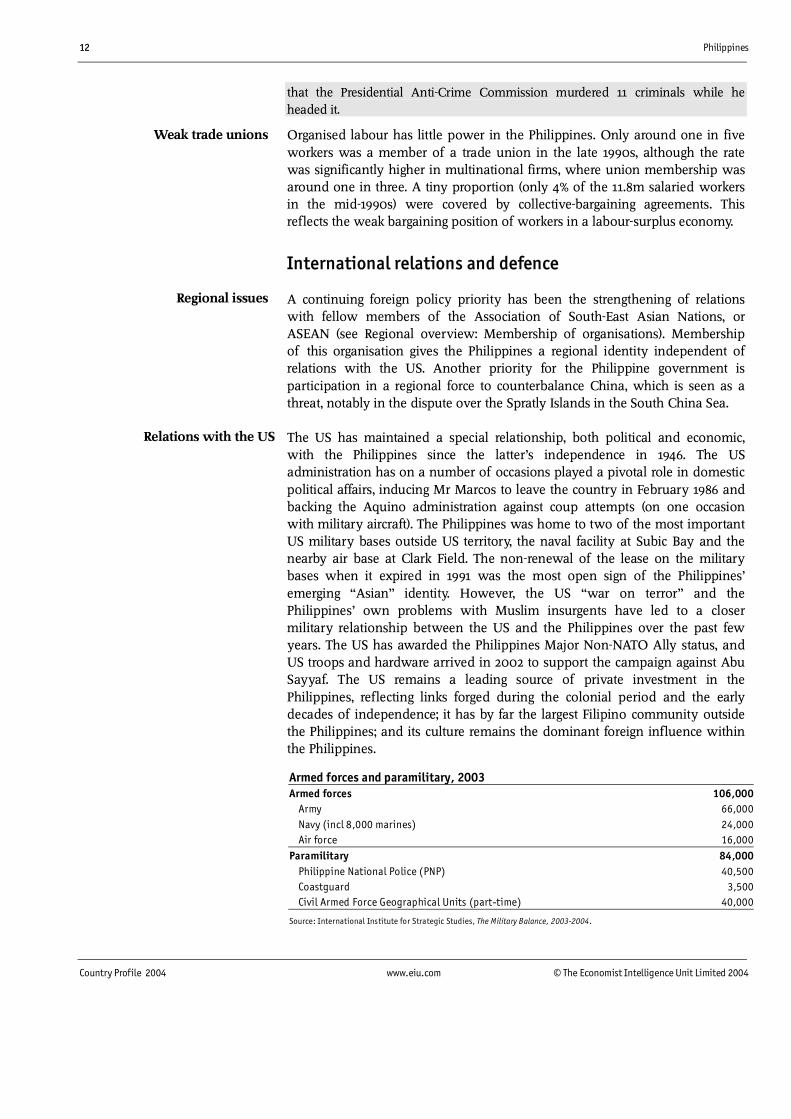
The US has maintained a special relationship, both political and economic,with the Philippines since the latter’s independence in 1946. The USadministration has on a number of occasions played a pivotal role in domesticpolitical affairs, inducing Mr Marcos to leave the country in February 1986 andbacking the Aquino administration against coup attempts (on one occasionwith military aircraft). The Philippines was home to two of the most importantUS military bases outside US territory, the naval facility at Subic Bay and thenearby air base at Clark Field. The non-renewal of the lease on the militarybases when it expired in 1991 was the most open sign of the Philippines’emerging “Asian” identity. However, the US “war on terror” and thePhilippines’ own problems with Muslim insurgents have led to a closermilitary relationship between the US and the Philippines over the past fewyears. The US has awarded the Philippines Major Non-NATO Ally status, andUS troops and hardware arrived in 2002 to support the campaign against AbuSayyaf. The US remains a leading source of private investment in thePhilippines, reflecting links forged during the colonial period and the earlydecades of independence; it has by far the largest Filipino community outsidethe Philippines; and its culture remains the dominant foreign influence withinthe Philippines.
Armed forces and paramilitary, 2003Armed forces 106,000 Army 66,000 Navy (incl 8,000 marines) 24,000 Air force 16,000Paramilitary 84,000 Philippine National Police (PNP) 40,500 Coastguard 3,500 Civil Armed Force Geographical Units (part-time) 40,000
Source: International Institute for Strategic Studies, The Military Balance, 2003-2004.
Weak trade unions
Relations with the US
Regional issues

Philippines 13
© The Economist Intelligence Unit Limited 2004 www.eiu.com Country Profile 2004
Security risk in the Philippines
I. Armed conflict
Armed conflict is a regular and disturbing feature of the domestic political scene inthe Philippines. Over the years, several groups of armed rebels have been active inthe large southern island of Mindanao, seeking the creation of an independent stateon the island. The two principal secessionist movements are the Moro NationalLiberation Front (MNLF) and the Moro Islamic Liberation Front (MILF). (Moro is theterm traditionally used to describe the Muslim population of the southern islands ofthe Philippines.) The Philippine military has been battling with the rebels for nearlythree decades, although a peace agreement was signed with the MNLF in 1996. Aseparate ceasefire was reached with the MILF in August 2001, but armed conflict hascontinued. Negotiations for a permanent settlement are likely to be resumed at somepoint in the near future.In 2003 the military also found itself in pitched battles with yet another Mindanaorebel group, Abu Sayyaf. A small extremist Islamist organisation, Abu Sayyaf claimsto be fighting for an independent Muslim state, but in fact appears more interested inkidnapping tourists and local residents for ransom. Abu Sayyaf is famously brutal:more than a few of its kidnap victims have been beheaded. Some members of thegroup have reportedly been trained at camps in Afghanistan run by Osama binLaden’s al-Qaida terrorist network. The Philippine military intensified its campaignagainst Abu Sayyaf after an American tourist was killed in mid-2001, and thecampaign has received backing in the form of both hardware and personnel fromthe US as part of its “war on terrorism”. This involvement has enhanced thePhilippine military’s ability to flush out Abu Sayyaf in the difficult terrain of therebel group’s island base, Basilan, but could be counterproductive if it is perceived asanti-Muslim and so provokes terrorist acts in other parts of Mindanao. This area ofthe Philippines is clearly unsafe, for foreigners as well as local residents.It is important to note, however, that the Muslim insurgency is far removed from thepolitical and business centre of Manila. Investors who avoid the disputed regions areunlikely to be affected significantly by the secessionist movements and the military’sattempts to subdue them.The challenge from the communist guerrilla movement, the New People’s Army(NPA), is much reduced but not defunct. The NPA’s activities are essentially confinedto attacking the security forces and local political leaders, but are more widelyspread, notably in Luzon, and thus are closer to the country’s economic hub. As withthe MILF, peace negotiations with the NPA are likely to be resumed in the nearfuture.Externally, the Philippines faces no serious threat. The government maintains itsterritorial claim to some of the Spratly Islands, and occasionally has minorconfrontations with China over the presence of shipping in the area and the buildingof semi-permanent structures. However, there is little chance of armed conflictbetween the two countries.
II. Civil unrest
Large public demonstrations in the Philippines are commonplace; indeed, thecountry’s so-called People’s Power movement has brought down two governmentsin the past 15 years, most recently in January 2001. Such protests are not particularlyviolent, but are disruptive to the normal functioning of business in the capital.

14 Philippines
Country Profile 2004 www.eiu.com © The Economist Intelligence Unit Limited 2004
Violence is not, however, uncommon. The run-up to the May 2004 presidential andcongressional elections was characterised by protests and a total of around 150election-related deaths. Supporters of Fernando Poe, the film star who failed in hisbid for the presidency in May, may continue to protest in the streets. Protests overeconomic issues are common, and demonstrations against the US military presencein support of the campaign against Abu Sayyaf are also likely to persist until thewithdrawal of US troops.
III. Crime
Street crime is a serious problem in the Philippines, particularly in metropolitanManila. According to official statistics, incidents of serious crime in 2002 were 107.8 per100,000 population (a rate of 25 or less per 100,000 is considered low). This was wellbelow the recorded peak of 313.6 per 100,000 in 1984, but higher than the rate of 98.8per 100,000 in 2001. The authorities acknowledge that 18 murders, on average, arecommitted in the country every day. Kidnappings, rapes and drug-related crimes arealso frequent. The high level of crime is a major reason why foreign investors shun thePhilippines, and is a factor in the fall in tourist visits in recent years from the peak of2.2m in 1999. The problem is made worse by the apparent complicity of some policeofficials in criminal enterprises.
IV. Organised crime
Violent drug-trafficking organisations are well established in the Philippines, and thenarcotic trade is massive. The huge sums to be earned in the drug trade attractpoliticians, law enforcement officials and leading business figures, and undermineattempts to reduce official corruption. A leading opposition senator has beenaccused of having co-operated with one of the drug gangs while he headed thenational police, and of ordering the murder of several Chinese nationals who fellfoul of the group. The government has created a new National Anti-CrimeCommission and has designated an “anti-crime czar”, but they have had fewsuccesses so far. Organised crime is not confined to drugs, however; it alsoencompasses gambling, prostitution, kidnapping, smuggling and extortion.Organised criminal gangs are believed to launder money through a network of localbanks. The Philippines has been cited by the Financial Action Task Force (FATF) of theGroup of Seven as “non-co-operative” in anti-money-laundering efforts. Legislationagainst money-laundering was introduced in 2003, but the Philippines remains on theFATF’s blacklist.
V. Kidnapping
Kidnapping is rampant in the Philippines, and is carried out by a wide range ofgroups: Islamist insurgents in the southern islands, sophisticated drug gangsthroughout the country and smaller groups of bandits. It is a major concern forcompanies in the Philippines, including foreign firms, and the affluent Chinesebusiness community has been a prime target. In addition, Abu Sayyaf, the notoriousMuslim secessionist group based on the southern island of Basilan, has kidnappeddozens of local residents and tourists, ostensibly for political reasons. When ransomsare not forthcoming, Abu Sayyaf, like other kidnap gangs, has been prepared to carryout its threat to execute hostages. It is widely suspected locally that members of thesecurity forces co-operate with kidnap gangs to extort ransoms. In late 2003Ms Macapagal Arroyo lifted a moratorium on the use of the death penalty, followingthe kidnapping and murder of an executive with a US soft-drinks firm, Coca Cola.
Philippines 15
© The Economist Intelligence Unit Limited 2004 www.eiu.com Country Profile 2004
However, no executions have taken place since Ms Macapagal Arroyo cameto power.
VI. Terrorism
Terrorism is a serious concern, although it is mainly confined to the southern islands.Abu Sayyaf carries out bombings, kidnappings and murders that clearly qualify asterrorist acts. The group is included on the US State Department’s list of knownterrorist organisations. Abu Sayyaf claims that some of its members have beentrained by the al-Qaida network in Afghanistan, although Abu Sayyaf seemsmotivated less by religious or political fervour than by financial gain from itskidnappings. The southern Philippines, nonetheless, is now widely regarded as asignificant breeding ground for terrorists, with its large population of alienated,impoverished Muslim youth.
Resources and infrastructure
Population
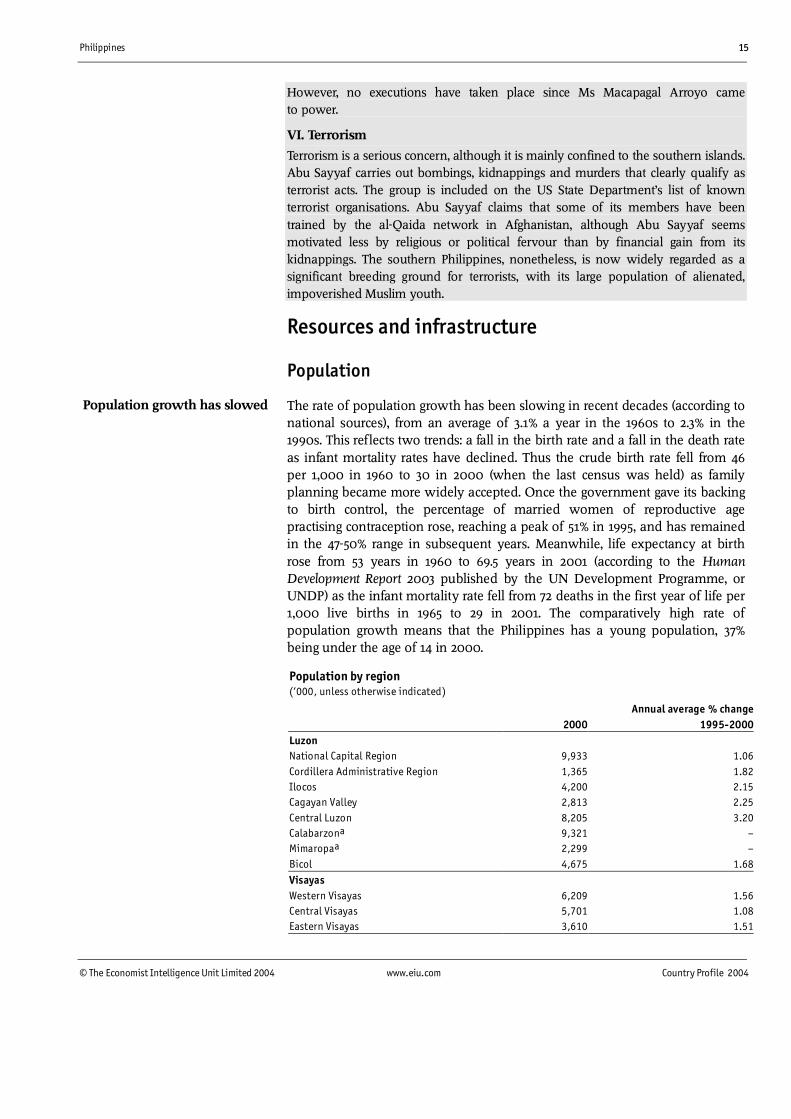
The rate of population growth has been slowing in recent decades (according tonational sources), from an average of 3.1% a year in the 1960s to 2.3% in the1990s. This reflects two trends: a fall in the birth rate and a fall in the death rateas infant mortality rates have declined. Thus the crude birth rate fell from 46per 1,000 in 1960 to 30 in 2000 (when the last census was held) as familyplanning became more widely accepted. Once the government gave its backingto birth control, the percentage of married women of reproductive agepractising contraception rose, reaching a peak of 51% in 1995, and has remainedin the 47-50% range in subsequent years. Meanwhile, life expectancy at birthrose from 53 years in 1960 to 69.5 years in 2001 (according to the HumanDevelopment Report 2003 published by the UN Development Programme, orUNDP) as the infant mortality rate fell from 72 deaths in the first year of life per1,000 live births in 1965 to 29 in 2001. The comparatively high rate ofpopulation growth means that the Philippines has a young population, 37%being under the age of 14 in 2000.
Population by region(‘000, unless otherwise indicated)
Annual average % change2000 1995-2000
LuzonNational Capital Region 9,933 1.06Cordillera Administrative Region 1,365 1.82Ilocos 4,200 2.15Cagayan Valley 2,813 2.25Central Luzon 8,205 3.20Calabarzona 9,321 –Mimaropaa 2,299 –Bicol 4,675 1.68VisayasWestern Visayas 6,209 1.56Central Visayas 5,701 1.08Eastern Visayas 3,610 1.51
Population growth has slowed
16 Philippines
Country Profile 2004 www.eiu.com © The Economist Intelligence Unit Limited 2004
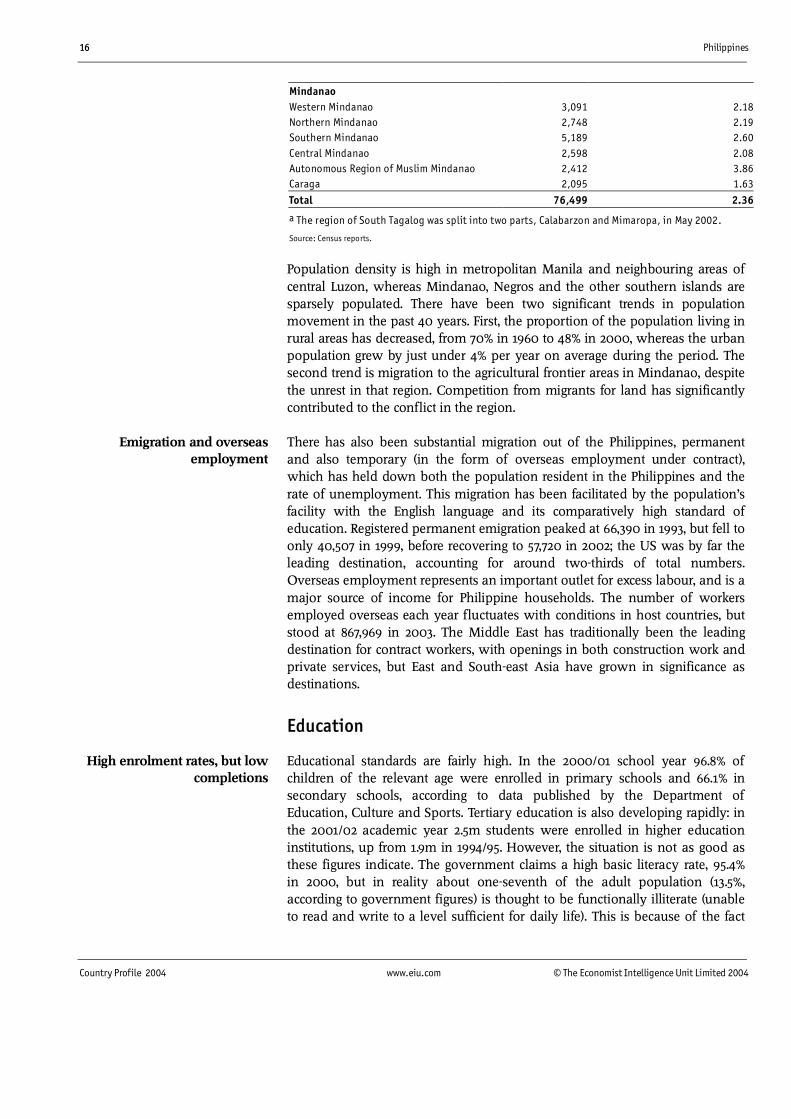
MindanaoWestern Mindanao 3,091 2.18Northern Mindanao 2,748 2.19Southern Mindanao 5,189 2.60Central Mindanao 2,598 2.08Autonomous Region of Muslim Mindanao 2,412 3.86Caraga 2,095 1.63
Total 76,499 2.36
a The region of South Tagalog was split into two parts, Calabarzon and Mimaropa, in May 2002.
Source: Census reports.
Population density is high in metropolitan Manila and neighbouring areas ofcentral Luzon, whereas Mindanao, Negros and the other southern islands aresparsely populated. There have been two significant trends in populationmovement in the past 40 years. First, the proportion of the population living inrural areas has decreased, from 70% in 1960 to 48% in 2000, whereas the urbanpopulation grew by just under 4% per year on average during the period. Thesecond trend is migration to the agricultural frontier areas in Mindanao, despitethe unrest in that region. Competition from migrants for land has significantlycontributed to the conflict in the region.
There has also been substantial migration out of the Philippines, permanentand also temporary (in the form of overseas employment under contract),which has held down both the population resident in the Philippines and therate of unemployment. This migration has been facilitated by the population’sfacility with the English language and its comparatively high standard ofeducation. Registered permanent emigration peaked at 66,390 in 1993, but fell toonly 40,507 in 1999, before recovering to 57,720 in 2002; the US was by far theleading destination, accounting for around two-thirds of total numbers.Overseas employment represents an important outlet for excess labour, and is amajor source of income for Philippine households. The number of workersemployed overseas each year fluctuates with conditions in host countries, butstood at 867,969 in 2003. The Middle East has traditionally been the leadingdestination for contract workers, with openings in both construction work andprivate services, but East and South-east Asia have grown in significance asdestinations.
Education
Educational standards are fairly high. In the 2000/01 school year 96.8% ofchildren of the relevant age were enrolled in primary schools and 66.1% insecondary schools, according to data published by the Department ofEducation, Culture and Sports. Tertiary education is also developing rapidly: inthe 2001/02 academic year 2.5m students were enrolled in higher educationinstitutions, up from 1.9m in 1994/95. However, the situation is not as good asthese figures indicate. The government claims a high basic literacy rate, 95.4%in 2000, but in reality about one-seventh of the adult population (13.5%,according to government figures) is thought to be functionally illiterate (unableto read and write to a level sufficient for daily life). This is because of the fact
Emigration and overseasemployment
High enrolment rates, but lowcompletions
Philippines 17
© The Economist Intelligence Unit Limited 2004 www.eiu.com Country Profile 2004
that, although there has been near-universal enrolment at primary-school levelfor more than two decades, the high drop-out rate means that one-third of allpupils do not complete their primary-level education. A similar proportion ofsecondary school students fail to complete secondary-level education.
The national figures also conceal the familiar disparity between Manila and thepoorer provinces: in Manila, the cohort survival rate (pupils completing theirschooling as a proportion of the total intake) in elementary schools was morethan 79%, compared with less than 34% in the Autonomous Region of MuslimMindanao. Overall educational standards have come under pressure owing tounderinvestment, as the sector has fallen victim to the squeeze on governmentspending. The situation in primary education has been compounded by the fallin the state’s proportional contribution to primary-education costs, whereas thestate’s contribution to tertiary education has risen.
Health
Healthcare provision is inadequate. UNDP data show that the Philippines hadonly 124 doctors per 100,000 people in 1990-2002. To some extent, as in thecase of education, this reflects budgetary constraints. Spending on public healthin the Philippines was equivalent to only 1.5% of GDP in 2000, with a further1.8% of GDP spent on private healthcare. However, the situation is exacerbatedby the skewed geographical distribution of health facilities. A disproportionatenumber of doctors are located in the National Capital Region, and the poorroad infrastructure in the rural areas of the poorer provinces limits the access ofa large section of the population to such facilities as do exist.
Natural resources and the environment
The Philippines is one of the largest island groups in the world, numberingmore than 7,100 islands and extending 1,851 km north to south and 1,107 kmeast to west. The topography is varied and includes two mountain ranges inLuzon and several volcanoes, 21 of them active.
The climate is tropical, with some variation in the extent and duration of thedry season. In the western parts of Luzon, Mindoro, Negros and Palawan (thewestern rim) there are two pronounced seasons: dry from November to Apriland wet for the rest of the year. Other regions have rainfall more or less evenlydistributed throughout the year. All are exposed to typhoons, which occur mostfrequently across the middle latitudes of the country. Southern Mindanao isalmost typhoon-free.
The area under crops expanded markedly in the 1970s and reached 12.3m ha in1979/80, mainly as a result of the clearing of virgin forest, particularly inMindanao, where more than one-half of the commercial acreage is located.Bureau of Agricultural Statistics data show that the national cropland area hadrisen to 12.8m has by 2002, but land availability is now a serious constraint inLuzon and some parts of the Visayas. Forests were in the past one of thePhilippines’ main resources, but they have been rapidly depleted (see Economicsectors: Agriculture, forestry and fishing).
Healthcare is substandard
A large island group

18 Philippines
Country Profile 2004 www.eiu.com © The Economist Intelligence Unit Limited 2004
The Philippines has extensive fishing resources, both marine and inland, with thelargest area of developed estuarine fishponds in South-east Asia and an exclusivefishing zone of 1.9m sq km. Although neither freshwater fishponds nor most of themarine waters have been fully developed, the productivity of some resources hasbeen deteriorating as rising demand and the use of destructive methods ofexploitation has resulted in overfishing. Few coral reefs remain in good condition,and the mangrove area has halved since the late 1970s.
Mineral resources are widely scattered throughout the islands, but aroundone-quarter of the land area has not been surveyed. At end-1996 there wereestimated reserves of 4.8m tonnes of copper, 1.1m tonnes of nickel, 36,667tonnes of chromite, 226,852 tonnes of gold and 484,696 tonnes of iron. Thepicture is mixed for energy resources. There are large deposits of coal andlignite, with proven reserves of 369m tonnes, of which close to 40% are onSemirara Island, and potential reserves are estimated at 1.6bn tonnes.Commercial deposits of oil off Palawan Island are small and have provedtechnically difficult to exploit and operate. Reserves of gas in the Malampayafield in the same region are substantial, estimated at 2.8trn-3.5trn cu ft (othergas reserves are estimated at 1.8trn cu ft), and are now being exploited.Geothermal resources are large and, as yet, not fully developed.
The Philippines is at significant risk from tropical storms, which can severelydisrupt business operations; an average of around 20 storms hit the countryeach year. Typically, they are more frequent and severe in the northern islands.Volcanic eruptions can be extremely disruptive: the eruption of MountPinatubo in 1991 caused massive damage to a wide area of Luzon north of thecapital and closed Manila airport for a period.
Transport, communications and the Internet
The transport infrastructure is inadequate, having suffered from decades ofunderinvestment. In the liberalised investment environment established by theadministration of the former president, Fidel Ramos, during the 1990s some ofthe most serious shortcomings have begun to be tackled, but development hasbeen concentrated in economic hubs.
The system is essentially bimodal, roads carrying 60% of freight and 80% ofpassenger traffic, and water 40% of freight and 10% of passenger traffic. Airtransport is oriented towards carrying passengers on long-distance inter-islandtravel. The rail network is minimal.
The road network covered 201,834 km at end-2000, of which two-thirds werefeeder and village roads. Less than one-half of the network is all-weather, animportant consideration in view of the climate, and only 21% of all roads arepaved with concrete or asphalt. The condition of the feeder roads is generallypoor, the result of substandard construction, inadequate maintenance and useby overloaded vehicles. Bridges are often weak, if not altogether absent, andsome remote areas have few access roads. Current projects provide for theimprovement of roads in Luzon, including the rehabilitation and modernisation
Fishing
Risk from natural disasters
Minerals
Transport
Philippines 19
© The Economist Intelligence Unit Limited 2004 www.eiu.com Country Profile 2004
of the North Luzon highway, much of which is now open to traffic, with theproject as a whole due for completion in February 2005. This work is beingcarried out under build-operate-transfer (BOT) terms, bringing in private capitaland expertise.
The railway network is being gradually extended. The single-line track in theBicol-Manila-La Union corridor in Luzon is in urgent need of rehabilitation, asonly one-fifth of the track is in operation. In addition, there is a modern,elevated rail system in Manila, which is currently being expanded within themetropolitan area.
Given the geography of the Philippines, shipping services and port facilities areof critical importance. In all there are nearly 1,500 ports in operation, but sixManila, Cebu, Iloilo, Cagayan de Oro, Zamboanga and Davao handle over 80%of public port traffic. The inter-island fleet is old, safety regulations are poor andmaritime navigational aids, in particular lighthouses, are inadequate.
There are 87 national airports, of which three Manila, Cebu and GeneralSantos are international. The provision of domestic services has beenimproving as the aviation sector has been liberalised and new airlines haveentered operation. However, after excessive capital spending resulted in afinancial crisis at the privatised national carrier, Philippine Airlines (PAL), in1998, the domestic route network was sharply cut back.
The telecommunications system used to be inadequate and unreliable, andtelephone density stood at only 1 per 100 people in the mid-1980s. Thederegulation of the sector in 1993 transformed the situation. Presidential decreesmandated interconnections between networks and required that internationalgateway operators and mobile telephone companies install telephone systemsin urban and rural areas. The changes ended the monopoly enjoyed by thePhilippine Long Distance Telephone Company (PLDT). As PLDT installed newlines and other operators entered the field, telephone density rose, reaching9.1 per 100 people in 1998 according to the National TelecommunicationsCommission. However, many installed lines are not in use fixed-line densityfell to 8.7 per 100 people in 2002 owing to the vibrancy of the mobile phonemarket. Mobile phone ownership has been expanding rapidly in recent years,with 18m subscribers in June 2003.
There were an estimated 4.1m Internet users in 2002, but ownership ofpersonal computers is limited to wealthy urban households and is estimated atonly 1.7% of the population. The e-commerce market in the Philippines istherefore tiny, estimated at only US$2m-3m in 2000. Although the passage ofthe Electronic Commerce Act in July 2000 should enhance growth in thissector, lax enforcement and the inadequacy of protection for intellectualproperty rights remain severe constraints.
Under the Marcos regime the mass media, with the exception of a few small-circulation and often short-lived newspapers, were controlled by interests closeto the president, and press censorship was exercised by the government. Nowthat the sector has opened up again there is a multiplicity of newspapers 475in 2000 and the Philippine press is a byword for freewheeling comment and
Communications

20 Philippines
Country Profile 2004 www.eiu.com © The Economist Intelligence Unit Limited 2004
speculation. There were 599 broadcasting radio stations in 2000, bothcommercial and non-commercial, of which 270 broadcast on AM wavebandsand 329 on FM. There were 108 television broadcast stations in 2000, of which13 were based in the Metro Manila region.
Energy provision
The Philippines depends to a fairly high degree on foreign energy sources, butsince the oil price rises of the 1970s the government has sought to bring downthe deficit in national supply. The contribution of domestic energy sources hasbeen rising, reflecting investment in geothermal and hydroelectric capacity andthe availability of a wider range of non-conventional sources. This trend wasreinforced with the start-up of gas production from the Malampaya reserves,off Palawan, in October 2001. Domestic oil is not expected to make a significantcontribution, and domestic coal production will continue to be supplementedby imports.
Power generation was previously a state preserve, but the private sector hasbeen brought in over the past decade to remedy shortfalls in supply and capital.When Mr Ramos became president in 1992 the Luzon grid (on which Maniladepends) had a supply deficit of 1,000 mw. This was because a plan for620 mw in nuclear capacity to come on stream in 1986 had lapsed. The newgovernment launched a fast-track programme of electricity expansion, whicheliminated the power shortage by end-1993. At end-1999 power-generatingcapacity was 12,341 mw, up from 6,949 mw at end-1992. Much of the increasecame from plants built under BOT contracts, and the use of such arrangements,as well as of build-own-operate agreements, has become common, being usedalso for the development of capacity that utilises gas from the Malampaya field.The greatest long-term potential for expansion in power-generation capacity liesin geothermal energy. Geothermal power generation on a commercial scalebegan in 1979, and capacity in 2000, at 1,931 mw, was second only to that of theUS. The latest development plan of the Department of Energy envisagesadditional capacity of 990 mw by 2011.
The liberalisation of the energy sector took another, more far-reaching, stepforward in 2001 with the passage of legislation to privatise the state-ownedutility, the National Power Corporation (Napocor). Even so, attempts to sell offNapocor have stumbled, and a major policy challenge for the new governmentelected in May 2004 is to make progress on the sell-off of both generating andtransmission assets.
Energy supply and usage
Philippines 21
© The Economist Intelligence Unit Limited 2004 www.eiu.com Country Profile 2004
The economy
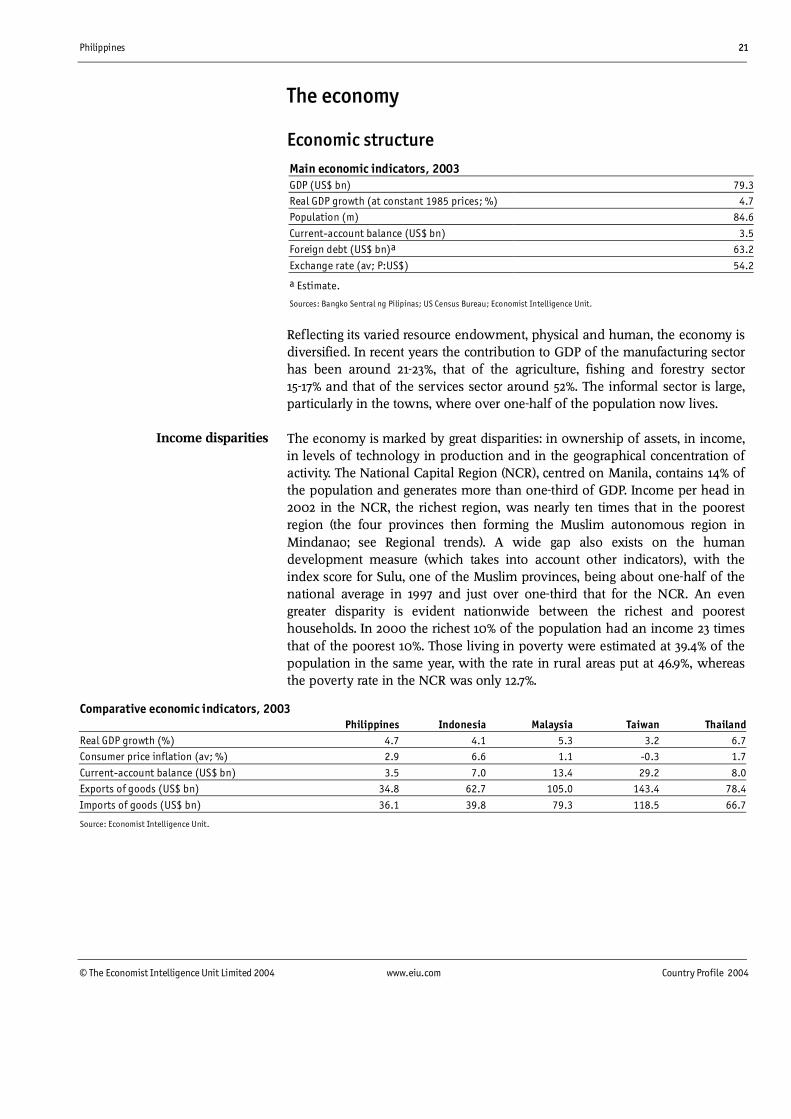
Economic structureMain economic indicators, 2003GDP (US$ bn) 79.3Real GDP growth (at constant 1985 prices; %) 4.7Population (m) 84.6
Current-account balance (US$ bn) 3.5Foreign debt (US$ bn)a 63.2
Exchange rate (av; P:US$) 54.2
a Estimate.
Sources: Bangko Sentral ng Pilipinas; US Census Bureau; Economist Intelligence Unit.
Reflecting its varied resource endowment, physical and human, the economy isdiversified. In recent years the contribution to GDP of the manufacturing sectorhas been around 21-23%, that of the agriculture, fishing and forestry sector15-17% and that of the services sector around 52%. The informal sector is large,particularly in the towns, where over one-half of the population now lives.
The economy is marked by great disparities: in ownership of assets, in income,in levels of technology in production and in the geographical concentration ofactivity. The National Capital Region (NCR), centred on Manila, contains 14% ofthe population and generates more than one-third of GDP. Income per head in2002 in the NCR, the richest region, was nearly ten times that in the poorestregion (the four provinces then forming the Muslim autonomous region inMindanao; see Regional trends). A wide gap also exists on the humandevelopment measure (which takes into account other indicators), with theindex score for Sulu, one of the Muslim provinces, being about one-half of thenational average in 1997 and just over one-third that for the NCR. An evengreater disparity is evident nationwide between the richest and pooresthouseholds. In 2000 the richest 10% of the population had an income 23 timesthat of the poorest 10%. Those living in poverty were estimated at 39.4% of thepopulation in the same year, with the rate in rural areas put at 46.9%, whereasthe poverty rate in the NCR was only 12.7%.
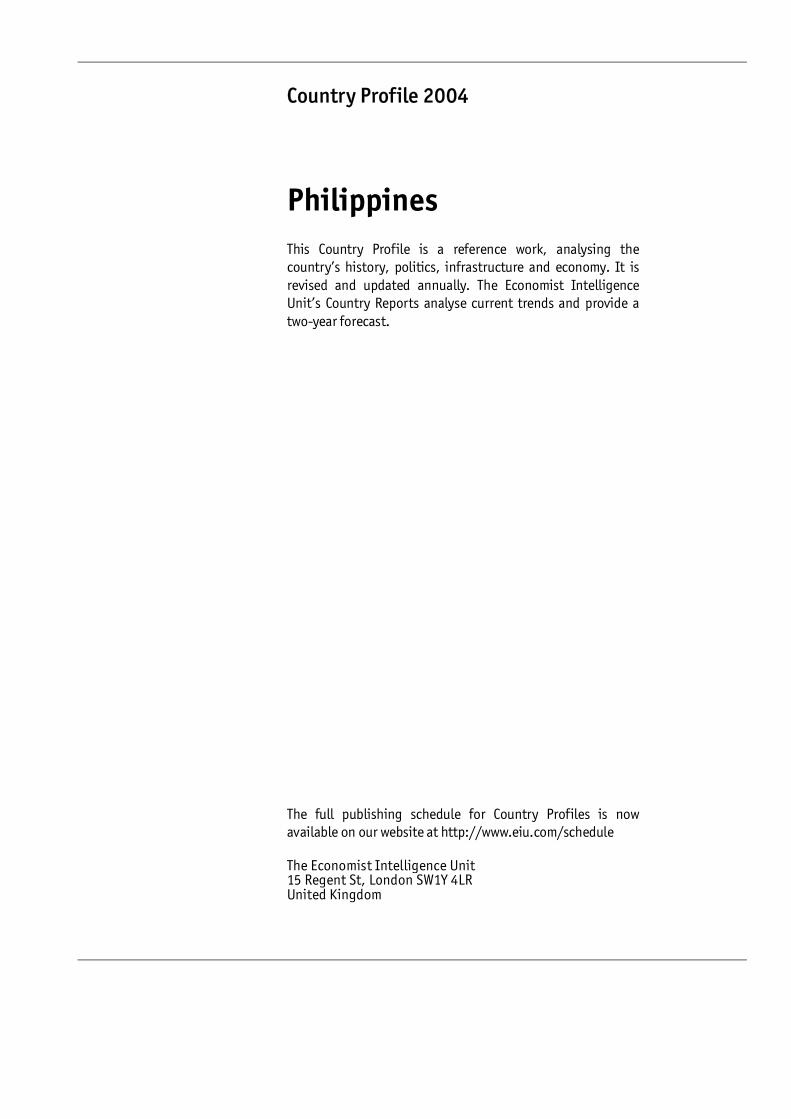
Comparative economic indicators, 2003Philippines Indonesia Malaysia Taiwan Thailand
Real GDP growth (%) 4.7 4.1 5.3 3.2 6.7Consumer price inflation (av; %) 2.9 6.6 1.1 -0.3 1.7
Current-account balance (US$ bn) 3.5 7.0 13.4 29.2 8.0Exports of goods (US$ bn) 34.8 62.7 105.0 143.4 78.4
Imports of goods (US$ bn) 36.1 39.8 79.3 118.5 66.7
Source: Economist Intelligence Unit.
Income disparities

22 Philippines
Country Profile 2004 www.eiu.com © The Economist Intelligence Unit Limited 2004
Economic policy
The major economic policy requirement in the Philippines is to raise the levelof budget revenue on a sustainable basis. The low ratio of tax revenue to GDParound 15% in most years has meant that the government has never investedadequately in physical and social infrastructure, generating serious bottlenecksin mobilising the Philippines’ considerable resources. The situation has beenexacerbated by the primacy accorded to achieving fiscal equilibrium, with thespending side bearing the burden of making up revenue shortfalls.
Progress was made under the presidency of Fidel Ramos from 1992 to 1998,with a small surplus registered each year in 1994-97. A complex of factorscontributed. Capital outgoings could be held down as private-sector capital wasbrought in under build-operate-transfer (BOT) contracts, initially to remedy thecritical power shortage in Luzon and subsequently to fund road and commuterrail projects. Income was boosted by the sale of government assets, bothcorporate and physical, which yielded a total of P68.7bn (US$2.5bn) in 1993-96,representing 5% of budget revenue for the period. A new feature in 1996 wasthe achievement of a small surplus before privatisation proceeds, which owedmuch to the fact that interest payments the largest single expenditure itemhad been eroded by the fall in the government’s debt stock. However, the mostsignificant progress made on the fiscal front during Mr Ramos’s presidency wasthe strengthening of the tax base. Value-added tax (VAT) was extended in 1996,while a comprehensive tax reform package, approved in two stages in 1996 and1997, tackled a range of defects in the tax structure. The reforms simplified thesystem of personal and corporate tax, raising thresholds for the former andreducing the range of allowances in both, and rebased the excise system froman ad valorem to a specific levy system. The underlying aim was to reduce boththe scope and the incentive for corruption and evasion, and thereby to increasethe tax take.
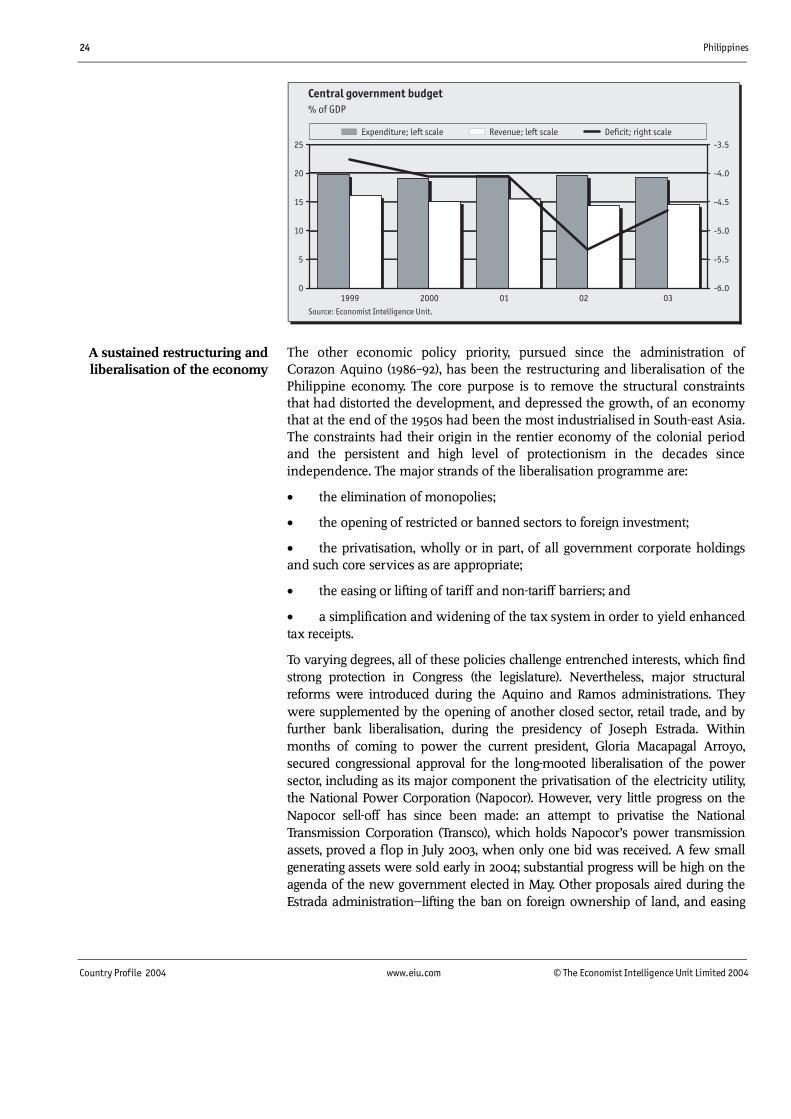
The progress achieved in the Ramos years proved short-lived. After a steadynarrowing of the surplus, the budget was back in the red in 1998 to the tune ofP50bn. The deficit more than doubled in 1999, and rose again in both 2000 and2001. A record deficit of P211bn was recorded in 2002, with a minor decrease in2003 leaving the fiscal deficit at a still high 4.6% of GDP. The reason for thereversal was the onset of the Asian economic crisis in 1997. This had animmediate and severe impact on the budget. The depreciation of the peso andthe steep rise in interest rates pushed up the cost of servicing the government’sdebt, at the same time that the slowing of economic growth and the onset ofrecession in 1998 hit tax revenue. Hence GDP growth in 1999 was slower, andmore fitful, than expected, with the result that internal tax receipts were wellbelow expectations. Despite some trimming on the expenditure side, the deficitfar exceeded the target, at P111.7bn.
However, the deterioration cannot all be attributed to poorer GDP results.Economic growth in 2000 was close to the revised official forecast, yet thedeficit of P134.2bn (4% of GDP) was double the target. The results in 2000 werepartly caused by worsening investor sentiment as the political situation
The fiscal priority: enhancingrevenue
A major deterioration by theend of the decade
Progress in the mid-1990s
Philippines 23
© The Economist Intelligence Unit Limited 2004 www.eiu.com Country Profile 2004
deteriorated; the government’s privatisation proceeds fell P19bn short of theP22bn target. Moreover, the sharp fall in the peso in October, and the steep risein interest rates aimed at containing the fall, greatly boosted interest outgoingson government debt. The most serious deterioration was in the proceeds of theBureau of Internal Revenue (BIR), which were P43bn below the revised targetand up by only 4.3% compared with 1999, when domestic demand growth wasconsiderably slower. As a result, and despite better than forecast results fromcustoms receipts in both 1999 and 2000, the tax ratio fell from 15.6% of GDP in1998 to 14.9% in 1999 and 13.6% in 2000.
Setting aside the issue of large-scale tax evasion by well-placed individuals, theessential problem lies in the system itself. The comprehensive tax reformintroduced under Mr Ramos has not produced an increase in revenue as apercentage of GDP. A study by the IMF in late 2000 showed that the reform hasbeen broadly revenue-neutral; proceeds from VAT had in fact fallen as apercentage of GDP since 1994 because of the exemptions introduced. A studyby a Philippine think-tank has claimed that tax evasion on personal income taxhas worsened under the simplified structure. It is widely recognised that thesolution lies not in new levies but in improving tax compliance by tighteningup on tax administration and reducing the opportunities for corruption. It wasin part through a reinforced collection effort, aided by a tax amnesty scheme,that the budget deficit in 2001 was held close to the target of P145bn, coming inat P147bn. However, the ratio of the budget deficit to GDP fell only marginally,from 4.1% in 2000 to 4% in 2001.
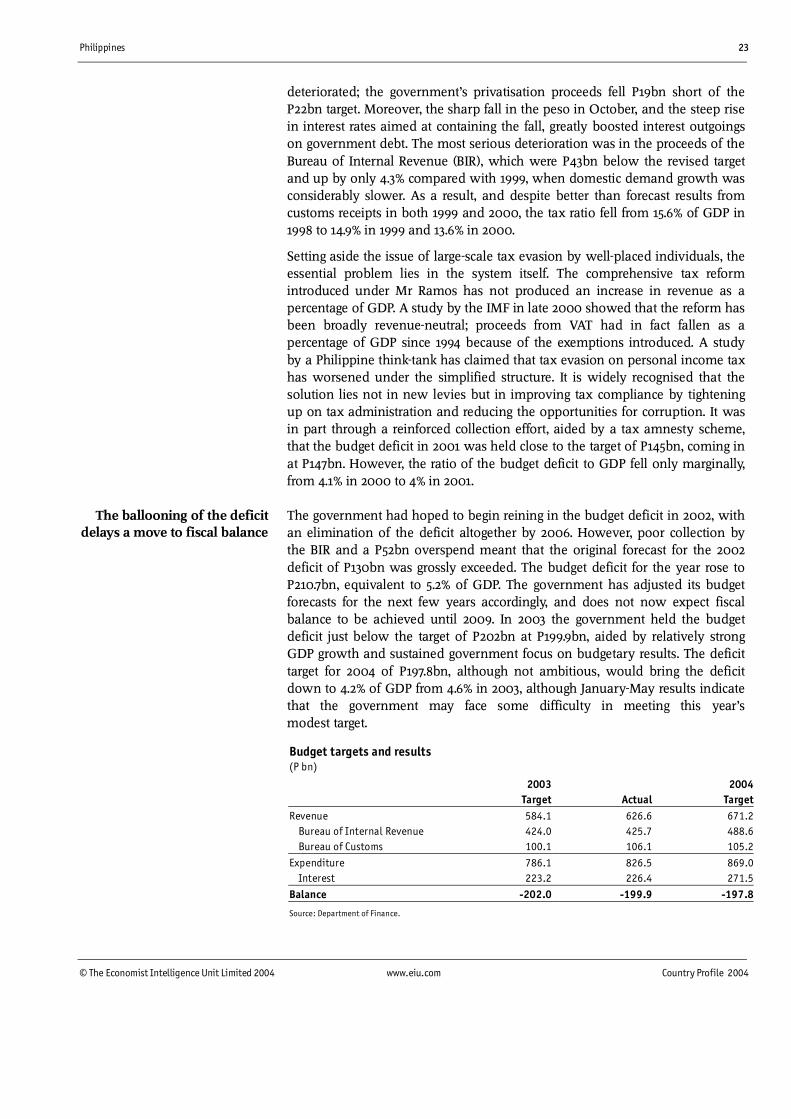
The government had hoped to begin reining in the budget deficit in 2002, withan elimination of the deficit altogether by 2006. However, poor collection bythe BIR and a P52bn overspend meant that the original forecast for the 2002deficit of P130bn was grossly exceeded. The budget deficit for the year rose toP210.7bn, equivalent to 5.2% of GDP. The government has adjusted its budgetforecasts for the next few years accordingly, and does not now expect fiscalbalance to be achieved until 2009. In 2003 the government held the budgetdeficit just below the target of P202bn at P199.9bn, aided by relatively strongGDP growth and sustained government focus on budgetary results. The deficittarget for 2004 of P197.8bn, although not ambitious, would bring the deficitdown to 4.2% of GDP from 4.6% in 2003, although January-May results indicatethat the government may face some difficulty in meeting this year’smodest target.
Budget targets and results(P bn)
2003 2004Target Actual Target
Revenue 584.1 626.6 671.2 Bureau of Internal Revenue 424.0 425.7 488.6 Bureau of Customs 100.1 106.1 105.2
Expenditure 786.1 826.5 869.0 Interest 223.2 226.4 271.5
Balance -202.0 -199.9 -197.8
Source: Department of Finance.
The ballooning of the deficitdelays a move to fiscal balance
24 Philippines
Country Profile 2004 www.eiu.com © The Economist Intelligence Unit Limited 2004
The other economic policy priority, pursued since the administration ofCorazon Aquino (1986 92), has been the restructuring and liberalisation of thePhilippine economy. The core purpose is to remove the structural constraintsthat had distorted the development, and depressed the growth, of an economythat at the end of the 1950s had been the most industrialised in South-east Asia.The constraints had their origin in the rentier economy of the colonial periodand the persistent and high level of protectionism in the decades sinceindependence. The major strands of the liberalisation programme are:
• the elimination of monopolies;
• the opening of restricted or banned sectors to foreign investment;
• the privatisation, wholly or in part, of all government corporate holdingsand such core services as are appropriate;
• the easing or lifting of tariff and non-tariff barriers; and
• a simplification and widening of the tax system in order to yield enhancedtax receipts.
To varying degrees, all of these policies challenge entrenched interests, which findstrong protection in Congress (the legislature). Nevertheless, major structuralreforms were introduced during the Aquino and Ramos administrations. Theywere supplemented by the opening of another closed sector, retail trade, and byfurther bank liberalisation, during the presidency of Joseph Estrada. Withinmonths of coming to power the current president, Gloria Macapagal Arroyo,secured congressional approval for the long-mooted liberalisation of the powersector, including as its major component the privatisation of the electricity utility,the National Power Corporation (Napocor). However, very little progress on theNapocor sell-off has since been made: an attempt to privatise the NationalTransmission Corporation (Transco), which holds Napocor’s power transmissionassets, proved a flop in July 2003, when only one bid was received. A few smallgenerating assets were sold early in 2004; substantial progress will be high on theagenda of the new government elected in May. Other proposals aired during theEstrada administration lifting the ban on foreign ownership of land, and easing
A sustained restructuring andliberalisation of the economy
Philippines 25
© The Economist Intelligence Unit Limited 2004 www.eiu.com Country Profile 2004
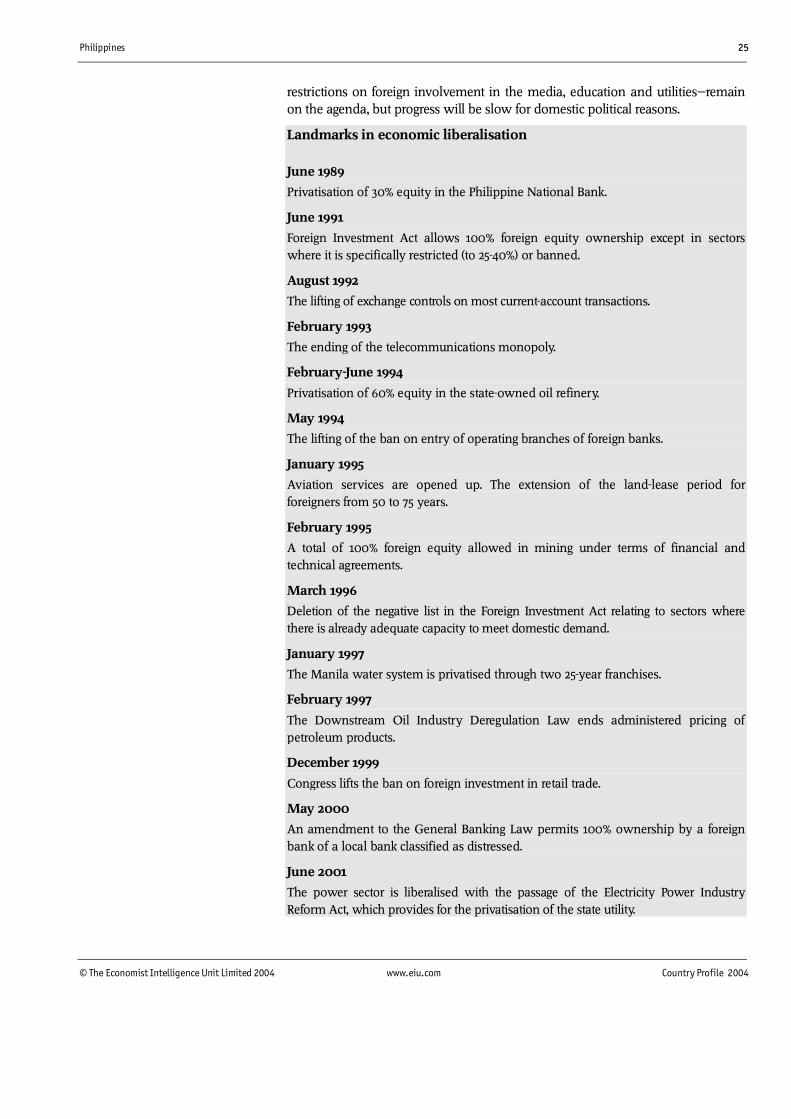
restrictions on foreign involvement in the media, education and utilities remainon the agenda, but progress will be slow for domestic political reasons.
Landmarks in economic liberalisation
June 1989
Privatisation of 30% equity in the Philippine National Bank.
June 1991
Foreign Investment Act allows 100% foreign equity ownership except in sectorswhere it is specifically restricted (to 25-40%) or banned.
August 1992
The lifting of exchange controls on most current-account transactions.
February 1993
The ending of the telecommunications monopoly.
February-June 1994
Privatisation of 60% equity in the state-owned oil refinery.
May 1994
The lifting of the ban on entry of operating branches of foreign banks.
January 1995
Aviation services are opened up. The extension of the land-lease period forforeigners from 50 to 75 years.
February 1995
A total of 100% foreign equity allowed in mining under terms of financial andtechnical agreements.
March 1996
Deletion of the negative list in the Foreign Investment Act relating to sectors wherethere is already adequate capacity to meet domestic demand.
January 1997
The Manila water system is privatised through two 25-year franchises.
February 1997
The Downstream Oil Industry Deregulation Law ends administered pricing ofpetroleum products.
December 1999
Congress lifts the ban on foreign investment in retail trade.
May 2000
An amendment to the General Banking Law permits 100% ownership by a foreignbank of a local bank classified as distressed.
June 2001
The power sector is liberalised with the passage of the Electricity Power IndustryReform Act, which provides for the privatisation of the state utility.
26 Philippines
Country Profile 2004 www.eiu.com © The Economist Intelligence Unit Limited 2004
December 2002
The special-purpose asset vehicle law is passed, making it easier for banks to spin offbad loans to asset-management companies.
A key policy change on the monetary side has been the switch to inflationtargeting by the Bangko Sentral ng Pilipinas (BSP, the autonomous central bank)at the beginning of 2001. It had traditionally set interest rates to meet monetarytargets monitored by the IMF, and with an eye to countering sharp fluctuationsin the peso’s value and providing some degree of support when it wasdepreciating rapidly. The target range for 2002 was initially set at 5-6%.
In view of the rapid fall in consumer price inflation during the final months of2001 and the first quarter of 2002, and against a background of slowing growthin money supply and credit and the steep fall in the US federal funds rate in thewake of the September 11th 2001 terrorist attacks, the BSP introduced a markedrelaxation in monetary conditions. Its overnight rates were reduced in everymonth from December 2001 to March 2002, reaching their lowest level sinceSeptember 1995. On June 6th 2003 the BSP restored the tiering system forovernight placements, applying the standard rate of 7% for the first P5bn butlowering the rate to 4% for an additional P5bn and to 1% for deposits aboveP10bn. However, the three-tiered interest rate system was removed on August28th as the BSP sought to defend the peso in the aftermath of the attemptedcoup in July 2003. Overnight borrowing and lending rates, which had beenheld steady since March 2002, were cut by a further 25 basis points in early July2003, to 6.75% and 9% respectively. Rates remain at these levels despite the end-June 2004 increase in the US federal funds rate, as Philippine inflation remainswithin the targeted range.
Economic performance
The notable feature of the GDP record in recent years has been the overallresilience of the economy in markedly deteriorating conditions. A sustained periodof accelerating growth in GDP from the mid-1990s on came to an end when thetwo pillars of growth exports and investment were hit by the regional economicand financial crisis of 1997-98. The steep rise in interest rates and in import costs,owing to the rapid devaluation in the peso, caused a sharp contraction in fixedcapital formation in 1998. The 21% contraction in exports (national-accountsmeasure) caused a deterioration in the net foreign balance since the fall inimports although steep was lower, at 14.7%. An aggravating factor on the supplyside was the fall in agricultural output owing to the El Niño weatherphenomenon, which hit the rice and maize crops. GDP consequently fell by 0.6%in 1998, a sharp turnaround compared with growth of 5.8% in 1996 and 5.2% in1997, but a much smaller deterioration than that registered by other economies inthe region.
The recession was also short-lived. The following two years saw a generallystrengthening recovery, with real GDP growth reaching 3.4% in 1999 and 6% in2000. Exports picked up marginally in 1999, but imports continued to decline, if ata much milder pace: as a result the net foreign balance contributed 3% to GDPgrowth in that year. Domestic demand remained sluggish throughout 1999, with
A switch to inflation targeting
A record of resilience indifficult conditions
Philippines 27
© The Economist Intelligence Unit Limited 2004 www.eiu.com Country Profile 2004
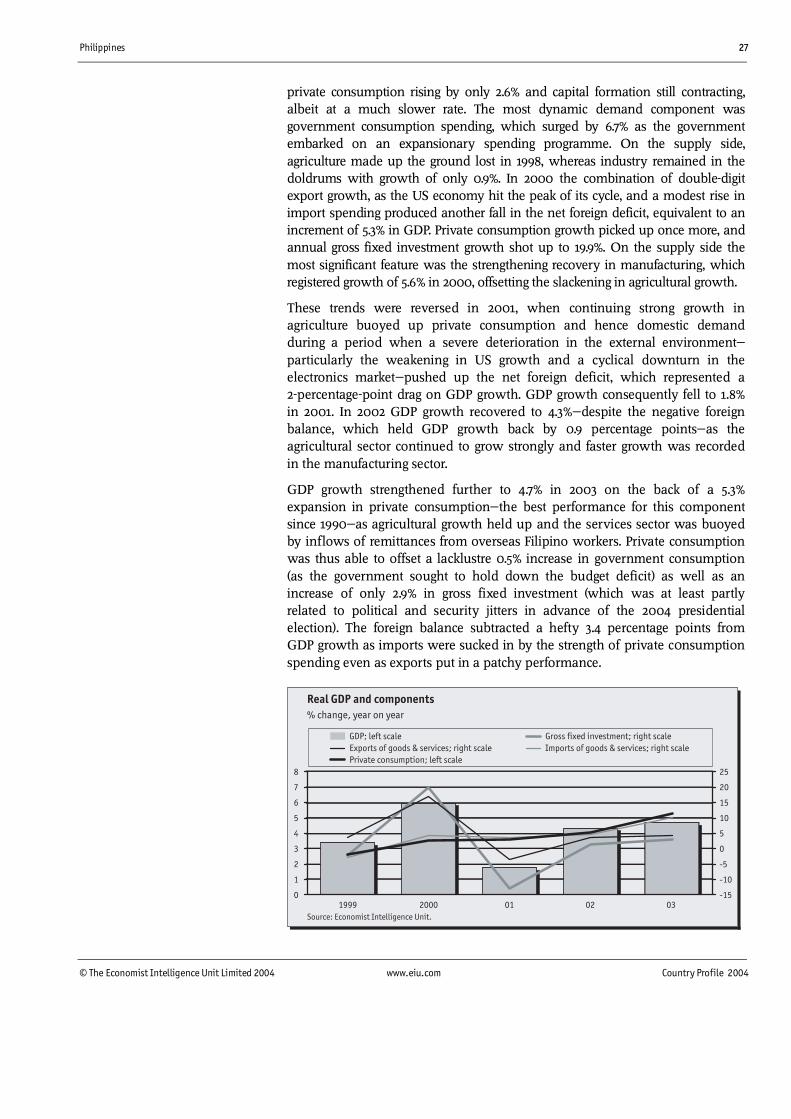
private consumption rising by only 2.6% and capital formation still contracting,albeit at a much slower rate. The most dynamic demand component wasgovernment consumption spending, which surged by 6.7% as the governmentembarked on an expansionary spending programme. On the supply side,agriculture made up the ground lost in 1998, whereas industry remained in thedoldrums with growth of only 0.9%. In 2000 the combination of double-digitexport growth, as the US economy hit the peak of its cycle, and a modest rise inimport spending produced another fall in the net foreign deficit, equivalent to anincrement of 5.3% in GDP. Private consumption growth picked up once more, andannual gross fixed investment growth shot up to 19.9%. On the supply side themost significant feature was the strengthening recovery in manufacturing, whichregistered growth of 5.6% in 2000, offsetting the slackening in agricultural growth.
These trends were reversed in 2001, when continuing strong growth inagriculture buoyed up private consumption and hence domestic demandduring a period when a severe deterioration in the external environmentparticularly the weakening in US growth and a cyclical downturn in theelectronics market pushed up the net foreign deficit, which represented a2-percentage-point drag on GDP growth. GDP growth consequently fell to 1.8%in 2001. In 2002 GDP growth recovered to 4.3% despite the negative foreignbalance, which held GDP growth back by 0.9 percentage points as theagricultural sector continued to grow strongly and faster growth was recordedin the manufacturing sector.
GDP growth strengthened further to 4.7% in 2003 on the back of a 5.3%expansion in private consumption the best performance for this componentsince 1990 as agricultural growth held up and the services sector was buoyedby inflows of remittances from overseas Filipino workers. Private consumptionwas thus able to offset a lacklustre 0.5% increase in government consumption(as the government sought to hold down the budget deficit) as well as anincrease of only 2.9% in gross fixed investment (which was at least partlyrelated to political and security jitters in advance of the 2004 presidentialelection). The foreign balance subtracted a hefty 3.4 percentage points fromGDP growth as imports were sucked in by the strength of private c0nsumptionspending even as exports put in a patchy performance.

28 Philippines
Country Profile 2004 www.eiu.com © The Economist Intelligence Unit Limited 2004
Remittance inflows
The importance of the Filipino community abroad
The economy’s resilience owes much to the inflow of remittances from Filipinosoverseas, both contract workers and emigrants. Remittances from overseas workersreached nearly US$8bn in 2003, aided by the fact that Filipino workers abroad areincreasingly likely to be doctors and nurses in OECD countries rather than poorlypaid maids in South-east Asia and the Middle East.Investments by overseas Filipinos in domestic assets are also sizeable, especiallysince exchange controls were liberalised in 1992 and the economy entered a periodof more stable and sustained growth. An approximate indication of their value wasgiven by a payments measure on the invisibles account, unique to the Philippines,which was abandoned after 1998 inflows through the conversion to pesos offoreign-currency deposits. In 1995-98 peso conversions averaged around US$5bn ayear, of which a significant proportion is likely to have represented inflows fromFilipinos abroad. Trends in these inflows consequently have an impact on the paceof overall economic growth, as they represent a significant source of income forFilipino households and generate demand for Philippine assets.
Consumer price inflation was steady at around the 8% level through much ofthe early and mid-1990s, when GDP growth was tending to rise, largely owingto the stability of the peso against the US dollar. It was the steep fall in thepeso’s value in the second half of 1997 in the wake of the regional financialcrisis, and the pressure from a much lower rice crop, which pushed theinflation rate up to 10-11% in May-December 1998 and an average of 9.7% for thefull year.
Since reaching this high, inflation has moved on to a generally lower path.Strong deflationary pressures began to be felt in 1999, reflecting the impact ofthe 1998 economic recession, the weakness of world oil prices and fromOctober 1998 the slight appreciation in the peso’s value against the US dollar.With the rebound in the rice crop, and despite the recovery in oil prices, therate of consumer price inflation fell in virtually every month of 1999 to recordan average of 6.6% for the year as a whole. The rate fell to 4.3% in 2000 as thegovernment countered the surge in energy prices through subsidies to controlthe price of state-supplied rice. The plummeting of the peso in response to thepolitical crisis surrounding the ouster of the president, Joseph Estrada, causedannual average inflation to creep up to 6.1%. Plentiful rice supply and asteadying of the peso then allowed consumer price inflation to ease to 3.1% in2002. Low prices for foodstuffs and oil kept inflationary pressures subdued in2003, when an average inflation rate of 2.9% was recorded. Inflation has sincecrept up, reaching a year-on-year rate of 5.1% in June 2004, owing to thedepreciation of the peso and the impact of high global oil prices.
For most of the 1990s real wages were in decline. Wages tended to lag behindthe rise in prices, with sudden catch-up increases in response to pressures suchas a surge in food prices or an imminent national election. Although the trendhas fluctuated in recent years, overall wage increases have not kept pace withconsumer price inflation. Indices on compensation per employee in the non-agricultural sector, based on a quarterly survey of 3,000 companies by the
Inflation moves on to aslower path
Wage increases broadly lagbehind price inflation
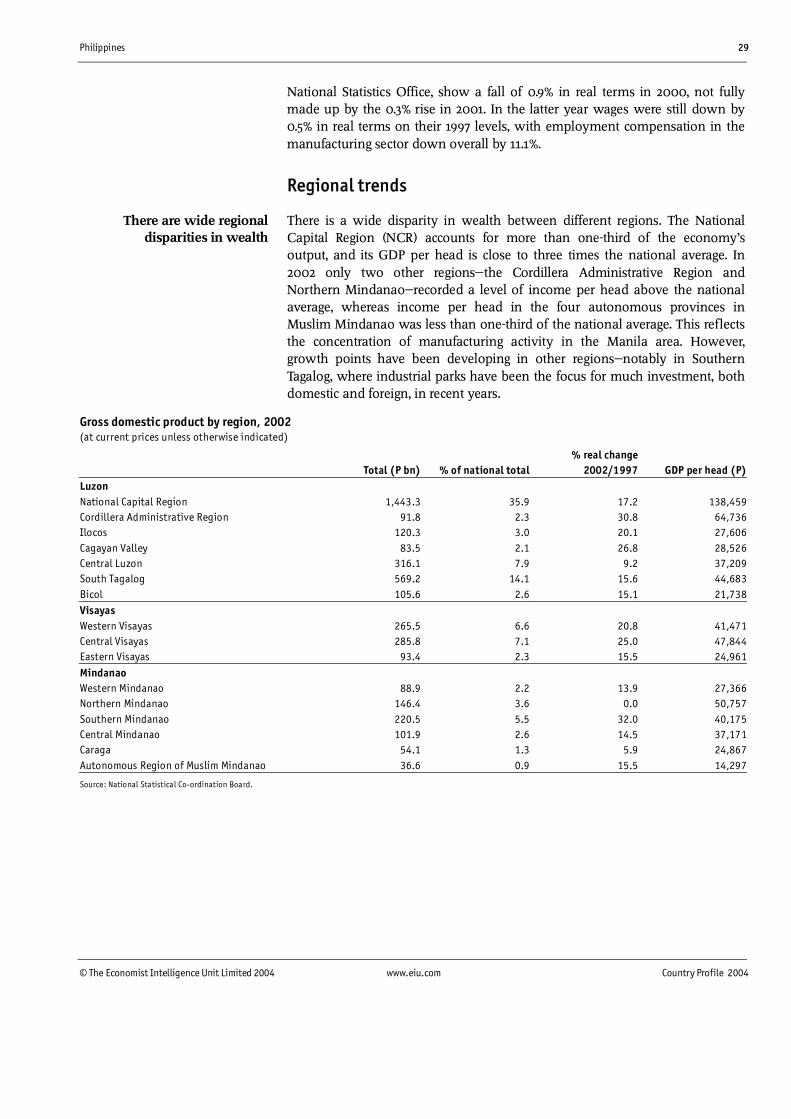
Philippines 29
© The Economist Intelligence Unit Limited 2004 www.eiu.com Country Profile 2004
National Statistics Office, show a fall of 0.9% in real terms in 2000, not fullymade up by the 0.3% rise in 2001. In the latter year wages were still down by0.5% in real terms on their 1997 levels, with employment compensation in themanufacturing sector down overall by 11.1%.
Regional trends
There is a wide disparity in wealth between different regions. The NationalCapital Region (NCR) accounts for more than one-third of the economy’soutput, and its GDP per head is close to three times the national average. In2002 only two other regions the Cordillera Administrative Region andNorthern Mindanao recorded a level of income per head above the nationalaverage, whereas income per head in the four autonomous provinces inMuslim Mindanao was less than one-third of the national average. This reflectsthe concentration of manufacturing activity in the Manila area. However,growth points have been developing in other regions notably in SouthernTagalog, where industrial parks have been the focus for much investment, bothdomestic and foreign, in recent years.
Gross domestic product by region, 2002(at current prices unless otherwise indicated)
% real changeTotal (P bn) % of national total 2002/1997 GDP per head (P)
LuzonNational Capital Region 1,443.3 35.9 17.2 138,459Cordillera Administrative Region 91.8 2.3 30.8 64,736Ilocos 120.3 3.0 20.1 27,606Cagayan Valley 83.5 2.1 26.8 28,526Central Luzon 316.1 7.9 9.2 37,209South Tagalog 569.2 14.1 15.6 44,683Bicol 105.6 2.6 15.1 21,738VisayasWestern Visayas 265.5 6.6 20.8 41,471Central Visayas 285.8 7.1 25.0 47,844Eastern Visayas 93.4 2.3 15.5 24,961
MindanaoWestern Mindanao 88.9 2.2 13.9 27,366Northern Mindanao 146.4 3.6 0.0 50,757Southern Mindanao 220.5 5.5 32.0 40,175Central Mindanao 101.9 2.6 14.5 37,171Caraga 54.1 1.3 5.9 24,867Autonomous Region of Muslim Mindanao 36.6 0.9 15.5 14,297
Source: National Statistical Co-ordination Board.
There are wide regionaldisparities in wealth
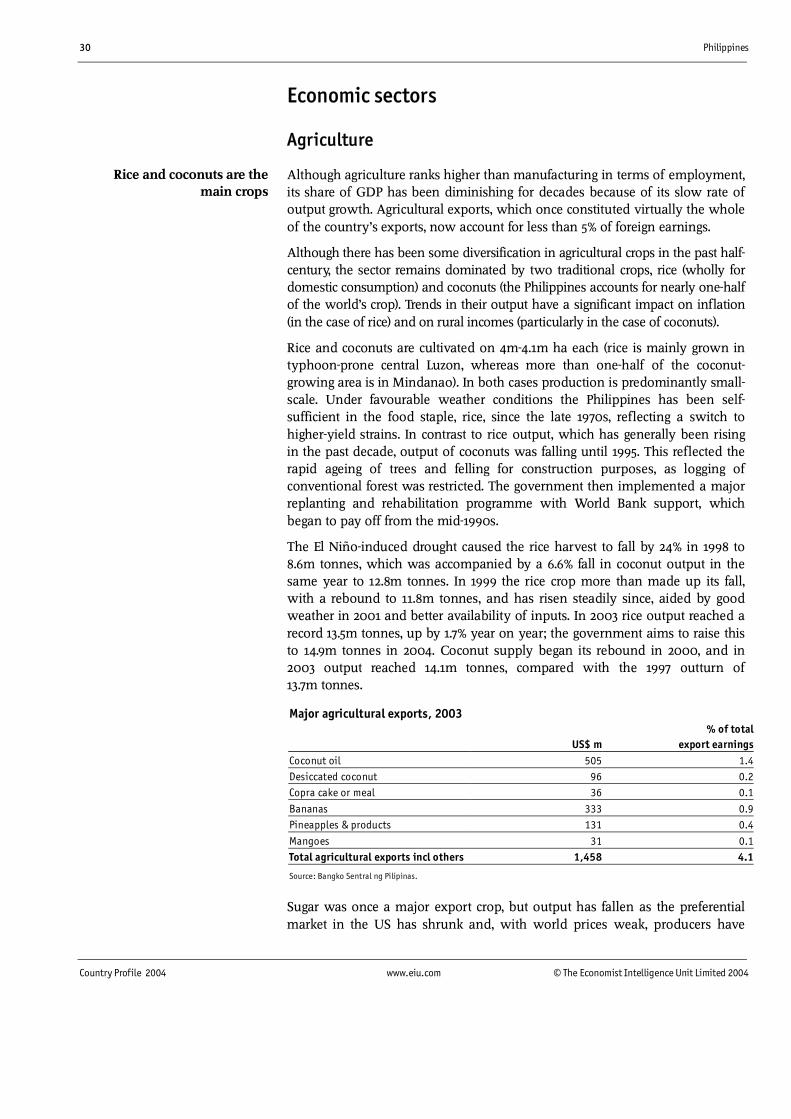
30 Philippines
Country Profile 2004 www.eiu.com © The Economist Intelligence Unit Limited 2004
Economic sectors
Agriculture
Although agriculture ranks higher than manufacturing in terms of employment,its share of GDP has been diminishing for decades because of its slow rate ofoutput growth. Agricultural exports, which once constituted virtually the wholeof the country’s exports, now account for less than 5% of foreign earnings.
Although there has been some diversification in agricultural crops in the past half-century, the sector remains dominated by two traditional crops, rice (wholly fordomestic consumption) and coconuts (the Philippines accounts for nearly one-halfof the world’s crop). Trends in their output have a significant impact on inflation(in the case of rice) and on rural incomes (particularly in the case of coconuts).
Rice and coconuts are cultivated on 4m-4.1m ha each (rice is mainly grown intyphoon-prone central Luzon, whereas more than one-half of the coconut-growing area is in Mindanao). In both cases production is predominantly small-scale. Under favourable weather conditions the Philippines has been self-sufficient in the food staple, rice, since the late 1970s, reflecting a switch tohigher-yield strains. In contrast to rice output, which has generally been risingin the past decade, output of coconuts was falling until 1995. This reflected therapid ageing of trees and felling for construction purposes, as logging ofconventional forest was restricted. The government then implemented a majorreplanting and rehabilitation programme with World Bank support, whichbegan to pay off from the mid-1990s.
The El Niño-induced drought caused the rice harvest to fall by 24% in 1998 to8.6m tonnes, which was accompanied by a 6.6% fall in coconut output in thesame year to 12.8m tonnes. In 1999 the rice crop more than made up its fall,with a rebound to 11.8m tonnes, and has risen steadily since, aided by goodweather in 2001 and better availability of inputs. In 2003 rice output reached arecord 13.5m tonnes, up by 1.7% year on year; the government aims to raise thisto 14.9m tonnes in 2004. Coconut supply began its rebound in 2000, and in2003 output reached 14.1m tonnes, compared with the 1997 outturn of13.7m tonnes.
Major agricultural exports, 2003% of total
US$ m export earningsCoconut oil 505 1.4Desiccated coconut 96 0.2Copra cake or meal 36 0.1
Bananas 333 0.9Pineapples & products 131 0.4
Mangoes 31 0.1Total agricultural exports incl others 1,458 4.1
Source: Bangko Sentral ng Pilipinas.
Sugar was once a major export crop, but output has fallen as the preferentialmarket in the US has shrunk and, with world prices weak, producers have
Rice and coconuts are themain crops
Philippines 31
© The Economist Intelligence Unit Limited 2004 www.eiu.com Country Profile 2004
switched to higher-value crops and fish farming. In recent years the Philippineshas had to import sugar to meet its US export quota. In the case of anothertraditional export crop, coffee, the rise in domestic demand has in most recentyears eliminated supplies for export. By contrast, bananas and pineapples havebecome significant export crops since the 1970s, reflecting investment by UScompanies; mangoes have become significant since the 1990s.
All livestock production is for domestic consumption. The Philippines is self-sufficient in pork and poultry, but needs to import beef and dairy products.
Land ownership
A major constraint on growth
One of the fundamental reasons for the failure of the Philippine economy to take offalong with similar economies in East Asia is the distribution of land or rather thefailure to redistribute it. As the rise in the area under cultivation has failed to keeppace with population growth, the average farm size has fallen: the 2002 census ofagriculture carried out by the National Statistics Office showed that the average farmsize in the Philippines was just 2.04 ha. A small number of landlords own adisproportionately large share of land. The result is deep-rooted poverty that affectsaround one-half of the rural population.Since the first years of independence there have been attempts at land reform, whichinitially took the form of allocating virgin land for settlement as well as partitioningsome large estates. The scope for the former was soon exhausted. A programme wasintroduced under the presidency of Ferdinand Marcos to convert share tenancies inland planted to rice or maize. Corazon Aquino initiated a much more extensiveprogramme of redistribution, the Comprehensive Agrarian Reform Programme,covering all agricultural land (above a retention limit of 5 ha per landowner and 3 haper direct heir) over a ten-year period. The beneficiaries were the farmers or “regularfarm workers” on the land. About 55% of existing agricultural land was covered.However, there was a significant exclusion: corporate landholdings were deemed tocomply with the programme through a transfer of stock, rather than land, and solandowners could use incorporation as a means of avoiding the break-up of theirestates.The underlying problems remained the inadequacy of back-up services for a newgeneration of small, poor farmers and the absence of political will to transfer sofundamental an asset. Lawsuits and obstruction by entrenched interests, as well as cutsin funding for landowner compensation, have caused the programme to fall far behindschedule. Completion is not now expected before 2008 ten years behind target.
Forestry is now a marginal sector, as a result of resource depletion over a longperiod. By the early 1990s its contribution to GDP was already less than 0.5%, andofficially recorded export earnings from forestry products were only US$23m in2002. However, there is a high level of illegal logging, particularly in remote areasof Mindanao.
Fishing is an important sector, employing 1.1m people in October 2002 (mostlyat near-subsistence level) and providing an important and growing source offoreign earnings. However, although commercial fishing and fish farming havegrown over the past decade, subsistence fishing has declined, depressing output
Forestry resources aredisappearing
Fishing
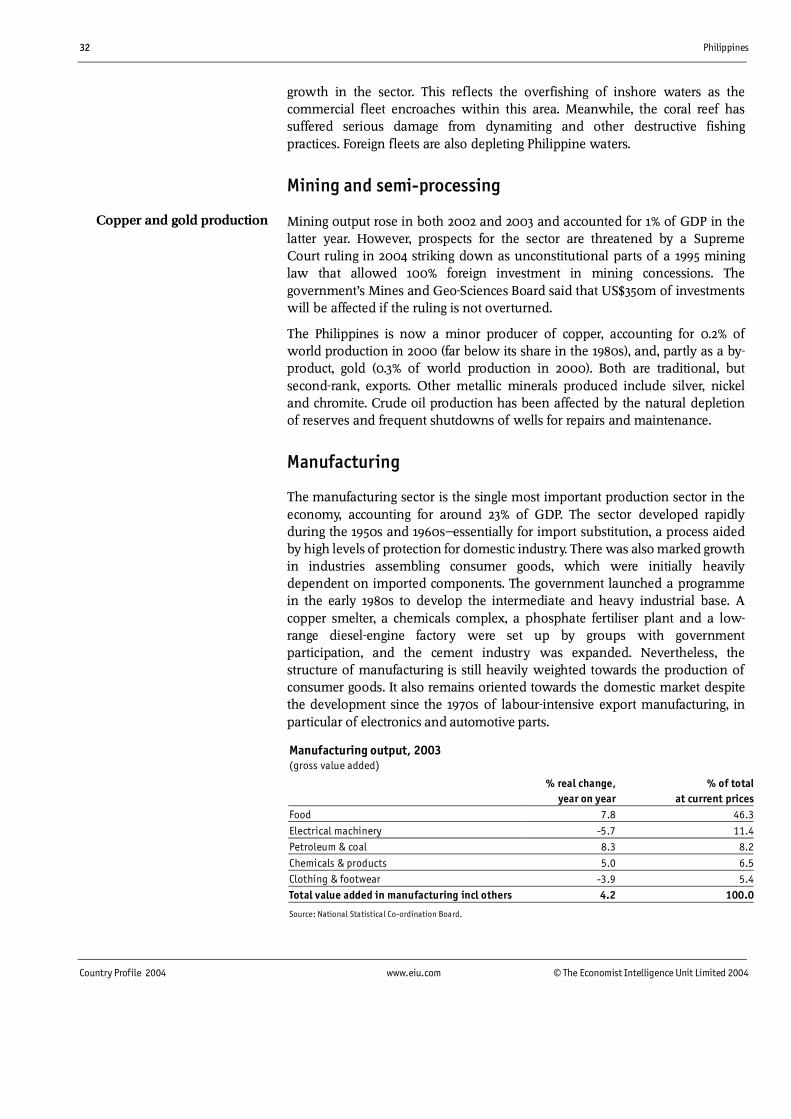
32 Philippines
Country Profile 2004 www.eiu.com © The Economist Intelligence Unit Limited 2004
growth in the sector. This reflects the overfishing of inshore waters as thecommercial fleet encroaches within this area. Meanwhile, the coral reef hassuffered serious damage from dynamiting and other destructive fishingpractices. Foreign fleets are also depleting Philippine waters.
Mining and semi-processing
Mining output rose in both 2002 and 2003 and accounted for 1% of GDP in thelatter year. However, prospects for the sector are threatened by a SupremeCourt ruling in 2004 striking down as unconstitutional parts of a 1995 mininglaw that allowed 100% foreign investment in mining concessions. Thegovernment’s Mines and Geo-Sciences Board said that US$350m of investmentswill be affected if the ruling is not overturned.
The Philippines is now a minor producer of copper, accounting for 0.2% ofworld production in 2000 (far below its share in the 1980s), and, partly as a by-product, gold (0.3% of world production in 2000). Both are traditional, butsecond-rank, exports. Other metallic minerals produced include silver, nickeland chromite. Crude oil production has been affected by the natural depletionof reserves and frequent shutdowns of wells for repairs and maintenance.
Manufacturing
The manufacturing sector is the single most important production sector in theeconomy, accounting for around 23% of GDP. The sector developed rapidlyduring the 1950s and 1960s essentially for import substitution, a process aidedby high levels of protection for domestic industry. There was also marked growthin industries assembling consumer goods, which were initially heavilydependent on imported components. The government launched a programmein the early 1980s to develop the intermediate and heavy industrial base. Acopper smelter, a chemicals complex, a phosphate fertiliser plant and a low-range diesel-engine factory were set up by groups with governmentparticipation, and the cement industry was expanded. Nevertheless, thestructure of manufacturing is still heavily weighted towards the production ofconsumer goods. It also remains oriented towards the domestic market despitethe development since the 1970s of labour-intensive export manufacturing, inparticular of electronics and automotive parts.
Manufacturing output, 2003(gross value added)
% real change, % of totalyear on year at current prices
Food 7.8 46.3
Electrical machinery -5.7 11.4Petroleum & coal 8.3 8.2
Chemicals & products 5.0 6.5Clothing & footwear -3.9 5.4Total value added in manufacturing incl others 4.2 100.0
Source: National Statistical Co-ordination Board.
Copper and gold production

Philippines 33
© The Economist Intelligence Unit Limited 2004 www.eiu.com Country Profile 2004
The expansion of the export manufacturing sector was stimulated by thecreation of export processing zones (EPZs), where companies were grantedincentives in addition to the tax and duty exemptions more widely offered tomanufacturing. The first such zone was set up at Mariveles, in Bataan. Otherzones have been developed at Mactan Island near Cebu city, at Baguio, north-east of Manila, and at Cavite, south of Manila. Two newcomers were the SubicSpecial Economic and Freeport Zone, at the former US naval base along SubicBay on the main island of Luzon, and Clark, at the former air force base in thecentral Luzon province of Pampanga. However, many other industrial parks andzones exist all over the country, with the total number standing at 96 in July2004. More than 907,000 people were employed in the zones in 2003, up from229,650 in 1994, according to the Philippine Economic Zones Authority.
Structure of manufacturing industry, 1998a
No. of Total av employment Census valueestablishments (‘000) added(P m)
Food 3,919 207.6 163,226
Beverages 129 30.3 47,173Tobacco 21 7.6 22,539
Textiles 586 53.6 11,591Clothing 2,025 158.5 28,499Leather products 595 42.6 5,338
Wood & cork products (excl furniture) 584 24.3 4,954Furniture 689 35.2 5,862
Paper & paper products 335 23.6 12,093Printing & publishing 988 30.8 10,788Industrial chemicals 375 15.7 8,930
Other chemical products 397 39.6 56,136Petroleum refining 5 1.9 52,851
Miscellaneous petroleum & coal products 12 0.8 102Rubber products 136 10.0 3,214
Plastic products 490 32.0 10,958Glass & glass products 66 6.1 3,722Cement 20 6.9 13,897
Other non-metallic mineral products 701 35.0 8,488Iron & steel 447 30.9 15,544
Non-ferrous metal 35 4.6 4,010Fabricated metal products
(excl machinery & equipment) 957 40.3 9,728Non-electric machinery & equipment 861 37.3 9,591
Office, accounting & computing machinery 27 22.8 17,291Electrical machinery & apparatus 446 172.6 109,116
Transport equipment 364 31.4 20,890Total incl others 15,674 1,163.4 669,338
a Establishments employing ten or more workers.
Source: National Statistical Co-ordination Board.
Over the long term the prospect remains one of growth in this sector, as thePhilippines attracts investment geared to crossborder production within theAssociation of South-East Asian Nations (ASEAN), and to the extent that itbenefits from the “hollowing out” of the economies of Japan and Taiwan.
The export processing andspecial economic zones
34 Philippines
Country Profile 2004 www.eiu.com © The Economist Intelligence Unit Limited 2004
However, the Philippines faces strong, and growing, competition from lower-cost producers, notably China.
Detailed official statistics on manufacturing do not cover the importantcontribution of small enterprises. These are numerous, and are an importantsource of employment. Manufacturing establishments employing more thanten workers numbered 15,674 in 1998 (the latest data available), providingemployment for 1.2m people. By contrast, manufacturing establishmentsemploying fewer than ten workers numbered 105,458, providing employmentfor 355,245 people.
Construction
During 1993-97 construction output rose by nearly 10% per year. Growth wasdynamic because the sluggishness of government capital spending was offset bythe contribution of the private sector in financing improvements in physicalinfrastructure, which in the past would have depended on public funds.Meanwhile, sustained economic growth generated private-sector demand in bothresidential and non-residential segments of the property market, such as luxuryapartment complexes, offices and shopping complexes in the National CapitalRegion and in other growth centres.
The sector went into sharp decline in 1998, owing to the sharp rise in interestrates in the wake of the regional financial crisis and the downturn ininvestment spending. The value of private building construction peaked atP123bn (US$3.2bn) in 1998, but fell to P69bn in 1998 and remained stagnant atthis level for several years. In 2002, however, the value of private buildingconstruction rose to P86bn, from P68.2bn in the previous year, with 91,471building permits issued, compared with 77,857 in the 2002.
Financial services
The financial sector is undeveloped compared with that of other countries in theregion, and the inadequacy of the local capital market is a major reason for thecountry’s low propensity to invest. The ratio of total assets of the bankingsystem to GNP is the lowest in East Asia, and individual commercial banks aresmall compared with those in other countries. In 1996, before countries in theregion were hit by the economic crisis, the depth of the Philippine financialsystem, as measured by the ratio of M2 to GNP, was low, at 51.8% compared with101.1% in Malaysia and 81.5% in Thailand.
However, these statistics have been improving over time in 1984 the M2/GNPratio stood at only 20.9%. An important stimulus to further real growth has comefrom the liberalisation of this sector: the 44-year ban on the establishment offoreign banks was lifted in May 1994; full operating licences are now beingaccorded to foreign insurance companies in line with commitments to the WorldTrade Organisation (WTO); and legislation in 1997 eased restrictions on foreigninvestment in finance companies and investment houses.
A significant informal sector
The construction sectorremains generally sluggish
A relatively undevelopedfinancial sector
Philippines 35
© The Economist Intelligence Unit Limited 2004 www.eiu.com Country Profile 2004
The Philippines has a large number of commercial banks (42 in June 2003) with awide variation in size, from the major banks with assets of more than P300bn tosmall, frequently family-controlled operations. Two banks are government-owned(the Land Bank of the Philippines and the Development Bank of the Philippines)and one major one the Philippine National Bank (PNB) is part government-owned. The government’s stake in the PNB rose from 16% to 45% as debt owed tothe state was converted into equity. It is envisaged that the rehabilitated bankwill eventually be sold back to the private sector. The state also owns a smallIslamic bank, the Al-Amanah Islamic Investment Bank, which serves Muslimareas in the south of the Philippines.
Assets of the top ten commercial banks, 2003(P bn; year-end)
Metrobank 508.0
Bank of the Philippine Islands 388.3Equitable PCI Bank 288.8
Land Bank of the Philippinesa 269.6Citibank 222.9
Philippine National Bank 203.3Rizal Commercial Banking Corporation 201.3Development Bank of the Philippinesa 148.3
Banco de Oro 147.9Allied Banking Corporation 137.7
a Government-owned.
Source: Press reports.
The general trend towards merger and consolidation was reinforced in thewake of the 1997-98 regional economic and financial crisis when highercapitalisation was demanded of all banks. In 2000 the Bank of the PhilippineIslands teamed up with Far East Bank & Trust, briefly displacing Metrobank asthe country’s largest bank. Banco de Oro merged with the local unit of theHong Kong-based Dao Heng Bank in June 2001 and Planters DevelopmentBank bought a thrift institution, Active Bank, in July 2002. The passage of theSpecial-Purpose Assets Vehicle bill through Congress (the legislature) inDecember 2002 was designed to make it easier for banks to spin off bad loansto asset-management companies, although banks have been slow to availthemselves of the law’s provisions.
For 44 years, until 1995, only four foreign banks were permitted to operatebranches in the Philippines Citibank, Bank of America, Hongkong & ShanghaiBank and Standard Chartered. With the lifting of the ban, operating licenceswere granted to ten other foreign banks, mainly from the Asian Pacific region.These banks have concentrated on wholesale corporate services. It wasoriginally envisaged that another ten licences would be issued after atransitional period of three to five years. That target was abandoned, with theBangko Sentral ng Pilipinas (the autonomous central bank) favouring moreconsolidation among domestic commercial banks before other foreign banksare allowed to enter. However, the entry of foreign banks was liberalised in theGeneral Banking Law of 2000, which raised the maximum foreign ownershiplevel of banks to 40% of voting stock. Also, under certain conditions, the centralbank can allow a foreign bank to own 100% of a domestic bank. At end-2001,
The banking system

36 Philippines
Country Profile 2004 www.eiu.com © The Economist Intelligence Unit Limited 2004
17 foreign banks were operating in the country, but only one Citibank rankedamong the top ten in terms of assets.
The biggest investment house is the Private Development Corporation,followed by the Bank of the Philippine Islands Investment Corporation(formerly the Ayala Investment Corporation). The government-ownedDevelopment Bank of the Philippines is an important source of investment foragriculture and small- and medium-scale industry. In addition, there is anoffshore banking and foreign-currency deposit system. Offshore bankinglicences are available only to foreign banks, but all commercial banks arepermitted to operate foreign-currency deposit units.
The Philippines Stock Exchange (PSE) received a double boost in the early andmid-1990s from the general international interest in emerging markets and theprogramme of investment liberalisation and privatisation. The marketcapitalisation of the stockmarket rose from only P353bn at end-1992 to P2.12trn(US$80.9bn) by end-1996. However, it remained both small and highlyvulnerable to trends in world equity markets and nervousness about thedomestic political climate. Thus in 1997 the main PHISIX index fell by 41% overthe year and market capitalisation was nearly halved. The index continued tofall, reaching a seven-year low of 1,082 in September 1998.
New highs were reached in June 1999, when the main PHISIX index hit 2,487 atthe end of the month. However, falling confidence in the administration ofJoseph Estrada, which was not offset by the relative resilience of the economyin 2000, served to push down the index once more, so that it dipped below1,450 in mid-January 2001, when Mr Estrada was ousted as president. Residualpolitical uncertainty and the deterioration in demand for emerging marketequities pushed the index down even further, and it stood at just above 1,200when the September 11th terrorist attacks in the US occurred. Thereafter thePHISIX index fell along with other world markets, ending October 2001 at just993. By the end of 2001 it had recovered to 1,168, buoyed by unexpectedly goodGDP results. The PHISIX index rallied to a high of 1,470 in February 2002, butcontinuing bouts of bearish sentiment, relating to the trial of Mr Estrada andthe security problems in the south of the country, took their toll, and the indexfinished the year at 1,018. It then dipped further in early 2003. A hesitantrecovery was stalled by the attempted coup in July 2003 and political concernsin advance of the 2004 elections, but the index rallied to end 2003 at 1,442 asthe incumbent president, Gloria Macapagal Arroyo, announced her candidacyin the presidential election. The index ended June 2004 at 1,579 asMs Macapagal Arroyo’s victory in the presidential election was confirmed andshe was sworn in for a fresh six-year term.
The equities market should benefit from the improvement in regulation underthe terms of the Securities Act passed in 2000. This tightened the definition ofinsider trading, required full disclosure by listed companies, set a one-yeardeadline for the demutualisation of the Philippines Stock Exchange (effected inAugust 2001) and enhanced the powers of the regulatory body, the Securitiesand Exchange Commission (SEC). However, the quality of regulation willcontinue to be undermined by the pervasive personal networks active in this
The securities market
Philippines 37
© The Economist Intelligence Unit Limited 2004 www.eiu.com Country Profile 2004
sector, which deter new entrants, keeping the equity market small and makingit an inadequate means of mobilising domestic savings. Much more also needsto be done to strengthen public listing requirements to improve corporategovernance.
Other services
The retail sector was, for many decades, closed to foreign participation. Thiswas nominally to protect small corner shops from foreign competition, but theban acted to keep the bulk of retail trade small-scale, much of it in the informalsector. Around one-half of the 418,000 retailers in 1991 were singleproprietorships: market vendors accounted for 13% of the total, and familyneighbourhood stores for just over one-third. However, a trend was establishedin the late 1980s and 1990s for the development of large shopping complexes,many of them in the vicinity of Manila and geared towards the higher incomesin this region.
Tourism is an important sector, the potential of which is largely untapped. Themajor constraints are: the concentration of first-class hotel accommodation in thecapital, whereas capacity in areas offering a more varied tourist experience islimited; inadequate domestic transport links; and the Philippines’ poor image interms of security, which has been greatly exacerbated by the targeting of touristsby the Abu Sayyaf guerrilla group.
Tourism earnings reached a high of US$2.6bn in 1999, although visitor arrivalspeaked two years earlier at 2.2m (including overseas Filipinos on home visits).The US and Japan were the leading sources of foreign visitors, the USaccounting for around 20% and Japan for 19%. But the most dynamic growth inthe mid- and late 1990s was in visitors from South Korea and Taiwan, boostedby developing investment links. The economic crisis in the region in 1997-98 hitthe latter group hard, and visitor numbers have declined in most years since.The aftermath of the September 11th 2001 terrorist attacks merely reinforced anestablished trend, with arrivals down by 9.8% to 1.8m in 2001 as a whole.US-dollar earnings from travel as registered in payments data fell at twice thisrate, to US$1.7bn, the lowest level since 1996. Visitor arrivals recovered to 1.93min 2002, but fell back once again in 2003 to 1.91m.
The retail sector
Tourism
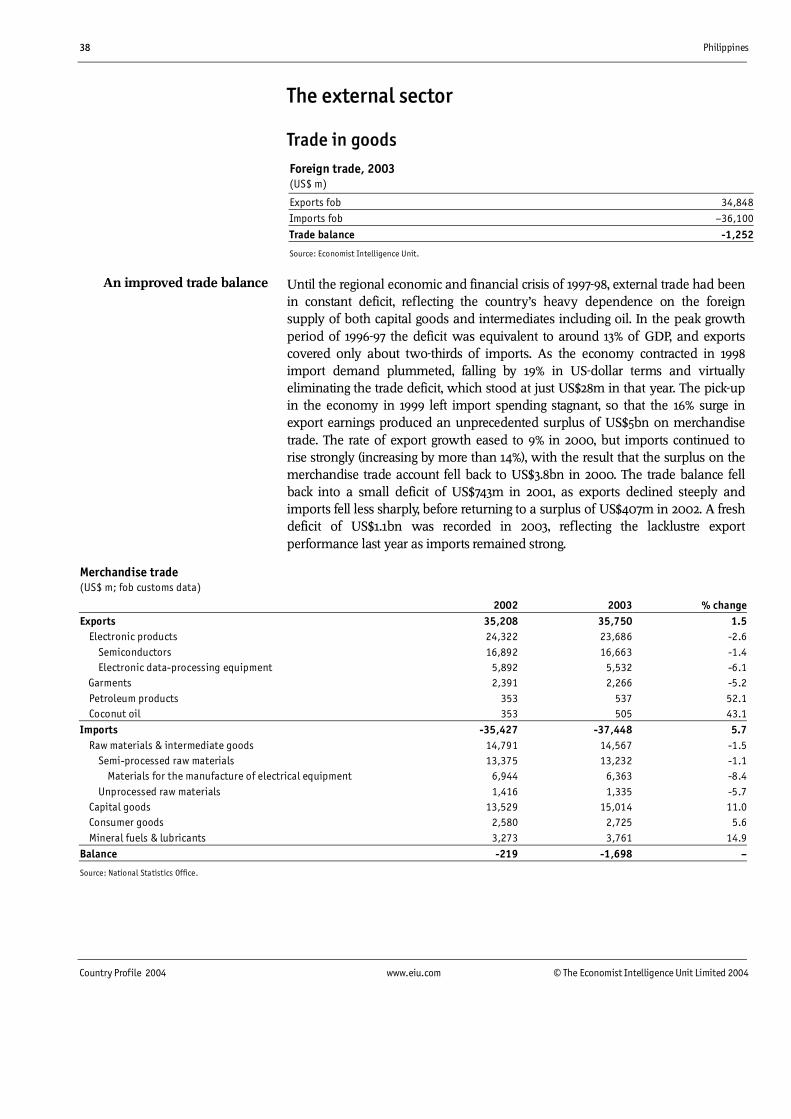
38 Philippines
Country Profile 2004 www.eiu.com © The Economist Intelligence Unit Limited 2004
The external sector
Trade in goodsForeign trade, 2003(US$ m)
Exports fob 34,848Imports fob –36,100
Trade balance -1,252
Source: Economist Intelligence Unit.
Until the regional economic and financial crisis of 1997-98, external trade had beenin constant deficit, reflecting the country’s heavy dependence on the foreignsupply of both capital goods and intermediates including oil. In the peak growthperiod of 1996-97 the deficit was equivalent to around 13% of GDP, and exportscovered only about two-thirds of imports. As the economy contracted in 1998import demand plummeted, falling by 19% in US-dollar terms and virtuallyeliminating the trade deficit, which stood at just US$28m in that year. The pick-upin the economy in 1999 left import spending stagnant, so that the 16% surge inexport earnings produced an unprecedented surplus of US$5bn on merchandisetrade. The rate of export growth eased to 9% in 2000, but imports continued torise strongly (increasing by more than 14%), with the result that the surplus on themerchandise trade account fell back to US$3.8bn in 2000. The trade balance fellback into a small deficit of US$743m in 2001, as exports declined steeply andimports fell less sharply, before returning to a surplus of US$407m in 2002. A freshdeficit of US$1.1bn was recorded in 2003, reflecting the lacklustre exportperformance last year as imports remained strong.
Merchandise trade(US$ m; fob customs data)
2002 2003 % changeExports 35,208 35,750 1.5 Electronic products 24,322 23,686 -2.6 Semiconductors 16,892 16,663 -1.4 Electronic data-processing equipment 5,892 5,532 -6.1 Garments 2,391 2,266 -5.2 Petroleum products 353 537 52.1 Coconut oil 353 505 43.1Imports -35,427 -37,448 5.7 Raw materials & intermediate goods 14,791 14,567 -1.5 Semi-processed raw materials 13,375 13,232 -1.1 Materials for the manufacture of electrical equipment 6,944 6,363 -8.4 Unprocessed raw materials 1,416 1,335 -5.7 Capital goods 13,529 15,014 11.0 Consumer goods 2,580 2,725 5.6 Mineral fuels & lubricants 3,273 3,761 14.9Balance -219 -1,698 –
Source: National Statistics Office.
An improved trade balance
Philippines 39
© The Economist Intelligence Unit Limited 2004 www.eiu.com Country Profile 2004
The turnaround in the trade balance in 1998-99 was the result not only of weakimport demand; the maintenance of double-digit export growth was the otherside of the coin. Trends in foreign demand had been positive for the Philippinesthroughout the 1990s, reflecting the dependence on the US market and thePhilippines’ competitiveness in a range of manufactures, above all electronicgoods. In 1999 electronics accounted for 70%. However, 2000 saw a markedslowdown in the growth in demand for Philippine electronic goods, followinga recovery from earthquake damage in Taiwan and the passing of the surge indemand that had resulted from the “millennium bug”. Over the year as awhole electronic goods earnings rose by only 7.9%.
In 2001 earnings declined sharply for the first time. It was the downturn inelectronic goods formerly the star performer that held export growth down in2000 and pulled exports into decline in 2001. US-dollar earnings from otherexports also fell because of the weakening in demand growth in the US and itsimplications for global trade. The modest recovery in exports in 2002 failed tomake up the ground lost in 2001, and export earnings consequently remainedbelow the 2000 level. A further fall in electronics exports in 2003 and threesuccessive annual falls in the value of clothing exports in 2001-03 lay behindthe sluggish increase in overall exports in 2003.
Trade liberalisation in the region
For over two decades now the Philippines has been lowering its (tariff andnon-tariff) trade barriers globally in line with its membership of GeneralAgreement on Tariffs and Trade (GATT) and the World Trade Organisation(WTO), and regionally as a member of the Association of South-East AsianNations (ASEAN). The regional trade liberalisation programme began in 1978when a mutual preference agreement came into effect, covering specified goodsincluding rice, sugar, crude oil, cement and chemicals. A programme of tariffreduction was agreed in 1992, designed to lead to the setting up of a free-tradearea (the ASEAN free-trade area, or AFTA) within 15 years, with a ceiling of 20%for tariffs on manufactured and processed goods within five to eight years, and5% by the end of the 15-year period. An accelerated programme, reducing theschedule to seven years, applied to 15 priority products. In 1993 the 15-yearperiod was shortened to ten years, with tariffs then below 20% falling to 5% by2000, and those over 20% scheduled to reach this level by 2003. For somegoods the 0-5% rate was to be implemented by 1998. Tariffs within ASEANwould thus fall to an average of 2.6% by 2003, from 13.4% in 1994. The goodsexcluded from the AFTA liberalisation were to be reduced in number, so thatthe programme’s coverage of intra-ASEAN trade would rise from 85% to nearly100%. This schedule fell victim to the regional economic and financial crisis of1997-98 when economic growth in ASEAN braked sharply, generatingprotectionist pressures to varying degrees. Consequently it was agreed in late2000 to relax the tariff-cutting schedule, and member states were permitted tokeep products on the temporary exclusion list longer.
Despite the impact of the Asian financial crisis, the Philippines had reduced theoverall average trade-weighted tariff on imports to 3.64% by 2003. A series oftariff increases were implemented in late 2003 and early 2004, but according to
The electronics downturn hitsexports hard
Tariff levels are broadly low
40 Philippines
Country Profile 2004 www.eiu.com © The Economist Intelligence Unit Limited 2004
the Philippine Tariff Commission these increase the average trade-weightedtariff to just 3.79%. The increases came in response to political pressure frombusinesses and unions alike to increase tariffs in the run-up to the elections, butwere much smaller than those demanded by interest groups. First, thescheduled reduction was suspended for petrochemical resins and certainfinished plastic products, although the tariff on the former was reduced and thefull cut is supposed to be applied in 2005. Then, more comprehensively, dutieswere raised from November 2003 through to 2007 on a list of 464manufactured goods including pharmaceuticals, clothing accessories, shoes andwooden furniture. In the following month the recommendations of thegovernment agency reviewing commitments under the WTO were accepted:increases in import duty on 671 items produced locally were implemented, andthe sharply higher rates imposed on some agricultural products in May 2003were retained.
Exports, once highly concentrated on the US market (which took around 35%of Philippine exports during most of the 1990s), have in recent years becomemore widely spread. In 2003 the US accounted for around 19% of Philippineexports, with the EU and Japan each taking 16%. Import sourcing is moreevenly split between Japan and the US, with Japan’s share underpinned by itsdominance as a provider of aid funds and its investment in manufacturing inthe Philippines. A growing investment presence has also pushed South Koreaup the table of import sources in the last decade. However, the most notablediversification has been towards trade with the Philippines’ partners inASEAN, which pulled ahead of Japan in 2003, taking nearly 18% of Philippineexports. Around one-half of Philippine exports to ASEAN go to Singapore; theisland state provides a similar proportion of Philippine imports from ASEAN.
Invisibles and the current account
In contrast to trade in goods, the balance on invisibles has always been in surplus.Historically, this was not enough to push the current-account balance into theblack, but trade surpluses or small trade deficits in recent years have allowed thecurrent account to remain in surplus. Thus the substantial surplus of US$6.3bnrecorded in 2000 narrowed sharply to US$1.3bn in 2001 as exports fell steeply,before recovering to US$4.2bn in 2002. The re-emergence of a small trade deficit in2003 brought the current-account surplus down to US$3.5bn.
The surplus on invisibles can be attributed largely to one item remittancesfrom overseas workers, which appear in the payments account as an incomeinflow rather than an unrequited transfer. Income credits have consistentlyremained around US$7bn-8bn in recent years, equivalent to between one-quarter and one-fifth of merchandise export earnings. Tourism also makes auseful contribution, at US$1.7bn in both 2001 and 2002. By far the mostimportant outflow on invisibles is interest, arising from the Philippines’substantial stock of external borrowing. However, interest payments havetended to stabilise since the mid-1990s, partly because of debt reschedulingand restructuring agreements. Transfers other than workers’ remittances make aminor positive contribution to the invisibles account, but the official
A modest diversification intrading partners
A structural surplus
Philippines 41
© The Economist Intelligence Unit Limited 2004 www.eiu.com Country Profile 2004
component has changed little in most recent years, as the Philippines’ middle-income status renders it ineligible for much in the way of grant funding.
The sizeable surplus on the current account in 1999 and 2000 temporarilyremoved a major funding requirement from the Philippine economy, but thesharp fall in the current-account surplus left the Philippines with a fundingrequirement of US$3.6bn in 2001. An improvement in the current account overthe past two years has since narrowed the funding requirement.
Capital flows and foreign debt
In every year from 1997 to 2000 there was a marked deterioration in thefinancial account balance, which fell to a deficit of US$4bn in 2000, comparedwith a surplus of US$11.1bn in 1996. The deficit in 2000 was sufficient to wipeout the record surplus on the current account, helping to push the overallpayments balance into deficit to the tune of US$376m. Payments moved backinto the black in 2001 and 2002, but the surpluses remained small, despite theincrease in the current-account surplus in 2002.
Trends in investment flows lie at the root of the weakness in the financialaccount. Direct investment inflows have been relatively low given the size ofthe economy and the guarantees enshrined in the constitution, generally fallingbetween US$1.5bn and US$2bn a year in balance-of-payments terms in recentyears. However, inflows fell to just US$319m in 2003 amid political andsecurity concerns in advance of the recent election. Portfolio investment flows,inherently more volatile, have reflected international and regional economicdevelopments (such as the regional financial crisis in 1997), trends in theinterest differential on peso assets and foreign perceptions of political risk. Thusportfolio investment registered a net inflow (net of foreign-currency bonds) ofUS$6.9bn in 1999 but a net outflow of US$706m in 2003.
The Philippines’ large financing requirement in the past has traditionally beenmet mainly by borrowing, from both official and private sources, and by aid.Foreign borrowing continues to be used to finance the budget deficit, to buildup reserves and as a mechanism to improve the maturity and reduce the costof foreign debt. Foreign debt, according to World Bank statistics, rose fromUS$24.4bn at end-1984 to US$59.3bn at end-2002. For most of this period thematurity profile of the debt was shifting away from short-term debt; short-termdebt as a proportion of total debt fell from an average of 37.6% in 1983-85 to anaverage of 13.7% in 1994-95. This reflected the major funding support given tothe administration of Corazon Aquino by multilateral lending institutions andbilateral official creditors. As a result, official creditors accounted for 59% of totalexternal debt at end-1995, compared with 26% in 1985. The trend towardsgreater long-term debt was interrupted in 1996-97 by an increase in short-termdebt, mainly to finance trade. With the onset of the regional financial crisis inmid-1997, and in line with falling imports, short-term trade debt eased down. Atend-2002 short-term liabilities represented just 9.4% of total external debt,down from 25.8% at end-1997.
A long-term fall in short-termliabilities
A weaker financial account
42 Philippines
Country Profile 2004 www.eiu.com © The Economist Intelligence Unit Limited 2004
The Philippines was in arrears on its foreign debt from the early 1980s and theearly 1990s, but has met its obligations consistently since 1993. The debt/GDP ratioin the Philippines is high, at 77.3% at end-2002, following a surge from 53.1% atend-1996 to 82.1% at end-1998 (reflecting the sharp devaluation of the peso in thesecond half of 1997 and the recession of 1998). The Philippines is not in imminentdanger of default, but the risk of a payments crisis cannot be discounted. Foreigninvestment inflows and the Philippines’ export performance in 2001-03 werep00r, and the certainty of continuing budget deficits over the next few yearsmeans that the government will continue to need to tap international markets. Asexports contracted in 2001, the debt-service ratio (debt service due as a percentageof the value of exports of goods and services) reached 18.9%, more than doublethe rate recorded in 1997. It is hoped that this will turn out to have been the peak,as the debt-service ratio fell to 17.4% in 2002, according to World Bank data.
Foreign reserves and the exchange rate
Foreign-exchange reserves steadied to US$12bn-14bn in 1999-2001 following thesharp fall registered in the regional financial crisis of 1997. The recovery ofreserves in 1998 and their strength in subsequent years reflected first theemergence and then the maintenance of a surplus on the current account. IMFfigures show that reserves (excluding gold) rose to US$13.5bn at end-2003, butfell below US$13bn in early 2004. The Philippines’ foreign-exchange reservesare equivalent to around four months of import cover.
Over the long term the peso has depreciated against the US dollar. However,this depreciation has tended to be realised through sharp one-off correctionsafter periods when the steadiness of the peso against the dollar has producedan appreciation in real terms as a result of the large inflation differential. Aradical correction occurred during the regional economic crisis of 1997. After thepeso was floated in July 1997, it depreciated by 34% against the US dollar withinsix months, ending the year at P39.98:US$1. The currency then hovered aroundthis level for most of 1998 and into 1999.
Paradoxically, although the current account was registering a persistent andrising surplus in 2000, the peso weakened sharply in that year and fell furtherin 2001. Initially this stemmed from the rise in the US federal funds rates asPhilippine interest rates held steady, which sapped demand for peso-denominated assets. However, from the beginning of 2000 political factorscame into play, culminating in October, when the corruption allegations againstthe former president, Joseph Estrada, caused the peso to plunge to P51.43:US$1at end-October. This brought the depreciation since the beginning of 2000 to24%. The peso then briefly stabilised although with sharp daily fluctuations inresponse to every twist in the impeachment proceedings.
The currency entered a period of relative stability after Gloria MacapagalArroyo took over the presidency in late January 2001, fluctuating within anarrow band around the P50:US$1 mark and ending the year at P51.4:US$1. Thedepreciation of 13.3% in the peso’s average value in 2001 was in line with trendsshown by other major currencies against the US dollar. The attempted mutinyin July 2003 led to a further bout of peso weakness, and the announcement
Debt repayment risk
The peso suffers from boutsof weakness
Reserves remain adequate
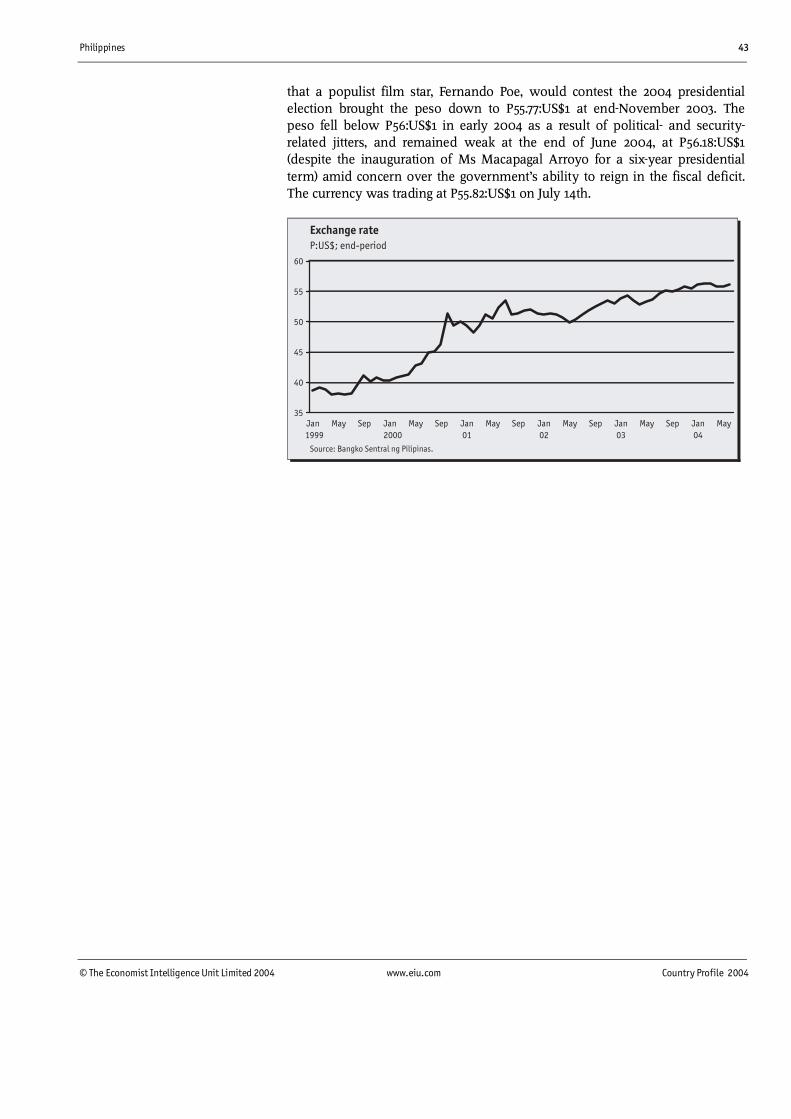
Philippines 43
© The Economist Intelligence Unit Limited 2004 www.eiu.com Country Profile 2004
that a populist film star, Fernando Poe, would contest the 2004 presidentialelection brought the peso down to P55.77:US$1 at end-November 2003. Thepeso fell below P56:US$1 in early 2004 as a result of political- and security-related jitters, and remained weak at the end of June 2004, at P56.18:US$1(despite the inauguration of Ms Macapagal Arroyo for a six-year presidentialterm) amid concern over the government’s ability to reign in the fiscal deficit.The currency was trading at P55.82:US$1 on July 14th.
44 Philippines
Country Profile 2004 www.eiu.com © The Economist Intelligence Unit Limited 2004
Regional overview
Membership of organisations
The Association of South-East Asian Nations was established in 1967. The fiveoriginal members were Indonesia, Malaysia, the Philippines, Singapore andThailand. Brunei joined in 1984, as did Vietnam in 1995, Laos and Myanmar in1997 and, most recently, Cambodia in 1999.
ASEAN summit meetings, which bring together the heads of government ofmember states, must now be held every three years. The most recent was inIndonesia in 2003. Informal summits of heads of governments are also held. Inaddition, the foreign and economic affairs ministers of member countries meetannually. Joint meetings of foreign and economic affairs ministers are held beforeeach ASEAN summit. There is also a standing committee (consisting of themembers’ accredited ambassadors to the host country), which usually meetsevery two months. There is a permanent secretariat, based in the Indonesiancapital, Jakarta, and a number of committees.
The organisation started with some grand objectives, but has generally failed todeliver. Early hopes that ASEAN could engineer a regional economicdevelopment strategy with particular countries concentrating on particularindustries were soon dashed. In 1977 the Basic Agreement on theEstablishment of ASEAN Preferential Tariffs was concluded, but a decade lateronly about 5% of trade between members was covered by this system.(Members had been permitted to exclude “sensitive” sectors, a let-out clausethat a subsequent agreement in 1987 only slightly curtailed.)
Plans for a proper ASEAN free-trade area (AFTA) were unveiled in 1992, with theaim of achieving this by 2008. A common effective preferential tariff (CEPT)scheme was applied in 1993, providing for the gradual reduction of tariffs on intra-ASEAN trade in certain goods over a number of years. Again, however, memberstates could exclude “sensitive” items, limiting progress. A new AFTA programme,covering a wider spread of products, was launched in 1994. During the mid-1990sthe timescale for implementing the programme was steadily tightened, with theaim being to reduce tariffs on most goods to below 5% by 2000. A limited AFTA,between the original six members of ASEAN and involving a reduction on tariffson intra-ASEAN trade to between 0% and 5%, came into operation on January 1st2002. (Countries joining recently have been allowed more time.)
The 1997-98 regional financial crisis exposed ASEAN’s failings in a brutalfashion. The organisation was unable to stop the regional currencydevaluations or alleviate the subsequent economic hardship. A Statement onBold Measures, released at end-1998, was exactly the opposite of what the titleimplied. Unfolding events in Indonesia then moved the focus on to theorganisation’s security plans. ASEAN members’ commitment to the principle ofnon-interference in the internal affairs of other members complicated theresponse to the crisis in East Timor. (Some members did eventually participatein the multinational force that intervened in East Timor, but not under ASEANauspices.)
Association of South-EastAsian Nations (ASEAN)

Philippines 45
© The Economist Intelligence Unit Limited 2004 www.eiu.com Country Profile 2004
On the economic front, ASEAN’s slow progress towards AFTA has encouragedsome of its members, notably Singapore, to opt instead for bilateral trade pacts.Singapore’s free-trade agreement (FTA) with New Zealand in 2000 promptedprotests from other ASEAN members, but the island state has since reachedbilateral trade agreements with the US, Australia and other countries. (It isunlikely that this approach will prove universally applicable, as the absence ofan agricultural sector in Singapore makes it much easier for it to negotiate withtrading partners with heavily protected primary sectors.) A decision in 2001 byvarious ASEAN members to set up bilateral currency-swap arrangements toprotect against currency volatility is limited in scope, and does not presagefurther ASEAN economic collaboration.
The organisation’s political hopes could be severely tested in the next fewyears. Changing governments in member countries could undermine anyremaining pretence of political consensus in the region. On the security front,the ASEAN Regional Forums (ARFs, which bring together the ASEAN ministersof foreign affairs with those of other countries, notably China) are likely toremain little more than talking shops, with negligible impact on changinggeopolitical trends.
APEC started life as a forum for informal discussion between six members ofthe Association of South-East Asian Nations (ASEAN), Brunei, Indonesia,Malaysia, the Philippines, Thailand and Singapore, and their six dialoguepartners in the Pacific, Australia, Canada, Japan, New Zealand, South Korea andthe US. In 1991 China, Hong Kong and Taiwan became members, followed byMexico and Papua New Guinea in 1993, and Chile in 1994. Peru, Russia andVietnam joined in 1998. APEC describes itself as “the primary vehicle forpromoting open trade and practical economic co-operation” in the region, withthe goal of advancing “Asia-Pacific economic dynamism and sense ofcommunity”.
APEC has had a permanent secretariat since 1992, and also runs fourpermanent committees on budget and managerial issues, on trade andinvestment, on economic trends generally, and on economic and technical co-operation. In addition, there are 11 working groups on agricultural technical co-operation, energy, fisheries, human resources, industrial science and technology,marine resource co-operation, small and medium-sized enterprises,telecommunications, tourism, trade promotion and transport. There is also anAPEC business advisory council (ABAC), which includes up to three seniorprivate-sector representatives from each member country. APEC as a whole hasits headquarters in Singapore, while ABAC is based in the Philippines. APEC’smain business is done at annual meetings of member states’ ministers offoreign affairs and economic affairs, which are followed by informal gatheringsof members’ heads of state. Every other ministerial meeting is held in a South-east Asian country. The chairmanship of APEC rotates on a yearly basis.
During the 1990s APEC’s star first waxed brighter and then started to wane. Thehigh point was probably reached in 1994, when members agreed a timetablefor the liberalisation of trade across the region: the ambitious aim was toeliminate all trade barriers by 2020, and then to extend reciprocal concessions
Asia-Pacific EconomicCo-operation (APEC) forum
46 Philippines
Country Profile 2004 www.eiu.com © The Economist Intelligence Unit Limited 2004
to non-members. In 1995 and 1996 APEC debated how best to achieve thistarget, but discussions in 1997 and 1998 were driven off course by the regionalfinancial crisis. APEC’s response to the crisis generally worded exhortations tomember states to develop financial and capital markets, and so on was farfrom convincing and signalled the inherent weaknesses of the organisation.Subsequent meetings also provided other distractions from the trade liberali-sation theme: East Timor in 1999, information technology in 2000 and security(following the September 11th terrorist attacks on the US) in 2001. Discussionreturned to trade relations in 2002, but was only very general in nature. The2003 meeting in Bangkok made little further progress, concluding with broadcommitments to multilateral trade and investment liberalisation, and toimproving regional security arrangements. Thus APEC has in effect gone backto its roots and become an informal talking shop, giving up all aspirations to bea serious regional reformer.
Philippines 47
© The Economist Intelligence Unit Limited 2004 www.eiu.com Country Profile 2004
Appendices
Sources of information
Bangko Sentral ng Pilipinas (BSP), Selected Philippine Economic Indicators, Manila
National Statistical Co-ordination Board (NSCB), Philippines Statistical Yearbook,Manila
National Statistics Office (NSO), Monthly Bulletin of Statistics, Manila
Bank for International Settlements, International Banking and Financial MarketDevelopments (quarterly)
Food and Agriculture Organisation, Quarterly Bulletin of Statistics, Rome
IMF, International Financial Statistics (monthly)
International Finance Corporation, Emerging Stockmarkets Factbook (annual)
International Institute for Strategic Studies, The Military Balance (annual),London
OECD, Geographical Distribution of Financial Flows to Aid Recipients (annual)
World Bank, Global Development Finance (annual)
World Bank, World Development Report (annual)
World Bureau of Metal Statistics, World Metal Statistics Yearbook
John Bresnan (ed), Crisis in the Philippines: The Marcos Era and Beyond, PrincetonUniversity Press, Princeton, 1987
Department of Energy, Philippines Energy Plan 1994-2010, Manila, 1997
Roland E Dolan (ed), The Philippines: A Country Study, Federal ResearchDivision, Library of Congress, Washington, 1993
E Gutierrez, I Torrente and N Narza, All in the Family: A Study of Elites and PowerRelations in the Philippines, Institute for People’s Democracy, Quezon City, 1992
Erika Jorgensen, A Strategy to Fight Poverty, World Bank, Washington, 1996
James Putzel, A Captive Land, Catholic Institute for International Relations,London, 1992
BSP, www.bsp.gov.ph
NSCB, www.nscb.gov.ph
NSO, www.census.gov.ph
National statistical sources
International statistical sources
Select bibliography andwebsites
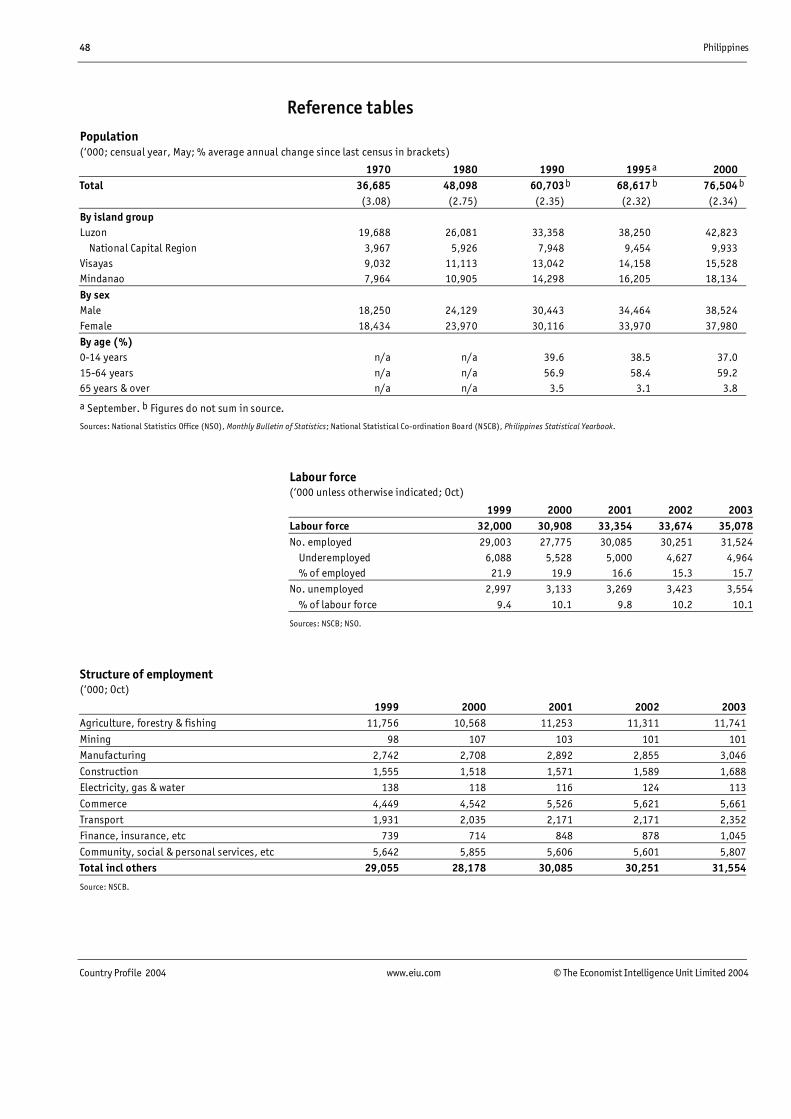
48 Philippines
Country Profile 2004 www.eiu.com © The Economist Intelligence Unit Limited 2004
Reference tablesPopulation(‘000; censual year, May; % average annual change since last census in brackets)
1970 1980 1990 1995 a 2000Total 36,685 48,098 60,703b 68,617 b 76,504 b
(3.08) (2.75) (2.35) (2.32) (2.34)By island groupLuzon 19,688 26,081 33,358 38,250 42,823 National Capital Region 3,967 5,926 7,948 9,454 9,933Visayas 9,032 11,113 13,042 14,158 15,528Mindanao 7,964 10,905 14,298 16,205 18,134
By sexMale 18,250 24,129 30,443 34,464 38,524Female 18,434 23,970 30,116 33,970 37,980By age (%)0-14 years n/a n/a 39.6 38.5 37.015-64 years n/a n/a 56.9 58.4 59.265 years & over n/a n/a 3.5 3.1 3.8
a September. b Figures do not sum in source.
Sources: National Statistics Office (NSO), Monthly Bulletin of Statistics; National Statistical Co-ordination Board (NSCB), Philippines Statistical Yearbook.
Labour force(‘000 unless otherwise indicated; Oct)
1999 2000 2001 2002 2003Labour force 32,000 30,908 33,354 33,674 35,078No. employed 29,003 27,775 30,085 30,251 31,524 Underemployed 6,088 5,528 5,000 4,627 4,964 % of employed 21.9 19.9 16.6 15.3 15.7No. unemployed 2,997 3,133 3,269 3,423 3,554 % of labour force 9.4 10.1 9.8 10.2 10.1
Sources: NSCB; NSO.
Structure of employment(‘000; Oct)
1999 2000 2001 2002 2003Agriculture, forestry & fishing 11,756 10,568 11,253 11,311 11,741
Mining 98 107 103 101 101Manufacturing 2,742 2,708 2,892 2,855 3,046
Construction 1,555 1,518 1,571 1,589 1,688Electricity, gas & water 138 118 116 124 113
Commerce 4,449 4,542 5,526 5,621 5,661Transport 1,931 2,035 2,171 2,171 2,352Finance, insurance, etc 739 714 848 878 1,045
Community, social & personal services, etc 5,642 5,855 5,606 5,601 5,807Total incl others 29,055 28,178 30,085 30,251 31,554
Source: NSCB.

Philippines 49
© The Economist Intelligence Unit Limited 2004 www.eiu.com Country Profile 2004
Transport statistics1999 2000 2001 2002 2003
VehiclesMotor vehicles registered (‘000) 3,534 3,701 3,866 4,188 4,292 Cars 775 768 730 750 n/aRailPhilippine National Railways Passengers (‘000) 541 374 319 265 240 Express freight ( tonnes) 2,813 1,941 1,686 1,700a 1,931Metro Manila Light Transit Rail passengers (m) 129 102 110 107 113
PortsTotal cargo handled (m tonnes) 142.9 149.8 147.9 149.5 158.0Total passenger traffic (m) 43.2 44.4 43.7 49.1 n/a
AirTotal domestic passenger traffic (‘000) 11,640 11,053 19,423 20,207 18,312
a Rounded figure.
Sources: NSCB; NSO.
Energy consumption by source(m barrels oil equivalent)
1998 1999 2000 2001 2002Indigenous 97.90 106.26 113.33 113.00 127.61 Oil 0.27 0.34 0.32 0.32 1.27 Coal 4.84 3.90 4.40 3.84 3.78 Gas 0.04 0.03 0.04 1.46 11.20 Hydroelectricity 8.74 13.50 13.45 12.25 12.13 Geothermal 15.37 18.28 20.05 18.00 17.66 Non-conventional (bagasse, etc) 68.65 70.22 75.08 77.13 79.04
Imported 142.33 139.23 137.57 135.45 129.87 Oil 128.93 122.30 113.30 112.56 103.76 Coal 13.40 16.94 24.28 22.89 26.11
Total 240.23 245.49 250.90 248.45 257.48
Source: NSCB.
Outstanding public-sector debt(P bn; end-period)
1999 2000 2001 2002 2003National government 1,775.4 2,166.7 2,384.9 2,815.5 3,355.1 Domestic 978.4 1,068.2 1,247.7 1,471.2 1,703.8 Foreign 797.0 1,098.5 1,137.2 1,344.3 1,651.3Contingent obligations 366.8 482.1 495.8 591.7 708.5
Total national government debt 2,142.2 2,648.8 2,880.7 3,407.2 4,063.6
Sources: Bureau of the Treasury; BSP.

50 Philippines
Country Profile 2004 www.eiu.com © The Economist Intelligence Unit Limited 2004
Government revenue and expenditure(P bn unless otherwise indicated; cash operations)
1999 2000 2001 2002 2003Revenue 478.5 514.8 563.7 567.1 626.6 Tax 431.7 460.0 489.9 496.4 537.4
Expenditure 590.2 649.0 710.8 777.9 826.5 Current 524.2 585.4 648.9 650.7 n/a Interest 106.3 140.9 174.8 185.9 226.4 Capital 61.2 60.4 57.4 124.6 n/aBalance -111.7 -134.2 -147.0 -210.7 199.9 % of GDP -3.7 -4.1 -4.0 -5.2 -4.6FinancingDomestic borrowing (net) 98.9 119.5 152.3 155.0 143.0Foreign borrowing (net) 82.8 84.4 22.9 109.1 143.9Non-budgetary accounts, use of
cash balances & miscellaneous 70.0 64.0 28.2 53.4 87.0
Sources: NSCB, Economic Indicators; Bangko Sentral ng Pilipinas (BSP), Selected Philippine Economic Indicators.
Money supply and credit(P bn unless otherwise indicated; end-period)
1999 2000 2001 2002 2003Currency in circulation 218.47 192.30 194.67 220.04 238.61
Demand deposits 172.87 192.98 191.94 252.77 274.92M1 incl others 395.56 390.55 392.25 478.48 519.84 % change, year on year 38.3 -1.3 0.4 22.0 8.6Time, saving & foreign-currency deposits 1,483.42 1,662.30 1,720.15 1,833.30 1,893.55M2 1,878.98 2,012.85 2,112.40 2,311.78 2,413.39 % change, year on year 16.0 7.1 4.9 9.4 4.4Domestic credit 1,911.82 2,088.82 2,130.52 2,247.55 2,395.08Claims on central & local government (net) 451.94 484.49 555.76 612.18 642.64Claims on non-financial public enterprises 65.44 97.51 112.90 155.23 252.23Claims on private sector 1,249.59 1,316.59 1,293.29 1,303.35 1,311.21Claims on other financial institutions 144.86 190.22 168.58 176.74 188.99Net foreign assets 278.29 302.37 329.81 480.66 573.46
Source: IMF, International Financial Statistics.
Interest rates(% annual rate; period averages)
1999 2000 2001 2002 2003Manila reference ratea 10.4 9.4 9.9 6.8 7.391-day Treasury bills 10.2 9.9 9.9 5.4 6.0Bank average lending rate 11.8 10.9 12.4 8.9 9.5
a All maturities.
Source: BSP, Selected Philippine Economic Indicators.
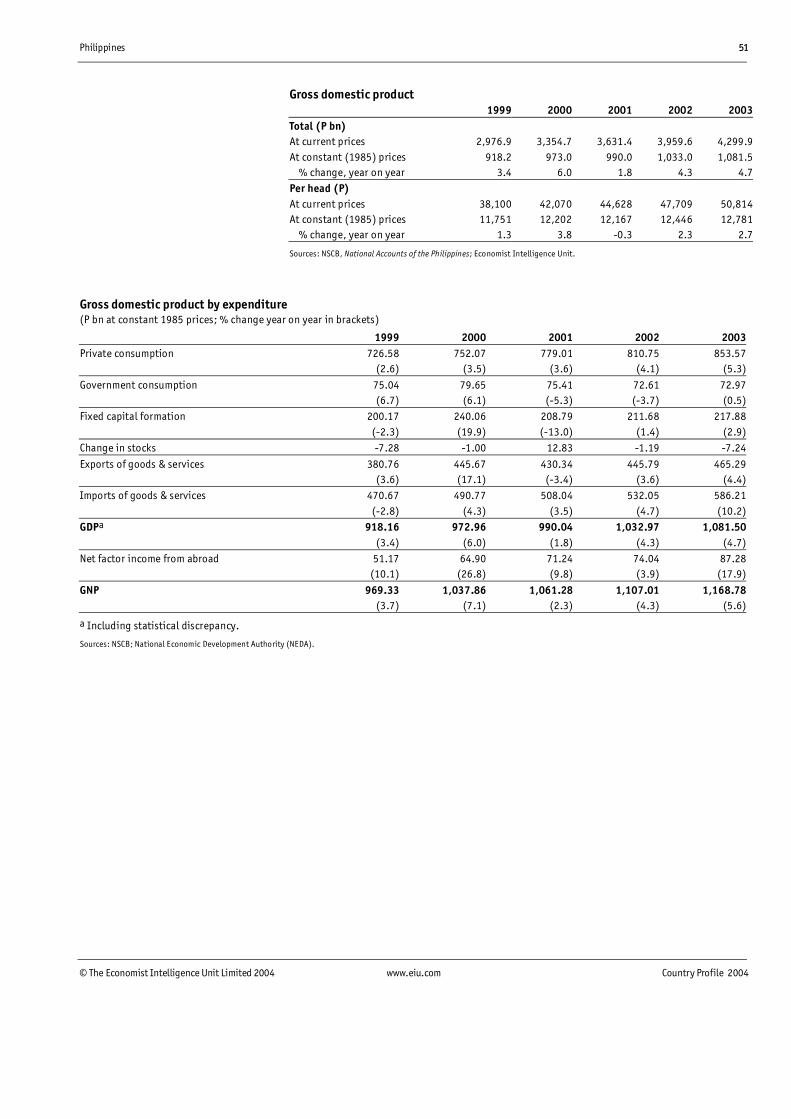
Philippines 51
© The Economist Intelligence Unit Limited 2004 www.eiu.com Country Profile 2004
Gross domestic product1999 2000 2001 2002 2003
Total (P bn)At current prices 2,976.9 3,354.7 3,631.4 3,959.6 4,299.9At constant (1985) prices 918.2 973.0 990.0 1,033.0 1,081.5 % change, year on year 3.4 6.0 1.8 4.3 4.7Per head (P)At current prices 38,100 42,070 44,628 47,709 50,814At constant (1985) prices 11,751 12,202 12,167 12,446 12,781 % change, year on year 1.3 3.8 -0.3 2.3 2.7
Sources: NSCB, National Accounts of the Philippines; Economist Intelligence Unit.
Gross domestic product by expenditure(P bn at constant 1985 prices; % change year on year in brackets)
1999 2000 2001 2002 2003Private consumption 726.58 752.07 779.01 810.75 853.57
(2.6) (3.5) (3.6) (4.1) (5.3)
Government consumption 75.04 79.65 75.41 72.61 72.97(6.7) (6.1) (-5.3) (-3.7) (0.5)
Fixed capital formation 200.17 240.06 208.79 211.68 217.88(-2.3) (19.9) (-13.0) (1.4) (2.9)
Change in stocks -7.28 -1.00 12.83 -1.19 -7.24
Exports of goods & services 380.76 445.67 430.34 445.79 465.29(3.6) (17.1) (-3.4) (3.6) (4.4)
Imports of goods & services 470.67 490.77 508.04 532.05 586.21(-2.8) (4.3) (3.5) (4.7) (10.2)
GDPa 918.16 972.96 990.04 1,032.97 1,081.50(3.4) (6.0) (1.8) (4.3) (4.7)
Net factor income from abroad 51.17 64.90 71.24 74.04 87.28(10.1) (26.8) (9.8) (3.9) (17.9)
GNP 969.33 1,037.86 1,061.28 1,107.01 1,168.78(3.7) (7.1) (2.3) (4.3) (5.6)
a Including statistical discrepancy.
Sources: NSCB; National Economic Development Authority (NEDA).
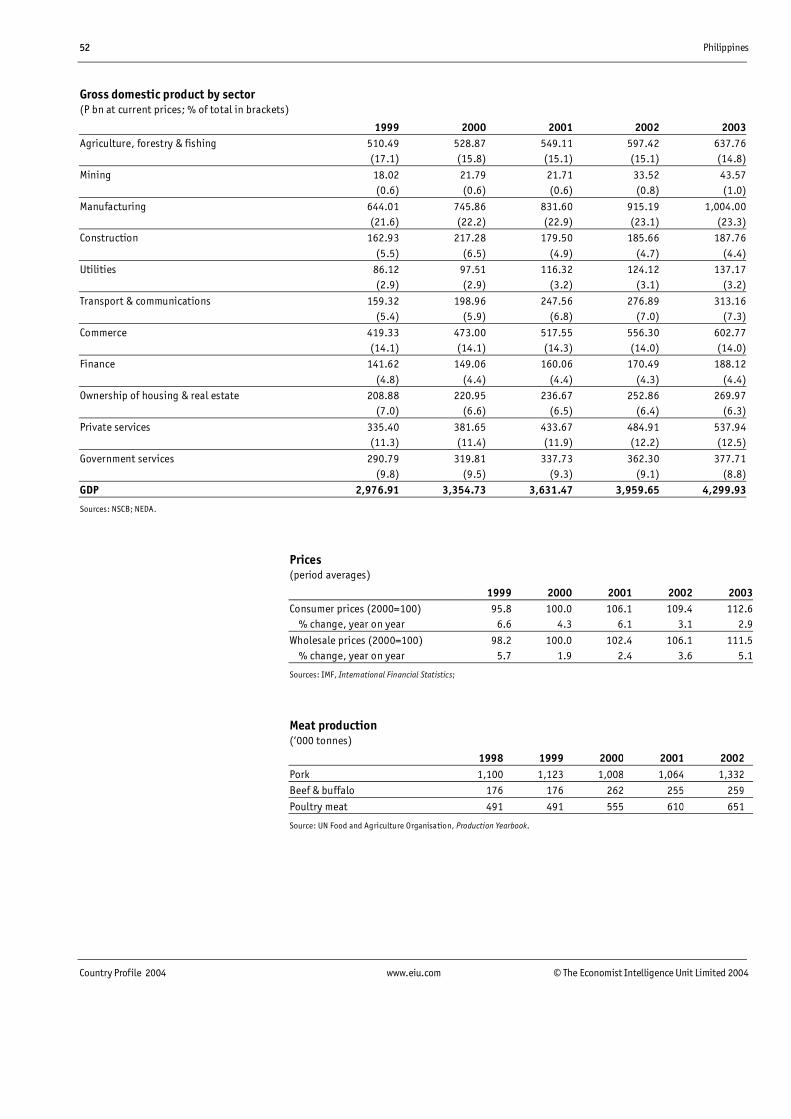
52 Philippines
Country Profile 2004 www.eiu.com © The Economist Intelligence Unit Limited 2004
Gross domestic product by sector(P bn at current prices; % of total in brackets)
1999 2000 2001 2002 2003Agriculture, forestry & fishing 510.49 528.87 549.11 597.42 637.76
(17.1) (15.8) (15.1) (15.1) (14.8)
Mining 18.02 21.79 21.71 33.52 43.57(0.6) (0.6) (0.6) (0.8) (1.0)
Manufacturing 644.01 745.86 831.60 915.19 1,004.00(21.6) (22.2) (22.9) (23.1) (23.3)
Construction 162.93 217.28 179.50 185.66 187.76(5.5) (6.5) (4.9) (4.7) (4.4)
Utilities 86.12 97.51 116.32 124.12 137.17(2.9) (2.9) (3.2) (3.1) (3.2)
Transport & communications 159.32 198.96 247.56 276.89 313.16(5.4) (5.9) (6.8) (7.0) (7.3)
Commerce 419.33 473.00 517.55 556.30 602.77(14.1) (14.1) (14.3) (14.0) (14.0)
Finance 141.62 149.06 160.06 170.49 188.12(4.8) (4.4) (4.4) (4.3) (4.4)
Ownership of housing & real estate 208.88 220.95 236.67 252.86 269.97(7.0) (6.6) (6.5) (6.4) (6.3)
Private services 335.40 381.65 433.67 484.91 537.94(11.3) (11.4) (11.9) (12.2) (12.5)
Government services 290.79 319.81 337.73 362.30 377.71(9.8) (9.5) (9.3) (9.1) (8.8)
GDP 2,976.91 3,354.73 3,631.47 3,959.65 4,299.93
Sources: NSCB; NEDA.
Prices(period averages)
1999 2000 2001 2002 2003Consumer prices (2000=100) 95.8 100.0 106.1 109.4 112.6 % change, year on year 6.6 4.3 6.1 3.1 2.9
Wholesale prices (2000=100) 98.2 100.0 102.4 106.1 111.5 % change, year on year 5.7 1.9 2.4 3.6 5.1
Sources: IMF, International Financial Statistics;
Meat production(‘000 tonnes)
1998 1999 2000 2001 2002Pork 1,100 1,123 1,008 1,064 1,332Beef & buffalo 176 176 262 255 259
Poultry meat 491 491 555 610 651
Source: UN Food and Agriculture Organisation, Production Yearbook.

Philippines 53
© The Economist Intelligence Unit Limited 2004 www.eiu.com Country Profile 2004
Production of major crops(‘000 tonnes unless otherwise indicated)
1998 1999 2000 2001 2002Rice 8,555 11,787 12,389 12,950 13,271Maize (unshelled) 3,823 4,585 4,511 4,528 4,319
Coconuts (m tonnes) 10.9 10.5 12.5 13.2 13.7Sugar 1,549 1,624 1,620 1,805 n/a
Bananas 3,493 3,727 4,156 5,057 5,265Pineapples 1,489 1,519 1,524 1,618 1,636
Mangoes 932 800 855 879 956Coffee 122 116 117 131 124Rubber 223 215 186 259 263
Tobacco 62 56 50 48 50Abaca 71 74 78 73 67
Sources: NSCB; Sugar Regulatory Administration.
Output of wood products(‘000 cu metres)
1999 2000 2001 2002 2003Lumber 260 124 164 152 227Logs 726 580 386 256 482
Plywood 211 230 255 341 321Veneer 84 130 188 229 322
Sources: NSCB; Forest Management Bureau.
Fishing production(‘000 tonnes)
1998 1999 2000 2001 2002Commercial fishing 941 947 947 977 1,041Aquaculture 955 993 1,091 1,203 1,338
Municipal & sustenance fishinga 891 926 946 970 989Total 2,786 2,868 2,983 3,149 3,368
a Fishing with boats of 3 gross tonnes or less, or without boats.
Source: NSCB.
Private construction1998 1999 2000 2001 2002
Building permits (no.)Total 82,971 80,884 70,436 77,857 91,471 Residential 59,059 54,857 47,911 52,980 63,516Value (P m) 69,163 69,786 69,863 68,200 85,917National Capital Region 21,939 20,777 33,018 24,313 38,985 Residential 24,278 26,647 24,598 28,534 36,377
Sources: NSCB; NSO.

54 Philippines
Country Profile 2004 www.eiu.com © The Economist Intelligence Unit Limited 2004
Mineral production(‘000 tonnes unless otherwise indicated)
1999 2000 2001 2002 2003Gold (tonnes) 31.1 35.7 40.5 29.3 37.8Silver (tonnes) 19.4 15.6 27.4 11.0 9.6
Nickela 20.7 17.4 22.8 26.5 21.2Coppera 34.5 30.6 20.3 18.4 20.4
Copper (refined) 148.0 138.7 164.5 144.3 171.2Chromite 15.4 0.3 26.2 14.2 31.0
Coal 1,211 1,290 1,335 1,665 2,032Crude oil (‘000 barrels) 313 418 475 2,020 n/a
Note. Gold output figures provided by various sources differ markedly.
a Ores and concentrates.
Sources: World Bureau of Metal Statistics, World Metal Statistics Yearbook; NSCB; NSO.
Manufacturing production(% volume change, year on year)
1999 2000 2001 2002 2003Food 1.0 1.3 0.9 0.9 0.0
Beverages 0.2 -4.1 -9.9 -12.3 -1.4Tobacco 5.4 6.0 -9.5 5.9 -51.7
Textiles -8.8 -4.3 -7.6 20.1 17.6Garments & footwear -17.3 -4.1 -4.6 -4.7 -15.5
Wood & products -17.0 -0.2 6.5 -9.2 62.5Furniture & fixtures 2.0 3.4 -14.2 -3.3 1.7Paper & products -2.0 30.7 -23.2 -14.1 -7.3
Chemicals 20.1 -8.7 -12.4 -14.1 -7.2Petroleum products -14.9 7.3 -2.4 -19.1 5.7
Rubber products 56.9 -9.0 -21.3 -5.0 14.0Non-metallic mineral products -4.7 -30.9 -13.8 24.2 -4.6Basic metals -16.3 -10.5 -8.7 -9.7 97.4
Fabricated metal products -9,7 11.0 13.6 15.0 -6.0Electrical machinery 9.7 175.7 -15.7 1.6 -16.6
Non-electrical machinery 15.5 76.8 33.4 -17.6 17.5Transport equipment 0.5 -47.2 -4.6 3.4 -5.3
Total incl others 1.1 2.4 -5.7 -6.1 0.0
Source: BSP.
Philippines Stock Exchange indicators1999 2000 2001 2002 2003
Market capitalisation (P bn; year-end) 1,939 2,578 2,143 2,083 1,308Composite index (year-end) 2,143 1,495 1,168 1,018 1,422
No. of companies listed 226 230 232 235 234Total turnover (P bn) 781.0 357.7 159.6 319.5 290.7
Source: International Finance Corporation, Emerging Stockmarkets Review.

Philippines 55
© The Economist Intelligence Unit Limited 2004 www.eiu.com Country Profile 2004
Visitor arrivals by country/region of residence(‘000)
1999 2000 2001 2002 2003US 464 445 392 395 n/aJapan 388 391 344 342 n/a
South Korea 133 175 208 288 n/aHong Kong 160 147 134 156 n/a
Taiwan 144 76 85 103 n/aOverseas Filipinos 199 150 99 84 100
Total incl others 2,171 1,992 1,797 1,933 1,907
Sources: NSCB; Department of Tourism.
Exports(customs statistics, fob; US$ m)
1999 2000 2001 2002 2003Electronic products 24,787 26,754 21,615 24,322 23,686 Semiconductors 19,822 20,262 14,898 16,892 16,663 Electronic data-processing equipment 4,115 4,934 5,070 5,892 5,532 Consumer electronics 302 475 469 494 536 Automotive electronics 269 344 366 318 327Apparel & clothing 2,267 2,563 2,403 2,391 2,266Woodcraft & furniture 483 593 416 428 410
Ignition wiring sets, etc 506 576 482 520 n/aBananas 241 292 297 309 333
Coconut oil 342 464 418 353 505Petroleum products 216 436 242 353 537Pineapple & products 137 156 161 149 n/a
Shrimps & prawns 126 141 118 119 n/aFootwear 86 76 73 47 46
Fertilisers, manufactured 44 44 35 57 n/aCopper concentrate 43 28 10 13 12
Total incl others 35,037 38,078 32,150 35,208 35,752
Source: BSP.
Imports(US$ m; fob)
1999 2000 2001 2002 2003Telecommunications equipment & electrical machinery 6,891 6,973 6,115 7,235 8,379
Materials & accessories for the manufacture of electrical equipment 4,708 7,310 7,291 6,944 6,363Semi-processed manufactured goods 3,175 3,151 3,072 3,118 3,241Power-generating & specialised machines 2,396 2,471 1,972 1,784 1,882
Consumer goods 2,644 2,523 2,483 2,580 2,725Crude oil 1,998 3,050 2,695 2,263 2,524
Semi-processed chemicals 2,507 2,619 2,514 2,555 2,878Total incl others 30,742 34,490 33,057 35,427 37,448
Source: BSP.

56 Philippines
Country Profile 2004 www.eiu.com © The Economist Intelligence Unit Limited 2004
Key commodity exports(‘000 tonnes unless otherwise indicated)
1999 2000 2001 2002 2003Coconut oil 479 1,036 1,315 945 1,184Desiccated coconut 76 74 76 107 107
Copra meal & cake 281 582 690 385 508Copper concentrates 146 83 58 46 36
Copper metal 143 129 157 143 167Gold (‘000 oz) 1,783 1,591 786 848 1,857
Bananas 1,320 1,599 1,601 1,685 1,829Fresh & preserved fish 89 99 77 83 93 Shrimps & prawns 11 12 13 17 19
Sugar 143 139 57 89 138Pineapples (canned) 183 205 206 186 197
Timber (‘000 cu metres) 70 205 70 91 120
Source: NSCB.
Main trading partners(% of total value)
1999 2000 2001 2002 2003Exports fob to:US 29.8 29.8 27.9 23.6 19.8ASEAN 14.0 15.7 15.5 15.7 17.6 Singapore 7.0 6.2 7.2 7.1 6.8 Malaysia 4.2 3.6 3.5 4.7 6.5EU 20.2 17.9 19.3 18.1 16.4 Netherlands 8.2 7.8 9.3 7.5 8.2Japan 13.3 14.7 15.7 15.8 16.1Hong Kong 5.6 5.0 4.9 3.8 8.6Taiwan 8.5 7.5 6.6 6.5 6.3China 1.6 1.7 2.5 3.9 6.0Imports fob from:Japan 20.0 19.2 20.6 20.8 20.4US 20.7 17.0 16.9 19.1 19.7ASEAN 13.8 15.7 15.8 16.2 16.3 Singapore 5.7 6.7 6.1 6.7 6.8EU 8.9 7.7 9.3 7.8 8.0South Korea 8.9 7.5 6.6 7.7 6.4Taiwan 5.3 6.2 5.4 4.9 5.0Hong Kong 4.0 3.9 4.3 4.7 4.3
Source: NSCB.

Philippines 57
© The Economist Intelligence Unit Limited 2004 www.eiu.com Country Profile 2004
Balance of payments, IMF series(US$ m)
1998 1999 2000 2001 2002Goods: exports fob 29,496 34,211 37,295 31,243 34,383Goods: imports fob -29,524 -29,252 -33,481 -31,986 -33,975
Trade balance -28 4,959 3,814 -743 408Services: credit 7,477 4,803 3,972 3,148 3,056
Services: debit -10,107 -7,515 -6,402 -5,198 -4,320Income: credit 6,440 8,082 7,804 7,152 7,931
Income: debit -2,671 -3,622 -3,367 -3,483 -3,381Current transfers: credit 758 607 552 517 594Current transfers: debit -323 -95 -115 -70 -91
Current-account balance 1,546 7,219 6,258 1,323 4,197Capital account balance 0 -8 38 -12 -19Direct investment abroad -160 29 108 160 -85Direct investment in the Philippines 2,287 1,725 1,345 982 1,111Portfolio investment assets -603 -807 -812 -399 -369
Portfolio investment liabilities -325 7,681 1,019 1,449 2,281Other investment assets 809 -18,639 -15,313 -13,898 -13,214
Other investment liabilities -1,525 7,761 9,611 11,312 7,536Financial account balance 483 -2,250 -4,042 -394 -2,740Net errors & omissions -750 -1,311 -2,630 -433 -1,432Overall balance 1,279 3,650 -376 484 6
Memorandum itemsTotal change in reserves and related items
(- indicates inflow) -1,938 -3,938 73 -476 400Use of IMF credit & loans 659 288 303 -8 -407
Source: IMF, International Financial Statistics.
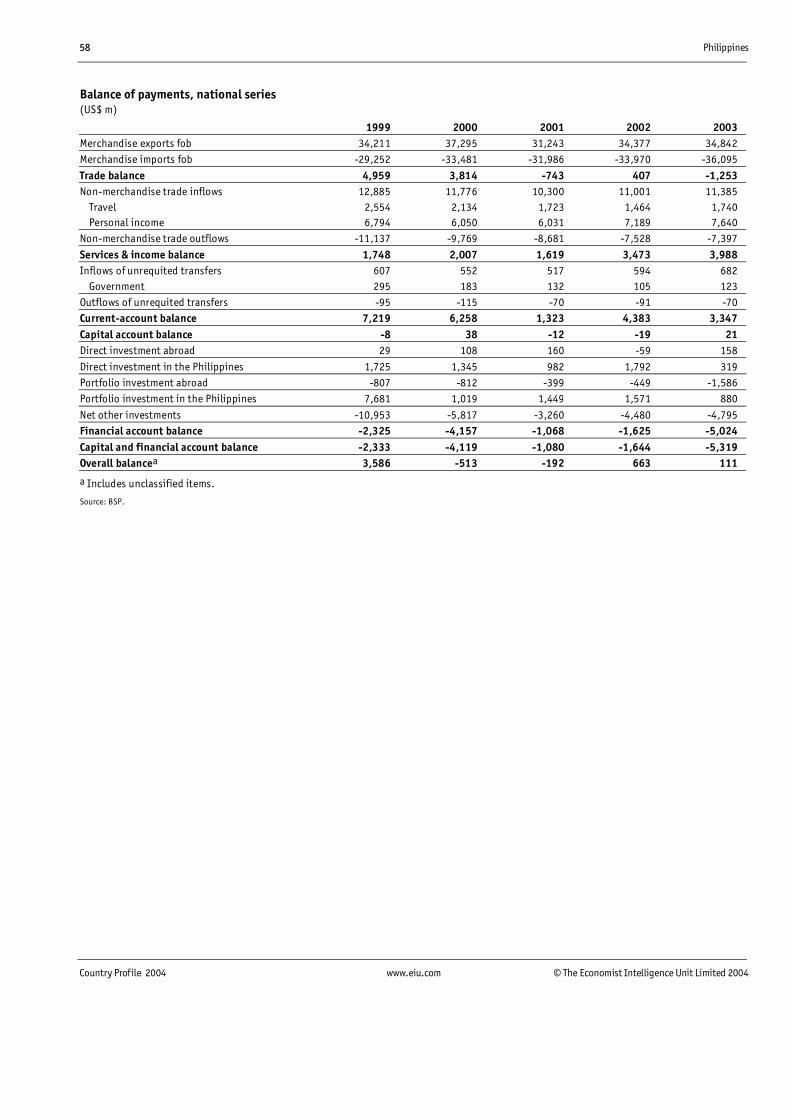
58 Philippines
Country Profile 2004 www.eiu.com © The Economist Intelligence Unit Limited 2004
Balance of payments, national series(US$ m)
1999 2000 2001 2002 2003Merchandise exports fob 34,211 37,295 31,243 34,377 34,842Merchandise imports fob -29,252 -33,481 -31,986 -33,970 -36,095
Trade balance 4,959 3,814 -743 407 -1,253Non-merchandise trade inflows 12,885 11,776 10,300 11,001 11,385 Travel 2,554 2,134 1,723 1,464 1,740 Personal income 6,794 6,050 6,031 7,189 7,640Non-merchandise trade outflows -11,137 -9,769 -8,681 -7,528 -7,397
Services & income balance 1,748 2,007 1,619 3,473 3,988Inflows of unrequited transfers 607 552 517 594 682 Government 295 183 132 105 123Outflows of unrequited transfers -95 -115 -70 -91 -70Current-account balance 7,219 6,258 1,323 4,383 3,347Capital account balance -8 38 -12 -19 21Direct investment abroad 29 108 160 -59 158
Direct investment in the Philippines 1,725 1,345 982 1,792 319Portfolio investment abroad -807 -812 -399 -449 -1,586Portfolio investment in the Philippines 7,681 1,019 1,449 1,571 880
Net other investments -10,953 -5,817 -3,260 -4,480 -4,795Financial account balance -2,325 -4,157 -1,068 -1,625 -5,024Capital and financial account balance -2,333 -4,119 -1,080 -1,644 -5,319Overall balancea 3,586 -513 -192 663 111
a Includes unclassified items.
Source: BSP.
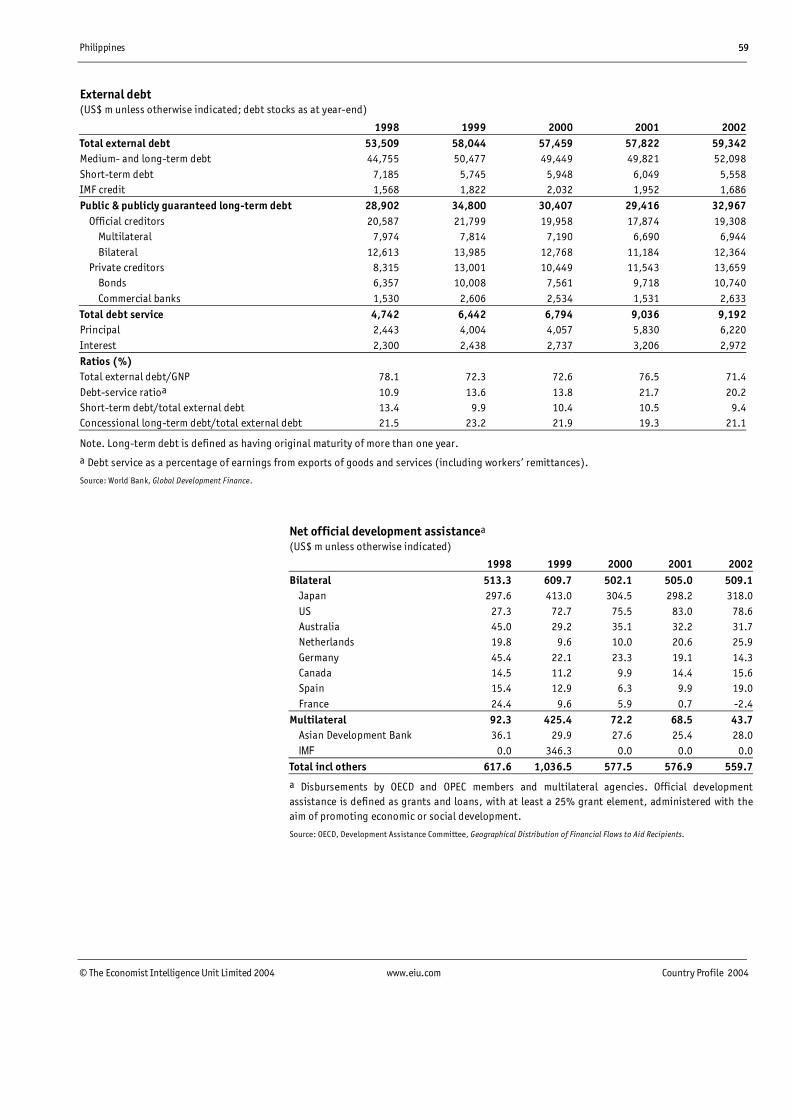
Philippines 59
© The Economist Intelligence Unit Limited 2004 www.eiu.com Country Profile 2004
External debt(US$ m unless otherwise indicated; debt stocks as at year-end)
1998 1999 2000 2001 2002Total external debt 53,509 58,044 57,459 57,822 59,342Medium- and long-term debt 44,755 50,477 49,449 49,821 52,098Short-term debt 7,185 5,745 5,948 6,049 5,558IMF credit 1,568 1,822 2,032 1,952 1,686Public & publicly guaranteed long-term debt 28,902 34,800 30,407 29,416 32,967 Official creditors 20,587 21,799 19,958 17,874 19,308 Multilateral 7,974 7,814 7,190 6,690 6,944 Bilateral 12,613 13,985 12,768 11,184 12,364 Private creditors 8,315 13,001 10,449 11,543 13,659 Bonds 6,357 10,008 7,561 9,718 10,740 Commercial banks 1,530 2,606 2,534 1,531 2,633Total debt service 4,742 6,442 6,794 9,036 9,192Principal 2,443 4,004 4,057 5,830 6,220Interest 2,300 2,438 2,737 3,206 2,972Ratios (%)Total external debt/GNP 78.1 72.3 72.6 76.5 71.4Debt-service ratioa 10.9 13.6 13.8 21.7 20.2Short-term debt/total external debt 13.4 9.9 10.4 10.5 9.4Concessional long-term debt/total external debt 21.5 23.2 21.9 19.3 21.1
Note. Long-term debt is defined as having original maturity of more than one year.
a Debt service as a percentage of earnings from exports of goods and services (including workers’ remittances).
Source: World Bank, Global Development Finance.
Net official development assistancea
(US$ m unless otherwise indicated)
1998 1999 2000 2001 2002Bilateral 513.3 609.7 502.1 505.0 509.1 Japan 297.6 413.0 304.5 298.2 318.0 US 27.3 72.7 75.5 83.0 78.6 Australia 45.0 29.2 35.1 32.2 31.7 Netherlands 19.8 9.6 10.0 20.6 25.9 Germany 45.4 22.1 23.3 19.1 14.3 Canada 14.5 11.2 9.9 14.4 15.6 Spain 15.4 12.9 6.3 9.9 19.0 France 24.4 9.6 5.9 0.7 -2.4Multilateral 92.3 425.4 72.2 68.5 43.7 Asian Development Bank 36.1 29.9 27.6 25.4 28.0 IMF 0.0 346.3 0.0 0.0 0.0Total incl others 617.6 1,036.5 577.5 576.9 559.7
a Disbursements by OECD and OPEC members and multilateral agencies. Official developmentassistance is defined as grants and loans, with at least a 25% grant element, administered with theaim of promoting economic or social development.
Source: OECD, Development Assistance Committee, Geographical Distribution of Financial Flows to Aid Recipients.
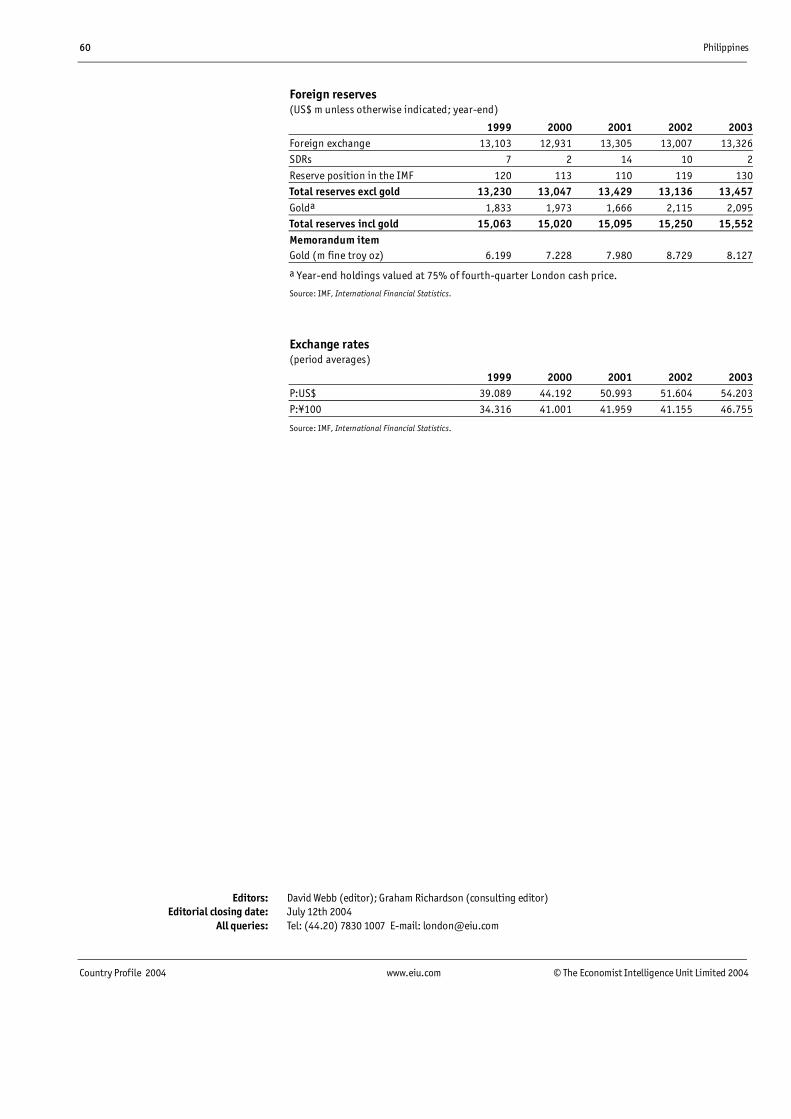
60 Philippines
Country Profile 2004 www.eiu.com © The Economist Intelligence Unit Limited 2004
Foreign reserves(US$ m unless otherwise indicated; year-end)
1999 2000 2001 2002 2003Foreign exchange 13,103 12,931 13,305 13,007 13,326SDRs 7 2 14 10 2
Reserve position in the IMF 120 113 110 119 130Total reserves excl gold 13,230 13,047 13,429 13,136 13,457Golda 1,833 1,973 1,666 2,115 2,095Total reserves incl gold 15,063 15,020 15,095 15,250 15,552Memorandum itemGold (m fine troy oz) 6.199 7.228 7.980 8.729 8.127
a Year-end holdings valued at 75% of fourth-quarter London cash price.
Source: IMF, International Financial Statistics.
Exchange rates(period averages)
1999 2000 2001 2002 2003P:US$ 39.089 44.192 50.993 51.604 54.203P:¥100 34.316 41.001 41.959 41.155 46.755
Source: IMF, International Financial Statistics.
Editors: David Webb (editor); Graham Richardson (consulting editor)Editorial closing date: July 12th 2004
All queries: Tel: (44.20) 7830 1007 E-mail: [email protected]