Embed Size (px)
Citation preview
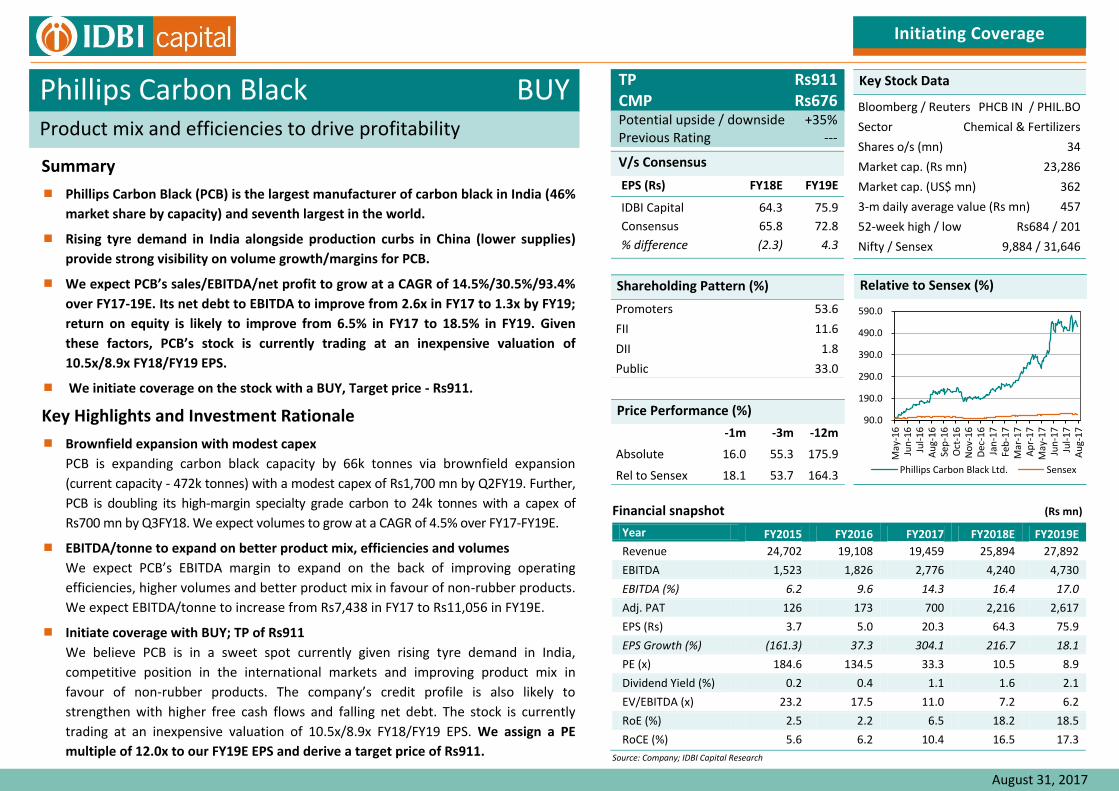
Initiating Coverage
Relative to Sensex (%)
Key Stock Data
Bloomberg / Reuters PHCB IN / PHIL.BO
Sector Chemical & Fertilizers
Shares o/s (mn) 34
Market cap. (Rs mn) 23,286
Market cap. (US$ mn) 362
3-m daily average value (Rs mn) 457
52-week high / low Rs684 / 201
Nifty / Sensex 9,884 / 31,646
BUY TP Rs911 CMP Rs676
Product mix and efficiencies to drive profitability Potential upside / downside +35% Previous Rating ---
Summary
Phillips Carbon Black (PCB) is the largest manufacturer of carbon black in India (46%
market share by capacity) and seventh largest in the world.
Rising tyre demand in India alongside production curbs in China (lower supplies)
provide strong visibility on volume growth/margins for PCB.
We expect PCB’s sales/EBITDA/net profit to grow at a CAGR of 14.5%/30.5%/93.4%
over FY17-19E. Its net debt to EBITDA to improve from 2.6x in FY17 to 1.3x by FY19;
return on equity is likely to improve from 6.5% in FY17 to 18.5% in FY19. Given
these factors, PCB’s stock is currently trading at an inexpensive valuation of
10.5x/8.9x FY18/FY19 EPS.
We initiate coverage on the stock with a BUY, Target price - Rs911.
Key Highlights and Investment Rationale
Brownfield expansion with modest capex
PCB is expanding carbon black capacity by 66k tonnes via brownfield expansion
(current capacity - 472k tonnes) with a modest capex of Rs1,700 mn by Q2FY19. Further,
PCB is doubling its high-margin specialty grade carbon to 24k tonnes with a capex of
Rs700 mn by Q3FY18. We expect volumes to grow at a CAGR of 4.5% over FY17-FY19E.
EBITDA/tonne to expand on better product mix, efficiencies and volumes
We expect PCB’s EBITDA margin to expand on the back of improving operating
efficiencies, higher volumes and better product mix in favour of non-rubber products.
We expect EBITDA/tonne to increase from Rs7,438 in FY17 to Rs11,056 in FY19E.
Initiate coverage with BUY; TP of Rs911
We believe PCB is in a sweet spot currently given rising tyre demand in India,
competitive position in the international markets and improving product mix in
favour of non-rubber products. The company’s credit profile is also likely to
strengthen with higher free cash flows and falling net debt. The stock is currently
trading at an inexpensive valuation of 10.5x/8.9x FY18/FY19 EPS. We assign a PE
multiple of 12.0x to our FY19E EPS and derive a target price of Rs911.
EPS (Rs) FY18E FY19E
IDBI Capital 64.3 75.9
Consensus 65.8 72.8
% difference (2.3) 4.3
V/s Consensus
Promoters 53.6
FII 11.6
DII 1.8
Public 33.0
90.0
190.0
290.0
390.0
490.0
590.0
May
-16
Jun
-16
Jul-
16
Au
g-1
6Se
p-1
6O
ct-1
6N
ov-
16
Dec
-16
Jan
-17
Feb
-17
Mar
-17
Ap
r-1
7M
ay-1
7Ju
n-1
7Ju
l-1
7A
ug-
17
Phillips Carbon Black Ltd. Sensex
Financial snapshot (Rs mn)
Year FY2015 FY2016 FY2017 FY2018E FY2019E
Revenue 24,702 19,108 19,459 25,894 27,892
EBITDA 1,523 1,826 2,776 4,240 4,730
EBITDA (%) 6.2 9.6 14.3 16.4 17.0
Adj. PAT 126 173 700 2,216 2,617
EPS (Rs) 3.7 5.0 20.3 64.3 75.9
EPS Growth (%) (161.3) 37.3 304.1 216.7 18.1
PE (x) 184.6 134.5 33.3 10.5 8.9
Dividend Yield (%) 0.2 0.4 1.1 1.6 2.1
EV/EBITDA (x) 23.2 17.5 11.0 7.2 6.2
RoE (%) 2.5 2.2 6.5 18.2 18.5
RoCE (%) 5.6 6.2 10.4 16.5 17.3
Source: Company; IDBI Capital Research
August 31, 2017
-1m -3m -12m
Absolute 16.0 55.3 175.9
Rel to Sensex 18.1 53.7 164.3
Price Performance (%)
Shareholding Pattern (%)
Phillips Carbon Black
Phillips Carbon Black | Initiating Coverage
2
Industry Overview
Carbon black – a critical raw material for tyre industry
Carbon black is produced by the thermal decomposition of hydrocarbons (liquid and gaseous hydrocarbons) under
controlled conditions, most commonly through incomplete combustion of the feedstock. The most common source
of feedstock for the production of carbon black is a heavy stream of hydrocarbon derived from coal or crude oil
processing, which is referred to as carbon black oil (CBO). Based on its properties, carbon black can be divided into
three broad categories: rubber black, high performance rubber black and non-rubber black, including Specialty
black.
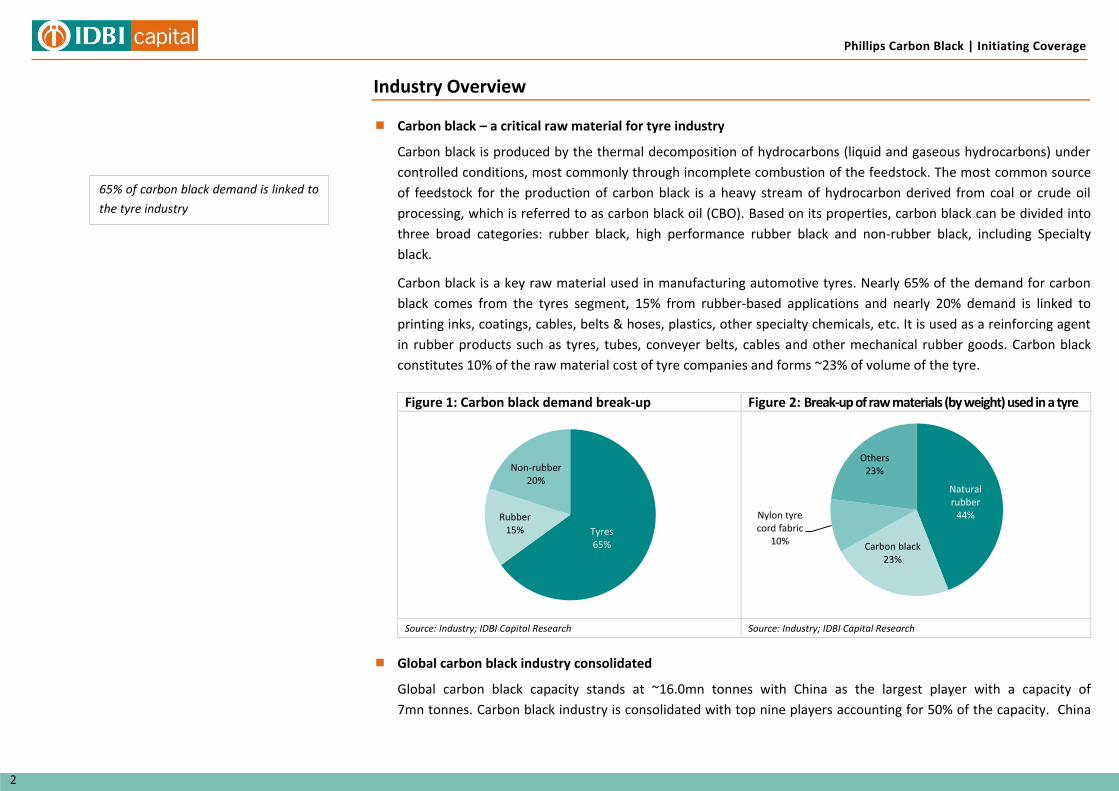
Carbon black is a key raw material used in manufacturing automotive tyres. Nearly 65% of the demand for carbon
black comes from the tyres segment, 15% from rubber-based applications and nearly 20% demand is linked to
printing inks, coatings, cables, belts & hoses, plastics, other specialty chemicals, etc. It is used as a reinforcing agent
in rubber products such as tyres, tubes, conveyer belts, cables and other mechanical rubber goods. Carbon black
constitutes 10% of the raw material cost of tyre companies and forms ~23% of volume of the tyre.
Figure 1: Carbon black demand break-up Figure 2: Break-up of raw materials (by weight) used in a tyre
Source: Industry; IDBI Capital Research Source: Industry; IDBI Capital Research
Global carbon black industry consolidated
Global carbon black capacity stands at ~16.0mn tonnes with China as the largest player with a capacity of
7mn tonnes. Carbon black industry is consolidated with top nine players accounting for 50% of the capacity. China
Tyres 65%
Rubber 15%
Non-rubber 20%
Natural rubber
44%
Carbon black 23%
Nylon tyre cord fabric
10%
Others 23%
65% of carbon black demand is linked to
the tyre industry
Phillips Carbon Black | Initiating Coverage 3
3
has the largest carbon black capacity (7 mn tonnes) while its domestic demand is ~4mn tonnes. Due to excess
capacity, exports from China have a major impact in the global carbon black market. China exports nearly 0.7mn
tonnes of carbon black annually.
Cabot Corp, Birla Carbon and Orion Engineered Carbons (Orion) are three largest carbon black manufacturers in the
world. Other prominent players include SID Richardson, Tokai Carbon, PCBL and Jiangxi Black Cat Carbon Black.
Even domestic carbon black industry remains consolidated; enjoys duty protection
India’s carbon black capacity is ~1.0mn tonnes with consumption of ~0.8mn tonnes in FY17. Domestic carbon black
industry is also consolidated with only five producers. PCB enjoys highest market share of 35% (FY17) in domestic
market according to our estimate. PCB also has 84% market share (FY17) in carbon black exports out of India.
In the domestic market, carbon black players enjoy protection as there is an anti-dumping duty on imports of carbon
black used in rubber applications from China of atleast $397/tonne till November 2020.
Table 1: Indian carbon black industry capacities
Companies Capacity (ktpa)
PCB 472
SKI Carbon Black India 315
Himadri Speciality Chemical 120
CCIL 85
RalsonCarbon 36
Source: Company; IDBI Capital Research
Lower crude prices makes Indian carbon black players competitive internationally
Carbon black can be manufactured using Carbon black feed stock (CBFS) or CBO. Indian companies used CBFS as
feedstock while Chinese companies use CBO as a feedstock due to abundant availability of coal tar in China.
Until CY14, Chinese companies enjoyed some inherent advantages as their plants were located adjacent to cheaper
raw material source. Also, they had better yields due to use of coal tar. This made them far more competitive
against the Indian players.
However, the scenario reversed since the beginning of CY15 when crude oil prices started falling. CBFS prices fell with fall
in crude oil prices. This led to lower prices for key raw material (CBFS) for Indian companies. While CBFS prices were
Domestic companies enjoy duty
protection as there is anti-dumping duty
on imports of carbon black from China
Phillips Carbon Black | Initiating Coverage
4
falling, stringent environmental norms in China led to a fall in carbon black production from small and marginal players. As
per our sources, the Chinese production continues to face restriction on account of pollution concerns, thus curbing
additional supplies in the global market.
Meanwhile, Indian companies became competitive in the international markets and they stepped up exports over
FY15-17 which helped their utilization levels and hence, margins.
Figure 3: Changing dynamics of carbon black demand-supply
Source: Industry; IDBI Capital Research
Expanding tyre manufacturers provide visibility on domestic volumes
Domestic carbon black manufacturers volumes have improved after the anti-dumping duty was imposed (November
2015) and also due to increase in exports (as Chinese manufacturers lost competitiveness) since the beginning of
FY16.
Looking ahead, domestic tyre companies are expanding their capacities which provide strong visibility on volume
offtake for domestic carbon black manufacturers.
FY13-15
Weak domestic demand, over-capacity leading to under-utilization for Indian companies
Dumping from China, Russia and other countries into India
High crude price leading to high raw material prices for domestic carbon black manufacturers
Anti-dumping duty imposed in November 2015
FY16 onwards
Improving domestic demand from tyre manufacturers
Fall in Chinese crude steel production and stringent pollution norms
for making carbon black leading to lower Chinese supplies
Fall in crude prices leading to lower raw material costs
Indian companies competitive in export market leading to higher sales in the overseas markets
Since the fall in crude oil prices, Indian
companies have become competitive in
the global carbon black market
Phillips Carbon Black | Initiating Coverage 5
5
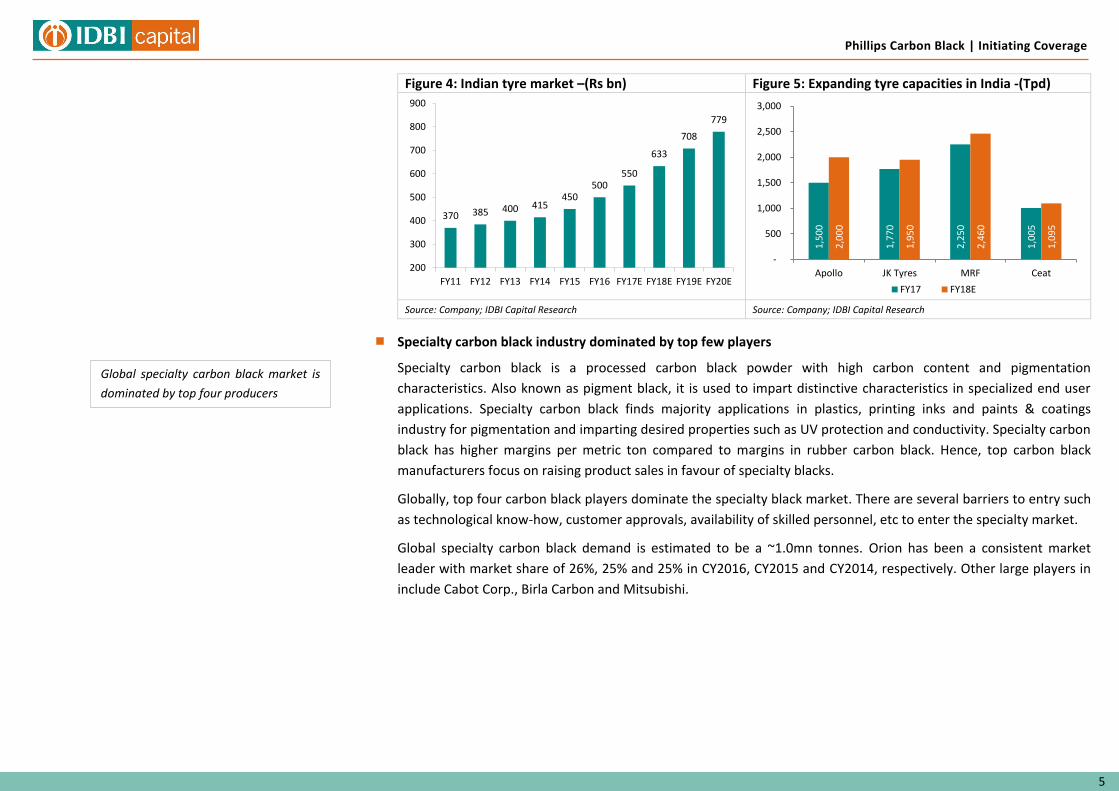
Figure 4: Indian tyre market –(Rs bn) Figure 5: Expanding tyre capacities in India -(Tpd)
Source: Company; IDBI Capital Research Source: Company; IDBI Capital Research
Specialty carbon black industry dominated by top few players
Specialty carbon black is a processed carbon black powder with high carbon content and pigmentation
characteristics. Also known as pigment black, it is used to impart distinctive characteristics in specialized end user
applications. Specialty carbon black finds majority applications in plastics, printing inks and paints & coatings
industry for pigmentation and imparting desired properties such as UV protection and conductivity. Specialty carbon
black has higher margins per metric ton compared to margins in rubber carbon black. Hence, top carbon black
manufacturers focus on raising product sales in favour of specialty blacks.
Globally, top four carbon black players dominate the specialty black market. There are several barriers to entry such
as technological know-how, customer approvals, availability of skilled personnel, etc to enter the specialty market.
Global specialty carbon black demand is estimated to be a ~1.0mn tonnes. Orion has been a consistent market
leader with market share of 26%, 25% and 25% in CY2016, CY2015 and CY2014, respectively. Other large players in
include Cabot Corp., Birla Carbon and Mitsubishi.
370 385 400 415 450
500 550
633
708
779
200
300
400
500
600
700
800
900
FY11 FY12 FY13 FY14 FY15 FY16 FY17E FY18E FY19E FY20E
1,5
00
1,7
70
2,2
50
1,0
05
2,0
00
1,9
50
2,4
60
1,0
95
-
500
1,000
1,500
2,000
2,500
3,000
Apollo JK Tyres MRF Ceat
FY17 FY18E
Global specialty carbon black market is
dominated by top four producers
Phillips Carbon Black | Initiating Coverage
6
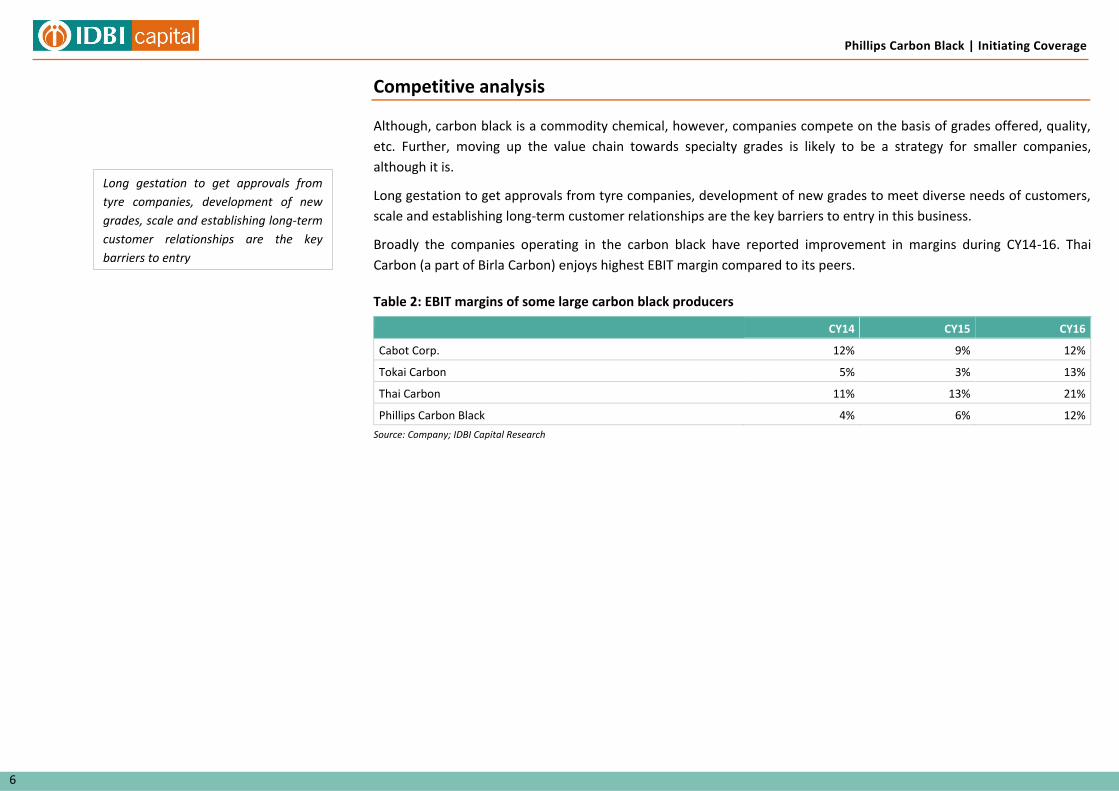
Competitive analysis
Although, carbon black is a commodity chemical, however, companies compete on the basis of grades offered, quality,
etc. Further, moving up the value chain towards specialty grades is likely to be a strategy for smaller companies,
although it is.
Long gestation to get approvals from tyre companies, development of new grades to meet diverse needs of customers,
scale and establishing long-term customer relationships are the key barriers to entry in this business.
Broadly the companies operating in the carbon black have reported improvement in margins during CY14-16. Thai
Carbon (a part of Birla Carbon) enjoys highest EBIT margin compared to its peers.
Table 2: EBIT margins of some large carbon black producers
CY14 CY15 CY16
Cabot Corp. 12% 9% 12%
Tokai Carbon 5% 3% 13%
Thai Carbon 11% 13% 21%
Phillips Carbon Black 4% 6% 12%
Source: Company; IDBI Capital Research
Long gestation to get approvals from
tyre companies, development of new
grades, scale and establishing long-term
customer relationships are the key
barriers to entry
Phillips Carbon Black | Initiating Coverage 7
7
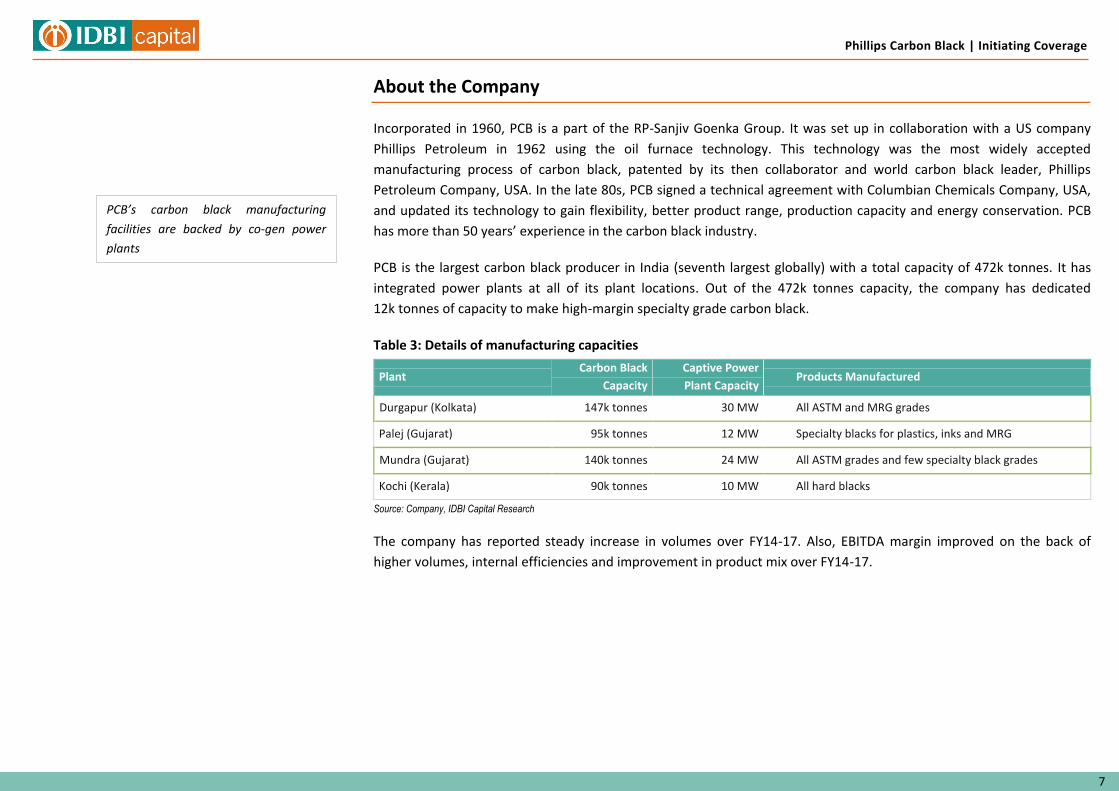
About the Company
Incorporated in 1960, PCB is a part of the RP-Sanjiv Goenka Group. It was set up in collaboration with a US company
Phillips Petroleum in 1962 using the oil furnace technology. This technology was the most widely accepted
manufacturing process of carbon black, patented by its then collaborator and world carbon black leader, Phillips
Petroleum Company, USA. In the late 80s, PCB signed a technical agreement with Columbian Chemicals Company, USA,
and updated its technology to gain flexibility, better product range, production capacity and energy conservation. PCB
has more than 50 years’ experience in the carbon black industry.
PCB is the largest carbon black producer in India (seventh largest globally) with a total capacity of 472k tonnes. It has
integrated power plants at all of its plant locations. Out of the 472k tonnes capacity, the company has dedicated
12k tonnes of capacity to make high-margin specialty grade carbon black.
Table 3: Details of manufacturing capacities
Plant Carbon Black
Capacity
Captive Power
Plant Capacity Products Manufactured
Durgapur (Kolkata) 147k tonnes 30 MW All ASTM and MRG grades
Palej (Gujarat) 95k tonnes 12 MW Specialty blacks for plastics, inks and MRG
Mundra (Gujarat) 140k tonnes 24 MW All ASTM grades and few specialty black grades
Kochi (Kerala) 90k tonnes 10 MW All hard blacks
Source: Company, IDBI Capital Research
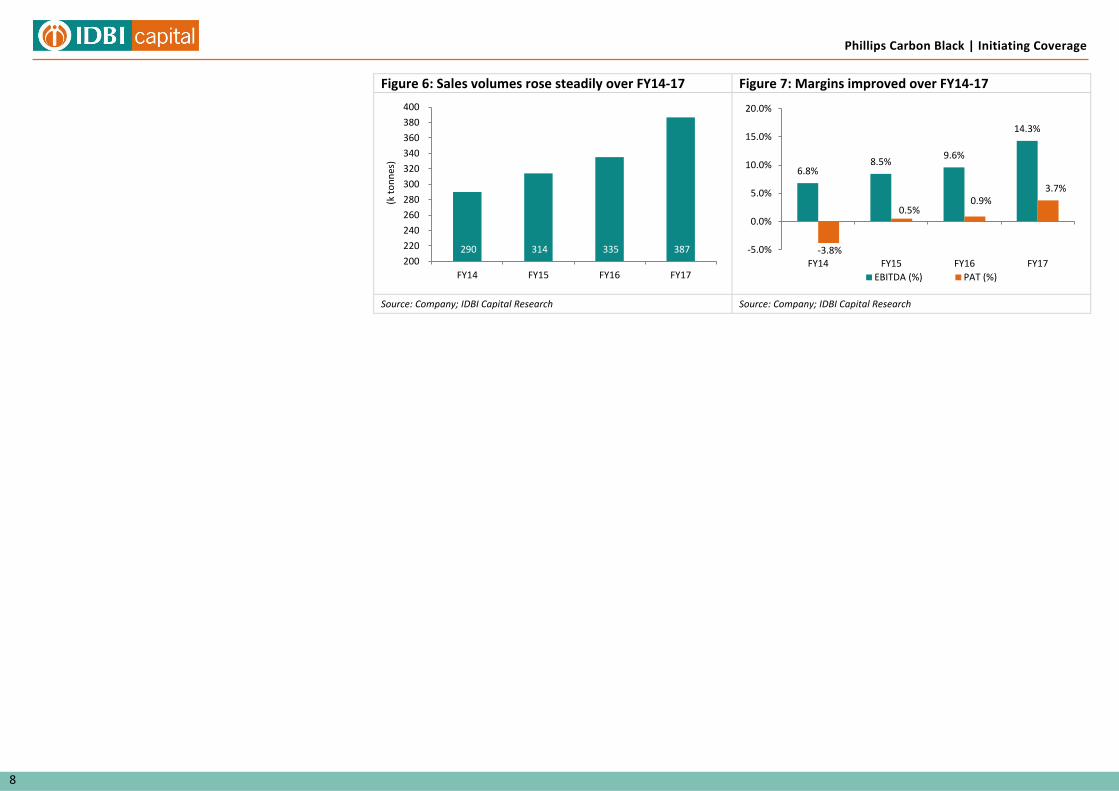
The company has reported steady increase in volumes over FY14-17. Also, EBITDA margin improved on the back of
higher volumes, internal efficiencies and improvement in product mix over FY14-17.
PCB’s carbon black manufacturing
facilities are backed by co-gen power
plants
Phillips Carbon Black | Initiating Coverage
8
Figure 6: Sales volumes rose steadily over FY14-17 Figure 7: Margins improved over FY14-17
Source: Company; IDBI Capital Research Source: Company; IDBI Capital Research
290 314 335 387 200
220
240
260
280
300
320
340
360
380
400
FY14 FY15 FY16 FY17
(k t
on
nes
)
6.8% 8.5%
9.6%
14.3%
-3.8%
0.5% 0.9%
3.7%
-5.0%
0.0%
5.0%
10.0%
15.0%
20.0%
FY14 FY15 FY16 FY17
EBITDA (%) PAT (%)
Phillips Carbon Black | Initiating Coverage 9
9
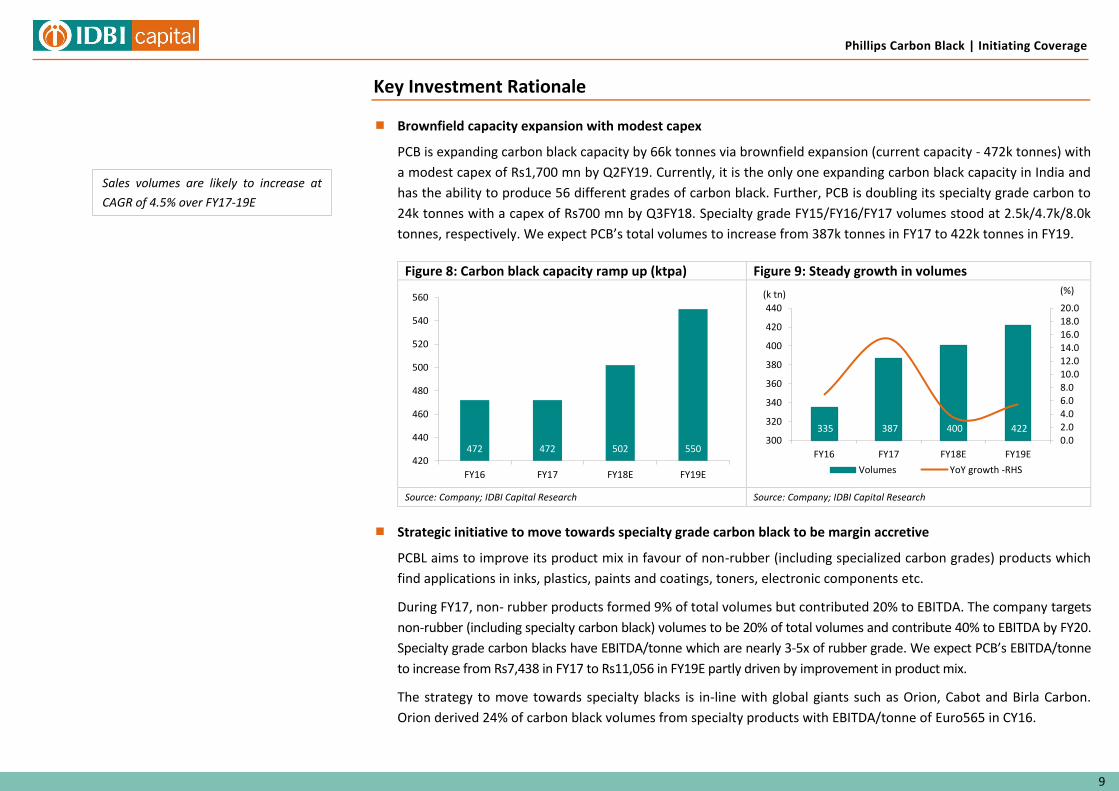
Key Investment Rationale
Brownfield capacity expansion with modest capex
PCB is expanding carbon black capacity by 66k tonnes via brownfield expansion (current capacity - 472k tonnes) with
a modest capex of Rs1,700 mn by Q2FY19. Currently, it is the only one expanding carbon black capacity in India and
has the ability to produce 56 different grades of carbon black. Further, PCB is doubling its specialty grade carbon to
24k tonnes with a capex of Rs700 mn by Q3FY18. Specialty grade FY15/FY16/FY17 volumes stood at 2.5k/4.7k/8.0k
tonnes, respectively. We expect PCB’s total volumes to increase from 387k tonnes in FY17 to 422k tonnes in FY19.
Figure 8: Carbon black capacity ramp up (ktpa) Figure 9: Steady growth in volumes
Source: Company; IDBI Capital Research Source: Company; IDBI Capital Research
Strategic initiative to move towards specialty grade carbon black to be margin accretive
PCBL aims to improve its product mix in favour of non-rubber (including specialized carbon grades) products which
find applications in inks, plastics, paints and coatings, toners, electronic components etc.
During FY17, non- rubber products formed 9% of total volumes but contributed 20% to EBITDA. The company targets
non-rubber (including specialty carbon black) volumes to be 20% of total volumes and contribute 40% to EBITDA by FY20.
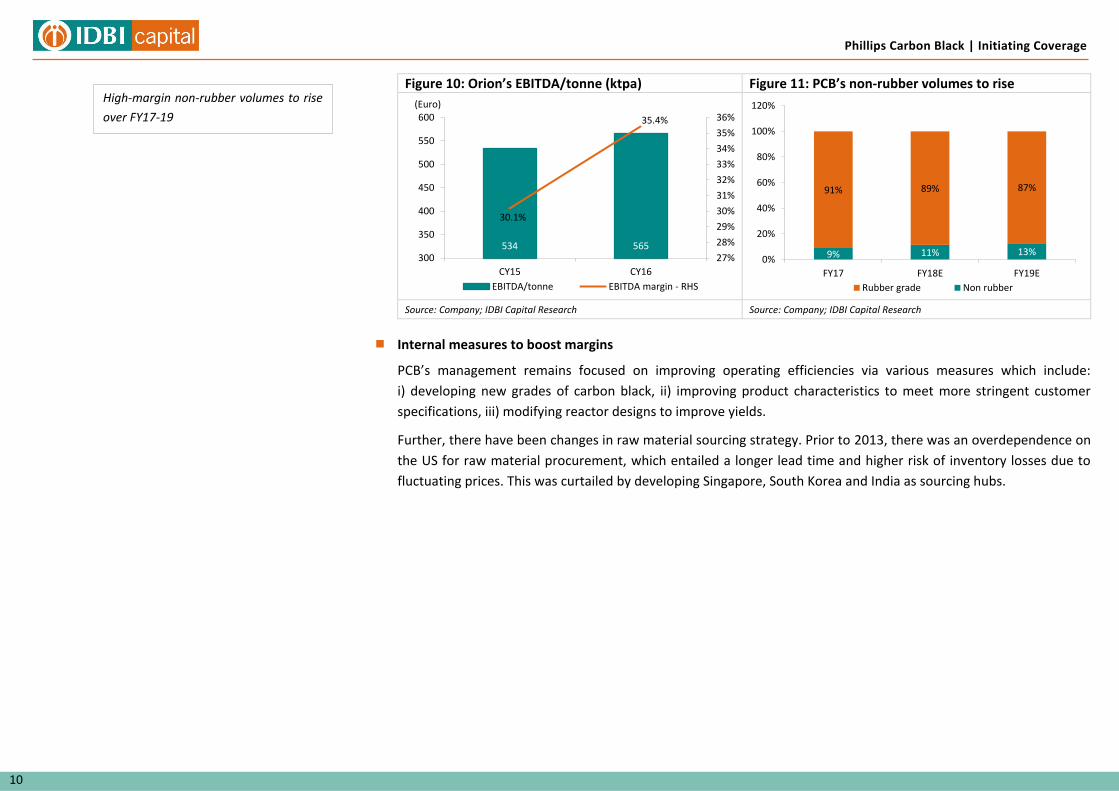
Specialty grade carbon blacks have EBITDA/tonne which are nearly 3-5x of rubber grade. We expect PCB’s EBITDA/tonne
to increase from Rs7,438 in FY17 to Rs11,056 in FY19E partly driven by improvement in product mix.
The strategy to move towards specialty blacks is in-line with global giants such as Orion, Cabot and Birla Carbon.
Orion derived 24% of carbon black volumes from specialty products with EBITDA/tonne of Euro565 in CY16.
472 472 502 550 420
440
460
480
500
520
540
560
FY16 FY17 FY18E FY19E
335 387 400 422 0.02.04.06.08.010.012.014.016.018.020.0
300
320
340
360
380
400
420
440
FY16 FY17 FY18E FY19E
Volumes YoY growth -RHS
(k tn) (%)
Sales volumes are likely to increase at
CAGR of 4.5% over FY17-19E
Phillips Carbon Black | Initiating Coverage
10
Figure 10: Orion’s EBITDA/tonne (ktpa) Figure 11: PCB’s non-rubber volumes to rise
Source: Company; IDBI Capital Research Source: Company; IDBI Capital Research
Internal measures to boost margins
PCB’s management remains focused on improving operating efficiencies via various measures which include:
i) developing new grades of carbon black, ii) improving product characteristics to meet more stringent customer
specifications, iii) modifying reactor designs to improve yields.
Further, there have been changes in raw material sourcing strategy. Prior to 2013, there was an overdependence on
the US for raw material procurement, which entailed a longer lead time and higher risk of inventory losses due to
fluctuating prices. This was curtailed by developing Singapore, South Korea and India as sourcing hubs.
534 565
30.1%
35.4%
27%
28%
29%
30%
31%
32%
33%
34%
35%
36%
300
350
400
450
500
550
600
CY15 CY16
EBITDA/tonne EBITDA margin - RHS
(Euro)
9% 11% 13%
91% 89% 87%
0%
20%
40%
60%
80%
100%
120%
FY17 FY18E FY19E
Rubber grade Non rubber
High-margin non-rubber volumes to rise
over FY17-19
Phillips Carbon Black | Initiating Coverage 11
11
Figure 12: Raw material dependency on imports has come off
Figure 13: EBITDA/tonne boosted by both, internal and external factors
Source: Company; IDBI Capital Research Source: Company; IDBI Capital Research
Also, the company has recruited several key personnel to drive internal efficiencies and raise specialty volumes.
Mr. Kaushik Roy, MD, has worked at Apollo Tyres for nearly 20 years before joining PCB in 2013. Further, several
several senior members with technical and marketing expertise in developing specialty carbon black products have
been added.
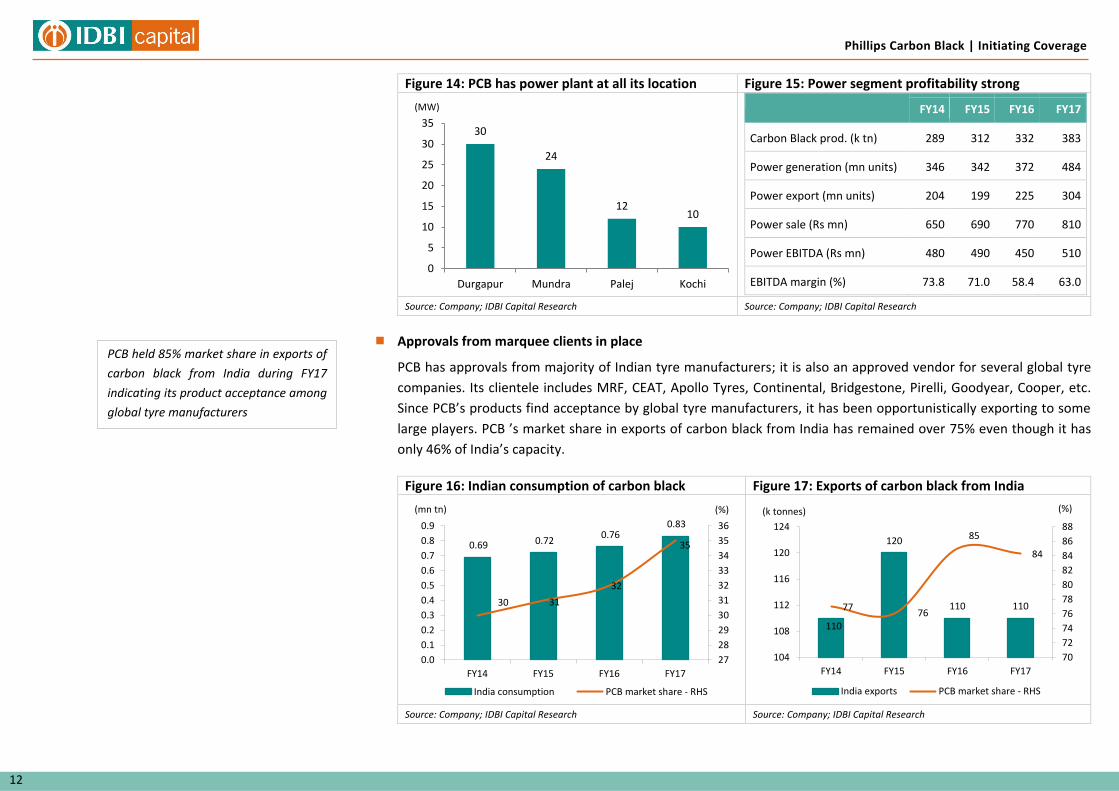
Power plant aid margins
PCB’s all four carbon black facilities generate power using lean gases which are generated during the process of
manufacturing carbon black. It generates 1,300 units of electricity per tonne of CB produced while per tonne of
carbon black requires 336 units of power. Approximately 40% of power generated is used to manufacture carbon
black while the balance is sold to the grid. Chinese carbon black manufacturers do not have co-generation power
plants and hence, PCB is competitive against the Chinese players.
92% 79% 86% 0%
10%
20%
30%
40%
50%
60%
70%
80%
90%
100%
FY15 FY16 FY17
Imported raw materials
4,762
5,983
6,704 6,865 7,337
8,596
9,892
3,000
4,000
5,000
6,000
7,000
8,000
9,000
10,000
11,000
FY15 FY16 Q1FY17 Q2FY17 Q3FY17 Q4FY17 Q1FY18
EBITDA/tonne has increased remarkably
since FY15
Phillips Carbon Black | Initiating Coverage
12
Figure 14: PCB has power plant at all its location Figure 15: Power segment profitability strong
FY14 FY15 FY16 FY17
Carbon Black prod. (k tn) 289 312 332 383
Power generation (mn units) 346 342 372 484
Power export (mn units) 204 199 225 304
Power sale (Rs mn) 650 690 770 810
Power EBITDA (Rs mn) 480 490 450 510
EBITDA margin (%) 73.8 71.0 58.4 63.0
Source: Company; IDBI Capital Research Source: Company; IDBI Capital Research
Approvals from marquee clients in place
PCB has approvals from majority of Indian tyre manufacturers; it is also an approved vendor for several global tyre
companies. Its clientele includes MRF, CEAT, Apollo Tyres, Continental, Bridgestone, Pirelli, Goodyear, Cooper, etc.
Since PCB’s products find acceptance by global tyre manufacturers, it has been opportunistically exporting to some
large players. PCB ’s market share in exports of carbon black from India has remained over 75% even though it has
only 46% of India’s capacity.
Figure 16: Indian consumption of carbon black Figure 17: Exports of carbon black from India
Source: Company; IDBI Capital Research Source: Company; IDBI Capital Research
30
24
12 10
0
5
10
15
20
25
30
35
Durgapur Mundra Palej Kochi
(MW)
0.69 0.72 0.76
0.83
30 31
32
35
27
28
29
30
31
32
33
34
35
36
0.0
0.1
0.2
0.3
0.4
0.5
0.6
0.7
0.8
0.9
FY14 FY15 FY16 FY17
India consumption PCB market share - RHS
(mn tn) (%)
110
120
110 110 77 76
85
84
70
72
74
76
78
80
82
84
86
88
104
108
112
116
120
124
FY14 FY15 FY16 FY17
India exports PCB market share - RHS
(k tonnes) (%)
PCB held 85% market share in exports of
carbon black from India during FY17
indicating its product acceptance among
global tyre manufacturers
Phillips Carbon Black | Initiating Coverage 13
13
EBITDA and return ratios to improve; leverage to come off
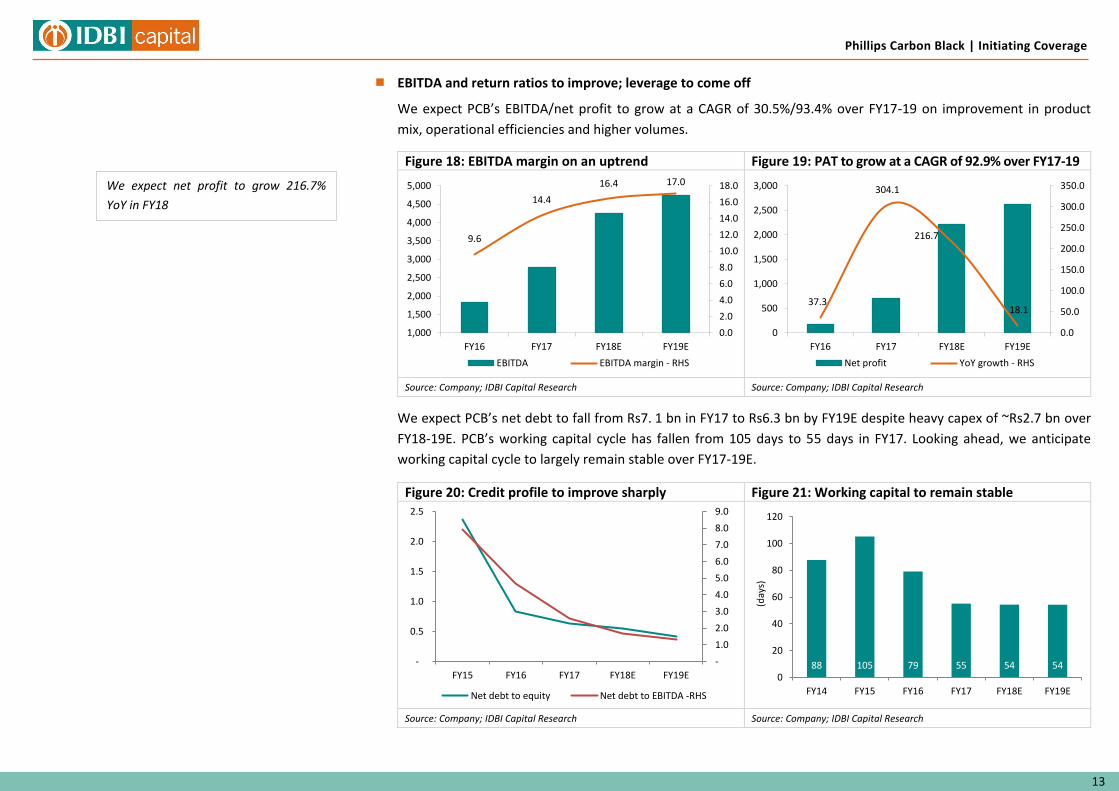
We expect PCB’s EBITDA/net profit to grow at a CAGR of 30.5%/93.4% over FY17-19 on improvement in product
mix, operational efficiencies and higher volumes.
Figure 18: EBITDA margin on an uptrend Figure 19: PAT to grow at a CAGR of 92.9% over FY17-19
Source: Company; IDBI Capital Research Source: Company; IDBI Capital Research
We expect PCB’s net debt to fall from Rs7. 1 bn in FY17 to Rs6.3 bn by FY19E despite heavy capex of ~Rs2.7 bn over
FY18-19E. PCB’s working capital cycle has fallen from 105 days to 55 days in FY17. Looking ahead, we anticipate
working capital cycle to largely remain stable over FY17-19E.
Figure 20: Credit profile to improve sharply Figure 21: Working capital to remain stable
Source: Company; IDBI Capital Research Source: Company; IDBI Capital Research
9.6
14.4
16.4 17.0
0.0
2.0
4.0
6.0
8.0
10.0
12.0
14.0
16.0
18.0
1,000
1,500
2,000
2,500
3,000
3,500
4,000
4,500
5,000
FY16 FY17 FY18E FY19E
EBITDA EBITDA margin - RHS
37.3
304.1
216.7
18.1
0.0
50.0
100.0
150.0
200.0
250.0
300.0
350.0
0
500
1,000
1,500
2,000
2,500
3,000
FY16 FY17 FY18E FY19E
Net profit YoY growth - RHS
-
1.0
2.0
3.0
4.0
5.0
6.0
7.0
8.0
9.0
-
0.5
1.0
1.5
2.0
2.5
FY15 FY16 FY17 FY18E FY19E
Net debt to equity Net debt to EBITDA -RHS
88 105 79 55 54 54 0
20
40
60
80
100
120
FY14 FY15 FY16 FY17 FY18E FY19E
(day
s)
We expect net profit to grow 216.7%
YoY in FY18
Phillips Carbon Black | Initiating Coverage
14
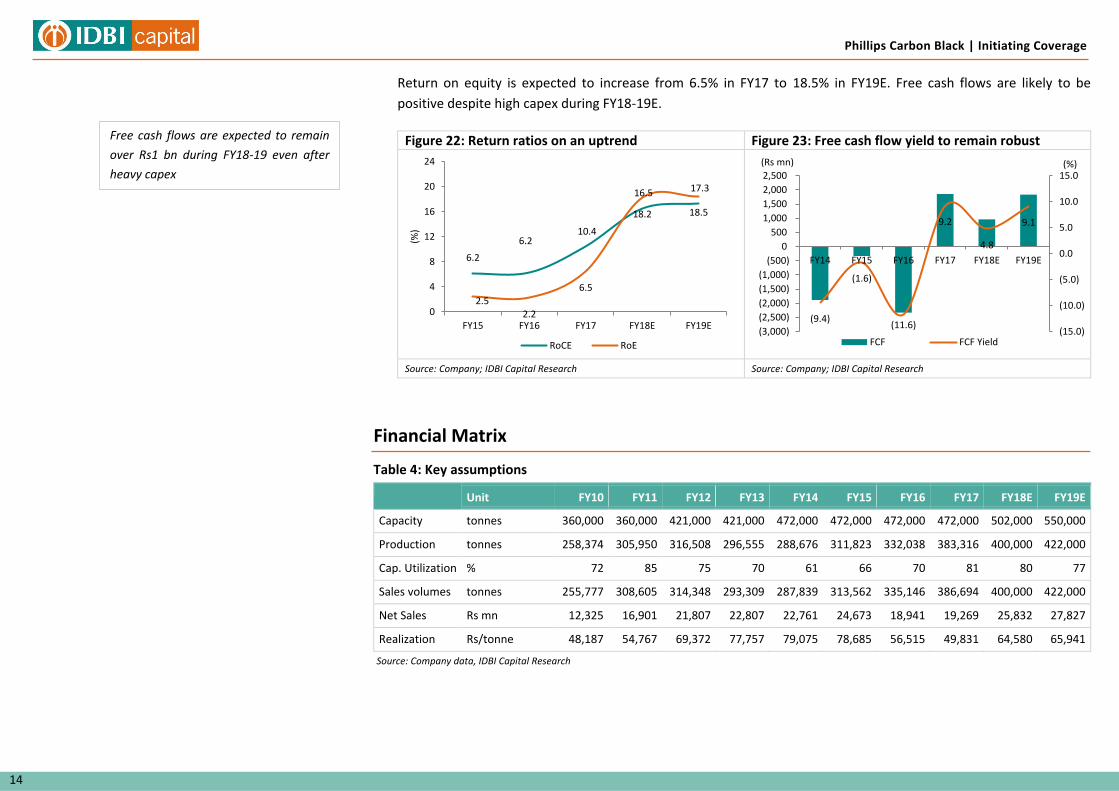
Return on equity is expected to increase from 6.5% in FY17 to 18.5% in FY19E. Free cash flows are likely to be
positive despite high capex during FY18-19E.
Figure 22: Return ratios on an uptrend Figure 23: Free cash flow yield to remain robust
Source: Company; IDBI Capital Research Source: Company; IDBI Capital Research
Financial Matrix
Table 4: Key assumptions
Unit FY10 FY11 FY12 FY13 FY14 FY15 FY16 FY17 FY18E FY19E
Capacity tonnes 360,000 360,000 421,000 421,000 472,000 472,000 472,000 472,000 502,000 550,000
Production tonnes 258,374 305,950 316,508 296,555 288,676 311,823 332,038 383,316 400,000 422,000
Cap. Utilization % 72 85 75 70 61 66 70 81 80 77
Sales volumes tonnes 255,777 308,605 314,348 293,309 287,839 313,562 335,146 386,694 400,000 422,000
Net Sales Rs mn 12,325 16,901 21,807 22,807 22,761 24,673 18,941 19,269 25,832 27,827
Realization Rs/tonne 48,187 54,767 69,372 77,757 79,075 78,685 56,515 49,831 64,580 65,941
Source: Company data, IDBI Capital Research
6.2
6.2 10.4
16.5 17.3
2.5 2.2
6.5
18.2 18.5
0
4
8
12
16
20
24
FY15 FY16 FY17 FY18E FY19E
(%)
RoCE RoE
(9.4)
(1.6)
(11.6)
9.2
4.8
9.1
(15.0)
(10.0)
(5.0)
0.0
5.0
10.0
15.0
(3,000)
(2,500)
(2,000)
(1,500)
(1,000)
(500)
0
500
1,000
1,500
2,000
2,500
FY14 FY15 FY16 FY17 FY18E FY19E
FCF FCF Yield
(%) (Rs mn)
Free cash flows are expected to remain
over Rs1 bn during FY18-19 even after
heavy capex
Phillips Carbon Black | Initiating Coverage 15
15
Valuation and Outlook
Initiate coverage with TP of Rs911, provides 35% upside potential; BUY
We believe PCB is in a sweet spot currently given rising tyre demand in India, competitive position in the
international markets and improving product mix with rising sales of specialty products. The company’s credit
profile is also likely to strengthen with higher free cash flows and declining debt. We expect PCB’s sales/EBITDA/net
profit to grow at a CAGR of 14.5%/30.5%/93.4% over FY17-19E. Its net debt to EBITDA to improve from 2.6x in FY17
to 1.3x by FY19; return on equity is likely to improve from 6.5% in FY17 to 18.5% in FY19. Given these factors, we
believe the stock is currently trading at an inexpensive valuation of 10.5x/8.9x FY18/FY19 EPS. We assign a PE
multiple of 12.0x to our FY19E EPS and derive a target price of Rs911.
Key risks
Rise in crude prices: A sharp increase in the crude oil price can impact the company's ability to compete with
Chinese players in the export market and thus affect its volumes and margins.
Slowdown in tyre demand: Demand for carbon black is mainly dependent on growth in the tyre industry. Any
slowdown in the domestic tyre demand can have adverse impact on PCB's volumes and margins.
Geopolitical risks: Sine the company procures raw material (CBFS) mainly from the overseas markets, any
geopolitical concerns could affect the company's ability to source raw material at desired prices.
PCB stock is currently trading at an
inexpensive valuation of 10.5x/8.9x
FY18/FY19 EPS
Phillips Carbon Black | Initiating Coverage
16
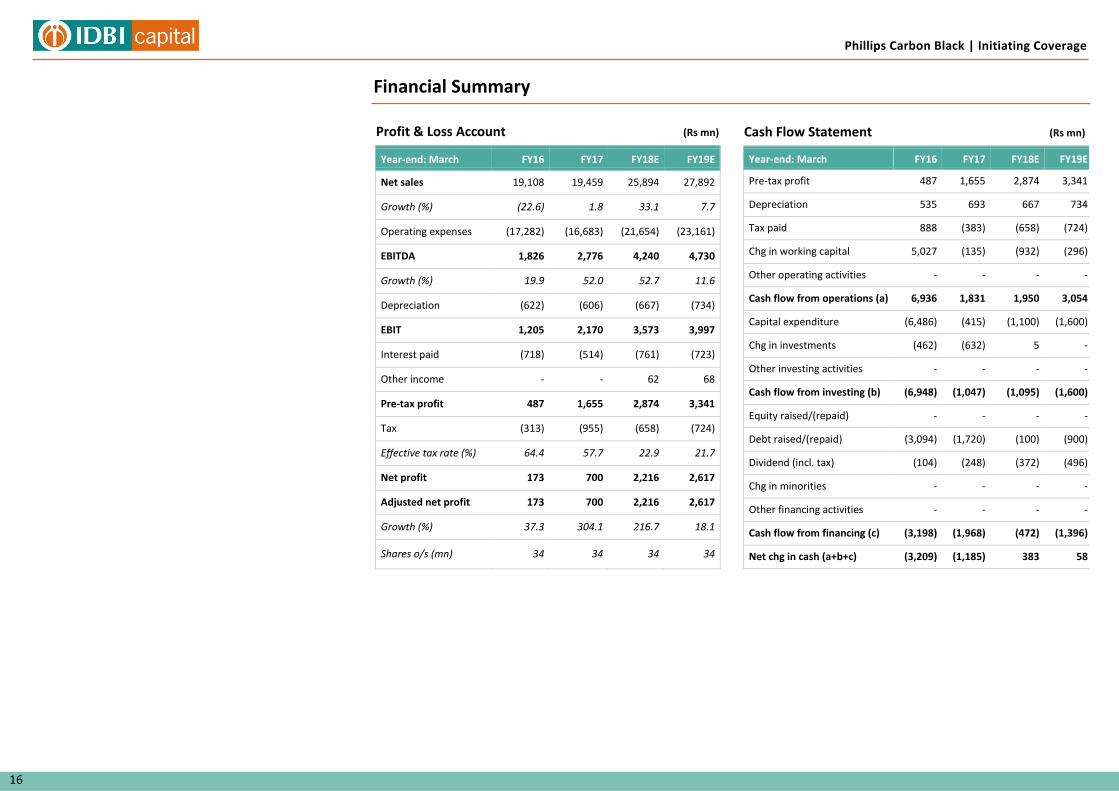
Financial Summary
Profit & Loss Account (Rs mn)
Year-end: March FY16 FY17 FY18E FY19E
Net sales 19,108 19,459 25,894 27,892
Growth (%) (22.6) 1.8 33.1 7.7
Operating expenses (17,282) (16,683) (21,654) (23,161)
EBITDA 1,826 2,776 4,240 4,730
Growth (%) 19.9 52.0 52.7 11.6
Depreciation (622) (606) (667) (734)
EBIT 1,205 2,170 3,573 3,997
Interest paid (718) (514) (761) (723)
Other income - - 62 68
Pre-tax profit 487 1,655 2,874 3,341
Tax (313) (955) (658) (724)
Effective tax rate (%) 64.4 57.7 22.9 21.7
Net profit 173 700 2,216 2,617
Adjusted net profit 173 700 2,216 2,617
Growth (%) 37.3 304.1 216.7 18.1
Shares o/s (mn) 34 34 34 34
Cash Flow Statement (Rs mn)
Year-end: March FY16 FY17 FY18E FY19E
Pre-tax profit 487 1,655 2,874 3,341
Depreciation 535 693 667 734
Tax paid 888 (383) (658) (724)
Chg in working capital 5,027 (135) (932) (296)
Other operating activities - - - -
Cash flow from operations (a) 6,936 1,831 1,950 3,054
Capital expenditure (6,486) (415) (1,100) (1,600)
Chg in investments (462) (632) 5 -
Other investing activities - - - -
Cash flow from investing (b) (6,948) (1,047) (1,095) (1,600)
Equity raised/(repaid) - - - -
Debt raised/(repaid) (3,094) (1,720) (100) (900)
Dividend (incl. tax) (104) (248) (372) (496)
Chg in minorities - - - -
Other financing activities - - - -
Cash flow from financing (c) (3,198) (1,968) (472) (1,396)
Net chg in cash (a+b+c) (3,209) (1,185) 383 58
Phillips Carbon Black | Initiating Coverage 17
17
Balance Sheet (Rs mn)
Year-end: March FY16 FY17 FY18E FY19E
Net fixed assets 14,891 14,613 15,046 15,912
Investments 1,737 2,369 2,363 2,363
Other non-curr assets - - - -
Current assets 9,129 8,643 10,073 10,760
Inventories 2,442 2,435 3,185 3,431
Sundry Debtors 4,382 4,657 4,954 5,337
Cash and Bank 506 250 192 116
Loans and advances 6 5 5 5
Total assets 25,757 25,624 27,483 29,036
a
Shareholders’ funds 10,384 11,259 13,103 15,224
Share capital 345 345 345 345
Reserves & surplus 10,039 10,915 12,758 14,879
Total Debt 9,103 7,383 7,283 6,383
Secured loans 7,053 5,481 5,581 5,081
Unsecured loans 2,050 1,902 1,702 1,302
Other liabilities 1,522 2,101 2,101 2,101
Curr Liab & prov 4,749 4,881 4,996 5,328
Current liabilities 4,713 4,824 4,937 5,265
Provisions 35 57 58 63
Total liabilities 15,374 14,365 14,380 13,812
Total equity & liabilities 25,757 25,624 27,483 29,036
Book Value (Rs) 301 327 380 442
Source: Company; IDBI Capital Research
Financial Ratios
Year-end: March FY16 FY17 FY18E FY19E
Adj. EPS (Rs) 5.0 20.3 64.3 75.9
Adj. EPS growth (%) 37.3 304.1 216.7 18.1
EBITDA margin (%) 9.6 14.3 16.4 17.0
Pre-tax margin (%) 2.5 8.5 11.1 12.0
ROE (%) 2.2 6.5 18.2 18.5
ROCE (%) 6.2 10.4 16.5 17.3
Turnover & Leverage ratios (x)
Asset turnover (x) 0.8 0.8 1.0 1.0
Leverage factor (x) 2.9 2.4 2.2 2.0
Net margin (%) 0.9 3.6 8.6 9.4
Net Debt/Equity (x) 0.8 0.6 0.5 0.4
Working Capital & Liquidity ratio
Inventory days 47 46 45 45
Receivable days 84 87 70 70
Payable days 57 90 72 72
Valuation
Year-end: March FY16 FY17 FY18E FY19E
P/E (x) 134.5 33.3 10.5 8.9
Price / Book value (x) 2.2 2.1 1.8 1.5
PCE (x) 29.3 17.8 8.1 6.9
EV / Net sales (x) 1.7 1.6 1.2 1.1
EV / EBITDA (x) 17.5 11.0 7.2 6.2
Dividend Yield (%) 0.4 1.1 1.6 2.1
Phillips Carbon Black | Initiating Coverage
18
Notes
Dealing (91-22) 6637 1150 [email protected]
Key to Ratings Stocks:
BUY: Absolute return of 15% and above; ACCUMULATE: 5% to 15%; HOLD: Upto ±5%; REDUCE: -5% to -15%; SELL: -15% and below.
IDBI Capital Markets & Securities Ltd. (Formerly known as “IDBI Capital Market Services Ltd.”) Equity Research Desk
3rd Floor, Mafatlal Centre, Nariman Point, Mumbai – 400 021. Phones: (91-22) 4322 1212; Fax: (91-22) 2285 0785; Email: [email protected]
SEBI Registration: BSE & NSE (Cash & FO) – INZ000007237, NSDL – IN-DP-NSDL-12-96, Research – INH000002459, CIN – U65990MH1993GOI075578
Compliance Officer: Christina D’souza; Email: [email protected]; Telephone: (91-22) 4322 1212 Disclaimer This document has been prepared by IDBI Capital Markets & Securities Ltd (formerly known as “IDBI Capital Market Services Ltd.”) (“IDBI Capital”) and is meant for the recipient only for use as intended and not for circulation. This document should not be reproduced or copied
or made available to others. No person associated with IDBI Capital is obligated to call or initiate contact with you for the purposes of elaborating or following up on the information contained in this document. The Report and information contained herein is strictly confidential
and meant for solely for the selected recipient and may not be altered in any way, transmitted to copied or distributed, in part or in whole , to any other person or to the media or reproduced in any form, without the prior written consent of IDBI Capital.
Recipients may not receive this report at the same time as other recipients. IDBI Capital will not treat recipients as customers by virtue of their receiving this report.
The information contained herein is from the public domain or sources believed to be reliable. While reasonable care has been taken to ensure that information given is at the time believed to be fair and correct and opinions based thereupon are reasonable, due to the very
nature of research it cannot be warranted or represented that it is accurate or complete and it should not be relied upon as such. In so far as this report includes current or historical information, it is believed to be reliable, although its accuracy and completeness cannot be
guaranteed.
Opinions expressed are current opinions as of the date appearing on this material only. While we endeavor to update on a reasonable basis, the information discussed in this material, IDBI Capital, its directors, employees are under no obligation to update or keep the
information current. Further there may be regulatory, compliance, or other reasons that prevent us from doing so.
Prospective investors and others are cautioned that any forward-looking statements are not predictions and may be subject to change without notice.
IDBI Capital, its directors and employees and any person connected with it, will not in any way be responsible for the contents of this report or for any losses, costs, expenses, charges, including notional losses/lost opportunities incurred by a recipient as a result of acting or non-
acting on any information/material contained in the report.
This is not an offer to sell or a solicitation to buy any securities or an attempt to influence the opinion or behaviour of investors or recipients or provide any investment/tax advice.
This report is for information only and has not been prepared based on specific investment objectives. The securities discussed in this report may not be suitable for all investors. Investors must make their own investment decision based on their own investment objectives,
goals and financial position and based on their own analysis.
Trading in stocks, stock derivatives, and other securities is inherently risky and the recipient agrees to assume complete and full responsibility for the outcomes of all trading decisions that the recipient makes, including but not limited to loss of capital.
Opinions, projections and estimates in this report solely constitute the current judgment of the author of this report as of the date of this report and do not in any way reflect the views of IDBI Capital, its directors, officers, or employees.
This report is not directed or intended for distribution to, or use by, any person or entity who is a citizen or resident of or located in any locality, state, country or other jurisdiction, where such distribution, publication, availability or use would be contrary to law, regulation or
which would subject IDBI Capital and associates to any registration or licensing requirement within such jurisdiction. The securities described herein may or may not be eligible for sale in all jurisdictions or to certain category of investors. Persons in whose possession this
document may come are required to inform themselves of and to observe such restriction.
E-mail is not a secure method of communication. IDBI Capital Markets & Securities Ltd (formerly known as “IDBI Capital Market Services Ltd.”) cannot accept responsibility for the accuracy or completeness of any e-mail message or any attachment(s).
This transmission could contain viruses, be corrupted, destroyed, incomplete, intercepted, lost or arrive late. IDBI Capital, its directors or employees or associates accept no liability for any damage caused, directly or indirectly, by this email.
Phillips Carbon Black | Initiating Coverage 19
19
Analyst Disclosures
I, Bhavesh Chauhan, hereby certify that the views expressed in this report accurately reflect my personal views about the subject companies and / or securities. I also certify that no part of my compensation was, is or will be directly or indirectly related to the specific
recommendations or views expressed in this report.
Other Disclosures
IDBI Capital Markets & Securities Ltd (formerly known as “IDBI Capital Market Services Ltd.”) “IDBI Capital” was incorporated in the year 1993 under Companies Act, 1956 and is a wholly owned subsidiary of IDBI Bank Limited. IDBI Capital is one of India’s leading securities firm
which offers a full suite of products and services to individual, institutional and corporate clients namely Stock broking (Institutional and Retail), Distribution of financial products, Merchant Banking, Corporate Advisory Services, Debt Arranging & Underwriting, Portfolio Manager
Services and providing Depository Services.
IDBI Capital registered trading and clearing member of BSE Ltd. (BSE) and National Stock Exchange of India Limited (NSE). IDBI Capital is also a SEBI registered Merchant Banker, Portfolio Manager and Research Analyst.
IDBI Capital is also a SEBI registered depository participant with National Securities Depository Limited (NSDL) and is also a Mutual Fund Advisor registered with Association of Mutual Funds in India (AMFI).
IDBI Capital Markets & Securities Ltd. (formerly known as “IDBI Capital Market Services Ltd.”) and its associates (IDBI Bank Ltd. (Holding Company), IDBI Intech Ltd. (Fellow Subsidiary), IDBI Asset Management Ltd. (Fellow Subsidiary) and IDBI Trusteeship Services Ltd. (Fellow
Subsidiary).
IDBI Group are a full-serviced banking, integrated investment banking, investment management, brokerage and financing group. Details in respect of which are available on www.idbicapital.com
IDBI Capital along with its associates are leading underwriter of securities and participants in virtually all securities trading markets in India. We and our associates have investment banking and other business relationships with a significant percentage of the companies covered
by our Research Department. Investors should assume that IDBI Capital and/or its associates are seeking or will seek investment banking or other business from the company or companies that are the subject of this material. IDBI Capital generally prohibits its analysts, persons
reporting to analysts, and their dependent family members having a financial conflict of interest in the securities or derivatives of any companies that the analysts cover.
Additionally, IDBI Capital generally prohibits its analysts and persons reporting to analysts from serving as an officer, director, or advisory board member of any companies that the analysts cover. Our salespeople, traders, and other professionals may provide oral or written
market commentary or trading strategies to our clients that reflect opinions that are contrary to the opinions expressed herein, and our proprietary trading and investing businesses may make investment decisions that are inconsistent with the recommendations expressed
herein. In reviewing these materials, you should be aware that any or all of the foregoing, among other things, may give rise to real or potential conflicts of interest. Additionally, other important information regarding our relationships with the company or companies that are the
subject of this material is provided herein.
This material should not be construed as an offer to sell or the solicitation of an offer to buy any security in any jurisdiction where such an offer or solicitation would be illegal. We are not soliciting any action based on this material. It is for the general information of clients of IDBI
Capital. It does not constitute a personal recommendation or take into account the particular investment objectives, financial situations, or needs of individual clients.
Before acting on any advice or recommendation in this material, clients should consider whether it is suitable for their particular circumstances and, if necessary, seek professional advice. The price and value of the investments referred to in this material and the income from
them may go down as well as up, and investors may realize losses on any investments. Past performance is not a guide for future performance, future returns are not guaranteed and a loss of original capital may occur.
We and our associates, officers, directors, and employees, including persons involved in the preparation or issuance of this material, may from time to time have “long” or “short” positions in, act as principal in, and buy or sell the securities or derivatives thereof of companies
mentioned herein. For the purpose of calculating whether IDBI Capital Markets & Securities Ltd (formerly known as “IDBI Capital Market Services Ltd.”) and its associates holds beneficially owns or controls, including the right to vote for directors, 1% of more of the equity shares
of the subject issuer of a research report, the holdings does not include accounts managed by IDBI Asset Management Company/ IDBI Mutual Fund.
IDBI Capital hereby declare that our activities were neither suspended nor we have materially defaulted with any Stock Exchange authority with whom we are registered in last five years. However SEBI, Exchanges and Depositories have conducted the routine inspection and
based on their observations have issued advise letters or levied minor penalty on IDBI Capital for certain operational deviations. We have not been debarred from doing business by any Stock Exchange / SEBI or any other authorities; nor has our certificate of registration been
cancelled by SEBI at any point of time.
IDBI Capital, its directors or employees or associates, may from time to time, have positions in, or options on, and buy and sell securities referred to herein. IDBI Capital or its associates, during the normal course of business, from time to time, may solicit from or perform
investment banking or other services for any company mentioned in this document or their connected persons or be engaged in any other transaction involving such securities and earn brokerage or other compensation or act as a market maker in the financial instruments of the
company(ies) discussed herein or their affiliate companies or act as advisor or lender / borrower to such company(ies)/associates companies or have other potential conflict of interest.
This report may provide hyperlinks to other websites. Except to the extent to which the report refers to the website of IDBI Capital, IDBI Capital states that it has not reviewed the linked site and takes no responsibility for the content contained in such other websites. Accessing
such websites shall be at recipient's own risk.
IDBI Capital encourages the practice of giving independent opinion in research report preparation by the analyst and thus strives to minimize the conflict in preparation of research report. Accordingly, neither IDBI Capital nor Research Analysts have any material conflict of
interest at the time of publication of this report.
We offer our research services to primarily institutional investors and their employees, directors, fund managers, advisors who are registered with us. The Research Analyst has not served as an officer, director or employee of Subject Company.
We or our associates may have received compensation from the subject company in the past 12 months. We or our associates may have managed or co-managed public offering of securities for the subject company in the past 12 months. We or our associates may have received
compensation for investment banking or merchant banking or brokerage services from the subject company in the past 12 months. We or our associates may have received any compensation for products or services other than investment banking or merchant banking or
brokerage services from the subject company in the past 12 months. We or our associates may have received any compensation or other benefits from the Subject Company or third party in connection with the research report.
Research Analyst or his/her relative’s may have financial interest in the subject company. IDBI Capital Markets & Securities Ltd (formerly known as “IDBI Capital Market Services Ltd.”) or its associates may have financial interest in the subject company. Research Analyst or
his/her relatives does not have actual/beneficial ownership of 1% or more securities of the subject company at the end of the month immediately preceding the date of publication of Research Report. IDBI Capital or its associates may have actual/beneficial ownership of 1% or
more securities of the subject company at the end of the month immediately preceding the date of publication of Research Report. The Subject Company may have been a client during twelve months preceding the date of distribution of the research report.
Price history of the daily closing price of the securities covered in this note is available at bseindia.com, nseindia.com and economictimes.indiatimes.com/markets/stocks/stock-quotes.
June 21, 2017
ICICI Securities Ltd | Retail Equity Research
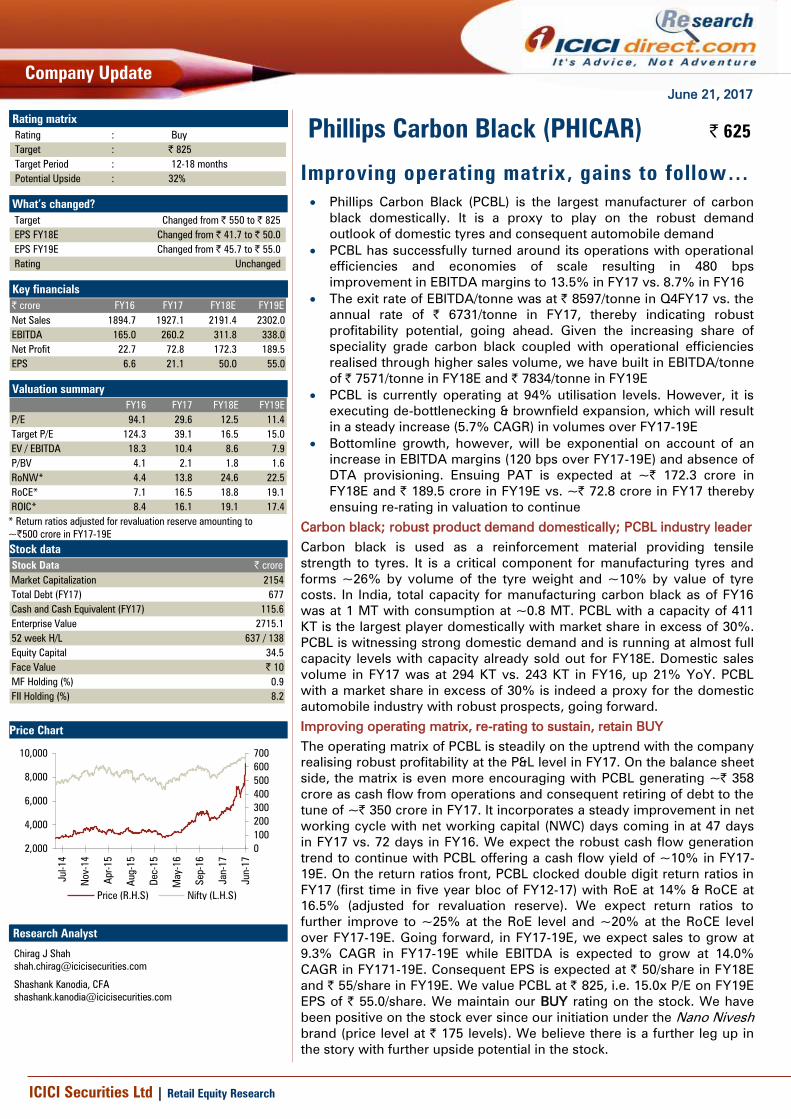
Company Update
Improving operating matrix, gains to follow… Phillips Carbon Black (PCBL) is the largest manufacturer of carbon
black domestically. It is a proxy to play on the robust demand
outlook of domestic tyres and consequent automobile demand
PCBL has successfully turned around its operations with operational
efficiencies and economies of scale resulting in 480 bps
improvement in EBITDA margins to 13.5% in FY17 vs. 8.7% in FY16
The exit rate of EBITDA/tonne was at | 8597/tonne in Q4FY17 vs. the
annual rate of | 6731/tonne in FY17, thereby indicating robust
profitability potential, going ahead. Given the increasing share of
speciality grade carbon black coupled with operational efficiencies
realised through higher sales volume, we have built in EBITDA/tonne
of | 7571/tonne in FY18E and | 7834/tonne in FY19E
PCBL is currently operating at 94% utilisation levels. However, it is
executing de-bottlenecking & brownfield expansion, which will result
in a steady increase (5.7% CAGR) in volumes over FY17-19E
Bottomline growth, however, will be exponential on account of an
increase in EBITDA margins (120 bps over FY17-19E) and absence of
DTA provisioning. Ensuing PAT is expected at ~| 172.3 crore in
FY18E and | 189.5 crore in FY19E vs. ~| 72.8 crore in FY17 thereby
ensuing re-rating in valuation to continue
Carbon black; robust product demand domestically; PCBL industry leader
Carbon black is used as a reinforcement material providing tensile
strength to tyres. It is a critical component for manufacturing tyres and
forms ~26% by volume of the tyre weight and ~10% by value of tyre
costs. In India, total capacity for manufacturing carbon black as of FY16
was at 1 MT with consumption at ~0.8 MT. PCBL with a capacity of 411
KT is the largest player domestically with market share in excess of 30%.
PCBL is witnessing strong domestic demand and is running at almost full
capacity levels with capacity already sold out for FY18E. Domestic sales
volume in FY17 was at 294 KT vs. 243 KT in FY16, up 21% YoY. PCBL
with a market share in excess of 30% is indeed a proxy for the domestic
automobile industry with robust prospects, going forward.
Improving operating matrix, re-rating to sustain, retain BUY
The operating matrix of PCBL is steadily on the uptrend with the company
realising robust profitability at the P&L level in FY17. On the balance sheet
side, the matrix is even more encouraging with PCBL generating ~| 358
crore as cash flow from operations and consequent retiring of debt to the
tune of ~| 350 crore in FY17. It incorporates a steady improvement in net
working cycle with net working capital (NWC) days coming in at 47 days
in FY17 vs. 72 days in FY16. We expect the robust cash flow generation
trend to continue with PCBL offering a cash flow yield of ~10% in FY17-
19E. On the return ratios front, PCBL clocked double digit return ratios in
FY17 (first time in five year bloc of FY12-17) with RoE at 14% & RoCE at
16.5% (adjusted for revaluation reserve). We expect return ratios to
further improve to ~25% at the RoE level and ~20% at the RoCE level
over FY17-19E. Going forward, in FY17-19E, we expect sales to grow at
9.3% CAGR in FY17-19E while EBITDA is expected to grow at 14.0%
CAGR in FY171-19E. Consequent EPS is expected at | 50/share in FY18E
and | 55/share in FY19E. We value PCBL at | 825, i.e. 15.0x P/E on FY19E
EPS of | 55.0/share. We maintain our BUY rating on the stock. We have
been positive on the stock ever since our initiation under the Nano Nivesh
brand (price level at | 175 levels). We believe there is a further leg up in
the story with further upside potential in the stock.
Phillips Carbon Black (PHICAR) | 625 Rating matrix
Rating : Buy
Target : | 825
Target Period : 12-18 months
Potential Upside : 32%
What’s changed?
Target Changed from | 550 to | 825
EPS FY18E Changed from | 41.7 to | 50.0
EPS FY19E Changed from | 45.7 to | 55.0
Rating Unchanged
Key financials
| crore FY16 FY17 FY18E FY19E
Net Sales 1894.7 1927.1 2191.4 2302.0
EBITDA 165.0 260.2 311.8 338.0
Net Profit 22.7 72.8 172.3 189.5
EPS 6.6 21.1 50.0 55.0
Valuation summary
FY16 FY17 FY18E FY19E
P/E 94.1 29.6 12.5 11.4
Target P/E 124.3 39.1 16.5 15.0
EV / EBITDA 18.3 10.4 8.6 7.9
P/BV 4.1 2.1 1.8 1.6
RoNW* 4.4 13.8 24.6 22.5
RoCE* 7.1 16.5 18.8 19.1
ROIC* 8.4 16.1 19.1 17.4
* Return ratios adjusted for revaluation reserve amounting to
~|500 crore in FY17-19E
Stock data
Stock Data | crore
Market Capitalization 2154
Total Debt (FY17) 677
Cash and Cash Equivalent (FY17) 115.6
Enterprise Value 2715.1
52 week H/L 637 / 138
Equity Capital 34.5
Face Value | 10
MF Holding (%) 0.9
FII Holding (%) 8.2
Price Chart
0
100
200
300
400
500
600
700
Jun-17
Jan-17
Sep-16
May-16
Dec-15
Aug-15
Apr-15
Nov-14
Jul-14
2,000
4,000
6,000
8,000
10,000
Price (R.H.S) Nifty (L.H.S)
Research Analyst
Chirag J Shah
Shashank Kanodia, CFA
ICICI Securities Ltd | Retail Equity Research Page 2
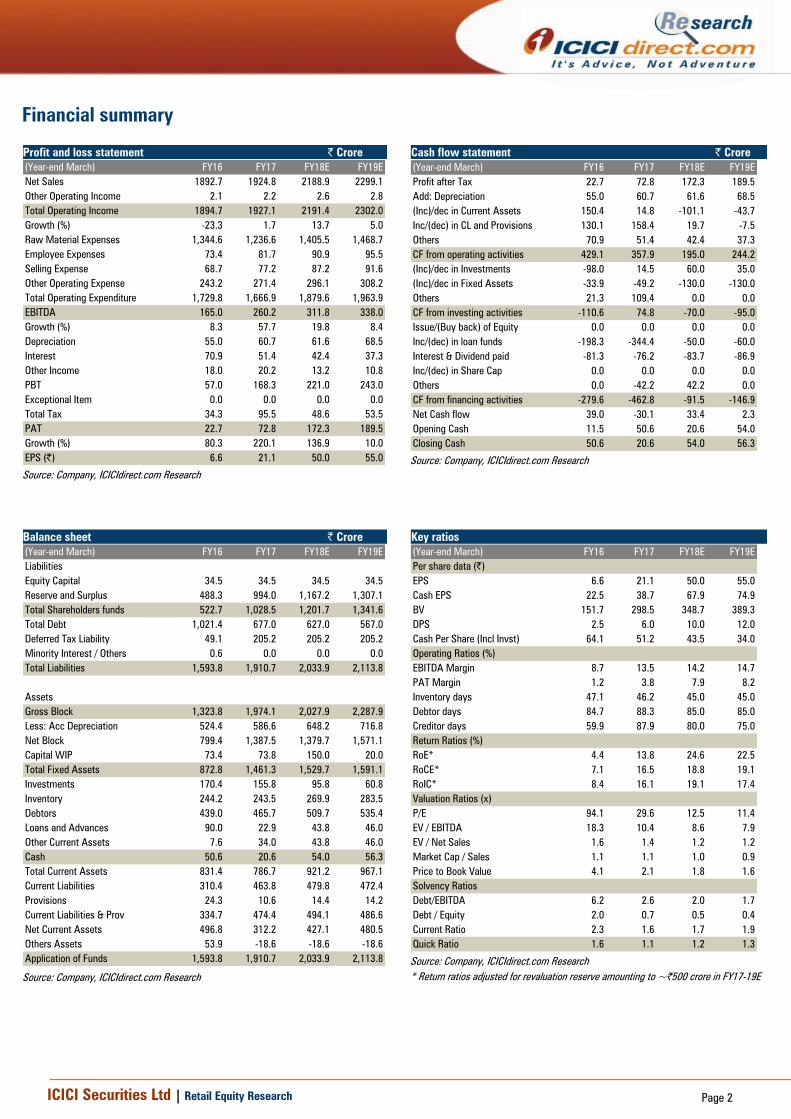
Financial summary
Profit and loss statement | Crore
(Year-end March) FY16 FY17 FY18E FY19E
Net Sales 1892.7 1924.8 2188.9 2299.1
Other Operating Income 2.1 2.2 2.6 2.8
Total Operating Income 1894.7 1927.1 2191.4 2302.0
Growth (%) -23.3 1.7 13.7 5.0
Raw Material Expenses 1,344.6 1,236.6 1,405.5 1,468.7
Employee Expenses 73.4 81.7 90.9 95.5
Selling Expense 68.7 77.2 87.2 91.6
Other Operating Expense 243.2 271.4 296.1 308.2
Total Operating Expenditure 1,729.8 1,666.9 1,879.6 1,963.9
EBITDA 165.0 260.2 311.8 338.0
Growth (%) 8.3 57.7 19.8 8.4
Depreciation 55.0 60.7 61.6 68.5
Interest 70.9 51.4 42.4 37.3
Other Income 18.0 20.2 13.2 10.8
PBT 57.0 168.3 221.0 243.0
Exceptional Item 0.0 0.0 0.0 0.0
Total Tax 34.3 95.5 48.6 53.5
PAT 22.7 72.8 172.3 189.5
Growth (%) 80.3 220.1 136.9 10.0
EPS (|) 6.6 21.1 50.0 55.0
Source: Company, ICICIdirect.com Research
Cash flow statement | Crore
(Year-end March) FY16 FY17 FY18E FY19E
Profit after Tax 22.7 72.8 172.3 189.5
Add: Depreciation 55.0 60.7 61.6 68.5
(Inc)/dec in Current Assets 150.4 14.8 -101.1 -43.7
Inc/(dec) in CL and Provisions 130.1 158.4 19.7 -7.5
Others 70.9 51.4 42.4 37.3
CF from operating activities 429.1 357.9 195.0 244.2
(Inc)/dec in Investments -98.0 14.5 60.0 35.0
(Inc)/dec in Fixed Assets -33.9 -49.2 -130.0 -130.0
Others 21.3 109.4 0.0 0.0
CF from investing activities -110.6 74.8 -70.0 -95.0
Issue/(Buy back) of Equity 0.0 0.0 0.0 0.0
Inc/(dec) in loan funds -198.3 -344.4 -50.0 -60.0
Interest & Dividend paid -81.3 -76.2 -83.7 -86.9
Inc/(dec) in Share Cap 0.0 0.0 0.0 0.0
Others 0.0 -42.2 42.2 0.0
CF from financing activities -279.6 -462.8 -91.5 -146.9
Net Cash flow 39.0 -30.1 33.4 2.3
Opening Cash 11.5 50.6 20.6 54.0
Closing Cash 50.6 20.6 54.0 56.3
Source: Company, ICICIdirect.com Research
Balance sheet | Crore
(Year-end March) FY16 FY17 FY18E FY19E
Liabilities
Equity Capital 34.5 34.5 34.5 34.5
Reserve and Surplus 488.3 994.0 1,167.2 1,307.1
Total Shareholders funds 522.7 1,028.5 1,201.7 1,341.6
Total Debt 1,021.4 677.0 627.0 567.0
Deferred Tax Liability 49.1 205.2 205.2 205.2
Minority Interest / Others 0.6 0.0 0.0 0.0
Total Liabilities 1,593.8 1,910.7 2,033.9 2,113.8
Assets
Gross Block 1,323.8 1,974.1 2,027.9 2,287.9
Less: Acc Depreciation 524.4 586.6 648.2 716.8
Net Block 799.4 1,387.5 1,379.7 1,571.1
Capital WIP 73.4 73.8 150.0 20.0
Total Fixed Assets 872.8 1,461.3 1,529.7 1,591.1
Investments 170.4 155.8 95.8 60.8
Inventory 244.2 243.5 269.9 283.5
Debtors 439.0 465.7 509.7 535.4
Loans and Advances 90.0 22.9 43.8 46.0
Other Current Assets 7.6 34.0 43.8 46.0
Cash 50.6 20.6 54.0 56.3
Total Current Assets 831.4 786.7 921.2 967.1
Current Liabilities 310.4 463.8 479.8 472.4
Provisions 24.3 10.6 14.4 14.2
Current Liabilities & Prov 334.7 474.4 494.1 486.6
Net Current Assets 496.8 312.2 427.1 480.5
Others Assets 53.9 -18.6 -18.6 -18.6
Application of Funds 1,593.8 1,910.7 2,033.9 2,113.8
Source: Company, ICICIdirect.com Research
Key ratios
(Year-end March) FY16 FY17 FY18E FY19E
Per share data (|)
EPS 6.6 21.1 50.0 55.0
Cash EPS 22.5 38.7 67.9 74.9
BV 151.7 298.5 348.7 389.3
DPS 2.5 6.0 10.0 12.0
Cash Per Share (Incl Invst) 64.1 51.2 43.5 34.0
Operating Ratios (%)
EBITDA Margin 8.7 13.5 14.2 14.7
PAT Margin 1.2 3.8 7.9 8.2
Inventory days 47.1 46.2 45.0 45.0
Debtor days 84.7 88.3 85.0 85.0
Creditor days 59.9 87.9 80.0 75.0
Return Ratios (%)
RoE* 4.4 13.8 24.6 22.5
RoCE* 7.1 16.5 18.8 19.1
RoIC* 8.4 16.1 19.1 17.4
Valuation Ratios (x)
P/E 94.1 29.6 12.5 11.4
EV / EBITDA 18.3 10.4 8.6 7.9
EV / Net Sales 1.6 1.4 1.2 1.2
Market Cap / Sales 1.1 1.1 1.0 0.9
Price to Book Value 4.1 2.1 1.8 1.6
Solvency Ratios
Debt/EBITDA 6.2 2.6 2.0 1.7
Debt / Equity 2.0 0.7 0.5 0.4
Current Ratio 2.3 1.6 1.7 1.9
Quick Ratio 1.6 1.1 1.2 1.3
Source: Company, ICICIdirect.com Research
* Return ratios adjusted for revaluation reserve amounting to ~|500 crore in FY17-19E
ICICI Securities Ltd | Retail Equity Research Page 3
RATING RATIONALE
ICICIdirect.com endeavours to provide objective opinions and recommendations. ICICIdirect.com assigns
ratings to its stocks according to their notional target price vs. current market price and then categorises them
as Strong Buy, Buy, Hold and Sell. The performance horizon is two years unless specified and the notional
target price is defined as the analysts' valuation for a stock.
Strong Buy: >15%/20% for large caps/midcaps, respectively, with high conviction;
Buy: >10%/15% for large caps/midcaps, respectively;
Hold: Up to +/-10%;
Sell: -10% or more;
Pankaj Pandey Head – Research [email protected]
ICICIdirect.com Research Desk,
ICICI Securities Limited,
1st Floor, Akruti Trade Centre,
Road No 7, MIDC,
Andheri (East)
Mumbai – 400 093
ICICI Securities Ltd | Retail Equity Research Page 4
ICICIdirect.com Research Desk,
ICICI Securities Limited,
1st Floor, Akruti Trade Centre,
Road No 7, MIDC,
Andheri (East)
Mumbai – 400 093
Disclaimer
ANALYST CERTIFICATION
We /I, Chirag Shah PGDBM, Shashank Kanodia, CFA MBA (Capital Markets), Research Analysts, authors and the names subscribed to this report, hereby certify that all of the views expressed in this
research report accurately reflect our views about the subject issuer(s) or securities. We also certify that no part of our compensation was, is, or will be directly or indirectly related to the specific
recommendation(s) or view(s) in this report.
Terms & conditions and other disclosures:
ICICI Securities Limited (ICICI Securities) is a full-service, integrated investment banking and is, inter alia, engaged in the business of stock brokering and distribution of financial products. ICICI Securities
Limited is a Sebi registered Research Analyst with Sebi Registration Number – INH000000990. ICICI Securities is a wholly-owned subsidiary of ICICI Bank which is India’s largest private sector bank and has
its various subsidiaries engaged in businesses of housing finance, asset management, life insurance, general insurance, venture capital fund management, etc. (“associates”), the details in respect of which
are available on www.icicibank.com.
ICICI Securities is one of the leading merchant bankers/ underwriters of securities and participate in virtually all securities trading markets in India. We and our associates might have investment banking
and other business relationship with a significant percentage of companies covered by our Investment Research Department. ICICI Securities generally prohibits its analysts, persons reporting to analysts
and their relatives from maintaining a financial interest in the securities or derivatives of any companies that the analysts cover.
The information and opinions in this report have been prepared by ICICI Securities and are subject to change without any notice. The report and information contained herein is strictly confidential and
meant solely for the selected recipient and may not be altered in any way, transmitted to, copied or distributed, in part or in whole, to any other person or to the media or reproduced in any form, without
prior written consent of ICICI Securities. While we would endeavour to update the information herein on a reasonable basis, ICICI Securities is under no obligation to update or keep the information current.
Also, there may be regulatory, compliance or other reasons that may prevent ICICI Securities from doing so. Non-rated securities indicate that rating on a particular security has been suspended
temporarily and such suspension is in compliance with applicable regulations and/or ICICI Securities policies, in circumstances where ICICI Securities might be acting in an advisory capacity to this
company, or in certain other circumstances.
This report is based on information obtained from public sources and sources believed to be reliable, but no independent verification has been made nor is its accuracy or completeness guaranteed. This
report and information herein is solely for informational purpose and shall not be used or considered as an offer document or solicitation of offer to buy or sell or subscribe for securities or other financial
instruments. Though disseminated to all the customers simultaneously, not all customers may receive this report at the same time. ICICI Securities will not treat recipients as customers by virtue of their
receiving this report. Nothing in this report constitutes investment, legal, accounting and tax advice or a representation that any investment or strategy is suitable or appropriate to your specific
circumstances. The securities discussed and opinions expressed in this report may not be suitable for all investors, who must make their own investment decisions, based on their own investment
objectives, financial positions and needs of specific recipient. This may not be taken in substitution for the exercise of independent judgment by any recipient. The recipient should independently evaluate
the investment risks. The value and return on investment may vary because of changes in interest rates, foreign exchange rates or any other reason. ICICI Securities accepts no liabilities whatsoever for any
loss or damage of any kind arising out of the use of this report. Past performance is not necessarily a guide to future performance. Investors are advised to see Risk Disclosure Document to understand the
risks associated before investing in the securities markets. Actual results may differ materially from those set forth in projections. Forward-looking statements are not predictions and may be subject to
change without notice.
ICICI Securities or its associates might have managed or co-managed public offering of securities for the subject company or might have been mandated by the subject company for any other assignment
in the past twelve months.
ICICI Securities or its associates might have received any compensation from the companies mentioned in the report during the period preceding twelve months from the date of this report for services in
respect of managing or co-managing public offerings, corporate finance, investment banking or merchant banking, brokerage services or other advisory service in a merger or specific transaction.
ICICI Securities or its associates might have received any compensation for products or services other than investment banking or merchant banking or brokerage services from the companies mentioned
in the report in the past twelve months.
ICICI Securities encourages independence in research report preparation and strives to minimize conflict in preparation of research report. ICICI Securities or its associates or its analysts did not receive any
compensation or other benefits from the companies mentioned in the report or third party in connection with preparation of the research report. Accordingly, neither ICICI Securities nor Research Analysts
and their relatives have any material conflict of interest at the time of publication of this report.
It is confirmed that Chirag Shah PGDBM, Shashank Kanodia, CFA MBA (Capital Markets), Research Analysts of this report have not received any compensation from the companies mentioned in the report
in the preceding twelve months.
Compensation of our Research Analysts is not based on any specific merchant banking, investment banking or brokerage service transactions.
ICICI Securities or its subsidiaries collectively or Research Analysts or their relatives do not own 1% or more of the equity securities of the Company mentioned in the report as of the last day of the month
preceding the publication of the research report. ,
Since associates of ICICI Securities are engaged in various financial service businesses, they might have financial interests or beneficial ownership in various companies including the subject
company/companies mentioned in this report.
It is confirmed that Chirag Shah PGDBM, Shashank Kanodia, CFA MBA (Capital Markets). Research Analysts do not serve as an officer, director or employee of the companies mentioned in the report.
ICICI Securities may have issued other reports that are inconsistent with and reach different conclusion from the information presented in this report.
Neither the Research Analysts nor ICICI Securities have been engaged in market making activity for the companies mentioned in the report.
We submit that no material disciplinary action has been taken on ICICI Securities by any Regulatory Authority impacting Equity Research Analysis activities.
This report is not directed or intended for distribution to, or use by, any person or entity who is a citizen or resident of or located in any locality, state, country or other jurisdiction, where such distribution,
publication, availability or use would be contrary to law, regulation or which would subject ICICI Securities and affiliates to any registration or licensing requirement within such jurisdiction. The securities
described herein may or may not be eligible for sale in all jurisdictions or to certain category of investors. Persons in whose possession this document may come are required to inform themselves of and
to observe such restriction.
report and information herein is solely for informational purpose and shall not be used or considered as an offer document or solicitation of offer to buy or sell or subscribe for securities or other financial
instruments. Though disseminated to all the customers simultaneously, not all customers may receive this report at the same time. ICICI Securities will not treat recipients as customers by virtue of their
receiving this report. Nothing in this report constitutes investment, legal, accounting and tax advice or a representation that any investment or strategy is suitable or appropriate to your specific
circumstances. The securities discussed and opinions expressed in this report may not be suitable for all investors, who must make their own investment decisions, based on their own investment
objectives, financial positions and needs of specific recipient. This may not be taken in substitution for the exercise of independent judgment by any recipient. The recipient should independently evaluate
the investment risks. The value and return on investment may vary because of changes in interest rates, foreign exchange rates or any other reason. ICICI Securities accepts no liabilities whatsoever for any
loss or damage of any kind arising out of the use of this report. Past performance is not necessarily a guide to future performance. Investors are advised to see Risk Disclosure Document to understand the
risks associated before investing in the securities markets. Actual results may differ materially from those set forth in projections. Forward-looking statements are not predictions and may be subject to
change without notice.
ICICI Securities or its associates might have managed or co-managed public offering of securities for the subject company or might have been mandated by the subject company for any other assignment
in the past twelve months.
ICICI Securities or its associates might have received any compensation from the companies mentioned in the report during the period preceding twelve months from the date of this report for services in
respect of managing or co-managing public offerings, corporate finance, investment banking or merchant banking, brokerage services or other advisory service in a merger or specific transaction.
ICICI Securities or its associates might have received any compensation for products or services other than investment banking or merchant banking or brokerage services from the companies mentioned
in the report in the past twelve months.
ICICI Securities encourages independence in research report preparation and strives to minimize conflict in preparation of research report. ICICI Securities or its analysts did not receive any compensation
or other benefits from the companies mentioned in the report or third party in connection with preparation of the research report. Accordingly, neither ICICI Securities nor Research Analysts have any
material conflict of interest at the time of publication of this report.
It is confirmed that Chirag Shah PGDBM, Shashank Kanodia, CFA MBA (Capital Markets), Research Analysts of this report have not received any compensation from the companies mentioned in the report
in the preceding twelve months.
Compensation of our Research Analysts is not based on any specific merchant banking, investment banking or brokerage service transactions.