Embed Size (px)
Citation preview

Market Snapshot

Contents Summary
Text
Special Topic: FHFA Removes Adverse Market
Fee Macro-Economic Indicators
Rate History
Prepayment Speed Trends
Delinquency Trends
Special Topic: FHFA Removes Adverse Market Fee
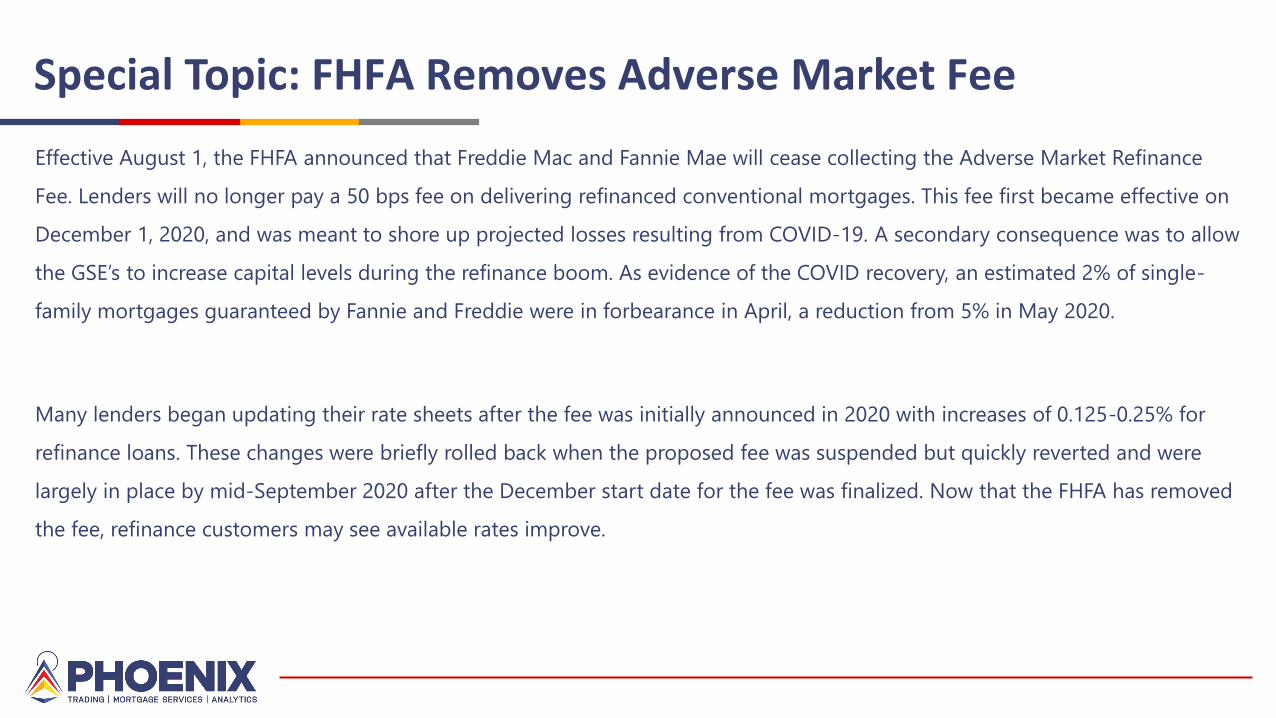
Effective August 1, the FHFA announced that Freddie Mac and Fannie Mae will cease collecting the Adverse Market Refinance
Fee. Lenders will no longer pay a 50 bps fee on delivering refinanced conventional mortgages. This fee first became effective on
December 1, 2020, and was meant to shore up projected losses resulting from COVID-19. A secondary consequence was to allow
the GSE’s to increase capital levels during the refinance boom. As evidence of the COVID recovery, an estimated 2% of single-
family mortgages guaranteed by Fannie and Freddie were in forbearance in April, a reduction from 5% in May 2020.
Many lenders began updating their rate sheets after the fee was initially announced in 2020 with increases of 0.125-0.25% for
refinance loans. These changes were briefly rolled back when the proposed fee was suspended but quickly reverted and were
largely in place by mid-September 2020 after the December start date for the fee was finalized. Now that the FHFA has removed
the fee, refinance customers may see available rates improve.

Macro-Economic Indicators
Summary
• The US job market weakened slightly in June, with the US
Unemployment Rate rising to 5.9% from May’s month-end figure of
5.8%
• The total number of loans in forbearance as a percentage of servicer’s
portfolio volume, tracked by the MBA’s Forbearance and Call Volume
Survey continued to slowly trend lower over the course of June. June’s
final figure was 3.87%, down from the 4.04% of loans recorded in the
first week of the month
• The MBA Mortgage Refinance Application Index’s weekly results fell
during June with a reading of 2,857 at month-end, down from 3,022
recorded the last week of May
• The domestic residential construction market once again exhibited
considerable year-over-year growth. Housing starts came in at
1,643,000 for June month-end; 29.10% higher than the same period in
2020

0%
1%
2%
3%
4%
5%
6%
7%
8%
9%
April 5 - April 11 4/18/2021 4/25/2021 5/2/2021 5/9/2021 5/16/2021 5/23/2021 5/30/2021 6/6/2021 6/13/2021 6/20/2021 6/27/2021
GNMA FNMA/FHLMC Other (PLS/Portfolio/etc.) Total
600
1,600
2,600
3,600
4,600
5,600
6,600
7,600
6/30/2019 9/30/2019 12/31/2019 3/31/2020 6/30/2020 9/30/2020 12/31/2020 3/31/2021 6/30/2021
Mo
rtg
ag
e R
efin
an
cin
g (
tho
usa
nd
s)
MBA Mortgage Refinance Application Index
Source: Thomson Reuters, Mortgage Bankers Association (MBA) of America
0.80.9
11.11.21.31.41.51.61.71.81.9
2
6/1/2019 9/1/2019 12/1/2019 3/1/2020 6/1/2020 9/1/2020 12/1/2020 3/1/2021 6/1/2021
Sta
rts/
Perm
its
(Millio
ns)
US Housing Starts/US Building PermitsUS Housing Starts US Building Permits
Source: Thomson Reuters, US Census Bureau
2
4
6
8
10
12
14
16
6/1/2019 9/1/2019 12/1/2019 3/1/2020 6/1/2020 9/1/2020 12/1/2020 3/1/2021 6/1/2021
Un
em
plo
ym
en
t P
erc
en
t
US Unemployment Rate
Sources: Thomson Reuters, Bureau of Labor Statistics, US Department of Labor
Macro-Economic Indicators
4/11/2020
Loans in Forbearance
Rate History
Summary
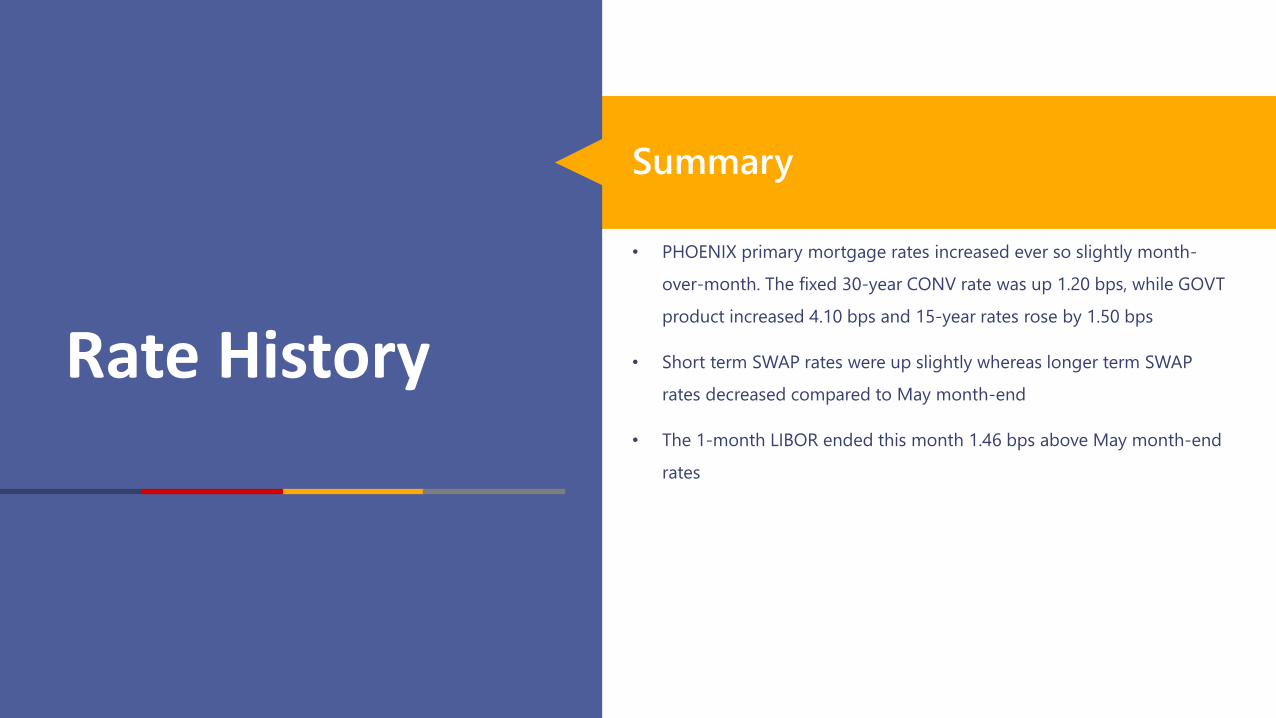
• PHOENIX primary mortgage rates increased ever so slightly month-
over-month. The fixed 30-year CONV rate was up 1.20 bps, while GOVT
product increased 4.10 bps and 15-year rates rose by 1.50 bps
• Short term SWAP rates were up slightly whereas longer term SWAP
rates decreased compared to May month-end
• The 1-month LIBOR ended this month 1.46 bps above May month-end
rates

0.10%
0.60%
1.10%
1.60%
2.10%
3M
1Y
R
2Y
R
3Y
R
4Y
R
5Y
R
10YR
15YR
20YR
30YR
Yield Curve Comparison05.28.21 06.30.21
0.0
0.2
0.4
0.6
0.8
1.0
1.2
1.4
1.6
6/30/2020 9/30/2020 12/31/2020 3/31/2021 6/30/2021
2yr and 10yr SWAP Spread2yr - 10yr SWAP Spread
1.00
1.25
1.50
1.75
2.00
2.25
2.50
2.75
3.00
3.25
6/30/2020 9/30/2020 12/31/2020 3/31/2021 6/30/2021
Mortgage Par Spread over SWAP Rates (%)
CONV30 - SWAP 10yr CONV15 - SWAP 7yr GOV30 - SWAP 10yr
2.0
2.5
3.0
3.5
4.0
3/31/2020 6/30/2020 9/30/2020 12/31/2020 3/31/2021 6/30/2021
Mortgage Par Rates (%)CONV30 Primary CONV15 Primary GOVT30
Rate History
Source: Thomson Reuters and PHOENIX

Primary Rates as of 06/30/2021
Rate 6/30/2021 5/28/2021 3/31/2021 6/30/2020
CONV30 3.175 3.163 3.361 3.169
CONV15 2.470 2.455 2.625 2.557
GOV30 3.104 3.063 3.203 3.024
ARM 5/1 2.250 2.250 2.250 2.875
Secondary Rates as of 06/30/2021
Rate 6/30/2021 5/28/2021 3/31/2021 6/30/2020
FNMA 30 1.775 1.813 2.061 1.569
FNMA 15 1.120 1.055 1.275 1.057
GNMA II 30 1.654 1.613 1.753 1.550
GNMA II 15 1.227 1.212 1.404 1.264
ARM 5/1 3.330 3.140 3.080 3.120
Earnings Rates as of 06/30/2021
Rate 6/30/2021 5/28/2021 3/31/2021 6/30/2020
3 MO ED 0.129 0.113 0.167 0.258
6 MO ED 0.140 0.116 0.171 0.264
12 MO ED 0.172 0.132 0.188 0.244
2 YR SWAP 0.320 0.223 0.286 0.219
3 YR SWAP 0.555 0.419 0.506 0.224
5 YR SWAP 0.934 0.870 1.036 0.318
10 YR SWAP 1.400 1.553 1.759 0.624
15 YR SWAP 1.601 1.820 2.031 0.787
20 YR SWAP 1.695 1.930 2.133 0.867
30 YR SWAP 1.733 1.976 2.181 0.904
Source: Thomson Reuters and PHOENIX
Rate History (cont.)
Confidential. PHOENIX use only.

Prepayment Speed Trends
Summary
• The average national prepayment speed for fixed-rate GNMA and GSE
loans was 25.74% in June, 177 bps faster than May’s rate of 23.96%
• Over the month, CONV 30-year and 15-year CPR increased 1.39% and
1.50%, respectively. Meanwhile, FHA speeds rose 3.31% % and VA CPR
increased 2.57%
• Over the year, prepayment speeds in South Dakota, Colorado, and
Utah have decreased at least 10 CPR, while New York’s rate increased
146 bps. The median CPR change over the year was a decrease of
409 bps (see next page)

SUMMARY TABLES - June 2021
Loan Characteristics Prepayments
Investor Avg Orig Bal WAC WAvg Orig FICO WAvg Orig LTV WAvg Age CPR1mo CPR
Change%
CONV Fixed 30 $236,839 3.70 753 74 39 25.81% 5.69%
CONV Fixed 15 $194,045 3.09 763 63 35 20.15% 8.03%
GNMA Fixed 30 $197,041 3.56 699 93 41 28.81% 11.94%
GNMA Fixed 15 $137,556 3.36 720 80 53 24.15% 12.46%
Vintage Avg Orig Bal WAC WAvg Orig FICO WAvg Orig LTV WAvg Age CPR1mo CPR
Change%
2006 $140,316 5.48 685 78 143 19.65% 14.14%
2007 $147,230 5.37 681 80 132 18.96% 13.45%
2008 $143,939 5.31 684 82 132 20.05% 14.12%
2009 $159,506 4.91 725 79 135 26.61% 7.58%
2010 $166,855 4.66 734 79 126 28.31% 7.97%
2011 $165,625 4.43 739 77 115 28.03% 5.64%
2012 $190,599 3.77 748 80 105 27.98% 5.82%
2013 $181,262 3.80 743 79 95 27.47% 6.27%
2014 $166,667 4.26 729 80 80 32.73% 6.36%
2015 $191,890 3.95 734 79 69 35.26% 5.75%
2016 $210,303 3.70 735 78 57 34.88% 7.55%
2017 $198,724 4.12 727 80 45 40.04% 5.79%
2018 $192,990 4.69 721 81 33 45.64% 6.72%
2019 $227,982 4.03 731 81 20 42.68% 10.29%
2020 $277,443 3.04 753 75 9 19.08% 20.72%
Tranche Avg Orig Bal WAC WAvg Orig FICO WAvg Orig LTV WAvg Age CPR1mo CPR
Change%
0.0000 - 2.4999 $295,944 2.27 762 73 5 6.94% 37.94%
2.5000 - 2.9999 $285,189 2.78 760 72 9 9.87% 24.36%
3.0000 - 3.4999 $247,353 3.22 747 77 24 20.44% 10.95%
3.5000 - 3.9999 $214,442 3.71 739 79 50 33.19% 8.40%
4.0000 - 4.4999 $190,886 4.19 730 81 61 38.35% 6.72%
4.5000 - 4.9999 $176,477 4.68 722 81 66 38.69% 6.20%
5.0000 - 5.4999 $157,537 5.16 708 82 83 36.31% 6.98%
5.5000 - 5.9999 $138,656 5.66 700 80 118 31.04% 8.97%
6.0000 - 6.4999 $119,351 6.16 697 78 164 22.88% 10.69%
6.5000 or more $93,635 6.94 684 80 190 17.64% 11.30%
GSE and GNMA fixed rate product only Source: Black Knight McDash
CPR Summary
Confidential. PHOENIX use only.

30.85%29.83%
31.57%
10%
15%
20%
25%
30%
35%
Ala
bam
a
Ala
ska
Ari
zon
a
Ark
an
sas
Califo
rnia
Co
lora
do
Co
nn
ect
icu
t
Dela
ware DC
Flo
rid
a
Geo
rgia
Haw
aii
Idah
o
Illin
ois
Ind
ian
a
Iow
a
Kan
sas
Ken
tuck
y
Lou
isia
na
Main
e
Mary
lan
d
Mass
ach
use
tts
Mic
hig
an
Min
neso
ta
Mis
siss
ipp
i
Mis
sou
ri
Mo
nta
na
Neb
rask
a
Nevad
a
New
Ham
psh
ire
New
Jers
ey
New
Mexi
co
New
Yo
rk
No
rth
Caro
lin
a
No
rth
Dako
ta
Oh
io
Okla
ho
ma
Ore
go
n
Pen
nsy
lvan
ia
Rh
od
e Isl
an
d
So
uth
Caro
lin
a
So
uth
Dako
ta
Ten
ness
ee
Texa
s
Uta
h
Verm
on
t
Vir
gin
ia
Wash
ing
ton
West
Vir
gin
ia
Wis
con
sin
Wyo
min
g
Average CPR by State - June 2021
State Jun 21 Total Pop. CPR Average
Source: Black Knight McDashGSE and GNMA fixed rate product only
Prepayment Speed Trends
Analysis• Utah was the fastest prepaying state at
31.57%, closely followed by its
Mountain West neighbors Arizona
(30.85%), Colorado (29.83%) and Idaho
(29.70%)
• In June, the slowest prepaying state
was New York at 18.32%. Although this
state showed an increase of nearly 100
bps in CPR, it was the only state with a
CPR less than 20% this month
• Back in June 2020, Utah was the fastest
prepaying state with a rate of 41.78%,
and New York was slowest with CPR of
16.86%

Source: Black Knight McDashGSE and GNMA fixed rate product only
18.32%(New York)
Average CPR by State
Prepayment Speed Trends (cont.)
25.36%
31.57%(Utah)
25.12%

Delinquency Trends
• The national delinquency and foreclosure rate decreased to 4.09%, a
decline of 44 bps compared to last month. This new value is 472 bps lower
than the 8.81% national average delinquency and foreclosure rate from
June 2020
• CONV 30-year loans’ delinquency and foreclosure rates decreased 34 bps
since May, while CONV 15-year loans’ delinquency and foreclosure rates
decreased 17 bps over the same period
• On a month over month basis, delinquency and foreclosure rates for FHA
and VA loans decreased 84 bps and 36 bps, respectively
NOTE: non-paying loans in forbearance are counted as delinquent in our data source.
Summary
Total delinquencies down
8.97%

SUMMARY TABLES - June 2021
Loan Characteristics Delinquencies
Investor Avg Orig Bal WACWAvg Orig
FICOWAvg Orig LTV WAvg Age 30d DQ 60d DQ +90d DQ Total FC
Total DQ &
FC
1mo DQ & FC
Change%
CONV Fixed 30 $236,839 3.70 753 74 39 0.70% 0.21% 2.52% 0.12% 3.54% -8.77%
CONV Fixed 15 $194,045 3.09 763 63 35 0.36% 0.08% 0.83% 0.02% 1.29% -11.79%
GNMA Fixed 30 $197,041 3.56 699 93 41 2.17% 0.69% 4.12% 0.22% 7.20% -8.60%
GNMA Fixed 15 $137,556 3.36 720 80 53 0.95% 0.27% 1.71% 0.07% 3.00% -8.45%
Vintage Avg Orig Bal WACWAvg Orig
FICOWAvg Orig LTV WAvg Age 30d DQ 60d DQ +90d DQ Total FC
Total DQ &
FC
1mo DQ & FC
Change%
2006 $140,316 5.48 685 78 143 3.51% 1.07% 9.12% 2.11% 15.80% -5.58%
2007 $147,230 5.37 681 80 132 3.64% 1.20% 10.21% 2.47% 17.51% -4.46%
2008 $143,939 5.31 684 82 132 3.89% 1.10% 7.24% 1.70% 13.94% -6.27%
2009 $159,506 4.91 725 79 135 2.19% 0.60% 3.55% 0.39% 6.73% -6.19%
2010 $166,855 4.66 734 79 126 1.58% 0.44% 3.09% 0.26% 5.37% -5.95%
2011 $165,625 4.43 739 77 115 1.35% 0.37% 2.70% 0.18% 4.61% -6.37%
2012 $190,599 3.77 748 80 105 0.87% 0.23% 2.03% 0.10% 3.23% -7.21%
2013 $181,262 3.80 743 79 95 1.03% 0.28% 2.61% 0.15% 4.07% -6.78%
2014 $166,667 4.26 729 80 80 1.66% 0.47% 3.97% 0.26% 6.36% -5.12%
2015 $191,890 3.95 734 79 69 1.45% 0.43% 3.87% 0.20% 5.95% -5.85%
2016 $210,303 3.70 735 78 57 1.33% 0.41% 4.21% 0.18% 6.13% -6.08%
2017 $198,724 4.12 727 80 45 1.68% 0.54% 5.45% 0.21% 7.89% -5.18%
2018 $192,990 4.69 721 81 33 1.99% 0.69% 7.03% 0.24% 9.95% -5.65%
2019 $227,982 4.03 731 81 20 1.32% 0.47% 5.51% 0.05% 7.36% -5.88%
2020 $277,443 3.04 753 75 9 0.50% 0.17% 1.06% 0.00% 1.73% -3.74%
Tranche Avg Orig Bal WACWAvg Orig
FICOWAvg Orig LTV WAvg Age 30d DQ 60d DQ +90d DQ Total FC
Total DQ &
FC
1mo DQ & FC
Change%
0.0000 - 2.4999 $295,944 2.27 762 73 5 0.31% 0.08% 0.25% 0.06% 0.70% -8.54%
2.5000 - 2.9999 $285,189 2.78 760 72 9 0.35% 0.09% 0.35% 0.00% 0.79% -5.16%
3.0000 - 3.4999 $247,353 3.22 747 77 24 0.67% 0.19% 1.32% 0.03% 2.22% -8.05%
3.5000 - 3.9999 $214,442 3.71 739 79 50 1.05% 0.33% 3.25% 0.11% 4.75% -6.81%
4.0000 - 4.4999 $190,886 4.19 730 81 61 1.57% 0.49% 4.83% 0.24% 7.13% -5.62%
4.5000 - 4.9999 $176,477 4.68 722 81 66 1.83% 0.59% 5.81% 0.26% 8.50% -5.89%
5.0000 - 5.4999 $157,537 5.16 708 82 83 2.38% 0.74% 6.65% 0.38% 10.16% -7.37%
5.5000 - 5.9999 $138,656 5.66 700 80 118 2.71% 0.78% 6.47% 0.52% 10.48% -7.67%
6.0000 - 6.4999 $119,351 6.16 697 78 164 2.87% 0.77% 5.34% 0.92% 9.90% -6.89%
6.5000 or more $93,635 6.94 684 80 190 3.32% 0.87% 5.23% 1.58% 11.00% -5.71%
GSE and GNMA fixed rate product only Source: Black Knight McDash
Delinquency Summary
Confidential. PHOENIX use only.

6.48%
6.08%6.32%
0%
1%
2%
3%
4%
5%
6%
7%
Ala
bam
a
Ala
ska
Ari
zon
a
Ark
an
sas
Califo
rnia
Co
lora
do
Co
nn
ect
icu
t
Dela
ware DC
Flo
rid
a
Geo
rgia
Haw
aii
Idah
o
Illin
ois
Ind
ian
a
Iow
a
Kan
sas
Ken
tuck
y
Lou
isia
na
Main
e
Mary
lan
d
Mass
ach
use
tts
Mic
hig
an
Min
neso
ta
Mis
siss
ipp
i
Mis
sou
ri
Mo
nta
na
Neb
rask
a
Nevad
a
New
Ham
psh
ire
New
Jers
ey
New
Mexi
co
New
Yo
rk
No
rth
Caro
lin
a
No
rth
Dako
ta
Oh
io
Okla
ho
ma
Ore
go
n
Pen
nsy
lvan
ia
Rh
od
e Isl
an
d
So
uth
Caro
lin
a
So
uth
Dako
ta
Ten
ness
ee
Texa
s
Uta
h
Verm
on
t
Vir
gin
ia
Wash
ing
ton
West
Vir
gin
ia
Wis
con
sin
Wyo
min
g
Average Delinquency and Foreclosure by State - June 2021
Total DQ Total FC Jun 21 Total Pop. DQ & FC Average
Source: Black Knight McDashGSE and GNMA fixed rate product only
Delinquency Trends
• Idaho remains the best performing
state, where delinquency and
foreclosure rates are 2.11%
• The nation’s most delinquent state is
Louisiana with 6.48% delinquency and
foreclosure rate
• New York is ranked second worst in
delinquencies: the state’s delinquency
and foreclosure rate was 6.32% in May,
which is about half the 13.70% rate
from June 2020
• Regionally, the Middle Atlantic states
of NY, NJ, and PA still have the highest
delinquency rate (5.33%), but the West
South Central region of TX, OK, AR,
and LA is close behind with 5.01%
delinquency and foreclosure
Analysis
All graphs use GSE and GNMA fixed rate product only. Source: Black Knight McDash

Delinquency Trends (cont.)
6.47%(Louisiana)
Source: Black Knight McDashGSE and GNMA fixed rate product only
2.11%(Idaho)
Average Delinquency by State
5.49%

5%
10%
15%
20%
25%
30%
35%
40%
45%
1 - 29 30 - 49 50 - 59 60 - 79 80 - 89 90 - 94 95 - 99 100 or
more
CPR by Original LTV - June 2021
Jun-20 Mar-21 May-21 Jun-21 Jun 21 Total Pop. Average
5%
10%
15%
20%
25%
30%
35%
40%
1 - 499 500 - 619 620 - 659 660 - 719 720 - 779 780 or more
CPR by Original FICO - June 2021Jun-20 Mar-21 May-21 Jun-21 Jun 21 Total Pop. Average
5%
10%
15%
20%
25%
30%
35%
40%
45%
1 - 74,999 75,000 - 149,999 150,000 - 224,999 225,000 - 299,999 300,000 or more
CPR by Original Loan Balance - June 2021
Jun-20 Mar-21 May-21 Jun-21 Jun 21 Total Pop. Average
5%
10%
15%
20%
25%
30%
35%
40%
45%
CONV Fixed 30 CONV Fixed 15 FHA Fixed Residential VA Fixed Residential
CPR by Fixed-Rate Product - June 2021
Jun-20 Mar-21 May-21 Jun-21 Jun 21 Total Pop. Average
Prepayment Speed Trends (cont.)
All graphs use GSE and GNMA fixed rate product only. Source: Black Knight McDash

0%
5%
10%
15%
20%
25%
30%
35%
1 - 499 500 - 619 620 - 659 660 - 719 720 - 779 780 or more
Delinquency and Foreclosure by Original FICO - June 2021
Jun-20 Mar-21 May-21 Jun-21 Jun 21 Total Pop. Average
0%
2%
4%
6%
8%
10%
12%
14%
16%
1 - 29 30 - 49 50 - 59 60 - 79 80 - 89 90 - 94 95 - 99 100 or
more
Delinquency and Foreclosure by Original LTV - June 2021
Jun-20 Mar-21 May-21 Jun-21 Jun 21 Total Pop. Average
0%
1%
2%
3%
4%
5%
6%
7%
8%
9%
10%
1 - 74,999 75,000 - 149,999 150,000 - 224,999 225,000 - 299,999 300,000 or more
Jun-20 Mar-21 May-21 Jun-21 Jun 21 Total Pop. Average
0%
2%
4%
6%
8%
10%
12%
14%
16%
18%
20%
CONV Fixed 30 CONV Fixed 15 FHA Fixed Residential VA Fixed Residential
Jun-20 Mar-21 May-21 Jun-21 Jun 21 Total Pop. Average
Delinquency and Foreclosure by Fixed-Rate Product – June 2021
Delinquency Trends (cont.)
All graphs use GSE and GNMA fixed rate product only. Source: Black Knight McDash
Delinquency and Foreclosure by Original Loan Balance - June 2021

Tables

SUMMARY TABLES - June 2021
Loan Characteristics Prepayments Delinquencies
State WAvg Orig Bal WAC WAvg Orig FICO WAvg Orig LTV WAvg Age CPR 1mo CPR Change% CPR Factor 30d DQ 60d DQ +90d DQ Total FC Total DQ & FC 1mo DQ & FC Change% DQ Factor
National $216,998 3.58 742 77 39 25.74% 7.65% 100.00% 1.00% 0.31% 2.65% 0.13% 4.09% -8.97% 100.00%
Alabama $166,097 3.65 730 84 44 24.26% 11.03% 94.27% 1.52% 0.43% 2.67% 0.10% 4.72% -8.49% 115.48%
Alaska $256,385 3.50 738 84 43 24.54% 6.50% 95.34% 0.86% 0.31% 2.47% 0.10% 3.74% -7.66% 91.41%
Arizona $208,842 3.51 743 78 31 30.85% 5.64% 119.84% 0.84% 0.24% 1.90% 0.03% 3.01% -9.59% 73.53%
Arkansas $149,902 3.60 732 83 42 22.23% 14.47% 86.37% 1.25% 0.36% 2.38% 0.10% 4.10% -7.11% 100.37%
California $314,834 3.43 753 68 35 28.30% 4.75% 109.94% 0.76% 0.23% 2.45% 0.05% 3.48% -9.47% 85.15%
Colorado $266,273 3.39 751 74 29 29.83% 8.85% 115.89% 0.74% 0.22% 1.94% 0.03% 2.93% -9.88% 71.60%
Connecticut $222,667 3.70 740 79 50 22.84% 8.94% 88.73% 1.16% 0.36% 3.19% 0.27% 4.97% -8.68% 121.53%
Delaware $213,483 3.66 738 80 45 23.44% 7.87% 91.09% 1.21% 0.39% 2.41% 0.18% 4.18% -6.86% 102.30%
DC $358,372 3.49 759 71 37 22.23% -1.82% 86.37% 0.69% 0.23% 3.15% 0.13% 4.21% -6.43% 102.89%
Florida $200,738 3.69 734 81 37 25.36% 9.55% 98.52% 1.03% 0.34% 3.38% 0.19% 4.95% -9.39% 121.16%
Georgia $189,403 3.62 732 82 40 25.50% 7.09% 99.08% 1.26% 0.40% 3.20% 0.08% 4.94% -9.66% 120.82%
Hawaii $368,068 3.55 753 72 46 26.81% 7.69% 104.16% 0.71% 0.26% 4.38% 0.29% 5.64% -9.84% 138.01%
Idaho $208,802 3.45 747 75 31 29.70% 7.28% 115.39% 0.65% 0.16% 1.26% 0.03% 2.11% -11.54% 51.57%
Illinois $187,091 3.67 741 80 46 25.19% 13.51% 97.89% 1.05% 0.34% 3.09% 0.26% 4.74% -7.98% 115.97%
Indiana $145,508 3.72 729 83 42 25.12% 9.78% 97.59% 1.39% 0.41% 2.24% 0.17% 4.20% -7.04% 102.72%
Iowa $155,720 3.49 743 81 39 24.08% 12.91% 93.54% 0.93% 0.27% 1.62% 0.14% 2.96% -6.36% 72.36%
Kansas $160,705 3.58 739 82 40 24.36% 5.69% 94.63% 1.14% 0.29% 2.15% 0.11% 3.69% -7.57% 90.17%
Kentucky $155,206 3.65 732 82 42 24.95% 9.56% 96.95% 1.24% 0.33% 2.28% 0.18% 4.03% -7.25% 98.61%
Louisiana $176,527 3.72 725 83 44 20.83% 8.27% 80.93% 1.66% 0.51% 4.08% 0.23% 6.47% -8.39% 158.34%
Maine $188,796 3.61 740 78 42 24.37% 8.07% 94.69% 1.03% 0.29% 1.97% 0.37% 3.66% -7.61% 89.41%
Maryland $260,197 3.53 740 80 41 24.45% 6.14% 94.99% 1.15% 0.37% 3.18% 0.15% 4.85% -9.37% 118.52%
Massachusetts $278,890 3.50 747 72 39 24.42% 5.74% 94.88% 1.00% 0.27% 2.32% 0.11% 3.71% -10.07% 90.68%
Michigan $156,621 3.65 739 80 40 25.13% 7.88% 97.63% 1.02% 0.31% 2.10% 0.05% 3.47% -7.11% 84.98%
Minnesota $202,640 3.56 749 80 40 26.05% 10.80% 101.23% 0.80% 0.23% 1.90% 0.04% 2.98% -8.78% 72.97%
Mississippi $158,197 3.69 722 85 43 21.99% 8.45% 85.44% 1.75% 0.54% 3.65% 0.14% 6.08% -7.68% 148.78%
Missouri $159,025 3.60 738 81 40 24.06% 6.75% 93.48% 1.14% 0.33% 2.04% 0.08% 3.59% -8.97% 87.89%
Montana $203,949 3.58 747 77 41 27.35% 15.04% 106.26% 0.83% 0.22% 1.64% 0.08% 2.78% -6.05% 68.03%
Nebraska $160,036 3.46 745 81 37 23.08% 7.24% 89.65% 0.87% 0.23% 1.58% 0.05% 2.73% -7.72% 66.71%
Nevada $224,391 3.61 738 80 32 28.08% 9.61% 109.10% 0.81% 0.30% 3.61% 0.14% 4.86% -10.11% 118.98%
New Hampshire $217,590 3.59 742 78 42 26.57% 9.31% 103.24% 0.98% 0.28% 1.97% 0.08% 3.31% -11.91% 81.02%
New Jersey $258,015 3.59 743 76 43 22.94% 4.03% 89.12% 1.08% 0.37% 3.60% 0.26% 5.32% -8.60% 130.06%
New Mexico $176,850 3.75 738 80 49 23.39% 8.66% 90.89% 1.02% 0.28% 2.23% 0.23% 3.76% -9.14% 91.90%
New York $248,944 3.83 742 73 54 18.32% 5.36% 71.18% 1.16% 0.39% 4.27% 0.50% 6.32% -7.41% 154.70%
North Carolina $190,087 3.57 741 80 39 26.01% 8.44% 101.04% 1.03% 0.30% 2.17% 0.08% 3.57% -10.10% 87.28%
North Dakota $193,638 3.40 747 81 36 23.61% 7.68% 91.73% 0.83% 0.24% 2.35% 0.20% 3.62% -7.73% 88.45%
Ohio $146,228 3.74 732 83 45 23.82% 9.88% 92.55% 1.23% 0.36% 2.17% 0.19% 3.95% -7.34% 96.60%
Oklahoma $154,490 3.76 731 84 46 21.71% 11.11% 84.35% 1.33% 0.38% 2.68% 0.20% 4.59% -8.92% 112.21%
Oregon $240,730 3.55 751 75 36 27.52% 6.36% 106.94% 0.67% 0.21% 2.07% 0.06% 3.01% -8.30% 73.56%
Pennsylvania $178,450 3.68 740 80 47 22.48% 7.71% 87.36% 1.11% 0.33% 2.33% 0.19% 3.95% -8.54% 96.72%
Rhode Island $217,254 3.63 739 78 43 24.47% 8.06% 95.07% 1.09% 0.29% 2.21% 0.18% 3.77% -11.33% 92.27%
South Carolina $183,356 3.61 734 81 39 26.07% 8.33% 101.27% 1.24% 0.36% 2.60% 0.14% 4.34% -8.86% 106.24%
South Dakota $178,145 3.34 748 80 36 25.29% 12.09% 98.27% 0.78% 0.22% 1.48% 0.08% 2.56% -8.34% 62.65%
Tennessee $185,616 3.57 736 81 37 27.03% 12.03% 105.02% 1.14% 0.30% 2.16% 0.05% 3.64% -8.08% 89.02%
Texas $196,713 3.66 733 81 39 24.97% 9.25% 97.02% 1.24% 0.39% 3.03% 0.08% 4.73% -10.44% 115.80%
Utah $249,277 3.38 744 77 27 31.57% 9.48% 122.66% 0.93% 0.27% 2.00% 0.03% 3.23% -8.52% 79.04%
Vermont $188,565 3.73 744 77 49 23.65% 4.41% 91.88% 1.07% 0.29% 2.25% 0.26% 3.87% -4.63% 94.72%
Virginia $256,226 3.45 746 79 38 25.48% 7.73% 98.99% 0.89% 0.27% 2.29% 0.05% 3.50% -10.51% 85.57%
Washington $276,832 3.46 749 74 33 28.51% 8.12% 110.78% 0.70% 0.19% 1.90% 0.05% 2.84% -8.77% 69.50%
West Virginia $152,200 3.73 725 84 45 21.01% 8.77% 81.61% 1.69% 0.40% 2.67% 0.12% 4.88% -6.37% 119.40%
Wisconsin $170,417 3.60 741 80 42 28.07% 14.10% 109.06% 1.02% 0.29% 1.88% 0.14% 3.33% -5.59% 81.38%
Wyoming $206,745 3.49 740 80 38 26.83% 8.53% 104.25% 1.05% 0.27% 2.35% 0.06% 3.73% -4.53% 91.34%
GSE and GNMA fixed rate product only Source: Black Knight McDash
State SummaryPrepayment and Delinquency
Confidential. PHOENIX use only.

For questions about this report, or to receive more information about our services, please contact your PHOENIX representative or reach us at [email protected].
Important Disclaimer: The material in this document has been prepared by PHOENIX based on information available to it
from third-party sources and contains general information about mortgage rates current as of the date of this document.
This information was compiled from sources believed to be reliable for informational purposes only. This information should
not be considered as advice or a recommendation in relation to defining mortgage rates, holding, purchasing or selling
financial products or instruments and does not take into account your particular mortgage production or particular
investment or financial objectives, situations or needs. We do not guarantee the accuracy of this information or any results
and further assume no responsibility or liability for any loss/damage suffered or incurred by you or any other person/entity,
however caused, relating in any way to reliance upon the information in this document.