Embed Size (px)
Citation preview
Phonon band structure and thermal transport correlation in a layered diatomic crystal
A. J. H. McGaughey* and M. I. Hussein†
Department of Mechanical Engineering, University of Michigan, Ann Arbor, Michigan 48109-2125, USA
E. S. LandryDepartment of Mechanical Engineering, Carnegie Mellon University, Pittsburgh, Pennsylvania 15213-3890, USA
M. Kaviany and G. M. HulbertDepartment of Mechanical Engineering, University of Michigan, Ann Arbor, Michigan 48109-2125, USA
�Received 2 June 2006; published 29 September 2006�
To elucidate the three-way relationship among a crystal’s structure, its phonon dispersion characteristics, andits thermal conductivity, an analysis is conducted on layered diatomic Lennard-Jones crystals with variousmass ratios. Lattice dynamics theory and molecular dynamics simulations are used to predict the phonondispersion curves and the thermal conductivity. The layered structure generates directionally dependent thermalconductivities lower than those predicted by density trends alone. The dispersion characteristics are quantifiedusing a set of band diagram metrics, which are used to assess the contributions of acoustic phonons and opticalphonons to the thermal conductivity. The thermal conductivity increases as the extent of the acoustic modesincreases, and it decreases as the extent of the stop bands increases. The sensitivity of the thermal conductivityto the band diagram metrics is highest at low temperatures, where there is less anharmonic scattering, indicat-ing that dispersion plays a more prominent role in thermal transport in that regime. We propose that thedispersion metrics �i� provide an indirect measure of the relative contributions of dispersion and anharmonicscattering to the thermal transport, and �ii� uncouple the standard thermal conductivity structure-propertyrelation to that of structure-dispersion and dispersion-property relations, providing opportunities for betterunderstanding of the underlying physical mechanisms and a potential tool for material design.
DOI: 10.1103/PhysRevB.74.104304 PACS number�s�: 63.20.Dj
I. INTRODUCTION
Thermal transport in a dielectric crystal is governed byphonon dispersion and phonon scattering.1 The majority oftheoretical studies of thermal transport in dielectrics dealwith phonon dispersion at a qualitative level. A commontreatment is to assume that the contribution of opticalphonons to the thermal conductivity is negligible because theassociated dispersion branches are often flat, implying lowphonon group velocities. Theories that quantitatively relatedispersion characteristics to bulk thermal transport propertiesare limited. One example is the use of phonon dispersioncurves to determine the phonon group and phase velocitiesrequired in the single mode relaxation time formulation ofthe Boltzmann transport equation �BTE�.2,3 Even in such acase, the dispersion is usually greatly simplified. The impor-tance of accurately and completely incorporating dispersioninto this BTE formulation has recently been investigated forbulk materials4,5 and for nanostructures.6,7
Dong et al.8 report evidence of the important role thatphonon dispersion plays in thermal transport in their study ofgermanium clathrates using molecular dynamics �MD� simu-lations. In their Fig. 1, they show phonon dispersion curvesfor a diamond structure, a clathrate cage, and the same cagestructure but filled with weakly bonded guest strontium at-oms that behave as “rattlers.” Although the range of frequen-cies accessed by the vibrational modes in these three struc-tures is comparable, the dispersion characteristics are quitedifferent. The large unit cell of the clathrate cage signifi-cantly reduces the frequency range of the acoustic phonons,the carriers generally assumed to be most responsible for
thermal transport. There is an accompanying factor of 10reduction in the thermal conductivity. In the filled cage, theencapsulated guest atoms have a natural frequency that cutsdirectly through the middle of what would be the acousticphonon branches, and the value of the thermal conductivityis reduced by a further factor of 10. Experimental studies onfilled cagelike structures have found similar results, i.e., thatrattler atoms can reduce the thermal conductivity.9,10
Considering phonon dispersion is also important in study-ing thermal transport in superlattices.11–14 Using an inelasticphonon Boltzmann approach to model anharmonic three-phonon scattering processes, Broido and Reinecke11 studiedthe thermal conductivity of a model two-mass superlatticewith a diamond structure, and how it depends on the massratio and layer thickness. As the mass ratio is increased, thedispersion curves flatten, which tends to lower the thermalconductivity. At the same time, the increase in mass ratioreduces the cross-section for Umklapp scattering, whichtends to increase the thermal conductivity. The relative im-portance of these two mechanisms is found to be a functionof the layer thickness. Using a kinetic theory model, Simkinand Mahan12 found that as the layer thickness in a modelsuperlattice is reduced, the thermal conductivity decreasesdue to an increase in ballistic scattering stemming from therise in interface density. It was shown in the same study thatas the layer thickness is further reduced to values sufficientlysmaller than the phonon mean free path, the thermal conduc-tivity increases. This transition, which predicts a minimumsuperlattice thermal conductivity, was attributed to a shiftfrom phonon transport best described by a particle theory toone that follows a wave theory. This minimum superlattice
PHYSICAL REVIEW B 74, 104304 �2006�
1098-0121/2006/74�10�/104304�12� ©2006 The American Physical Society104304-1
thermal conductivity has also been measured in experi-ments15–17 and predicted in MD simulations.13 The need for awave treatment of phonons indicates that interference mech-anisms affect the phonon transport.
Apart from the above-mentioned efforts, few investiga-tions have attempted to rigorously establish a connection be-tween dispersion characteristics, which include the size andlocation of frequency pass bands �and stop bands�, and ther-mal transport properties. In this work we explore the three-way relationship in a crystal between: �i� the unit cell struc-ture, �ii� the associated dispersion characteristics, and �iii� thebulk thermal transport behavior, using lattice dynamics cal-culations and MD simulations, as shown in Fig. 1. The dis-persion characteristics are quantified using a set of frequencyband diagram metrics. As a starting point, we narrow ourattention to a diatomic Lennard-Jones �LJ� crystal that corre-sponds to a monolayer superlattice. The atomic species areonly differentiated by their masses. By modeling a simplesystem, phenomena can be observed that might not be dis-cernable in more complex structures. The overall theme ofthe investigation, however, is intended for dielectric crystalsin general, and the analysis tools developed are not limited tosuperlattices.
The insights gained in this study could lead to the devel-opment of a systematic technique for the atomic-level designof materials with desired thermal transport properties. Thiscapability could facilitate the introduction of new, yet realiz-able, materials with very high or low thermal conductivities.Examples of applications include thermoelectric materialswith high figure-of-merit, microelectronic devices enjoyingenhanced cooling characteristics, and efficient thermal insu-lators for chemical processing.
We begin by presenting the diatomic crystal structure andbasic information pertaining to the MD simulations. Phonondispersion relations are then determined using lattice dynam-ics calculations and analyzed for different mass ratios at vari-ous temperatures. The band diagram metrics are introducedand discussed. We then use MD simulations and the Green-Kubo �GK� method to predict the thermal conductivities ofthese structures. Discussion is presented with regard to themagnitude of the thermal conductivity, its directional andtemperature dependencies, and its relation to the unit cell.We then explore the relationship between the thermal con-ductivity and the associated dispersion band structure.
II. CRYSTAL STRUCTURE AND MOLECULARDYNAMICS SIMULATIONS
We perform our study of the relationship among atomicstructure, phonon band structure, and thermal transport byconsidering model systems described by the LJ potential,
�ij�rij� = 4�LJ���LJ
rij�12
− ��LJ
rij�6� . �1�
Here, �ij is the potential energy associated with a pair ofparticles �i and j� separated by a distance rij, the potentialwell depth is �LJ, and the equilibrium pair separation is21/6�LJ. The LJ potential is commonly used in investigationsof thermal transport in bulk and composite sys-tems.5,13,14,18–23 Dimensional quantities have been scaled forargon, for which �LJ and �LJ have values of 1.67�10−21 Jand 3.4�10−10 m.24 The argon mass scale, mLJ, is 6.63�10−26 kg �the mass of one atom�. Quantities reported indimensionless LJ units are indicated by an asterisk.
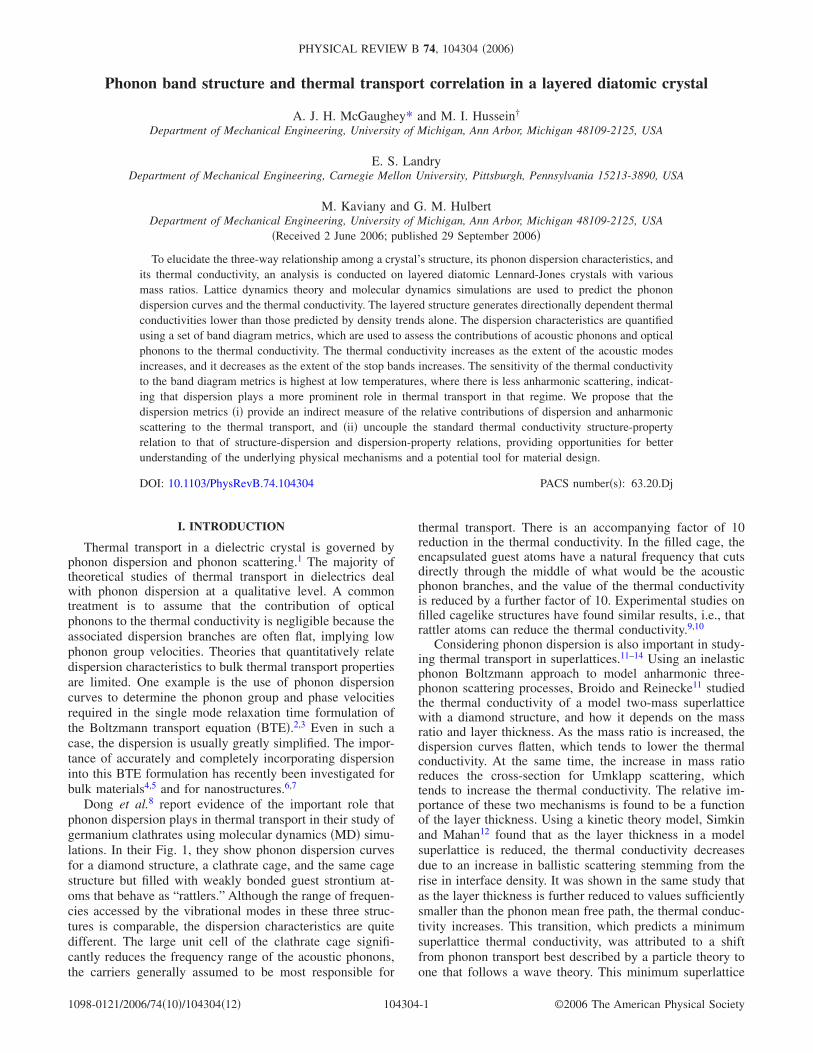
The structure we consider is a simple-cubic crystal with afour-atom basis �unit cell� and lattice parameter a, as shownin Fig. 2. If the four atoms A–D are identical, the conven-tional unit-cell representation of the face-centered-cubic �fcc�crystal structure is obtained. By taking two of the atoms in
FIG. 1. Schematic of the relationships among atomic structure,dispersion characteristics, and thermal conductivity. Shown are boththe tools available for moving between these blocks �solid lines�and the links we are seeking to establish �dashed lines�. Link A isdiscussed in Sec. III, link B in Sec. IV C, link C* in Sec. V A andlink C in Sec. V B. In this investigation, we restrict our discussionof the lattice dynamics to the phonon mode frequencies.
FIG. 2. �Color online� The four-atom unit cell of the layereddiatomic crystal. If the four atoms are equivalent, the crystal struc-ture is fcc. If A and B have a different mass than C and D, thecrystal structure is simple cubic. The arrangement chosen leads toplanes with a thickness of one atomic layer stacked in the �010��cross-plane� direction.
MCGAUGHEY et al. PHYSICAL REVIEW B 74, 104304 �2006�
104304-2
the basis �A, B� to have one mass, m1, and the other two �C,D� to have a different mass, m2, a crystal with alternatinglayers of atoms in the �010� direction �which we will refer toas the cross-plane �CP� direction� is created. We will refer tothe �100� and �001� directions as the in-plane �IP� directions.This structure is a monolayer superlattice. The value of m2 isfixed at mLJ, and the mass ratio Rm is defined as
Rm m1
m2. �2�
The dimensionless mass of the atoms in a monatomic systemwill be denoted by m*. It has a value of unity, unless noted.By varying only the atomic masses, the LJ potential can beapplied to this system without any modification. We prima-rily consider Rm values of 1 �the monatomic unit cell�, 2, 5,and 10. We note that this variation in atomic masses is in thesame spirit as the work of Broido and Reinecke11 and Che etal.,25 who considered two-mass diamond systems.
The MD simulations are performed in dimensionless LJunits. All results can be scaled to dimensional values usingthe parameters �LJ, �LJ, and mLJ, and the Boltzmann con-stant, kB, which is part of the temperature scale, �LJ/kB. Fromdimensional analysis, it can be shown that the thermal con-ductivity of the 1/Rm system, k1/Rm
, is related to that of theRm system, kRm
, through
k1/Rm= kRm
Rm1/2. �3�
Thus, one dimensionless simulation can be used to generatedata for both the Rm system and the 1/Rm system. Wherehelpful, data corresponding to mass ratios of 0.1, 0.2, and 0.5will be presented.
The purpose of the MD simulations is �i� to obtain thezero-pressure lattice parameter as a function of temperature�used in later simulations and for lattice dynamics calcula-tions� and �ii� to predict the thermal conductivity. Becausethe functional form of the LJ potential is kept the same �weconsider only different masses�, the zero-pressure unit cellparameters remain unchanged from those for a single-masssystem.5
All reported MD results are generated from simulationsrun in the NVE �constant mass, volume, and energy� en-semble at zero pressure with a time step of 4.285 fs. Thesimulation cell contains 512 atoms �eight unit cells in thecross-plane direction and four in the in-plane direction� andperiodic boundary conditions are imposed in all three direc-tions. This system size was found to be sufficient to obtaincomputational domain size-independent thermal conductivi-ties. The MD procedures have been described in detailelsewhere.5,22,26 We consider temperatures T between 10 and80 K in 10 K increments. The melting temperature of themonatomic system is 87 K. The data presented in the thermalconductivity analysis for a given parameter set �Rm, T, andthe crystallographic direction� are obtained by averagingover five independent simulations so as to get a representa-tive sampling of the associated phase space. In each of thefive simulations, information is obtained over 1�106 timesteps, after an equilibration period of 5�105 time steps.
III. PHONON DISPERSION
The frequency �phonon� space characteristics of a solidphase can be determined with lattice dynamics calcula-tions,27 in which the real-space coordinates �the positions�are transformed into the normal mode coordinates �the pho-non modes�. Each normal mode has a frequency, �, wavevector, �, and polarization vector, e �which describes themode shape�. The available wave vectors are obtained fromthe crystal structure, and the frequencies and polarizationvectors are found by solving the eigenvalue equation27
�2��,��e��,�� = D��� · e��,�� , �4�
where D��� is the dynamical matrix for the unit cell and theparameter � identifies the polarization for a given wave vec-tor. The lattice dynamics methods used are reviewed in theAppendix.
The predictions of harmonic lattice dynamics calculationsfrom Eq. �4� at zero temperature are exact and can be foundusing the equilibrium atomic positions and the interatomicpotential. As the temperature rises, the system will moveaway from the zero-temperature minimum of the potentialenergy surface. The lattice dynamics are affected in twoways. First, the solid will either expand or contract. Thiseffect can be accounted for by using the finite-temperaturelattice constant in the harmonic lattice dynamics formulation�the quasi-harmonic approximation�.27 Second, the motionsof the atoms will lead to anharmonic interactions. These ef-fects cannot be easily accounted for in the formal latticedynamics theory due to the difficulty in incorporating third-order �and higher� derivatives of the interatomic potential. Inan MD simulation, it is possible, with considerable effort, tocapture the true anharmonic lattice dynamics.5 For the pur-poses of this investigation, however, we restrict the analysisto the quasi-harmonic formulation. Further discussion of thischoice will follow where appropriate.
We now consider the relationship between the mass ratioRm and the dispersion characteristics �A in Fig. 1� by plottinga set of dispersion curves in Figs. 3�a�–3�c�. The plots in Fig.3 are of dimensionless frequency, �*=� / ��LJ/mLJ�LJ
2 �1/2, vsdimensionless wave number, defined as �*=� / �2� /a�. Thezero-temperature phonon dispersion curves for the mon-atomic �Rm=1� unit cell in the �100� direction are shown inFig. 3�a�. As this system has cubic isotropy, the dispersioncharacteristics are the same for the �010� and �001� direc-tions. For the monatomic crystal, the true Brillouin zone ex-tends to a �* value of unity in the �100� direction and is atruncated octahedron. Here, to be consistent with the plotsfor the layered structure �where the Brillouin zone extends toa �* value of 0.5 and is cubic�, the branches have been foldedover at their midpoints.
The zero-temperature dispersion curves for the in-planeand cross-plane directions for the Rm=10 unit cell are shownin Figs. 3�b� and 3�c�. The anisotropy of the crystal structureis reflected in the directional dependence of the plotted dis-persion curves. At nonunity mass ratios, stop bands �bandgaps� in the frequency spectra are evident and grow as Rm isincreased. A stop band in the in-plane direction opens when
PHONON BAND STRUCTURE AND THERMAL TRANSPORT… PHYSICAL REVIEW B 74, 104304 �2006�
104304-3
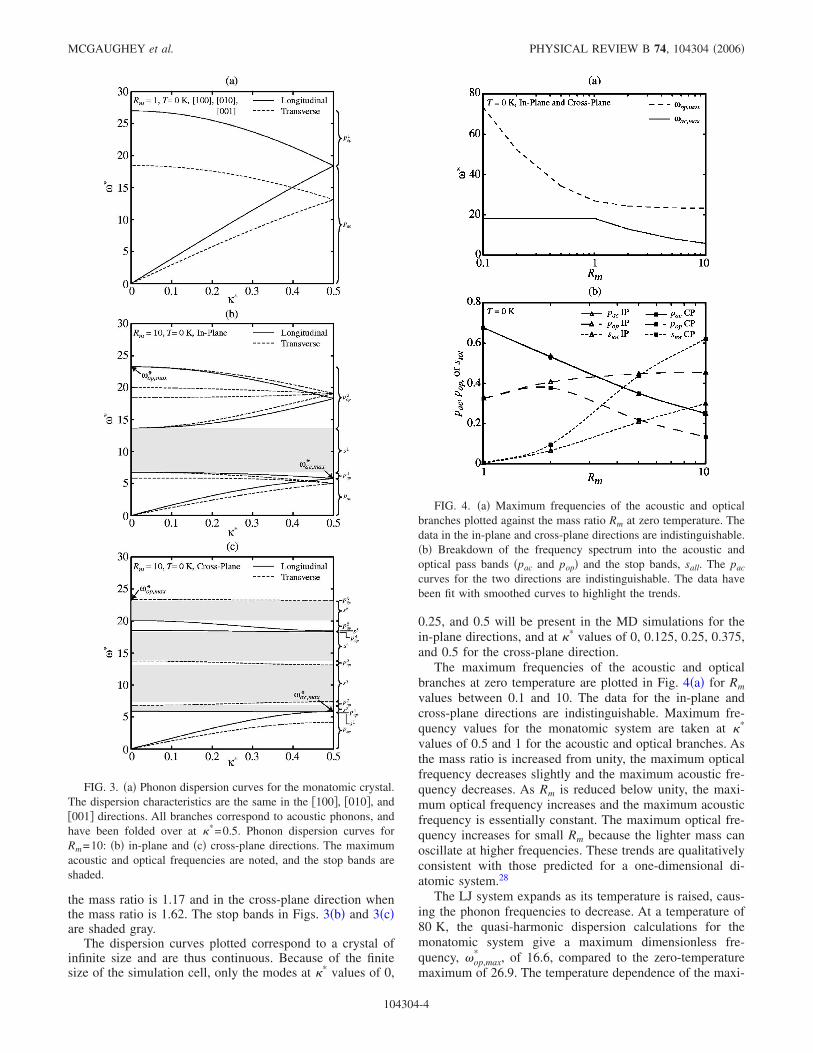
the mass ratio is 1.17 and in the cross-plane direction whenthe mass ratio is 1.62. The stop bands in Figs. 3�b� and 3�c�are shaded gray.
The dispersion curves plotted correspond to a crystal ofinfinite size and are thus continuous. Because of the finitesize of the simulation cell, only the modes at �* values of 0,
0.25, and 0.5 will be present in the MD simulations for thein-plane directions, and at �* values of 0, 0.125, 0.25, 0.375,and 0.5 for the cross-plane direction.
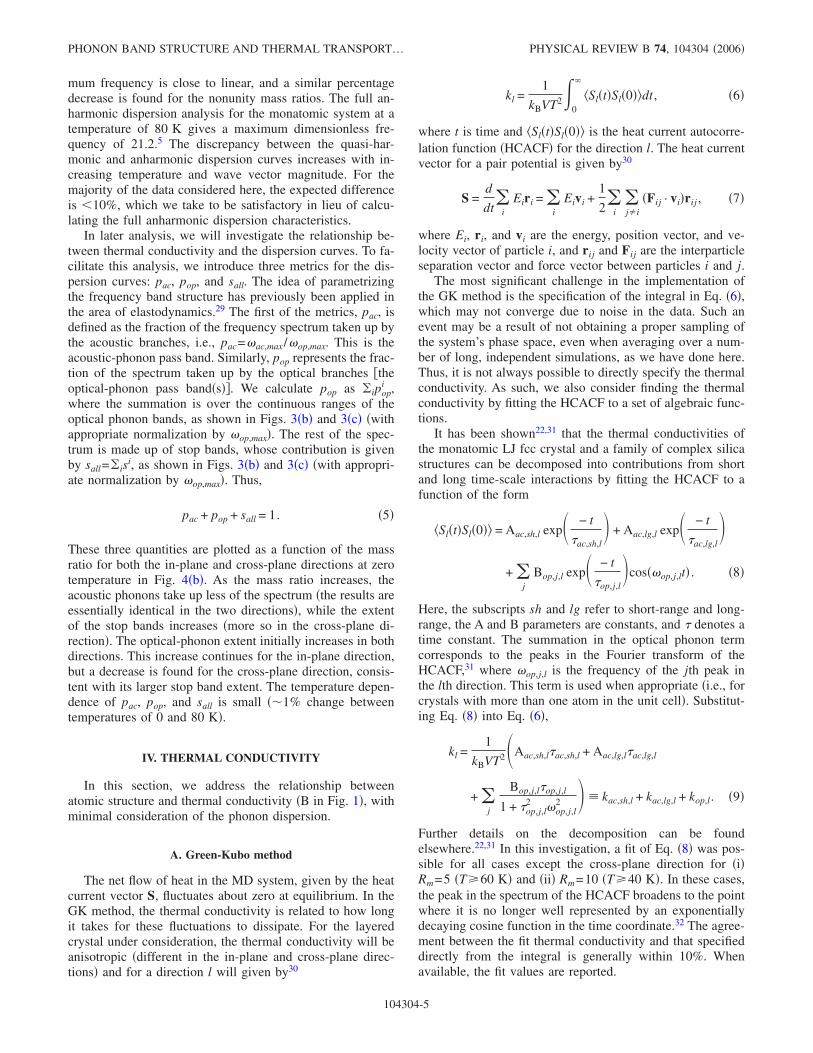
The maximum frequencies of the acoustic and opticalbranches at zero temperature are plotted in Fig. 4�a� for Rmvalues between 0.1 and 10. The data for the in-plane andcross-plane directions are indistinguishable. Maximum fre-quency values for the monatomic system are taken at �*
values of 0.5 and 1 for the acoustic and optical branches. Asthe mass ratio is increased from unity, the maximum opticalfrequency decreases slightly and the maximum acoustic fre-quency decreases. As Rm is reduced below unity, the maxi-mum optical frequency increases and the maximum acousticfrequency is essentially constant. The maximum optical fre-quency increases for small Rm because the lighter mass canoscillate at higher frequencies. These trends are qualitativelyconsistent with those predicted for a one-dimensional di-atomic system.28
The LJ system expands as its temperature is raised, caus-ing the phonon frequencies to decrease. At a temperature of80 K, the quasi-harmonic dispersion calculations for themonatomic system give a maximum dimensionless fre-quency, �op,max
* , of 16.6, compared to the zero-temperaturemaximum of 26.9. The temperature dependence of the maxi-
FIG. 3. �a� Phonon dispersion curves for the monatomic crystal.The dispersion characteristics are the same in the �100�, �010�, and�001� directions. All branches correspond to acoustic phonons, andhave been folded over at �*=0.5. Phonon dispersion curves forRm=10: �b� in-plane and �c� cross-plane directions. The maximumacoustic and optical frequencies are noted, and the stop bands areshaded.
FIG. 4. �a� Maximum frequencies of the acoustic and opticalbranches plotted against the mass ratio Rm at zero temperature. Thedata in the in-plane and cross-plane directions are indistinguishable.�b� Breakdown of the frequency spectrum into the acoustic andoptical pass bands �pac and pop� and the stop bands, sall. The pac
curves for the two directions are indistinguishable. The data havebeen fit with smoothed curves to highlight the trends.
MCGAUGHEY et al. PHYSICAL REVIEW B 74, 104304 �2006�
104304-4
mum frequency is close to linear, and a similar percentagedecrease is found for the nonunity mass ratios. The full an-harmonic dispersion analysis for the monatomic system at atemperature of 80 K gives a maximum dimensionless fre-quency of 21.2.5 The discrepancy between the quasi-har-monic and anharmonic dispersion curves increases with in-creasing temperature and wave vector magnitude. For themajority of the data considered here, the expected differenceis 10%, which we take to be satisfactory in lieu of calcu-lating the full anharmonic dispersion characteristics.
In later analysis, we will investigate the relationship be-tween thermal conductivity and the dispersion curves. To fa-cilitate this analysis, we introduce three metrics for the dis-persion curves: pac, pop, and sall. The idea of parametrizingthe frequency band structure has previously been applied inthe area of elastodynamics.29 The first of the metrics, pac, isdefined as the fraction of the frequency spectrum taken up bythe acoustic branches, i.e., pac=�ac,max /�op,max. This is theacoustic-phonon pass band. Similarly, pop represents the frac-tion of the spectrum taken up by the optical branches �theoptical-phonon pass band�s��. We calculate pop as ipop
i ,where the summation is over the continuous ranges of theoptical phonon bands, as shown in Figs. 3�b� and 3�c� �withappropriate normalization by �op,max�. The rest of the spec-trum is made up of stop bands, whose contribution is givenby sall=is
i, as shown in Figs. 3�b� and 3�c� �with appropri-ate normalization by �op,max�. Thus,
pac + pop + sall = 1. �5�
These three quantities are plotted as a function of the massratio for both the in-plane and cross-plane directions at zerotemperature in Fig. 4�b�. As the mass ratio increases, theacoustic phonons take up less of the spectrum �the results areessentially identical in the two directions�, while the extentof the stop bands increases �more so in the cross-plane di-rection�. The optical-phonon extent initially increases in bothdirections. This increase continues for the in-plane direction,but a decrease is found for the cross-plane direction, consis-tent with its larger stop band extent. The temperature depen-dence of pac, pop, and sall is small ��1% change betweentemperatures of 0 and 80 K�.
IV. THERMAL CONDUCTIVITY
In this section, we address the relationship betweenatomic structure and thermal conductivity �B in Fig. 1�, withminimal consideration of the phonon dispersion.
A. Green-Kubo method
The net flow of heat in the MD system, given by the heatcurrent vector S, fluctuates about zero at equilibrium. In theGK method, the thermal conductivity is related to how longit takes for these fluctuations to dissipate. For the layeredcrystal under consideration, the thermal conductivity will beanisotropic �different in the in-plane and cross-plane direc-tions� and for a direction l will given by30
kl =1
kBVT2�0
Sl�t�Sl�0��dt , �6�
where t is time and Sl�t�Sl�0�� is the heat current autocorre-lation function �HCACF� for the direction l. The heat currentvector for a pair potential is given by30
S =d
dt
i
Eiri = i
Eivi +1
2i
j�i
�Fij · vi�rij , �7�
where Ei, ri, and vi are the energy, position vector, and ve-locity vector of particle i, and rij and Fij are the interparticleseparation vector and force vector between particles i and j.
The most significant challenge in the implementation ofthe GK method is the specification of the integral in Eq. �6�,which may not converge due to noise in the data. Such anevent may be a result of not obtaining a proper sampling ofthe system’s phase space, even when averaging over a num-ber of long, independent simulations, as we have done here.Thus, it is not always possible to directly specify the thermalconductivity. As such, we also consider finding the thermalconductivity by fitting the HCACF to a set of algebraic func-tions.
It has been shown22,31 that the thermal conductivities ofthe monatomic LJ fcc crystal and a family of complex silicastructures can be decomposed into contributions from shortand long time-scale interactions by fitting the HCACF to afunction of the form
Sl�t�Sl�0�� = Aac,sh,l exp� − t
�ac,sh,l� + Aac,lg,l exp� − t
�ac,lg,l�
+ j
Bop,j,l exp� − t
�op,j,l�cos��op,j,lt� . �8�
Here, the subscripts sh and lg refer to short-range and long-range, the A and B parameters are constants, and � denotes atime constant. The summation in the optical phonon termcorresponds to the peaks in the Fourier transform of theHCACF,31 where �op,j,l is the frequency of the jth peak inthe lth direction. This term is used when appropriate �i.e., forcrystals with more than one atom in the unit cell�. Substitut-ing Eq. �8� into Eq. �6�,
kl =1
kBVT2�Aac,sh,l�ac,sh,l + Aac,lg,l�ac,lg,l
+ j
Bop,j,l�op,j,l
1 + �op,j,l2 �op,j,l
2 � kac,sh,l + kac,lg,l + kop,l. �9�
Further details on the decomposition can be foundelsewhere.22,31 In this investigation, a fit of Eq. �8� was pos-sible for all cases except the cross-plane direction for �i�Rm=5 �T�60 K� and �ii� Rm=10 �T�40 K�. In these cases,the peak in the spectrum of the HCACF broadens to the pointwhere it is no longer well represented by an exponentiallydecaying cosine function in the time coordinate.32 The agree-ment between the fit thermal conductivity and that specifieddirectly from the integral is generally within 10%. Whenavailable, the fit values are reported.
PHONON BAND STRUCTURE AND THERMAL TRANSPORT… PHYSICAL REVIEW B 74, 104304 �2006�
104304-5
B. Heat current autocorrelation function
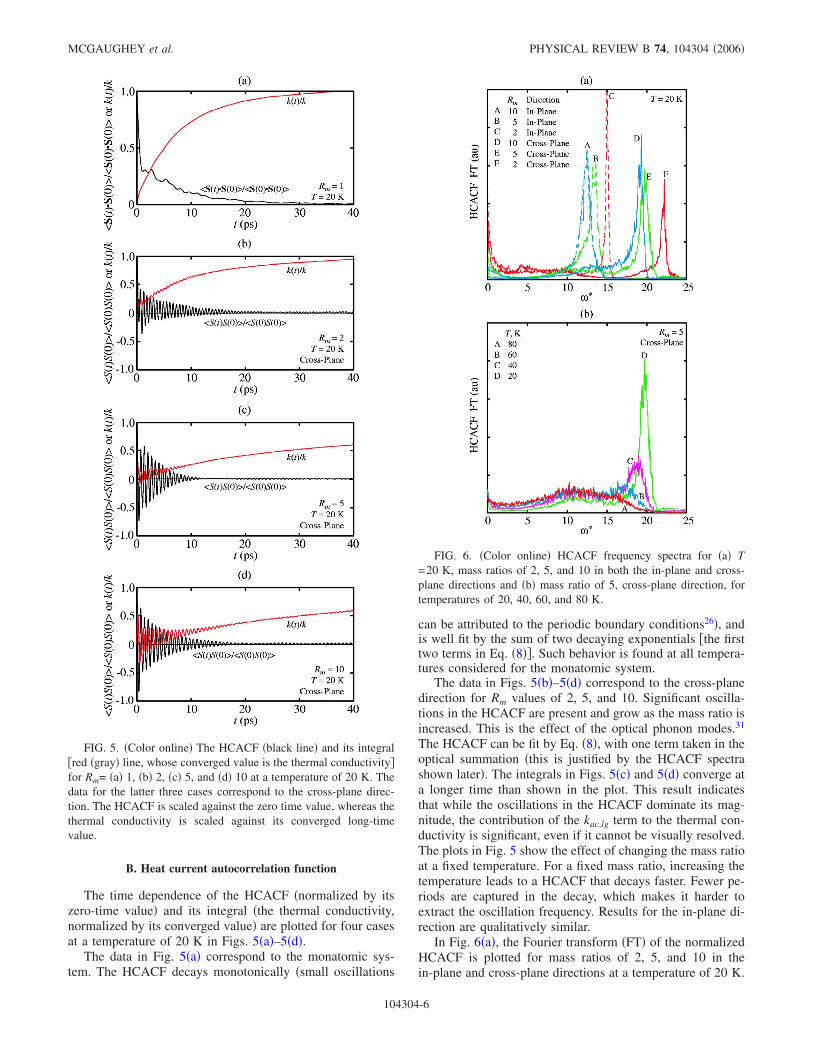
The time dependence of the HCACF �normalized by itszero-time value� and its integral �the thermal conductivity,normalized by its converged value� are plotted for four casesat a temperature of 20 K in Figs. 5�a�–5�d�.
The data in Fig. 5�a� correspond to the monatomic sys-tem. The HCACF decays monotonically �small oscillations
can be attributed to the periodic boundary conditions26�, andis well fit by the sum of two decaying exponentials �the firsttwo terms in Eq. �8��. Such behavior is found at all tempera-tures considered for the monatomic system.
The data in Figs. 5�b�–5�d� correspond to the cross-planedirection for Rm values of 2, 5, and 10. Significant oscilla-tions in the HCACF are present and grow as the mass ratio isincreased. This is the effect of the optical phonon modes.31
The HCACF can be fit by Eq. �8�, with one term taken in theoptical summation �this is justified by the HCACF spectrashown later�. The integrals in Figs. 5�c� and 5�d� converge ata longer time than shown in the plot. This result indicatesthat while the oscillations in the HCACF dominate its mag-nitude, the contribution of the kac,lg term to the thermal con-ductivity is significant, even if it cannot be visually resolved.The plots in Fig. 5 show the effect of changing the mass ratioat a fixed temperature. For a fixed mass ratio, increasing thetemperature leads to a HCACF that decays faster. Fewer pe-riods are captured in the decay, which makes it harder toextract the oscillation frequency. Results for the in-plane di-rection are qualitatively similar.
In Fig. 6�a�, the Fourier transform �FT� of the normalizedHCACF is plotted for mass ratios of 2, 5, and 10 in thein-plane and cross-plane directions at a temperature of 20 K.
FIG. 5. �Color online� The HCACF �black line� and its integral�red �gray� line, whose converged value is the thermal conductivity�for Rm= �a� 1, �b� 2, �c� 5, and �d� 10 at a temperature of 20 K. Thedata for the latter three cases correspond to the cross-plane direc-tion. The HCACF is scaled against the zero time value, whereas thethermal conductivity is scaled against its converged long-timevalue.
FIG. 6. �Color online� HCACF frequency spectra for �a� T=20 K, mass ratios of 2, 5, and 10 in both the in-plane and cross-plane directions and �b� mass ratio of 5, cross-plane direction, fortemperatures of 20, 40, 60, and 80 K.
MCGAUGHEY et al. PHYSICAL REVIEW B 74, 104304 �2006�
104304-6
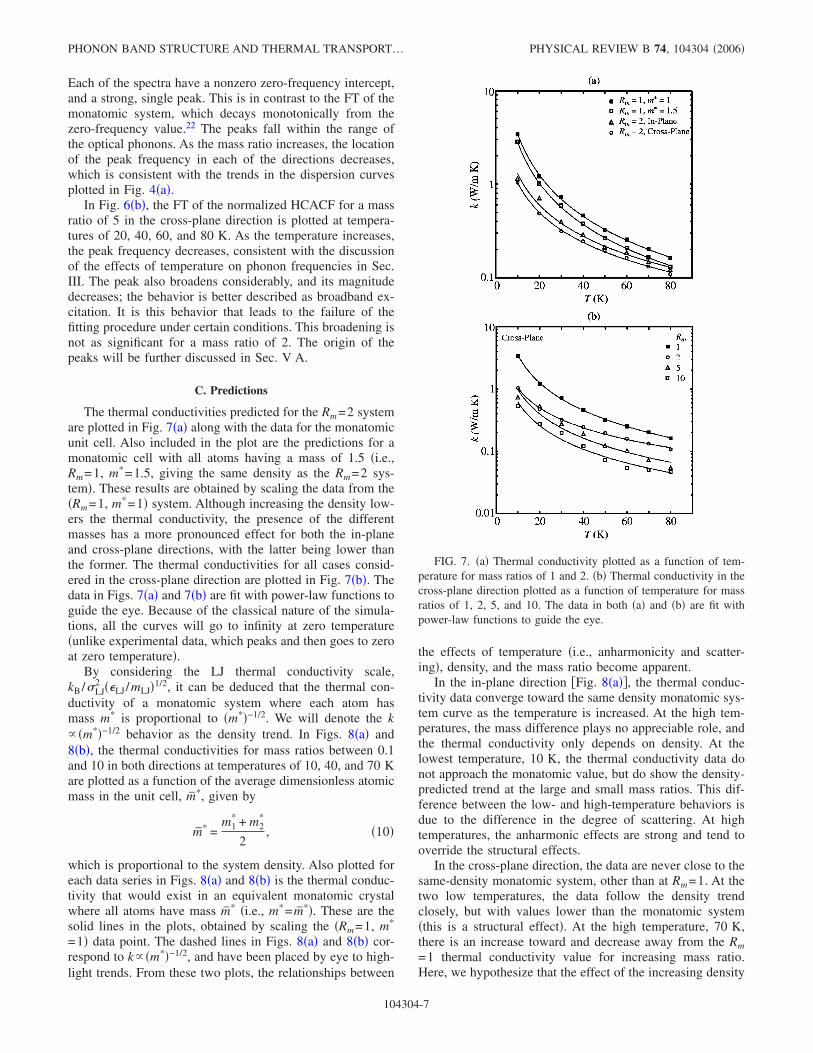
Each of the spectra have a nonzero zero-frequency intercept,and a strong, single peak. This is in contrast to the FT of themonatomic system, which decays monotonically from thezero-frequency value.22 The peaks fall within the range ofthe optical phonons. As the mass ratio increases, the locationof the peak frequency in each of the directions decreases,which is consistent with the trends in the dispersion curvesplotted in Fig. 4�a�.
In Fig. 6�b�, the FT of the normalized HCACF for a massratio of 5 in the cross-plane direction is plotted at tempera-tures of 20, 40, 60, and 80 K. As the temperature increases,the peak frequency decreases, consistent with the discussionof the effects of temperature on phonon frequencies in Sec.III. The peak also broadens considerably, and its magnitudedecreases; the behavior is better described as broadband ex-citation. It is this behavior that leads to the failure of thefitting procedure under certain conditions. This broadening isnot as significant for a mass ratio of 2. The origin of thepeaks will be further discussed in Sec. V A.
C. Predictions
The thermal conductivities predicted for the Rm=2 systemare plotted in Fig. 7�a� along with the data for the monatomicunit cell. Also included in the plot are the predictions for amonatomic cell with all atoms having a mass of 1.5 �i.e.,Rm=1, m*=1.5, giving the same density as the Rm=2 sys-tem�. These results are obtained by scaling the data from the�Rm=1, m*=1� system. Although increasing the density low-ers the thermal conductivity, the presence of the differentmasses has a more pronounced effect for both the in-planeand cross-plane directions, with the latter being lower thanthe former. The thermal conductivities for all cases consid-ered in the cross-plane direction are plotted in Fig. 7�b�. Thedata in Figs. 7�a� and 7�b� are fit with power-law functions toguide the eye. Because of the classical nature of the simula-tions, all the curves will go to infinity at zero temperature�unlike experimental data, which peaks and then goes to zeroat zero temperature�.
By considering the LJ thermal conductivity scale,kB/�LJ
2 ��LJ/mLJ�1/2, it can be deduced that the thermal con-ductivity of a monatomic system where each atom hasmass m* is proportional to �m*�−1/2. We will denote the k �m*�−1/2 behavior as the density trend. In Figs. 8�a� and8�b�, the thermal conductivities for mass ratios between 0.1and 10 in both directions at temperatures of 10, 40, and 70 Kare plotted as a function of the average dimensionless atomicmass in the unit cell, m*, given by
m* =m1
* + m2*
2, �10�
which is proportional to the system density. Also plotted foreach data series in Figs. 8�a� and 8�b� is the thermal conduc-tivity that would exist in an equivalent monatomic crystalwhere all atoms have mass m* �i.e., m*= m*�. These are thesolid lines in the plots, obtained by scaling the �Rm=1, m*
=1� data point. The dashed lines in Figs. 8�a� and 8�b� cor-respond to k �m*�−1/2, and have been placed by eye to high-light trends. From these two plots, the relationships between
the effects of temperature �i.e., anharmonicity and scatter-ing�, density, and the mass ratio become apparent.
In the in-plane direction �Fig. 8�a��, the thermal conduc-tivity data converge toward the same density monatomic sys-tem curve as the temperature is increased. At the high tem-peratures, the mass difference plays no appreciable role, andthe thermal conductivity only depends on density. At thelowest temperature, 10 K, the thermal conductivity data donot approach the monatomic value, but do show the density-predicted trend at the large and small mass ratios. This dif-ference between the low- and high-temperature behaviors isdue to the difference in the degree of scattering. At hightemperatures, the anharmonic effects are strong and tend tooverride the structural effects.
In the cross-plane direction, the data are never close to thesame-density monatomic system, other than at Rm=1. At thetwo low temperatures, the data follow the density trendclosely, but with values lower than the monatomic system�this is a structural effect�. At the high temperature, 70 K,there is an increase toward and decrease away from the Rm=1 thermal conductivity value for increasing mass ratio.Here, we hypothesize that the effect of the increasing density
FIG. 7. �a� Thermal conductivity plotted as a function of tem-perature for mass ratios of 1 and 2. �b� Thermal conductivity in thecross-plane direction plotted as a function of temperature for massratios of 1, 2, 5, and 10. The data in both �a� and �b� are fit withpower-law functions to guide the eye.
PHONON BAND STRUCTURE AND THERMAL TRANSPORT… PHYSICAL REVIEW B 74, 104304 �2006�
104304-7
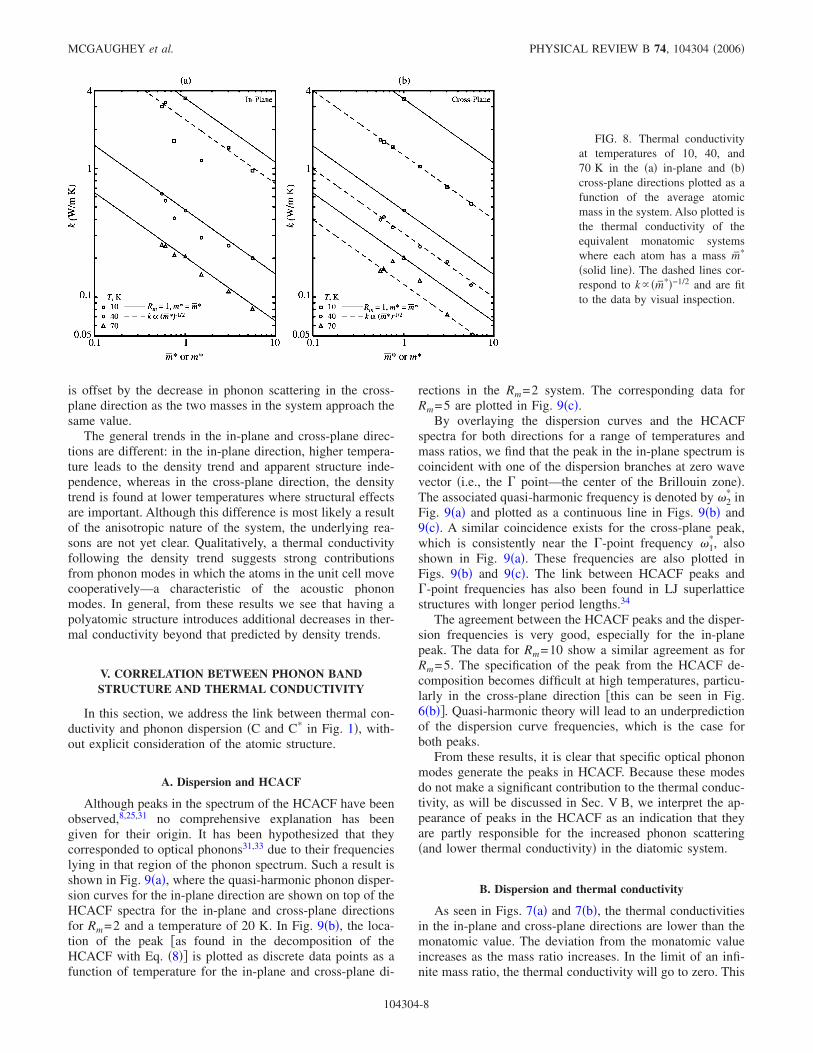
is offset by the decrease in phonon scattering in the cross-plane direction as the two masses in the system approach thesame value.
The general trends in the in-plane and cross-plane direc-tions are different: in the in-plane direction, higher tempera-ture leads to the density trend and apparent structure inde-pendence, whereas in the cross-plane direction, the densitytrend is found at lower temperatures where structural effectsare important. Although this difference is most likely a resultof the anisotropic nature of the system, the underlying rea-sons are not yet clear. Qualitatively, a thermal conductivityfollowing the density trend suggests strong contributionsfrom phonon modes in which the atoms in the unit cell movecooperatively—a characteristic of the acoustic phononmodes. In general, from these results we see that having apolyatomic structure introduces additional decreases in ther-mal conductivity beyond that predicted by density trends.
V. CORRELATION BETWEEN PHONON BANDSTRUCTURE AND THERMAL CONDUCTIVITY
In this section, we address the link between thermal con-ductivity and phonon dispersion �C and C* in Fig. 1�, with-out explicit consideration of the atomic structure.
A. Dispersion and HCACF
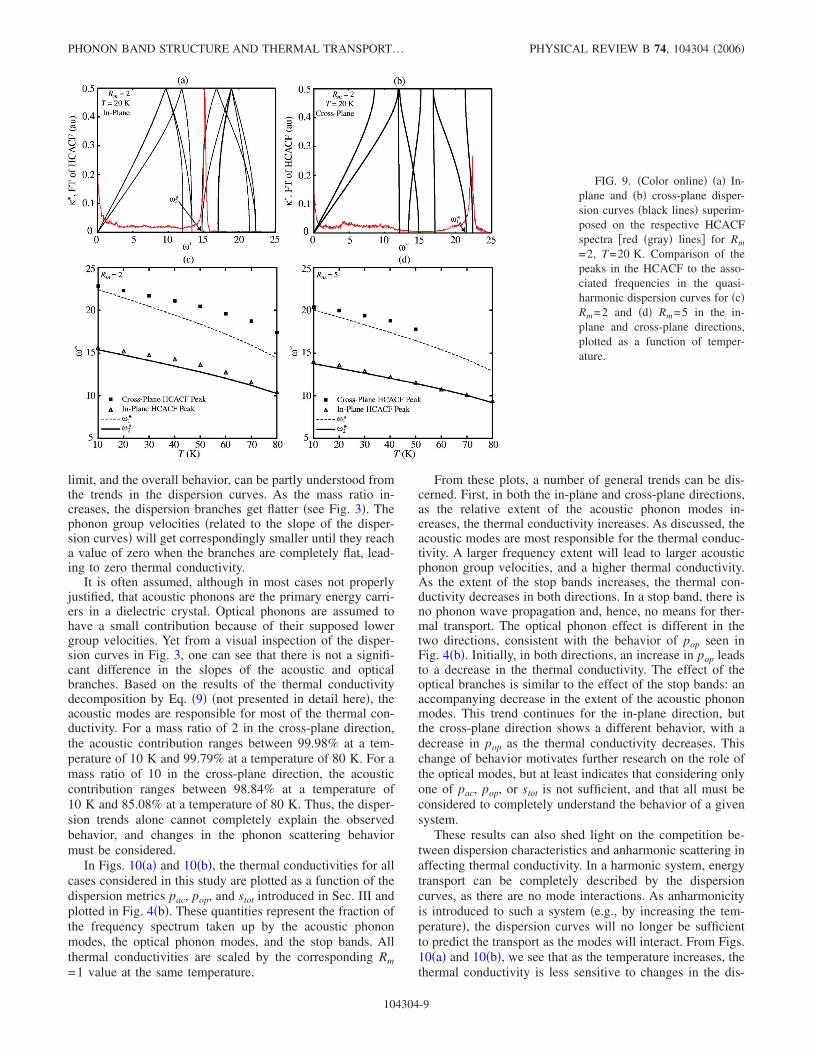
Although peaks in the spectrum of the HCACF have beenobserved,8,25,31 no comprehensive explanation has beengiven for their origin. It has been hypothesized that theycorresponded to optical phonons31,33 due to their frequencieslying in that region of the phonon spectrum. Such a result isshown in Fig. 9�a�, where the quasi-harmonic phonon disper-sion curves for the in-plane direction are shown on top of theHCACF spectra for the in-plane and cross-plane directionsfor Rm=2 and a temperature of 20 K. In Fig. 9�b�, the loca-tion of the peak �as found in the decomposition of theHCACF with Eq. �8�� is plotted as discrete data points as afunction of temperature for the in-plane and cross-plane di-
rections in the Rm=2 system. The corresponding data forRm=5 are plotted in Fig. 9�c�.
By overlaying the dispersion curves and the HCACFspectra for both directions for a range of temperatures andmass ratios, we find that the peak in the in-plane spectrum iscoincident with one of the dispersion branches at zero wavevector �i.e., the � point—the center of the Brillouin zone�.The associated quasi-harmonic frequency is denoted by �2
* inFig. 9�a� and plotted as a continuous line in Figs. 9�b� and9�c�. A similar coincidence exists for the cross-plane peak,which is consistently near the �-point frequency �1
*, alsoshown in Fig. 9�a�. These frequencies are also plotted inFigs. 9�b� and 9�c�. The link between HCACF peaks and�-point frequencies has also been found in LJ superlatticestructures with longer period lengths.34
The agreement between the HCACF peaks and the disper-sion frequencies is very good, especially for the in-planepeak. The data for Rm=10 show a similar agreement as forRm=5. The specification of the peak from the HCACF de-composition becomes difficult at high temperatures, particu-larly in the cross-plane direction �this can be seen in Fig.6�b��. Quasi-harmonic theory will lead to an underpredictionof the dispersion curve frequencies, which is the case forboth peaks.
From these results, it is clear that specific optical phononmodes generate the peaks in HCACF. Because these modesdo not make a significant contribution to the thermal conduc-tivity, as will be discussed in Sec. V B, we interpret the ap-pearance of peaks in the HCACF as an indication that theyare partly responsible for the increased phonon scattering�and lower thermal conductivity� in the diatomic system.
B. Dispersion and thermal conductivity
As seen in Figs. 7�a� and 7�b�, the thermal conductivitiesin the in-plane and cross-plane directions are lower than themonatomic value. The deviation from the monatomic valueincreases as the mass ratio increases. In the limit of an infi-nite mass ratio, the thermal conductivity will go to zero. This
FIG. 8. Thermal conductivityat temperatures of 10, 40, and70 K in the �a� in-plane and �b�cross-plane directions plotted as afunction of the average atomicmass in the system. Also plotted isthe thermal conductivity of theequivalent monatomic systemswhere each atom has a mass m*
�solid line�. The dashed lines cor-respond to k �m*�−1/2 and are fitto the data by visual inspection.
MCGAUGHEY et al. PHYSICAL REVIEW B 74, 104304 �2006�
104304-8
limit, and the overall behavior, can be partly understood fromthe trends in the dispersion curves. As the mass ratio in-creases, the dispersion branches get flatter �see Fig. 3�. Thephonon group velocities �related to the slope of the disper-sion curves� will get correspondingly smaller until they reacha value of zero when the branches are completely flat, lead-ing to zero thermal conductivity.
It is often assumed, although in most cases not properlyjustified, that acoustic phonons are the primary energy carri-ers in a dielectric crystal. Optical phonons are assumed tohave a small contribution because of their supposed lowergroup velocities. Yet from a visual inspection of the disper-sion curves in Fig. 3, one can see that there is not a signifi-cant difference in the slopes of the acoustic and opticalbranches. Based on the results of the thermal conductivitydecomposition by Eq. �9� �not presented in detail here�, theacoustic modes are responsible for most of the thermal con-ductivity. For a mass ratio of 2 in the cross-plane direction,the acoustic contribution ranges between 99.98% at a tem-perature of 10 K and 99.79% at a temperature of 80 K. For amass ratio of 10 in the cross-plane direction, the acousticcontribution ranges between 98.84% at a temperature of10 K and 85.08% at a temperature of 80 K. Thus, the disper-sion trends alone cannot completely explain the observedbehavior, and changes in the phonon scattering behaviormust be considered.
In Figs. 10�a� and 10�b�, the thermal conductivities for allcases considered in this study are plotted as a function of thedispersion metrics pac, pop, and stot introduced in Sec. III andplotted in Fig. 4�b�. These quantities represent the fraction ofthe frequency spectrum taken up by the acoustic phononmodes, the optical phonon modes, and the stop bands. Allthermal conductivities are scaled by the corresponding Rm=1 value at the same temperature.
From these plots, a number of general trends can be dis-cerned. First, in both the in-plane and cross-plane directions,as the relative extent of the acoustic phonon modes in-creases, the thermal conductivity increases. As discussed, theacoustic modes are most responsible for the thermal conduc-tivity. A larger frequency extent will lead to larger acousticphonon group velocities, and a higher thermal conductivity.As the extent of the stop bands increases, the thermal con-ductivity decreases in both directions. In a stop band, there isno phonon wave propagation and, hence, no means for ther-mal transport. The optical phonon effect is different in thetwo directions, consistent with the behavior of pop seen inFig. 4�b�. Initially, in both directions, an increase in pop leadsto a decrease in the thermal conductivity. The effect of theoptical branches is similar to the effect of the stop bands: anaccompanying decrease in the extent of the acoustic phononmodes. This trend continues for the in-plane direction, butthe cross-plane direction shows a different behavior, with adecrease in pop as the thermal conductivity decreases. Thischange of behavior motivates further research on the role ofthe optical modes, but at least indicates that considering onlyone of pac, pop, or stot is not sufficient, and that all must beconsidered to completely understand the behavior of a givensystem.
These results can also shed light on the competition be-tween dispersion characteristics and anharmonic scattering inaffecting thermal conductivity. In a harmonic system, energytransport can be completely described by the dispersioncurves, as there are no mode interactions. As anharmonicityis introduced to such a system �e.g., by increasing the tem-perature�, the dispersion curves will no longer be sufficientto predict the transport as the modes will interact. From Figs.10�a� and 10�b�, we see that as the temperature increases, thethermal conductivity is less sensitive to changes in the dis-
FIG. 9. �Color online� �a� In-plane and �b� cross-plane disper-sion curves �black lines� superim-posed on the respective HCACFspectra �red �gray� lines� for Rm
=2, T=20 K. Comparison of thepeaks in the HCACF to the asso-ciated frequencies in the quasi-harmonic dispersion curves for �c�Rm=2 and �d� Rm=5 in the in-plane and cross-plane directions,plotted as a function of temper-ature.
PHONON BAND STRUCTURE AND THERMAL TRANSPORT… PHYSICAL REVIEW B 74, 104304 �2006�
104304-9
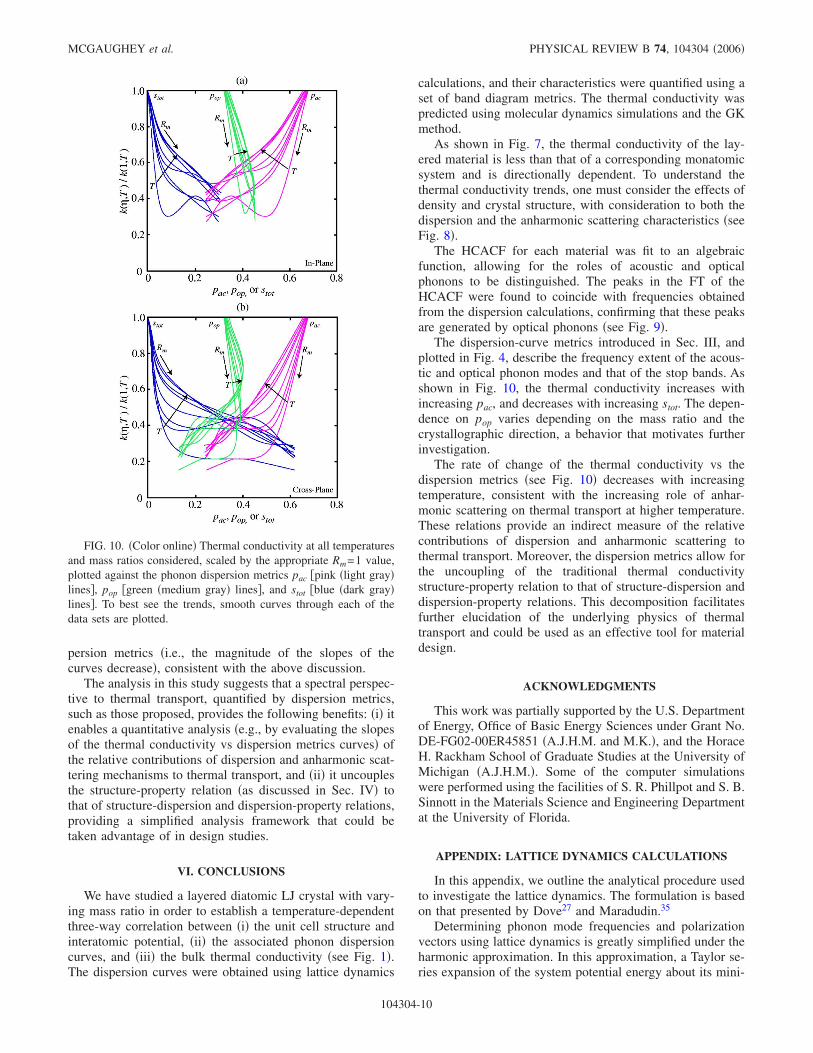
persion metrics �i.e., the magnitude of the slopes of thecurves decrease�, consistent with the above discussion.
The analysis in this study suggests that a spectral perspec-tive to thermal transport, quantified by dispersion metrics,such as those proposed, provides the following benefits: �i� itenables a quantitative analysis �e.g., by evaluating the slopesof the thermal conductivity vs dispersion metrics curves� ofthe relative contributions of dispersion and anharmonic scat-tering mechanisms to thermal transport, and �ii� it uncouplesthe structure-property relation �as discussed in Sec. IV� tothat of structure-dispersion and dispersion-property relations,providing a simplified analysis framework that could betaken advantage of in design studies.
VI. CONCLUSIONS
We have studied a layered diatomic LJ crystal with vary-ing mass ratio in order to establish a temperature-dependentthree-way correlation between �i� the unit cell structure andinteratomic potential, �ii� the associated phonon dispersioncurves, and �iii� the bulk thermal conductivity �see Fig. 1�.The dispersion curves were obtained using lattice dynamics
calculations, and their characteristics were quantified using aset of band diagram metrics. The thermal conductivity waspredicted using molecular dynamics simulations and the GKmethod.
As shown in Fig. 7, the thermal conductivity of the lay-ered material is less than that of a corresponding monatomicsystem and is directionally dependent. To understand thethermal conductivity trends, one must consider the effects ofdensity and crystal structure, with consideration to both thedispersion and the anharmonic scattering characteristics �seeFig. 8�.
The HCACF for each material was fit to an algebraicfunction, allowing for the roles of acoustic and opticalphonons to be distinguished. The peaks in the FT of theHCACF were found to coincide with frequencies obtainedfrom the dispersion calculations, confirming that these peaksare generated by optical phonons �see Fig. 9�.
The dispersion-curve metrics introduced in Sec. III, andplotted in Fig. 4, describe the frequency extent of the acous-tic and optical phonon modes and that of the stop bands. Asshown in Fig. 10, the thermal conductivity increases withincreasing pac, and decreases with increasing stot. The depen-dence on pop varies depending on the mass ratio and thecrystallographic direction, a behavior that motivates furtherinvestigation.
The rate of change of the thermal conductivity vs thedispersion metrics �see Fig. 10� decreases with increasingtemperature, consistent with the increasing role of anhar-monic scattering on thermal transport at higher temperature.These relations provide an indirect measure of the relativecontributions of dispersion and anharmonic scattering tothermal transport. Moreover, the dispersion metrics allow forthe uncoupling of the traditional thermal conductivitystructure-property relation to that of structure-dispersion anddispersion-property relations. This decomposition facilitatesfurther elucidation of the underlying physics of thermaltransport and could be used as an effective tool for materialdesign.
ACKNOWLEDGMENTS
This work was partially supported by the U.S. Departmentof Energy, Office of Basic Energy Sciences under Grant No.DE-FG02-00ER45851 �A.J.H.M. and M.K.�, and the HoraceH. Rackham School of Graduate Studies at the University ofMichigan �A.J.H.M.�. Some of the computer simulationswere performed using the facilities of S. R. Phillpot and S. B.Sinnott in the Materials Science and Engineering Departmentat the University of Florida.
APPENDIX: LATTICE DYNAMICS CALCULATIONS
In this appendix, we outline the analytical procedure usedto investigate the lattice dynamics. The formulation is basedon that presented by Dove27 and Maradudin.35
Determining phonon mode frequencies and polarizationvectors using lattice dynamics is greatly simplified under theharmonic approximation. In this approximation, a Taylor se-ries expansion of the system potential energy about its mini-
FIG. 10. �Color online� Thermal conductivity at all temperaturesand mass ratios considered, scaled by the appropriate Rm=1 value,plotted against the phonon dispersion metrics pac �pink �light gray�lines�, pop �green �medium gray� lines�, and stot �blue �dark gray�lines�. To best see the trends, smooth curves through each of thedata sets are plotted.
MCGAUGHEY et al. PHYSICAL REVIEW B 74, 104304 �2006�
104304-10
mum value is truncated after the second-order term. Thisapproach leads to harmonic equations of motion that can besolved analytically for simple systems,28 but are most easilysolved numerically.
Given an interatomic potential and the equilibrium posi-tions of the atoms in a crystal with an n-atom unit cell, theanalysis proceeds as follows.
The equation of motion of the jth atom �j=1,2 , . . . ,n� inthe kth unit cell is
mju�jk,t� = j�k�
��jk; j�k�� · u�jk,t� , �A1�
where mj is the mass of atom j, � is the 3�3 force constantmatrix describing the interaction between atoms jk and j�k�,u�jk , t� is the displacement of atom jk from its equilibriumposition, and the summation is over every atom in the system�including jk itself�. The elements of � are given by
����jk; j�k�� = �− ����jk; j�k�� jk � j�k�
j�k�
����jk; j�k�� jk = j�k�, � �A2�
where � and � can be the Cartesian coordinates x, y, and z.The summation in Eq. �A2� is over pairings between atom jkand every atom in the system other than itself. For a two-body potential, ��r�, ��� is
����jk; j�k��
= ����r jk − r j�k��
=��2��r��r��r�
�r=�rjk−rj�k��
=�� r�r�
r2 ����r� −1
r���r�� +
���
r���r���
r=�rjk−rj�k��,
�A3�
where � indicates a derivative with respect to r, ��� is the �function, r is a position vector, and r� is the � componentof r.
The solution to Eq. �A1� is assumed to be harmonic and isa summation over the normal �phonon� modes of the system,which are traveling waves. Each normal mode has a differentwave vector � and dispersion branch � such that
u�jk,t� = �,�
mj−1/2e j��,�� exp�i�� · r�jk� − ���,��t�� ,
�A4�
where � is the mode frequency and t is time. The allowedwave vectors are set by the crystal structure. Substituting Eq.�A4� into Eq. �A1� leads to the eigenvalue equation
�2��,��e��,�� = D��� · e��,�� , �A5�
where D��� is the 3n�3n dynamical matrix and e�� ,�� isthe polarization vector of length 3n. In Eq. �A4�, e j�� ,��contains the three elements of e�� ,�� that correspond to thejth atom of the unit cell �elements 3j−2, 3j−1, and 3j�. Theelements of D��� are given by
D3�j−1�+�,3�j�−1�+��j j�,��
=1
�mjmj��1/2
k�
����j0; j�k��exp�i� · �r�j�k�� − r�j0��� .
�A6�
Here, the summation is over all unit cells and � or � equals1 for x, 2 for y, and 3 for z. For example, in a unit cell of fouratoms denoted by A, B, C, and D �like that shown in Fig. 2�,the summation in Eq �A6� for �j=1, j�=2� would be overpairings between atom A in the zeroth unit cell and atom B inall unit cells, including 0.
The dynamical matrix is Hermitian and therefore has realeigenvalues and orthogonal eigenvectors. The square roots ofthe eigenvalues of D��� are the phonon mode frequencies��� ,��, and the eigenvectors of D��� give the phonon po-larization vectors e�� ,��. The polarization vectors �alsoknown as the mode shapes� are normalized such that
�e��,���T · �e��,���* = 1. �A7�
In general, the elements of e�� ,�� are complex and describethe relative amplitude and phase difference of the displace-ments of the atoms in the unit cell.
Dispersion curves can be generated by calculating thephonon mode frequencies for a range of wave vectors in aparticular direction. For example, the dispersion curve pre-sented in Fig. 3�b� was generated using 100 evenly spacedwave vectors in the in-plane direction with wave numbersranging from 0 to � /a where a is the lattice constant. Thedispersion curve has three acoustic branches and 3n−3 opti-cal branches. The dispersion shown in Fig. 3�c� has onlyeight branches because the transverse branches in this direc-tion are degenerate.
The procedure outlined here gives results that are exact atzero temperature. For higher temperatures, the zero-pressurelattice positions should be used �i.e., the quasi-harmonicapproximation�.27 The anharmonic contributions to the latticedynamics analysis can be included using molecular dynamicssimulations.5
PHONON BAND STRUCTURE AND THERMAL TRANSPORT… PHYSICAL REVIEW B 74, 104304 �2006�
104304-11
*Present affiliation: Department of Mechanical Engineering, Carn-egie Mellon University, Pittsburgh, PA 15213, USA. Electronicaddress: [email protected]
†Present affiliation: Department of Engineering, University of Cam-bridge, Trumpington Street CB2 1PZ, UK.
1 In this study, where the phonon transport is diffusive, we will usethe term scattering to indicate multiphonon interactions broughtabout by the anharmonic effects present at finite temperatures.
2 J. Callaway, Phys. Rev. 113, 1046 �1959�.3 M. G. Holland, Phys. Rev. 132, 2461 �1963�.4 J. D. Chung, A. J. H. McGaughey, and M. Kaviany, J. Heat
Transfer 126, 376 �2004�.5 A. J. H. McGaughey and M. Kaviany, Phys. Rev. B 69, 094303
�2004�.6 S. Mazumder and A. Majumdar, J. Heat Transfer 123, 749
�2001�.7 N. Mingo, Phys. Rev. B 68, 113308 �2003�.8 J. Dong, O. F. Sankey, and C. W. Myles, Phys. Rev. Lett. 86,
2361 �2001�.9 G. S. Nolas, J. L. Cohn, G. A. Slack, and S. B. Schujman, Appl.
Phys. Lett. 73, 178 �1998�.10 J. L. Cohn, G. S. Nolas, V. Fessatidis, T. H. Metcalf, and G. A.
Slack, Phys. Rev. Lett. 82, 779 �1999�.11 D. A. Broido and T. L. Reinecke, Phys. Rev. B 70, 081310�R�
�2004�.12 M. V. Simkin and G. D. Mahan, Phys. Rev. Lett. 84, 927 �2000�.13 Y. Chen, D. Li, J. R. Lukes, Z. Ni, and M. Chen, Phys. Rev. B 72,
174302 �2005�.14 Y. Chen, D. Li, J. Yang, Y. Wu, J. R. Lukes, and A. Majumdar,
Physica B 349, 270 �2004�.15 R. Venkatasubramanian, Phys. Rev. B 61, 3091 �2000�.16 S. Chakraborty, C. A. Kleint, A. Heinrich, C. M. Schneider, J.
Schumann, M. Falke, and S. Teichert, Appl. Phys. Lett. 83,4184 �2003�.
17 J. C. Caylor, K. Coonley, J. Stuart, T. Colpitts, and R. Venkata-subramanian, Appl. Phys. Lett. 87, 023105 �2005�.
18 J. Lukes, D. Y. Li, X.-G. Liang, and C.-L. Tien, J. Heat Transfer122, 536 �2000�.
19 A. R. Abramson, C.-L. Tien, and A. Majumdar, J. Heat Transfer124, 963 �2002�.
20 P. Chantrenne and J.-L. Barrat, J. Heat Transfer 126, 577 �2004�.21 J. Lukes and C.-L. Tien, Microscale Thermophys. Eng. 8, 341
�2004�.22 A. J. H. McGaughey and M. Kaviany, Int. J. Heat Mass Transfer
47, 1783 �2004�.23 A. J. H. McGaughey and M. Kaviany, Phys. Rev. B 71, 184305
�2005�.24 N. W. Ashcroft and N. D. Mermin, Solid State Physics �Saunders
College Publishing, Fort Worth, 1976�.25 J. Che, T. Cagin, W. Deng, and W. A. Goddard III, J. Chem. Phys.
113, 6888 �2000�.26 A. J. H. McGaughey, Ph.D. thesis, University of Michigan, Ann
Arbor, MI, 2004.27 M. T. Dove, Introduction to Lattice Dynamics �Cambridge, Lon-
don, England, 1993�.28 C. Kittel, Introduction to Solid State Physics, 7th ed. �Wiley, New
York, 1996�.29 M. I. Hussein, K. Hamza, G. M. Hulbert, R. A. Scott, and K.
Saitou, Struct. Multidiscip. Optim. 31, 60 �2006�.30 D. A. McQuarrie, Statistical Mechanics �University Science
Books, Sausalito, 2000�.31 A. J. H. McGaughey and M. Kaviany, Int. J. Heat Mass Transfer
47, 1799 �2004�.32 This unsuitability of the fitting procedure in these eight cases �out
of 64 total� was not found in an investigation of silicastructures.31 In that case, all the peaks remained well-definedover the temperature range considered and did not interfere withthe low-frequency behavior. There are two likely explanationsfor the findings here. First, the mass ratio in silica structures,mSi /mO�28/16=1.75, is much smaller than the mass ratioswhere we encounter difficulties. Second, the LJ simulations arebeing run at temperatures close to their melting temperatures�87 K for the monatomic system�, whereas the silica simulationswere run between temperatures of 100 and 350 K, well belowthe melting temperatures, which are �1000 K.
33 P. J. D. Lindan and M. J. Gillan, J. Phys.: Condens. Matter 3,3929 �1991�.
34 E. S. Landry, A. J. H. McGaughey, and M. I. Hussein, Proceed-ings of the ASME International Mechanical Engineering Con-ference and Exposition, Chicago �ASME, New York, 2006�,ASME Paper No. IMECE2006-13673.
35 A. A. Maradudin, in Dynamical Properties of Solids, edited by G.K. Horton and A. A. Maradudin �Elsevier, New York, 1974�,Vol. 1, pp. 1–82.
MCGAUGHEY et al. PHYSICAL REVIEW B 74, 104304 �2006�
104304-12


![Review Article Prediction of Spectral Phonon Mean Free Path ...obtained the phonon relaxation times by Umklapp ( ) three-phonon scattering [ , ] and defect scattering [ ], Herring](https://img.pdfslide.net/doc/110x75/610ec2441e225c0bdc196ade/review-article-prediction-of-spectral-phonon-mean-free-path-obtained-the-phonon.jpg)