Embed Size (px)
Citation preview
PHYSICAL REVIEW B 85, 195301 (2012)
Phonon-mediated coupling between quantum dots through an off-resonant microcavity
Arka Majumdar,* Michal Bajcsy, Armand Rundquist, Erik Kim, and Jelena VuckovicE. L. Ginzton Laboratory, Stanford University, Stanford, California 94305, USA
(Received 21 November 2011; revised manuscript received 19 April 2012; published 1 May 2012)
We present experimental results showing phonon-mediated coupling between two quantum dots embeddedinside a photonic-crystal microcavity. With only one of the dots being spectrally close to the cavity, we observeboth frequency up-conversion and down-conversion of the pump light via a ∼1.2-THz phonon. We demonstratethis process for both weak and strong regimes of dot-cavity coupling and provide a simple theoretical model toqualitatively explain our observations.
DOI: 10.1103/PhysRevB.85.195301 PACS number(s): 42.50.Pq, 63.20.kk
I. INTRODUCTION
Phonon-mediated coupling between a self-assembled semi-conductor quantum dot (QD) and a semiconductor microcav-ity is a recently discovered phenomenon unique to solid-state cavity quantum electrodynamics. This phenomenonhas been observed both in photoluminescence studies underabove-band pumping1–5 and under resonant excitation of theQD.6,7 The coupling observed via photoluminescence is at-tributed to several phenomena, including the electron-phononinteractions,8–13 multiexciton complexes,14 and charges inthe vicinity of the QD.15 To isolate the role of phonons inoff-resonant QD-cavity coupling, studies employing resonantexcitation of the QD are preferable as they avoid possiblecomplications arising from multiexcitonic complexes andnearby charges generated via above-band pumping. Apart fromthe fundamental interest in identifying the mechanism behindthis off-resonant coupling,8–11,14,16 this effect can be used toprobe the coherent interaction of the QD with a strong laser17
as well as the cavity-enhanced AC stark shift of a QD.18 Theseresults demonstrate that the off-resonant cavity constitutes anefficient readout channel for the QD states.
However, all phonon-assisted off-resonant interaction ex-periments reported so far in the literature are based on a singleQD and a cavity. Recently, an experimental study of twospatially separated QDs interacting resonantly in a microcavityhas been reported19 as well as a theoretical analysis20–24 of thepossible energy-transfer mechanisms between QDs in such acavity. The interaction between two spectrally detuned QDs viaa photonic-crystal cavity has also been demonstrated recentlyunder p-shell QD excitation.25 However, the actual couplingmechanism between two QDs is not conclusively proven inthat experiment as the presence of a higher-energy pumpinglaser can create charges and multiexcitons, making the systemmore complex. In our work, we show that under resonantexcitation (of one of the dots), two spectrally far-detuned QDscan interact with each other via an off-resonant cavity. Morespecifically, we observe emission from a spectrally detunedQD when another QD is resonantly excited. Both frequencydown-conversion (energy transfer from a higher-energy QD toa lower-energy QD) and up-conversion (energy transfer froma lower-energy QD to a higher-energy QD) are observed fora frequency separation of up to ∼±1.2 THz. Such a largeenergy difference cannot be ascribed to an excited state ofthe same QD as opposed to conclusions reached in an earlierwork by Flagg et al.,26 which was performed without a cavity
and for a frequency difference of ∼±0.2 THz. Based onour observations, we believe this process occurs between twodifferent QDs, and the coupling between the QDs is enhancedby the presence of the cavity.
II. THEORY
The experimental system we want to model is shown inFig. 1(a). QD1, spectrally detuned from both the cavity andQD2, is resonantly excited with a pump laser. The excitationis transferred to the cavity and QD2 via an incoherentphonon-mediated coupling.27 We note that, in theory, it ispossible to transfer energy directly from QD1 to QD2 viaphonons. However, we observe the QD2 emission to bestrongly dependent on the QD2-cavity detuning, and hence,the presence of a cavity is important for our experiment. Inparticular, for detunings greater than a few cavity linewidths,the QD2 emission becomes weak and eventually vanishes.
The master equation used to describe the lossy dynamicsof the density matrix ρ of a coupled system consisting of twoQDs and a cavity is given by
dρ
dt= −i[H,ρ] + 2κL[a] + 2γ1L[σ1] + 2γ2L[σ2]. (1)
Assuming the rotating-wave approximation, the Hamiltoniandescribing the coherent dynamics of the system H can bewritten in the interaction picture as
H = ωca†a + ωd1σ
†1 σ1 + g1(a†σ1 + aσ
†1 )
+ωd2σ†2 σ2 + g2(a†σ2 + aσ
†2 ), (2)
while the Lindblad operator modeling the incoherent decay viaa collapse operator D isL[D] = DρD† − 1
2D†Dρ − 12ρD†D.
Additionally, κ is the cavity-field-decay rate; γ1 and γ2 are theQD-dipole-decay rates; ωc, ωd1, and ωd2 are the resonancefrequencies of the cavity, QD1, and QD2, respectively; andg1 and g2 are the coherent-interaction strengths between thecavity and the two QDs, respectively. The resonant drivingof QD1 or QD2 can be described, respectively, by addingthe term �(σ1 + σ
†1 ) or �(σ2 + σ
†2 ) to the Hamiltonian H.
The driving-laser frequency is denoted by ωl . We model theincoherent phonon-mediated coupling by adding 2γr1L[a†σ1]and 2γr2L[aσ
†2 ] to the master equation.27 We note that
the phonon-QD-interaction strength depends on the phononfrequency and is, in general, not a constant.9,10 However, aswe are focusing only on a small range of detunings in our
195301-11098-0121/2012/85(19)/195301(6) ©2012 American Physical Society
ARKA MAJUMDAR et al. PHYSICAL REVIEW B 85, 195301 (2012)
cavity QD2
pump
Incoherenttransfer
PBS
SpectrometerQD in Cavity
Pump
Cavity OutputOL
i
QD1
-4 0 4 80
1
2
3
4
5
6
7
10 11 13 14
0
0.2
0.4
lS gr2/2
S
g/2
g/2
(a)
(b)
(c)
r2
r2
2
2
2
GHZ
GHZ
GHZ
QD1
cavityQD2
12
12
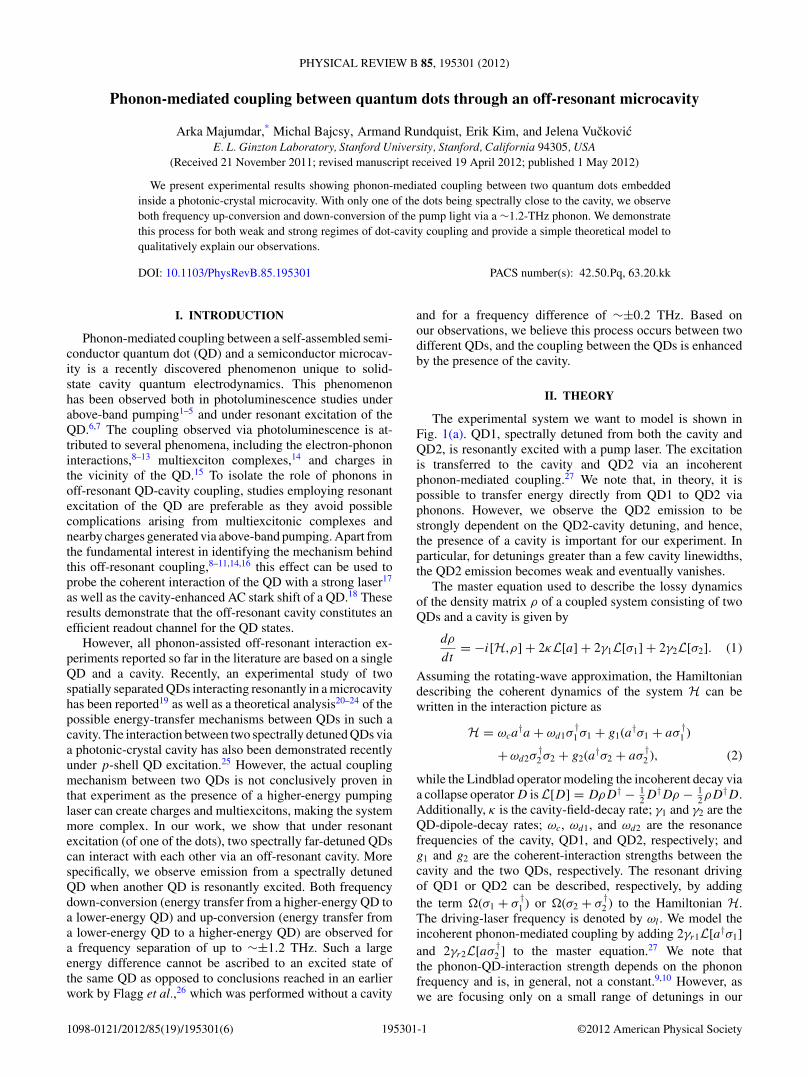
FIG. 1. (Color online) (a) Illustration of the phonon-assistedinterdot coupling. QD1 is resonantly driven with a pump laser. Theexcitation is transferred to QD2 via the cavity. (b) Experimentalcrosspolarized confocal-microscopy setup with a polarizing-beamsplitter (PBS) and an objective lens (OL). (c) Numerically calculatedpower spectral density S(ω) of the cavity output for differentQD2-phonon-coupling strengths γr2 and QD2-cavity mode couplingg2. QD1 is resonantly excited (i.e., ωl = ωd1), and QD1-cavitycoupling is g1/2π = 20 GHz while the QD1-phonon-coupling rate isγr1/2π = 0.5 GHz. The cavity-field-decay rate is κ/2π = 20 GHz.The inset shows a zoom-in of the emission at the QD2 frequency.
experiments, a constant rate of QD-phonon interaction canbe assumed. The channel between QD1 and the cavity isthen characterized by the rates γr1 and g1 while the channelbetween the cavity and QD2 is characterized by γr2 and g2.Figure 1(c) shows the numerically simulated powerspectral density (PSD) of the cavity output S(ω) =∫ ∞−∞〈a†(τ )a(0)〉e−iωτ dτ when the lower-energy QD1 is res-
onantly driven with a laser. We use only the cavity operatorto calculate the PSD because experimentally most of thecollected light (even off-resonant) is coupled to the cavitymode. For these simulations, we use γ1/2π = γ2/2π = 1GHz, γr1/2π = 0.5 GHz, g1/2π = 20 GHz, κ/2π = 20 GHz,QD1-cavity detuning 1 = 6κ , QD2-cavity detuning 2 =−6κ , and the driving-laser strength �0/2π = 5 GHz.
We first study the role of γr2 and g2 in the QD2 emission.Without g2, no emission from QD2 is observed; in the presenceof g2, QD2 emission appears, and γr2 enhances it [Fig. 1(c)].This shows that coherent coupling between the cavity and QD2is required to observe this dot-to-dot coupling. Although QD2emission is observed even in the absence of its coupling tophonons (for γr2 = 0), such emission is much weaker thanwhen a phonon-assisted process is present. The three peaksobserved at the QD1 resonance are the usual Mollow triplet,modified due to the presence of the cavity and phonons.27–29
We note that to observe the off-resonant emissions from thecavity and QD2, we also need to have a phonon-assistedinteraction between QD1 and the cavity, i.e., a nonzero γr1.
Next, we theoretically analyze the dependence of the inter-dot coupling on the spectral detuning between the undriven dotand the cavity. In an actual experiment, it is very difficult totune only one QD without affecting the other as the two QDsare spatially very close to each other. Hence, in the simulation,we changed both QD resonances and kept the cavity resonancefixed. In Fig. 2(a) we excite the lower-energy QD1, whichis spectrally far detuned from the cavity. QD2 is spectrallyclose to the cavity and strongly coupled to it. The resonantexcitation of QD1 causes light to be emitted both from the
-10 -5 0 5 10(ω − ω )/κc
S(ω
)
(b)(a)
-10 0 10
2
4
QD
2 E
mis
sion
ω ω γl d1-( )/
0.04
0.08
QD
1 E
mis
sion
-10 0 10ω ω γl d2-( )/
cav
QD1
QD2
QD1
cav
QD2
-10 -5 0 5 10(ω − ω )/κc
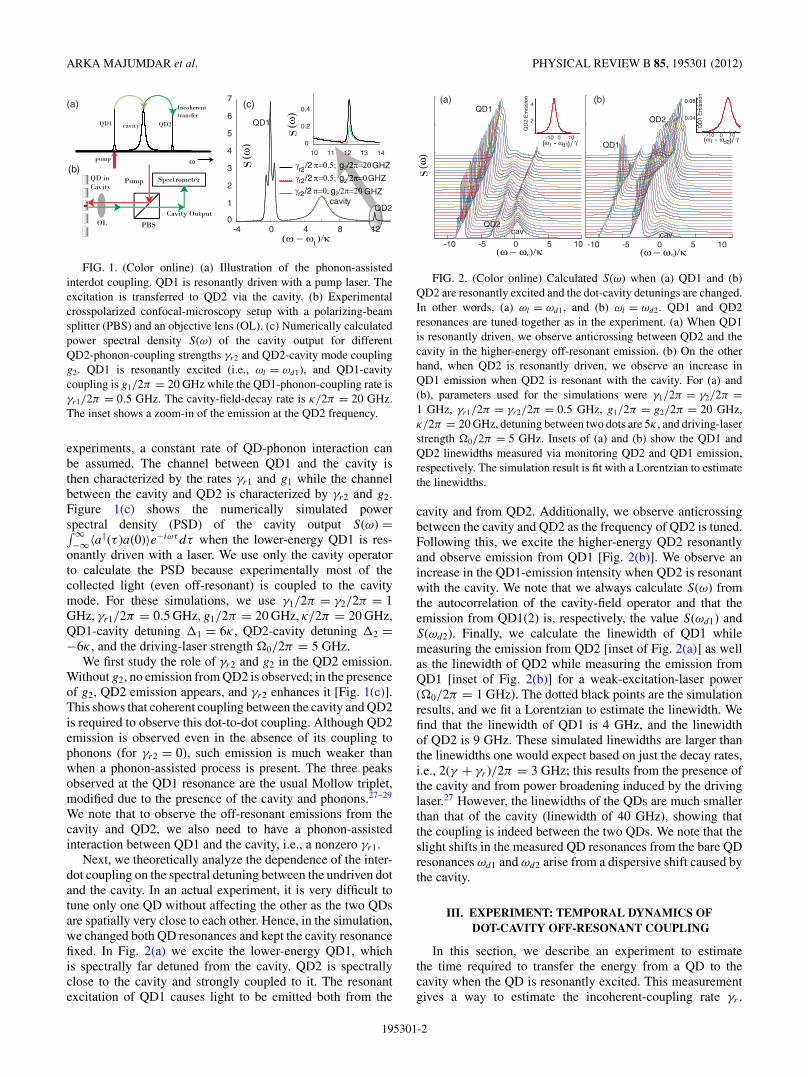
FIG. 2. (Color online) Calculated S(ω) when (a) QD1 and (b)QD2 are resonantly excited and the dot-cavity detunings are changed.In other words, (a) ωl = ωd1, and (b) ωl = ωd2. QD1 and QD2resonances are tuned together as in the experiment. (a) When QD1is resonantly driven, we observe anticrossing between QD2 and thecavity in the higher-energy off-resonant emission. (b) On the otherhand, when QD2 is resonantly driven, we observe an increase inQD1 emission when QD2 is resonant with the cavity. For (a) and(b), parameters used for the simulations were γ1/2π = γ2/2π =1 GHz, γr1/2π = γr2/2π = 0.5 GHz, g1/2π = g2/2π = 20 GHz,κ/2π = 20 GHz, detuning between two dots are 5κ , and driving-laserstrength �0/2π = 5 GHz. Insets of (a) and (b) show the QD1 andQD2 linewidths measured via monitoring QD2 and QD1 emission,respectively. The simulation result is fit with a Lorentzian to estimatethe linewidths.
cavity and from QD2. Additionally, we observe anticrossingbetween the cavity and QD2 as the frequency of QD2 is tuned.Following this, we excite the higher-energy QD2 resonantlyand observe emission from QD1 [Fig. 2(b)]. We observe anincrease in the QD1-emission intensity when QD2 is resonantwith the cavity. We note that we always calculate S(ω) fromthe autocorrelation of the cavity-field operator and that theemission from QD1(2) is, respectively, the value S(ωd1) andS(ωd2). Finally, we calculate the linewidth of QD1 whilemeasuring the emission from QD2 [inset of Fig. 2(a)] as wellas the linewidth of QD2 while measuring the emission fromQD1 [inset of Fig. 2(b)] for a weak-excitation-laser power(�0/2π = 1 GHz). The dotted black points are the simulationresults, and we fit a Lorentzian to estimate the linewidth. Wefind that the linewidth of QD1 is 4 GHz, and the linewidthof QD2 is 9 GHz. These simulated linewidths are larger thanthe linewidths one would expect based on just the decay rates,i.e., 2(γ + γr )/2π = 3 GHz; this results from the presence ofthe cavity and from power broadening induced by the drivinglaser.27 However, the linewidths of the QDs are much smallerthan that of the cavity (linewidth of 40 GHz), showing thatthe coupling is indeed between the two QDs. We note that theslight shifts in the measured QD resonances from the bare QDresonances ωd1 and ωd2 arise from a dispersive shift caused bythe cavity.
III. EXPERIMENT: TEMPORAL DYNAMICS OFDOT-CAVITY OFF-RESONANT COUPLING
In this section, we describe an experiment to estimatethe time required to transfer the energy from a QD to thecavity when the QD is resonantly excited. This measurementgives a way to estimate the incoherent-coupling rate γr .
195301-2
PHONON-MEDIATED COUPLING BETWEEN QUANTUM DOTS . . . PHYSICAL REVIEW B 85, 195301 (2012)
0 1 2 3 4 5 6 7 80
0.4
0.8
1.2
1.6
2
Time (ns)
Nor
mal
ized
Cav
ity O
utpu
t
Temperature Decreasingfrom 50K to 40K
Pulse
Tim
e (p
s)
40 45 50
800
1000
Temperature (K)
Fall Time
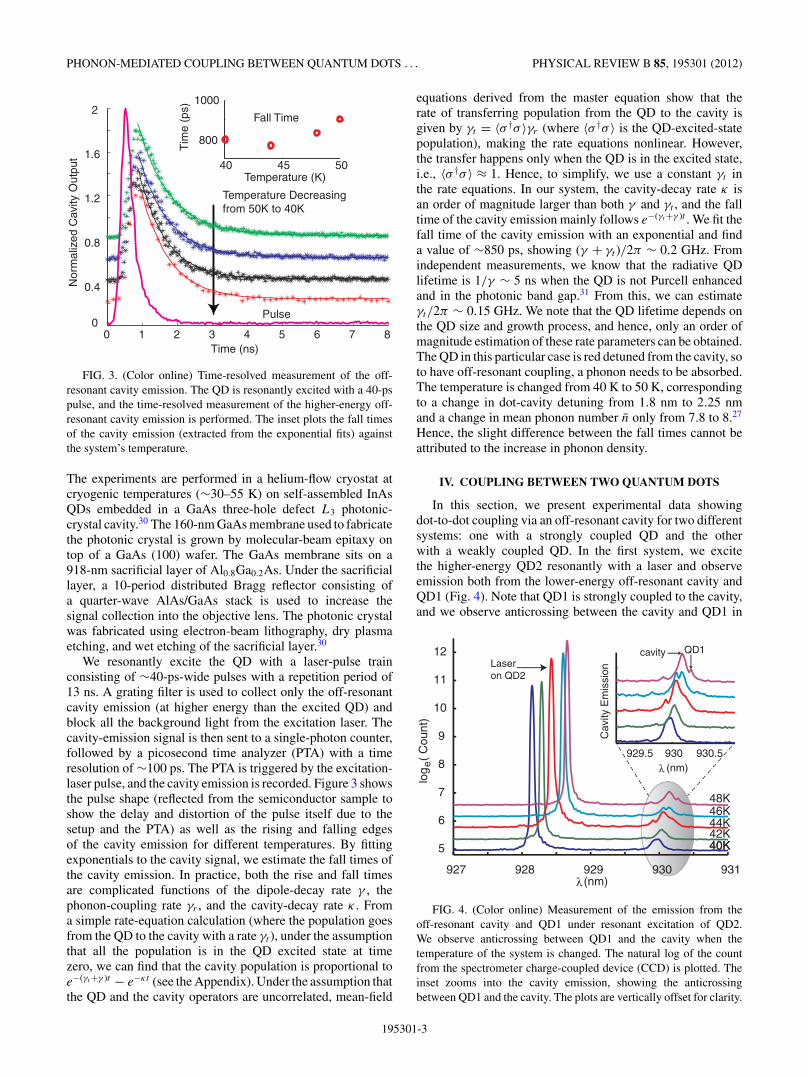
FIG. 3. (Color online) Time-resolved measurement of the off-resonant cavity emission. The QD is resonantly excited with a 40-pspulse, and the time-resolved measurement of the higher-energy off-resonant cavity emission is performed. The inset plots the fall timesof the cavity emission (extracted from the exponential fits) againstthe system’s temperature.
The experiments are performed in a helium-flow cryostat atcryogenic temperatures (∼30–55 K) on self-assembled InAsQDs embedded in a GaAs three-hole defect L3 photonic-crystal cavity.30 The 160-nm GaAs membrane used to fabricatethe photonic crystal is grown by molecular-beam epitaxy ontop of a GaAs (100) wafer. The GaAs membrane sits on a918-nm sacrificial layer of Al0.8Ga0.2As. Under the sacrificiallayer, a 10-period distributed Bragg reflector consisting ofa quarter-wave AlAs/GaAs stack is used to increase thesignal collection into the objective lens. The photonic crystalwas fabricated using electron-beam lithography, dry plasmaetching, and wet etching of the sacrificial layer.30
We resonantly excite the QD with a laser-pulse trainconsisting of ∼40-ps-wide pulses with a repetition period of13 ns. A grating filter is used to collect only the off-resonantcavity emission (at higher energy than the excited QD) andblock all the background light from the excitation laser. Thecavity-emission signal is then sent to a single-photon counter,followed by a picosecond time analyzer (PTA) with a timeresolution of ∼100 ps. The PTA is triggered by the excitation-laser pulse, and the cavity emission is recorded. Figure 3 showsthe pulse shape (reflected from the semiconductor sample toshow the delay and distortion of the pulse itself due to thesetup and the PTA) as well as the rising and falling edgesof the cavity emission for different temperatures. By fittingexponentials to the cavity signal, we estimate the fall times ofthe cavity emission. In practice, both the rise and fall timesare complicated functions of the dipole-decay rate γ , thephonon-coupling rate γr , and the cavity-decay rate κ . Froma simple rate-equation calculation (where the population goesfrom the QD to the cavity with a rate γt ), under the assumptionthat all the population is in the QD excited state at timezero, we can find that the cavity population is proportional toe−(γt+γ )t − e−κt (see the Appendix). Under the assumption thatthe QD and the cavity operators are uncorrelated, mean-field
equations derived from the master equation show that therate of transferring population from the QD to the cavity isgiven by γt = 〈σ †σ 〉γr (where 〈σ †σ 〉 is the QD-excited-statepopulation), making the rate equations nonlinear. However,the transfer happens only when the QD is in the excited state,i.e., 〈σ †σ 〉 ≈ 1. Hence, to simplify, we use a constant γt inthe rate equations. In our system, the cavity-decay rate κ isan order of magnitude larger than both γ and γt , and the falltime of the cavity emission mainly follows e−(γt+γ )t . We fit thefall time of the cavity emission with an exponential and finda value of ∼850 ps, showing (γ + γt )/2π ∼ 0.2 GHz. Fromindependent measurements, we know that the radiative QDlifetime is 1/γ ∼ 5 ns when the QD is not Purcell enhancedand in the photonic band gap.31 From this, we can estimateγt/2π ∼ 0.15 GHz. We note that the QD lifetime depends onthe QD size and growth process, and hence, only an order ofmagnitude estimation of these rate parameters can be obtained.The QD in this particular case is red detuned from the cavity, soto have off-resonant coupling, a phonon needs to be absorbed.The temperature is changed from 40 K to 50 K, correspondingto a change in dot-cavity detuning from 1.8 nm to 2.25 nmand a change in mean phonon number n only from 7.8 to 8.27
Hence, the slight difference between the fall times cannot beattributed to the increase in phonon density.
IV. COUPLING BETWEEN TWO QUANTUM DOTS
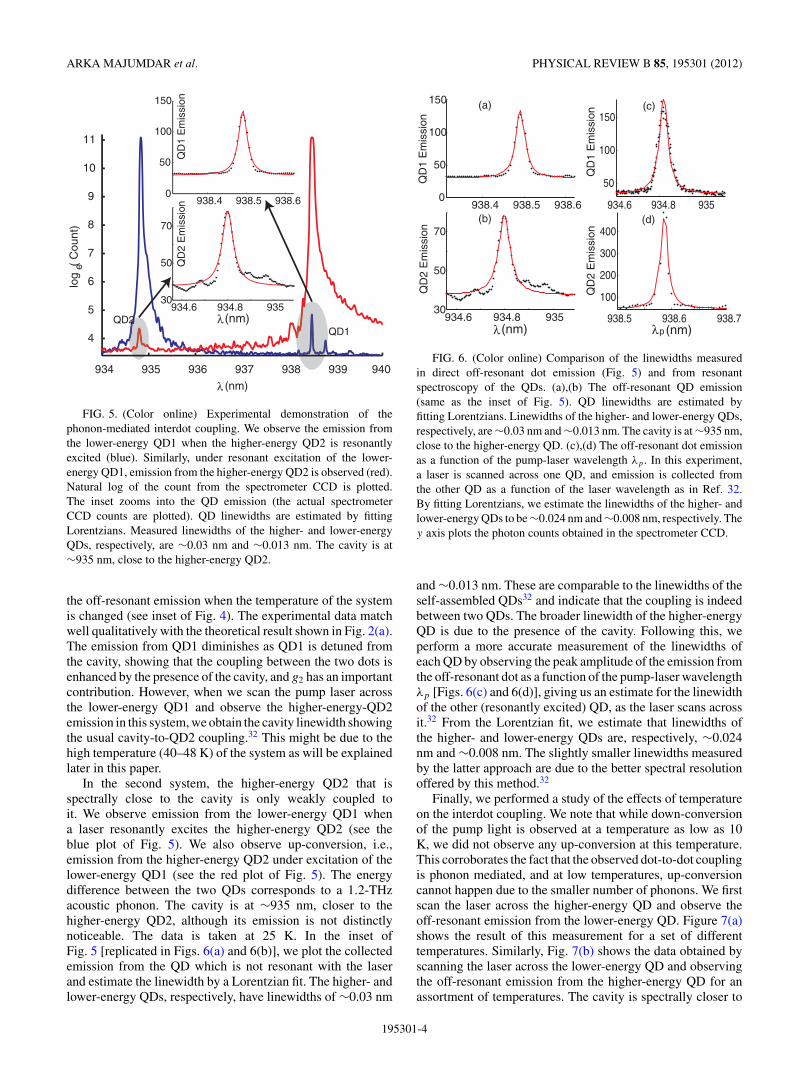
In this section, we present experimental data showingdot-to-dot coupling via an off-resonant cavity for two differentsystems: one with a strongly coupled QD and the otherwith a weakly coupled QD. In the first system, we excitethe higher-energy QD2 resonantly with a laser and observeemission both from the lower-energy off-resonant cavity andQD1 (Fig. 4). Note that QD1 is strongly coupled to the cavity,and we observe anticrossing between the cavity and QD1 in
927 928 929 931
5
6
7
8
9
10
11
12
40K40K42K44K46K48K
929.5 930 930.5
λ(nm)
λ (nm)
log
( C
ount
)
Cav
ity E
mis
sion
e
Laser on QD2
cavity QD1
930
FIG. 4. (Color online) Measurement of the emission from theoff-resonant cavity and QD1 under resonant excitation of QD2.We observe anticrossing between QD1 and the cavity when thetemperature of the system is changed. The natural log of the countfrom the spectrometer charge-coupled device (CCD) is plotted. Theinset zooms into the cavity emission, showing the anticrossingbetween QD1 and the cavity. The plots are vertically offset for clarity.
195301-3
ARKA MAJUMDAR et al. PHYSICAL REVIEW B 85, 195301 (2012)
934 935 936 937 938 939 940
4
5
6
7
8
9
10
11
log
( C
ount
)e
λ (nm)
938.4 938.5 938.60
50
100
150
934.6 934.8 93530
50
70
λ(nm)
QD
1 E
mis
sion
QD
2 E
mis
sion
QD2QD1
FIG. 5. (Color online) Experimental demonstration of thephonon-mediated interdot coupling. We observe the emission fromthe lower-energy QD1 when the higher-energy QD2 is resonantlyexcited (blue). Similarly, under resonant excitation of the lower-energy QD1, emission from the higher-energy QD2 is observed (red).Natural log of the count from the spectrometer CCD is plotted.The inset zooms into the QD emission (the actual spectrometerCCD counts are plotted). QD linewidths are estimated by fittingLorentzians. Measured linewidths of the higher- and lower-energyQDs, respectively, are ∼0.03 nm and ∼0.013 nm. The cavity is at∼935 nm, close to the higher-energy QD2.
the off-resonant emission when the temperature of the systemis changed (see inset of Fig. 4). The experimental data matchwell qualitatively with the theoretical result shown in Fig. 2(a).The emission from QD1 diminishes as QD1 is detuned fromthe cavity, showing that the coupling between the two dots isenhanced by the presence of the cavity, and g2 has an importantcontribution. However, when we scan the pump laser acrossthe lower-energy QD1 and observe the higher-energy-QD2emission in this system, we obtain the cavity linewidth showingthe usual cavity-to-QD2 coupling.32 This might be due to thehigh temperature (40–48 K) of the system as will be explainedlater in this paper.
In the second system, the higher-energy QD2 that isspectrally close to the cavity is only weakly coupled toit. We observe emission from the lower-energy QD1 whena laser resonantly excites the higher-energy QD2 (see theblue plot of Fig. 5). We also observe up-conversion, i.e.,emission from the higher-energy QD2 under excitation of thelower-energy QD1 (see the red plot of Fig. 5). The energydifference between the two QDs corresponds to a 1.2-THzacoustic phonon. The cavity is at ∼935 nm, closer to thehigher-energy QD2, although its emission is not distinctlynoticeable. The data is taken at 25 K. In the inset ofFig. 5 [replicated in Figs. 6(a) and 6(b)], we plot the collectedemission from the QD which is not resonant with the laserand estimate the linewidth by a Lorentzian fit. The higher- andlower-energy QDs, respectively, have linewidths of ∼0.03 nm
938.4 938.5 938.60
50
100
150
934.6 934.8 93530
50
70
λ(nm)
QD
2 E
mis
sion
QD
2 E
mis
sion
934.6 934.8 935
50
100
150
938.5 938.6 938.7
100
200
300
400
λp(nm)
(a)
(b)
(c)
(d)
QD
1 E
mis
sion
QD
1 E
mis
sion
FIG. 6. (Color online) Comparison of the linewidths measuredin direct off-resonant dot emission (Fig. 5) and from resonantspectroscopy of the QDs. (a),(b) The off-resonant QD emission(same as the inset of Fig. 5). QD linewidths are estimated byfitting Lorentzians. Linewidths of the higher- and lower-energy QDs,respectively, are ∼0.03 nm and ∼0.013 nm. The cavity is at ∼935 nm,close to the higher-energy QD. (c),(d) The off-resonant dot emissionas a function of the pump-laser wavelength λp . In this experiment,a laser is scanned across one QD, and emission is collected fromthe other QD as a function of the laser wavelength as in Ref. 32.By fitting Lorentzians, we estimate the linewidths of the higher- andlower-energy QDs to be ∼0.024 nm and ∼0.008 nm, respectively. They axis plots the photon counts obtained in the spectrometer CCD.
and ∼0.013 nm. These are comparable to the linewidths of theself-assembled QDs32 and indicate that the coupling is indeedbetween two QDs. The broader linewidth of the higher-energyQD is due to the presence of the cavity. Following this, weperform a more accurate measurement of the linewidths ofeach QD by observing the peak amplitude of the emission fromthe off-resonant dot as a function of the pump-laser wavelengthλp [Figs. 6(c) and 6(d)], giving us an estimate for the linewidthof the other (resonantly excited) QD, as the laser scans acrossit.32 From the Lorentzian fit, we estimate that linewidths ofthe higher- and lower-energy QDs are, respectively, ∼0.024nm and ∼0.008 nm. The slightly smaller linewidths measuredby the latter approach are due to the better spectral resolutionoffered by this method.32
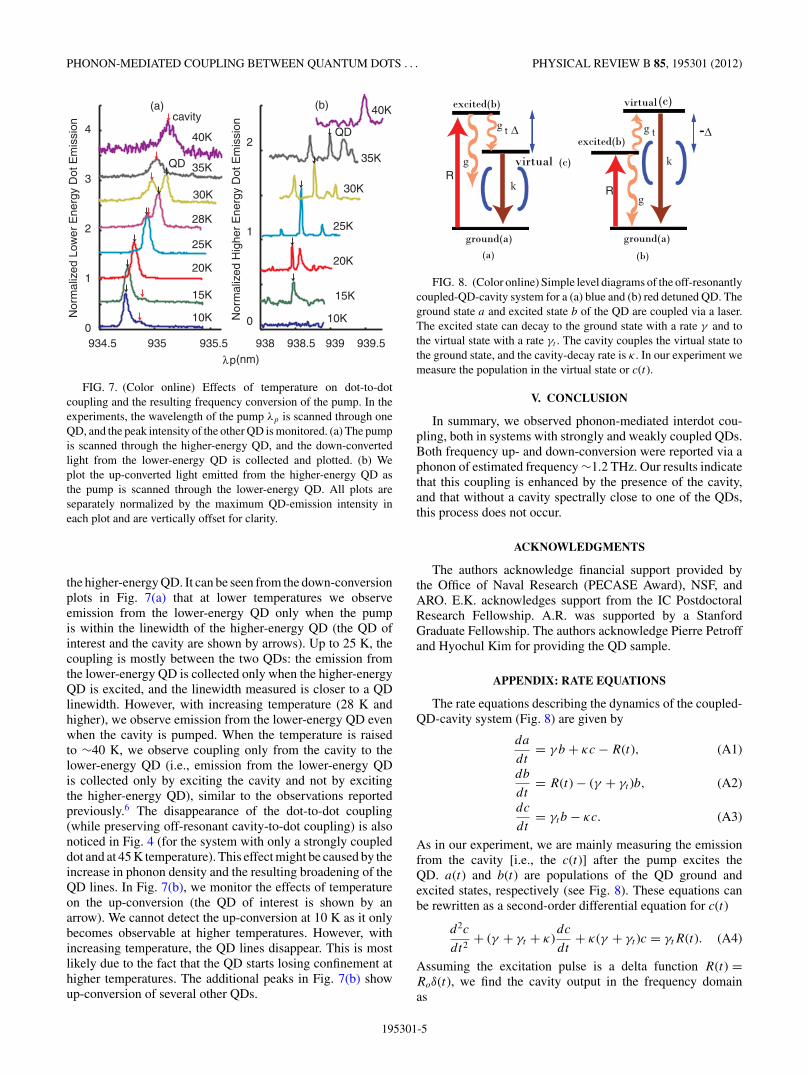
Finally, we performed a study of the effects of temperatureon the interdot coupling. We note that while down-conversionof the pump light is observed at a temperature as low as 10K, we did not observe any up-conversion at this temperature.This corroborates the fact that the observed dot-to-dot couplingis phonon mediated, and at low temperatures, up-conversioncannot happen due to the smaller number of phonons. We firstscan the laser across the higher-energy QD and observe theoff-resonant emission from the lower-energy QD. Figure 7(a)shows the result of this measurement for a set of differenttemperatures. Similarly, Fig. 7(b) shows the data obtained byscanning the laser across the lower-energy QD and observingthe off-resonant emission from the higher-energy QD for anassortment of temperatures. The cavity is spectrally closer to
195301-4
PHONON-MEDIATED COUPLING BETWEEN QUANTUM DOTS . . . PHYSICAL REVIEW B 85, 195301 (2012)
934.5 935 935.50
1
2
3
4
938 938.5 939 939.5
0
1
2
10K
15K 15K
20K20K
25K
25K28K
30K 30K
35K35K
40K
40K
λ (nm)
(a) (b)
Nor
mal
ized
Low
er E
nerg
y D
ot E
mis
sion
Nor
mal
ized
Hig
her
Ene
rgy
Dot
Em
issi
on
p
QDcavity
QD
10K
FIG. 7. (Color online) Effects of temperature on dot-to-dotcoupling and the resulting frequency conversion of the pump. In theexperiments, the wavelength of the pump λp is scanned through oneQD, and the peak intensity of the other QD is monitored. (a) The pumpis scanned through the higher-energy QD, and the down-convertedlight from the lower-energy QD is collected and plotted. (b) Weplot the up-converted light emitted from the higher-energy QD asthe pump is scanned through the lower-energy QD. All plots areseparately normalized by the maximum QD-emission intensity ineach plot and are vertically offset for clarity.
the higher-energy QD. It can be seen from the down-conversionplots in Fig. 7(a) that at lower temperatures we observeemission from the lower-energy QD only when the pumpis within the linewidth of the higher-energy QD (the QD ofinterest and the cavity are shown by arrows). Up to 25 K, thecoupling is mostly between the two QDs: the emission fromthe lower-energy QD is collected only when the higher-energyQD is excited, and the linewidth measured is closer to a QDlinewidth. However, with increasing temperature (28 K andhigher), we observe emission from the lower-energy QD evenwhen the cavity is pumped. When the temperature is raisedto ∼40 K, we observe coupling only from the cavity to thelower-energy QD (i.e., emission from the lower-energy QDis collected only by exciting the cavity and not by excitingthe higher-energy QD), similar to the observations reportedpreviously.6 The disappearance of the dot-to-dot coupling(while preserving off-resonant cavity-to-dot coupling) is alsonoticed in Fig. 4 (for the system with only a strongly coupleddot and at 45 K temperature). This effect might be caused by theincrease in phonon density and the resulting broadening of theQD lines. In Fig. 7(b), we monitor the effects of temperatureon the up-conversion (the QD of interest is shown by anarrow). We cannot detect the up-conversion at 10 K as it onlybecomes observable at higher temperatures. However, withincreasing temperature, the QD lines disappear. This is mostlikely due to the fact that the QD starts losing confinement athigher temperatures. The additional peaks in Fig. 7(b) showup-conversion of several other QDs.
ground(a)
excited(b)
virtual (c)
ground(a)
excited(b)
virtual (c)
-
(b)(a)
RRk
kg
g
g t g tΔ Δ
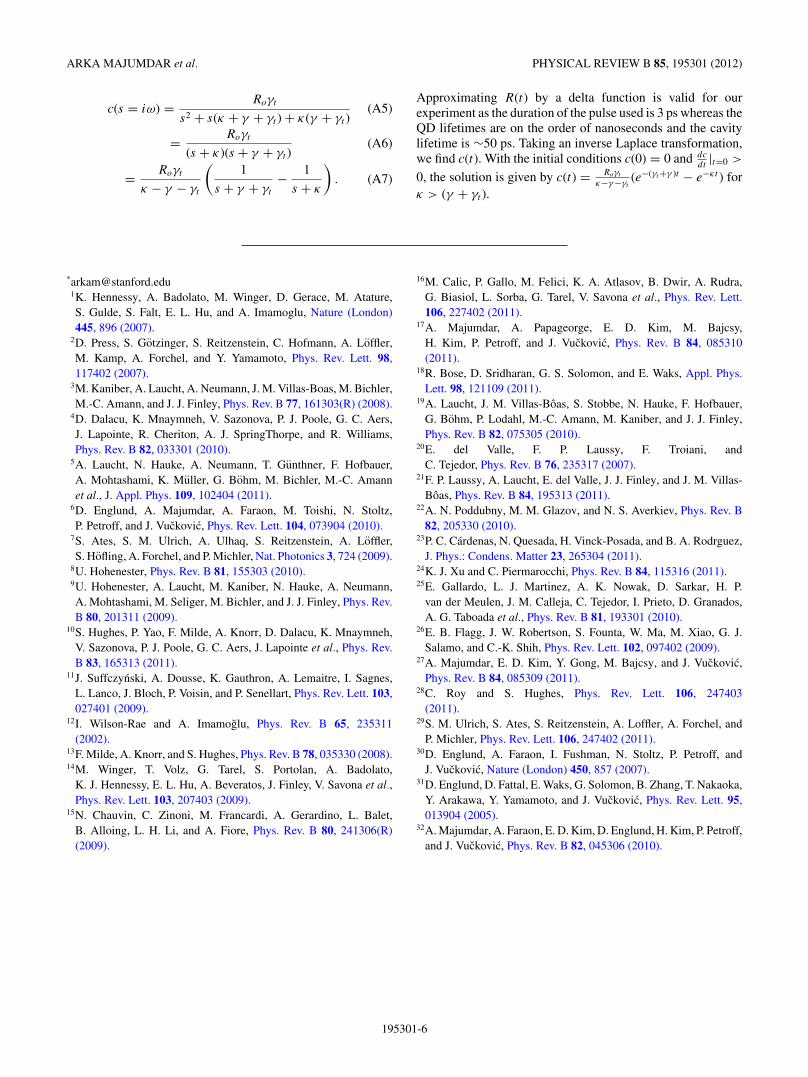
FIG. 8. (Color online) Simple level diagrams of the off-resonantlycoupled-QD-cavity system for a (a) blue and (b) red detuned QD. Theground state a and excited state b of the QD are coupled via a laser.The excited state can decay to the ground state with a rate γ and tothe virtual state with a rate γt . The cavity couples the virtual state tothe ground state, and the cavity-decay rate is κ . In our experiment wemeasure the population in the virtual state or c(t).
V. CONCLUSION
In summary, we observed phonon-mediated interdot cou-pling, both in systems with strongly and weakly coupled QDs.Both frequency up- and down-conversion were reported via aphonon of estimated frequency ∼1.2 THz. Our results indicatethat this coupling is enhanced by the presence of the cavity,and that without a cavity spectrally close to one of the QDs,this process does not occur.
ACKNOWLEDGMENTS
The authors acknowledge financial support provided bythe Office of Naval Research (PECASE Award), NSF, andARO. E.K. acknowledges support from the IC PostdoctoralResearch Fellowship. A.R. was supported by a StanfordGraduate Fellowship. The authors acknowledge Pierre Petroffand Hyochul Kim for providing the QD sample.
APPENDIX: RATE EQUATIONS
The rate equations describing the dynamics of the coupled-QD-cavity system (Fig. 8) are given by
da
dt= γ b + κc − R(t), (A1)
db
dt= R(t) − (γ + γt )b, (A2)
dc
dt= γtb − κc. (A3)
As in our experiment, we are mainly measuring the emissionfrom the cavity [i.e., the c(t)] after the pump excites theQD. a(t) and b(t) are populations of the QD ground andexcited states, respectively (see Fig. 8). These equations canbe rewritten as a second-order differential equation for c(t)
d2c
dt2+ (γ + γt + κ)
dc
dt+ κ(γ + γt )c = γtR(t). (A4)
Assuming the excitation pulse is a delta function R(t) =Roδ(t), we find the cavity output in the frequency domainas
195301-5
ARKA MAJUMDAR et al. PHYSICAL REVIEW B 85, 195301 (2012)
c(s = iω) = Roγt
s2 + s(κ + γ + γt ) + κ(γ + γt )(A5)
= Roγt
(s + κ)(s + γ + γt )(A6)
= Roγt
κ − γ − γt
(1
s + γ + γt
− 1
s + κ
). (A7)
Approximating R(t) by a delta function is valid for ourexperiment as the duration of the pulse used is 3 ps whereas theQD lifetimes are on the order of nanoseconds and the cavitylifetime is ∼50 ps. Taking an inverse Laplace transformation,we find c(t). With the initial conditions c(0) = 0 and dc
dt|t=0 >
0, the solution is given by c(t) = Roγt
κ−γ−γt(e−(γt+γ )t − e−κt ) for
κ > (γ + γt ).
*[email protected]. Hennessy, A. Badolato, M. Winger, D. Gerace, M. Atature,S. Gulde, S. Falt, E. L. Hu, and A. Imamoglu, Nature (London)445, 896 (2007).
2D. Press, S. Gotzinger, S. Reitzenstein, C. Hofmann, A. Loffler,M. Kamp, A. Forchel, and Y. Yamamoto, Phys. Rev. Lett. 98,117402 (2007).
3M. Kaniber, A. Laucht, A. Neumann, J. M. Villas-Boas, M. Bichler,M.-C. Amann, and J. J. Finley, Phys. Rev. B 77, 161303(R) (2008).
4D. Dalacu, K. Mnaymneh, V. Sazonova, P. J. Poole, G. C. Aers,J. Lapointe, R. Cheriton, A. J. SpringThorpe, and R. Williams,Phys. Rev. B 82, 033301 (2010).
5A. Laucht, N. Hauke, A. Neumann, T. Gunthner, F. Hofbauer,A. Mohtashami, K. Muller, G. Bohm, M. Bichler, M.-C. Amannet al., J. Appl. Phys. 109, 102404 (2011).
6D. Englund, A. Majumdar, A. Faraon, M. Toishi, N. Stoltz,P. Petroff, and J. Vuckovic, Phys. Rev. Lett. 104, 073904 (2010).
7S. Ates, S. M. Ulrich, A. Ulhaq, S. Reitzenstein, A. Loffler,S. Hofling, A. Forchel, and P. Michler, Nat. Photonics 3, 724 (2009).
8U. Hohenester, Phys. Rev. B 81, 155303 (2010).9U. Hohenester, A. Laucht, M. Kaniber, N. Hauke, A. Neumann,A. Mohtashami, M. Seliger, M. Bichler, and J. J. Finley, Phys. Rev.B 80, 201311 (2009).
10S. Hughes, P. Yao, F. Milde, A. Knorr, D. Dalacu, K. Mnaymneh,V. Sazonova, P. J. Poole, G. C. Aers, J. Lapointe et al., Phys. Rev.B 83, 165313 (2011).
11J. Suffczynski, A. Dousse, K. Gauthron, A. Lemaitre, I. Sagnes,L. Lanco, J. Bloch, P. Voisin, and P. Senellart, Phys. Rev. Lett. 103,027401 (2009).
12I. Wilson-Rae and A. Imamoglu, Phys. Rev. B 65, 235311(2002).
13F. Milde, A. Knorr, and S. Hughes, Phys. Rev. B 78, 035330 (2008).14M. Winger, T. Volz, G. Tarel, S. Portolan, A. Badolato,
K. J. Hennessy, E. L. Hu, A. Beveratos, J. Finley, V. Savona et al.,Phys. Rev. Lett. 103, 207403 (2009).
15N. Chauvin, C. Zinoni, M. Francardi, A. Gerardino, L. Balet,B. Alloing, L. H. Li, and A. Fiore, Phys. Rev. B 80, 241306(R)(2009).
16M. Calic, P. Gallo, M. Felici, K. A. Atlasov, B. Dwir, A. Rudra,G. Biasiol, L. Sorba, G. Tarel, V. Savona et al., Phys. Rev. Lett.106, 227402 (2011).
17A. Majumdar, A. Papageorge, E. D. Kim, M. Bajcsy,H. Kim, P. Petroff, and J. Vuckovic, Phys. Rev. B 84, 085310(2011).
18R. Bose, D. Sridharan, G. S. Solomon, and E. Waks, Appl. Phys.Lett. 98, 121109 (2011).
19A. Laucht, J. M. Villas-Boas, S. Stobbe, N. Hauke, F. Hofbauer,G. Bohm, P. Lodahl, M.-C. Amann, M. Kaniber, and J. J. Finley,Phys. Rev. B 82, 075305 (2010).
20E. del Valle, F. P. Laussy, F. Troiani, andC. Tejedor, Phys. Rev. B 76, 235317 (2007).
21F. P. Laussy, A. Laucht, E. del Valle, J. J. Finley, and J. M. Villas-Boas, Phys. Rev. B 84, 195313 (2011).
22A. N. Poddubny, M. M. Glazov, and N. S. Averkiev, Phys. Rev. B82, 205330 (2010).
23P. C. Cardenas, N. Quesada, H. Vinck-Posada, and B. A. Rodrguez,J. Phys.: Condens. Matter 23, 265304 (2011).
24K. J. Xu and C. Piermarocchi, Phys. Rev. B 84, 115316 (2011).25E. Gallardo, L. J. Martinez, A. K. Nowak, D. Sarkar, H. P.
van der Meulen, J. M. Calleja, C. Tejedor, I. Prieto, D. Granados,A. G. Taboada et al., Phys. Rev. B 81, 193301 (2010).
26E. B. Flagg, J. W. Robertson, S. Founta, W. Ma, M. Xiao, G. J.Salamo, and C.-K. Shih, Phys. Rev. Lett. 102, 097402 (2009).
27A. Majumdar, E. D. Kim, Y. Gong, M. Bajcsy, and J. Vuckovic,Phys. Rev. B 84, 085309 (2011).
28C. Roy and S. Hughes, Phys. Rev. Lett. 106, 247403(2011).
29S. M. Ulrich, S. Ates, S. Reitzenstein, A. Loffler, A. Forchel, andP. Michler, Phys. Rev. Lett. 106, 247402 (2011).
30D. Englund, A. Faraon, I. Fushman, N. Stoltz, P. Petroff, andJ. Vuckovic, Nature (London) 450, 857 (2007).
31D. Englund, D. Fattal, E. Waks, G. Solomon, B. Zhang, T. Nakaoka,Y. Arakawa, Y. Yamamoto, and J. Vuckovic, Phys. Rev. Lett. 95,013904 (2005).
32A. Majumdar, A. Faraon, E. D. Kim, D. Englund, H. Kim, P. Petroff,and J. Vuckovic, Phys. Rev. B 82, 045306 (2010).
195301-6