Embed Size (px)
Citation preview
phospholamban
Old & NewFar & Near
Lin Guo-hua
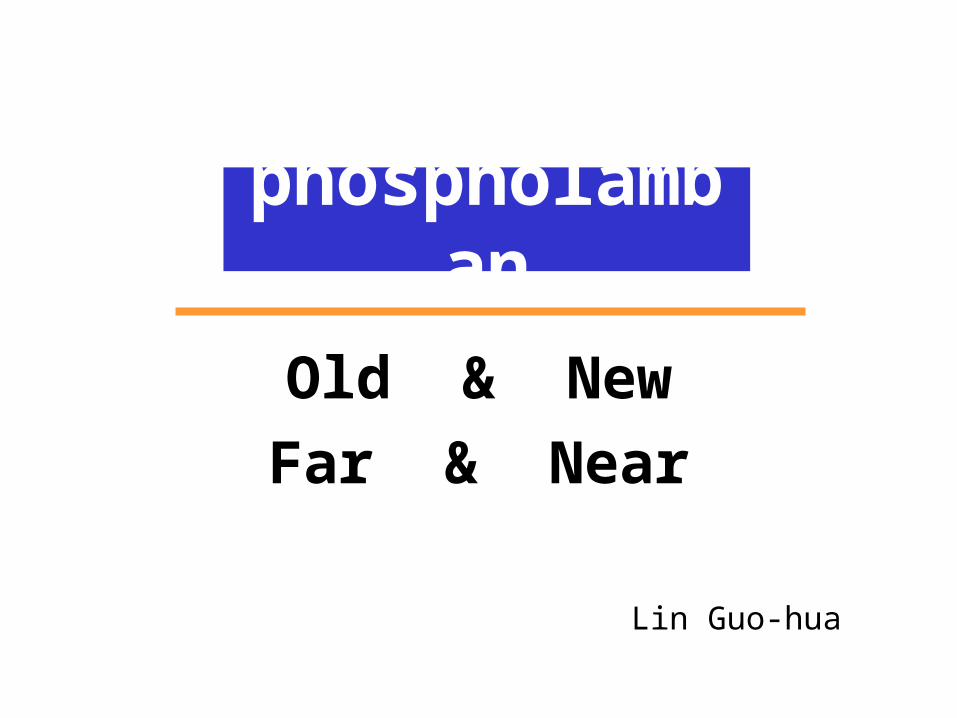
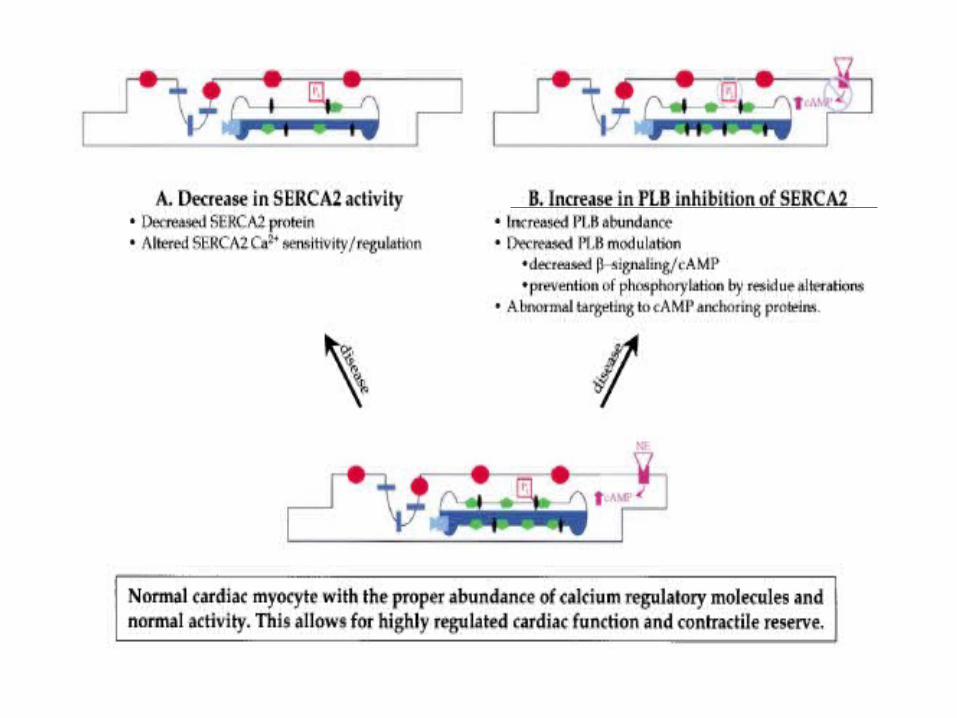
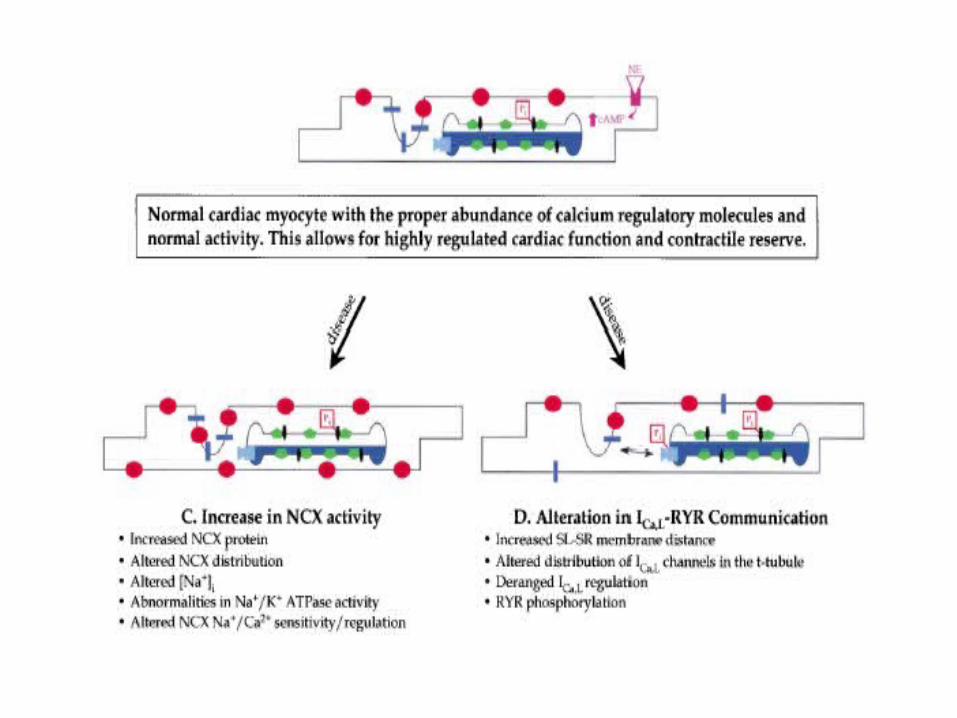
Schematic representation of myocardial Ca homeostasis. During systole, Ca enters the myocyte over L-type Ca channels (1) and induces a Ca release of the ryanodine receptor from the sarcoplasmic reticulum (SR). During diastole Ca is subsequently transported into the SR via the SR Ca -ATPase (SERCA2a), which is under the inhibitory control of phospholamban (PLB). The intracellular Ca concentration is modified by the sarcolemmal Ca -ATPase (2), the Na /Ca -exchanger (3), the Na , K -ATPase (4), the sarcolemmal Na -channels (5), and the b-adrenoreceptor (6). Diastolic SR Ca movement is modulated through alterations in SERCA2a function and PLB inhibition.
myocardial Ca2+
homeostasis
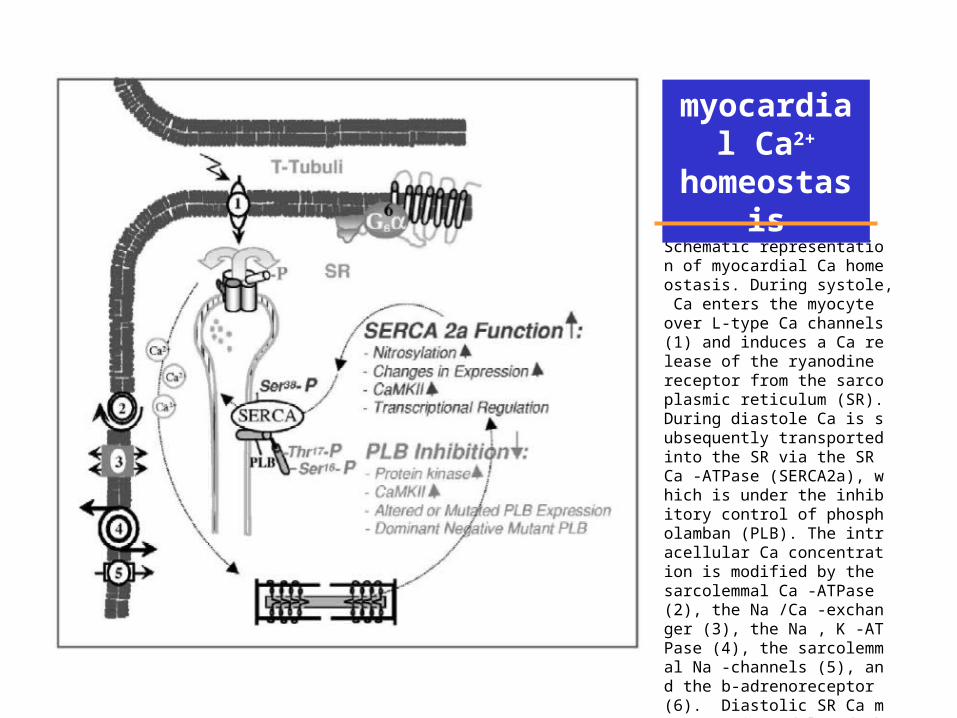
SERCA
(Trends Cardiovasc Med 1998;8:330–340)
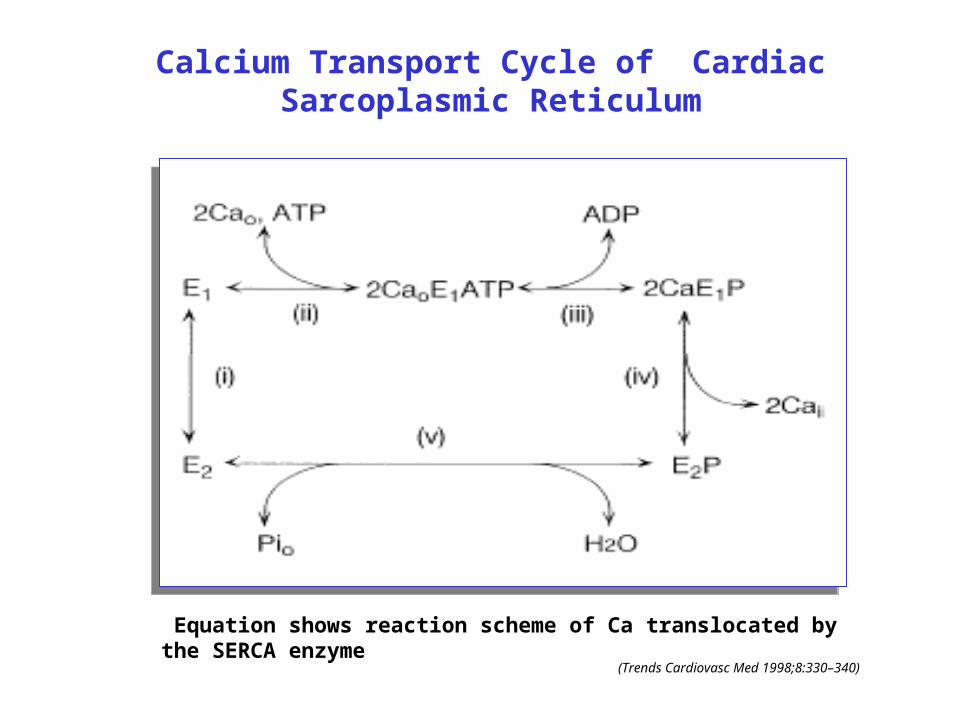
Calcium Transport Cycle of Cardiac Sarcoplasmic Reticulum
Equation shows reaction scheme of Ca translocated by the SERCA enzyme
(Trends Cardiovasc Med 1998;8:330–340)
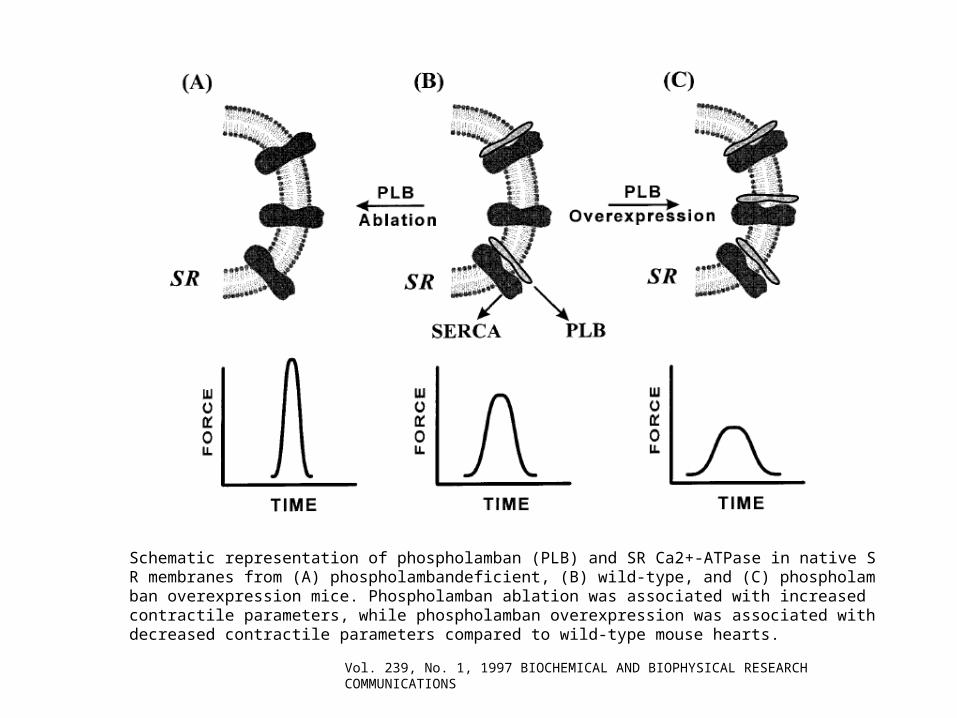
Schematic representation of phospholamban (PLB) and SR Ca2+-ATPase in native SR membranes from (A) phospholambandeficient, (B) wild-type, and (C) phospholamban overexpression mice. Phospholamban ablation was associated with increased contractile parameters, while phospholamban overexpression was associated with decreased contractile parameters compared to wild-type mouse hearts.
Vol. 239, No. 1, 1997 BIOCHEMICAL AND BIOPHYSICAL RESEARCH COMMUNICATIONS
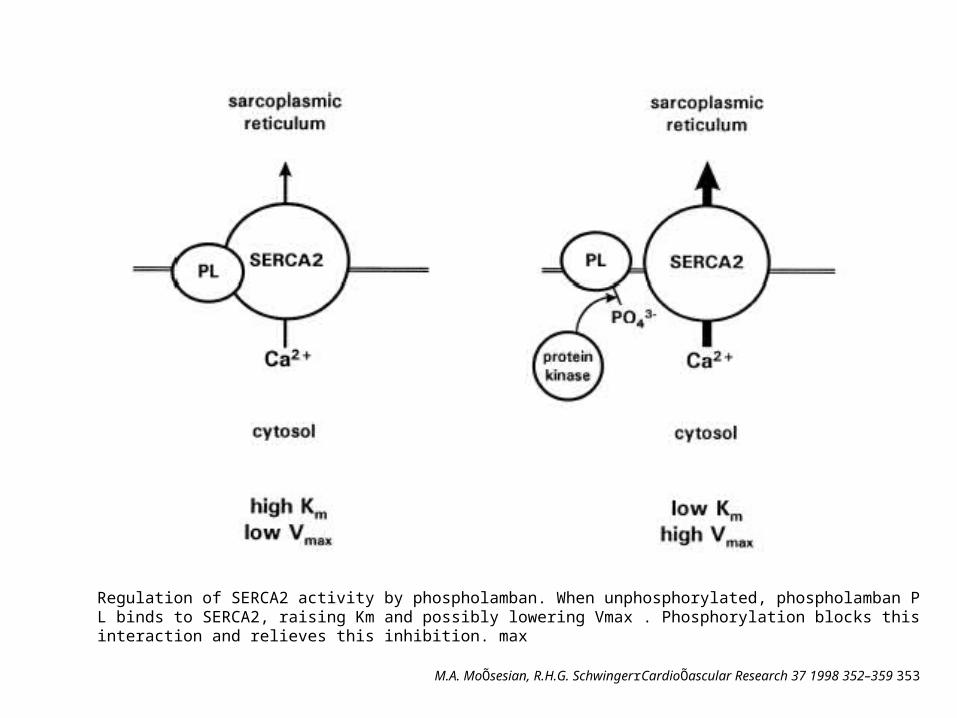
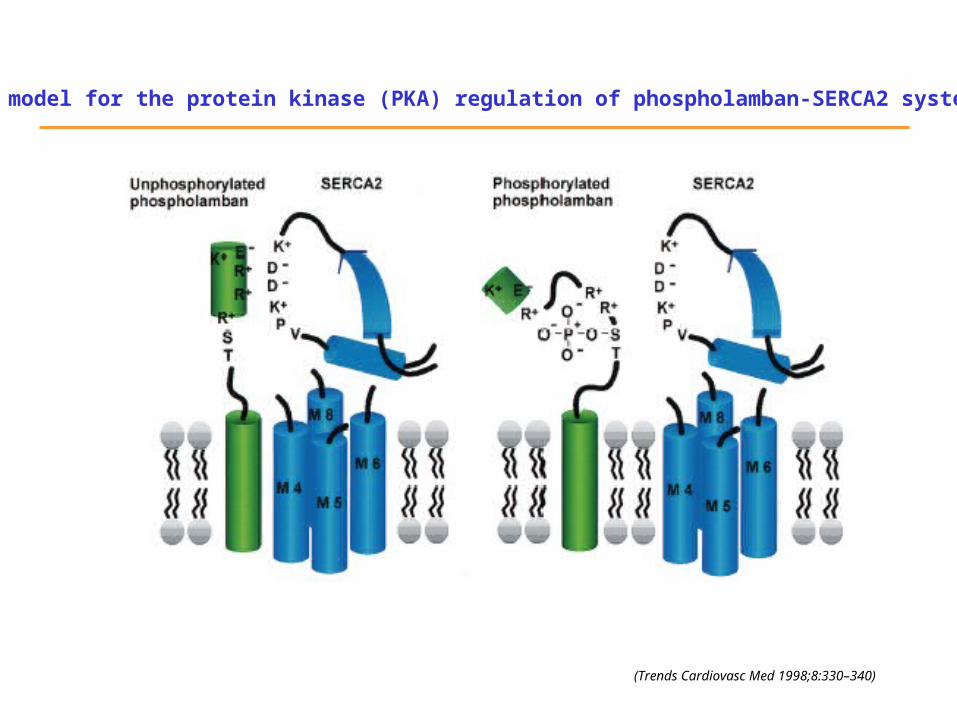
Regulation of SERCA2 activity by phospholamban. When unphosphorylated, phospholamban PL binds to SERCA2, raising Km and possibly lowering Vmax . Phosphorylation blocks this interaction and relieves this inhibition. max
M.A. MoÕsesian, R.H.G. SchwingerrCardioÕascular Research 37 1998 352–359 353
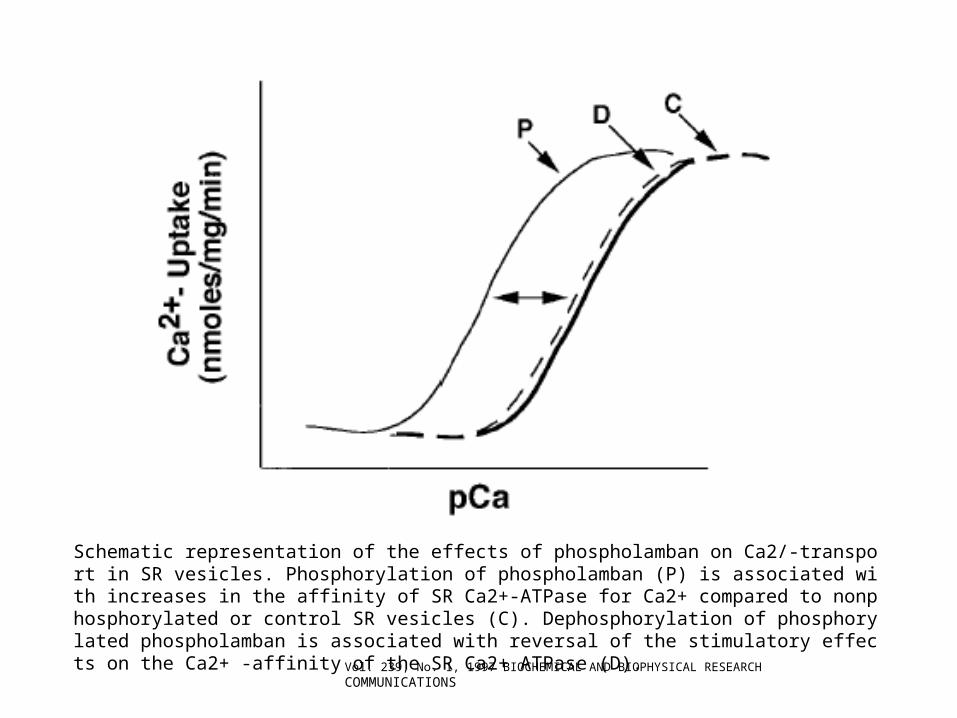
Schematic representation of the effects of phospholamban on Ca2/-transport in SR vesicles. Phosphorylation of phospholamban (P) is associated with increases in the affinity of SR Ca2+-ATPase for Ca2+ compared to nonphosphorylated or control SR vesicles (C). Dephosphorylation of phosphorylated phospholamban is associated with reversal of the stimulatory effects on the Ca2+ -affinity of the SR Ca2+ ATPase (D).
Vol. 239, No. 1, 1997 BIOCHEMICAL AND BIOPHYSICAL RESEARCH COMMUNICATIONS
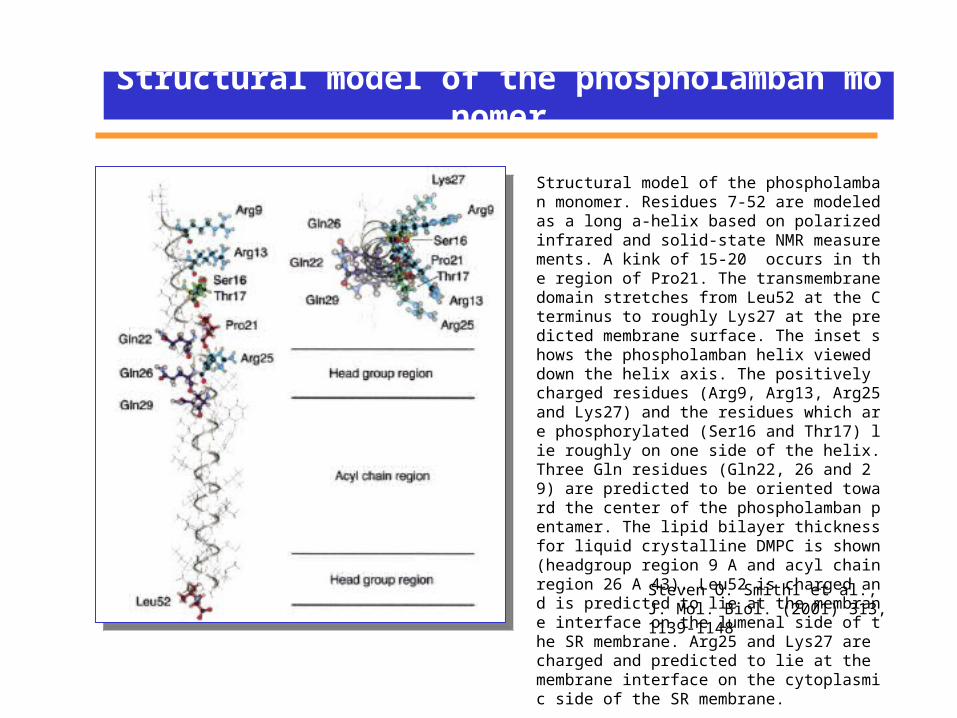
Structural model of the phospholamban monomer
Structural model of the phospholamban monomer. Residues 7-52 are modeled as a long a-helix based on polarized infrared and solid-state NMR measurements. A kink of 15-20 occurs in the region of Pro21. The transmembrane domain stretches from Leu52 at the C terminus to roughly Lys27 at the predicted membrane surface. The inset shows the phospholamban helix viewed down the helix axis. The positively charged residues (Arg9, Arg13, Arg25 and Lys27) and the residues which are phosphorylated (Ser16 and Thr17) lie roughly on one side of the helix. Three Gln residues (Gln22, 26 and 29) are predicted to be oriented toward the center of the phospholamban pentamer. The lipid bilayer thickness for liquid crystalline DMPC is shown (headgroup region 9 A and acyl chain region 26 A 43). Leu52 is charged and is predicted to lie at the membrane interface on the lumenal side of the SR membrane. Arg25 and Lys27 are charged and predicted to lie at the membrane interface on the cytoplasmic side of the SR membrane.
Steven O. Smith1 et al., J. Mol. Biol. (2001) 313, 1139-1148
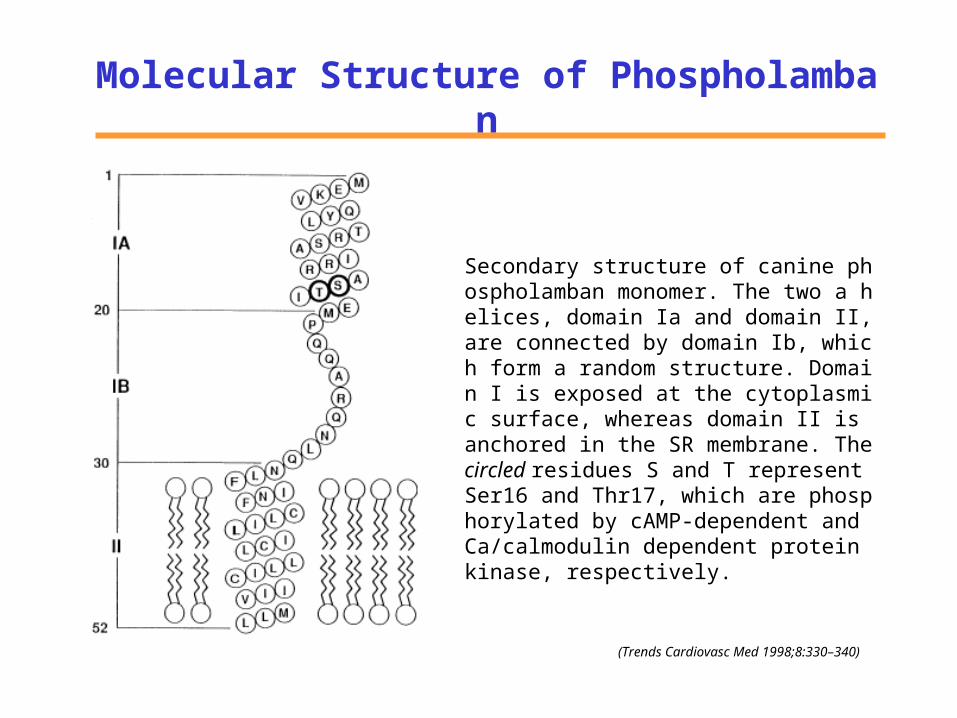
Molecular Structure of Phospholamban
(Trends Cardiovasc Med 1998;8:330–340)
Secondary structure of canine phospholamban monomer. The two a helices, domain Ia and domain II, are connected by domain Ib, which form a random structure. Domain I is exposed at the cytoplasmic surface, whereas domain II is anchored in the SR membrane. The circled residues S and T represent Ser16 and Thr17, which are phosphorylated by cAMP-dependent and Ca/calmodulin dependent protein kinase, respectively.
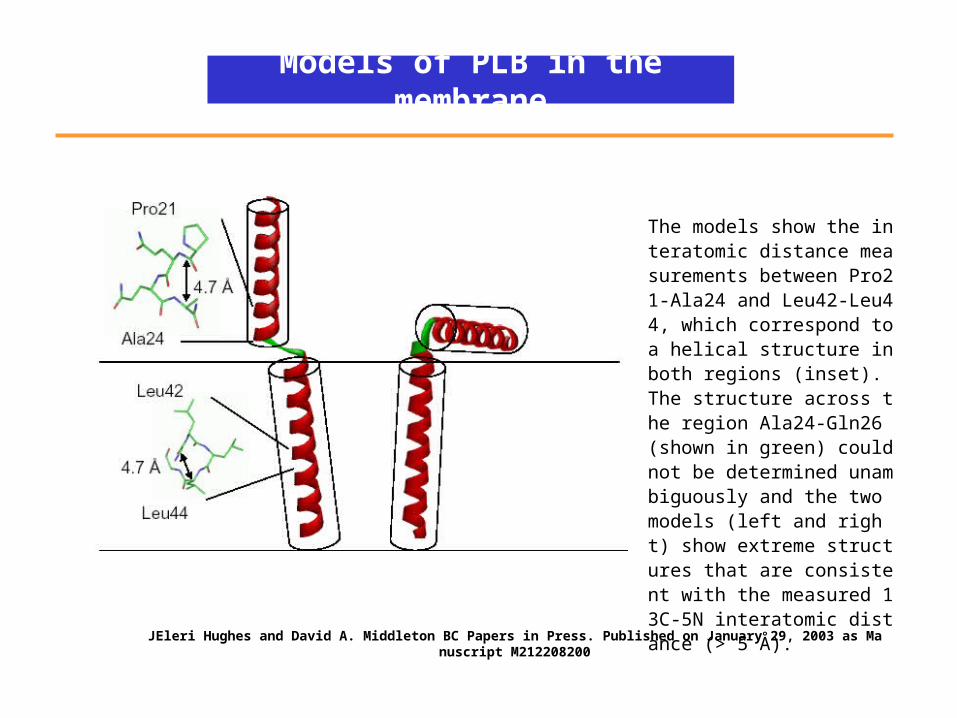
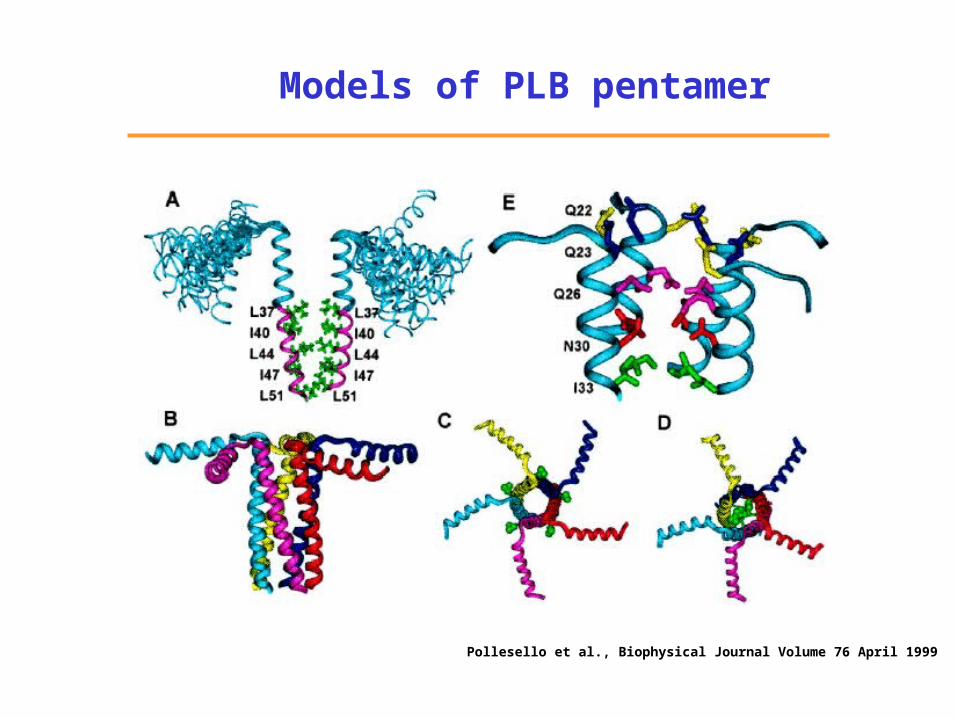
Models of PLB in the membrane
The models show the interatomic distance measurements between Pro21-Ala24 and Leu42-Leu44, which correspond to a helical structure in both regions (inset). The structure across the region Ala24-Gln26 (shown in green) could not be determined unambiguously and the two models (left and right) show extreme structures that are consistent with the measured 13C-5N interatomic distance (> 5 Å).
JEleri Hughes and David A. Middleton BC Papers in Press. Published on January 29, 2003 as Manuscript M212208200

Amino acid sequences of PLB monomerfrom different species
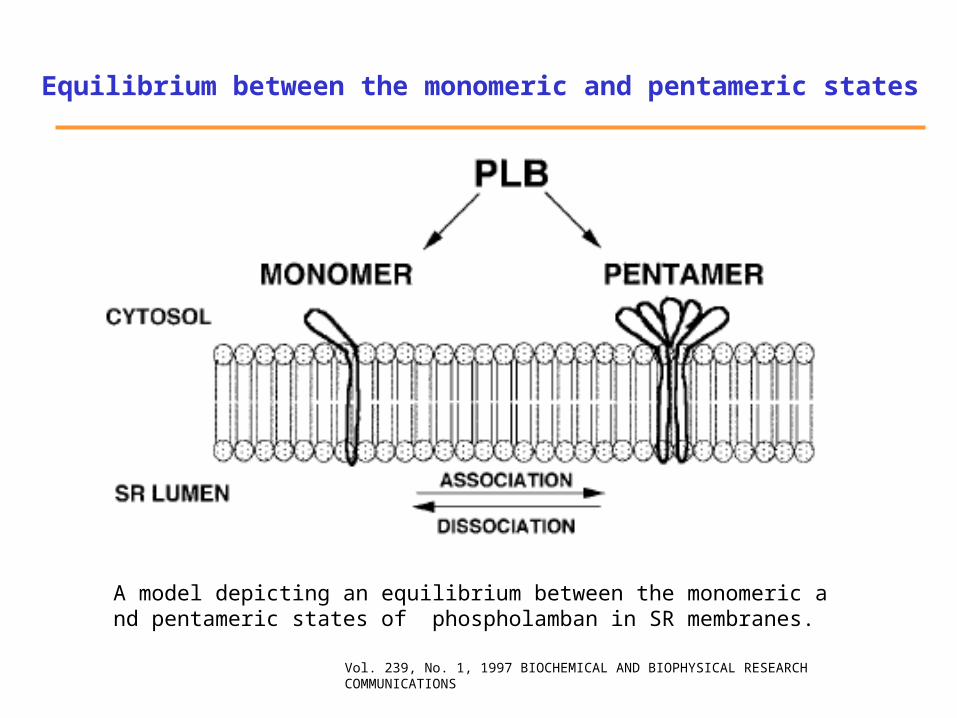
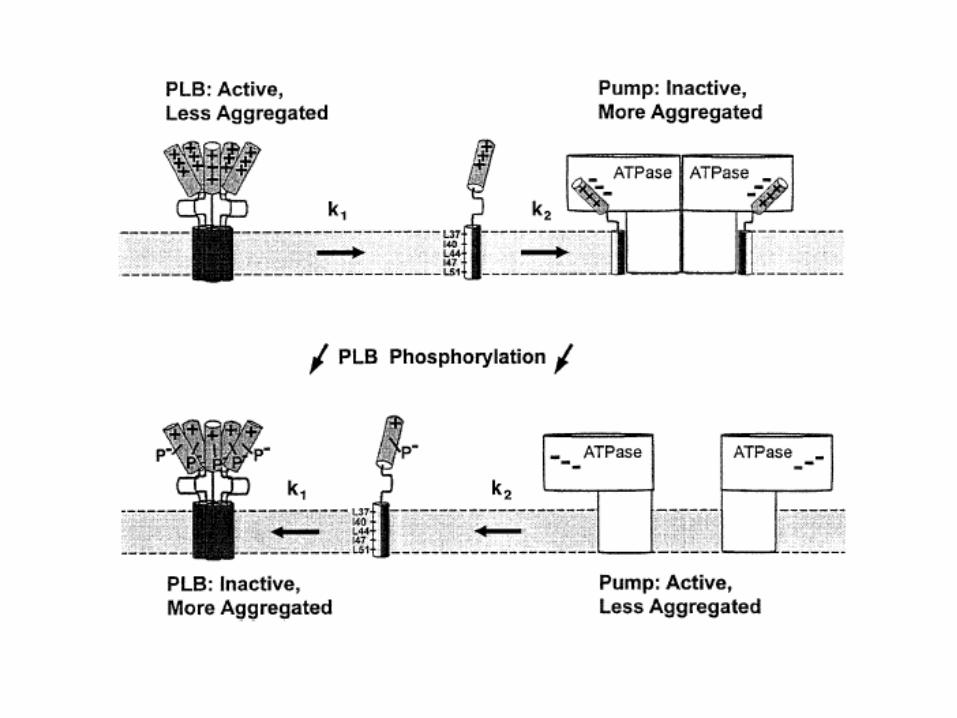
A model depicting an equilibrium between the monomeric and pentameric states of phospholamban in SR membranes.
Vol. 239, No. 1, 1997 BIOCHEMICAL AND BIOPHYSICAL RESEARCH COMMUNICATIONS
Equilibrium between the monomeric and pentameric states
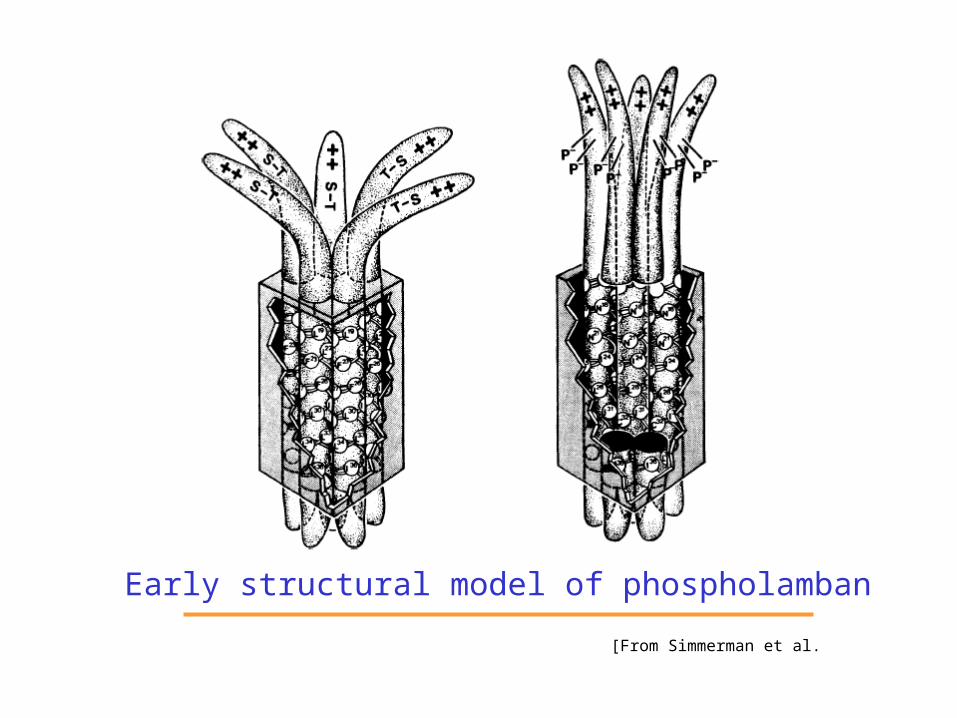
Early structural model of phospholamban[From Simmerman et al.
Pollesello et al., Biophysical Journal Volume 76 April 1999
Models of PLB pentamer
(Trends Cardiovasc Med 1998;8:330–340)
A model for the protein kinase (PKA) regulation of phospholamban-SERCA2 system
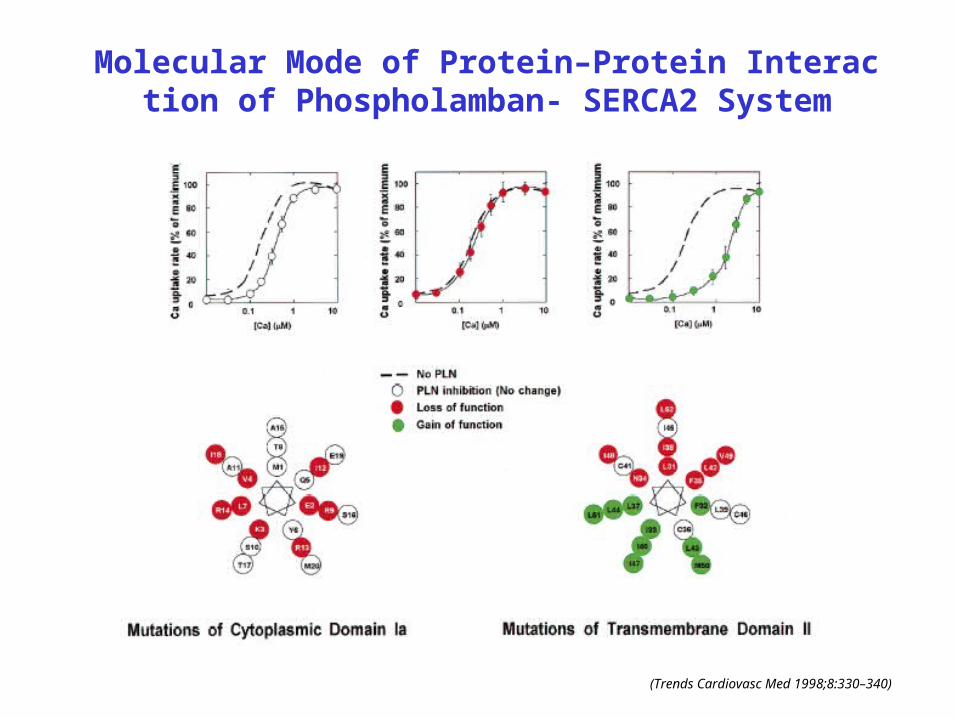
Molecular Mode of Protein–Protein Interaction of Phospholamban- SERCA2 System
(Trends Cardiovasc Med 1998;8:330–340)
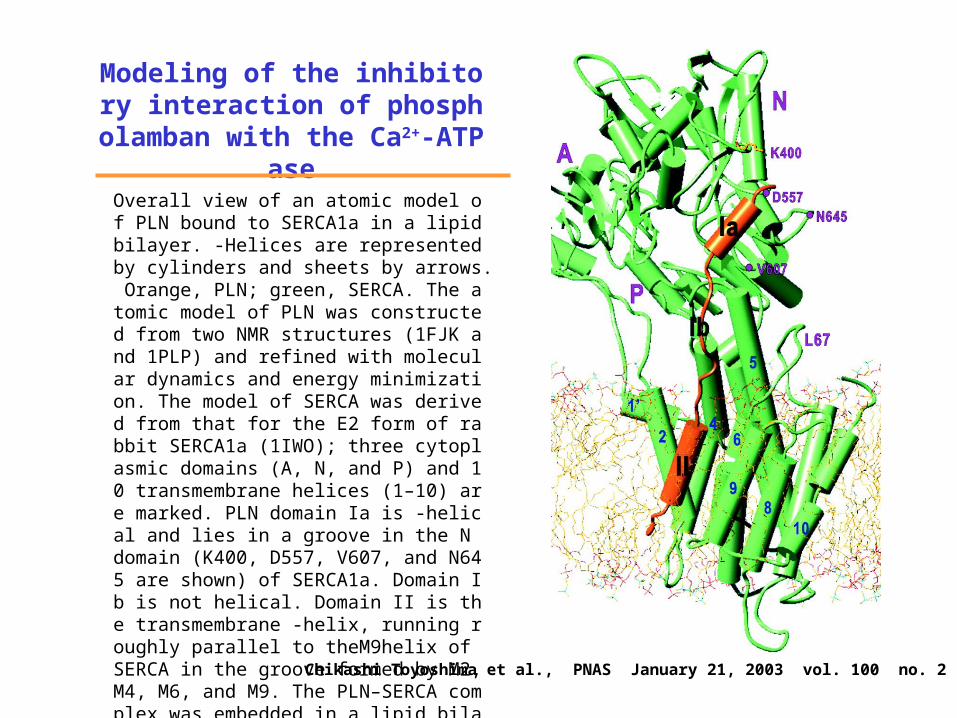
Modeling of the inhibitory interaction of phospholamban
with the Ca2+-ATPaseOverall view of an atomic model of PLN bound to SERCA1a in a lipid bilayer. -Helices are represented by cylinders and sheets by arrows. Orange, PLN; green, SERCA. The atomic model of PLN was constructed from two NMR structures (1FJK and 1PLP) and refined with molecular dynamics and energy minimization. The model of SERCA was derived from that for the E2 form of rabbit SERCA1a (1IWO); three cytoplasmic domains (A, N, and P) and 10 transmembrane helices (1–10) are marked. PLN domain Ia is -helical and lies in a groove in the N domain (K400, D557, V607, and N645 are shown) of SERCA1a. Domain Ib is not helical. Domain II is the transmembrane -helix, running roughly parallel to theM9helix of SERCA in the groove formed by M2, M4, M6, and M9. The PLN–SERCA complex was embedded in a lipid bilayer generated by molecular dynamics simulation of dioleoyl phosphatidyl choline. Chikashi Toyoshima et al., PNAS January 21, 2003 vol. 100 no. 2 467–472
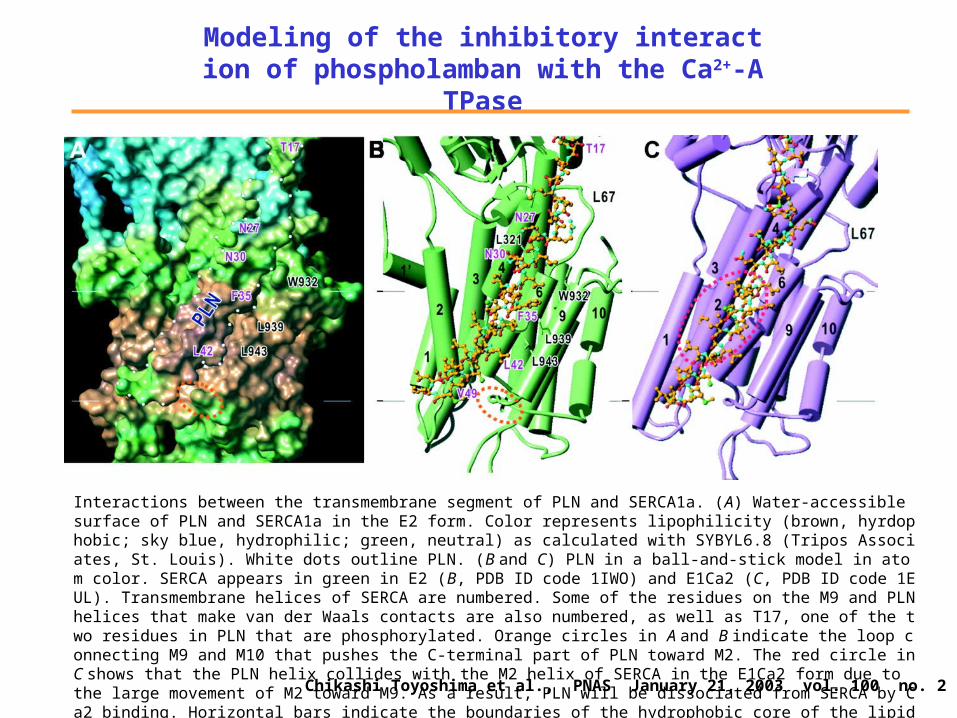
Modeling of the inhibitory interaction of phospholamban with the Ca2+-ATPase
Interactions between the transmembrane segment of PLN and SERCA1a. (A) Water-accessible surface of PLN and SERCA1a in the E2 form. Color represents lipophilicity (brown, hyrdophobic; sky blue, hydrophilic; green, neutral) as calculated with SYBYL6.8 (Tripos Associates, St. Louis). White dots outline PLN. (B and C) PLN in a ball-and-stick model in atom color. SERCA appears in green in E2 (B, PDB ID code 1IWO) and E1Ca2 (C, PDB ID code 1EUL). Transmembrane helices of SERCA are numbered. Some of the residues on the M9 and PLN helices that make van der Waals contacts are also numbered, as well as T17, one of the two residues in PLN that are phosphorylated. Orange circles in A and B indicate the loop connecting M9 and M10 that pushes the C-terminal part of PLN toward M2. The red circle in C shows that the PLN helix collides with the M2 helix of SERCA in the E1Ca2 form due to the large movement of M2 toward M9. As a result, PLN will be dissociated from SERCA by Ca2 binding. Horizontal bars indicate the boundaries of the hydrophobic core of the lipid bilayer.Chikashi Toyoshima et al., PNAS January 21, 2003 vol. 100 no. 2 467–472
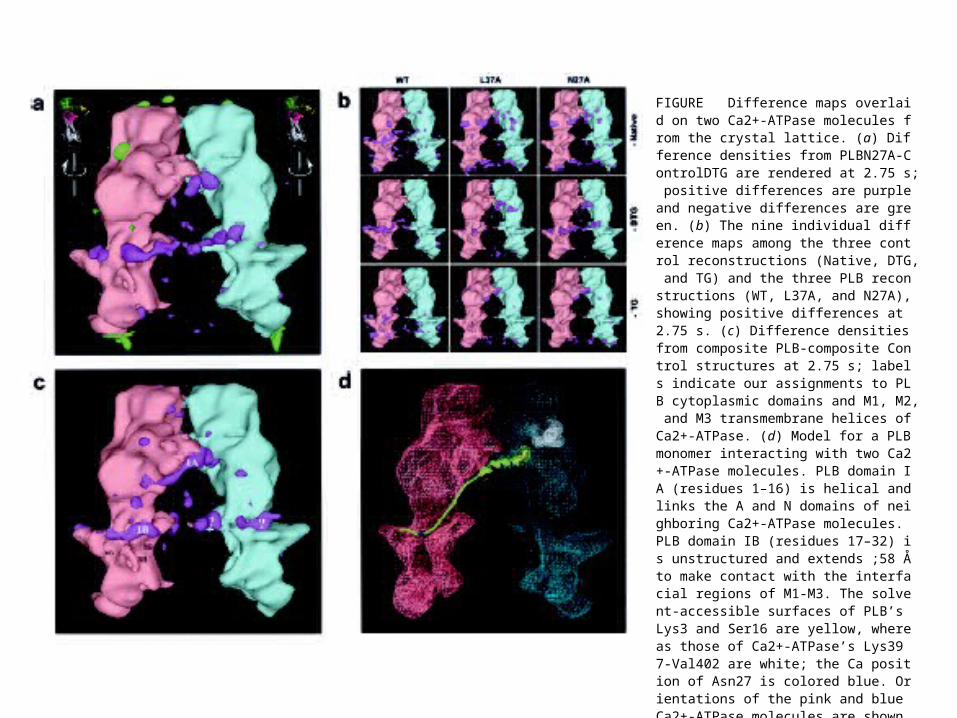
FIGURE Difference maps overlaid on two Ca2+-ATPase molecules from the crystal lattice. (a) Difference densities from PLBN27A-ControlDTG are rendered at 2.75 s; positive differences are purple and negative differences are green. (b) The nine individual difference maps among the three control reconstructions (Native, DTG, and TG) and the three PLB reconstructions (WT, L37A, and N27A), showing positive differences at 2.75 s. (c) Difference densities from composite PLB-composite Control structures at 2.75 s; labels indicate our assignments to PLB cytoplasmic domains and M1, M2, and M3 transmembrane helices of Ca2+-ATPase. (d) Model for a PLB monomer interacting with two Ca2+-ATPase molecules. PLB domain IA (residues 1–16) is helical and links the A and N domains of neighboring Ca2+-ATPase molecules. PLB domain IB (residues 17–32) is unstructured and extends ;58 Å to make contact with the interfacial regions of M1-M3. The solvent-accessible surfaces of PLB’s Lys3 and Ser16 are yellow, whereas those of Ca2+-ATPase’s Lys397-Val402 are white; the Ca position of Asn27 is colored blue. Orientations of the pink and blue Ca2+-ATPase molecules are shown in the upper corners of (a).
(Howard S et al., 2001)
?• Both domains are involved in the inhibitory
effect of PLB on SR Ca2+-ATPase
• whether monomeric or pentameric state of PLB is a more effective inhibitory unit of PLB for SR Ca2+-ATPase.
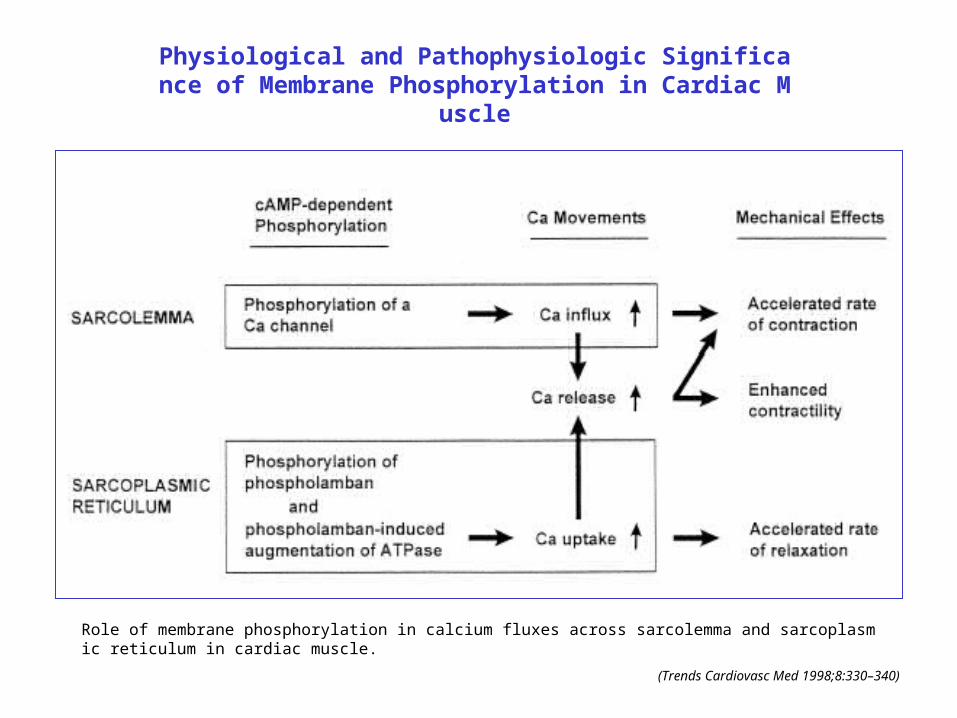
Physiological and Pathophysiologic Significance of Membrane Phosphorylation in Cardiac Muscle
Role of membrane phosphorylation in calcium fluxes across sarcolemma and sarcoplasmic reticulum in cardiac muscle.
(Trends Cardiovasc Med 1998;8:330–340)
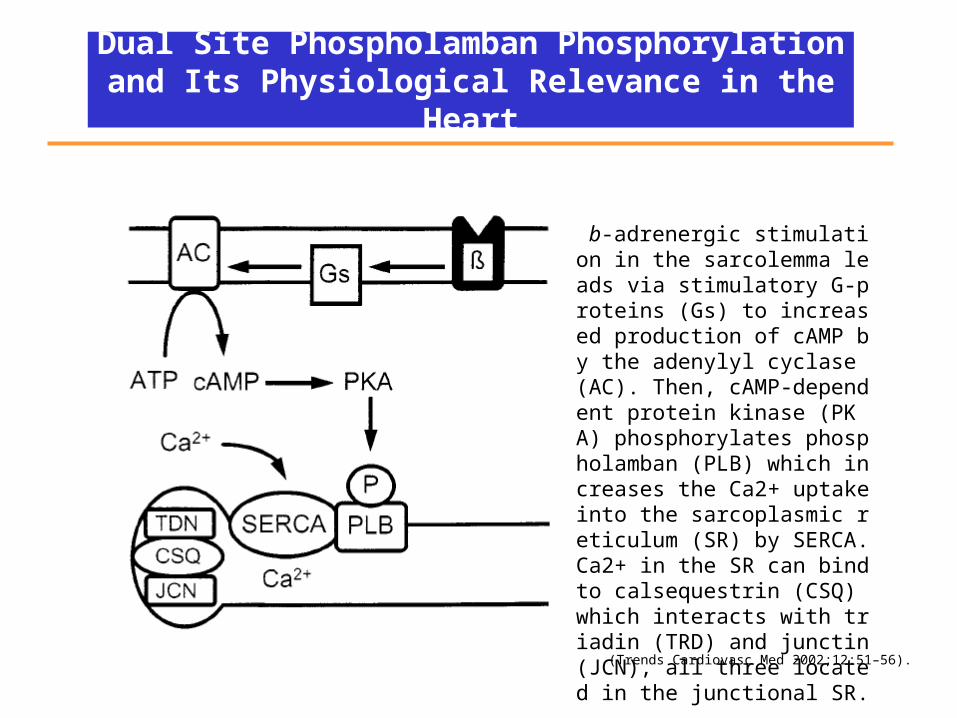
Dual Site Phospholamban Phosphorylation and Its Physiological Relevance in the Heart
(Trends Cardiovasc Med 2002;12:51–56).
b-adrenergic stimulation in the sarcolemma leads via stimulatory G-proteins (Gs) to increased production of cAMP by the adenylyl cyclase (AC). Then, cAMP-dependent protein kinase (PKA) phosphorylates phospholamban (PLB) which increases the Ca2+ uptake into the sarcoplasmic reticulum (SR) by SERCA. Ca2+ in the SR can bind to calsequestrin (CSQ) which interacts with triadin (TRD) and junctin (JCN), all three located in the junctional SR.
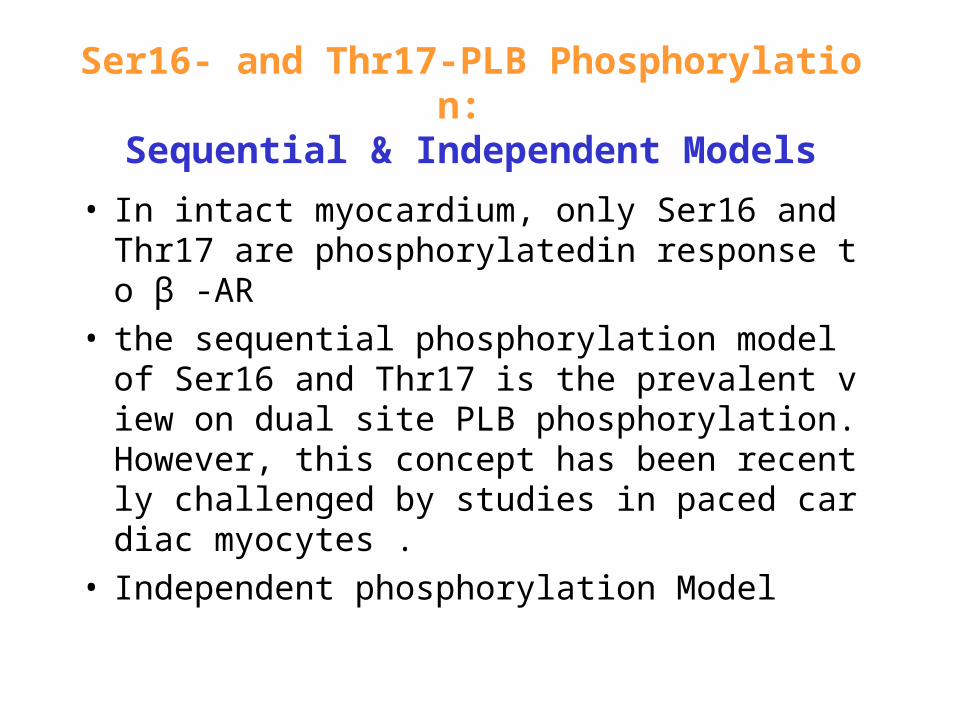
Ser16- and Thr17-PLB Phosphorylation: Sequential & Independent Models
• In intact myocardium, only Ser16 and Thr17 are phosphorylatedin response to β -AR
• the sequential phosphorylation model of Ser16 and Thr17 is the prevalent view on dual site PLB phosphorylation. However, this concept has been recently challenged by studies in paced cardiac myocytes .
• Independent phosphorylation Model
Independent Ser16 and Thr17 Phosphorylation
Figure 1. Norepinephrine (NE) dose-response of Ser16- and Thr17-PLB phosphorylation. Isolated adult rat ventricular myocytes were stimulated by a b1-AR agonist, NE (10-9–10-6 M), in the presence of an a1-adrenergic inhibitor, prazosin (1026 M). Representative immunoblots with antibodies specific for phosphorylated Ser16- and Thr17-PLB are shown in upper pannels. Average data (densitometric evaluation with arbitary units) are presented in the bottom pannel (mean 1 SEM, n 5 3–16 for each data point, * p , 0.01).
(derived from Hagemann et al. 2000).
Hagemann et al. 2000
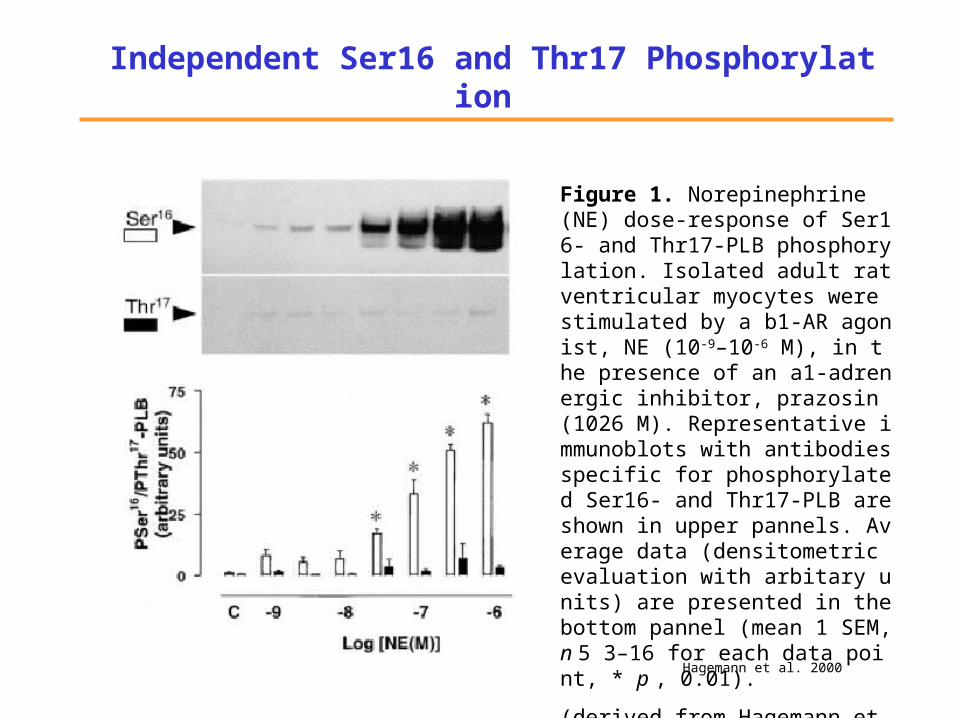
Independent Ser16 and Thr17 Phosphorylation
Figure 2. Ser16- and Thr17-PLB phosphorylation in response to an increase in stimulation frequency. Isolated adult rat cardiomyocytes were electrically paced at various frequencies (0.1–3 Hz) in the absence of b-adrenergic agonist. Upper panels show representative immunoblots with phophorylation site (PSer16/ PThr17)-specific PLB antibodies. Lower panel illustrates the average data (mean 1 SEM, n 5 5–10 for each data point, *p , 0.01). Note the trend of linear increase in Thr17-PLB phosphorylation with increasing pacing frequency and the lack of a significant increase in Ser16-PLB phosphorylation.
(derived from Hagemann et al. 2000)
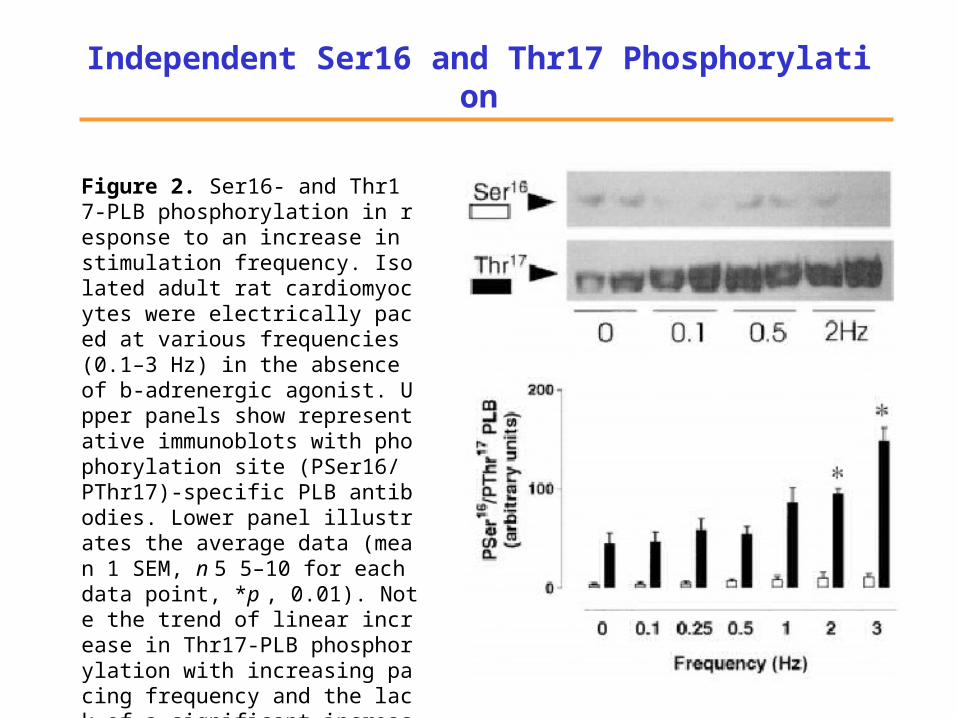
Independent Ser16 and Thr17 Phosphorylation
Figure 3. Thr17-PLB phosphorylation correlates to abbreviation in t5
0 of relaxation. Frequency-dependent Thr17-PLB phosphorylation (n 5 5–10) is closely associated with frequency- dependent abbreviation of the t50 of relaxation (n 5 13–30) in the absence of b-adrenergic stimulation. Data are mean 6 SEM.
(derived from Hagemann et al. 2000)
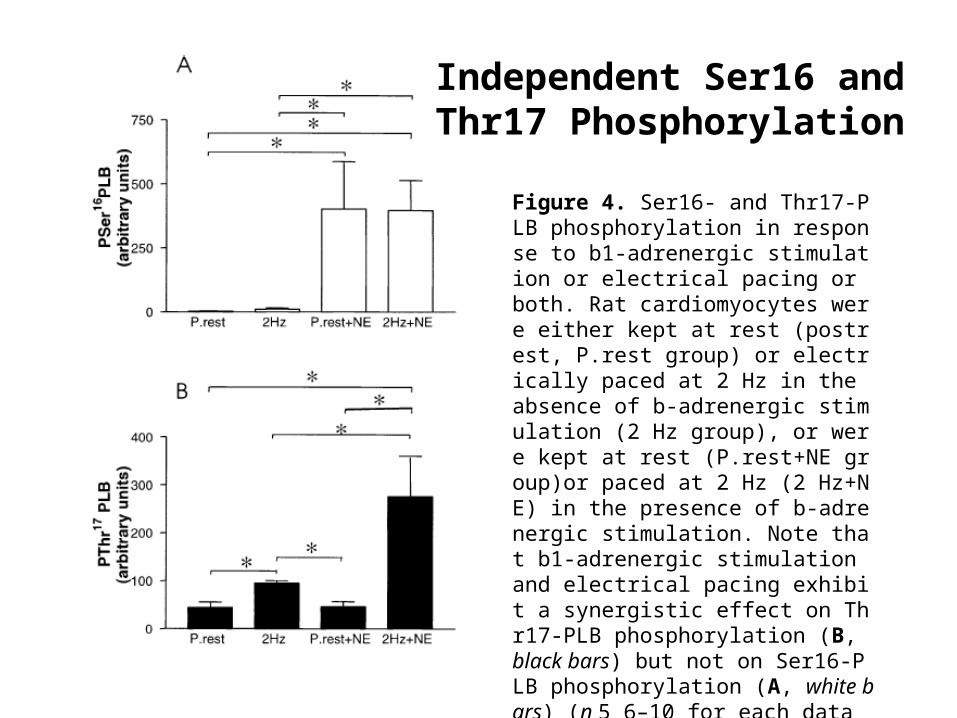
Figure 4. Ser16- and Thr17-PLB phosphorylation in response to b1-adrenergic stimulation or electrical pacing or both. Rat cardiomyocytes were either kept at rest (postrest, P.rest group) or electrically paced at 2 Hz in the absence of b-adrenergic stimulation (2 Hz group), or were kept at rest (P.rest+NE group)or paced at 2 Hz (2 Hz+NE) in the presence of b-adrenergic stimulation. Note that b1-adrenergic stimulation and electrical pacing exhibit a synergistic effect on Thr17-PLB phosphorylation (B, black bars) but not on Ser16-PLB phosphorylation (A, white bars) (n 5 6–10 for each data point, *p , 0.05). Data represent mean 6 SEM.
(derived from Hagemann et al. 2000)
Independent Ser16 andThr17 Phosphorylation
Unique Property of Thr17-PLB Phosphorylation: A Frequency Decoder
An emerging view on PLB dual site phosphorylation is that the phosphorylation status of Ser16 and Thr17 can be independently modulated by selective activation of PKA and CaMKII, and that phosphorylation of either site is able to hasten cardiac relaxation. The unique frequency-dependence of Thr17 phosphorylation makes Thr17 act as a cardiac beat-to-beat frequency-decoder, whereas PKA-mediated Ser16 phosphorylation is engaged in responses to exercise, stress, or “fight and flight” situations. When both kinase signaling pathways are concurrently activated, there is a strong synergistic effect on phosphorylation of Thr17, but not of Ser16.
Expression of Cardiac Calcium Regulatory Proteins in Atrium v
Ventricle
I. LÜ ss et al.J Mol Cell Cardiol 31, 1299–1314 (1999)
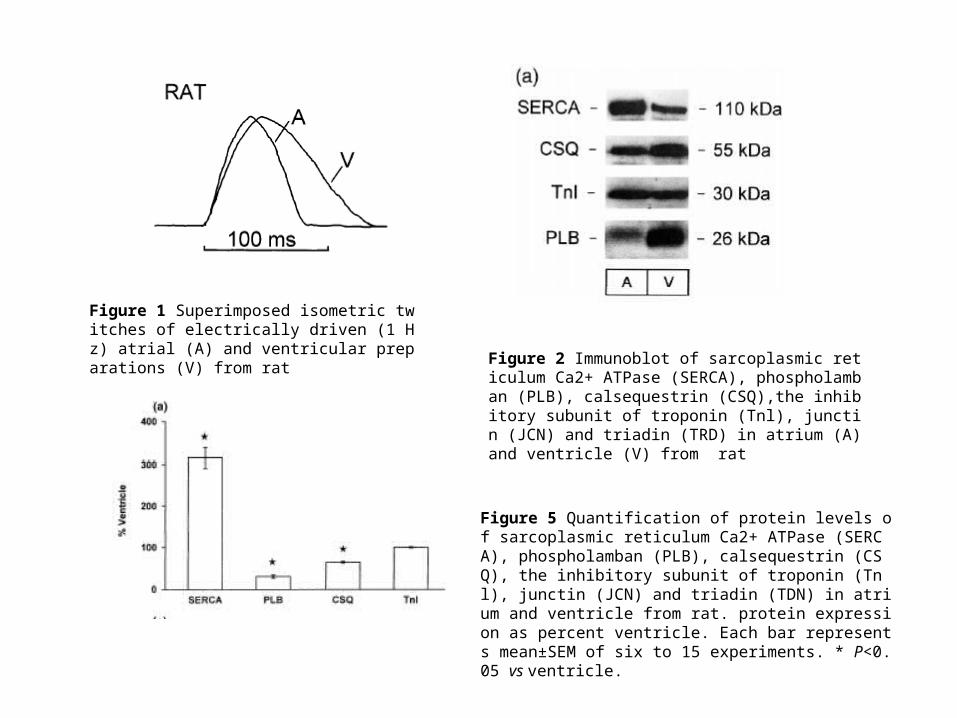
Figure 1 Superimposed isometric twitches of electrically driven (1 Hz) atrial (A) and ventricular preparations (V) from rat
Figure 2 Immunoblot of sarcoplasmic reticulum Ca2+ ATPase (SERCA), phospholamban (PLB), calsequestrin (CSQ),the inhibitory subunit of troponin (Tnl), junctin (JCN) and triadin (TRD) in atrium (A) and ventricle (V) from rat
Figure 5 Quantification of protein levels of sarcoplasmic reticulum Ca2+ ATPase (SERCA), phospholamban (PLB), calsequestrin (CSQ), the inhibitory subunit of troponin (Tnl), junctin (JCN) and triadin (TDN) in atrium and ventricle from rat. protein expression as percent ventricle. Each bar represents mean±SEM of six to 15 experiments. * P<0.05 vs ventricle.
Abnormalities of Calcium Cycling
in the Failing Heart
Is Abnormal Ca2+ Homeostasis Responsible for the Electromechanical Dysfunction of the Failing Heart?
• Many results strongly support the hypothesis that changes in cellular Ca2+ handling are a final common pathway for progressive deterioration of cardiac pump function in CHF.
• What seems clear at present is that the amount of Ca2+ released from the SR of failing human (and most animal models) myocytes is smaller than normal and that this difference is accentuated at high beating rates.A major unresolved issue is the causes of this reduced SR Ca2+ release.
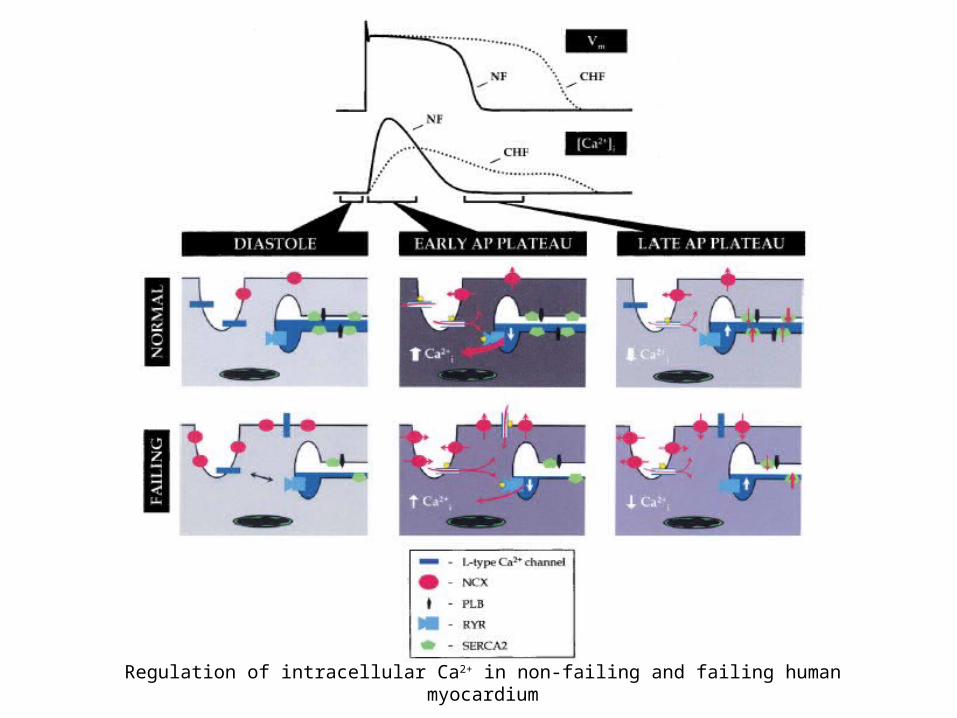
Regulation of intracellular Ca2+ in non-failing and failing human myocardium
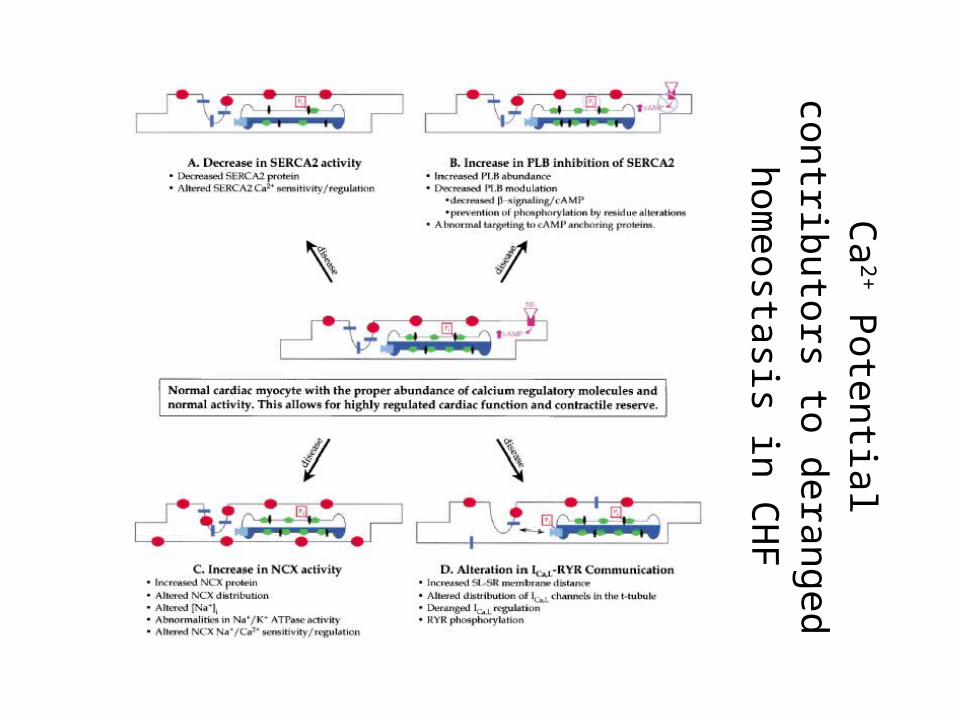
Ca
2+ P
ote
ntia
l contrib
uto
rs to
dera
ng
ed
hom
eosta
sis in
CH
F
Maybe it’s Not a Change in theAbundance of Ca2+ Regulatory
Proteins• It is unlikely that a change in the abundance of one specific Ca2
+ regulatory protein causes the deranged Ca2+ metabolism of CHF
• Activity of Ca2+ regulatory proteins could be altered in CHF because of changes in their regulation (i.e. phosphorylation is one mechanism) or because of unrecognized proteolysis or covalent modification rather than from a simple change in protein abundance.
• Alterations of Ca2+ regulatory mechanisms described in small animal models of CHF may not be predictive of associated changes in humans
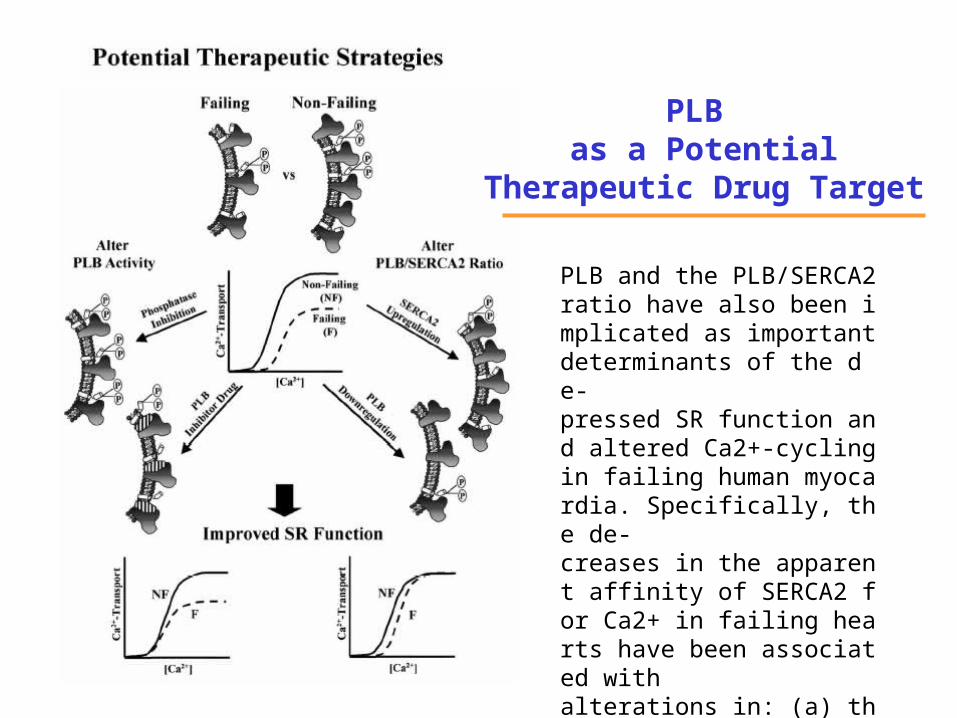
PLB and the PLB/SERCA2 ratio have also been implicated as important determinants of the de-pressed SR function and altered Ca2+-cycling in failing human myocardia. Specifically, the de-creases in the apparent affinity of SERCA2 for Ca2+ in failing hearts have been associated withalterations in: (a) the relative PLB/SERCA2 ratio; and/or (b) the phosphorylation status of PLB.
PLB as a Potential
Therapeutic Drug Target
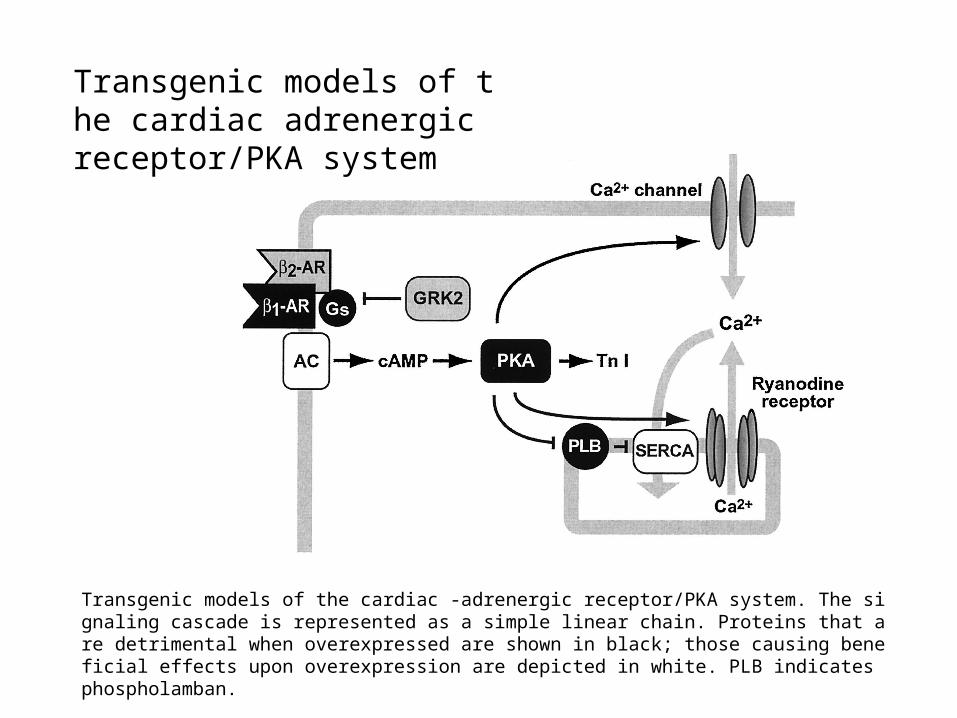
Transgenic models of the cardiac -adrenergic receptor/PKA system. The signaling cascade is represented as a simple linear chain. Proteins that are detrimental when overexpressed are shown in black; those causing beneficial effects upon overexpression are depicted in white. PLB indicates phospholamban.
Transgenic models of the cardiac adrenergic receptor/PKA system

![In Vitro Rat Myocyte Cardiotoxicity Model for …...(CANCER RESEARCH 48. 5222-5227, September 15. 1988] In Vitro Rat Myocyte Cardiotoxicity Model for Antitumor Antibiotics Using Adenosine](https://img.pdfslide.net/doc/110x75/5f801929f00b6a5fb7561c08/in-vitro-rat-myocyte-cardiotoxicity-model-for-cancer-research-48-5222-5227.jpg)