Embed Size (px)
Citation preview
Phosphorus Stress in Common Bean: Root Transcriptand Metabolic Responses1[W][OA]
Georgina Hernandez*, Mario Ramırez, Oswaldo Valdes-Lopez, Mesfin Tesfaye, Michelle A. Graham,Tomasz Czechowski2, Armin Schlereth, Maren Wandrey, Alexander Erban, Foo Cheung, Hank C. Wu,Miguel Lara, Christopher D. Town, Joachim Kopka, Michael K. Udvardi, and Carroll P. Vance
Centro de Ciencias Genomicas-Universidad Nacional Autonoma de Mexico, 66210 Cuernavaca, Mor., Mexico(G.H., M.R., O.V.-L., M.L.); Departments of Agronomy and Plant Genetics (G.H., C.P.V.), and Plant Pathology(M.T.), University of Minnesota, St. Paul, Minnesota 55108; United States Department of Agriculture,Agricultural Research Service, Plant Science Research Unit, St. Paul, Minnesota 55108 (C.P.V., M.T.); UnitedStates Department of Agriculture, Agricultural Research Service, Corn Insects and Crop Genetics ResearchUnit, Ames, Iowa 50010 (M.A.G.); Max Planck Institute for Molecular Plant Physiology, 14476 Golm, Germany(G.H., T.C., A.S., M.W., A.E., J.K., M.K.U.); The Institute for Genomic Research, Rockville, Maryland 20850(F.C., H.C.W., C.D.T.); and Samuel Robert Noble Foundation, Ardmore, Oklahoma 73401 (M.K.U.)
Phosphorus (P) is an essential element for plant growth. Crop production of common bean (Phaseolus vulgaris), the mostimportant legume for human consumption, is often limited by low P in the soil. Functional genomics were used to investigateglobal gene expression and metabolic responses of bean plants grown under P-deficient and P-sufficient conditions. P-deficientplants showed enhanced root to shoot ratio accompanied by reduced leaf area and net photosynthesis rates. Transcriptprofiling was performed through hybridization of nylon filter arrays spotted with cDNAs of 2,212 unigenes from a P deficiencyroot cDNA library. A total of 126 genes, representing different functional categories, showed significant differential expressionin response to P: 62% of these were induced in P-deficient roots. A set of 372 bean transcription factor (TF) genes, coding forproteins with Inter-Pro domains characteristic or diagnostic for TF, were identified from The Institute of Genomic Research/Dana Farber Cancer Institute Common Bean Gene Index. Using real-time reverse transcription-polymerase chain reactionanalysis, 17 TF genes were differentially expressed in P-deficient roots; four TF genes, including MYB TFs, were induced.Nonbiased metabolite profiling was used to assess the degree to which changes in gene expression in P-deficient roots affectoverall metabolism. Stress-related metabolites such as polyols accumulated in P-deficient roots as well as sugars, which are knownto be essential for P stress gene induction. Candidate genes have been identified that may contribute to root adaptation to P de-ficiency and be useful for improvement of common bean.
Common beans (Phaseolus vulgaris) are the world’smost important grain legume for direct human con-sumption; they comprise 50% of the grain legumesconsumed worldwide (Broughton et al., 2003; Grahamet al., 2003). In several countries of Central and SouthAmerica, beans are staple crops serving as the primarysource of protein in the diet. Environmental factors,such as low soil nitrogen (N) and phosphorus (P) lev-els, and acid soil conditions are important constraintsfor bean production in most of the areas where thiscrop is grown (Graham et al., 2003). In bean, symbioticN fixation rates, seed protein level, and tolerance to Pdeficiency are low in comparison to other legumes(Broughton et al., 2003).
P is an essential element required for plant growthand development. Besides N, P is the most limitingnutrient for plant growth, and it is a common limitingfactor for crop production in arable soils. Plants haveevolved general strategies for P acquisition and usein limiting environments that include: mycorrhizalsymbioses, decreased growth rate, remobilization ofinternal inorganic phosphate (Pi), modification of car-bon (C) metabolism bypassing P-requiring steps, in-creased production and secretion of phosphatases,
1 This work was supported by Consejo Nacional de Ciencia yTecnologıa, Mexico (grant no. G31751–B at Centro de CienciasGenomicas/Universidad Nacional Autonoma de Mexico [UNAM]);by Direccion General de Asuntos del Personal Academico/UNAM,Mexico (grant no. PAPIIT: IN211607 and sabbatical fellowship toG.H.); by the U.S. Department of Agriculture, Agricultural ResearchService (grant nos. CRIS 3640–21000–024–00D ‘‘Functional Genomicsfor Improving Nutrient Acquisition and Use in Legumes’’ andUSDA–FAS MX161 ‘‘Functional Genomics of Symbiotic NitrogenFixation and Root Adaptation to Phosphorus Deficiency in Phaseolus
vulgaris’’ at the University of Minnesota); and by the German Aca-demic Exchange Service (research stay fellowship to G.H.).
2 Present address: CNAP Research Laboratories, Department ofBiology (Area 7), University of York, Heslington, PO Box 373, YorkYO10 5YW, UK.
* Corresponding author; e-mail [email protected]; fax 52–777–3175581.
The author responsible for distribution of materials integral to thefindings presented in this article in accordance with the policydescribed in the Instructions for Authors (www.plantphysiol.org) is:Georgina Hernandez ([email protected]).
[W] The online version of this article contains Web-only data.[OA] Open Access articles can be viewed online without a sub-
scription.www.plantphysiol.org/cgi/doi/10.1104/pp.107.096958
752 Plant Physiology, June 2007, Vol. 144, pp. 752–767, www.plantphysiol.org � 2007 American Society of Plant Biologists www.plantphysiol.orgon February 1, 2018 - Published by Downloaded from
Copyright © 2007 American Society of Plant Biologists. All rights reserved.

exudation of organic acids, modification of root ar-chitecture, expansion of root surface area, and en-hanced expression of Pi transporters (for review, seeRaghothama, 1999; Smith, 2001; Vance et al., 2003;Plaxton, 2004).
In contrast to disease-resistance traits, where resis-tance may be due to a single dominant or recessivegene, enhancing tolerance to P stress requires multiplegenes and involves several different mechanisms. Inrecent years, macro/microarray technologies have pro-vided valuable information on global changes in geneexpression in response to P starvation in several plantspecies and organs, including white lupin (Lupinusalbus) proteoid roots (Uhde-Stone et al., 2003), rice(Oryza sativa) leaves and roots (Wasaki et al., 2003, 2006),and Arabidopsis (Arabidopsis thaliana) roots, shoots,and leaves (Hammond et al., 2003; Wu et al., 2003;Misson et al., 2005; Muller et al., 2007).
Although macro/microarray studies have identifiedgenes differentially regulated by P starvation, littleis known about the regulation of gene expressionchanges. Transcription factors (TFs) are master controlproteins in all living cells, regulating gene expressionin response to different stimuli (Riechmann, 2002;Czechowski et al., 2004). Chen et al. (2002) reportedthat Arabidopsis TF gene expression is regulated in acell type- or tissue-specific manner and in response tospecific environmental biotic and abiotic stresses.Muller et al. (2007) reported that specific TFs areinduced in Arabidopsis P-starved leaves. These studieshave opened new possibilities to elucidate the sensing,signaling, and regulatory pathways of the P deficiencyresponse in plants.
Despite the agronomic importance of beans, there islittle information on global gene expression of beantissues in response to P deficiency. In previous work,we attempted to identify candidate P stress-inducedgenes in beans using an in silico approach that clus-tered bean ESTs with previously identified P stress-induced genes across three other legume species andArabidopsis (Graham et al., 2006). Here, we undertooka three-step approach to identify genes important toP deficiency in common bean. First, macroarray tech-nology was used for transcript profiling of P-deficientbean roots with the aim of identifying those genes,gene networks, and signaling pathways that are im-portant for the plant response to P deficiency. Second,we identified bean TFs and used quantitative reversetranscription (RT)-PCR to assess TF gene expression inP-deficient bean roots, with the aim of identifying TFsthat regulate the differential expression of genes dur-ing P stress. Third, we performed nonbiased metabo-lite profiling of bean roots using gas chromatographycoupled to mass spectrometry (GC-MS) to correlatemetabolic differentiation orchestrated by global changesin gene transcription as response to P starvation. Theoverall goal of this research is to identify candidategenes that may be useful to bean improvement andthat will contribute to understanding common beanadaptation to P deficiency.
RESULTS
Phenotypic Characterization
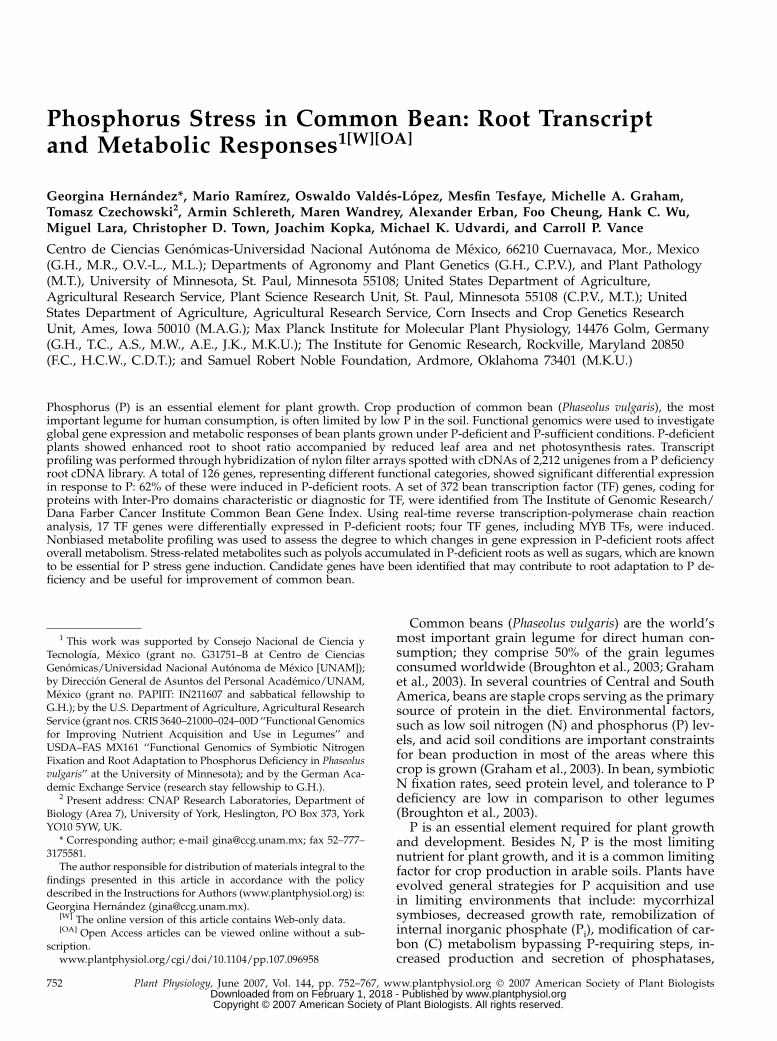
The long-term P deficiency treatment used in thiswork consisted of growing common bean plants inpots under controlled environments for 3 weeks using200-fold lower phosphate concentration as comparedto P-sufficient (1P) control plants. Control plants ac-cumulated higher concentrations of soluble Pi. Pi con-tent in 1P leaves was 2.6- and 13-fold higher than in1P stems and 1P roots, respectively (Fig. 1A). Com-pared to 1P plants, a drastic reduction (2–23-foldlower) in Pi content was observed in plants grownunder P-deficient conditions (Fig. 1A). Pi content inP-deficient plants was similar in leaf, stem, and roottissues (Fig. 1A). Typical P stress responses were ob-served (Raghothama, 1999; Gilbert et al., 2000; Maet al., 2003), including a 4-fold reduction in leaf areaand 1.5-fold higher dry weight root to shoot ratio (Fig.1, B and C). The latter response was due to arrestedshoot growth and proliferation of lateral roots and roothairs of P-deficient plants.
Content of photosynthetic pigments such as chloro-phyll a and b and carotenes was similar in plants under2P and 1P treatments (data not shown). However,P-deficient plants showed significant inhibition of netphotosynthetic rate (Pn) regardless of internal CO2 (Ci)concentration (Fig. 1D). In contrast, P-deficient plantsshowed 50% lower Pn at ambient CO2 concentration(350 mmol mol21), reflecting lower carboxylation effi-ciency. In addition, P-stressed plants showed 60% ofthe maximum Pn of 1P plants, which is consistentwith changes associated with increasingly larger limi-tations of Pn by Rubisco and ribulose 1,5-bisphosphateregeneration as leaf Pi declines (Fig. 1D). However,stomatal conductance and resistance was not altered inP-deficient plants (data not shown).
Macroarray Analysis of Root Response to P Deficiency
Macroarray analyses were performed to evaluategene expression from P-deficient roots of bean plantsas compared to control P-sufficient roots. Nylon filterarrays were spotted with ESTs that represented a 2,212bean unigene set consisting of 1,194 singletons and1,018 contigs derived from the 2P roots cDNA libraryfrom bean ‘Negro Jamapa 81’ previously reported(Ramırez et al., 2005; Graham et al., 2006).
Total RNA was isolated from plants grown undersimilar conditions as described for each treatment (2Pand 1P). Ten nylon filter arrays were hybridized withfirst-strand cDNA synthesized from four independentsources of total RNA. From the 10 hybridizations, sixreplicates with high determination coefficients (r2 $0.8) were chosen for analysis of differential gene ex-pression. A total of 126 cDNAs showed significant(P # 0.05) differential expression (Tables I and II).
Tables I and II list the genes that were significantlyinduced or repressed, respectively, in P-deficient roots.To aid in annotation, cDNAs were assigned to tentative
Phosphorus Deficiency in Common Bean Roots
Plant Physiol. Vol. 144, 2007 753 www.plantphysiol.orgon February 1, 2018 - Published by Downloaded from
Copyright © 2007 American Society of Plant Biologists. All rights reserved.
consensus sequences (TCs; Institute of Genomic Re-search [TIGR]/Dana Farber Cancer Institute [DFCI]Common Bean Gene Index, v. 1.0) when possible. TheTC or EST sequences were then compared (BLASTX,E , 10–4; Altschul et al., 1997) to the Uniprot proteindatabase (Apweiler et al., 2004) to assign putative func-tion. Based on information available in the literature,sequences were then assigned to functional categories.
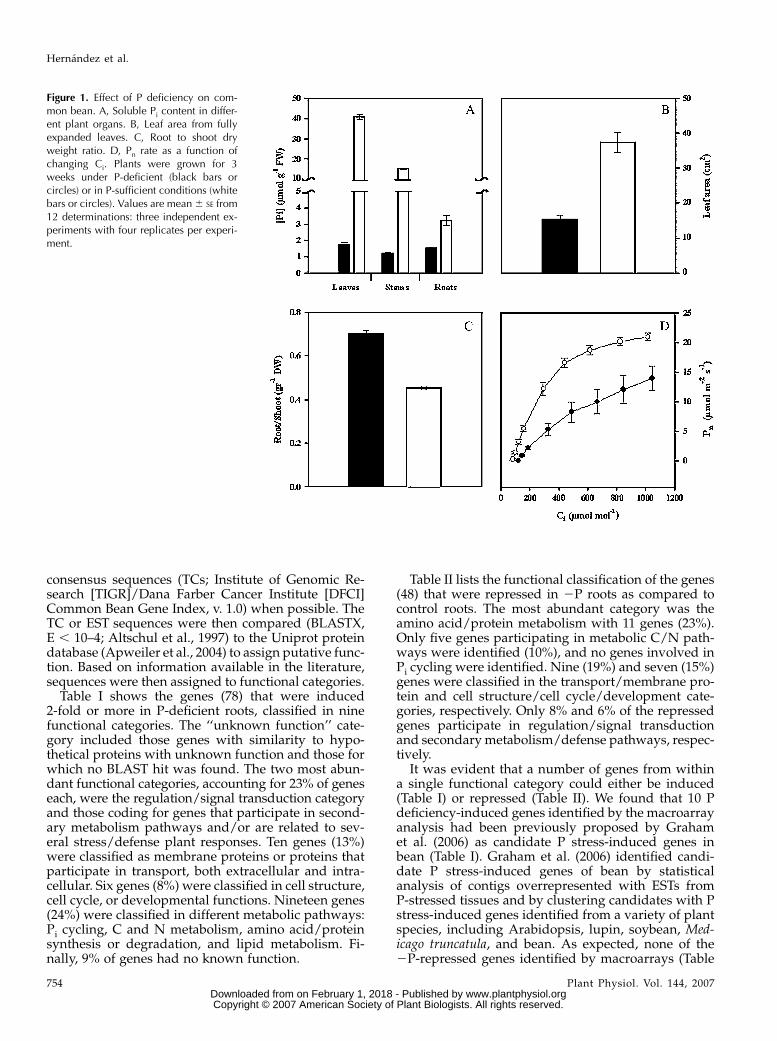
Table I shows the genes (78) that were induced2-fold or more in P-deficient roots, classified in ninefunctional categories. The ‘‘unknown function’’ cate-gory included those genes with similarity to hypo-thetical proteins with unknown function and those forwhich no BLAST hit was found. The two most abun-dant functional categories, accounting for 23% of geneseach, were the regulation/signal transduction categoryand those coding for genes that participate in second-ary metabolism pathways and/or are related to sev-eral stress/defense plant responses. Ten genes (13%)were classified as membrane proteins or proteins thatparticipate in transport, both extracellular and intra-cellular. Six genes (8%) were classified in cell structure,cell cycle, or developmental functions. Nineteen genes(24%) were classified in different metabolic pathways:Pi cycling, C and N metabolism, amino acid/proteinsynthesis or degradation, and lipid metabolism. Fi-nally, 9% of genes had no known function.
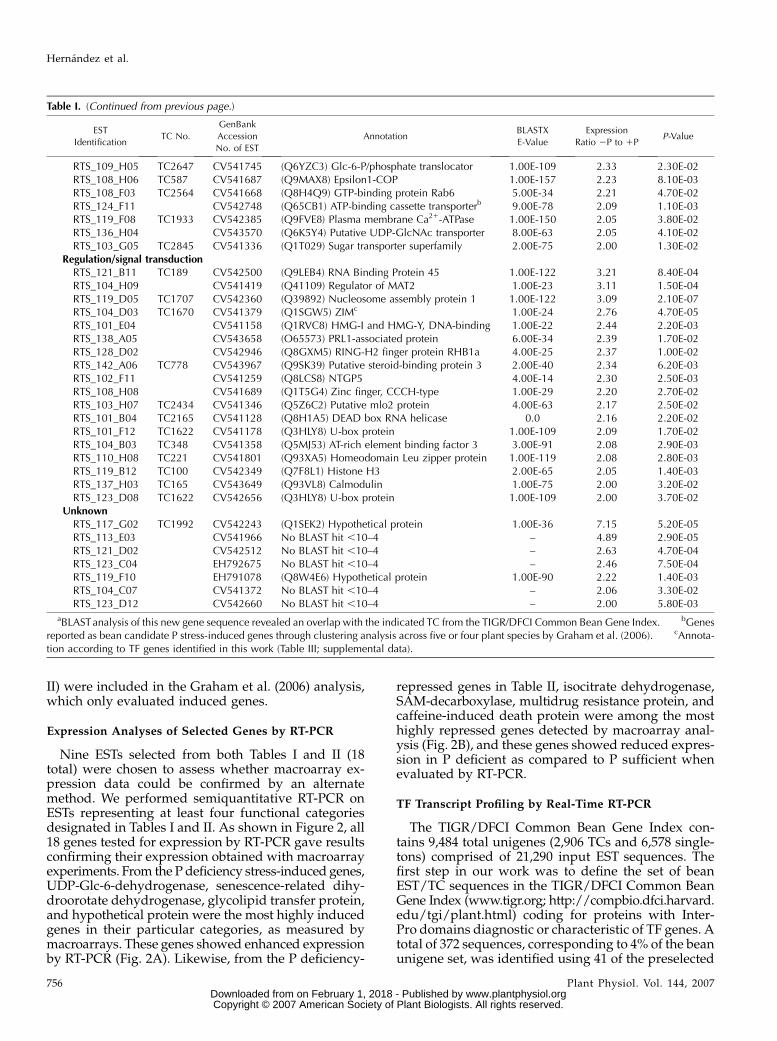
Table II lists the functional classification of the genes(48) that were repressed in 2P roots as compared tocontrol roots. The most abundant category was theamino acid/protein metabolism with 11 genes (23%).Only five genes participating in metabolic C/N path-ways were identified (10%), and no genes involved inPi cycling were identified. Nine (19%) and seven (15%)genes were classified in the transport/membrane pro-tein and cell structure/cell cycle/development cate-gories, respectively. Only 8% and 6% of the repressedgenes participate in regulation/signal transductionand secondary metabolism/defense pathways, respec-tively.
It was evident that a number of genes from withina single functional category could either be induced(Table I) or repressed (Table II). We found that 10 Pdeficiency-induced genes identified by the macroarrayanalysis had been previously proposed by Grahamet al. (2006) as candidate P stress-induced genes inbean (Table I). Graham et al. (2006) identified candi-date P stress-induced genes of bean by statisticalanalysis of contigs overrepresented with ESTs fromP-stressed tissues and by clustering candidates with Pstress-induced genes identified from a variety of plantspecies, including Arabidopsis, lupin, soybean, Med-icago truncatula, and bean. As expected, none of the2P-repressed genes identified by macroarrays (Table
Figure 1. Effect of P deficiency on com-mon bean. A, Soluble Pi content in differ-ent plant organs. B, Leaf area from fullyexpanded leaves. C, Root to shoot dryweight ratio. D, Pn rate as a function ofchanging Ci. Plants were grown for 3weeks under P-deficient (black bars orcircles) or in P-sufficient conditions (whitebars or circles). Values are mean 6 SE from12 determinations: three independent ex-periments with four replicates per experi-ment.
Hernandez et al.
754 Plant Physiol. Vol. 144, 2007 www.plantphysiol.orgon February 1, 2018 - Published by Downloaded from
Copyright © 2007 American Society of Plant Biologists. All rights reserved.

Table I. Genes induced in roots of P-deficient plants identified by macroarray analysis
Functional categories are in bold. TC No., Tentative consensus sequence assignment (TIGR/DFCI Common Bean Gene Index, version 1.0); blankcells correspond to singletons with no TC number assigned.
EST
IdentificationTC No.
GenBank
Accession
No. of EST
AnnotationBLASTX
E-Value
Expression
Ratio 2P to 1PP-Value
Pi cyclingRTS_113_H08 EH791066 (Q84MA2) Type I inositol-1,4,5-trisphosphate
5-phosphatase4.00E-10 2.59 9.8E-04
RTS_145_F08 TC1447 CV544205 (Q6J5M7) Purple acid phosphatase 1 1.00E-100 2.10 2.2E-02RTS_105_G04 CV541472 (Q9LDA7) Protein phosphatase type 2C 1.00E-65 2.12 4.8E-02
C/N metabolismRTS_101_F08 TC1804 CV541174 (Q96558) UDP-Glc-6-dehydrogenase 1.00E-65 3.63 1.7E-07RTS_122_G12 TC733 CV542619 (Q8S532) Cytosolic aldehyde dehydrogenase RF2C 3.00E-48 3.48 7.1E-04RTS_104_C06 TC1280 CV541371 (P39866) Nitrate reductase 1.00E-122 2.65 2.5E-04RTS_117_F10 CV542239 (Q75GR9) Inosine-uridine preferring nucleoside
hydrolase3.00E-78 2.28 3.8E-03
Amino acid/protein metabolismRTS_104_E06 CV541391 (Q8LSY7) Phosphoribosyltransferase 3.00E-19 6.18 3.60E-05RTS_117_A02 (TC1704)a EH791074 (Q8LJW0) 40S Ribosomal S4 protein 1.00E-126 2.43 7.30E-04RTS_108_F01 TC492 CV541666 (Q7DLS1) Proteasome subunit-b type 1.00E-135 2.41 3.20E-03RTS_120_H04 TC486 CV542476 (P29144) Tripeptidyl-peptidase 2 2.00E-14 2.39 5.00E-02RTS_101_D04 TC250 CV541149 (Q8LKU3) 60S Ribosomal protein 1.00E-103 2.34 6.80E-04RTS_117_A07 (TC1704)a EH792674 (Q8LJW0) 40S Ribosomal S4 protein 1.00E-126 2.30 3.30E-04RTS_135_E01 TC112 CV543464 (Q41119) Cyclophilin 1.00E-88 2.25 1.70E-03RTS_123_H06 CV542691 (Q9ZNS5) Ribosomal protein S28 4.00E-19 2.20 5.20E-03RTS_121_C06 TC1703 CV542506 (Q5YJR8) 60S Acidic ribosomal protein 1.00E-23 2.08 3.80E-03RTS_101_B01 TC85 CV541126 (Q8W3Y4) S-adenosyl-methionine synthetase 0.0 2.00 5.70E-03
Lipid metabolismRTS_110_A04 TC1739 CV541751 (Q69JE2) Putative CLB1 protein 0.0 2.51 4.2E-02RTS_127_F12 CV542902 (Q8LG07) GlcNAc-1-P-transferase 2.00E-79 2.21 1.2E-03
Cell structure/cell cycle/developmentRTS_109_B06 EH792671 (Q9LVI9) Senescence-related dihydroorotate
dehydrogenase1.00E-50 5.11 3.30E-08
RTS_125_D07 TC63 CV542788 (Q944T2) Translationally controlled tumor protein 3.00E-77 3.72 7.60E-04RTS_127_C08 (TC1617)a EH792676 (Q41125) Pro-rich, 14-kD protein 1.00E-50 2.43 7.10E-05RTS_137_A05 TC114 CV543578 (Q41707) Extensin class 1 protein precursor 1.00E-134 2.40 9.10E-05RTS_119_E03 TC254 CV542369 (Q9XHD5) B12D/Leaf senescence protein 4.00E-35 2.21 7.60E-04RTS_136_B08 TC415 CV543516 (Q09085) Hydroxy-Pro-rich glycoprotein 2.00E-80 2.10 8.80E-04
Stress/defense/secondary metabolismRTS_138_E12 TC1903 CV543709 (Q6K1Q5) Glycolipid transfer protein-like 2.00E-82 4.62 2.10E-05RTS_101_C10 TC280 CV541144 (Q2KTE6) ACC oxidase 1.00E-160 3.59 1.10E-03RTS_107_E03 TC64 CV541595 (P25985) Pathogenesis-related protein (PvPR1)b 2.00E-82 3.00 5.40E-05RTS_135_E10 TC459 CV543472 (Q9C939) Putative oxidoreductaseb 1.00E-59 2.63 4.40E-04RTS_117_E09 TC2562 CV542227 (Q700B1) Noncyanogenic b-glucosidaseb 9.00E-41 2.54 2.30E-05RTS_113_H03 TC1260 CV541991 (Q2LAL0) Cyt P450 monooxygenaseb 1.00E-72 2.52 1.80E-03RTS_111_F07 TC2443 CV541849 (Q2LAL4) Cyt P450 monooxygenaseb 1.00E-56 2.49 1.50E-03RTS_103_E06 TC1890 CV541320 (Q9SWS4) Ripening-related protein/(O65884)
MLP protein1.00E-71 2.39 2.10E-03
RTS_136_E10 TC397 CV543546 (O22443) Seed coat peroxidase precursorb 1.00E-103 2.31 3.30E-03RTS_113_H10 CV541995 (P32292) Indole-3-acetic acid-induced protein ARG2 5.00E-39 2.28 2.60E-03RTS_119_F09 TC146 CV542386 (O48561) Catalase-4 0.0 2.27 1.30E-04RTS_102_H03 TC2059 CV541272 (O23961) Peroxidase precursorb 1.00E-119 2.26 3.10E-02RTS_135_B05 CV543440 (Q1SGR7) TIR; Disease resistance protein 1.00E-49 2.18 4.50E-03RTS_138_A10 TC257 CV543662 (P07218) Phe ammonia-lyase 0.0 2.18 2.80E-03RTS_108_H02 CV541683 (Q4QTI9) Pathogenesis-related 10 protein 1.00E-15 2.15 2.10E-02RTS_125_H01 CV542814 (Q1SGA8) 2OG-Fe(II) oxygenase 2.00E-38 2.12 2.90E-02RTS_118_D09 CV542294 (Q8LJ95) NBS-LRR resistance protein RGH1-like 1.00E-06 2.04 1.40E-02RTS_105_D07 TC1309 CV541452 (O65152) Cinnamyl alcohol dehydrogenaseb 1.00E-115 2.04 3.80E-03
Transport/membrane proteinsRTS_113_A06 CV541934 (Q1SI67) Dynamin central region 1.00E-43 3.96 5.00E-04RTS_108_A08 TC220 CV541629 (Q506K0) Putative aquaporinb 1.00E-164 2.91 2.70E-05RTS_133_A05 TC2513 CV543276 (O65744) GDP dissociation inhibitor 4.00E-22 2.48 2.80E-02
(Table continues on following page.)
Phosphorus Deficiency in Common Bean Roots
Plant Physiol. Vol. 144, 2007 755 www.plantphysiol.orgon February 1, 2018 - Published by Downloaded from
Copyright © 2007 American Society of Plant Biologists. All rights reserved.
II) were included in the Graham et al. (2006) analysis,which only evaluated induced genes.
Expression Analyses of Selected Genes by RT-PCR
Nine ESTs selected from both Tables I and II (18total) were chosen to assess whether macroarray ex-pression data could be confirmed by an alternatemethod. We performed semiquantitative RT-PCR onESTs representing at least four functional categoriesdesignated in Tables I and II. As shown in Figure 2, all18 genes tested for expression by RT-PCR gave resultsconfirming their expression obtained with macroarrayexperiments. From the P deficiency stress-induced genes,UDP-Glc-6-dehydrogenase, senescence-related dihy-droorotate dehydrogenase, glycolipid transfer protein,and hypothetical protein were the most highly inducedgenes in their particular categories, as measured bymacroarrays. These genes showed enhanced expressionby RT-PCR (Fig. 2A). Likewise, from the P deficiency-
repressed genes in Table II, isocitrate dehydrogenase,SAM-decarboxylase, multidrug resistance protein, andcaffeine-induced death protein were among the mosthighly repressed genes detected by macroarray anal-ysis (Fig. 2B), and these genes showed reduced expres-sion in P deficient as compared to P sufficient whenevaluated by RT-PCR.
TF Transcript Profiling by Real-Time RT-PCR
The TIGR/DFCI Common Bean Gene Index con-tains 9,484 total unigenes (2,906 TCs and 6,578 single-tons) comprised of 21,290 input EST sequences. Thefirst step in our work was to define the set of beanEST/TC sequences in the TIGR/DFCI Common BeanGene Index (www.tigr.org; http://compbio.dfci.harvard.edu/tgi/plant.html) coding for proteins with Inter-Pro domains diagnostic or characteristic of TF genes. Atotal of 372 sequences, corresponding to 4% of the beanunigene set, was identified using 41 of the preselected
Table I. (Continued from previous page.)
EST
IdentificationTC No.
GenBank
Accession
No. of EST
AnnotationBLASTX
E-Value
Expression
Ratio 2P to 1PP-Value
RTS_109_H05 TC2647 CV541745 (Q6YZC3) Glc-6-P/phosphate translocator 1.00E-109 2.33 2.30E-02RTS_108_H06 TC587 CV541687 (Q9MAX8) Epsilon1-COP 1.00E-157 2.23 8.10E-03RTS_108_F03 TC2564 CV541668 (Q8H4Q9) GTP-binding protein Rab6 5.00E-34 2.21 4.70E-02RTS_124_F11 CV542748 (Q65CB1) ATP-binding cassette transporterb 9.00E-78 2.09 1.10E-03RTS_119_F08 TC1933 CV542385 (Q9FVE8) Plasma membrane Ca21-ATPase 1.00E-150 2.05 3.80E-02RTS_136_H04 CV543570 (Q6K5Y4) Putative UDP-GlcNAc transporter 8.00E-63 2.05 4.10E-02RTS_103_G05 TC2845 CV541336 (Q1T029) Sugar transporter superfamily 2.00E-75 2.00 1.30E-02
Regulation/signal transductionRTS_121_B11 TC189 CV542500 (Q9LEB4) RNA Binding Protein 45 1.00E-122 3.21 8.40E-04RTS_104_H09 CV541419 (Q41109) Regulator of MAT2 1.00E-23 3.11 1.50E-04RTS_119_D05 TC1707 CV542360 (Q39892) Nucleosome assembly protein 1 1.00E-122 3.09 2.10E-07RTS_104_D03 TC1670 CV541379 (Q1SGW5) ZIMc 1.00E-24 2.76 4.70E-05RTS_101_E04 CV541158 (Q1RVC8) HMG-I and HMG-Y, DNA-binding 1.00E-22 2.44 2.20E-03RTS_138_A05 CV543658 (O65573) PRL1-associated protein 6.00E-34 2.39 1.70E-02RTS_128_D02 CV542946 (Q8GXM5) RING-H2 finger protein RHB1a 4.00E-25 2.37 1.00E-02RTS_142_A06 TC778 CV543967 (Q9SK39) Putative steroid-binding protein 3 2.00E-40 2.34 6.20E-03RTS_102_F11 CV541259 (Q8LCS8) NTGP5 4.00E-14 2.30 2.50E-03RTS_108_H08 CV541689 (Q1T5G4) Zinc finger, CCCH-type 1.00E-29 2.20 2.70E-02RTS_103_H07 TC2434 CV541346 (Q5Z6C2) Putative mlo2 protein 4.00E-63 2.17 2.50E-02RTS_101_B04 TC2165 CV541128 (Q8H1A5) DEAD box RNA helicase 0.0 2.16 2.20E-02RTS_101_F12 TC1622 CV541178 (Q3HLY8) U-box protein 1.00E-109 2.09 1.70E-02RTS_104_B03 TC348 CV541358 (Q5MJ53) AT-rich element binding factor 3 3.00E-91 2.08 2.90E-03RTS_110_H08 TC221 CV541801 (Q93XA5) Homeodomain Leu zipper protein 1.00E-119 2.08 2.80E-03RTS_119_B12 TC100 CV542349 (Q7F8L1) Histone H3 2.00E-65 2.05 1.40E-03RTS_137_H03 TC165 CV543649 (Q93VL8) Calmodulin 1.00E-75 2.00 3.20E-02RTS_123_D08 TC1622 CV542656 (Q3HLY8) U-box protein 1.00E-109 2.00 3.70E-02
UnknownRTS_117_G02 TC1992 CV542243 (Q1SEK2) Hypothetical protein 1.00E-36 7.15 5.20E-05RTS_113_E03 CV541966 No BLAST hit ,10–4 – 4.89 2.90E-05RTS_121_D02 CV542512 No BLAST hit ,10–4 – 2.63 4.70E-04RTS_123_C04 EH792675 No BLAST hit ,10–4 – 2.46 7.50E-04RTS_119_F10 EH791078 (Q8W4E6) Hypothetical protein 1.00E-90 2.22 1.40E-03RTS_104_C07 CV541372 No BLAST hit ,10–4 – 2.06 3.30E-02RTS_123_D12 CV542660 No BLAST hit ,10–4 – 2.00 5.80E-03
aBLASTanalysis of this new gene sequence revealed an overlap with the indicated TC from the TIGR/DFCI Common Bean Gene Index. bGenesreported as bean candidate P stress-induced genes through clustering analysis across five or four plant species by Graham et al. (2006). cAnnota-tion according to TF genes identified in this work (Table III; supplemental data).
Hernandez et al.
756 Plant Physiol. Vol. 144, 2007 www.plantphysiol.orgon February 1, 2018 - Published by Downloaded from
Copyright © 2007 American Society of Plant Biologists. All rights reserved.
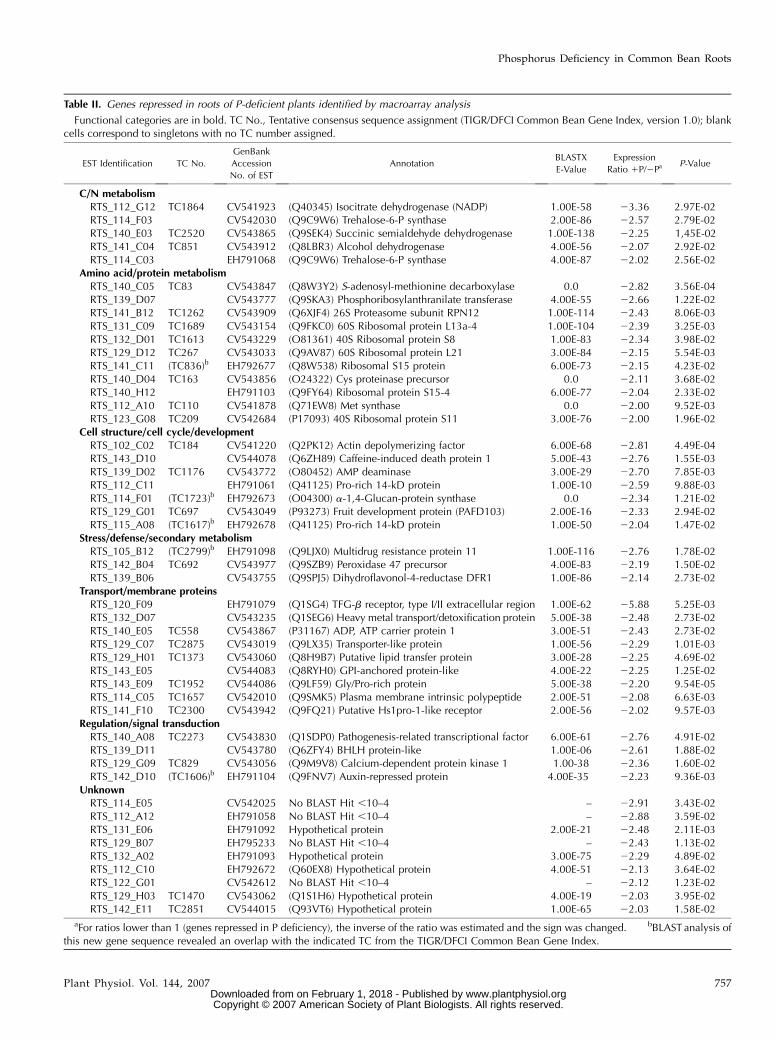
Table II. Genes repressed in roots of P-deficient plants identified by macroarray analysis
Functional categories are in bold. TC No., Tentative consensus sequence assignment (TIGR/DFCI Common Bean Gene Index, version 1.0); blankcells correspond to singletons with no TC number assigned.
EST Identification TC No.
GenBank
Accession
No. of EST
AnnotationBLASTX
E-Value
Expression
Ratio 1P/2Pa P-Value
C/N metabolismRTS_112_G12 TC1864 CV541923 (Q40345) Isocitrate dehydrogenase (NADP) 1.00E-58 23.36 2.97E-02RTS_114_F03 CV542030 (Q9C9W6) Trehalose-6-P synthase 2.00E-86 22.57 2.79E-02RTS_140_E03 TC2520 CV543865 (Q9SEK4) Succinic semialdehyde dehydrogenase 1.00E-138 22.25 1,45E-02RTS_141_C04 TC851 CV543912 (Q8LBR3) Alcohol dehydrogenase 4.00E-56 22.07 2.92E-02RTS_114_C03 EH791068 (Q9C9W6) Trehalose-6-P synthase 4.00E-87 22.02 2.56E-02
Amino acid/protein metabolismRTS_140_C05 TC83 CV543847 (Q8W3Y2) S-adenosyl-methionine decarboxylase 0.0 22.82 3.56E-04RTS_139_D07 CV543777 (Q9SKA3) Phosphoribosylanthranilate transferase 4.00E-55 22.66 1.22E-02RTS_141_B12 TC1262 CV543909 (Q6XJF4) 26S Proteasome subunit RPN12 1.00E-114 22.43 8.06E-03RTS_131_C09 TC1689 CV543154 (Q9FKC0) 60S Ribosomal protein L13a-4 1.00E-104 22.39 3.25E-03RTS_132_D01 TC1613 CV543229 (O81361) 40S Ribosomal protein S8 1.00E-83 22.34 3.98E-02RTS_129_D12 TC267 CV543033 (Q9AV87) 60S Ribosomal protein L21 3.00E-84 22.15 5.54E-03RTS_141_C11 (TC836)b EH792677 (Q8W538) Ribosomal S15 protein 6.00E-73 22.15 4.23E-02RTS_140_D04 TC163 CV543856 (O24322) Cys proteinase precursor 0.0 22.11 3.68E-02RTS_140_H12 EH791103 (Q9FY64) Ribosomal protein S15-4 6.00E-77 22.04 2.33E-02RTS_112_A10 TC110 CV541878 (Q71EW8) Met synthase 0.0 22.00 9.52E-03RTS_123_G08 TC209 CV542684 (P17093) 40S Ribosomal protein S11 3.00E-76 22.00 1.96E-02
Cell structure/cell cycle/developmentRTS_102_C02 TC184 CV541220 (Q2PK12) Actin depolymerizing factor 6.00E-68 22.81 4.49E-04RTS_143_D10 CV544078 (Q6ZH89) Caffeine-induced death protein 1 5.00E-43 22.76 1.55E-03RTS_139_D02 TC1176 CV543772 (O80452) AMP deaminase 3.00E-29 22.70 7.85E-03RTS_112_C11 EH791061 (Q41125) Pro-rich 14-kD protein 1.00E-10 22.59 9.88E-03RTS_114_F01 (TC1723)b EH792673 (O04300) a-1,4-Glucan-protein synthase 0.0 22.34 1.21E-02RTS_129_G01 TC697 CV543049 (P93273) Fruit development protein (PAFD103) 2.00E-16 22.33 2.94E-02RTS_115_A08 (TC1617)b EH792678 (Q41125) Pro-rich 14-kD protein 1.00E-50 22.04 1.47E-02
Stress/defense/secondary metabolismRTS_105_B12 (TC2799)b EH791098 (Q9LJX0) Multidrug resistance protein 11 1.00E-116 22.76 1.78E-02RTS_142_B04 TC692 CV543977 (Q9SZB9) Peroxidase 47 precursor 4.00E-83 22.19 1.50E-02RTS_139_B06 CV543755 (Q9SPJ5) Dihydroflavonol-4-reductase DFR1 1.00E-86 22.14 2.73E-02
Transport/membrane proteinsRTS_120_F09 EH791079 (Q1SG4) TFG-b receptor, type I/II extracellular region 1.00E-62 25.88 5.25E-03RTS_132_D07 CV543235 (Q1SEG6) Heavy metal transport/detoxification protein 5.00E-38 22.48 2.73E-02RTS_140_E05 TC558 CV543867 (P31167) ADP, ATP carrier protein 1 3.00E-51 22.43 2.73E-02RTS_129_C07 TC2875 CV543019 (Q9LX35) Transporter-like protein 1.00E-56 22.29 1.01E-03RTS_129_H01 TC1373 CV543060 (Q8H9B7) Putative lipid transfer protein 3.00E-28 22.25 4.69E-02RTS_143_E05 CV544083 (Q8RYH0) GPI-anchored protein-like 4.00E-22 22.25 1.25E-02RTS_143_E09 TC1952 CV544086 (Q9LF59) Gly/Pro-rich protein 5.00E-38 22.20 9.54E-05RTS_114_C05 TC1657 CV542010 (Q9SMK5) Plasma membrane intrinsic polypeptide 2.00E-51 22.08 6.63E-03RTS_141_F10 TC2300 CV543942 (Q9FQ21) Putative Hs1pro-1-like receptor 2.00E-56 22.02 9.57E-03
Regulation/signal transductionRTS_140_A08 TC2273 CV543830 (Q1SDP0) Pathogenesis-related transcriptional factor 6.00E-61 22.76 4.91E-02RTS_139_D11 CV543780 (Q6ZFY4) BHLH protein-like 1.00E-06 22.61 1.88E-02RTS_129_G09 TC829 CV543056 (Q9M9V8) Calcium-dependent protein kinase 1 1.00-38 22.36 1.60E-02RTS_142_D10 (TC1606)b EH791104 (Q9FNV7) Auxin-repressed protein 4.00E-35 22.23 9.36E-03
UnknownRTS_114_E05 CV542025 No BLAST Hit ,10–4 – 22.91 3.43E-02RTS_112_A12 EH791058 No BLAST Hit ,10–4 – 22.88 3.59E-02RTS_131_E06 EH791092 Hypothetical protein 2.00E-21 22.48 2.11E-03RTS_129_B07 EH795233 No BLAST Hit ,10–4 – 22.43 1.13E-02RTS_132_A02 EH791093 Hypothetical protein 3.00E-75 22.29 4.89E-02RTS_112_C10 EH792672 (Q60EX8) Hypothetical protein 4.00E-51 22.13 3.64E-02RTS_122_G01 CV542612 No BLAST Hit ,10–4 – 22.12 1.23E-02RTS_129_H03 TC1470 CV543062 (Q1S1H6) Hypothetical protein 4.00E-19 22.03 3.95E-02RTS_142_E11 TC2851 CV544015 (Q93VT6) Hypothetical protein 1.00E-65 22.03 1.58E-02
aFor ratios lower than 1 (genes repressed in P deficiency), the inverse of the ratio was estimated and the sign was changed. bBLAST analysis ofthis new gene sequence revealed an overlap with the indicated TC from the TIGR/DFCI Common Bean Gene Index.
Phosphorus Deficiency in Common Bean Roots
Plant Physiol. Vol. 144, 2007 757 www.plantphysiol.orgon February 1, 2018 - Published by Downloaded from
Copyright © 2007 American Society of Plant Biologists. All rights reserved.

TF diagnostic Inter-Pro domains. This constitutes thewhole set of TF genes used for our real-time RT-PCRanalyses. Most likely, some of the genes are not trueTFs; however, they were included because they con-tain DNA-binding and other domains that are char-acteristic of TF proteins. Based on the classificationof Arabidopsis TF gene families (Riechmann, 2002;http://range.gsc.riken.ip/rart; http://daft.cbi.pku.edu.cn), bean TF genes were grouped into 47 families (Fig. 3).
Although TF classes in bean were restricted to thoseidentified from cDNA libraries, a general correspon-dence was found between the most abundant TF fam-ilies in beans and those from Arabidopsis (Riechmann,2002), such as the MYB superfamily with 46 gene mem-bers (12%), C2H2(Zn) (10%), and AP2/EREBP (8%;Fig. 3). However, in our dataset, we found that CCAATand bHLH families were equally abundant in our beanTF gene set (Fig. 3), while in Arabidopsis the bHLH
Figure 2. Verification of macroarray re-sults by RT-PCR analysis. Selected genesidentified as induced (A) or repressed (B)in P-deficient roots were evaluated. Theubiquitin gene was included as control foruniform RT-PCR conditions (bottom). Theprimer sequences and reaction conditionsused are presented in Table V.
Figure 3. Classification of common bean TFgenes in different families. The TF genes (372)were grouped in 47 different families with differ-ent Inter-Pro domains according to TF gene fam-ilies reported for Arabidopsis (Riechmann, 2002;http://range.gsc.riken.ip/rart; http://daft.cbi.pku.edu.cn). The identity of each TF gene family with threeor more members is shown. Twelve gene familieswith two members each (2/TF fam) are: TAZ,MBF1, ARID, Nin-like, Dof-type C2C2(Zn), S1Fa-like, YABBY C2C2(Zn), BES1, K-box, Histone-like/CBFA_NFYB_topo, Auxin_resp, and Lambda_DNA_bd. Eleven gene families with one membereach (1/TF fam) are: FHA, LIM-domain, E2F/DP,Jumonji JmjN, SBP, SHAQKYF_MYB_bd, ZF_HD,SRS, POX, EIL, and Euk_TF_DNA_bd.
Hernandez et al.
758 Plant Physiol. Vol. 144, 2007 www.plantphysiol.orgon February 1, 2018 - Published by Downloaded from
Copyright © 2007 American Society of Plant Biologists. All rights reserved.

family is around 3-fold more abundant than theCCAAT family (Riechmann, 2002). Other families ofbean TF genes consisted of between one and 12 genes(Fig. 3).
We performed TF profiling based on real-time RT-PCR to determine differential expression of bean TFgenes that might be involved in gene expression re-sponse to P deficiency. There were three biological rep-licates of 2P- and 1P-treated roots. In each RT-PCRrun, the phosphatase gene (TC201) was included asa P-deficient marker. This marker gene, known to beinduced in P-deficient roots (Ramırez et al., 2005),showed an average expression ratio 2P to 1P of 18.48(P 5 0.005), confirming the P-deficient status of theroots. From the 372 TF genes, 46 (12%) were differen-tially expressed (P # 0.05) in 2P-treated roots, 10 wereinduced, and the rest were repressed in 2P roots. TableIII shows those TF genes that were induced (four) orrepressed (13) 2-fold or more in P-deficient roots. Toannotate the P-regulated TFs, the TC sequences wereblasted (BLASTX, E , 1024; Altschul et al., 1997)against the Uniprot protein database (Apweiler et al.,2004; Table III).
Most of the TF genes induced in 2P roots belong tothe MYB superfamily (Table III). The induction ofArabidopsis MYB TF genes in response to differentbiotic stresses (Chen et al., 2002) and to P starvation(Muller et al., 2007) has been shown previously. It hasbeen demonstrated that the Arabidopsis PHR1 andPHR2 genes, which resemble the PSR1 gene fromChlamydomonas reinhardtii and belong to the TF MYBsuperfamily, are crucial for P starvation signaling(Rubio et al., 2001; Todd et al., 2004). Our BLASTanalysis revealed that the deduced translated aminoacid sequence of MYB TF TC2883, induced 2-fold in
2P roots (Table III), showed 59% amino acid identityto PHR1 (BLASTX E value 5 4.1E239). The C2C2(Zn)TF family was the most highly represented among therepressed TF genes, and members from eight other TFgene families were also repressed (2-fold or more) in2P roots (Table III).
Metabolome Analyses
To assess the degree to which changes in plant geneexpression in P-deficient bean roots affect overall me-tabolism, we performed nonbiased metabolite profilingof bean roots using GC-MS. The complete informa-tion of the 81 metabolites and mass spectral metabolitetags (MSTs) detected in bean roots subjected to bothtreatments (2P and 1P) is provided as supplementaldata.
Table IV shows the retention time index (RI) valueand RI SD of those metabolites and MSTs (42) with 2Pto 1P response ratios 1.5-fold or more and those withlower ratios but highly significant (P # 0.05). The metab-olites thus identified were in agreement with previousanalyses (Desbrosses et al., 2005), mostly primary me-tabolites belonging to the compound classes: amino acids,organic acids, polyhydroxy acids, fatty acids, sugars,sugar phosphates, polyols, and other nitrogenous com-pounds. Most of the metabolites showed a responseratio higher than 1, indicating an increase in P-deficientroots; only eight metabolites were decreased in P-stressedroots (Table IV). Most of the amino acids were increasedin P-stressed roots; in addition, the polyols and sugarsshowed high and significantly different 2P to 1P re-sponse ratios (Table IV).
Quantitative data for the metabolites listed in TableIV were used for independent component analysis
Table III. TF genes significantly expressed in roots of P-deficient plants identified by real-time RT-PCR
Data of genes exhibiting $2-fold induction or repression expression ratio in roots from P-deficient plants versus 1P plants.
GenBank Accession No./TC No. Annotation TF Family or Domain Expression Ratio 2P to 1Pa P-Value
Induced in 2PCV532742 MYB family TF MYB superfamily 3.19 2.5E-02CV541354 MYB family TF MYB superfamily 2.12 5.0E-02TC2883 Transfactor-like protein MYB superfamily 2.00 4.4E-02TC1670 Unknown protein At1g19180 ZIM 2.00 4.9E-02
Repressed in 2PCV535367 Zinc finger protein C2H2(Zn) 23.03 5.0E-02TC1859 Protein kinase (E6) C2H2(Zn) 22.00 5.0E-02TC1802 GPI-anchored protein C2H2(Zn) 22.00 5.0E-02TC2557 RNA-binding protein C2H2(Zn) 22.00 1.0E-02TC2359 LOB domain protein AS2 25.95 1.1E-02CV535841 LOB domain protein AS2 23.26 2.2E-02CB540443 TF Alfin-like 22.19 3.6E-02CV536700 Ethylene response factor AP2/EREBP 22.03 1.1E-02CV530634 bHLH TF bHLH 22.59 5.1E-02CV530350 YABBY2-like TF C2C2(Zn) 22.67 3.0E-02CB542250 WUSCHEL-related homeobox 4 CCAAT 22.89 4.0E-03CB540853 Phosphate starvation response regulator MYB superfamily 22.00 5.0E-02CV535056 NAM-like protein NAC 22.00 1.0E-02
aWhenever the ratio was lower than 1 (genes repressed in P-deficiency), the inverse of the ratio was estimated and the sign was changed.
Phosphorus Deficiency in Common Bean Roots
Plant Physiol. Vol. 144, 2007 759 www.plantphysiol.orgon February 1, 2018 - Published by Downloaded from
Copyright © 2007 American Society of Plant Biologists. All rights reserved.

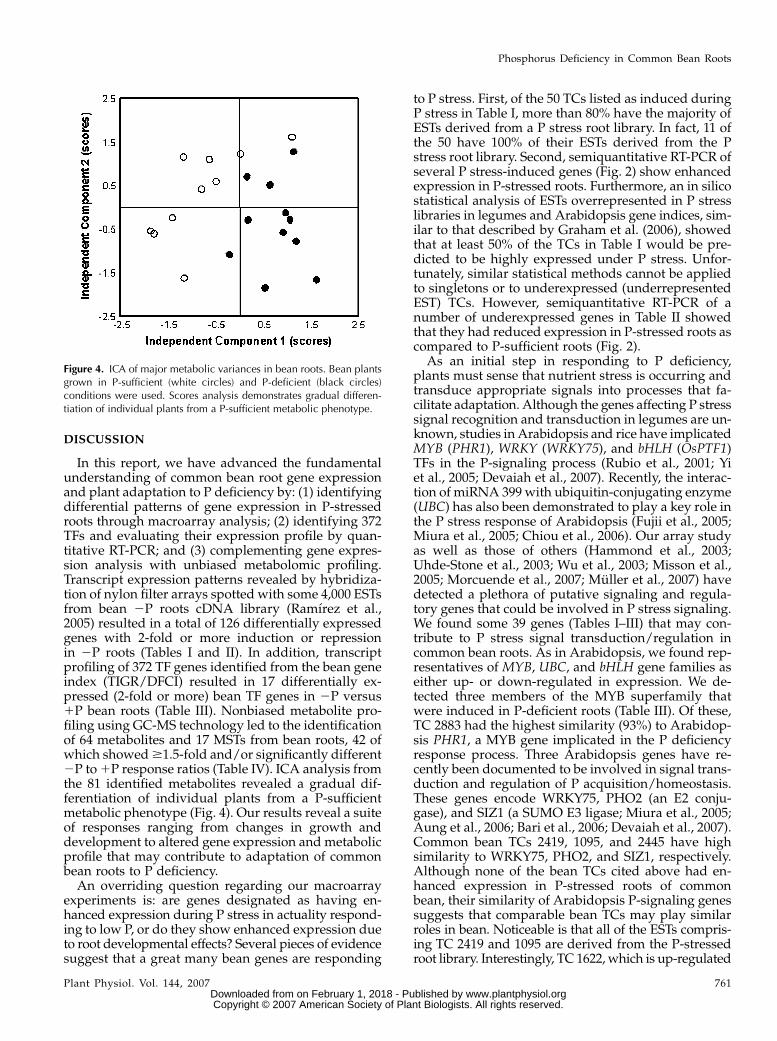
(ICA) to identify major differences in metabolite com-position in P-deficient and normal roots. ICA of me-tabolite response ratios of all 81 metabolites in 12samples from P-deficient roots and 12 samples ofP-sufficient roots allowed nonbiased partitioning intotwo sample groups showing gradual differentiation of
individual plants from a P-sufficient metabolite phe-notype (Fig. 4). The score plots (Fig. 4) show a clearseparation between 2P and 1P samples, though someoverlap in the samples can be seen, which probablyindicates a P deficiency but not total P starvation inbean roots.
Table IV. Metabolites identified by GC-MS in bean roots from 2P- and 1P-treated plants
RI,
ExpectedRI, SD
Response
Ratio 2P to 1Pa
Amino acidsGly 1,304.5 20.17 23.3b-Ala 1,424.7 20.12 1.4Ser 1,252.9 0.09 5.2Asp 1,420.5 0.07 2.1Asn 1,665.8 20.02 20.04-Aminobutyric acid 1,526.5 20.15 1.9Thr 1,290.9 20.02 3.3Pro 1,298.0 20.16 1.7Glu 1,615.4 20.10 2.1Gln 1,767.6 20.05 25.0Arg (citrulline)b 1,814.4 0.07 2.8Leu 1,151.0 0.52 3.4Lys 1,847.3 20.02 3.5Phe 1,553.1 0.15 5.0
N compoundsPutrescine (agmatine)b 1,737.2 20.24 1.4Allantoin 2,067.3 0.29 1.6Spermidine 2,251.1 20.22 1.6Urea 1,235.6 0.06 25.0
Organic acidsOxalic acid 1,116.8 0.90 22.5Malonic acid 1,195.0 0.30 22.5Succinic acid 1,310.2 0.02 1.4Malic acid 1,477.3 0.11 21.12-Methylmalic acid 1,464.3 20.09 1.3Shikimic acid 1,792.5 0.05 1.6
Polyhydroxy acidsErythronic acid-1,4-lactone 1,426.9 0.08 21.3Galactonic acid-1,4-lactone 1,877.4 20.31 2.5
PolyolsThreitol 1,485.1 20.12 2.1Arabitol 1,707.8 20.19 3.4Myoinositol 2,083.9 20.27 3.1
SugarsXyl 1,651.6 20.12 1.9Gal 1,874.7 0.16 2.2Fru 1,856.2 20.24 2.8Fru 1,865.9 20.23 3.2Man 1,869.0 20.17 3.5Suc 2,629.6 20.28 1.2
MSTsc,d
[516; 1H-Indole-2,3-dione, 1-(tert-butyldimethylsilyl)-5-isopropyl-, 3-(O-methyloxime)] 1,691.2 20.04 22.0[771; a-D-Methylfructofuranoside (4TMS)] 1,760.9 20.02 1.6[802; Methylcitric acid (4TMS)] 1,909.57 20.06 2.2[926; Galactosylglycerol (6TMS)] 2,297.2 20.12 5.9[802; Gulose (5TMS)] 2,424.3 0.26 2.0[964; Trehalose (8TMS)] 2,678.4 0.02 7.3[882; Melibiose (8TMS)] 3,092.9 20.27 3.5
aThe response ratio of average 2P root response compared with average 1P root response is listed (t test significance of P # 0.05 is indicated bybold format of the response ratio). For ratios lower than 1, the inverse of the ratio was estimated and the sign was changed. bRepresents the sumof two or more metabolites. cReference substance not yet available. dMSTs are characterized by match factor and mass spectral hit.
Hernandez et al.
760 Plant Physiol. Vol. 144, 2007 www.plantphysiol.orgon February 1, 2018 - Published by Downloaded from
Copyright © 2007 American Society of Plant Biologists. All rights reserved.
DISCUSSION
In this report, we have advanced the fundamentalunderstanding of common bean root gene expressionand plant adaptation to P deficiency by: (1) identifyingdifferential patterns of gene expression in P-stressedroots through macroarray analysis; (2) identifying 372TFs and evaluating their expression profile by quan-titative RT-PCR; and (3) complementing gene expres-sion analysis with unbiased metabolomic profiling.Transcript expression patterns revealed by hybridiza-tion of nylon filter arrays spotted with some 4,000 ESTsfrom bean 2P roots cDNA library (Ramırez et al.,2005) resulted in a total of 126 differentially expressedgenes with 2-fold or more induction or repressionin 2P roots (Tables I and II). In addition, transcriptprofiling of 372 TF genes identified from the bean geneindex (TIGR/DFCI) resulted in 17 differentially ex-pressed (2-fold or more) bean TF genes in 2P versus1P bean roots (Table III). Nonbiased metabolite pro-filing using GC-MS technology led to the identificationof 64 metabolites and 17 MSTs from bean roots, 42 ofwhich showed $1.5-fold and/or significantly different2P to 1P response ratios (Table IV). ICA analysis fromthe 81 identified metabolites revealed a gradual dif-ferentiation of individual plants from a P-sufficientmetabolic phenotype (Fig. 4). Our results reveal a suiteof responses ranging from changes in growth anddevelopment to altered gene expression and metabolicprofile that may contribute to adaptation of commonbean roots to P deficiency.
An overriding question regarding our macroarrayexperiments is: are genes designated as having en-hanced expression during P stress in actuality respond-ing to low P, or do they show enhanced expression dueto root developmental effects? Several pieces of evidencesuggest that a great many bean genes are responding
to P stress. First, of the 50 TCs listed as induced duringP stress in Table I, more than 80% have the majority ofESTs derived from a P stress root library. In fact, 11 ofthe 50 have 100% of their ESTs derived from the Pstress root library. Second, semiquantitative RT-PCR ofseveral P stress-induced genes (Fig. 2) show enhancedexpression in P-stressed roots. Furthermore, an in silicostatistical analysis of ESTs overrepresented in P stresslibraries in legumes and Arabidopsis gene indices, sim-ilar to that described by Graham et al. (2006), showedthat at least 50% of the TCs in Table I would be pre-dicted to be highly expressed under P stress. Unfor-tunately, similar statistical methods cannot be appliedto singletons or to underexpressed (underrepresentedEST) TCs. However, semiquantitative RT-PCR of anumber of underexpressed genes in Table II showedthat they had reduced expression in P-stressed roots ascompared to P-sufficient roots (Fig. 2).
As an initial step in responding to P deficiency,plants must sense that nutrient stress is occurring andtransduce appropriate signals into processes that fa-cilitate adaptation. Although the genes affecting P stresssignal recognition and transduction in legumes are un-known, studies in Arabidopsis and rice have implicatedMYB (PHR1), WRKY (WRKY75), and bHLH (OsPTF1)TFs in the P-signaling process (Rubio et al., 2001; Yiet al., 2005; Devaiah et al., 2007). Recently, the interac-tion of miRNA 399 with ubiquitin-conjugating enzyme(UBC) has also been demonstrated to play a key role inthe P stress response of Arabidopsis (Fujii et al., 2005;Miura et al., 2005; Chiou et al., 2006). Our array studyas well as those of others (Hammond et al., 2003;Uhde-Stone et al., 2003; Wu et al., 2003; Misson et al.,2005; Morcuende et al., 2007; Muller et al., 2007) havedetected a plethora of putative signaling and regula-tory genes that could be involved in P stress signaling.We found some 39 genes (Tables I–III) that may con-tribute to P stress signal transduction/regulation incommon bean roots. As in Arabidopsis, we found rep-resentatives of MYB, UBC, and bHLH gene families aseither up- or down-regulated in expression. We de-tected three members of the MYB superfamily thatwere induced in P-deficient roots (Table III). Of these,TC 2883 had the highest similarity (93%) to Arabidop-sis PHR1, a MYB gene implicated in the P deficiencyresponse process. Three Arabidopsis genes have re-cently been documented to be involved in signal trans-duction and regulation of P acquisition/homeostasis.These genes encode WRKY75, PHO2 (an E2 conju-gase), and SIZ1 (a SUMO E3 ligase; Miura et al., 2005;Aung et al., 2006; Bari et al., 2006; Devaiah et al., 2007).Common bean TCs 2419, 1095, and 2445 have highsimilarity to WRKY75, PHO2, and SIZ1, respectively.Although none of the bean TCs cited above had en-hanced expression in P-stressed roots of commonbean, their similarity of Arabidopsis P-signaling genessuggests that comparable bean TCs may play similarroles in bean. Noticeable is that all of the ESTs compris-ing TC 2419 and 1095 are derived from the P-stressedroot library. Interestingly, TC 1622, which is up-regulated
Figure 4. ICA of major metabolic variances in bean roots. Bean plantsgrown in P-sufficient (white circles) and P-deficient (black circles)conditions were used. Scores analysis demonstrates gradual differen-tiation of individual plants from a P-sufficient metabolic phenotype.
Phosphorus Deficiency in Common Bean Roots
Plant Physiol. Vol. 144, 2007 761 www.plantphysiol.orgon February 1, 2018 - Published by Downloaded from
Copyright © 2007 American Society of Plant Biologists. All rights reserved.
in P-deficient bean roots, encodes a putative UBC-ligase related to a pepper CaPUB1 that has been im-plicated in resistance to abiotic stress (Cho et al., 2006).
Studies with white lupin (Uhde-Stone et al., 2003;Liu et al., 2005) and Arabidopsis (Nacry et al., 2005;Karthikeyan et al., 2006; Muller et al., 2007) have shownthat sugars and P stress signaling are closely interre-lated. Rychter and Randall (1994) found that within2 weeks of P stress, common bean partitioned moresugars to roots than nonstressed plants. The enhancedexpression of P stress-induced genes requires the pre-sence of available sugars. Deprivation of sugars byeither shading or stem girdling blocks the expressionof P stress-induced genes (Liu et al., 2005). Our met-abolic analysis of bean P-stressed roots provides ad-ditional support for the role of sugars in P stress. Severalsugars (Table IV) were more abundant in P stress roots
as compared to P-sufficient roots, suggesting that sug-ars may be partitioned preferentially to P-stressed rootsto support the expression of P stress-induced genes. Itis noteworthy that PRL1-associated protein, encodedby CV543658, which has enhanced expression in Pstress bean roots, is known to interact with SNF1 to de-repress Glc metabolism, stimulate starch accumulation,and inhibit root elongation (Bhalerao et al., 1999). Thesetraits are characteristic of P-stressed plants.
It is also worthwhile to note the reduced amountsof organic acids in P-stressed roots as comparedto P-sufficient roots (Table IV). It is well known thatP-stressed legume roots release organic acids as aP-adaptive mechanism (Johnson et al., 1996; Neumannand Romheld, 1999; Shen et al., 2002; Dong et al., 2004).Release of organic acids into the rhizosphere enhancesPi solubilization, making P more available. The reduced
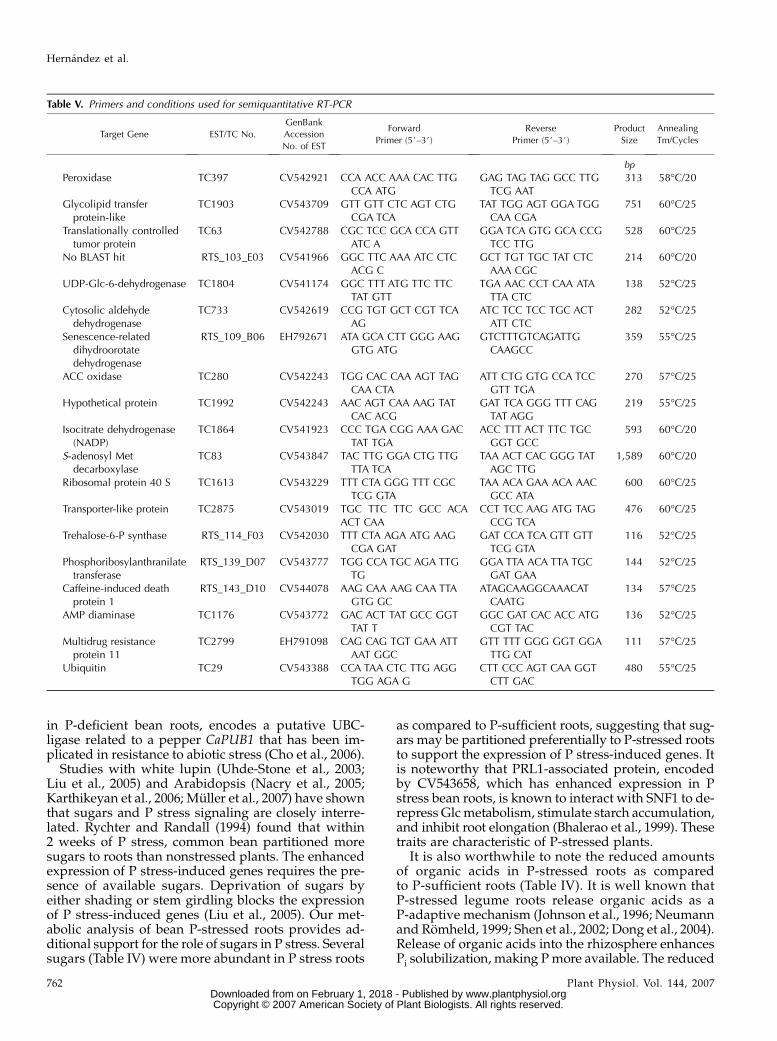
Table V. Primers and conditions used for semiquantitative RT-PCR
Target Gene EST/TC No.
GenBank
Accession
No. of EST
Forward
Primer (5#–3#)Reverse
Primer (5#–3#)Product
Size
Annealing
Tm/Cycles
bp
Peroxidase TC397 CV542921 CCA ACC AAA CAC TTGCCA ATG
GAG TAG TAG GCC TTGTCG AAT
313 58�C/20
Glycolipid transferprotein-like
TC1903 CV543709 GTT GTT CTC AGT CTGCGA TCA
TAT TGG AGT GGA TGGCAA CGA
751 60�C/25
Translationally controlledtumor protein
TC63 CV542788 CGC TCC GCA CCA GTTATC A
GGA TCA GTG GCA CCGTCC TTG
528 60�C/25
No BLAST hit RTS_103_E03 CV541966 GGC TTC AAA ATC CTCACG C
GCT TGT TGC TAT CTCAAA CGC
214 60�C/20
UDP-Glc-6-dehydrogenase TC1804 CV541174 GGC TTT ATG TTC TTCTAT GTT
TGA AAC CCT CAA ATATTA CTC
138 52�C/25
Cytosolic aldehydedehydrogenase
TC733 CV542619 CCG TGT GCT CGT TCAAG
ATC TCC TCC TGC ACTATT CTC
282 52�C/25
Senescence-relateddihydroorotatedehydrogenase
RTS_109_B06 EH792671 ATA GCA CTT GGG AAGGTG ATG
GTCTTTGTCAGATTGCAAGCC
359 55�C/25
ACC oxidase TC280 CV542243 TGG CAC CAA AGT TAGCAA CTA
ATT CTG GTG CCA TCCGTT TGA
270 57�C/25
Hypothetical protein TC1992 CV542243 AAC AGT CAA AAG TATCAC ACG
GAT TCA GGG TTT CAGTAT AGG
219 55�C/25
Isocitrate dehydrogenase(NADP)
TC1864 CV541923 CCC TGA CGG AAA GACTAT TGA
ACC TTT ACT TTC TGCGGT GCC
593 60�C/20
S-adenosyl Metdecarboxylase
TC83 CV543847 TAC TTG GGA CTG TTGTTA TCA
TAA ACT CAC GGG TATAGC TTG
1,589 60�C/20
Ribosomal protein 40 S TC1613 CV543229 TTT CTA GGG TTT CGCTCG GTA
TAA ACA GAA ACA AACGCC ATA
600 60�C/25
Transporter-like protein TC2875 CV543019 TGC TTC TTC GCC ACAACT CAA
CCT TCC AAG ATG TAGCCG TCA
476 60�C/25
Trehalose-6-P synthase RTS_114_F03 CV542030 TTT CTA AGA ATG AAGCGA GAT
GAT CCA TCA GTT GTTTCG GTA
116 52�C/25
Phosphoribosylanthranilatetransferase
RTS_139_D07 CV543777 TGG CCA TGC AGA TTGTG
GGA TTA ACA TTA TGCGAT GAA
144 52�C/25
Caffeine-induced deathprotein 1
RTS_143_D10 CV544078 AAG CAA AAG CAA TTAGTG GC
ATAGCAAGGCAAACATCAATG
134 57�C/25
AMP diaminase TC1176 CV543772 GAC ACT TAT GCC GGTTAT T
GGC GAT CAC ACC ATGCGT TAC
136 52�C/25
Multidrug resistanceprotein 11
TC2799 EH791098 CAG CAG TGT GAA ATTAAT GGC
GTT TTT GGG GGT GGATTG CAT
111 57�C/25
Ubiquitin TC29 CV543388 CCA TAA CTC TTG AGGTGG AGA G
CTT CCC AGT CAA GGTCTT GAC
480 55�C/25
Hernandez et al.
762 Plant Physiol. Vol. 144, 2007 www.plantphysiol.orgon February 1, 2018 - Published by Downloaded from
Copyright © 2007 American Society of Plant Biologists. All rights reserved.

amount of organic acids in P-deficient roots more thanlikely reflects exudation from the root into the rhizo-sphere. The altered organic acid content of P-stressedroots is also reflected in the reduced expression of TC1864 isocitrate dehydrogenase-ICD (Table II). Thisenzyme is a key regulatory enzyme in the tricarboxylicacid cycle. Reduced expression of ICD would lead to abuildup of malate acids that could be available forexudation into the rhizosphere.
Almost 23% of the genes showing enhanced expres-sion in P-stressed bean roots encode proteins havingroles in either stress/defense or secondary metabolism(Table I). Hammond et al. (2003) have shown that manygenes that respond to P stress in Arabidopsis shootsalso respond to other environmental challenges, in-cluding salinity, wounding, pathogen attack, anoxia,and other nutrient stresses. In bean, P stress results inthe induction of oxidative responses, including in-creased lipid peroxidation, elevated peroxide levels,and increased catalase and peroxidase activity (Juszczuket al., 2001). Our results confirm and extend this ob-servation by showing that genes encoding proteins inseveral aspects of oxidative stress have enhancedexpression in P-stressed roots. Moreover, several genesimplicated in plant response to diseases, such as PRand NBS-LRR resistance, are up-regulated in beanP-stressed roots along with genes involved in phenyl-propanoid synthesis (Table I). Similar patterns of geneactivation have been noted for plants undergoing potas-sium, zinc, iron, and N deficiency stress (Wang et al.,2002; Armengaud et al., 2004; Shin et al., 2005; van deMortel et al., 2006).
Because enhanced Pi transporter gene expression ishighly indicative of the Pi stress response (Raghothama,1999; Smith, 2001), it was surprising that we did notfind any Pi transporter to be highly expressed inP-stressed common bean roots. In fact, we found onlya single Pi transporter EST derived from the P-stressedroot library. The lack of Pi transporter ESTs in the rootlibrary could reflect that the library was made fromroots of 21-d-old P-stressed plants. Perhaps earlier sam-pling dates would have yielded more Pi transporters.On the other hand, we did detect enhanced expressionof other types of transporters, including a putativeaquaporin, an ATP-binding cassette transporter, andan acetylglucosamine transporter (Table I).
As demonstrated in Figure 1C and previously shownin numerous studies, the root to shoot ratio increasedin P-stressed plants as compared to P-sufficient plants.The ratio change was due in part to proliferation oflateral roots in P-stressed plants. Modified root archi-tecture in response to P stress has been noted previ-ously in common bean (Rychter and Randall, 1994;Lynch, 1995; Ge et al., 2000; Liao et al., 2001; Lynch andBrown, 2001) and Arabidopsis (Lopez-Bucio et al., 2003;Ma et al., 2003; Wu et al., 2003). Phosphate starvationwas recently shown to induce determinant root devel-opment programs in Arabidopsis (Sanchez-Calderonet al., 2005). Recently, quantitative trait loci for root ar-chitecture traits that correlate with P acquisition have
been identified in bean, strengthening the importanceof root structure for low P adaptation (Beebe et al.,2006). Modification of root architecture in response toP deficiency results from the interplay between inter-nal balance of the phytohormones auxin, cytokinin,and ethylene (Gilbert et al., 2000; Williamson et al.,2001; Al-Ghazi et al., 2003; Lopez-Bucio et al., 2003; Maet al., 2003; Karthikeyan et al., 2006). As one mightexpect, we found several genes in bean roots related tophytohormone biosynthesis and activity to be respon-sive to P. Accompanying increased lateral root growth,genes involved in cell wall synthesis and growth wereresponsive to P.
Reduced shoot growth accompanied by reducedphotosynthetic rate (Fig. 1) was symptomatic of P stressin bean. Phosphate content and photosynthesis are re-lated in several ways, and alteration of photosynthesisas a result of P starvation has been shown for severalplant species, including common bean (Rychter andRandall, 1994; Mikulska et al., 1998). It has been shownthat tobacco plants grown under P deficiency havereduced photosynthate demand in sink organs, result-ing in carbohydrate accumulation and decrease in netphotosynthesis (Pieters et al., 2001). Our data supportthe proposition of Morcuende et al. (2007) that repres-sion of photosynthesis may be a secondary responselinked to lower demand of photosynthate and highersugar levels during P limitation.
The results from this work provide an abundance ofcandidate genes with diverse function that are postu-lated to play important roles in adaptation of commonbean plants to P deficiency. These newly identifiedgenes may be of utility in marker-assisted selection forP-efficient genotypes. The identified candidate genesexpand the current information available on the reg-ulation and signaling pathways during P deficiencyin plants. In future studies, we propose to define theprecise roles of selected candidate genes using reversegenetics approaches.
MATERIALS AND METHODS
Plant Material and Growth Conditions
The common bean (Phaseolus vulgaris) Mesoamerican ‘Negro Jamapa 81’
was used in this study. Plants were grown in controlled-environment (26�C–
28�C, 16-h photoperiod) greenhouses at Centro de Ciencias Genomicas/
Universidad Nacional Autonoma de Mexico (Cuernavaca, Mexico) and Max
Planck Institute of Plant Molecular Physiology (Golm, Germany), or in growth
chambers at the University of Minnesota (St. Paul). Surface-sterilized seeds
were germinated at 30�C for 3 d over sterile wet filter paper and then planted
in pots with vermiculite or coarse quartz sand. Pots were watered 3 d per
week with the plant nutrient solution reported by Summerfield et al. (1977).
For 2P conditions, K2HPO4 concentration of the plant nutrient solution was
reduced from 1 mM to 5 mM. In 2P conditions, cotyledons from each plant
were cut 1 week after planting. Plants were grown for 3 weeks before
harvesting. Roots for RNA isolation were harvested directly into liquid
nitrogen and stored at 280�C.
Soluble Pi Concentration
Soluble Pi content was determined in leaves, stems, and roots from plants
grown for 3 weeks in 2P or 1P conditions using the colorimetric assay
Phosphorus Deficiency in Common Bean Roots
Plant Physiol. Vol. 144, 2007 763 www.plantphysiol.orgon February 1, 2018 - Published by Downloaded from
Copyright © 2007 American Society of Plant Biologists. All rights reserved.

reported by Taussky and Shorr (1953). For each assay, tissues were harvested,
weighed, and immediately homogenized in 10 N TCA. For each determina-
tion, 12 replicates were analyzed. These were derived from three independent
experiments with plants grown in similar conditions with four replicate assays
from each treatment (2P roots or 1P roots) per experiment.
Photosynthesis and Photosynthetic Pigments Content
The relationship between CO2 assimilation rate (Pn), increasing Ci, and
stomatal conductance and resistance was determined using a portable pho-
tosynthesis system (LI-6200 Primer; LI-COR) in 2P- versus 1P-treated plants.
The measurements from mature bean trifolia were undertaken in a green-
house maintaining leaf temperature and photosynthetically active photon flux
density at 25�C and 1,600 mmol m22 s21, respectively. Each point represents the
average of 12 determinations from three independent experiments with plants
grown in similar conditions and four replicate assays from each treatment
(2P roots or 1P roots) per experiment. The CO2 assimilation rate was adjusted
to each leaf area value.
Photosynthetic pigments were extracted from freshly harvested, fully ex-
panded leaves using 80% (v/v) acetone. Carotenes and chlorophyll (a and b)
were determined spectrophotometrically at 470, 663, and 646 nm wavelength,
respectively, as reported (Wellburn, 1994).
EST Sequencing and Annotation
Because the macroarrays used in this study were spotted prior to sequenc-
ing, 65 of the spotted clones had poor quality sequence and were not included
in sequence-based analyses (Ramırez et al., 2005; TIGR/DFCI, Quackenbush
et al., 2001) or submitted to GenBank. To include these clones in our analyses,
the clones were resequenced. DNA sequencing was performed at the Ad-
vanced Genetic Analysis Center (University of Minnesota) and at the Center
for Genomic Sciences/Universidad Nacional Autonoma de Mexico (Cuerna-
vaca, Mexico). The new sequences were submitted to GenBank (accession nos.
EH791054–EH791109, EH792671–EH792678, and EH795233).
To assign newly sequenced ESTs to existing TCs in the TIGR/DFCI Com-
mon Bean Gene Index, the EST sequences were compared to the TCs using
TBLASTX (Altschul et al., 1997). To confirm the placement of the EST with the
putative matching TIGR/DFCI TC, the overlap of both sequences was checked
using the SeqManII program in the DNASTAR software package. Sequence
matching indicated that the analyzed bean sequence belonged to the TC, as
indicated in Tables I and II. To annotate the sequences described in Tables I to
III, all sequences were cross referenced with the TIGR/DFCI Common Bean
Gene Index to find the corresponding TCs or singletons. TC or singleton
sequences were compared to the Uniprot (version July 2006; Apweiler et al.,
2004) protein database using BLASTX and an E-value cutoff of E , 1024.
Nylon Filter Arrays, Hybridization, and Data Analysis
The preparation of a cDNA library from roots from P-deficient bean ‘Negro
Jamapa 81’ plants and the sequence of ESTs (4,329) have been reported
(Ramırez et al., 2005; Graham et al., 2006). For macroarray preparation, the
cDNA portion of each root EST was amplified by PCR using standard T3 and
T7 primers. The PCR products were spotted onto Gene Screen Plus mem-
branes (NEN Life Science Products) using the Q-bot (Genetix) automated
spotting system.
Total RNA was isolated from 4 g frozen roots (as reported by Chang et al.
[1993]) from plants grown under similar 2P or 1P conditions in four inde-
pendent experiments. Radiolabeled cDNA probes were synthesized from total
RNA (30 mg) by RT, as reported (Ramırez et al., 2005). Hybridization and wash-
ing conditions of nylon filters were performed as reported (Ramırez et al.,
2005). Ten independent nylon filter arrays were hybridized with cDNA from
each treatment.
Hybridized filters were exposed to phosphor screens for 5 d, and the
fluorescent intensity of each spot was quantified as reported (Ramırez et al.,
2005; Tesfaye et al., 2006). To work with highly reproducible experiments,
linear regression analysis was performed for each pair of membrane replicas;
only those replicas for which the linear model could explain at least 80% of the
variation (r2 $ 0.8) were considered. This process yielded a total of six well-
correlated replicas for each treatment: 2P roots and 1P roots, respectively.
Array data were normalized and quantified using GeneSpring (version 7.2;
Silicon Genetics), as provided by the Supercomputing Institute at the Uni-
versity of Minnesota. t tests were performed with a P-value cutoff of #0.05.
RT-PCR Analysis for Verification of Array Analysis
Total RNA for RT-PCR was isolated from 3 g frozen roots using the RNeasy
isolation kit (Qiagen). Quantification of transcripts was performed using two-
step RT-PCR following the manufacturer’s directions (Ambion and Invitrogen)
using poly thymine deoxynucleotide primer. The sequences of oligonucleo-
tide primers and conditions used in RT-PCR reactions are shown in Table V.
RT-PCR products were resolved in 1% (w/v) agarose gels in Tris-acetate-EDTA
buffer, along with a 1-kb DNA-standard ladder (Invitrogen). Amplification of
ubiquitin gene was used as control for uniform PCR conditions.
TF Gene Selection and RT-PCR Primer Design
Genes (EST/TC) coding for proteins specifically involved in transcrip-
tional regulation were selected from the TIGR/DFCI Common Bean Gene
Index (www.tigr.org). For protein domain prediction, Inter-Pro Release 11
(www.ebi.ac.uk/interpro) was used. The text of all Inter-Pro database entries
was searched for the specific strings ‘‘*transcription*’’, ‘‘*DNA*binding*’’, and
‘‘*zinc*finger*’’ using the SRS search tool (www.ebi.ac.uk/interpro/search.
html). The identified domains were assembled in a list. The list was supple-
mented by Inter-Pro domains that are components of the Gene Ontology (GO)
branches ‘‘Transcription factor activity’’ (GO:0003700), ‘‘Transcriptional acti-
vator activity’’ (GO:00165643), ‘‘Transcriptional repressor activity’’ (GO:0016564),
and ‘‘Two-component response regulator activity’’ (GO:0000156). The GO-
Inter-Pro mappings were found using the QuickGO browser on the Inter-Pro
page (www.ebi.ac.uk/ego/). In total, 1,533 domains of proteins potentially in-
volved in transcriptional regulation were selected.
Subsequently, all common bean sequences were analyzed for the occur-
rence of these domains using Inter-ProScan (www.ebi.ac.uk/Inter-ProScan).
In 372 sequences, 41 of the preselected domains were found. The Inter-Pro
descriptions of these domains were evaluated to select the domains of proteins
that are involved in transcriptional regulation.
RT-PCR primers were generated for the 372 TF genes with TIGR’s Primer
Design Pipeline, which was designed with the aims of high throughput and
specificity. The pipeline iterates through three phases: design, specificity, and
selection.
First, the design phase queried every region of the target TF sequences with
sliding windows to generate primer set candidates that fit the experimental
requirements. Each sliding window was 250 bp across and stepped 50 bp
along the target sequence per iteration. The experimental requirements were
enforced by the following MIT Primer3 (Rozen and Skaletsky, 2000) param-
eters: PRIMER_MIN_TM 58, PRIMER_OPT_TM 60, PRIMER_MAX_TM 62,
PRIMER_SELF_ANY 6, PRIMER_SELF_END 2, PRIMER_MAX_POLY_X 3,
and PRIMER_PRODUCT_SIZE_RANGE#60 to 150#.
Next, the specificity phase aligned primer candidates via WU-Blast (W.
Gish, 1996–2004; http://blast.wustl.edu) to the TIGR/DFCI Common Bean
Gene Index. The selection phase then discarded primer candidates that reg-
istered possible secondary hits, defined as specificity alignments that achieved
80% or greater identity over the length of the primer and included at least one
of the terminal ends of the primer in the alignment. The remaining, qualifying
primer sets were further prioritized by self-complementarity and poly-X
characteristics to achieve selection of the most preferred primers for every
target.
The primer design pipeline was implemented in object-oriented Perl mod-
ules and supported by a relational MySQL database. Sequences of primer pairs
used to amplify each TF gene are shown as supplemental data.
Real-Time RT-PCR Conditions and Analysis of Bean TF
Total RNA for real-time RT-PCR was isolated from 400 mg frozen roots
based on the protocol reported by Heim et al. (1993). Three biological replicas
were isolated for each treatment (2P and 1P roots), extracting RNA from
different sets of plants grown in similar conditions. RNA concentration was
measured in NanoDrop ND-1000 spectrophotometer (NanoDrop Technolo-
gies), and 10 mg of total RNA was digested with TURBO DNase (catalog no.
1907, Ambion), adding ribonuclease inhibitor (catalog no. N211B, Promega)
and following the manufacturer’s directions. Absence of genomic DNA
contamination was subsequently confirmed by real-time PCR amplification,
using primers designed for the bean E2 UBC9 reference gene (TC362; primers:
F, 5#-GCTCTCCATTTGCTCCCTGTT-3#; R, 5#-TGAGCAATTTCAGGCAC-
CAA-3#). cDNA was synthesized using SuperScriptIII reverse transcriptase
(Invitrogen), according to manufacturer’s instructions. The efficiency of cDNA
Hernandez et al.
764 Plant Physiol. Vol. 144, 2007 www.plantphysiol.orgon February 1, 2018 - Published by Downloaded from
Copyright © 2007 American Society of Plant Biologists. All rights reserved.
synthesis was assessed by real-time PCR amplification of control UBC9 gene.
Only cDNA preparations that yielded similar CT values (i.e. 19 6 1) for the
reference gene were used for comparing TF transcript levels.
Quantitative determinations of relative transcript levels of TF genes using
RT-PCR were carried out at the Max Planck Institute of Molecular Plant Phys-
iology (Golm, Germany) according to Czechowski et al. (2004). Each real-time
RT-PCR run for the whole set of TF genes (372) plus reference (housekeeping)
and marker genes was performed in a 384-well plate. The bean phosphatase
gene (TC201), which is highly induced in P-deficient roots (Ramırez et al.,
2005), was included as a P deficiency marker in every real-time PCR run. The
primers used for phosphatase gene amplification are: F, 5#-GCCCAAGTTT-
GAGGCTGAAAG-3#; R, 5#-TCAAGTCCCACACCGGAAAGT-3#. TF gene ex-
pression was normalized to that of UBC9, which was the most constant of the
four housekeeping genes included in each PCR run. 2P/1P average expres-
sion ratios were obtained from the equation ð1 1 EÞDDCT , where DDCT repre-
sents DCT(2P) 2 DCT(1P), and E is the PCR efficiency. Student’s t test was
performed with a P-value cutoff at 0.05.
Plant Metabolite Extraction
Plant metabolite extraction from root samples of 2P- and 1P-treated bean
plants and GC-MS metabolite profiling was done as reported previously for
Lotus japonicus (Colebatch et al., 2004; Desbrosses et al., 2005). Twelve replicate
samples each of roots from plants grown under 1P and 2P conditions were
harvested from pods, rinsed with tap water, dried on filter paper, and shock
frozen in liquid nitrogen. Frozen samples of 60 to 150 mg fresh weight (FW)
were ground 3 min in 2-mL micro vials with a clean stainless steel metal ball
(5-mm diameter) using a Retschball mill set at 20 cycles s21. Grinding
components of the mill were cooled with liquid nitrogen to keep samples
deep frozen. Frozen powder was extracted with hot MeOH/CHCl3 and the
fraction of polar metabolites prepared by liquid partitioning into water and
further processed as described (Desbrosses et al., 2005).
GC-Time of Flight-MS Metabolite Profiling
GC-time of flight (TOF)-MS profiling was performed using a FactorFour
VF-5ms capillary column, 30 m long, 0.25 mm i.d., 0.25 mm film thickness with
a 10-m EZ-guard precolumn (Varian BV), and an Agilent 6890N gas chro-
matograph with splitless injection and electronic pressure control (Agilent)
mounted to a Pegasus III TOF mass spectrometer (LECO Instrumente). Details
of GC-TOF-MS adaptation of the original profiling method (Desbrosses et al.,
2005) are described by Wagner et al. (2003) and Erban et al. (2006). Metabolites
were quantified after mass spectral deconvolution (ChromaTOF software
version 1.00, Pegasus driver 1.61; LECO) of at least three mass fragments for
each analyte. Peak height representing arbitrary mass spectral ion currents of
each mass fragment was normalized using the amount of the sample FW and
ribitol for internal standardization of volume variations to obtain normalized
responses (per gram FW) and response ratios as described (Colebatch et al.,
2004; Desbrosses et al., 2005).
Identification of Metabolites within GC-MSMetabolite Profiles
Metabolites were identified using the NIST05 mass spectral search and
comparison software (National Institute of Standards and Technology; http://
www.nist.gov/srd/mslist.htm) and the mass spectral and RI collection
(Schauer et al., 2005) of the Golm Metabolome Database (Kopka et al., 2005).
Mass spectral matching was manually supervised, and matches were ac-
cepted with thresholds of match .650 (with maximum match equal to 1,000)
and RI deviation ,1.0%. Information on the polar metabolites, using the
corresponding mass spectral identifiers can be found at http://csbdb.mpimp-
golm.mpg.de/csbdb/gmd/msri/gmd_smq.html. Metabolites are character-
ized by chemical abstracts system identifiers and compound codes issued by
the Kyoto Encyclopedia of Genes and Genomes (Kanehisa et al., 2004).
Metabolites were identified by standard substances or by MSTs. The term MST
is used for repeatedly occurring yet nonidentified compounds, which can be
recognized by mass spectrum and RI, as defined earlier (Colebatch et al., 2004;
Desbrosses et al., 2005). MSTs are characterized and named by best mass
spectral match to compounds identified by NIST05 or Golm Metabolome
Database using match value and hit name (Table IV). The response ratio 2P to
1P for each metabolite/MST was calculated dividing the average metabolite
concentration from 12 samples from roots of P-deficient plants over the
average metabolite concentration from 12 samples from roots of control plants
(Table IV).
ICA and Statistical Analysis
ICA (Scholz et al., 2004) was applied to metabolite profiles (as compiled in
supplemental data). Data were normalized by calculation of response ratios
using the median of each metabolite as denominator and subsequently sub-
jected to logarithmic transformation. Missing value substitution was as de-
scribed earlier (Scholz et al., 2005). Statistical testing was performed using the
Student’s t test. Logarithmic transformation of response ratios was applied for
approximation of required Gaussian normal distribution of metabolite pro-
filing data.
Sequence data from this article can be found in the GenBank/EMBL data
libraries under accession numbers EH791054 to EH791109, EH792671 to
EH792678, and EH795233.
Supplemental Data
The following materials are available in the online version of this article.
Supplemental Table S1. Root transcript levels of all the genes in the
common bean macroarray.
Supplemental Table S2. Complete list of common bean TF gene and
primer sequences.
Supplemental Table S3. Root transcript levels of all common bean TF
genes determined by real-time RT-PCR.
Supplemental Table S4. Complete metabolic profile response from com-
mon bean roots.
ACKNOWLEDGMENTS
We are grateful to Victor M. Bustos for plant maintenance and to
Guillermo Davila and Rosa I. Santamarıa for providing the facility and for
technical assistance for DNA sequencing at CCG/Universidad Nacional
Autonoma de Mexico.
Received February 7, 2007; accepted April 9, 2007; published April 20, 2007.
LITERATURE CITED
Al-Ghazi Y, Muller B, Pinloche S, Tranbarger TJ, Nacry P, Rossignol M,
Tardieu F, Doumas P (2003) Temporal responses of Arabidopsis root
architecture to phosphate starvation: evidence for the involvement of
auxin signaling. Plant Cell Environ 26: 1053–1066
Altschul SF, Madden TL, Schaffer AA, Zhang J, Zhang Z, Miller W,
Lipman DJ (1997) Gapped BLAST and PSI-BLAST: a new generation of
protein database search programs. Nucleic Acids Res 25: 3389–3402
Apweiler R, Bairoch A, Wu CH, Barker WC, Boeckmann B, Ferro S,
Gasteiger E, Huang H, Lopez R, Magrane M, et al (2004) UniProt: the
universal protein knowledgebase. Nucleic Acids Res 32: D115–D119
Armengaud P, Breitling R, Amtmann A (2004) The potassium-dependent
transcriptome of Arabidopsis reveals a prominent role of jasmonic acid
in nutrient signaling. Plant Physiol 136: 2556–2576
Aung K, Lin S-I, Wu CC, Huang Y-T, Su C-L, Chiou T-J (2006) pho2, a
phosphate overaccumulator, is caused by a nonsense mutation in a
microRNA399 target gene. Plant Physiol 141: 1000–1011
Bari R, Pant BD, Stitt M, Scheible WR (2006) PHO2, MicroRNA399, and
PHR1 define a phosphate-signaling pathway in plants. Plant Physiol
141: 988–999
Beebe SE, Rojas-Pierce M, Yan X, Blair MW, Pedraza F, Munoz F, Tohme J,
Lynch JP (2006) Quantitative trait loci for root architecture traits cor-
relate with phosphorus acquisition in common bean. Crop Sci 46:
413–423
Bhalerao RP, Salchert K, Bako L, Oekresz L, Szabados L, Muranka T,
Machida Y, Schell J, Koncz C (1999) Regulatory interaction of PRL1 WD
Phosphorus Deficiency in Common Bean Roots
Plant Physiol. Vol. 144, 2007 765 www.plantphysiol.orgon February 1, 2018 - Published by Downloaded from
Copyright © 2007 American Society of Plant Biologists. All rights reserved.

protein with Arabidopsis SNF1-like protein kinases. Proc Natl Acad Sci
USA 96: 5322–5327
Broughton WJ, Hernandez G, Blair M, Beebe S, Gepts P, Vanderleyden J
(2003) Beans (Phaseolus spp.): model food legume. Plant Soil 252: 55–128
Chang S, Poryear J, Cairney J (1993) A simple and efficient method for
isolating RNA from pine trees. Plant Mol Biol Rep 11: 113–116
Chen W, Provart NJ, Glazebrook J, Katagiri F, Chang HS, Eulgem T,
Mauch F, Luan S, Zou G, Whitham SA, et al (2002) Expression profile
matrix of Arabidopsis transcription factor genes suggests their putative
functions in response to environmental stresses. Plant Cell 14: 559–574
Chiou TJ, Aung K, Lin SI, Wu CC, Chiang SF, Su CL (2006) Regulation of
phosphate homeostasis by microRNA in Arabidopsis. Plant Cell 18:
412–421
Cho SK, Chung HS, Ryu MY, Park MJ, Lee MM, Bahk Y-Y, Kim J, Pai HS,
Kim WT (2006) Heterologous expression cellular characterization of
CaPUB1 encoding a hot pepper U-box E3 ubiquitin ligase homolog.
Plant Physiol 142: 1664–1682
Colebatch G, Desbrosses G, Ott T, Krussell L, Montanari O, Kloska S,
Kopka J, Udvardi MK (2004) Global changes in transcription orches-
trate metabolic differentiation during symbiotic nitrogen fixation in
Lotus japonicus. Plant J 29: 487–512
Czechowski T, Bari RP, Stitt M, Scheible WR, Udvardi MK (2004) Real-
time RT-PCR profiling of over 1400 Arabidopsis transcription factors:
unprecedented sensitivity reveals novel root- and shoot-specific genes.
Plant J 38: 366–379
Desbrosses GC, Kopka J, Udvardi MK (2005) Lotus japonicus metabolic
profiling. Development of gas chromatography-mass spectrometry re-
sources for the study of plant microbe interactions. Plant Physiol 137:
1302–1318
Devaiah BN, Karthikeyan AS, Raghothama KG (2007) WRKY75 tran-
scription factor is a modulator of phosphate acquisition and root
development in Arabidopsis. Plant Physiol 143: 1789–1801
Dong D, Peng X, Yan X (2004) Organic acid exudation induced by
phosphorus deficiency and/or aluminum toxicity in two contrasting
soybean genotypes. Physiol Plant 122: 190–199
Erban A, Schauer N, Fernie AR, Kopka J (2006) Non-supervised construc-
tion and application of mass spectral and retention time index libraries
from time-of-flight GC-MS metabolite profiles. In W Weckwerth, ed, Me-
tabolomics: Methods and Protocols. Humana Press, Totowa, NJ, pp 19–38
Fujii H, Chiou TJ, Lin SI, Aung K, Zhu JK (2005) A miRNA involved in
phosphate-starvation response in Arabidopsis. Curr Biol 15: 2038–2043
Ge Z, Rubio G, Lynch JP (2000) The importance of root gravitropism for
inter-root competition and phosphorus acquisition efficiency: results
from a geometric simulation model. Plant Soil 218: 159–171
Gilbert GA, Knight JD, Vance CP, Allan DL (2000) Proteoid root devel-
opment of phosphorus deficient lupin is mimicked by auxin and
phosphonate. Ann Bot (Lond) 85: 921–928
Graham MA, Ramırez M, Valdes-Lopez O, Lara M, Tesfaye M, Vance CP,
Hernandez G (2006) Identification of candidate phosphorus stress
induced genes in Phaseolus vulgaris L. through clustering analysis across
several plant species. Funct Plant Biol 33: 789–797
Graham PH, Rosas JC, Estevez de Jensen C, Peralta E, Tlusty B, Acosta-
Gallegos J, Arraes Pereira PA (2003) Addressing edaphic constraints to
bean production: the bean/cowpea CRSP project in perspective. Field
Crop Res 82: 179–192
Hammond JP, Bennett MJ, Bowen HC, Briadley MR, Eastwood DC, May
ST, Rahn C, Swaruo R, Woolaway KE, White PJ (2003) Changes in gene
expression in Arabidopsis shoots during phosphate starvation and the
potential for developing smart plants. Plant Physiol 132: 578–596
Heim U, Weber H, Baumlein H, Wobus U (1993) A sucrose-synthase gene
of V. faba L. Expression pattern in developing seeds in relation to starch
synthesis and metabolic regulation. Planta 191: 394–401
Johnson JF, Allan DL, Vance CP, Weiblen G (1996) Root carbon dioxide
fixation by phosphorus-deficient Lupinus albus (contribution to organic
acid exudation by proteoid roots). Plant Physiol 112: 19–30
Juszczuk IM, Malusa E, Rychter AM (2001) Oxidative stress during
phosphate deficiency in roots of bean plants (Phaseolus vulgaris L.).
J Plant Physiol 158: 1299–1305
Kanehisa M, Goto S, Kawashima S, Okuno Y, Hattori M (2004) The KEGG
resource for deciphering the genome. Nucleic Acids Res 32: D277–280
Karthikeyan AS, Varadarajan DK, Jain A, Held MA, Carpita NC,
Raghothama KG (2006) Phosphate starvation responses are mediated
by sugar signaling in Arabidopsis. Planta 225: 907–918
Kopka J, Schauer N, Krueger S, Birkemeyer C, Usadel B, Bergmuller E,
Dormann P, Weckwerth W, Gibon Y, Stitt M, et al (2005)
[email protected]: the Golm Metabolome Database. Bioinformatics 21:
1635–1638
Liao H, Rubio G, Yan X, Cao A, Brown KM, Lynch JP (2001) Effect of
phosphate availability on basal root shallowness in common bean. Plant
Soil 232: 69–79
Liu J, Samac DA, Bucciarelli B, Allan DL, Vance CP (2005) Signaling of
phosphorus deficiency-induced gene expression in white lupin requires
sugar and phloem transport. Plant J 41: 257–268
Lopez-Bucio J, Cruz-Ramırez A, Herrera-Estrella L (2003) The role of
nutrient availability in regulating root architecture. Curr Opin Plant Biol
6: 280–287
Lynch J (1995) Root architecture and plant productivity. Plant Physiol
109: 7–13
Lynch JP, Brown KM (2001) Topsoil foraging and architectural adaptation
of plants to low phosphorus. Plant Soil 237: 225–237
Ma Z, Baskin TI, Brown KM, Lynch JP (2003) Regulation of root elongation
under phosphorus stress involves changes in ethylene responsiveness.
Plant Physiol 131: 1381–1390
Mikulska M, Bomsel JL, Rychter AM (1998) The influence of phosphate
deficiency on photosynthesis, respiration and adenine nucleotide pool
in bean leaves. Photosynthetica 35: 79–88
Misson J, Raghothama KG, Jain A, Jouhet J, Block MA, Bligny R, Ortet P,
Creff A, Somerville S, Rolland N, et al (2005) A genome-wide tran-
scriptional analysis using Arabidopsis thaliana Affymetrix gene chips
determined plant responses to phosphate deprivation. Proc Natl Acad
Sci USA 102: 11934–11939
Miura K, Rus A, Sharkhuu A, Yokoi S, Karthikeyan AS, Raghothama KG,
Baek D, Koo YD, Jin JB, Bressan RA, et al (2005) The Arabidopsis SUMO
E3 ligase SIZ1 controls phosphate deficiency responses. Proc Natl Acad
Sci USA 102: 11934–11939
Morcuende R, Bari R, Gibon Y, Zheng W, Pant BD, Blasing O, Usadel B,
Czechowski T, Udvardi MK, Sttitt M, et al (2007) Genome-wide,
reprogramming of metabolism and regulatory networks of Arabidopsis
in response to phosphorus. Plant Cell Environ 30: 85–112
Muller R, Morant M, Jarmer H, Nilsson L, Nielsen TH (2007) Genome-
wide analysis of the Arabidopsis leaf transcriptome reveals interaction
of phosphate and sugar metabolism. Plant Physiol 143: 156–171
Nacry P, Canivenc G, Muller B, Azmi A, Van Onckelen H, Rossignol M,
Doumas P (2005) A role for auxin redistribution in the responses of the
root system architecture to phosphate starvation in Arabidopsis. Plant
Physiol 138: 2061–2074
Neumann G, Romheld V (1999) Root excretion of carboxylic acids and
protons in phosphorus-deficient plants. Plant Soil 211: 121–130
Pieters AJ, Paul MJ, Lawlor DW (2001) Low sink demands limits photo-
synthesis under Pi deficiency. J Exp Bot 52: 1083–1091
Plaxton WC (2004) Plant responses to stress: biochemical adaptations to
phosphate deficiency. In RM Goodman, ed, Encyclopedia of Plant and
Crop Science. Marcel Dekker, New York, pp 976–980
Quackenbush J, Cho J, Lee D, Liang F, Holt I, Karamycheva S, Parvizi B,
Pertea G, Sultana R, White J (2001) The TIGR Gene Indices: analysis of
gene transcript sequences in highly sampled eukaryotic species. Nucleic
Acids Res 29: 159–164
Raghothama KG (1999) Phosphate acquisition. Annu Rev Plant Physiol
Plant Mol Biol 50: 665–693
Ramırez M, Graham MA, Blanco-Lopez L, Silvente S, Medrano-Soto A,
Blair MW, Hernandez G, Vance CP, Lara M (2005) Sequencing analysis
of common bean ESTs. Building a foundation for functional genomics.
Plant Physiol 137: 1211–1227
Riechmann JL (2002) Transcriptional regulation: a genomic overview. In
CR Sommerville, EM Meyerowitz, eds, The Arabidopsis Book. Ameri-
can Society of Plant Biologists, Rockville, MD, doi/10.1199/tab.0085,
http://www.aspb.org/publications/arabidopsis/
Rozen S, Skaletsky H (2000) Primer3 on the WWW for general users and
biologist programmers. In S Krawetz, S Misener, eds, Bioinformatics
Methods and Protocols. Humana Press, Totowa, NJ, pp 365–386
Rubio V, Linhares F, Solano R, Martın AC, Iglesias J, Leyva A, Paz-Ares J
(2001) A conserved MYB transcription factor involved in phosphate
starvation signaling both in vascular plants and in unicellular algae.
Genes Dev 15: 2122–2133
Rychter AM, Randall DD (1994) The effect of phosphate deficiency on
carbohydrate metabolism in bean roots. Physiol Plant 91: 383–388
Hernandez et al.
766 Plant Physiol. Vol. 144, 2007 www.plantphysiol.orgon February 1, 2018 - Published by Downloaded from
Copyright © 2007 American Society of Plant Biologists. All rights reserved.
Sanchez-Calderon L, Lopez-Bucio J, Chacon-Lopez A, Cruz-Ramirez A,
Nieto-Jacobo F, Dubrovsky JG, Herrera-Estrella L (2005) Phosphate
starvation induced a determinate development program in roots of
Arabidopsis thaliana. Plant Cell Physiol 46: 174–184
Schauer N, Steinhauser D, Strelkov S, Schomburg D, Allison G, Moritz T,
Lundgren K, Roessner-Tunali U, Forbes MG, Willmitzer L, et al (2005)
GC-MS libraries for the rapid identification of metabolites in complex
biological samples. FEBS Lett 579: 1332–1337
Scholz M, Gatzek S, Sterling A, Fiehn O, Selbig J (2004) Metabolite
fingerprinting: detecting biological features by independent component
analysis. Bioinformatics 20: 2447–2454
Scholz M, Kaplan F, Guy CL, Kopka J, Selbig J (2005) Non-linear PCA: a
missing data approach. Bioinformatics 21: 3887–3895
Shen H, Yan X, Zhao M, Zheng S, Wang X (2002) Exudation of organic
acids in common bean as related to mobilization of aluminum- and iron-
bound phosphates. Environ Exp Bot 48: 1–9
Shin R, Berg RH, Schactman DP (2005) Reactive oxygen species and root
hairs in Arabidopsis root response to nitrogen, phosphorus, and
potassium deficiency. Plant Cell Physiol 46: 1350–1357
Smith FW (2001) Sulphur and phosphorus transport systems in plants.
Plant Soil 232: 109–118
Summerfield RJ, Huxley PA, Minchin FR (1977) Plant husbandry and
management techniques for growing grain legumes under simulated
tropical conditions in controlled environments. Exp Agric 13: 113–121
Taussky HH, Shorr E (1953) A microcolorimetric method for the determi-
nation of inorganic phosphorus. J Biol Chem 202: 675–685
Tesfaye M, Samac DA, Vance CP (2006) Insights into symbiotic nitro-
gen fixation in Medicago truncatula. Mol Plant Microbe Interact 19:
330–341
Todd CD, Zeng P, Rodrıguez AM, Hoyos ME, Polacco JC (2004) Tran-
scripts of MYB-like genes respond to phosphorus and nitrogen depri-
vation in Arabidopsis. Planta 219: 1003–1009
Uhde-Stone C, Zinn KE, Ramırez-Yanez M, Li A, Vance CP, Allan DL
(2003) Nylon filter arrays reveal differential gene expression in proteoid
roots of white lupin in response to phosphorus deficiency. Plant Physiol
131: 1064–1079
van de Mortel JE, Villanueva LA, Schat H, Kwekkeboom J, Coughlan S,
Moerland PD, van Themaat EVL, Koorneef M, Aarts MGM (2006)
Large expression differences in genes for iron and zinc homeostasis,
stress response, and lignin biosynthesis distinguish roots of Arabidopsis
thaliana and the related metal hyperaccumulator Thlaspi caerulescens.
Plant Physiol 142: 1127–1147
Vance CP, Uhde-Stone C, Allan DL (2003) Phosphorus acquisition and use:
critical adaptations by plants for securing a nonrenewable resource.
New Phytol 157: 423–447
Wagner C, Sefkow M, Kopka J (2003) Construction and application of a
mass spectral and retention time index database generated from plant
GC/EI-TOF-MS metabolite profiles. Phytochemistry 62: 887–900
Wang Y-H, Garvin DF, Kochian LV (2002) Rapid induction of regulatory
and transporter genes in response to phosphorus, potassium, and iron
deficiencies in tomato. Evidence for cross talk and root/rhizosphere
mediated signals. Plant Physiol 130: 1361–1370
Wasaki J, Shinano T, Onishi K, Yonetani R, Yazaki J, Fujii F, Shimbo K,
Ishikawa M, Shimatani Z, Nagata Y, et al (2006) Transcriptomic
analysis indicates putative metabolic changes caused by manipulation
of phosphorus availability in rice leaves. J Exp Bot 57: 2049–2059
Wasaki J, Yonetani R, Kuroda S, Shinano T, Yasaki J, Fujii F, Shimbo K,
Yamamoto K, Sakata K, Sasaki T, et al (2003) Transcriptomic analysis of
metabolic changes by phosphorus stress in rice plant roots. Plant Cell
Environ 26: 1515–1523
Wellburn AR (1994) The spectral determination of chlorophylls a and b, as
well as total carotenoids, using various solvents with spectrophotom-
eters. J Plant Physiol 144: 307–317
Williamson LC, Ribrioux SPCP, Fitter AH, Leyser HMO (2001) Phosphate
availability regulates root system architecture in Arabidopsis. Plant
Physiol 126: 875–882
Wu P, Ligeng M, Hou X, Wang M, Wu Y, Liu F, Deng XW (2003) Phosphate
starvation triggers distinct alterations of genome expression in Arabi-
dopsis roots and leaves. Plant Physiol 132: 1260–1271
Yi K, Wu Z, Zhou J, Du L, Guo L, Wu Y, Wu P (2005) OsPTF1, a novel
transcription factor involved in tolerance to phosphate starvation in
rice. Plant Physiol 138: 2087–2096
Phosphorus Deficiency in Common Bean Roots
Plant Physiol. Vol. 144, 2007 767 www.plantphysiol.orgon February 1, 2018 - Published by Downloaded from
Copyright © 2007 American Society of Plant Biologists. All rights reserved.
![Phosphorus Stress in Common Bean: Root Transcript · Phosphorus Stress in Common Bean: Root Transcript and Metabolic Responses1[W][OA] Georgina Herna ´ndez*, Mario Ramırez, Oswaldo](https://img.pdfslide.net/doc/110x75/5bdcad1409d3f210678bcbac/phosphorus-stress-in-common-bean-root-transcript-phosphorus-stress-in-common.jpg)