Embed Size (px)
Citation preview

ARTICLE
Received 27 Dec 2013 | Accepted 7 Jun 2014 | Published 11 Jul 2014
Photo-enhanced antinodal conductivityin the pseudogap state of high-Tc cupratesF. Cilento1, S. Dal Conte2,3,w, G. Coslovich4,w, S. Peli2,5, N. Nembrini2,5, S. Mor2, F. Banfi2,3, G. Ferrini2,3,
H. Eisaki6, M.K. Chan7, C.J. Dorow7, M.J. Veit7, M. Greven7, D. van der Marel8, R. Comin9,10, A. Damascelli9,10,
L. Rettig11,w, U. Bovensiepen11, M. Capone12, C. Giannetti2,3 & F. Parmigiani1,4
A major challenge in understanding the cuprate superconductors is to clarify the nature of the
fundamental electronic correlations that lead to the pseudogap phenomenon. Here we use
ultrashort light pulses to prepare a non-thermal distribution of excitations and capture novel
properties that are hidden at equilibrium. Using a broadband (0.5–2 eV) probe, we are able to
track the dynamics of the dielectric function and unveil an anomalous decrease in the
scattering rate of the charge carriers in a pseudogap-like region of the temperature (T) and
hole-doping (p) phase diagram. In this region, delimited by a well-defined T*neq(p) line,
the photoexcitation process triggers the evolution of antinodal excitations from gapped
(localized) to delocalized quasiparticles characterized by a longer lifetime. The novel
concept of photo-enhanced antinodal conductivity is naturally explained within the single-
band Hubbard model, in which the short-range Coulomb repulsion leads to a k-space
differentiation between nodal quasiparticles and antinodal excitations.
DOI: 10.1038/ncomms5353 OPEN
1 Elettra—Sincrotrone Trieste S.C.p.A., I-34149 Basovizza, Italy. 2 Department of Physics, Universita Cattolica del Sacro Cuore, I-25121 Brescia, Italy. 3 i-LAMP(Interdisciplinary Laboratories for Advanced Materials Physics), Universita Cattolica del Sacro Cuore, I-25121 Brescia, Italy. 4 Department of Physics,Universita degli Studi di Trieste, I-34127 Trieste, Italy. 5 Department of Physics, Universita degli Studi di Milano, I-20133 Milano, Italy. 6 NanoelectronicsResearch Institute, National Institute of Advanced Industrial Science and Technology, Tsukuba, Ibaraki 305-8568, Japan. 7 School of Physics and Astronomy,University of Minnesota, Minneapolis, Minnesota 55455, USA. 8 Departement de Physique de la Matiere Condensee, Universite de Geneve, CH1211 Geneve,Switzerland. 9 Department of Physics and Astronomy, University of British Columbia, Vancouver, British Columbia, Canada V6T 1Z1. 10 Quantum MatterInstitute, University of British Columbia, Vancouver, British Columbia, Canada V6T 1Z4. 11 Fakultaet fuer Physik and Zentrum fur Nanointegration (CENIDE),Universitaet Duisburg-Essen, 47048 Duisburg, Germany. 12 CNR-IOM Democritos National Simulation Center and Scuola Internazionale Superiore di StudiAvanzati (SISSA), Via Bonomea 265, 34136 Trieste, Italy. w Present addresses: Department of Physics, Politecnico di Milano, I-20100 Milano, Italy (S.D.C.);Materials Sciences Division, Lawrence Berkeley National Laboratory, Berkeley, California 94720, USA (G.C.); Swiss Light Source, Paul Scherrer Institute, 5232Villigen PSI, Switzerland (L.R.). Correspondence and requests for materials should be addressed to F.C. (email: [email protected]) or to C.G.(email: [email protected]).
NATURE COMMUNICATIONS | 5:4353 | DOI: 10.1038/ncomms5353 | www.nature.com/naturecommunications 1
& 2014 Macmillan Publishers Limited. All rights reserved.

Superconductivity in the cuprates takes place when chargecarriers are injected into a charge-transfer insulator1 inwhich the carriers are localized by the strong electron–
electron interactions. This surprising phenomenon has motivateda remarkable effort to understand to what extent the electron–electron interactions determine the physical properties ofcuprates when tuning these materials away from the insulatingstate by increasing the hole concentration p and the temperatureT. The physics of superconducting cuprates is furthercomplicated by an anisotropic gap (pseudogap) in theelectronic density of states (DOS), which opens well above thesuperconducting critical temperature (Tc) at moderate dopingand takes on maximal values close to the k¼ (±p,0), (0,±p)regions (antinodes) of the Brillouin zone (BZ) (ref. 2). In the sameregion of the p–T phase diagram, different ordered phases havebeen observed. Such phases can be favoured by the reducedkinetic energy of the carriers and might be associated with aquantum critical point underneath the superconducting domeTc(p)3,4. Indeed, a wealth of different broken symmetries, such asunusual q¼ 0 magnetism5–7, charge-density waves (CDW)8,9,stripes10, nematic and smectic phases11–13, have been reported.The universal mechanism underlying the formation of thepseudogap continues to be the subject of intense research14,and the relation between the electronic interactions and thevarious ordering tendencies remains one of the major openquestions.
A possible scenario that reconciles this phenomenology is thatthe pseudogap emerges as an inherent effect of the strong short-range Coulomb repulsion, U, between two electrons occupyingthe same lattice site15. Considering the case of an isotropic Mottinsulator, the U-driven suppression of charge fluctuations isexpected to reduce the electron kinetic energy and render theelectronic excitations increasingly localized in real space. Clustergeneralization of dynamical mean-field theory (DMFT)calculations16–18 suggests that the cuprates exhibit a similar U-driven reduction of kinetic energy that is, however, not uniformin momentum space. In the underdoped region, the antinodalexcitations are indeed quasi-localized, with a T¼ 0 divergentscattering rate that is reminiscent of the Mott insulator (seeFig. 1a), whose self-energy (SE) diverges at low frequency anddecreases at finite temperature. In contrast, the nodal (N)excitations in the vicinity of k¼ (±p/2,±p/2) still retain theessential nature of the quasiparticles (QPs) at large holeconcentrations, that is, a scattering rate that increases whenexternal energy is provided (see Fig. 1b). The possible k-spacedifferentiation between nodal QPs and antinodal excitations inthe pseudogap phase has been hitherto elusive both to k-space-integrated equilibrium techniques, such as optical spectroscopy
and resistivity measurements, that are mostly sensitive to theproperties of nodal QPs and to conventional angle-resolvedphotoemission spectroscopy (ARPES), which has limits incapturing small temperature- and k-dependent variations of theelectronic scattering rate.
Here we adopt a non-equilibrium approach19 based onultrashort light pulses (E100 fs) used to artificially prepare thesystem in a non-thermal state with an excess of antinodal (AN)excitations20. The key element of our experiment, which goesbeyond single-colour pump-probe techniques21–23, is that thedynamics of the optical properties are simultaneously probed overan unprecedentedly broad energy range (0.5–2 eV). Thistechnique allows us to probe the damping of the infraredreflectivity plasma edge and to directly relate the transientreflectivity variation, dR(o,t), to the instantaneous value of theoptical scattering rate. From the outcome of time-resolvedbroadband spectroscopy, we infer that the transient non-thermal state created in the pseudogap phase is characterizedby a scattering rate smaller than that at equilibrium. Theemerging picture is that, on excitation, the localized antinodalstates transiently evolve into more mobile states with a reducedscattering rate. This scenario is corroborated by DMFTcalculations within the single-band Hubbard model and bytime-resolved and ARPES (TR-ARPES) data in the pseudogapstate. Finally, the generality of the concept of photo-enhancedantinodal conductivity in the pseudogap regime is demonstratedby combining the results obtained on different families of copperoxides (Bi- and Hg-based) in a single and universal phasediagram.
ResultsOptical properties of cuprates. Non-equilibrium optical spec-troscopy is emerging as a very effective tool to unravel the dif-ferent degrees of freedom coupled to electrons in correlatedmaterials19,24. After the photoexcitation process, small variationsof the equilibrium optical properties can be measured on atimescale faster than the recovery of the equilibrium QPs’distribution, the complete restoration of the (long-range) orders25
and the heating of the phonons26, thus unveiling an intriguingphysics that cannot be accessed under equilibrium conditions.Single-colour time-resolved reflectivity measurements21–23 havebeen applied in the past to study the pseudogap state, evidencinga characteristic dynamics proportional to the pseudogapamplitude (|Dpg|) and a change of sign of the photoinducedreflectivity variation at TET*. Nonetheless, the inherent lack ofspectral information of single-colour techniques precluded theunderstanding of the origin of this pseudogap-related reflectivity
2.01.51.00.50.0
60
40
20
0
2.01.51.00.50.0
0.9
0.6
0.3
0.0
Mott insulator p=0 Metal p=0.2
in in
–Im
Σ
–Im
Σ|i⟩
|k⟩Localized wavefunction
Delocalized wavefunction
a b
Figure 1 | Electron scattering rate of correlated systems. (a,b) The imaginary part of the electronic SE is calculated, as a function of the Matsubara
frequency on¼ (2nþ 1)pkBT, by solving the single-band Hubbard model via single-site DMFT. The prototypical cases of the Mott insulator (p¼0)
and metallic system (p¼0.2) are reported and contrasted. In the more realistic three-band Hubbard model, the same divergence of the SE is obtained as
the charge-transfer insulating state is approached.
ARTICLE NATURE COMMUNICATIONS | DOI: 10.1038/ncomms5353
2 NATURE COMMUNICATIONS | 5:4353 | DOI: 10.1038/ncomms5353 | www.nature.com/naturecommunications
& 2014 Macmillan Publishers Limited. All rights reserved.

signal. Recent developments in ultrafast techniques now permit toovercome this limitation by probing the dynamics of the dielectricfunction over a broad frequency range. This paves the way to aquantitative modelling of the ultrafast optical response of thepseudogap phase.
To properly model the dynamics of the optical propertiesmeasured in non-equilibrium conditions, we start by introducingthe basic elements that characterize the equilibrium reflectivity,Req(o), of optimally doped Bi2Sr2Y0.08Ca0.92Cu2O8þ d (OP-YBi2212, hole-doping p¼ 0.16, Tc¼ 96 K), shown in Fig. 2a. Inthe infrared region, the normal incidence Req(o) is dominated bya metallic-like response, which is characterized by a broad edge atthe dressed plasma frequency opE1.25 eV. The infraredreflectivity of optimally and overdoped cuprates is well repro-duced by the extended Drude model (EDM)27,28 in which afrequency-dependent optical scattering time, t(o,T), accounts forall the processes that affect the QP lifetime, such as the electronicscattering with phonons, spin fluctuations or other bosons ofelectronic origin. Within the EDM, the optical scattering rate isconnected to the single-particle SE by:
g o;Tð Þ ¼ ‘t o;Tð Þ ¼
Im oZþ1
1
f z;Tð Þ f zþo;Tð Þoþ
P z;Tð ÞP
zþo;Tð Þ dz
24
35 1
o
8<:
9=;ð1Þ
where f is the Fermi–Dirac distribution and S(z,T) and S*(z,T)are the electron and hole k-space-averaged SEs. In Fig. 2a, wereport the best fit of the EDM to the experimental Req(o) of OP-YBi2212 at T¼ 100 K. In the calculation of the SE in equation (1),we use a recently developed model29–31 that takes into account anon-constant QPs’ DOS, N(o,T), characterized by a pseudogapwidth Dpg¼ 40 meV (see Methods section). The k-space-integrated electronic DOS is recovered completely between Dpg
and 2Dpg. The N(o,T) extracted by optical spectroscopy (seeMethods; Supplementary Notes 1 and 2; Supplementary Figs 1and 2) is in agreement with the outcome of tunnellingexperiments32. The quality of the fit to the optical properties
(Fig. 2a) demonstrates that the EDM with a non-constant DOS isa very effective tool to extract the scattering properties ofthe charge carriers, at least for moderate hole-dopingconcentrations. The possible failure of the EDM model isexpected for hole-doping concentrations smaller than those ofthe samples studied in this work. The interband transitions at:o41.5 eV are accounted for by additional Lorentz oscillators atvisible/ultraviolet frequencies. Focusing on the energy rangethat will be probed by the time-resolved experiment (0.5–2 eV),we note that t(o) has almost approached the asymptoticvalue tNE2 fs (see inset of Fig. 2a). Therefore, we can safelyassume that, in the 0.5–2 eV range, the damping of thereflectivity edge depends on the asymptotic value of thescattering rate, gN¼:/tN.
Non-equilibrium optical spectroscopy. In the non-equilibriumoptical spectroscopy, snapshots of the reflectivity edge of OP-YBi2212 are taken with 100 fs time resolution, as a function of thedelay from the excitation with the 1.5 eV pump pulses. Con-sidering that the temporal width of the probe pulses is muchwider than the inherent scattering time of the charge carriers(tNE2 fs), we can assume that the electronic excitations havecompletely lost any coherence on a timescale faster than theobservation time. Therefore, the transient optical properties canbe rationalized by changing some effective parameters in theequilibrium reflectivity.
Notably, Req(o,gN) exhibits an isosbestic point (see Fig. 2a)at the frequency ~o 1:1 eV. At this frequency, the reflectivityis independent of gN and, for small dgN changes, it canbe expanded as dR(o,gN)¼ [qR(o)/qgN]dgN, where [qR(o)/qgN]4(o)0 for o4 oð Þ~o (see Supplementary Note 3;Supplementary Fig. 3). Therefore, the reflectivity variation,measured over a broad frequency range across ~o, can provide adirect information about the instantaneous value of the totalscattering rate during the thermalization process of the photo-induced non-equilibrium QP population. In the bottom panel ofFig. 2a, we report the normalized reflectivity variation dR/R(o),calculated from the equilibrium EDM model by assuming apositive (red line) or negative (blue line) variation of the total
2
34567
0.1
2
34567
1a b
Req
()
2.52.01.51.00.50.0
Energy (eV)
Req()
EDM fit 10% increase 10% decrease
T=100 K
450
350
250
Pulsed
probe
(m
eV)
2.01.51.00.5Energy (eV)
t=100 fs
2.5
2.0
1.5
1.0
(fs)
R/R
()
(a.u
.)
2.0
1.8
1.6
1.4
1.2
1.0
0.8
0.6
Ene
rgy
(eV
)
43210–1
Delay (ps)
–1.0
–0.5
0.0
0.5
1.0
×10–3
t=100 fs
Figure 2 | Equilibrium and non-equilibrium optical spectroscopies. (a) The equilibrium reflectivity of an OP-YBi2212 sample, measured at T¼ 100 K in the
0–2.5 eV spectral range, is reported (yellow dots). The black line is the fit of the equilibrium EDM to the data. The red (blue) curve is the reflectivity
obtained from the EDM, in which an increase (decrease) in the optical scattering rate is artificially introduced. The bottom panel displays the relative
reflectivity variation in the case of an increase (red line) and a decrease (blue line) in the optical scattering rate. The optical scattering rate,
g oð Þ ¼ h=t oð Þ ¼ ho2p=4pRe 1=sD oð Þð Þ, is reported in the inset. The grey bar highlights the spectral range probed by the non-equilibrium spectroscopy.
(b) The relative reflectivity variation, dR/R(o,t), is reported as a function of the probe photon energy (:o) and pump-probe delay t in the form
of an intensity map. The colour coding for dR/R(o,t) is indicated by the colourscale.
NATURE COMMUNICATIONS | DOI: 10.1038/ncomms5353 ARTICLE
NATURE COMMUNICATIONS | 5:4353 | DOI: 10.1038/ncomms5353 | www.nature.com/naturecommunications 3
& 2014 Macmillan Publishers Limited. All rights reserved.

scattering rate, gN. The reflectivity variation associated with achange in gN extends over a broad frequency range and itchanges sign when crossing the isosbestic point ~o.
Figure 2b shows the frequency-resolved measurements on OP-YBi2212 at T¼ 100 K, as a function of the delay t from the pumppulse. The relative reflectivity variation dR/R(o,t)¼ [Rneq(o,t)Req(o)]/Req(o), where Rneq is the non-equilibrium reflectivity, isreported as a two-dimensional (2D) plot. The colour scalerepresents the magnitude of dR/R(o,t) as a function of t and ofthe probe photon energy :o. Soon after the excitation, dR/R(o,t)is positive below ~o, whereas a negative signal is detected above ~o.When compared with the dR/R(o) calculated for dgNo0(bottom panel of Fig. 2a), the measured dR/R(o,t) suggests atransient decrease in the QP scattering rate soon after theexcitation with the pump pulse.
To substantiate the possible transient variation of gN, adifferential model is used to quantitatively analyse the dR/R(o,t)signal. This approach consists in finding out the minimal set ofparameters that should be changed in the equilibrium dielectricfunction to satisfactorily reproduce the measured dR/R(o,t) at agiven time t. The main goal of this procedure is to disentangle thecontributions of the genuine variation of gN, from that ofpossible photoinduced band-structure modifications, such as thetransient filling of the pseudogapped electronic states31,33. InFig. 3, we report a slice of dR/R(o,t) (red dots) at fixed delay time,that is, t¼ 100 fs. dR/R(o, t¼ 100 fs) is qualitatively reproduced,over the whole probed frequency range, by modifying only twoparameters in the equilibrium EDM, that is, N(o,T) and gN. Incontrast, no change in the interband transitions and in the plasmafrequency is required. This demonstrates that, in the probedspectral range, the dR/R(o) signal is not significantly affected bythe transient change in the electronic occupation at the pumpenergy scale or by other excitonic-like processes and that thedensity of the charge carriers is not significantly modified by theexcitation process. Similarly, Fig. 3 also displays the contributionsto the dR/R(o, t¼ 100 fs) signal, as arising from the variation ofN(o,T) (green line) and gN (blue line), separately. The centralresult is that a negative gN variation is necessary to reproduce dR/R(o,t¼ 100 fs). dgNo0 corresponds to a narrowing of thereflectivity plasma edge around the isosbestic point at ~o (seeFig. 2a), which is detected as a broad reflectivity variationchanging from positive to negative when moving to highfrequencies. Quantitatively, the relative variation dgN/gN¼ (1.2±0.4) 10 2 is extracted from the fittingprocedure. For sake of clarity, we show in Fig. 3 the total dR/R(o) calculated (black dashed line) by constraining a positivedgN/gN¼ þ 1.2 10 2 variation (red dashed line). In this case,the main features of the measured dR/R(o) cannot be, evenqualitatively, reproduced. This demonstrates that, while theexperimental uncertainties can affect the absolute value of dgN/gN, the transient photoinduced decrease in the scattering rate is arobust experimental fact that is unaffected by possibleuncertainties, such as fluence fluctuations or changes in thepump-probe overlap.
The characteristic relaxation time t of the measured dgN isobtained by fitting the function dR/R(t)¼ dR/R(0)exp( t/t) tothe time-resolved traces at fixed frequencies. In particular, wefocus on the time traces at :o¼ 0.68 and 1.55 eV, shown inFig. 3b,c, for which the contribution from the N(o,T) variation isnegligible. The resulting value, t ¼ 600±50 fs (see SupplementaryNote 4; Supplementary Fig. 4), is of the same order as that of thetime required for the complete heating of the lattice and for therecovery of the equilibrium QPs’ population, as will be shown bythe time-resolved photoemission measurements. Interestingly, onthe picosecond timescale, the dR/R(o) signal is qualitativelyopposite to the signal at tE100 fs, as shown by the time traces in
Fig. 3b,c. In particular, it changes from negative to positive as oincreases and crosses ~o. The dR/R(o, t41 ps) signal can bereproduced by a broadening of the reflectivity edge, equivalent toan increase in the scattering rate (dgN/gN¼ 10 4), with anegligible contribution from the variation of N(o,T). This gNincrease is compatible with a local effective heating (dT¼ 0.6 K)of the lattice, which can be estimated considering the pumpfluence (10 mJ cm 2) and the specific heat of the sample (seeSupplementary Note 5; Supplementary Fig. 5).
The transient decrease in the total electronic scattering rate,measured on the sub-picosecond timescale at T¼ 100 K, is anovel finding that contrasts both with the results26 obtained wellabove the pseudogap temperature and with the behaviourexpected for a metallic system. In the latter case, the scatteringrate should increase as energy is delivered, either adiabatically orimpulsively. Furthermore, as inferred from the dR/R(o,t)
0
4
420Delay (ps)
0
4
420Delay (ps)
2.5×10⁻³
2.0
1.5
1.0
0.5
0.0
–0.5
–1.0
2.001.751.501.251.000.750.50Energy (eV)
δN(0,T )=0.2
Simulation with δ∞/∞>0
T=100 K
1.55 eV
0.68 eVδ∞/∞=+1.2×10–2
δ∞/∞=–1.2×10–2
Model fit to δR/RδR /R (, t=100 fs)
δR/R
()
δR/R
(t)
δR/R
(t)
δR/R (0.68 eV,t )
δR/R (1.55 eV,t )
–4×10⁻⁴ –4×10⁻⁴
Figure 3 | Differential model for the non-equilibrium reflectivity. (a) The
dR/R(o, t¼ 100 fs), measured on the OP-YBi2212 sample at T¼ 100 K, is
reported (red dots). The solid black line is the result of the fitting procedure
of the differential model to dR/R(o, t¼ 100 fs), in which the DOS
N(o,T) (see Methods) and gN have been considered as free parameters.
The contribution of each effect is shown separately: the green line
represents the filling of the pseudogap DOS (dNNneq(0,T)–Neq(0,T)¼0.2±0.02), in agreement with recent time-resolved ARPES results33; the
blue line is related to the relative decrease of gN. The dashed red line
represents the dR/R(o) due to an increase in the scattering rate. The
dashed black line represents the calculation of dR/R(o), assuming dN¼0.2
and dgN/gN¼ þ 1.2 10 2. The red arrows highlight the probe energies
at which the dynamics of the dgN/gN variation is investigated. The
measurements at oo1.2 eV have been performed by tuning the probe
wavelength through an optical parametric amplifier (see Methods).
Therefore, each point at oo1.2 eV belongs to a different time-domain
measurement in which the uncertainty in the absolute amplitude (reported
as a red bar) is larger than that of the measurements in the o41.2 eV
frequency range. The error bars, accounting for the uncertainties in the
pump fluence, size and spatial overlap with the probe beam, have been
used as the weight for the fit. (b,c) Single-color time traces at photon
energies :o¼0.68 and 1.55 eV.
ARTICLE NATURE COMMUNICATIONS | DOI: 10.1038/ncomms5353
4 NATURE COMMUNICATIONS | 5:4353 | DOI: 10.1038/ncomms5353 | www.nature.com/naturecommunications
& 2014 Macmillan Publishers Limited. All rights reserved.

measured in local quasi-equilibrium conditions (t41 ps), thisanomalous dgNo0 cannot originate from the partial quench ofan order parameter or a temperature-induced decrease in theelectron–boson coupling. In fact, the expected positive dgN40 isrecovered at t41 ps, although on this timescale an increase in theeffective electronic and bosonic temperatures and the relatedamplitude decrease in the possible order parameter are attained.
Non-equilibrium broadband optical spectroscopy cruciallybroadens the information that could be reached in the past bysingle-colour techniques. The quantitative modelling of thedynamics of the dielectric function in the 0.5–2 eV energy rangedemonstrates that, after the impulsive photoexcitation, theoptimally doped YBi2212 sample at 100 K is driven into a non-equilibrium state, characterized by a scattering rate smaller thanthat at equilibrium (dgNo0). In terms of the a.c. conductivity,this corresponds to a transient increase in the conductivity, onceassumed a constant density of the charge carriers. The relaxationtime of this photo-enhanced conductivity is t ¼ 600±50 fs. Onthe picosecond timescale, the equilibrium distribution, dominatedby nodal QPs, is recovered and a more conventional behaviour ofthe scattering rate (dgN40) is observed, in agreement with theoutcomes of conventional equilibrium techniques, such asresistivity and optics34,35.
The k-space-dependent non-equilibrium QP population. Sincethe energy scale of the pump photons (1.5 eV) is much larger thanthe thermal (kBTE10 meV) and the pseudogap (DpgE40 meV)energy scales, the photoinduced QPs’ distribution is expected tohave no relation with the equilibrium one. The photoexcitationprocess can be roughly reduced to two main steps. In the first step,the pump pulse is absorbed creating electron–hole excitationsextending from 1.5 to þ 1.5 eV across the Fermi energy (EF)and with a distribution that is regulated by the joint DOS of thephotoexcitation process. In consequence of the extremely shortscattering time of high-energy excitations (tN¼ :/gNE2 fs), thisphotoexcited population undergoes a fast energy relaxation relatedto multiple scattering processes that lead to the creation of exci-tations at energies closer to EF. Considering the k-space-integratedDOS in the pseudogap state, a high density of excitations isexpected to accumulate, within the pump-pulse duration
(0–100 fs), in the Dpg 2Dpg energy range from EF. In the secondand slower step, the subset of scattering processes that allow largemomentum exchange, while preserving the energy conservation,leads to the recovery of a quasi-equilibrium distribution domi-nated by nodal QPs. Considering the phase-space constraints forthese processes, the redistribution of excitations in the k-space isexpected to be effective on the picosecond timescale.
To directly investigate the k-space electron distribution afterthe photoexcitation process with 1.5 eV ultrashort pulses, weapply a momentum-resolved technique. TR-ARPES (see Methodssection) is applied to measure the transient occupation atdifferent k-vectors36,37 along the Fermi arcs (see Fig. 4a) of aBi2Sr2CaCu2O8þ d single crystal at T¼ 100 K. When consideringthe TR-ARPES spectra at fixed angles F from the antinodaldirection (see Fig. 4a), the pump excitation results in a depletionof the filled states below EF and a filling of the states above EF
36.In the following, we will focus on the integral (I) of the TR-ARPES spectra for E4EF, which is proportional to the totalexcess of excitations in the empty states. Figure 4b reports thevariation of I normalized to the intensity before the arrival of thepump pulse (DIF(t)/IF) as a function of F. For each value of F,DIF(t)/IF is fitted by a single exponential decay of the formDIF0exp( t/tF), convoluted with a Gaussian function to accountfor the finite temporal resolution (B100 fs). Figure 4c,d shows thek-dependent values of DIF0 and tF extracted from the fittingprocedure. Within the error bars, DIF0 increases by a factor 3when moving from the node (F¼ 45) towards the antinodalregion of the BZ, indicating an effective photoinjection of ANexcitations. This situation is dramatically different from thatexpected in equilibrium conditions, in which the number ofexcitations is governed solely by the Fermi–Dirac distribution attemperature T. In this case, the excitations’ density shouldsignificantly decrease when approaching the AN region of the BZ,as a consequence of the gap Dpg44kBT in the density ofelectronic states. Another notable result is that the relaxation timetF is k-dependent, increasing from 300 to 800 fs when movingfrom the N to the AN region. These values are much larger thanthe total optical scattering time (tN¼:/gNE2 fs), whichdemonstrates that the recovery of a quasi-equilibrium QPs’distribution is severely constrained, either by the phase spaceavailable for the scattering processes simultaneously conserving
N
AN
543210
Delay (ps)
1
0
453015
–0.8
–0.6
–0.4
–0.2
0.0
–0.8 –0.6 –0.4 –0.2 0.0
–4
Γ0
kx (Å–1)
k y (
Å–1
)
ΔI/I
(a.
u.)
δR/R
(×1
04 )
δR/R(h=1.55eV, t )-
Φ=18°Φ=37° Φ=45°
Φ=27° ΔI0
(a.u
.)t
(ps
)-
FS angle Φ (°)
Φ
a b c
d
Figure 4 | Equilibrium and non-equilibrium photoemission. (a) The YBi2212 FS, measured by conventional ARPES at 100 K, is reported. The two FS
replicas surrounding the main FS are due to surface reconstruction. The G point and the FS k-space regions where the TR-ARPES measurements
have been performed are indicated by full dots. F is the FS angle from the antinode. (b) The normalized integrated variation of the TR-ARPES intensity
above EF, DIF(t)/IF, is reported for different points along the Fermi arcs (F¼ 18, 27, 37, 45). Solid lines are the fit to the data with a single exponential
decay, DIF0 exp t=t-ð Þ. In the top panel, the dR/R(t) trace at 1.55 eV is reported for comparison. (c,d) The maximum intensity variation, DIF0,
and the decay time, t-F , of the non-equilibrium transient population measured by TR-ARPES are reported as a function of F. The error bars include the
experimental uncertainty related to the possible alignment errors of the sample angle.
NATURE COMMUNICATIONS | DOI: 10.1038/ncomms5353 ARTICLE
NATURE COMMUNICATIONS | 5:4353 | DOI: 10.1038/ncomms5353 | www.nature.com/naturecommunications 5
& 2014 Macmillan Publishers Limited. All rights reserved.

energy and momentum, or by some bottleneck effect related tothe emission of gap-energy bosons during the relaxation of ANexcitations.
TR-ARPES demonstrates that, soon after the excitation with1.5 eV pump pulses, an excess number of low-energy electronexcitations is accumulated in the antinodal region. Furthermore,the relaxation time of this non-equilibrium distribution issignificantly k-dependent. Taken together, these results provethat this non-equilibrium electron distribution in the k-spacecannot be described by a Fermi–Dirac distribution with a singleeffective electronic temperature that is evolving in time. At thesimplest level, we can assume that the effective temperatureincrease in the excitations in the antinodal region is larger thanthat of the nodal QP population. Notably, the k-space-averagedrelaxation time of the non-equilibrium distribution,/tFS¼ 550±200 fs, is the same, within the error bars, as ofthe relaxation time of the transient dgNo0 measured by non-equilibrium optical spectroscopy. This result demonstrates thedirect relation between the creation of a non-thermal distributionwith an excess of antinodal excitations and the transient decreasein the scattering rate measured by non-equilibrium opticalspectroscopy.
T*neq(p) line emerging from non-equilibrium spectroscopy.
The use of ultrashort light pulses to manipulate the equilibriumQP distribution is crucial to investigate the cuprate phase diagramfrom a perspective that was hitherto inaccessible. In this section,we report on the T*
neq(p) temperature below which the transientreduction of gN is observed via non-equilibrium optical spec-troscopy. As shown in Fig. 3a, for o significantly above op, thecontribution to dR/R(o,t) due to the modification of N(o) isnegligible. Therefore, single-colour pump-probe measurements at1.55 eV probe photon energy contain the direct signature of thetransient dgNo0, in the form of a negative component21,22 withrelaxation time t ¼ 600 fs23. Figure 5a reports some of the single-colour time traces measured as a function of the temperature(from 300 to 20 K) for different hole concentrations. The negativecomponent (blue colour) appears in the dR/R(t) signal at
T*neq¼ 240±20 K for p¼ 0.13 and at T*
neq¼ 165±20 K forp¼ 0.16. Above p¼ 0.18, this negative dR/R(t) signal is neverdetected on cooling the sample down to Tc (see SupplementaryNotes 6 and 7; Supplementary Figs 6, 7 and 8). A similarbehaviour is also found for underdoped HgBa2CuO4þ d (Hg1201;see Supplementary Note 8; Supplementary Figs 9,10 and 11).Hg1201 is considered a nearly ideal single-layer cuprate andexhibits a maximal critical temperature close to that of double-layer YBi221238,39. Collecting the results for the two materials onthe same plot, we obtain a phase diagram that shows a universalbehaviour for the properties of different copper-oxide-basedsuperconductors having the same maximal critical temperature.Figure 5b shows that the p–T phase diagram of cuprates isdominated by an ubiquitous and sharp T*
neq(p) boundary. Belowthis line, the pump-induced non-thermal distribution of thecharge carriers exhibits a scattering rate smaller than that atequilibrium. This pseudogap-like T*
neq(p) boundary meets thesuperconducting dome slightly above P¼ 0.18. Below Tc, thecontinuation of the T*
neq(p) line delimits two regions of thesuperconducting dome that exhibit opposite variation of theoptical spectral weight of intra- and inter-band transitions24,40–42,related to the crossing from a kinetic energy gain- to a potentialenergy gain-driven superconducting transition, consistent withpredictions for the 2D Hubbard model43.
Further insight into the T*neq(p) line unveiled by non-
equilibrium optical spectroscopy is provided by the comparisonwith the pseudogap temperature T*(p) estimated from comple-mentary equilibrium techniques7,14,44,45 (elastic neutronscattering, resistivity and resonant ultrasound spectroscopy) andwith the onset temperature of different ordered states46–48
(CDW, time-reversal symmetry-breaking states and fluctuatingstripes). The picture sketched in Fig. 5c compares the mainphenomenology on the most common materials with similarcritical temperatures (Bi2212, Hg1201, YBCO). Remarkably, theT*
neq(p) line almost exactly coincides with the pseudogap lineestimated by resistivity measurements45 and ultrasoundspectroscopy14 and with the onset of the newly-discoveredq¼ 0 exotic magnetic order7,44. The appearance of ordered
KEgain
KEloss
350
300
250
200
150
100
50
0
Tem
pera
ture
(K
)
YBi2212 Non-eq.Hg1201 Non-eq.
TmagT
Tstripes TRUS (YBCO) TCDW (YBCO) TKerr (YBCO)
KEgain
KEloss
350
300
250
200
150
100
50
0
Tem
pera
ture
(K
)
43210Delay (ps)
43210Delay (ps)
43210Delay (ps)
YBi2212 UDTc=88 K, p=0.13
YBi2212 OPTc=96 K, p=0.16
YBi2212 ODTc=83 K, p=0.2
0.30 0.00 0.15Doping
0.300.150.00Doping
YBi2212 Hg1201 Tc
Correlation-drivk-space scattering differentiationen
–0.2 –0.1 0.0 0.1 0.2R/R×103
Figure 5 | The cuprate phase diagram from non-equilibrium spectroscopy. (a) The relative reflectivity variation dR/R(t) measured at the probe energy of
1.55 eV is reported as a function of the temperature (from 300 to 20 K) for three YBi2212 samples with different hole concentrations: underdoped
(UD, Tc¼88 K), optimally doped (OP, Tc¼96 K) and overdoped (OD, Tc¼ 83 K). The white lines are the dR/R(t) time traces at 110 K. (b) The general phase
diagram of cuprates, as unveiled by non-equilibrium reflectivity measurements, is sketched. The pseudogap boundary T*neq (grey curve) is determined
reporting the temperature at which a negative component in the dR/R(t) signal appears on YBi2212 (black dots) and underdoped Hg1201 (purple dots)
samples with Tc¼ 55 and 95 K. The grey circles indicate some of the temperatures at which the dR/R(t) data have been taken. The empty (full)
circles correspond to a (non) zero negative signal in the dR/R(t) time traces. The green markers denote the critical temperature Tc of the samples. (c) The
T*neq(p) temperatures extracted from time-resolved optical spectroscopy experiments are compared with the values of T*(p) extracted from resistivity45
(green diamonds) and ultrasound spectroscopy14 (purple stars) on Bi2212 and YBCO and with the onset of the newly-discovered q¼0 exotic
magnetic order7,44 (blue squares) on Bi2212 and Hg1201. We also compare T*neq(p) with the onset of ordered states, like CDW order47(yellow diamonds)
in YBCO, fluctuating stripes48 (red triangles) in Bi2212 and time-reversal symmetry-breaking states in YBCO46 (blue hexagons). KE, kinetic energy;
non-eq., non-equilibrium.
ARTICLE NATURE COMMUNICATIONS | DOI: 10.1038/ncomms5353
6 NATURE COMMUNICATIONS | 5:4353 | DOI: 10.1038/ncomms5353 | www.nature.com/naturecommunications
& 2014 Macmillan Publishers Limited. All rights reserved.

states at ToT* is likely the consequence of the instability of thecorrelated pseudogap ground state on further cooling.
The antinodal scattering rate. The results reported in the pre-vious sections suggest that the T*
neq(p) line delimits a region inwhich the AN states evolve into more metallic ones (dgNo0) onphotoexcitation with the pump pulses. The generality of theresults obtained calls for a general model that accounts for thephase diagram unveiled by the non-equilibrium optical spectro-scopy. Considering that the measured transient decrease in thecarrier scattering rate is faster than the complete heating of thelattice, we focus on the minimal model that neglects electron–phonon coupling and retains the genuine physics of correlations,that is, the 2D Hubbard Hamiltonian49,50. To compute thetemperature-dependent SE in different positions of the BZ, we usethe dynamical cluster approximation, a cluster extension ofDMFT that captures the k-space differentiation of the electronicproperties17 between different regions of the BZ (see Methodssection). Furthermore, long-range correlations are neglected tofocus on the intrinsic effect of short-range correlations inside thechosen four-site cluster (see Methods section). At this stage, theincrease in energy related to the pump excitation is mimicked byselectively increasing the effective temperature of the nodal andantinodal SEs.
The FS of a lightly doped system is reported in Fig. 6a andexhibits a progressive smearing when moving from the nodes to
the antinodes. This result is qualitatively in agreement with the FSexperimentally measured by conventional ARPES in prototypicalcuprates (compared with the ARPES data on optimally dopedBi2Sr2Y0.08Ca0.92Cu2O8þ d at 100 K reported in Fig. 4a). Thesmearing of the FS at antinodes reflects a strong dichotomybetween the scattering rate of nodal and antinodal excitations thatcan be captured by plotting the imaginary parts of the calculatedSE, that is, the inverse QP lifetime, as a function of the effectivetemperature (see Fig. 6c). In contrast to nodal QPs, whosescattering rate increases with temperature, the scattering rate ofantinodal excitations exhibits a completely different evolution,decreasing as the effective temperature rises. This anomalousbehaviour is related to the localized and gapped character of theantinodal fundamental excitations that experience very strongelectronic interactions at low temperatures. The concept ofdelocalized QPs, characterized by a smaller scattering rate, isprogressively recovered when the temperature increases. Thisstriking dichotomy of the nature of the elementary excitations inthe k-space is the consequence of a momentum-space selectiveopening of a correlation-driven gap, which eventually evolves intothe full Mott gap at p¼ 0. The same physics has been previouslyidentified in calculations based on similar approaches (also usinglarger clusters to achieve a better momentum resolution)16–18,51.When the hole doping is increased (see Fig. 6b,d), the k-spacedifferentiation of N–AN fundamental excitations is washed outand a more conventional metallic behaviour is recovered. In thiscase, the delocalized QPs exhibit a gapless energy spectrum and ascattering rate that is proportional to a power function of thetemperature over the entire BZ.
DMFT calculations thus confirm an intrinsic U-drivenmomentum-space differentiation of the electronic properties ofcuprates at finite hole concentrations and temperatures. Thenature of the AN states is similar to that of a Mott insulator inthe sense that the scattering rate of AN states decreases when theinternal energy of the system is increased.
DiscussionWrapping up the experimental outcomes collected in this work,we can gain a novel insight into the pseudogap physics of high-Tc
cuprates. Time-resolved optical spectroscopy demonstrates that,on excitation with 1.5 eV pump pulses, the optical properties ofcuprates transiently evolve into those of a more conductivesystem (dgNo0). TR-ARPES shows that the k-space distributionof the electron excitations created by the pump pulse ischaracterized by an excess of AN electrons. Finally, the reportedobservation of a transient enhancement of the conductivityunveils a universal and sharp pseudogap-like T*
neq(p) boundaryin the p–T phase diagram. All these results cannot be rationalizedin terms of the simple consequence of an anisotropic scattering ofQPs with bosonic fluctuations, such as antiferromagnetic spinfluctuations. Although antiferromagnetic correlations maystrongly influence the dynamics of AN excitations, the energyprovided by the pump pulse should necessarily result in anincrease in the boson density, leading to an increase in thescattering rate for all the timescales. Furthermore, the transientdecrease in the scattering rate on the sub-picosecond timescalecannot be related to the presence of incipient charge orders, suchas CDW, which are quenched by the pump pulse. The picoseconddynamics of conventional CDW has been widely studied inweakly correlated (UE0) materials25,52. After the impulsiveexcitation, the characteristic timescale for the CDW recovery ison the order of several picoseconds, that is, much longer than thetransient dgNo0 measured in our work. Even assuming a purelyelectronic (and faster) density wave mechanism in cuprates, thephotoinduced decrease in the scattering rate should mono-
4
3
2
1
0
0.100.080.06
UD (p=0.05)
AntinodalNodal
AntinodalNodal
–0.6
–0.3
0.0a b
c d
k y (
Å–1
)
–0.6 –0.3 0.0
kx (Å–1)
–0.6
–0.3
0.0
k y (
Å–1
)
–0.6 –0.3 0.0
kx (Å–1)
4
3
2
1
0
Im
/t
Im
/t
0.100.080.06
kBT/t kBT/t
OD (p=0.20)
N
ANAN
N
Figure 6 | The single-band Hubbard model and cluster-DMFT (CDMFT).
(a,b) The FS reconstructed from CDMFT, for an UD (p¼0.05) and an OD
(p¼0.2) sample, are reported. (c,d) The imaginary parts of the electronic
SE, calculated through CDMFT as a function of the temperature, are
reported for the UD and the OD samples, respectively. The effective
temperature is expressed in units of the nearest-neighbor hopping t.
Assuming a reasonable value t¼0.3 eV, kT/t¼0.1 corresponds to
T¼ 350 K. The values of the parameters used in the calculations are U¼ 9t
and t’¼ 0.25t. The imaginary parts of the SEs are calculated using
dynamical cluster approximation (see ref. 4 and Methods section) and four
equal-area partitions of the BZ. Following ref. 4, the nodal and antinodal SEs
are calculated in the regions centred in k¼ (0,0) (N) and k¼ (±p,0),
(0,±p) (AN), as shown in a and b.
NATURE COMMUNICATIONS | DOI: 10.1038/ncomms5353 ARTICLE
NATURE COMMUNICATIONS | 5:4353 | DOI: 10.1038/ncomms5353 | www.nature.com/naturecommunications 7
& 2014 Macmillan Publishers Limited. All rights reserved.
tonically decrease eventually approaching a zero value. This is incontrast with the experimental observation of a transition fromdgNo0 to dgN40 on the picosecond timescale.
On the other hand, the Hubbard model provides a minimalframework for the interpretation of the pseudogap region ofcuprates as unveiled by time-resolved spectroscopies. The pumppulse provides energy to the system in a non-thermal way,which can be schematized as a larger increase in the effectivetemperature of AN excitations as compared with that of nodalQPs. The transient decrease in the scattering rate (dgNo0) isthus related to the evolution of AN excitations from Mott-likegapped excitations to delocalized QPs with a longer lifetime. Onthe picosecond timescale, the equilibrium electronic distributionis recovered and the expected dgN40 is measured. Although thispicture does not exhaust all the properties of the pseudogap, itcaptures a key element of the universal and fundamental natureof the antinodal states, providing a backbone for more realisticmulti-band descriptions3 that could give rise to a broken-symmetry state originating from a quantum phase transition4 atT¼ 0. Furthermore, the short-range Coulomb repulsion induces asuppression of the charge fluctuations below the T*
neq(p) line thatis opposite to the effect of temperature. Therefore, the region ofthe cuprate phase diagram delimited by T*
neq(p) is intrinsicallyprone to bulk53,54 and surface55,56 phase-separated instabilities,whose nature depends on the details of the Fermi surface (FS) ofthe particular system considered. Interestingly, the region of thecuprate phase diagram in which the optical photoexcitationcreates a non-equilibrium state with longer lifetime closelycorresponds to that in which the possibility of creating a transientsuperconductive state by tetrahertz excitation has been recentlydiscussed57,58. These findings suggest a general tendency ofcopper oxides to develop, when photoexcited, a transient non-equilibrium state that is more conductive than the equilibriumphase.
MethodsSamples. The Y-substituted Bi2212 single crystals were grown in an image furnaceby the travelling solvent floating-zone technique with a non-zero Y content tomaximize Tc
38. The underdoped samples were annealed at 550 C for 12 days in avacuum-sealed glass ampoule with copper metal inside. The overdoped sampleswere annealed in a quartz test tube under pure oxygen flow at 500 C for 7 days. Toavoid damage of the surfaces, the crystals were embedded in Bi2Sr2CaCu2O8þ dpowder during the annealing procedure. In both cases, the quartz tube wasquenched into ice-water bath after annealing to preserve the oxygen content atannealing temperature.
The Hg1201 single crystals were grown using a flux method, characterized andheat treated to the desired doping level39. The crystal surface is oriented along theab-plane with a dimension of about 1 mm2. Hg1201 samples are hygroscopic.Therefore, the last stage of the preparation of the sample surface is done under acontinuous flow of nitrogen, on which the sample is transferred to the high-vacuum chamber (10 7 mbar) of the cryostat within a few minutes. Before eachmeasurement, the surface is carefully checked for any evidence of oxidation.
Optical spectroscopy. The ab-plane dielectric function at equilibrium of theYBi2212 samples has been measured using conventional spectroscopic ellipso-metry59. The dielectric function has been obtained by applying the Kramers–Kronig relations to the reflectivity for 50oo/2pco6,000 cm 1 and directly fromellipsometry for 1,500oo/2pco36,000 cm 1.
The dR/R(o,t) data presented in Fig. 2 have been acquired combining twocomplementary techniques60: (i) a pump supercontinuum-probe setup61, based onthe white light generated in a photonic crystal fibre seeded by a Ti:sapphire cavity-dumped oscillator, to explore the visible–near infrared range of the spectrum (1.1–2 eV); (ii) a pump tunable-probe setup, based on an optical parametric amplifierseeded by a regenerative amplifier, to extend measurements in the infrared spectralregion (0.5–1.1 eV). In both cases, the laser systems operate at 250 kHz repetitionrate. The pump fluence is set to 10±2 mJ cm 2 for spectroscopic measurements.Single-colour measurements (:o¼ 1.55 eV), presented in Fig. 5, have beenperformed directly using the output of a cavity-dumped Ti:sapphire oscillator. Thehigh-frequency modulation of the pump beam, combined with a fast scan of thepump-probe delay and lock-in acquisition, ensures a high signal-to-noise ratio(B106) and fast acquisition times, necessary to study the evolution of the time-resolved optical properties as a function of the temperature. Single-colour
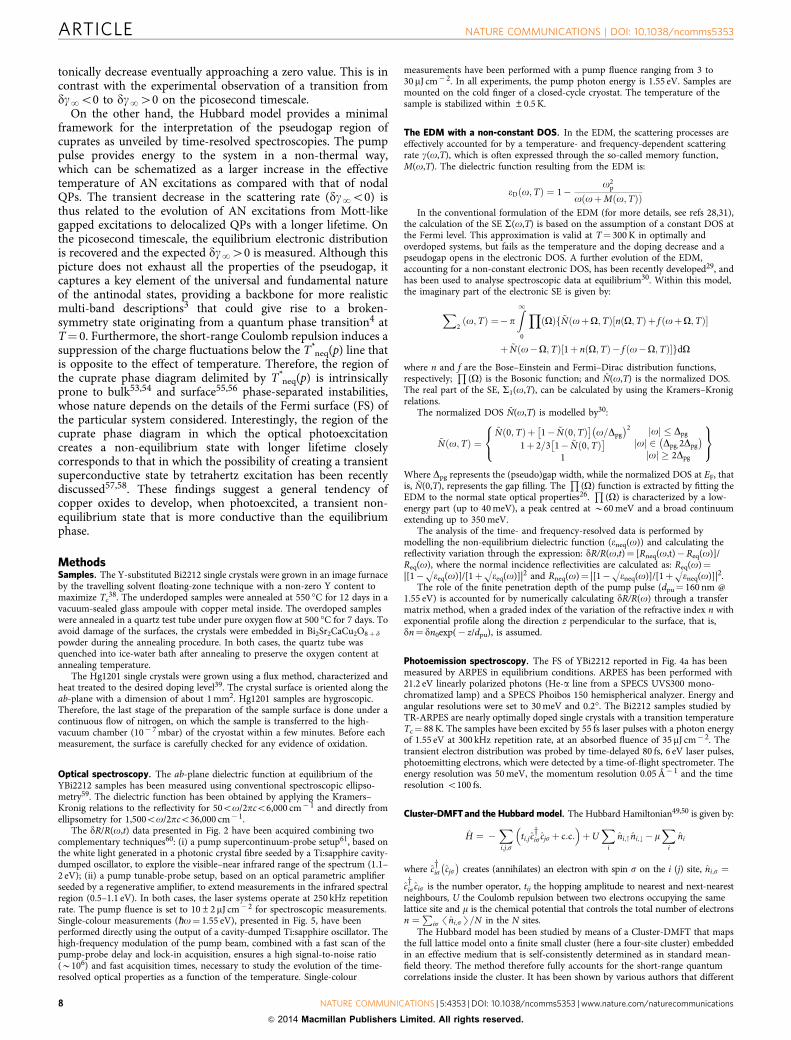
measurements have been performed with a pump fluence ranging from 3 to30 mJ cm 2. In all experiments, the pump photon energy is 1.55 eV. Samples aremounted on the cold finger of a closed-cycle cryostat. The temperature of thesample is stabilized within ±0.5 K.
The EDM with a non-constant DOS. In the EDM, the scattering processes areeffectively accounted for by a temperature- and frequency-dependent scatteringrate g(o,T), which is often expressed through the so-called memory function,M(o,T). The dielectric function resulting from the EDM is:
eD o;Tð Þ ¼ 1o2
p
o oþM o;Tð Þð ÞIn the conventional formulation of the EDM (for more details, see refs 28,31),
the calculation of the SE S(o,T) is based on the assumption of a constant DOS atthe Fermi level. This approximation is valid at T¼ 300 K in optimally andoverdoped systems, but fails as the temperature and the doping decrease and apseudogap opens in the electronic DOS. A further evolution of the EDM,accounting for a non-constant electronic DOS, has been recently developed29, andhas been used to analyse spectroscopic data at equilibrium30. Within this model,the imaginary part of the electronic SE is given by:
X2o;Tð Þ ¼ p
Z1
0
YOð Þf~N oþO;Tð Þ n O;Tð Þþ f oþO;Tð Þ½
þ ~N oO;Tð Þ 1þ n O;Tð Þ f oO;Tð Þ½ gdO
where n and f are the Bose–Einstein and Fermi–Dirac distribution functions,respectively;
Q(O) is the Bosonic function; and N(o,T) is the normalized DOS.
The real part of the SE, S1(o,T), can be calculated by using the Kramers–Kronigrelations.
The normalized DOS N(o,T) is modelled by30:
~N o;Tð Þ ¼~N 0;Tð Þþ 1 ~N 0;Tð Þ
o=Dpg 2
1þ 2=3 1 ~N 0;Tð Þ
1
oj j Dpg
oj j 2 Dpg;2Dpg
oj j 2Dpg
8<:
9=;
Where Dpg represents the (pseudo)gap width, while the normalized DOS at EF, thatis, N(0,T), represents the gap filling. The
Q(O) function is extracted by fitting the
EDM to the normal state optical properties26.Q
(O) is characterized by a low-energy part (up to 40 meV), a peak centred at B60 meV and a broad continuumextending up to 350 meV.
The analysis of the time- and frequency-resolved data is performed bymodelling the non-equilibrium dielectric function (eneq(o)) and calculating thereflectivity variation through the expression: dR/R(o,t)¼ [Rneq(o,t)Req(o)]/Req(o), where the normal incidence reflectivities are calculated as: Req(o)¼|[1Oeeq(o)]/[1þOeeq(o)]|2 and Rneq(o)¼ |[1Oeneq(o)]/[1þOeneq(o)]|2.
The role of the finite penetration depth of the pump pulse (dpu¼ 160 nm @1.55 eV) is accounted for by numerically calculating dR/R(o) through a transfermatrix method, when a graded index of the variation of the refractive index n withexponential profile along the direction z perpendicular to the surface, that is,dn¼ dn0exp( z/dpu), is assumed.
Photoemission spectroscopy. The FS of YBi2212 reported in Fig. 4a has beenmeasured by ARPES in equilibrium conditions. ARPES has been performed with21.2 eV linearly polarized photons (He-a line from a SPECS UVS300 mono-chromatized lamp) and a SPECS Phoibos 150 hemispherical analyzer. Energy andangular resolutions were set to 30 meV and 0.2. The Bi2212 samples studied byTR-ARPES are nearly optimally doped single crystals with a transition temperatureTc¼ 88 K. The samples have been excited by 55 fs laser pulses with a photon energyof 1.55 eV at 300 kHz repetition rate, at an absorbed fluence of 35 mJ cm 2. Thetransient electron distribution was probed by time-delayed 80 fs, 6 eV laser pulses,photoemitting electrons, which were detected by a time-of-flight spectrometer. Theenergy resolution was 50 meV, the momentum resolution 0.05 Å 1 and the timeresolution o100 fs.
Cluster-DMFT and the Hubbard model. The Hubbard Hamiltonian49,50 is given by:
H ¼ Xi;j;s
ti;j cyis cjs þ c:c:
þU
Xi
ni;"ni;# mX
i
ni
where cyis cjs
creates (annihilates) an electron with spin s on the i (j) site, ni;s ¼cyis cis is the number operator, tij the hopping amplitude to nearest and next-nearest
neighbours, U the Coulomb repulsion between two electrons occupying the samelattice site and m is the chemical potential that controls the total number of electronsn ¼
Pis /ni;sS=N in the N sites.
The Hubbard model has been studied by means of a Cluster-DMFT that mapsthe full lattice model onto a finite small cluster (here a four-site cluster) embeddedin an effective medium that is self-consistently determined as in standard mean-field theory. The method therefore fully accounts for the short-range quantumcorrelations inside the cluster. It has been shown by various authors that different
ARTICLE NATURE COMMUNICATIONS | DOI: 10.1038/ncomms5353
8 NATURE COMMUNICATIONS | 5:4353 | DOI: 10.1038/ncomms5353 | www.nature.com/naturecommunications
& 2014 Macmillan Publishers Limited. All rights reserved.

implementations of this approach provide qualitatively similar results andreproduce the main features of the phase diagram of the cuprates, including thed-wave superconducting state and the pseudogap region that we discuss in thepresent paper. The calculations of this paper use the dynamical clusterapproximation62 prescription and the 4* patching of the BZ introduced in17 andhave been performed using finite-temperature exact diagonalization63 to solve theself-consistent cluster problem using eight energy levels in the bath as in severalprevious calculations. The finite-temperature version of the exact diagonalizationhas been implemented as discussed in ref. 17 including typically 40 states in thelow-temperature expansion of the observables.
References1. Lee, P. A., Nagaosa, N. & Wen, X.-G. Doping a Mott insulator: physics of high-
temperature superconductivity. Rev. Mod. Phys. 78, 17–85 (2006).2. Damascelli, A., Hussain, Z. & Shen, Z.-X. Angle-resolved photoemission studies
of the cuprate superconductors. Rev. Mod. Phys. 75, 473–541 (2003).3. Varma, C. M. Theory of the pseudogap state of the cuprates. Phys. Rev. B 73,
155113 (2006).4. Sachdev, S. Quantum Phase Transitions 2nd edn (Cambridge Univ. Press, 2011).5. Fauque, B. et al. Magnetic order in the pseudogap phase of high-TC
superconductors. Phys. Rev. Lett. 96, 197001 (2006).6. Li, Y. et al. Unusual magnetic order in the pseudogap region of the
superconductor HgBa2CuO4þ d. Nature 455, 372–375 (2008).7. Li, Y. et al. Hidden magnetic excitation in the pseudogap phase of a high-TC
superconductor. Nature 468, 283–285 (2010).8. Ghiringhelli, G. et al. Long-range incommensurate charge fluctuations in
(Y,Nd)Ba2Cu3O6þ x. Science 337, 821–825 (2012).9. Chang, Y. et al. Direct observation of competition between superconductivity
and charge density wave order in YBa2Cu3O6.67. Nat. Phys. 8, 871–876 (2012).10. Tranquada, J. M., Sternlieb, B. J., Axe, J. D., Nakamura, Y. & Uchida, S.
Evidence for stripe correlations of spins and holes in copper oxidesuperconductors. Nature 375, 561–563 (1995).
11. Kivelson, S. A., Fradkin, E. & Emery, V. J. Electronic liquid-crystal phases of adoped Mott insulator. Nature 393, 550–553 (1998).
12. Mesaros, A. et al. Topological defects coupling smectic modulations to intra–unit-cell nematicity in cuprates. Science 333, 426–430 (2011).
13. Hinkov, V. et al. Electronic liquid crystal state in the high-temperaturesuperconductor YBa2Cu3O6.45. Science 319, 597–600 (2008).
14. Shekhter, A. et al. Bounding the pseudogap with a line of phase transitions inYBa2Cu3O6þ d. Nature 498, 75–77 (2013).
15. Alloul, H. What is the simplest model that captures the basic experimental factsof the physics of underdoped cuprates? C. R. Physique doi:10.1016/j.crhy.2014.02.007 (2014).
16. Ferrero, M. et al. Pseudogap opening and formation of Fermi arcs as anorbital-selective Mott transition in momentum space. Phys. Rev. B 80, 064501(2009).
17. Gull, E., Ferrero, M., Parcollet, O., Georges, A. & Millis, A. J. Momentum-spaceanisotropy and pseudogaps: a comparative cluster dynamical mean-fieldanalysis of the doping-driven metal-insulator transition in the two-dimensionalHubbard model. Phys. Rev. B 82, 155101 (2010).
18. Civelli, M. et al. Nodal-antinodal dichotomy and the two gaps of asuperconducting doped Mott insulator. Phys. Rev. Lett. 100, 046402 (2008).
19. Gedik, N. et al. Single-quasiparticle stability and quasiparticle-pair decay inYBa2Cu3O6.5. Phys. Rev. B 70, 014504 (2004).
20. Orenstein, J. Ultrafast spectroscopy of quantum materials. Phys. Today 65,44–50 (2012).
21. He, R.-H. et al. From a single-band metal to a high-temperature super-conductor via two thermal phase transitions. Science 331, 1579–1583 (2011).
22. Liu, Y. H. et al. Direct observation of the coexistence of the pseudogap andsuperconducting quasiparticles in Bi2Sr2CaCu2O8þ d by time-resolved opticalspectroscopy. Phys. Rev. Lett. 101, 137003 (2008).
23. Demsar, J., Podobnik, B., Kabanov, V. V., Wolf, T. & Mihailovic, D.Superconducting gap Dc, the pseudogap Dp, and pair fluctuations above Tc inoverdoped Y1-xCaxBa2Cu3O7 d from femtosecond time-domain spectroscopy.Phys. Rev. Lett. 82, 4918 (1999).
24. Giannetti, C. et al. Revealing the high-energy electronic excitations underlyingthe onset of high-temperature superconductivity in cuprates. Nat. Commun. 3,353 (2011).
25. Eichberger, M. et al. Snapshots of cooperative atomic motions in the opticalsuppression of charge density waves. Nature 468, 799–802 (2010).
26. Dal Conte, S. et al. Disentangling the electronic and phononic glue in a high-Tc
superconductor. Science 335, 1600–1603 (2012).27. Basov, D. N. & Timusk, T. Electrodynamics of high-Tc superconductors. Rev.
Mod. Phys. 77, 721–779 (2005).28. van Heumen, E. et al. Optical determination of the relation between the
electron-boson coupling function and the critical temperature in high-Tc
cuprates. Phys. Rev. B 79, 184512 (2009).
29. Sharapov, S. G. & Carbotte, J. P. Effects of energy dependence in thequasiparticle density of states on far-infrared absorption in the pseudogap state.Phys. Rev. B 72, 134506 (2005).
30. Hwang, J. Electron-boson spectral density function of underdopedBi2Sr2CaCu2O8þ d and YBa2Cu3O6.5. Phys. Rev. B 83, 014507 (2011).
31. Cilento, F. et al. In search for the pairing glue in cuprates by non-equilibriumoptical spectroscopy. J. Phys. Conf. Ser. 449, 012003 (2013).
32. Renner, Ch., Revaz, B., Genoud, J.-Y., Kadowaki, K. & Fischer, O. Pseudogapprecursor of the superconducting gap in under- and overdopedBi2Sr2CaCu2O8þ d. Phys. Rev. Lett. 80, 149–152 (1998).
33. Smallwood, C. L. et al. Time- and momentum-resolved gap dynamics inBi2Sr2CaCu2O8þ d. Phys. Rev. B 89, 115126 (2014).
34. Mirzaei, S. I. et al. Spectroscopic evidence for Fermi liquid-like energy andtemperature dependence of the relaxation rate in the pseudogap phase of thecuprates. Proc. Natl Acad. Sci. USA 110, 5774–5778 (2013).
35. Barisic, N. et al. Universal sheet resistance and revised phase diagram of thecuprate high-temperature superconductors. Proc. Natl Acad. Sci. USA 110,12235–12240 (2013).
36. Cortes, R. et al. Momentum-resolved ultrafast electron dynamics insuperconducting Bi2Sr2CaCu2O8þ d. Phys. Rev. Lett. 107, 097002 (2011).
37. Smallwood, C. L. et al. Tracking Cooper pairs in a cuprate superconductor byultrafast angle-resolved photoemission. Science 336, 1137–1139 (2012).
38. Eisaki, H. et al. Effect of chemical inhomogeneity in bismuth-based copperoxide superconductors. Phys. Rev. B 69, 064512 (2004).
39. Barisic, N. et al. Demonstrating the model nature of the high-temperaturesuperconductor HgBa2CuO4þ d. Phys. Rev. B 78, 054518 (2008).
40. Deutscher, G., Santander-Syro, A. F. & Bontemps, N. Kinetic energy changewith doping upon superfluid condensation in high-temperaturesuperconductors. Phys. Rev. B 72, 092504 (2005).
41. Gedik, N. et al. Abrupt transition in quasiparticle dynamics at optimal dopingin a cuprate superconductor system. Phys. Rev. Lett. 95, 117005 (2005).
42. Carbone, F. et al. Doping dependence of the redistribution of optical spectralweight in Bi2Sr2CaCu2O8þ d. Phys. Rev. B 74, 064510 (2006).
43. Gull, E. & Millis, A. J. Energetics of superconductivity in the two-dimensionalHubbard model. Phys. Rev. B 86, 241106(R) (2012).
44. De Almeida-Didry, S. et al. Evidence for intra-unit-cell magnetic order inBi2Sr2CaCu2O8þ d.. Phys. Rev. B 86, 020504(R) (2012).
45. Raffy, H., Toma, V., Murrills, C. & Li, Z. Z. c-axis resistivity of Bi2Sr2CaCu2Oy
thin films at various oxygen doping: phase diagram and scaling law. Physica C460, 851–853 (2007).
46. Xia, J. et al. Polar Kerr-effect measurements of the high-temperatureYBa2Cu3O6þ x superconductor: evidence for broken symmetry near thepseudogap temperature. Phys. Rev. Lett. 100, 127002 (2008).
47. Blackburn, E. et al. X-ray diffraction observations of a charge-density-waveorder in superconducting ortho-II YBa2Cu3O6.54 single crystals in zeromagnetic field. Phys. Rev. Lett. 110, 137004 (2013).
48. Parker, C. V. et al. Fluctuating stripes at the onset of the pseudogap in the high-Tc superconductor Bi2Sr2CaCu2O8þ x. Nature 468, 677–680 (2010).
49. Hubbard, J. Electron correlations in narrow energy bands. Proc. R. Soc. Lond. A276, 238–257 (1963).
50. Anderson, P. W. Theory of magnetic exchange interactions: exchange ininsulators and semiconductors. Solid State Phys. 14, 99–214 (1963).
51. Sordi, G., Haule, K. & Tremblay, A.-M. S. Mott physics and first-ordertransition between two metals in the normal-state phase diagram of the two-dimensional Hubbard model. Phys. Rev. B 84, 075161 (2011).
52. Yusupov, R. et al. Coherent dynamics of macroscopic electronic order througha symmetry breaking transition. Nat. Phys. 6, 681–684 (2010).
53. Castellani, C., Di Castro, C. & Grilli, M. Singular quasiparticle scattering in theproximity of charge instabilities. Phys. Rev. Lett. 75, 4650–4653 (1995).
54. Comin, R. et al. Charge order driven by Fermi-arc instability inBi2Sr2-xLaxCuO6þ d. Science 343, 490–492 (2014).
55. Rosen, J. A. et al. Surface-enhanced charge-density-wave instability inunderdoped Bi2201. Nat. Commun. 4, 1977 (2013).
56. Hirsch, J. E. Charge expulsion, charge inhomogeneity and phaseseparation in dynamic Hubbard models. Preprint at http://arxiv.org/abs/1307.6526 (2013).
57. Hu, W. et al. Optically enhanced coherent transport in YBa2Cu3O6.5 byultrafast redistribution of interlayer coupling. Nat. Mater. 13, 705–711 (2014).
58. Kaiser, S. et al. Photoinduced interlayer coherence in underdopedYBa2Cu3O6þ d. Phys. Rev. B 89, 184516 (2014).
59. van der Marel, D. et al. Quantum critical behaviour in a high-Tc
superconductor. Nature 425, 271–274 (2003).60. Cilento, F. Non-equilibrium phase diagram of Bi2Sr2Y0.08Ca0.92Cu2O8þ d
cuprate superconductors revealed by ultrafast optical spectroscopy. PhD thesishttps://www.openstarts.units.it/dspace/handle/10077/6689 (2012).
61. Cilento, F. et al. Ultrafast insulator-to-metal phase transition as a switch tomeasure the spectrogram of a supercontinuum light pulse. Appl. Phys. Lett. 96,021102 (2010).
NATURE COMMUNICATIONS | DOI: 10.1038/ncomms5353 ARTICLE
NATURE COMMUNICATIONS | 5:4353 | DOI: 10.1038/ncomms5353 | www.nature.com/naturecommunications 9
& 2014 Macmillan Publishers Limited. All rights reserved.

62. Maier, T., Jarrell, M., Pruschke, T. & Hettler, M. H. Quantum cluster theories.Rev. Mod. Phys. 77, 1027–1080 (2005).
63. Capone, M., de’ Medici, L. & Georges, A. Solving the dynamical mean-fieldtheory at very low temperatures using the Lanczos exact diagonalization. Phys.Rev. B 76, 245116 (2007).
AcknowledgementsWe thank D. Fausti, G. Zgrablic, G. Sordi, E. Gull, P. Werner, A. Avella, M. Fabrizio, A.Cavalleri, D. Manske, G. Ghiringhelli, B. Keimer, D. Mihailovic for the useful discussionsand comments and for their support. The research activities of C.G., S.D.C., N.M., S.M.,F.B., G.F., M.C., F.P. and U.B. have received funding from the European Union, SeventhFramework Programme (FP7 2007-2013), under Grant No. 280555 (GO FAST). F.C.,G.C., and F.P. acknowledge the support of the Italian Ministry of University and Researchunder Grant No. FIRB-RBAP045JF2 and FIRB-RBAP06AWK3. M.C. is financed byEuropean Research Council through FP7/ERC Starting Grant SUPERBAD, GrantAgreement 240524. L. R. and U. B. acknowledge support by the Mercator Research CenterRuhr (MERCUR). The YBi2212 crystal growth work was performed in M.G.’s priorlaboratory at Stanford University, Stanford, CA 94305, USA, and supported by DOE-BES.The Hg1201 crystal growth work at the University of Minnesota was supported by DOE-BES Award DE- SC0006858. The work at UBC was supported by the Killam, Alfred P.Sloan, Alexander von Humboldt, and NSERC’s Steacie Memorial Fellowships (A.D.), theCanada Research Chairs Program (A.D.), NSERC, CFI, and CIFAR Quantum Materials.D.v.d.M. acknowledges the support of the Swiss National Science Foundation under GrantNo. 200020-140761 and MaNEP. The Open Access has been funded by UniversitaCattolica del Sacro Cuore and Elettra-Sincrotrone Trieste S.C.p.A.
Author contributionsC.G., F.C. and F.P. conceived the project and the time-resolved experiments. C.G.coordinated the research activities with input from all the coauthors, particularly F.C.,S.D.C., G.C., U.B., A.D., M.C. The pump-supercontinuum-probe technique at theI-LAMP Labs (Brescia) was designed and developed by C.G., F.B. and G.F. The
pump-supercontinuum- probe technique at the T-REX Labs (Elettra, Trieste) wasdesigned and developed by F.C. and F.P. The time-resolved optical measurements andthe data analysis were performed by F.C., S.D.C., G.C., S.P., S.M., N.N. and C.G. TheBi2212 crystals were grown and characterized by H.E., M.G., R.C. and A.D. The Hg1201crystals were grown and characterized by M.K.C, C.J.D., M.J.V. and M.G. EquilibriumARPES measurements were perfomed by R.C. and A.D. Non-equilibrium ARPES mea-surements were performed by L.R and U.B. The equilibrium spectroscopic ellipsometrymeasurements were performed by D.vdM. The DMFT calculations were carried out byM.C., who provided input for the theoretical interpretation of the experimental data. Thetext was drafted by C.G., F.C., M.C. and F.P with major input from S.D.C., G.C., R.C.,F.B., G.F., U.B., A.D., D.vdM. and M.G. All authors extensively discussed the results andthe interpretation, and revised the manuscript.
Additional informationSupplementary Information accompanies this paper at http://www.nature.com/naturecommunications
Competing financial interests: The authors declare no competing financial interests.
Reprints and permission information is available online at http://npg.nature.com/reprintsandpermissions/
How to cite this article: Cilento, F. et al. Photo-enhanced antinodal conductivity in thepseudogap state of high-Tc cuprates. Nat. Commun. 5:4353 doi: 10.1038/ncomms5353(2014).
This work is licensed under a Creative Commons Attribution-NonCommercial-ShareAlike 4.0 International License. The images or
other third party material in this article are included in the article’s Creative Commonslicense, unless indicated otherwise in the credit line; if the material is not included underthe Creative Commons license, users will need to obtain permission from the licenseholder to reproduce the material. To view a copy of this license, visit http://creativecommons.org/licenses/by-nc-sa/4.0/
ARTICLE NATURE COMMUNICATIONS | DOI: 10.1038/ncomms5353
10 NATURE COMMUNICATIONS | 5:4353 | DOI: 10.1038/ncomms5353 | www.nature.com/naturecommunications
& 2014 Macmillan Publishers Limited. All rights reserved.

Supplementary Figure 1 | Equilibrium Optical Properties at T=100 K. The real part (ε1(ω), right axis) and the imaginary part (ε2(ω), left axis) of the equilibrium dielectric function of the optimally doped Y-Bi2212 sample, measured at T=100 K over a broad energy range, are reported. Req(ω) is reported in the inset. The dressed plasma frequency ωp (defined by ε1(ωp)=0) is 1.15 eV. The black curves are the best Extended Drude Model fits to the data.
-15
-10
-5
0
5
ε1 (ω)
3.53.02.52.01.51.00.50.0Energy (eV)
20
15
10
5
0
ε 2(ω
)
ε1 (ω) ε2 (ω)
fits
1.0
0.5
0.0R
(ω)
3.02.01.00.0Energy (eV)
T=100 K

Supplementary Figure 2 | Pseudogap Function and Photoinduced gap filling. a) The pseudogap density of electronic states, ( )TN ,~
Ω , obtained by fitting the equilibrium dielectric function at T=100 K (see also Methods), is shown as a dark green line. The transient filling of the pseudogap (light green line) is simulated by increasing the normalized density of states at EF, i.e., ( )TN ,0~ . b) The contribution to the δR/R(ω,t), calculated through the differential
Extended Drude Model in the case of δ ( )TN ,0~ =0.2, is shown.
2.0x10⁻³
1.5
1.0
0.5
0.0
-0.5
-1.0
R/R
(ω)
2.001.751.501.251.000.750.50Energy (eV)
δN(0,T)=0.2
a b
~~
~
~
1.2
1.0
0.8
0.6
N(Ω
,T)
100806040200Energy (meV)
N(0,T)=0.9 N(0,T)=0.7
T=100 K

Supplementary Figure 3 | Electronic Scattering Rate and Optical Properties. a. The effect on the Reflectivity R(ω) of a ±20% modification of the electronic scattering time is shown. The plasma edge narrows (broadens), respectively. b. The same effect is shown in the δR/R(ω,t) signal.
-0.4
-0.2
0.0
0.2
0.4
R/R
(ω)
1.21.00.80.60.4Energy (eV)
R/R(ω)
τ∼5 fs ----> τ∼4 fs τ∼5 fs ----> τ∼6 fs
2
3456
0.01
2
3456
0.1
2
3456
1
R(ω
)
2.01.51.00.50.0Energy (eV)
R(ω), Drude Model
τ∼5 fs τ∼4 fs (-20%) τ∼6 fs (+20%)
a b

Supplementary Figure 4 | Decay Time of the Non-Equilibrium Population. The relaxation time of the δR/R(t) signal measured at 100 K, is reported.
-3x10⁻⁴
-2
-1
0
1
δR/R
43210Delay (ps)
t=600±50 fs
δR/R(hν=1.55 eV,t) T=100 K - Φ=10±2 µJ/cm2

Supplementary Figure 5 | Long-time reflectivity variation. The δR/R(ω,t) signal measured at T=100 K on OP-YBi2212 is reported (red dots). The yellow line is the best fit to the data obtained by the procedure described in the text.
-2x10⁻⁴
-1
0
1
2
R/R
(ω)
2.01.81.61.41.21.00.80.6Energy (eV)
R/R at t=3 ps Model fit to R/R
OP Sample - T=100 K

Supplementary Figure 6 | Single-colour pump-probe measurements. High-resolution, single-colour (1.55 eV probe photon energy) reflectivity measurements as a function of temperature are reported for three different samples: UD (p=0.13), OP (p=0.16), OD (p=0.2). The results of the fitting procedure are superimposed. Black fits are drawn in correspondence of the temperature below which the finite negative component in f(t) (I3<0, see Supplementary Note 6) is observed.
1.1x10⁻³
1.0
0.9
0.8
0.7
0.6
0.5
R/R
(hν=
1.55
eV,t)
43210-1Delay (ps)
300 K 280 K 260 K 240 K 220 K 205 K 195 K 185 K 175 K 165 K 150 K 145 K 140 K 135 K 130 K 125 K 120 K 115 K 109 K 105 K 102 K 100 K 99 K 98 K 97 K 96 K 95 K
Y-Bi2212 OPTc=96 K, p=0.16
1.2x10⁻³
1.0
0.8
0.6
R/R
(hν=
1.55
eV,t)
43210-1Delay (ps)
300 K 290 K 280 K 270 K 260 K 250 K 240 K 230 K 217 K 210 K 200 K 193 K 186 K 180 K 175 K 170 K 166 K 162 K 156 K 150 K 144 K 138 K 132 K 126 K 120 K 115 K 110 K 106 K 102 K 100 K 99 K 98 K 97 K 96 K 95 K 94 K 93 K 92 K 91 K 90 K
Y-Bi2212 UDTc=88 K, p=0.13
1.2x10⁻³
1.0
0.8
0.6
0.4R
/R(hν=
1.55
eV,t)
43210-1Delay (ps)
300 K 280 K 260 K 240 K 220 K 200 K 195 K 189 K 186 K 183 K 180 K 176 K 174 K 171 K 167 K 160 K 153 K 143 K 135 K 129 K 123 K 116 K 111 K 109 K 107 K 106 K 105 K 104 K 101 K 95 K 93 K 91 K 89 K 88 K 87 K 86 K 85 K 84 K 83 K 82 K 81 K 80 K
Y-Bi2212 ODTc=83 K, p=0.2

Supplementary Figure 7 | Time-resolved optical spectroscopy on the sOD sample. δR/R(ω,t) on the sOD sample is reported for some selected temperatures. Slices of the δR/R(ω,t) maps at t=100 fs are shown on the right panel.
Supplementary Figure 8 | Time-resolved optical spectroscopy on the OD sample. δR/R(ω,t) on the OD sample is reported for some selected temperatures. Slices of the δR/R(ω,t) maps at t=100 fs are shown on the right panel.
1.9
1.8
1.7
1.6
1.5
1.4
1.3
1.2
1.2x10-30.80.40.0R/R(ω,t=100 fs)
Cuts at t=100 fs T=110 K T=120 K T=130 K T=140 K T=150 K T=170 K
1.9
1.8
1.7
1.6
1.5
1.4
1.3
1.2
Ener
gy (e
V)
0.80.40.0-0.4Delay (ps)
T=170 K1.9
1.8
1.7
1.6
1.5
1.4
1.3
1.2
Ener
gy (e
V)
0.80.40.0-0.4Delay (ps)
T=150 K1.9
1.8
1.7
1.6
1.5
1.4
1.3
1.2
Ener
gy (e
V)
0.80.40.0-0.4Delay (ps)
T=140 K1.9
1.8
1.7
1.6
1.5
1.4
1.3
1.2
Ener
gy (e
V)
0.80.40.0-0.4Delay (ps)
T=130 K1.9
1.8
1.7
1.6
1.5
1.4
1.3
1.2
Ener
gy (e
V)
0.80.40.0-0.4Delay (ps)
T=120 K1.9
1.8
1.7
1.6
1.5
1.4
1.3
1.2
Ener
gy (e
V)
0.80.40.0-0.4Delay (ps)
T=110 K
-1.0
0.0
1.0
R/R
x10-3
1.9
1.8
1.7
1.6
1.5
1.4
1.3
1.2
1.0x10-30.50.0R/R(ω,t=100 fs)
Cuts at t=100 fs T=110 K T=120 K T=130 K T=140 K T=160 K T=170 K
1.9
1.8
1.7
1.6
1.5
1.4
1.3
1.2
Ener
gy (e
V)
0.80.40.0-0.4Delay (ps)
T=170 K1.9
1.8
1.7
1.6
1.5
1.4
1.3
1.2
Ener
gy (e
V)
0.80.40.0-0.4Delay (ps)
T=160 K1.9
1.8
1.7
1.6
1.5
1.4
1.3
1.2
Ener
gy (e
V)
0.80.40.0-0.4Delay (ps)
T=140 K1.9
1.8
1.7
1.6
1.5
1.4
1.3
1.2
Ener
gy (e
V)
0.80.40.0-0.4Delay (ps)
T=130 K1.9
1.8
1.7
1.6
1.5
1.4
1.3
1.2
Ener
gy (e
V)
0.80.40.0-0.4Delay (ps)
T=120 K1.9
1.8
1.7
1.6
1.5
1.4
1.3
1.2
Ener
gy (e
V)
0.80.40.0-0.4Delay (ps)
T=110 K
-1.0
0.0
1.0
R/R
x10-3

Supplementary Figure 9 | Time resolved optical spectroscopy on sUD-Hg1201. a. and b. The δR/R(ω,t) data, acquired respectively at T=150 K and T=300 K on the sUD-Hg1201 sample (Tc=95 K), are shown. c. The δR/R(ω) slices at t=100 fs are reported.
Supplementary Figure 10 | Time resolved Optical Spectroscopic Measurements on UD Hg1201. a. The δR/R(ω,t) data acquired at T=150 K on the UD Hg1201 sample (Tc=55 K) are shown. b. The δR/R(ω) slice at t=100 fs is reported.
1.9
1.8
1.7
1.6
1.5
1.4
1.3
Ener
gy (e
V)
2x10-40-2R/R (ω,t=100 fs)
T=150 K T=300 K
1.9
1.8
1.7
1.6
1.5
1.4
1.3
Ener
gy (e
V)
1.20.80.40.0-0.4Delay (ps)
T=150 K
-6-4-20246
R/R
x10-4
1.9
1.8
1.7
1.6
1.5
1.4
1.3
Ener
gy (e
V)1.20.80.40.0-0.4
Delay (ps)
T=300 K
-6-4-20246
R/R
x10-4
a b c
1.9
1.8
1.7
1.6
1.5
1.4
1.3
Ener
gy (e
V)
4x10-420-2-4R/R (ω,t=100 fs)
T=150 K1.9
1.8
1.7
1.6
1.5
1.4
1.3
Ener
gy (e
V)
1.20.80.40.0-0.4Delay (ps)
T=150 K
-6-4-20246
R/R
x10-4
a b

Supplementary Figure 11 | Onset of the Pseudogap for Hg1201. a. The high-resolution, single colour (1.55 eV probe energy) pump-probe measurements, performed on the UD-Hg1201, are shown. b. The same, but for sUD-Hg1201.
-3x10⁻⁴
-2
-1
0
1
2
3
R/R
(hν=
1.55
eV,t)
43210-1Delay (ps)
T=300 K T=150 K
-3x10⁻⁴
-2
-1
0
1
2
3
R/R
(hν=
1.55
eV,t)
43210-1Delay (ps)
T=300 K T=250 K
a b

Supplementary Note 1
The Equilibrium Reflectivity at T=100 K
In Supplementary Fig. 1 we report the real and imaginary parts of the equilibrium dielectric function εeq(ω), measured by conventional reflectivity and ellipsometry techniques (1), in a wide spectral range (0-3.5 eV). The data reported refer to the ab-plane pseudo-dielectric function, which has been corrected for the c-axis admixture due to the off-normal angle of incidence used with ellipsometry.
A satisfactory fit to the data has been obtained by a model dielectric function containing the Extended Drude term with a non-constant density of states (see Methods) and six Lorentz oscillators (with central energies: 1.53 eV, 1.99 eV, 2.72 eV, 3.85 eV, 4.36 eV and 5.05 eV), accounting for interband and charge transfer optical transitions. In the Extended Drude Model, we consider the same Glue Function Π(Ω) as the one determined from the fitting in the normal state (T=300 K) data (see (2)). Assuming Δpg=40 meV (as determined from STS measurements, see (3)), the best fit to Req(ω) provides a value of )K 100,0(~
=TN =0.7±0.05, (see Supplementary Note 2) in quantitative agreement with the results reported in (4).

Supplementary Note 2
The Non-Constant Density of States and the Photoinduced gap filling
In Supplementary Fig. 2(a) we report (dark green line) the normalized density of states obtained from fitting the Extended Drude Model with a non-constant density of states (see Methods and Supplementary Note 1) to the reflectivity data at equilibrium, reported in Supplementary Fig. 1. The best fit provides ( )K 100,0~
=TNeq =0.7±0.05, when the pseudogap
width value is fixed to Δpg=40 meV (3). After the impulsive pump excitation, a transient gap filling can occur. In Supplementary Fig. 2(b) we report the δR/R(ω) signal arising from a partial filling of the pseudogap, that is accounted for by a partial quench of the density of states, i.e., ( ) ( ) 02.02.0K 100,0~K 100,0~
±==−= TNTN eqneq .

Supplementary Note 3
Isosbestic Points: the link between Electronic Scattering Rate and Optical Properties
In general, the transient variation of the electronic properties after the interaction with the pump pulse, modifies the optical properties over a very broad frequency range. Here we show how broadband time-resolved optical spectroscopy can be used to measure the instantaneous optical scattering rate with 100 fs time resolution. This argument is based on the properties of the so-called ‘isosbestic points’ (defined as the crossing frequency (ω) of all the functions f(ω,g) with different values of the parameter g), discussed in detail in a recent paper (5). In the vicinity of the crossing point, ∂f/∂g≃0 and the function can be expanded with respect to the parameter considered, establishing a simple dependence of f(ω,g) on the parameter g. As an example, we consider the variation of the scattering rate γ on the prototypical reflectivity R(ω) of a metal. Within the simple Drude Model, recalling that:
the width of the plasma edge is proportional to the scattering rate γ, defined as the inverse of the scattering time τ . This is shown in Supplementary Fig. 3a, where a frequency-independent value τ=5 fs is considered. The values of the other parameters used in the simulation are: εinf=3, ωp=1.1 eV, γ=0.12 eV≈(5 fs)−1. A 20% increase (decrease) of the scattering rate γ results in a broadening (narrowing) of the plasma edge. An isosbestic point (see Supplementary Fig. 3a) is found at the frequency ∼0.7 eV. Close to the reflectivity variation can be expanded as δR(ω, γ)=∂R/∂γ(ω)δγ, where ∂R/∂γ>(<)0 for ω>(<) . Therefore, the effect of a pump-induced modification of the scattering rate can be readily inferred by measuring δR/R(ω,t) over a broad frequency range across , as shown in Supplementary Fig 3b.
2))(1/())(1()( ωεωεω +−=R
γωω
ωεωε
ip
D +−= 2
2
inf)(
ω~ ω~
ω~
ω~

Supplementary Note 4
Relaxation Dynamics in the Pseudogap
The relaxation time of the pump-probe measurements has been determined by fitting a single exponential decay to the pump-probe trace measured at T=100 K on the sUD-YBi2212 sample, excited with a pump fluence equal to 10±2 µJ/cm2. The result is reported in Supplementary Fig. 4. A decay time ŧ=600±50 fs has been obtained. The same decay time has been measured increasing the pump fluence up to 100 µJ/cm2.

Supplementary Note 5
ps-timescale Reflectivity Variation
The δR/R(ω,t=3 ps) measured at T=100 K on the OP sample is reported in Supplementary Fig. 5 (red dots). In this case, the measured frequency-dependent reflectivity variation is the opposite than that measured at t=100 fs (see Fig. 3a in the main paper). δR/R(ω,t=3 ps) can be easily reproduced (yellow line) by assuming ≃0 and a relative increase of the scattering rate δγ∞/γ∞≈10−4. The long-time increase of the scattering rate is compatible with a local effective heating of δT=0.6 K, that corresponds to the effective heating estimated considering the pump fluence (10 µJ/cm2) of the experiment and the specific heat of the lattice.
)K 100,0(~)K 100,0(~=−= TNTN eqneq

Supplementary Note 6
T*neq(p) from non-equilibrium spectroscopy
The onset temperature T*neq of the pseudogap, as a function of the hole-doping concentration,
has been determined from the analysis of the single-colour (1.55 eV) pump-probe measurements. The appearance in the δR/R(t) signal of a negative component with the relaxation time ŧ=600 fs is the consequence of the decrease of the electronic scattering rate as the non-thermal antinodal population is created by the pump pulse. The δR/R(t) data at different temperatures and hole-doping concentrations are reported in Supplementary Fig. 6. The function f(t), defined as the sum of three exponentials convoluted with a Gaussian representing the experimental resolution, has been fitted to the data:
321 /t3
/t2
/t1)t( τττ −−− ⋅+⋅+⋅= eIeIeIf
The two positive components are needed to reproduce the temporal dynamics in the normal state. They exhibit two distinct decay times: a fast component of ∼100 fs (I1), and a slower one, with a decay time of ∼1 ps (I2). These timescales are related to the coupling of the electrons with two different subsets of phonons, as previously shown (2, 6). The third negative component (I3) accounts for the transient decrease of the scattering rate in the pseudogap. The temperatures at which a non-zero value of I3 appears are: T*=240, 165 and 110 K for samples with p=0.13, 0.16 and 0.18, respectively. A zero value of I3 is obtained at all the temperatures larger than Tc for dopings p>0.18.

Supplementary Note 7
The crossing point of T*neq(p) and the superconducting dome
In this section, we discuss the measurements performed with the time-resolved optical spectroscopy on two overdoped samples: sOD (p=0.18, Tc=94 K) and OD (p=0.2, Tc=83 K). In the sOD sample, the δR/R(ω,t=100 fs) signal above 1.4 eV evolve from positive in the normal state to negative in the pseudogap state at about 100 K (see Supplementary Fig. 7). In the OD sample, the pseudogap-related negative δR/R(ω,t=100 fs) signal above 1.4 eV, is never detected for all the temperature larger than Tc (see Supplementary Fig. 8). This result demonstrates that the T*
neq(p) line meets the superconducting dome at a doping concentration of 0.18<p<0.2.

Supplementary Note 8
Measurements on Hg1201
In this section, we discuss the results of time- and frequency-resolved reflectivity measurements on HgBa2CuO4+δ (Hg1201) samples. Supplementary Figures 9 and 10 display the δR/R(ω,t) maps measured on underdoped (UD-Hg1201, p≈0.06, Tc=55 K) and slightly-underdoped (sUD-Hg2101, p≈0.12, Tc=95 K) Hg1201 crystals. The measurements have been performed in the same experimental conditions as the ones described for Y-Bi2212 samples. The spectral traces taken at t=0 at different temperatures are shown in the panels on the right. The δR/R(ω,t=100 fs) signal at T=150 K on the sUD-Hg2101 is very similar to the signal measured on underdoped YBi2212 samples. The negative reflectivity variation at photon energies larger than 1.3 eV is the fingerprint of the transient decrease of the scattering rate, related to the pseudogap state. The signal related to the pseudogap gradually disappears as the temperature is increased up to T=300 K. At T=300 K the δR/R(ω,t=100 fs) is positive for all photon energies and can be reproduced by simply assuming an increase of the scattering rate, in agreement with the results on Y-Bi2212 at T=300 K. On UD-Hg1201 the δR/R(ω,t=100 fs) signal at T=150 K is very similar and exhibit a negative variation above 1.3 eV at all the temperatures from Tc to 350 K. Supplementary Figure 11 reports the high-resolution, single colour pump-probe measurements performed at different sample temperatures on both the UD and the sUD Hg1201 crystals. In UD-Hg1201 the negative signal characteristic of the pseudogap state persists till the highest temperature is reached (350 K). Further increasing of the temperature leads to a permanent damage of the crystal. This demonstrates that the UD-Hg1021 sample is well within the pseudogap state at T=300 K.

Supplementary References
1. van der Marel, D., Molegraaf, H. J. A., Zaanen, J., Nussinov, Z., Carbone, F., Damascelli, A., Eisaki, H., Greven, M., Kes, P. H. & Li, M. Quantum critical behaviour in a high-Tc superconductor. Nature 425, 271 (2003).
2. Dal Conte, S., Giannetti, C., Coslovich, G., Cilento, F., Bossini, D., Abebaw, T., Banfi, F., Ferrini, G., Eisaki, H., Greven, M., Damascelli, A., van der Marel, D. & Parmigiani, F. Disentangling the Electronic and Phononic Glue in a High-Tc Superconductor. Science 335, 1600 (2012).
3. Renner, Ch., Revaz, B., Genoud, J.-Y., Kadowaki, K. & Fischer, O. Pseudogap Precursor of the Superconducting Gap in Under- and Overdoped Bi2Sr2CaCu2O8+δ. Phys. Rev. Lett. 80, 149 (1998).
4. Hwang, J., Electron-boson spectral density function of underdoped Bi2Sr2CaCu2O8+δ and YBa2Cu3O6.5. Phys. Rev. B 83, 014507 (2011).
5. Greger, M., Kollar, M. & Vollhardt, D. Isosbestic points: How a narrow crossing region of curves determines their leading parameter dependence. Phys. Rev. B 87, 195140 (2013).
6. Perfetti, L., Loukakos, P. A., Lisowski, M., Bovensiepen, U., Eisaki, H. & Wolf, M. Ultrafast Electron Relaxation in Superconducting Bi2Sr2CaCu2O8+δ by Time-Resolved Photoelectron Spectroscopy. Phys. Rev. Lett. 99, 197001 (2007).