Embed Size (px)
Citation preview
PHOTOELECTRIC DROP SORTING
A
ster
I.. F •
1968

M.G.
& ;
Oi. z.) I
J.
• a
a 1e
•
1 would so , B ..
and W .. B .. Earl~ I


SUMMI\RY
work of Abrahamson (1) has been continued in an
effort to develop an instrument to classify the
and solute of individual drops in a
two ... phase
a 1
(
)
)
method used (modulation
more
in use.
1

2
INTRODUCTION
The behaviour of the swarms of drops found in liquid•
liquid extraction processes is not at this
understood process. A large body of data is available on
the behaviour of single drops in well-defined fl9w situations
and some success has been achieved in understanding and
predicting the hydrodynamic and mass transfer behaviour of such
Very little progress has been made, however, in
using this knowledge to predict behaviour in complex systems
such as are in widespread industrial use. This is because of
unce:r:·tainty as to the basic mechanism of such
turbulence fields drop coalescence,
of s as re
phases~ and to which are
mod if by mass conditions
of .. To the single d:top to multidrop
it is nece to evaluate some o.r all of factors
which differentiate the complex situation from the simple ones
which are at present at least partially understood.
Abrahamson (1) points out that if simultaneous information
on drop diameters and mass transfer s in various places in
a available then some progress would be possible
towards applying single drop data to stirred tank systems.
Information on residence times and breakup a1'ld coalescence
could also be obtained if an experimental technique were
available for measuring simultaneously the size and solute

3
in all members of a dr'op population .. Tracer
techniques used in conjunction with this could yield much
useful data.,
This study a continuation of Abrahamson's work in an
effort to develop an instrument package that would give
simultaneous information on drop a.nd solute crn1centration ..
The method consists of withdrawing a stream of drops from a
stirred tank and diluting the stream sufficiently to ensure
that the drops will ss singl.)r through a narrow beam of light ..
drop causes a modulation of the beam» which
ss
by pulse width
a pulse width would sort
s; similarly, the solute is a function
of the pulse and a pulse amplitude discriminator
could sort the drops within each into concentration
.. For initial trials the liquids were kerosene
and water~ which are more suitable than and
system. used by Glen (2) because of their fairly high
index difference.
The initial aim of the work was to confirm the findings ,,
of Glen thai?, a turbulent breakup mechanism controlled the drop ..
distribution in the impeller of the mixer used.
4
(i)
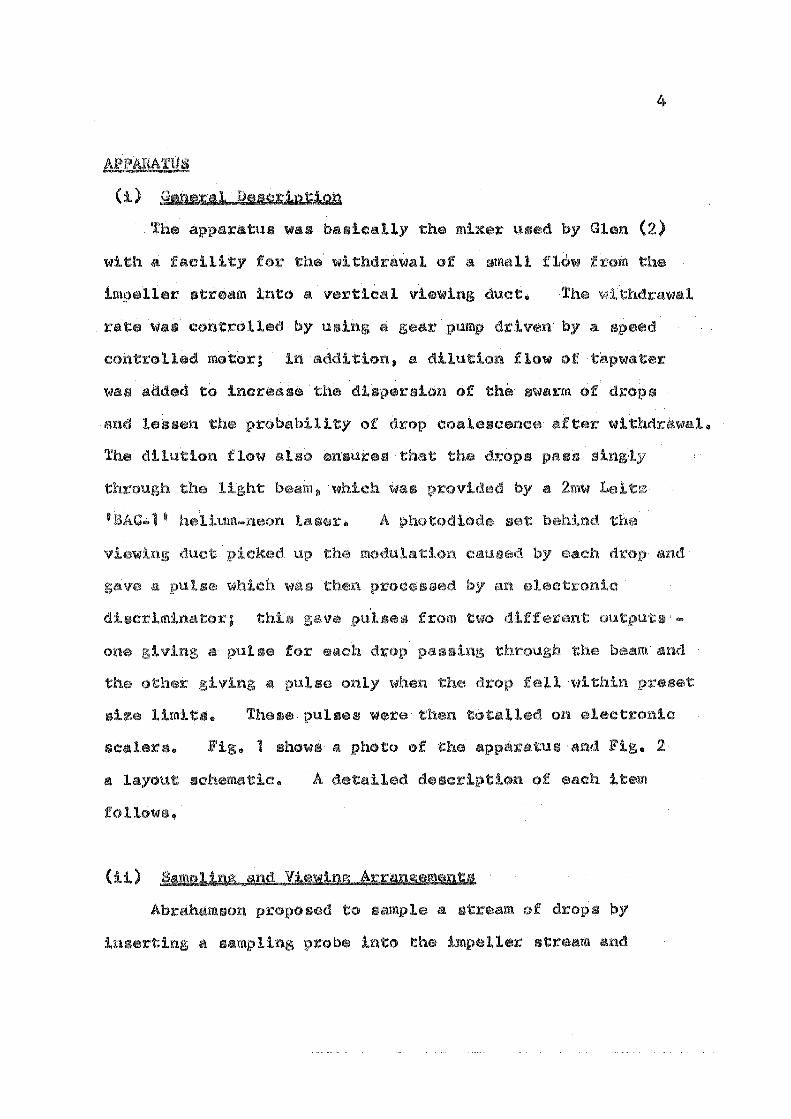
The apparatus was basically the mixer used by Glen (2)
with a facility for the withdrawal of a small flow from the
impeller stream into a vertical viewing duct. The thdrawal
rate controlled by using a pump driven by a
controlled motor; in addition. a dilution flow tapwater
was added to increase the dispersion of ther swarm of drops
and lessen the probability drop coalescence withdrawal~
The dilution flow also that the ss
one
the
the light $ which by a 2mw
laser. A behind
a pulse
a pulse only drop fell within
limits. These pulses were then total
s. • 1 shows a photo of the
a layout • A led
follows.
(ii)
Abrahamson propo to sample a LL.IieU"i.UI of drops by
a sampling probe into the impel stream and
,..,

Q_
~ ~
w
CD
_J
<( ~
z w ~
-cr: w
0... X
w
.a
lL

0 0 0
TO SPEED CONTROLLED WITJ-DRAWAL PUMP
PHOTO I SENSoR I 0 I l1= I HE-NE LASER 0
PULSE- WIDTH
DISCRIMINATOR
000000 WINDOW COUNT
000000 TOTAL COUNT
ELECTRONIC SCALERS
. 0
0
0 I VIEWING DUCT 0
0
DILUTION FLOW
FROM MIXER
Fig. 2 SCHEMATIC OF APPARATUS

. - -
Fig. 3 SAMPLING S VIEWING ARRANGEMENT
5
matching the withdrawal velocity to the approach velocity of
the drops in the tank which could be estimated from the data
of Cutter (3) and other~. Such tests as he carried out
indicated that this method was not satisfactory • difficulties
caused by drop breakup on sampling were encountered and two
different-sized probes were required to cover the range of
drop sizes expected. The present writer of the opinion
that there would be some difficulty in determining the overall
distribution from these two fragmentary and to some extent
overlapping distributions.. A further disadvantage of
Abrahamson's system was that drops tended to coalesce on
upper
di
al (4)
the viewing
With this the
which would seriously
on was that of
s out a stream to
is
unconstrained as is no possibility that an excessively
bulky probe within the mixer will seriously distort the flow
• A vertical chute has the advantage that
drops do not coalesce on the walls, although the necessity to
put the drops through a af ling is a
drawback as this could cause breakup and/or coalescence.
alternative layouts were considered for the
viewing duct and since some first sight seem attractive
the reasons for their rejection are given in some detail.
A horizontal duct similar to that used by Abrahamson has the
6
advantage that the stream of drops need 110t turned through
a right-angle; however. it'was rejected on consideration of
vertical terminal velocities. For drops in the range
expected (up to 5 xnm) the data of Klee and Treybal (5)
indicate a spread of terminal velocities up to about 1 em/sec.
Using a sampling velocity of about 20 em/sec (l) and allowing
a maximum vertical deflection of about 1 or 2 mm (constraints
imposed by the necessity to avoid breakup and prevent drops
from coalescing on the upper surface of the duct respectively)
the drops would have to be to the light beam within
1/5 second sampling which would limit
chute to about 5 em, including
of dilution flow. With so
seems unl s~ II
will time s
the velocity drops
light beam would no longer a function of
length of th1!9
for
short a path~
dilution flow
through
only
because of random velocity fluctuations that would occur.
The use of a horizontal viewing chute on was also
considered; since such a chute could be made long enough to
eliminate the difficulties de above. However 11 the
wide spread of terminal velocities previously mentioned would
give to a differential migration effect, viz. the
distribution seen by the light pencil any particular place
in the duct would differ from the actual distribution because
of the varying rates of rise of drops in the duct. The top

1
of the duct would show too many drops and the bottom
too many small drops. This feet would accentuated as
the duct was longer ensure a smooth flow pattern in
the duct. (Because of the large number of drops withdrawn
it only possible to scan a small cross .... section of the duct
with the light beam if the drops are to give separate pul s.)
With these points in mind it was decided to withdraw a
stream from the mixer, take it through a gentle right .. angle
bend and dilute it at the entrance to the vertical viewing
the dilution flow to be just ficient to
that a of s was withdrawn from the tank.. This
(Glen
is in
an
swarms
in
lately work
unsuitable for technique with holdups as low as 5'%, .. )
The of the withdrawal tube was by two
constraints:
(a) it should be enough to sample .
... about 5 mm;
{b) it should not be so large that the withdrawal flow
appreciably distorts
the tank ..
circular symmetry of the flow in
From consideration of flows used by Glen. the impeller
to
pumping capacity as found by Holmes, Vonck.en and Dekker (6)
8
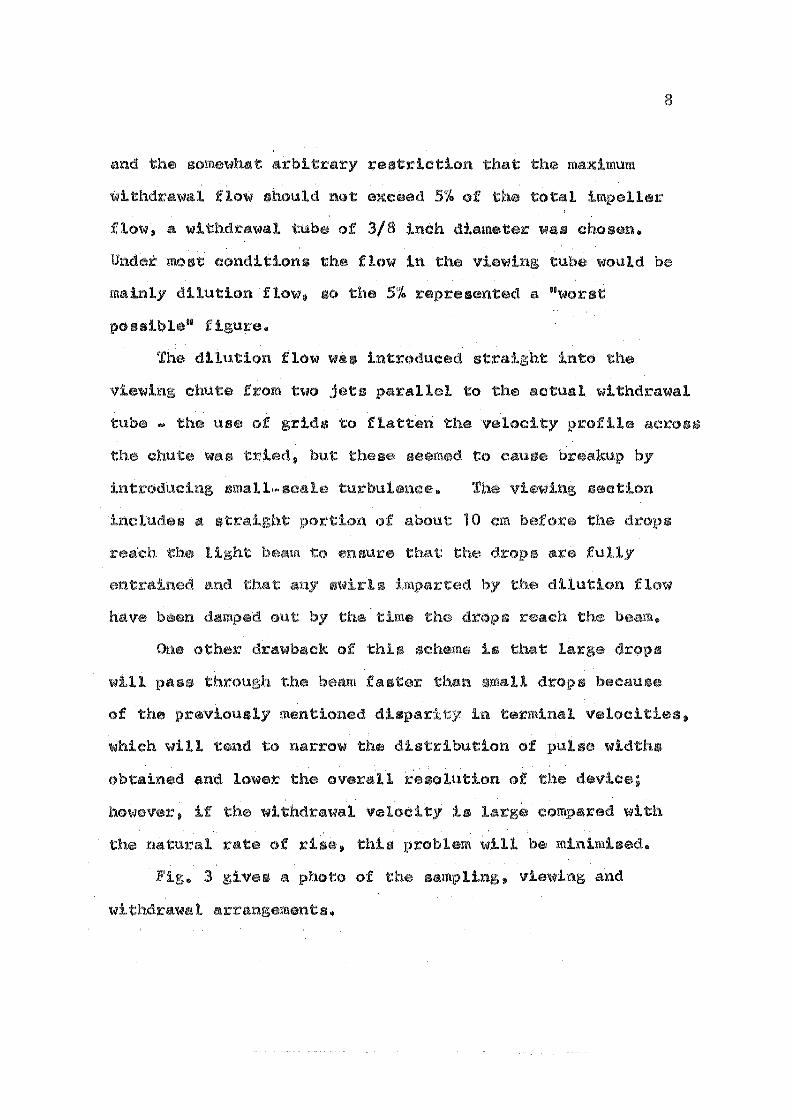
and the arbitrary restriction that the maximum
withdra:wal flow should not exceed S''h of the total impeller
flow. a withdrawal tube of 3/8 inch diameter was chosen.
Under most conditions the flow in the viewing tube would be
mainly dilution flow$ so the 5% represented a "worst
possible•• figure ..
The dilution flow wae introduced straight into the
viewing chute from two jets parallel to the actual withdrawal
tube ~ the use of grids to flatten the velocity profile across
the chute was tried» but these to cause breakup by
small .. turbulence .. section
of about 10 em the drops
s are fully 1 to ensure
swirls by dilution flow
the
of this
will through the beam 1 s
of the previously mentioned di in terminal velocities.
which will tend to narrow the distribution of pulse widths
obtained and lower the overall resolution of device;
~ if the withdrawal velocity is compared with
the natural
• 3
of rise, this problem will be minimised.
a photo of the sampling 11 viewing and
withdrawal arrangements.

(iii)
This is a driven by a DC with a
controller which will maintain the constant tp
within 1~ over a number of days.
scription of the circuitry •.
Abrahamson gives a full
( i v) L;Lght Sgurge
9
The requirement here was for a light source that would
1 of light about 1 em across and about 200
microns thick collimated over of
(about 8 rnm). to
30
or sensor,
are on the
of Glen and
lif
s were made to use a 12 volt
iodine with slits and col as described
by
count .. The smallest beam that could obtained had a
thickness of about 1 mm (or more) and attempts to diminish
this led to troubtes with, diffraction ; also the
intensity was too low • the beat photocurrent attainable ..
about 10 microampa. tests were out with

10
helium-neon laser, indicated
that a more powerful with an output of about 1 mw or
would probably meet all requirements. Further tests
with .a 1 mw "Laser:tronu ser borrowed from the Physics·
laser used had
university confirmed this, although the
too noisy an output to meet requirements
as.a suitable light source. This would be a problem with
any DC
a of 1\'11hite11 noise on the output
Further~ a·DC la is to an known as
(
, which causes random fluctu ...
2 "' 100
on (7 ). One other
it
a reasonably
i work.,
Accordingly, an AC multimode was acquired
1, TEMqmn).
ile
Multimode s have a flatter
mode ones, with a
high excitation frequency of
tube noise inte:rmodUlation are obviated.
A multimode tube also gives higher output (generally
about that a.n equivalent tube) • but has
disadvantage of beam divergence (5 milliradia:ns
as .4 ~illiradians). Unfortunately$ the exciter
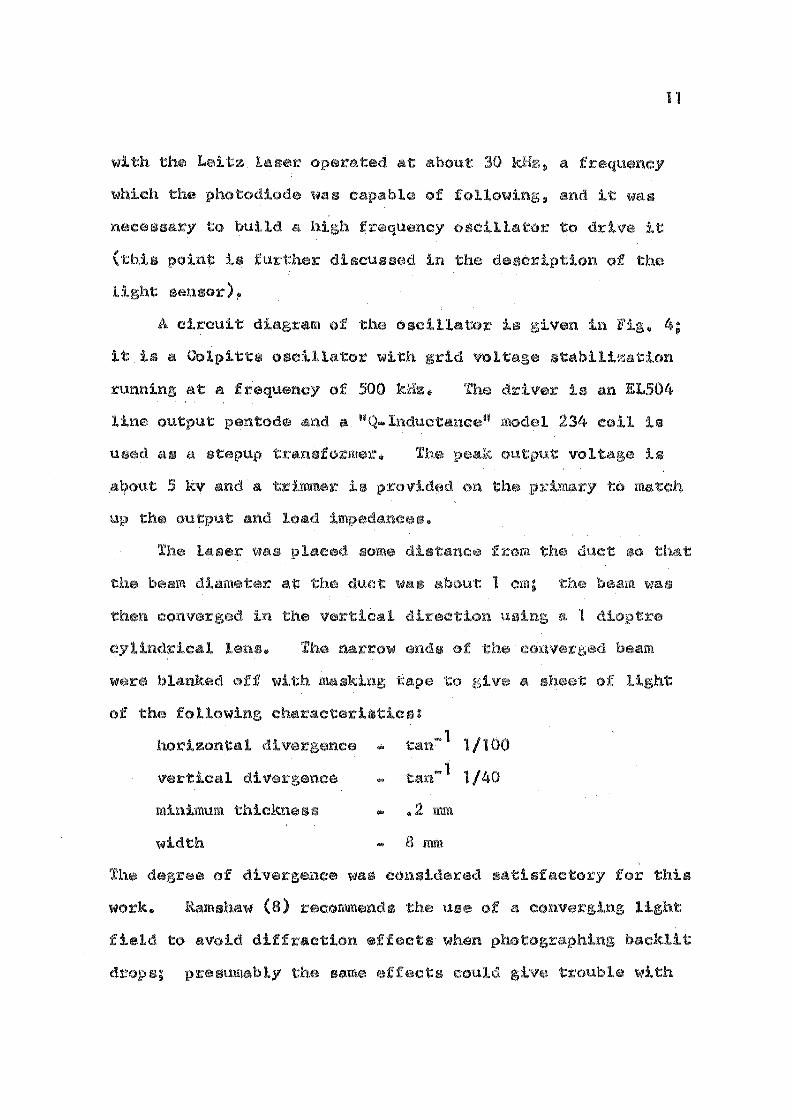
11
at about 30 with the
which photodiode was capable of following, it was
nece build a high frequency oscil to
(this point is further discussed in
light sensor)"
description of the
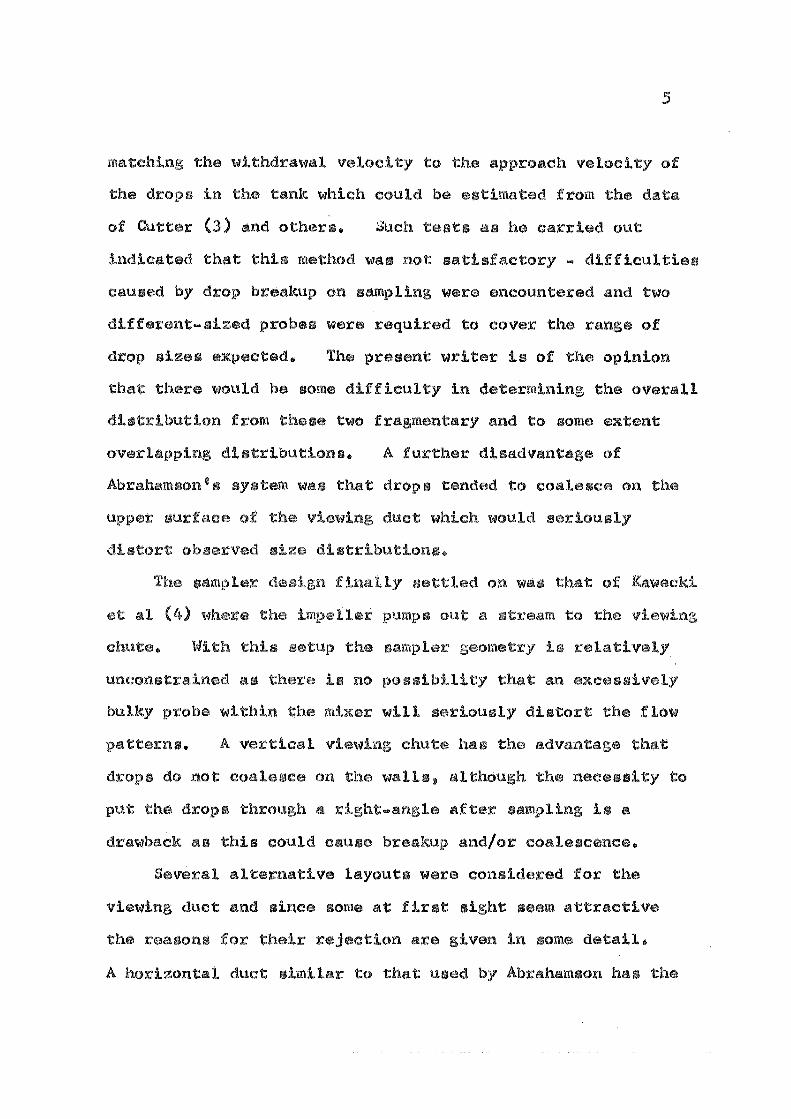
A circuit diagram of the oscillator given in .. 4;
it is a Colpitts oscillator with voltage stabilization
running at a frequency of 500 an EL504
line output pentode a "Q ... lnductancen 234 coil
as a .. vo is
. about 5 kv on the to
ser was p so
at 1 em; was
a 1
l .. narrow
were blanked off with ma to light
the following au
horizontal 1 1/100 "'
vertical 1 1/40 ...
minL-num thickness ... ..2 mm
width 8mm
The of divergence was sfactory this
work .. (8) recommends the use of a converging light
field to avoid diffraction ts when backlit
drops; presumably the same ef could troub with

200- 6001/ IOOmA
\ I . Ol,uF 750V
6.3V X
~~ .oi~F 750V
earth
OA2
IOk lOw
.OIJ.IF T 60-60 750V Df
,,
_L .I }J F
680 5w
330pf
·a· 234
100
C>\ o<
I q eX,
I
'
~ ~ ~ c:>L,_.
H~---------.001 )JF
100 k
Fig 4 500 kHz oscillator

wall
one would •
500 oscil
could induced
this work.
(v)
~ so the ser wa<J
duct ra
2 mw
ll a
in the photodiode, which
l:ls his sensor a
sensor Y.Jhich, was an OAP12
..
12
on
as
the
100 s
was adequate for
of slow DC
was
use with
An
3v ampl
Its
A
by
ity
f
fo:t'
is
run at a much lower photocurrent ..
sensor \~as con which overcame the
s a
which
by
..
or by slow DC dr
This
slow
(see
output pulse of
the beam.,
ts in
ld provided
the photodiode.
prevent
circuitry and the level
lOOk
photodiode
-6V
.22).JF
IOOpf
filtef .I ,.uF .047 }JF
OAPI2
+12V -r threshold
220
-t-12 v
.OI.AJ F
~ +II-= IOO)JF
8
.7
compardtor output 4
l lOOk
.OIJJF
~ -it:!: IOOJ.l F
.22}J
Fig 5 LIGHT SENSOR

VOLT AGE ACROSS LOAD RESISTOR
..........-PULSES CAUSED BY---
DROPS \
---J _________________________ ... _____________ _, __________ ..,_TH.FiE9blnL1~L(W_
OUTPUT WITH THRESHOLD (a)
_r 1 nL_____ OUTPUT WITH THRESHOLD (b)
____..JI I I I n.___
Fig. 6 EFFECT OF THRESHOLD
CONTROL ON LIGHT . SENSOR
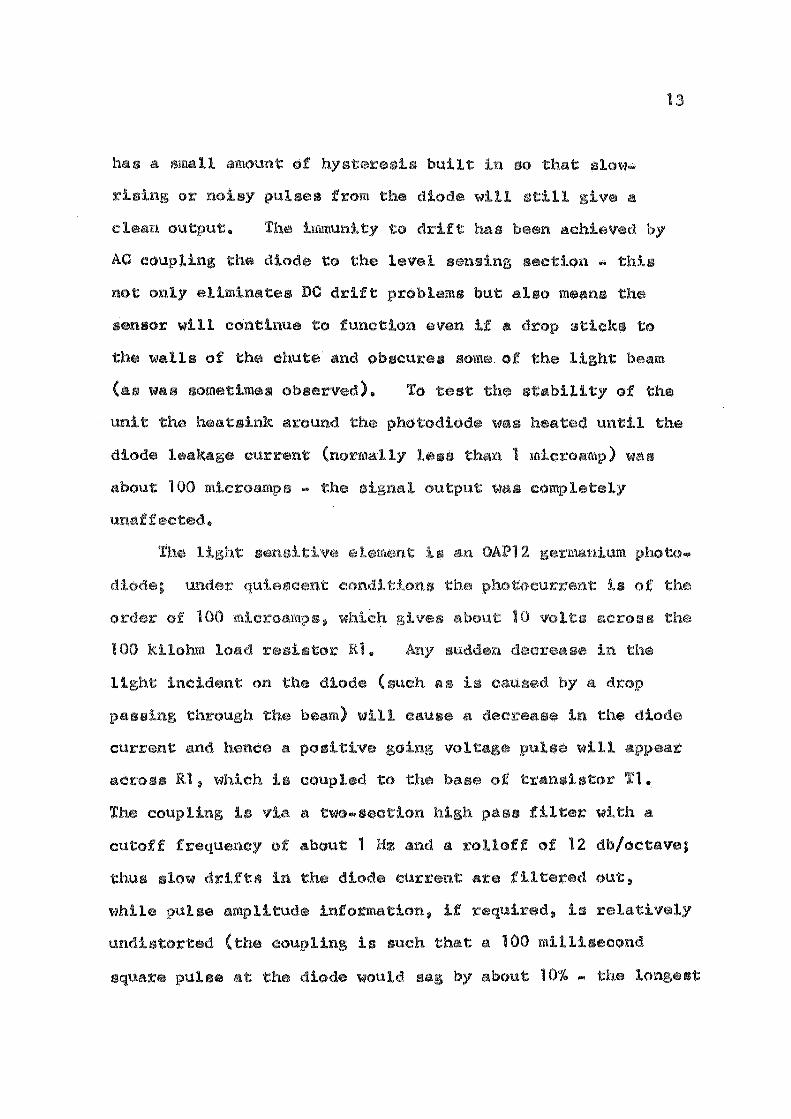
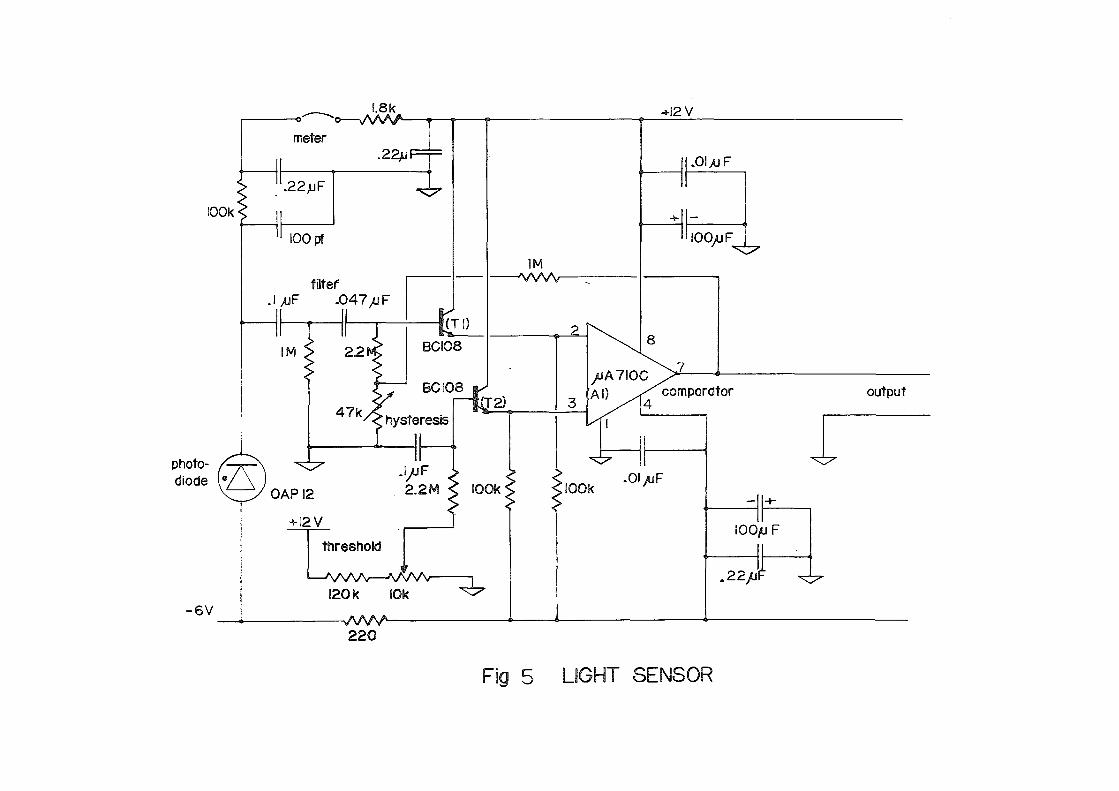
has a small amount of hystere s built in so that slow•
or pulses from the diode will still give a
clean output .. The immunity to drift
AC coupling the diode to the level
achieved by
section .. this
not only eliminates DC drift problems but also means the
sensor will continue to function even if a sticks to
the walls of the chute' and obscures some of the light beam
13
(as was sometimes observed). To test the stability of the
unit the heatsink around the photodiode was until the
diode
about 100
current (normally less than 1 microamp) was
s ... 1 output was letely
..
e is an 2
• , of s, which across
100 kilohm " se
light incident on the diode ( as by a
pas through beam) will cause a in the diode
current a11.d hence a positive vo pulse will
across Rl~ which is coupled to the of transistor Tl ..
The coupling is via a two-section high pass filter with a
cutoff frequency of about 1 and a rolloff of 12 db/octave;
thus slow drifts in the diode current are f out,
while pulse amplitude information, if required, relatively
undistorted (the coupling is such that a 100 millisecond
square pulse at the diode would by about 10% .. the longest

.14
pulses are about 10 mseo and in shape).
Tl an fol the
output impedance of diode to the low., input
of comparator which follows.
The main active element in the circuit is a Fairchild
pA710C comparator; this is· a device whose output state
( .... Sv or +3.1v on pin 7) depends whether the input voltage
on pin 2 or less than a reference voltage applied
to pin 3, i.e. it
vo is lied
slightly by the
over
se
ld
to
two
llable by R4.
mentioned·,
inputs,.
12v
the
F
sensor
the 30 modulation initially
111 which was not
to remove the 30
, but would
about 5
information ..
rolloff was also
The reference
ly, and may
some
which
I>
"' 6. By
R4
capable of
on

a filter is likely to ring badly with single pulses
However~ since the diode response is 3 dB down at 50
with a fairly steep rolloff, the solution adopted was to
drive the laser at 500 kHzp a frequency well outside the
diode 0s sensitivity.
(vi) Pulst W~dtb D~sQ,~minato,
This device takes rectangular pulses of constant
litude and varying widths and gives a standard output
pulse when the incoming pulse falls within preset width
limits. From a terminal a pulse provided for
input pulse» thus is po both
number of
fraction
pulses from
amplitude of
width; this
• total
1
then
a
sensor are
1 to
s to two level
outputs will change state if their
a
input pulse
thresholds are
exceeded. These form a voltage window their outputs
are gated so that an output pulse produced only when
lls within the window. A complete description
gi·ven below• circuit diagrams of the various sections are
given in Figs 7, 8 and 9.
(a) Pulse
15
input pulse (po
10 10 Lisee wide)
from
lCl :. a J1L900

buf which inverts it and provides sufficient
drive for the following sections. The output of IC1 is a
negative going pulse +3.6v and zero (the normal
logic levels for this type of circuitry) which s to a
resistor string composed of a 1 ,kilohm and a 2.2 kilohm
resistor connected to the ... 6v· supply. This· shifts the
·voltage level so that the voltage at point A would if
unrestrained swing between +.Sv and -2v. The swing is,
however, limited to 1v (between zero and -1v) by the
clamping diodes Dl D2. The purpose of this is to
pulse for the integrator which follows.
this pulse are set by the
se the
16
up as
the te
lows:
ground Rl is adjusted to zero •
Then, using the one millisecond ~ a standard 1 milli-
second pulse is fed into the input from a pulse generator
and an oscilloscope connected place of the voltmeter;
R2 is then adju so that the maximum amplitude of the
is 4v.
The integrator (Al) is a pA702C operational amplif
with itive Three different feedback
capacitors (selected by a rotary switch) are provided:
.002 mfd& .02 mfd and .2 mfd corresponding to maximum"input
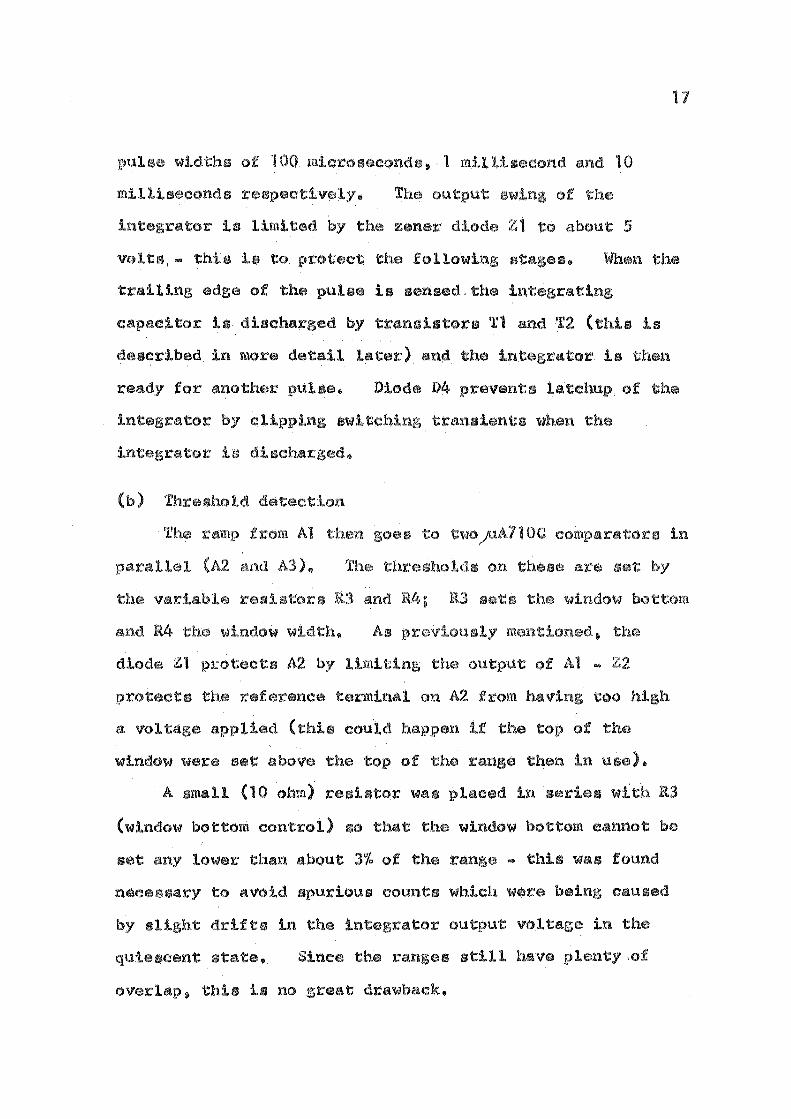
17
pulse widths 100 s,, 1 mil 10
milliseconds The output of
integrator is limited by the zener diode Z1 to about 5
volts, ... this to protect the following s. When the
trailing edge of the pulse is sensed the integrating
capacitor is discharged by transistors Tl and T2 (this is
described in more d,etail later) and the integrator is then
ready for another pulse. Diode D4 prevents latchup of the
the reference terminal on A2 from too high
a voltage applied (this could happen if the top of the
windo\4 were above top of the then in use).
A small (10 ohm) stor was placed in s with R3
(window bottom control) so that the window bottom cannot be
any lower than about 3'r.. of the ... this was found
nece to avoid spurious counts which were being caused
by drifts in the integrator output voltage in the
quie Since the still have ple:nty.of
overlap• this no drawback,.

(c)
are
is
s combinations
ld or both thresholds.
18
outputs from
one threshold~
from the
only in the first case, since this denotes
a pulse within the voltage window. It th$refore necessary
in the third situation the pulse from A2 should inhibit
or that from A3. However, the pulse from A2
is not po
pulse \~idth
pulse
(A
.. in
a pulse is
to other
pul
the pulse from A3» direct
has been where
in a buf memory which is
pulse a output
l
A
..
14 as
f s one e,s a
flip-flop is a inputs and two
this case the outputs are zero +3 .. 6v.
to one of input )
s reverse s until a pulse
only one
lied
("resetn) is
It the
f !' A NOR a with two output
are 1 low
no
and
output
output
a of ... if the
will high, but if one or xnore s high:.

19
In setup~ are the set•
flip ... flops making up the memory, 1C7 a three-
input NOR
IOS isconnected to A2 and hence "remembers" whether or
not the threshold on A2 has been exceeded .. Similarly 11 IC6
stores the history of A3. The outputs of ICS and IC6 are
connected to two of the inputs of IC7 .. In the "reset"
state, i.,e. with no pulses present, the output of ICS is at
zero and that of 106 is at +3.6v,. lf an input pulse
ld on A3, but not on A2 (i.e. it lls
within the vo window), the output of IC6 will fall
zero; will. also at zero
IC7 l
... a
same ..
se
normally
to this input
a po
Ic7. It fol
have
IC7 will
Af
pulse
(d)
IC1
the
Total pulse
To provide
diff
1
of this
pulse will
also from this
II
only IC6
to IC7 will be at zero
pulse (about 2 micro
be at the output
that or both
one input to
s
)
of
be no output pulse will produced,.
pulse memory, another
to memory ..
count~ re pulses
pUlses the initial input pulse from
by R8 and Cl to two

20
to and trailing s of the
input pulse ... diode D3 clips the from the leading
so that point E only a positive going spike
corresponding to the trailing of the pulse is present.
E is an input to IC2, a pL914 gate connected as two separate
D (the output corresponding to E) is
normally at +3.6v:~ but the positive go'ing at E drops D
to zero for about 2 microseconds. D is connected to the
third input of IC7 (the three input NOR
and
pulse
2
by IC3, a
pulse
buf
in the memory)
pulse is also
total pulse
so uses the
to
pulse
of
the
are
, then once
Tl across
on
comp
produced.
The output of 1C3 is also to IC4 11
11 however~ 6v than the
Thus the output of IC4 (at G) normally at
JlL900 buffer
usual 3.6v.
+6v. element is af1A710C comparator (A4) which
s one input lead connected to the output
other to the output of the integrator.
IC4 and the
the output
voltage of Al is limited to 5v by the zener diode Zl, the
voltage on pin 2 of A4 will normally be less than the 6v

21
on pin 3 the output of A4 will be at • liow when
the·2 micro pulse from 103 is applied to the input of
lCI+~ output of 104 (G) will fall to zero"' as will the
voltage on pin 3 (the reference input) of A4. Pin 2 on A4
to the integrator output, which at this stage '
will be between .Sv and .5v (i~e. at the top of the
ramp) ; since the vo on pin 3 of A4 is now less than
that on pin 2, the output of A4 will switch rapidly to +6v
and as a result two 2N3643 transistors Tl and T2 will be
The output of A4 also to the
which ho G at zero, i.e. the latches
on until the
reached
(the voltage on
pulse
, Tl ·and
SI!!IC:!OrllQ ~ Which
all cases ..
holds
completely
lied lC4. lf
would be turned on for
to
When this
voltage on pin 2 of A4 falls to zero
actually slightly above zero) and
the comparator output switches back to zero, turning off Tl
allowing the output of 1C4 to to 6v.. This
switching transient differentiated and applied to H (the
input to the second half of the buffer 1C2) and the resultant
output pulse is used to re the memory.

INPUT
+3.6V ----.----
uL900 <rc t>
PULSE SHAPER
A
2.2k
TO Cl
Rl - INTEGRATOR ZERO
R2- • SLEW RATE
R5- • RESET OVERSWOOT
COMPENSATION
Rg. 7 DISCRIMINATOR -
-sv
lk (R5)
+6V -.--
56k
PULSE SHAPER & INTEGRATOR
INTEGRATOR
AN lOll
(04)
-t-12V
OAZ202
270k
--sv
.oo2 uFwroo usl /'
22k
lk
TEST SOCKET
TO A3 S. A:2
220 ~ Ill 2N3643
TO f A4 PIN 2
(T2)
IOOpf
TO A4 PIN.7

OA91 (03)
(CI)
FROM ICI PIN 5
lk (R8)
+3.6V
1500pf (C3)
RESET
PULSE
+3.6V
READOUT
PULSE
+sy -----.--
iOOpf
lk5
TOTAL PULSE COUNT
FIG 8 DISCRIMINATOR- TIMING & CONTROL
FROM INTEGRATOR
OUTPUT
220
+12V
2
3
)JA710C
(A4)
-6V _
TOTI aT2

FROM INT!;:GRATOR I
OUTPUT (AIl •
220
220
I
ft, 1000 J.JF
100
100
I
220 (R4)
Fig 9
-+12V ---r-
7
~
60-1
250AJF
DLSCRIMINATOR-
1.5k
LSI< (IC6J
RESET
~ PULSE
12V AC
THRESHOLD
+3.6V --.-
+3.6V ----r-
READOUT
PULSE
DETECTION &
+3.6V
..ul914
GATING
I COUNT WITHIN
WIDTH WINDOW

10
7
Fig 10 --DISCRIMINATOR
CALIBRATION
WINDOW WIDTH
THRESHOLD
2 a 4 s e 1 a 9 10 11 12 13 MILLISEOS
thla calibrcation ia tor range 3 divide X-axis by 10 for range 2 & 100 for range 1

(e)
di
and linearity ..
model 114 pulse
device built and
22
reproducibility
A calibration chart obtained using a Tektronix
given in Fig. 10. The similar
scribed by Abrahamson had several defects,
window and threshold controls, slow recovery,
which system behaviour to be dependent on the frequency,
aa well as the width of incoming pulses and slow
which :restricted resolution available in the
These
)
both
window directly, which an
method of a constant
s were
one
to 10~000 or 100,000
the
for
within
alternative
window

23
Initially, the mixer was
at the top (similar to Glen's
up with the withdrawal tube
), no provision for
the introduction of a dilution flow; and the light source a
12~ quartz-iodine lamp (driven by a 12v lead accumulator to
eliminate 50 Hz modulation on the light). The. light sensor
was apparently satisfactory as it would give an output when a
wire was moved through the beam and problems of DC stability
had been overcome by AC coupling th• ph.otodiode, .Considerable
difficulties were with the light source. howe~er;
of dif s the was not sharply
and was not intensity
with no an
output even 1 it
to put down, which
sensor liable to spurious
pickup. Even if the de·vice were so well shielded this
could all eliminated, would be no of obtaining
an output with the modulation caused by the lest drops
(about 3%) .. Amplification the was also
considered, but this would amplify also, no
improvement,
difficulty was encountered with the sampling and
viewing setup where the
through a short tube then
was withdrawn from the mixer -.
into a flat viewing duct.
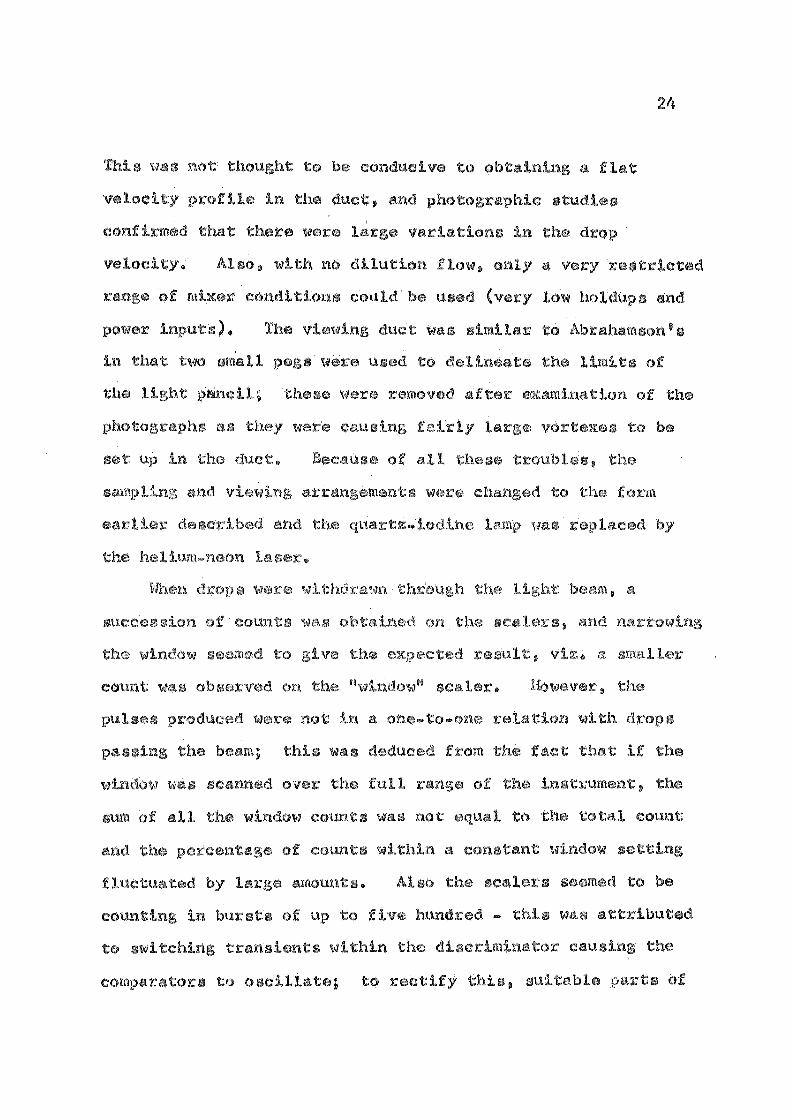
24
thought to conducive to obtaining a flat
velocity profi
conf that
velocity. Al
of
power inputs).
duct , studies
were large variations drop
• with no dilution flow. only a very re
conditions could (very low holdups and
The viewing duct was
in two small
light pancil;
to Abrahamson's
limits of
of the
succes
was
sum of all
the
fluctua
to
as
by
duct.
ser.
were in a one ...
was deduced
with
that if the
over full , the
was not equal to tal eount
of within a window
amounts.
of up f
s within
Also the
hundred -
di
to be
s was attributed
causing the
s to oscillate; to rectify this, suitable s of
were
a
output ... it was
output
~Jith no
shield the
500
its
osc
sensor
were connec
output
was
but this
sought..,
was
f
ItO
, but no was
VO across the
modulation on its
concluded was
photoelectric .. bypa to high
Unfortu11ately ~ it was
0 1 completely
as
~,;~a. s
was
to
was s was
s s .. s
about 1 O'Yo no:t"!nal
with s
s of a f
a difficult approach
by the
this the
II
not to
all
laser tuba
ss mo
~ -vJhich cau
1;
on
ser
is to
"
calibration
method was
drops in was to
an o llo across of

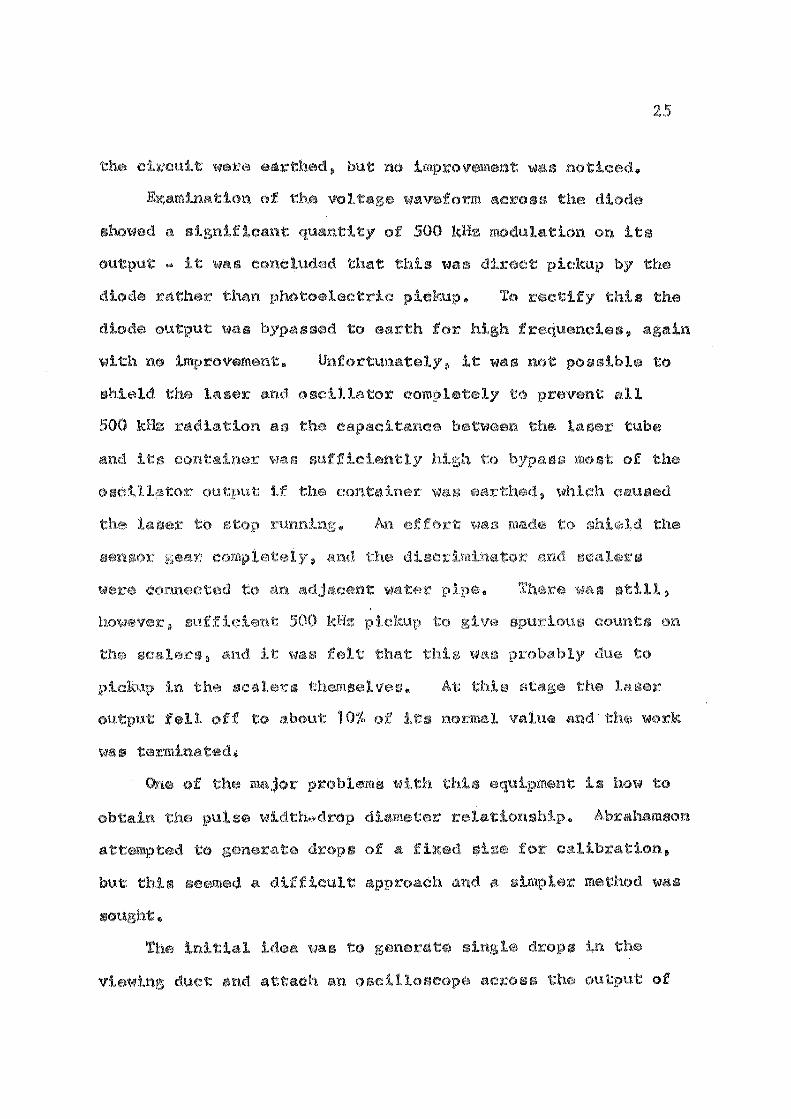
26
sensor; as
would
pulse which it ..
both
While this \vas
one
drop and the
in principle~
reason
1 for two reasons: to drop it was
to use a f of light
for a short it was difficult to
drops, e ly in a flowing •
difficulties are probably not in but
it: was 11ot
an
some
ssible
to measure width or to
mo
sensor
f sen, which
success~' was
measure the pulse
sensor.
the drops also the distribution of
obtained matched with the distribution
program to
s is
s to
by photo ..
could
pulse widths.
distribution
27
CONOLU§IONS AND RECQMMENDAIIONS
With some modifications. this apparatus could be
satisfactory for measuring drop-size distributions. It is
felt~ however, that the original aim of producing a device
that would measure simultaneously the drop (from pulse
width) and tracer concentration (from pulse height) is not a
practical proposition. In the device developed. the light
sensor placed sufficiently far back for all forward
light to lost ~ this means that the drops
opaque to the light sensor. sensor was further
a function
po
a
A
re
s
1
so at the
as well as
as some was
This
• Thus
; however, it could u
pulse was produced by one
pulse would
smal s would
use a pulse
would not be
1 ones (though would
over•
problems) ..
with for a height discriminator
di is in 4.
Another problem
duct ... although
that of velocity variations in
is not too difficult to obtain a
velocity profile across
necessitY for a thin viewing section
of the duct
it hard to

a f
answer to
that all
by
the duct. Possibly the
in
s will entrained
they reach the light beam.
duct in
·the
avoid the troubles caused by 500
28
container should be built for the laser tube and oscillator.
lt should not be difficult enclose the whole assembly
11.0
which can
oscillator output.
could
cone
not
..
without
If neces
to about 200
should
is
se
too much
lat:or
without
this
or

29
a mono.stable multivibrator compo of
pt.914 ~ with a p.L900 driving an
• When the first flash f (by the camera) the
bur of light sensed by a photodiode, and
a variable delay time has elap is f
flash (connected across also
A in • 1 1
• 12 .. By in an
it is

100
Fig 12 --90 DELAY
80
70
60
50
40
30
20
10
DIAL SETTING
CALIBRATION '
2 4 s e 1 a a DELAY (Milli8EC)

.30
A circuit ol this is given in • 13.
Regulated supplies at +12v 11 +36.v, +6v, ... 6v, ... 12v- are
<il'Vailable 11 with 12v floating AC for the threshold
window settings on discriminator.

~ 230 v Oi c: ex, .. :J
12 ...
SO-l
SO-l
I 2500 pf
40V
s 220 H •oo,:,r ~I ~...,
OAZ 202
-l .. 25lpF 40V
1.51<
"'l" OJpF
1.811
ACI26
1.51<
Fig. 13 DISCRIMJNA TOR POWER
OC75
5 uF .211
OC74
SUPPLY
+12 v
L +.~6\fo
~O.AIF .J:,. 12V
+6V
~ -• IOO,AJF
12V
-6V
-12V

This
photograph•
output the l
resolution.
31
as input observed drop sizes from a
with the • as
distribution determined with
A listing given in Fig. 14 and le output in
Fig. 15.

FORTr<.A'\1 IV MDOEL 44 PS VERSION 2v LEVEl l
OIMENSIO~ DOROP(5000J,ODIA(8) ~EADl,SC~LE 9 DElT4
l FORHAT(2Fl0.51 2 FORMAl( 8F 10.41
I=O 63 ~EADLtDDIA
IF!DDIA(lll62,61,62 62 00 60 J=l 8 60 CDROP(J+Ii=DDIAlJI/SCALE
1=1+8 GO TO 63
61 '\IDRDP=I DMAX=DDR"":P ( U DO 36 I=l,ND~OP IF(OHAX-QDROP(lll34,36,36
34 GMAX=DDR~P(Il
DATE 68218
00.01 UC .. C•.2 0003 0004 JOCJ':> COOb 0007 :)003 0009 001v 0011 0012. 0013 0014 0015 OOlo 0017 0012 0019 C020
36 CONTir.UE L=lDMAX/DElTAI+l. 80UN2=0.J
6 FORMAT(/" LOWER LIMIT,MM',6X, 1 UPPER liHIT,MM 8 ,6X, 8 NO OF OROPS•,zx,
0021 002i on3 C024 002.S 0026 0027 ooze 0029 J03C• 0031 0032 0033 0034 0035 0036 0037 003~ 0039 (1040
FGRB.ll:-. II/
!'WINDOW PERCENT 1 ,2Xa 1 CUMULATIVE PERCENTS•) PRINT 6 r(BR=G DO 50 K=l,L NMBR=O i>.OUNl=BOuN2
BOUN2=B8UNl+DELTA CO 30 I=l,NOROP IF(BOUN2-UOROP(lll30,40,35
35 IF(00ROP!Il-BOUNll30,30,40 40 •;MBR=NMBR+l
KBR=KBR+l 30 CONTINUE
nPERC=IfLUAT!NMBRl/FLOATINDROPll*lOO.O CPERC=IFLOATIKBRl/FlOAT(NOROP))*100.0 eLT=BOUNl+.Ol*DELTA
50 PRINT5,BLT,BOUN2,NMBR,WPtRC,CPERt 5 FORM~T(/4X,f6.2 7 14X,F6.2,12X,I5,lOX,F6.2 7 lOX,F6.2)
r>~INll5 ,~DROP 15 FOKMATI/' TOTAL NO Of DROPS WAS',l5)
E:ND
MOuEL 44 PS VERSION 2, LEVEl 1 DATE 68218
TOTAL ~EMJ~Y REQUl~EMENTS ~053EO BYTES
CGMPILE~ HIGHEST SEI/E~ITY too= ~AS 0 II EXEC L~KEDTINOMAPI
Fig. 14 COMPUTER PROGRAM TO SORT
PAGE 0001
PAGE 0002
DROPS

ltH/ / )1•
~}N~~:•t 11'1111< llliilll ~I ~I VIlli IV W~';
Ill Will I I M II diM
o.on l\,(.)1)
u.lo ().,., DolO
(l, !U
U.l~
0,40
0,45
t). 1>0
OohO
0.&5
Uo70
0.75
o.no u.es Oo90
Oo95
loOO
lo05
1.10
lol5
lo 20
lo25
lo30
lo35
lo40
lo 45
lo50
1.55
lobO
lo65
lo70
lo75
loBO
lo85
lo90
lo9S
2o00
2o05
2ol0
2.15
2.20
2o 25
2.30
2. 35
2o40
2.45
2o50
2o55
Ill' I' I II I I Mil ,MM
\i, 10
,), 20
v.;~
\)I 3(J
u.,.o l)·'•5 II. 'jO
1),55
n.6o l)•biJ
o. 70 llo 75
(lo uo o.a5 0 o'/0
Oo95
looo 1.05
lolO
1.1~
lo20
1.25
1.30
lo35
1.40
1.45
1.50
1.55
1.&0
1.&5
lo 70
1.75
loOO
lo85
1.90
lo95
2.00
2o05
2.10
2.15
2.20
2.25
2.30
2o35 2o,,o 2o45
2o 50
2.55
lobO
2.60 2.65
2o65 2.70
2o70 2o75
}2TAL NO 8f DROPS WAS 27&0
II
Fig 15 SPECIMEN
IIIIII'I'V I.INKA .I I ill I
1~11 Ill 1111111'~ WINIJIJW l'tiH.Pll CUMIJI AI lVI I'IIICI 'II',
llr,
14•·
Hh
Zll
2'11
lh,
25;
111
201
81
15 7
IJ(>
4'.l
3'• 81
21
4r>
21
27.
l.J
IK
12
12
13
I (,
()
0
0
0
0
0
()
,)
[)
•)
')
n
o.o lt.'.JI
lj ,(J 1
I lo'll
HoOt 10.~11
'loll
, .. o~ 7,50
loOI
5.6'1
4o9J
lob)
4o4'1
lo27
2.91
Oo76
1.4'J
o.11>
o.ao o. 3b
o.&o; Oo43
Oo43
0.47
0.04
u.22
o.O'• 0.10
o,o7 o.o 0.07
o.o o.o4 o.o4 o.o 0.07
o.o4 o.o o,o7 o.o o.o o.o o.o o.o o.o o,o o.o o.o o.o o.o o.o 0,04
o.o1
PROGRAM
OoO
1 J.5~
il.'>h
'•2· 11•
/tf), l'J 1J1. 3fJ
61.311 6H .·an 'II. 811
77.51
112 .so ~4.ll
H6,b7.
U9,89
'12.86
93.62
95.07
95.81
'lbob"l
96.99
'17 ,64
98.08
98,51
'18.99
99.02
'19.24
99,28
99.46
99.53
Y9o53
99.60
99.60
99.64
99.67
99,67
99,7~
99o7ll
99.78
99.86
'19.86
99.86
99.86
99.8&
99.86
'19,86
99,81>
?9,86
?9.86
9'l,8n
99,86
99,86
99,89
qq,qt,
OUTPUT

32
A circuit is in • 16 for a pulse height
discriminator cornpatible with the preser&t width discriminator.
The ld detection section of the circuit is identical
with that in the width discriminator. but a logarithmic
lifier at the input avoids the need for several levels
of sensitivity. This is described in the Fairchild
Applications Handbook.
If litude discrimination were , a
lif would also

LOGARITHMIC
220
lOOk
'I
+12V
220
lOOk
220
<.:~
+12V
56 60-1
220~~--,-------------;
q·~~·
12V AC
Fig_ PULSE HEIGHT
RESET PULSE
+3.6V ----.--
II<
COUNT IN WlllTH WINDOW
+12V
470
DISCRIMINATOR
+3.6V
READOUT PULSE
pL914
COUNT IN HEIGHT
r·~·
COUNT IN BOTH
f"-

1,. J.. 11 "Development of a Photoelectric Method for
2.
4.
5.
7 ..
8 ..
Mea Drop... Distributions:.'' M.E. Thesis 11 University
of Canterbury (1967)
J .. B. Glen, ":Mass Di Systems", Ph.D ..
Univ. of Canterbury (1965)
L.A., Cutter~ Uflow and Turbulence in a
D.. .. The s, Columbia University ( 1960)
(u .. c. ilm 61, 246)
w ..
c ..
P .. E ..
J .. w ..
1,
41' 444 (1
J .. A ..
65/9 ..
, July 1 11 p ..
)
Tank" ,
the
1519 (1
130C
by
1
Liquid
1 ( 1
)