Embed Size (px)
Citation preview
i n t e r n a t i o n a l j o u r n a l o f h y d r o g e n e n e r g y 3 4 ( 2 0 0 9 ) 4 5 1 7 – 4 5 2 3
Avai lab le a t www.sc iencedi rec t .com
j ourna l homepage : www.e lsev ier . com/ loca te /he
Photofermentative hydrogen production from volatile fattyacids present in dark fermentation effluents
Basar Uyara,*, Inci Eroglub, Meral Yucelc, Ufuk Gunduzc
aDepartment of Biotechnology, Middle East Technical University, 06531 Ankara, TurkeybDepartment of Chemical Engineering, Middle East Technical University, 06531 Ankara, TurkeycDepartment of Biology, Middle East Technical University, 06531 Ankara, Turkey
a r t i c l e i n f o
Article history:
Received 23 February 2008
Received in revised form
31 March 2008
Accepted 13 July 2008
Available online 1 October 2008
Keywords:
Rhodobacter sphaeroides
Photofermentation
Dark fermentation
Volatile fatty acid
Substrate conversion efficiency
* Corresponding author. Tel.: þ90 312 210269E-mail address: [email protected] (B. Uy
0360-3199/$ – see front matter ª 2008 Interndoi:10.1016/j.ijhydene.2008.07.057
a b s t r a c t
In the present study, the growth and hydrogen production of Rhodobacter sphaeroides O.U.
001, was investigated in media containing five different volatile fatty acids (VFA) individ-
ually (malate, acetate, propionate, butyrate and lactate) and in media containing mixtures
of these acids that reflect the composition of dark fermentation effluents. The highest
hydrogen production rate was obtained in malate (24 mlhydrogen/lreactor h) and the highest
biomass concentration was obtained in acetate containing media (1.65 g/l). The substrate
conversion efficiencies for different volatile fatty acids were found to vary between 14 and
50%. The malate and butyrate consumption rates were first order with consumption rate
constants of 0.026 h�1 and 0.015 h�1, respectively. In the case of substrate mixtures, it was
observed that the bacteria consumed acetate first, followed by propionate and then buty-
rate. It was also found that the consumption rate of the main substrate significantly
increased when the minor substrates were depleted.
ª 2008 International Association for Hydrogen Energy. Published by Elsevier Ltd. All rights
reserved.
1. Introduction The composition of the fermentor liquor obtained after
Biological hydrogen production processes are found to be
more environment friendly and less energy intensive as
compared to thermochemical and electrochemical processes.
These processes are mostly controlled by either photosyn-
thetic or fermentative bacteria [1].
The combination of photosynthetic bacteria with fermen-
tative bacteria can provide a system for hydrogen photopro-
duction from residual carbohydrates such as organic wastes.
In such a coupled system, anaerobic fermentation of organic
wastes produces low-molecular-weight organic acids in a first
step, which are then converted to hydrogen by photosynthetic
bacteria at the expense of light energy, in a second step [2].
The overall yield of hydrogen in such a two-stage process was
found to be higher compared to a single stage process [3].
6; fax: þ90 312 2102600.ar).ational Association for H
first step fermentation depends on the substrate, microor-
ganism type used and pH of the process. Table 1 lists the
compositions reported in literature. The types and concen-
trations of organic compounds obtained after the fermenta-
tion covers a wide range, however the main fermentation
products can be identified as acetate and butyrate. Propionate
was also present in considerable amounts. Ethanol, methanol
and lactate were reported in some cases.
It is important to convert those acids to hydrogen as that
will also mean to obtain the treatment of organic wastes in
addition to hydrogen production.
On the other hand, for hydrogen photoproduction, malate
and lactate were reported as the most favorable substrates
giving the highest hydrogen production rates [17–20].
However, little is known about the conversion of acetate and
ydrogen Energy. Published by Elsevier Ltd. All rights reserved.

Nomenclature
ks the substrate consumption rate constant (h�1)
OD optical density
PHB poly-b-hydroxybutyrate
R2 the coefficient quantifying goodness-of-fit
S substrate concentration (mol/l)
t time (h)
VFA volatile fatty acid
i n t e r n a t i o n a l j o u r n a l o f h y d r o g e n e n e r g y 3 4 ( 2 0 0 9 ) 4 5 1 7 – 4 5 2 34518
butyrate to hydrogen by photosynthetic bacteria [20,21],
acetate and butyrate were reported to be favorable for
production of poly-b-hydroxybutyrate (PHB) instead of
hydrogen [22]. Moreover, PHB production competes with light
dependent hydrogen production; the reason for this compe-
tition is that PHB production and hydrogen production use the
same reducing power that results from the metabolism of
organic acids [23].
Rhodobacter sphaeroides O.U. 001, is a purple non-sulphur
bacteria that is able to produce hydrogen from organic
acids by nitrogenase–hydrogenase enzyme system under
illumination at anaerobic conditions. The culture medium
Table 1 – The composition of dark fermentation effluents
pH m/o Type Substrate used
Acetat
5–7 Mesophilic Sewage sludge 10.4–21.0
8 Mesophilic Sewage sludge 41.3–49a
5.2 Mesophilic Refined sucrose 17–27
5 Mesophilic Organic municipal
solid waste
16.7a
6.8 Mesophilic Sewage sludge 40.7a
4.5–6.5 Thermophilic Foodwaste 1.1–4.2a
4.5–6.5 Mesophilic Foodwaste 3.1–8.7
4–7 Mesophilic Rice-waste 15.7–29.4
5 Mesophilic Fruit–vegetable waste 83.3c
5–6.5 Mesophilic Molasses 9–21.6d
4.3–5.4 Mesophilic Steam exploded
corn straw
60.7e
4.5 Mesophilic Cronstalk wastes 15.3a
6.6 Mesophilic Cattle dung
and sludge
12.6
3.7–4.8 Mesophilic Cattle dung
and sludge
14.3–20.2
6.0 Mesophilic Sucrose 15–40
6.0 Mesophilic Starch 7
5.2–6.4 Thermophilic Glucose 7.5–10.8
4.9–6.0 Mesophilic Glucose 3.2–10.6
4.5 Mesophilic Glucose 29.2–41.0
a Given in mg/l in the original reference.
b Converted from % values and total VFA given in mg/l, 0–5.9 mM metha
c Composition after 23 days of acidogenic fermentation. converted from
d Converted from % values and total VFA given in mg/l.
e Converted from % values, total VFA given in mg.gsubstrate, feed subst
f 6–24 g/l sucrose was added to the feed before fermentation.
g In CSTR reactor, 0–11.4 mM lactate was also present in the effluent.
h In CSTR reactor, 2.4–8.4 mM lactate was also present in the effluent.
i In UASB reactor, 0–5mM lactate was also present in the effluent.
should be under a nitrogen limitation (i.e. a high C/N
ratio), which forces the bacteria to ‘dump’ the excess
energy and reducing power through the production of
hydrogen [22].
In a previous study, our group reported that R. sphaeroides
O.U. 001 is able to produce hydrogen anaerobically in a pho-
tobioreactor by using effluent which was obtained by dark
fermentation of olive mill wastewater with activated sludge
[24].
The objective of this study is the comparative analysis of
the biomass growth and hydrogen production of R. sphaeroides
O.U. 001 in media containing different volatile fatty acids
(VFA) as carbon sources (malate, acetate, propionate, lactate
and butyrate) in order to determine alternative carbon sources
for photofermentative hydrogen production. It is also targeted
to use mixtures of those acids which reflect dark fermentation
outlet composition as carbon sources in photofermentation in
order to investigate the appropriate conditions of coupling
dark fermentation with photofermentation to improve overall
hydrogen production efficiency. The evaluation of different
runs based on the hydrogen production, growth and substrate
consumption is also required for understanding the metabo-
lism of the bacteria.
Effluent composition (mM) Refs.
e Propionate Butyrate Ethanol
a 0.3–6.5a 29.5–36.0a 1.3–6.3a [4]
19.2–24.1a 2.8–5.9a 2.6–11.3a [4]
33–39 2.0 [5]
8.1a 31.8a 21.7a [6]
23.3a 85.7a 33.7a [7]
0 7.4–10.5a [8]
1.9–6.2 2.0–7.1 [8]b 0.4b 18–25b [9]
37.0c 250.0c [10]
0–2.7d 1.2–2.3d 32–60d [11]
20.3e 25.2e 12.1e [12]
9.2a 12.8a 5.4a [13]
0.5 0.9 [14]
f 0.8–1.3f 48.1–143.1f [14]
45 30–35 [15]
20 14 [15]
3.9 3.5–13.1 0.2–0.7 [16],g
6.5–22.2 0.5–10.6 [16],h
23.8–30.4 1.3–2.4 [16],i
nol was also present in the effluent.
g/l.
rate amount and culture volume.
i n t e r n a t i o n a l j o u r n a l o f h y d r o g e n e n e r g y 3 4 ( 2 0 0 9 ) 4 5 1 7 – 4 5 2 3 4519
2. Materials and methods
2.1. Bacteria and culture
R. sphaeroides O.U. 001 (DSM 5864) was used in this study. The
inoculum was prepared by growing cells in the modified
medium of Biebl and Pfennig [25]. Growth medium had
malate (7.5 mM) as the carbon source and sodium glutamate
(10 mM) as the nitrogen source. In hydrogen production
experiments, nitrogen source was sodium glutamate, type
and concentration of the carbon source were changed as
stated. The sterilization of the photobioreactors and media
were accomplished by autoclaving at 121 �C for 15 min. 10%
inoculation by volume of the fresh medium was made into
the photobioreactors.
2.2. Photobioreactor
Glass bottles with 55 ml liquid volume were used for hydrogen
production. Since the foaming was virtually absent in our
system, headspace volume was not required in the bioreactor
and thus the bioreactor was filled completely with the broth
during the process. The hydrogen gas produced by the
bacteria was collected from the top by a thin hollow tube into
a graded glass cylinder initially filled with water which was
replaced by the hydrogen produced during the process. A
camera connected to a PC was used for on-line monitoring of
the hydrogen production. In this system design, continuous
hydrogen production data were obtained which allowed
calculation of the rate of hydrogen production precisely and
accurately. Details of this experimental setup were given
previously [26].
2.3. Operating conditions
The photobioreactors were maintained at 30–33 �C in an
incubator. The illumination was provided by 100 W tungsten
lamp, adjusted to provide a uniform light intensity of
150–200 W/m2 at the surface of the reactor. Initial pH of the
media in all of the bioreactors were 6.7.
2.4. Analytical methods
The produced gas was analysed by gas chromatography
(Hewlett–Packard 5890 Series II). Propak Q column was used
with thermal conductivity detector. The oven, injector and
detector temperatures were 30, 40 and 50 �C, respectively.
Nitrogen was used as a carrier gas at a flow rate of 11 ml/min.
The bacterial cell concentration was determined spectropho-
tometrically. It was found that an optical density (OD) of 1.0 at
660 nm corresponded to a cell density of 0.58 g dry weight per
liter of culture. VFA concentrations were analysed with HPLC
(Varian ProStar HPLC). MetaCarb 87H (300� 7.8 mm) (Cat No.
5210) and VARIAN 330 PDA were used as column and detector,
respectively. H2SO4 (0.008 N) was used as the mobile phase at
a flow rate of 0.6 ml/min.
3. Results and discussion
3.1. Hydrogen production from different individualVFAs
Hydrogen production experiments were conducted in media
containing different VFAs as the carbon sources; malate
(15 mM), acetate (30 mM), propionate (20 mM), lactate (20 mM)
and butyrate (15 mM). The concentrations of VFAs were
proportional to their C contents. All other parameters were
kept same but the carbon sources were changed.
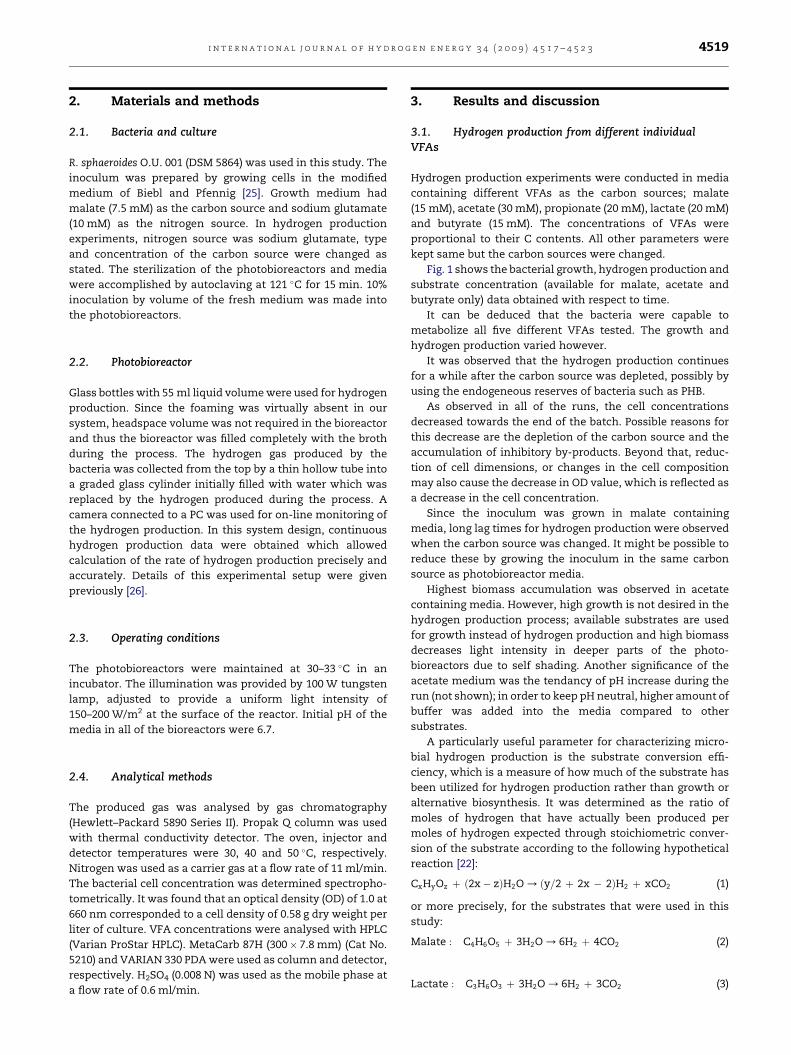
Fig. 1 shows the bacterial growth, hydrogen production and
substrate concentration (available for malate, acetate and
butyrate only) data obtained with respect to time.
It can be deduced that the bacteria were capable to
metabolize all five different VFAs tested. The growth and
hydrogen production varied however.
It was observed that the hydrogen production continues
for a while after the carbon source was depleted, possibly by
using the endogeneous reserves of bacteria such as PHB.
As observed in all of the runs, the cell concentrations
decreased towards the end of the batch. Possible reasons for
this decrease are the depletion of the carbon source and the
accumulation of inhibitory by-products. Beyond that, reduc-
tion of cell dimensions, or changes in the cell composition
may also cause the decrease in OD value, which is reflected as
a decrease in the cell concentration.
Since the inoculum was grown in malate containing
media, long lag times for hydrogen production were observed
when the carbon source was changed. It might be possible to
reduce these by growing the inoculum in the same carbon
source as photobioreactor media.
Highest biomass accumulation was observed in acetate
containing media. However, high growth is not desired in the
hydrogen production process; available substrates are used
for growth instead of hydrogen production and high biomass
decreases light intensity in deeper parts of the photo-
bioreactors due to self shading. Another significance of the
acetate medium was the tendancy of pH increase during the
run (not shown); in order to keep pH neutral, higher amount of
buffer was added into the media compared to other
substrates.
A particularly useful parameter for characterizing micro-
bial hydrogen production is the substrate conversion effi-
ciency, which is a measure of how much of the substrate has
been utilized for hydrogen production rather than growth or
alternative biosynthesis. It was determined as the ratio of
moles of hydrogen that have actually been produced per
moles of hydrogen expected through stoichiometric conver-
sion of the substrate according to the following hypothetical
reaction [22]:
CxHyOz þ ð2x� zÞH2O / ðy=2 þ 2x � 2ÞH2 þ xCO2 (1)
or more precisely, for the substrates that were used in this
study:
Malate : C4H6O5 þ 3H2O / 6H2 þ 4CO2 (2)
Lactate : C3H6O3 þ 3H2O / 6H2 þ 3CO2 (3)
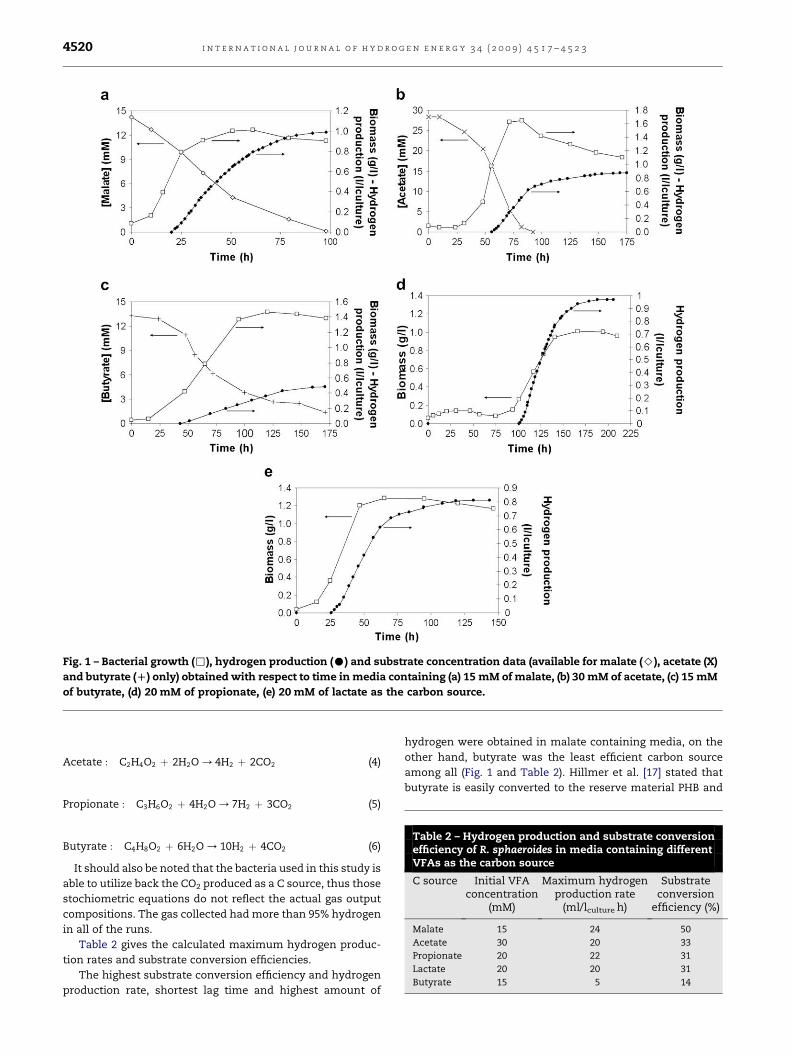
Fig. 1 – Bacterial growth (,), hydrogen production (C) and substrate concentration data (available for malate (>), acetate (X)
and butyrate (D) only) obtained with respect to time in media containing (a) 15 mM of malate, (b) 30 mM of acetate, (c) 15 mM
of butyrate, (d) 20 mM of propionate, (e) 20 mM of lactate as the carbon source.
Table 2 – Hydrogen production and substrate conversionefficiency of R. sphaeroides in media containing differentVFAs as the carbon source
C source Initial VFAconcentration
(mM)
Maximum hydrogenproduction rate
(ml/lculture h)
Substrateconversion
efficiency (%)
Malate 15 24 50
Acetate 30 20 33
Propionate 20 22 31
Lactate 20 20 31
Butyrate 15 5 14
i n t e r n a t i o n a l j o u r n a l o f h y d r o g e n e n e r g y 3 4 ( 2 0 0 9 ) 4 5 1 7 – 4 5 2 34520
Acetate : C2H4O2 þ 2H2O / 4H2 þ 2CO2 (4)
Propionate : C3H6O2 þ 4H2O / 7H2 þ 3CO2 (5)
Butyrate : C4H8O2 þ 6H2O / 10H2 þ 4CO2 (6)
It should also be noted that the bacteria used in this study is
able to utilize back the CO2 produced as a C source, thus those
stochiometric equations do not reflect the actual gas output
compositions. The gas collected had more than 95% hydrogen
in all of the runs.
Table 2 gives the calculated maximum hydrogen produc-
tion rates and substrate conversion efficiencies.
The highest substrate conversion efficiency and hydrogen
production rate, shortest lag time and highest amount of
hydrogen were obtained in malate containing media, on the
other hand, butyrate was the least efficient carbon source
among all (Fig. 1 and Table 2). Hillmer et al. [17] stated that
butyrate is easily converted to the reserve material PHB and
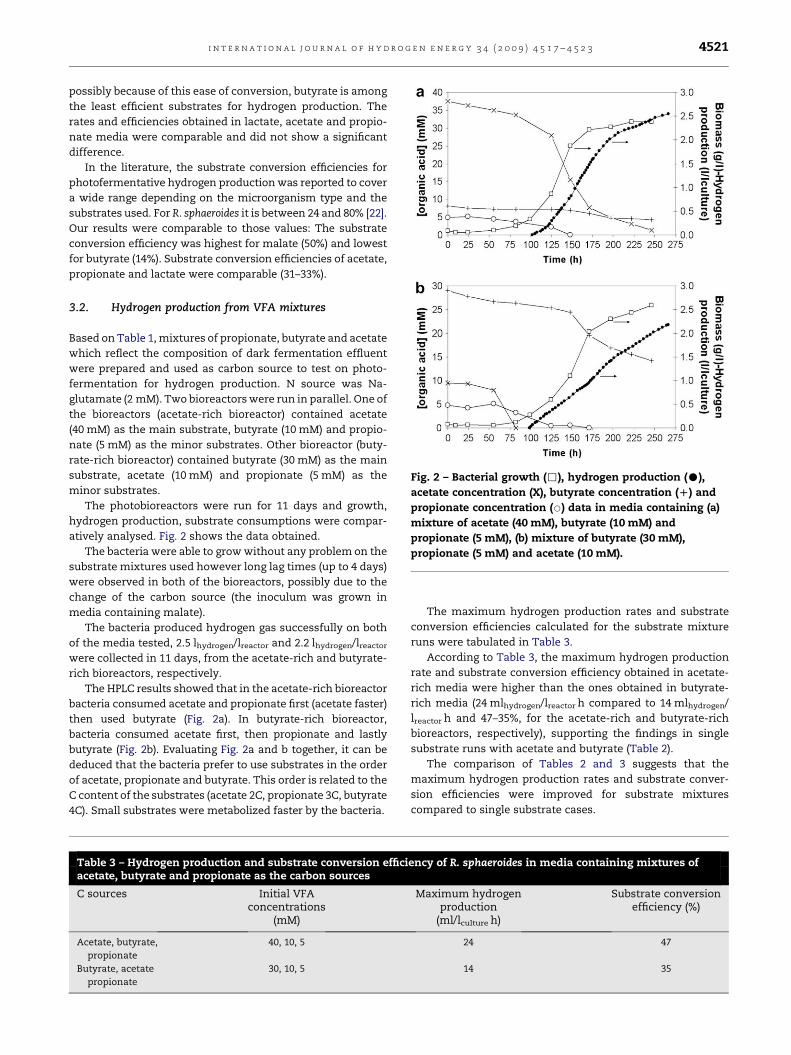
Fig. 2 – Bacterial growth (,), hydrogen production (C),
acetate concentration (X), butyrate concentration (D) and
propionate concentration (B) data in media containing (a)
mixture of acetate (40 mM), butyrate (10 mM) and
propionate (5 mM), (b) mixture of butyrate (30 mM),
propionate (5 mM) and acetate (10 mM).
i n t e r n a t i o n a l j o u r n a l o f h y d r o g e n e n e r g y 3 4 ( 2 0 0 9 ) 4 5 1 7 – 4 5 2 3 4521
possibly because of this ease of conversion, butyrate is among
the least efficient substrates for hydrogen production. The
rates and efficiencies obtained in lactate, acetate and propio-
nate media were comparable and did not show a significant
difference.
In the literature, the substrate conversion efficiencies for
photofermentative hydrogen production was reported to cover
a wide range depending on the microorganism type and the
substrates used. For R. sphaeroides it is between 24 and 80% [22].
Our results were comparable to those values: The substrate
conversion efficiency was highest for malate (50%) and lowest
for butyrate (14%). Substrate conversion efficiencies of acetate,
propionate and lactate were comparable (31–33%).
3.2. Hydrogen production from VFA mixtures
Based on Table 1, mixtures of propionate, butyrate and acetate
which reflect the composition of dark fermentation effluent
were prepared and used as carbon source to test on photo-
fermentation for hydrogen production. N source was Na-
glutamate (2 mM). Two bioreactors were run in parallel. One of
the bioreactors (acetate-rich bioreactor) contained acetate
(40 mM) as the main substrate, butyrate (10 mM) and propio-
nate (5 mM) as the minor substrates. Other bioreactor (buty-
rate-rich bioreactor) contained butyrate (30 mM) as the main
substrate, acetate (10 mM) and propionate (5 mM) as the
minor substrates.
The photobioreactors were run for 11 days and growth,
hydrogen production, substrate consumptions were compar-
atively analysed. Fig. 2 shows the data obtained.
The bacteria were able to grow without any problem on the
substrate mixtures used however long lag times (up to 4 days)
were observed in both of the bioreactors, possibly due to the
change of the carbon source (the inoculum was grown in
media containing malate).
The bacteria produced hydrogen gas successfully on both
of the media tested, 2.5 lhydrogen/lreactor and 2.2 lhydrogen/lreactor
were collected in 11 days, from the acetate-rich and butyrate-
rich bioreactors, respectively.
The HPLC results showed that in the acetate-rich bioreactor
bacteria consumed acetate and propionate first (acetate faster)
then used butyrate (Fig. 2a). In butyrate-rich bioreactor,
bacteria consumed acetate first, then propionate and lastly
butyrate (Fig. 2b). Evaluating Fig. 2a and b together, it can be
deduced that the bacteria prefer to use substrates in the order
of acetate, propionate and butyrate. This order is related to the
C content of the substrates (acetate 2C, propionate 3C, butyrate
4C). Small substrates were metabolized faster by the bacteria.
Table 3 – Hydrogen production and substrate conversion efficiacetate, butyrate and propionate as the carbon sources
C sources Initial VFAconcentrations
(mM)
Acetate, butyrate,
propionate
40, 10, 5
Butyrate, acetate
propionate
30, 10, 5
The maximum hydrogen production rates and substrate
conversion efficiencies calculated for the substrate mixture
runs were tabulated in Table 3.
According to Table 3, the maximum hydrogen production
rate and substrate conversion efficiency obtained in acetate-
rich media were higher than the ones obtained in butyrate-
rich media (24 mlhydrogen/lreactor h compared to 14 mlhydrogen/
lreactor h and 47–35%, for the acetate-rich and butyrate-rich
bioreactors, respectively), supporting the findings in single
substrate runs with acetate and butyrate (Table 2).
The comparison of Tables 2 and 3 suggests that the
maximum hydrogen production rates and substrate conver-
sion efficiencies were improved for substrate mixtures
compared to single substrate cases.
ency of R. sphaeroides in media containing mixtures of
Maximum hydrogenproduction
(ml/lculture h)
Substrate conversionefficiency (%)
24 47
14 35
i n t e r n a t i o n a l j o u r n a l o f h y d r o g e n e n e r g y 3 4 ( 2 0 0 9 ) 4 5 1 7 – 4 5 2 34522
In a recent study, Shi et al. [27] used a mixture of acetate
(30 mM), propionate (3 mM) and butyrate (11 mM) as the
substrate for hydrogen production by Rhodopseudomonas cap-
sulata in a 1.5 l continuous photobioreactor operated at
a hydraulic retention time of 72 h. They reported a maximum
hydrogen production rate of 17 mlhydrogen/lreactor.h, and
a substrate conversion efficiency of 45% which are compa-
rable to our results.
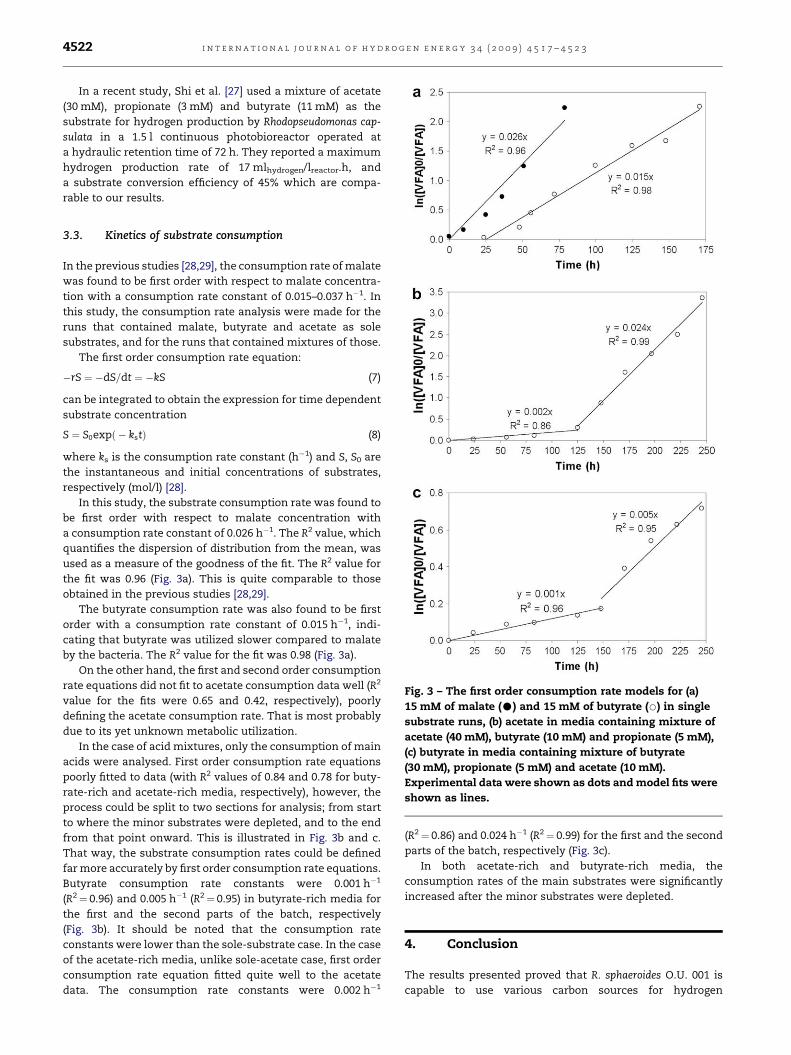
Fig. 3 – The first order consumption rate models for (a)
15 mM of malate (C) and 15 mM of butyrate (B) in single
substrate runs, (b) acetate in media containing mixture of
acetate (40 mM), butyrate (10 mM) and propionate (5 mM),
(c) butyrate in media containing mixture of butyrate
(30 mM), propionate (5 mM) and acetate (10 mM).
Experimental data were shown as dots and model fits were
shown as lines.
3.3. Kinetics of substrate consumption
In the previous studies [28,29], the consumption rate of malate
was found to be first order with respect to malate concentra-
tion with a consumption rate constant of 0.015–0.037 h�1. In
this study, the consumption rate analysis were made for the
runs that contained malate, butyrate and acetate as sole
substrates, and for the runs that contained mixtures of those.
The first order consumption rate equation:
�rS ¼ �dS=dt ¼ �kS (7)
can be integrated to obtain the expression for time dependent
substrate concentration
S ¼ S0expð � kstÞ (8)
where ks is the consumption rate constant (h�1) and S, S0 are
the instantaneous and initial concentrations of substrates,
respectively (mol/l) [28].
In this study, the substrate consumption rate was found to
be first order with respect to malate concentration with
a consumption rate constant of 0.026 h�1. The R2 value, which
quantifies the dispersion of distribution from the mean, was
used as a measure of the goodness of the fit. The R2 value for
the fit was 0.96 (Fig. 3a). This is quite comparable to those
obtained in the previous studies [28,29].
The butyrate consumption rate was also found to be first
order with a consumption rate constant of 0.015 h�1, indi-
cating that butyrate was utilized slower compared to malate
by the bacteria. The R2 value for the fit was 0.98 (Fig. 3a).
On the other hand, the first and second order consumption
rate equations did not fit to acetate consumption data well (R2
value for the fits were 0.65 and 0.42, respectively), poorly
defining the acetate consumption rate. That is most probably
due to its yet unknown metabolic utilization.
In the case of acid mixtures, only the consumption of main
acids were analysed. First order consumption rate equations
poorly fitted to data (with R2 values of 0.84 and 0.78 for buty-
rate-rich and acetate-rich media, respectively), however, the
process could be split to two sections for analysis; from start
to where the minor substrates were depleted, and to the end
from that point onward. This is illustrated in Fig. 3b and c.
That way, the substrate consumption rates could be defined
far more accurately by first order consumption rate equations.
Butyrate consumption rate constants were 0.001 h�1
(R2¼ 0.96) and 0.005 h�1 (R2¼ 0.95) in butyrate-rich media for
the first and the second parts of the batch, respectively
(Fig. 3b). It should be noted that the consumption rate
constants were lower than the sole-substrate case. In the case
of the acetate-rich media, unlike sole-acetate case, first order
consumption rate equation fitted quite well to the acetate
data. The consumption rate constants were 0.002 h�1
(R2¼ 0.86) and 0.024 h�1 (R2¼ 0.99) for the first and the second
parts of the batch, respectively (Fig. 3c).
In both acetate-rich and butyrate-rich media, the
consumption rates of the main substrates were significantly
increased after the minor substrates were depleted.
4. Conclusion
The results presented proved that R. sphaeroides O.U. 001 is
capable to use various carbon sources for hydrogen
i n t e r n a t i o n a l j o u r n a l o f h y d r o g e n e n e r g y 3 4 ( 2 0 0 9 ) 4 5 1 7 – 4 5 2 3 4523
production which makes this bacterium a good candidate to
be employed for wastewater treatment and for dark- photo-
fermentation coupling. Alternative carbon sources to malate,
such as propionate and lactate, which are cheaper and more
available at large scales were suggested. Butyrate was not that
efficient for hydrogen production due to the competitive
production of PHB.
The substrate conversion efficiencies were found to be
between 14 and 50% for different VFAs tested.
The malate and butyrate consumption rates were found to
be first order with consumption rate constants of 0.026 and
0.015 h�1, whereas the first and second order consumption
rate equations did not fit to acetate consumption data. In the
case of substrate mixtures, it is found that the consumption
rate of the main substrate significantly increased when the
minor substrates were depleted.
Acknowledgements
This study was supported by DPT-YUUP, METU (BAP-08-11-
DPT.2002K120510 OYP-FBE-BTEK1) and EU 6th framework
project ‘‘HYVOLUTION’’.
r e f e r e n c e s
[1] Das D, Veziroglu TN. Hydrogen production by biologicalprocesses: a survey of literature. Int J Hydrogen Energy 2001;26:13–28.
[2] Barbosa MJ, Rocha JMS, Tramper J, Wijffels RH. Acetate asa carbon source for hydrogen production by photosyntheticbacteria. J Biotechnol 2001;85:25–33.
[3] Nath K, Muthukumar M, Kumar A, Das D. Kinetics of two-stage fermentation process for the production of hydrogen.Int J Hydrogen Energy 2008;33:1195–203.
[4] Horiuchi JI, Shimizu T, Tada K, Kanno T, Kobayashi M.Selective production of organic acids in anaerobic acidreactor by pH control. Bioresour Technol 2002;82:209–13.
[5] Hussy I, Hawkes FR, Dinsdale R, Hawkes DL. Continuousfermentative hydrogen production from sucrose andsugarbeet. Int J Hydrogen Energy 2005;30:471–83.
[6] Lay JJ, Lee YJ, Noike T. Feasibility of biological hydrogenproduction from organic fraction of municipal solid waste.Water Res. 1999;33(11):2579–86.
[7] Lin CY, Lay CH. A nutrient formulation for fermentativehydrogen production using anaerobic sewage sludgemicroflora. Int J Hydrogen Energy 2005;30:285–92.
[8] Shin HS, Youn JH, Kim SH. Hydrogen production from foodwaste in anaerobic mesophilic and thermophilicacidogenesis. Int J Hydrogen Energy 2004;29:1355–63.
[9] Fang HHP, Li C, Zhang T. Acidophilic biohydrogen productionfrom rice slurry. Int J Hydrogen Energy 2006;31:683–92.
[10] Fascetti E, D’addario E, Todini O, Robertiello A. Photosynthetichydrogen evolution with volatile organic acids derived fromthe fermentation of source selected municipal solid wastes.Int J Hydrogen Energy 1998;23(9):753–60.
[11] Ren N, Li J, Li B, Wang Y, Liu S. Biohydrogen production frommolasses by anaerobic fermentation with a pilot-scalebioreactor system. Int J Hydrogen Energy 2006;31:2147–57.
[12] Li D, Chen H. Biological hydrogen production from steam-exploded straw by simultaneous saccharification andfermentation. Int J Hydrogen Energy 2007;32:1742–8.
[13] Zhang ML, Fan YT, Xing Y, Pan CM, Zhang GS, Lay JJ.Enhanced biohydrogen production from cornstalk wasteswith acidification pretreatment by mixed anaerobic cultures.Biomass and Bioenergy 2007;31:250–4.
[14] Tao Y, Chen Y, Wu Y, He Y, Zhou Z. High hydrogen yield froma two-step process of dark- and photo-fermentation ofsucrose. Int J Hydrogen Energy 2007;32:200–6.
[15] Khanal SK, Chen WH, Li L, Sung S. Biological hydrogenproduction: effects of pH and intermediate products. Int JHydrogen Energy 2004;29:1123–31.
[16] Gavala HN, Skiadas V, Ahring BK. Biological hydrogenproduction in suspended and attached growthanaerobic reactor systems. Int J Hydrogen Energy 2006;31:1164–75.
[17] Hillmer P, Gest H. H2 metabolism in the photosyntheticbacterium Rhodopseudomonas capsulata: H2 production bygrowing cultures. J. Bacteriol 1977;129(2):724–31.
[18] Kim JS, Ito K, Takahashi H. The relationship betweennitrogenase activity and hydrogen evolution inRhodopseudomonas palustris. Agric Biol Chem 1980;44(4):827–33.
[19] Miyake J, Mao XY, Kawamura S. Photoproduction ofhydrogen from glucose by a co-culture of a photosyntheticbacterium and Clostridium butyricum. J Ferment Technol 1984;62(6):531–5.
[20] Sasaki K. Hydrogen and 5-aminolevulinic acid production byphotosynthetic bacteria. In: Zaborsky OR, editor.Biohydrogen. London: Plenum Press; 1998. p. 133–42.
[21] Segers L, Verstraete W. Conversion of organic acids to H2 byRhodospirillaceae grown with glutamate or dinitrogen asnitrogen source. Biotechnol Bioeng 1983;25:2843–53.
[22] Koku H, Eroglu I, Gunduz U, Yucel M, Turker L. Aspects of themetabolism of hydrogen production by Rhodobactersphaeroides. Int J Hydrogen Energy 2002;27(Issues 11–12):1315–29.
[23] Yigit DO, Gunduz U, Turker L, Yucel M, Eroglu I. Identificationof by-products in hydrogen producing bacteria; Rhodobactersphaeroides O.U. 001 grown in the waste water of a sugarrefinery. J Biotechnol 1999;70:125–31.
[24] Eroglu E, Eroglu I, Gunduz U, Turker L, Yucel M.Biological hydrogen production from olive millwastewater with two-stage processes. Int J HydrogenEnergy 2006;31:1527–35.
[25] Biebl H, Pfennig N. In: Starr MP, Stolp H, Truper HG, Balows A,Schlegel HG, editors. The prokaryotes. Isolation of membersof the family Rhodosprillaceae, vol. 1. New York: Springer-Verlag; 1981. p. 267–73.
[26] Uyar B, Eroglu I, Yucel M, Gunduz U, Turker L. Effect of lightintensity, wavelength and illumination protocol on hydrogenproduction in photobioreactors. Int J Hydrogen Energy 2007;32:4670–7.
[27] Shi XY, Yu HQ. Continuous production of hydrogen frommixed volatile fatty acids with Rhodopseudomonas capsulata.Int J Hydrogen Energy 2006;31:1641–7.
[28] Eroglu I, Aslan K, Gunduz U, Yucel M, Turker L. Substrateconsumption rates for hydrogen production by Rhodobactersphaeroides in a column photobioreactor. J Biotechnol 1999;70(Issues 1–3):103–13.
[29] Koku H, Eroglu I, Gunduz U, Yucel M, Turker L. Kinetics ofbiological hydrogen production by the photosyntheticbacterium Rhodobacter sphaeroides O.U. 001. Int J HydrogenEnergy 2003;28(Issue 4):381–8.