Embed Size (px)
Citation preview
PHOTOGRAMMETRIC APPROACHES FOR THE ARCHAEOLOGICAL MAPPING OF THE MAZOTOS SHIPWRECK
D. Skarlatosa, *, M. Rova
a Cyprus University of Technology, Department of Civil Engineering and Geomatics, P.O. BOX 50329, Limassol 3603, Cyprus – (dimitrios.skarlatos, margarita.rova)@cut.ac.cy
ABSTRACT: This project presents an approach based on a combination of photogrammetry, machine vision and surveying approaches applied for the purpose of monitoring and measuring an underwater archaeological excavation. The paper covers a description of both methodologies as well as products according to the archaeological requirements. The diversity of tasks imposes the need of using different processing techniques as well as dedicated software at each stage of the outlined methodologies. Open source software has been used as much as possible to accommodate issues that emerge in such demanding underwater conditions. Main stages of the methodology followed here include calibration of the underwater camera system, photomosaic production for underwater communication and site inspection and bundle block triangulation for site modelling using dense photography and video. Although, the outcomes presented here comprise initial products, these suggest that a combination of photogrammetry and machine vision methodologies can offer a basis for further exploitations of key issues that arise in such particularly demanding underwater environments. KEY WORDS: Underwater photogrammetry, 3D measurement, recording, shipwreck
* Corresponding author.
1. Introduction
Underwater archaeological mapping has always been a fascinating task particularly considering the monitoring and mapping of such challenging and dynamically changing environments. When inserting the aspects of accuracy, speed and versatility, it is well understood that there exists the necessity to merge solutions from different approaches obtained from photogrammetry and machine vision domains for the purpose of delivering a series of outcomes that may vary from 3D maps to monitoring sequences for example. Archaeological excavation mapping poses significant interest to the photogrammetrist as a result. 1.1 The Mazotos shipwreck case study. The Mazotos shipwreck has been investigated since 2007 by a team of the University of Cyprus, under the supervision of the archaeologist, Dr Stella Demesticha in collaboration with the Department of Antiquities of Cyprus and the THETIS foundation. The first systematic excavation period took place in May-June 2010, during which detailed mapping and documentation of the findings’ position were necessary on a daily basis. This task was undertaken by the Department of Civil Engineering and Geomatics of Cyprus University of Technology. Mazotos wreck in southern Cyprus, is located approximately 2 miles from the coast and 45 meters in depth. The ship was sunk under unknown circumstances carrying wine from Chios (Greece) to Cyprus. The dimensions of the exposed shipwreck are approximately 17 meters long and 8 meters wide. The cargo of the ship was mainly large amphorae which at the moment are the only visible parts of the shipwreck. Fortunately, the ship was laid in a sandy flat bed, almost intact. In addition, it seems to be almost horizontal or have only a slight inclination as the cargo is almost in position.
Considering the requirements of an excavation, the archaeologist is usually interested in a number of different outcomes such as (a) a 3D map of the underwater surface as it was found and prior to excavation, (b) daily records of the trench, (c) daily maps of the 3D locations of the artefacts for 3D reconstruction of the wreck at the stage of full shipwreck excavation and (d) 3D measurement and modelling of finds such as the amphorae. Furthermore, archaeological analysis becomes particularly demanding with regards to speed of data acquisition and automation of the processing chain from system calibration, measurement and 3D modelling. What is moreover significant is that non-dedicated software product is desirable to facilitate ‘easy’ analysis as well as interpretation and communication from the non-photogrammetrist. As a result, data acquisition, processing and deliverable production become very demanding especially considering the difficult conditions that prevail underwater. The cost however that it is expected to be encountered is the accuracy of the results. The topic of underwater monitoring and modelling has attracted different implementations from the fields of photogrammetry and machine vision (Arpenteur 2010; Drap et al., 2003; Drap et al., 2007; Ludvigsen et al.; 2006; Pizarro et al., 2009). Our main objective is to utilize open-source tools for monitoring, modelling and analysis considering additionally the aspect of accuracy. At the stage of writing this article we are presenting some initial results using the Photomodeler scanner software for system calibration (Photomodeler, 2010), machine vision open-source tools for mosaicing and Intergraph’s SSK photogrammetric software for bundle block triangulation. 1.2 Present limitations
By definition photogrammetry is connected with the term ‘Art’, in the context that “Photogrammetry is the art, science and technology of obtaining reliable information about physical objects and the environment through the process of recording, measuring, and interpreting photographic images and patterns of electromagnetic radiant energy and other phenomena” (McGlone, 2004). The word “Art” is being used to highlight the need for sharp, net photography. Whilst this term does not always appear in recent definitions, it shows its connection with the concept of high quality photographs. In our case, the monitoring depth of Mazotos shipwreck, deteriorates visibility significantly. Depending on prevailing conditions, it is not unusual for objects at 10 meters to be merged into the blue background. The red part of the visible spectrum is absorbed almost completely at any distance. Considering other constraints, divers can work for a net time of 18 minutes in that depth, before they start the decompression sequence and resurface. In addition, they may suffer from depth narcosis which results for example in erroneous implementations of even very simple tasks such as tape measurement readings. Although in working depths of 20 meters, simple tape measurement techniques are standard surveying approaches, our case is more demanding with regards to depth, time and operational control. Considering the above, it is expected that besides digital measurement for object recording, photogrammetry’s ability to model dense surfaces based on image matching techniques for example can be regarded as irretraceable. Of course modelling from images alone is attached with the significant issues of camera calibration, object space control as well as occlusion to report a few key factors. For example the monitoring system needs to be calibrated within the water medium considering that refraction (the refractive index of sea water is a function of the depth, temperature and salinity) results in significant variations in the nominal focal length. In addition it is difficult to establish control, whereas occlusion of hidden object details comprises key problem. The underwater environment, as a result, poses challenges that restricts photogrammetry’s ability to achieve high precision levels and therefore to be exploited ‘in full’.
1.3 Underwater photogrammetry Underwater photogrammetry presents some key differences with regards to conventional processing. These can be listed here as follows:
Limited on-site accessibility. No operational control on data acquisition (usually implemented by a non-surveyor diver). Two-interface (water and air) data collection. Absorption of red wavelength even at a very close imaging range unless strong artificial
illumination is utilized (valid only for ~1.5 meters). Significant diffusion that poses object recognition difficult (working ranges of ~10 metres)
and tie point measurement nearly impossible. Control point establishment limitations (adequate accuracy with standard tape measurement
and 3D trileteration methods is prohibited).
It is however noted that diffusion can be avoided in close range imaging situations if a wide-angled camera system is utilized. Luckily this ensures good geometry (wide base to distance ratio) but it results in high inner geometric distortions when considering camera calibration as a trade-off. Our current experience proves that we can not avoid a ‘correlation’ between light diffusion, which forces us to close range photograph of the shipwreck, and the effect of parallax, that occurs in close range wide-baseline imaging situations. 1.4 Previous work and existing data The reader can find a detailed report of some preliminary investigations of the Mazotos shipwreck study in Demesticha (2010). Here we outline a short review. At the outset of the discovery of the wreck, the main objectives were the documentation of its state as well as the shape recording and 3D positional mapping of its amphorae. As mentioned in Demesticha (2010), drawing of the different types of the amphorae was done using underwater measurements with conventional instruments such as plastic tape, callipers, quadrant compasses and metal rulers. The final 3D object was a revolved design using the aforementioned measurements. In our approach, we implement most of our 3D mapping methodologies utilizing EOS Systems Photomodeler scanner software (Canciani et al., 2002; Green et al., 2002; Drap et al., 2007) and the available Canon A620 CCD camera. In order to identify an amphora a 10cm diameter plastic disc with a cross-wire black and yellow coloured surface has been wrapped in its rims. This forms a small 3D plane and therefore provides a locator to position a typical amphora in 3D space. To give a sample of the data processing chain in Photomodeler scanner software, one dataset was processed with a selected number of 119 images (of a 350 total number) collected in three dives during two different field-seasons using the auto focus camera settings. The photos were collected with an orientation ranging between 45-90 degrees with respect to the sea bottom (nadir-looking) covering an approximate area of 17.5x8 meters. To recover scale, a 2 meter bar and several sub bottom buoys for vertical direction were utilized; these were introduced as survey constraints to the otherwise free network. This dataset was processed with a self-calibrated bundle adjustment for the purpose of locating the 140 amphorae. To report an example of the achieved precisions, maximum standard deviations of σX= 0.034m, σY= 0.064m, σZ= 0.052m have been observed amongst the 771 measured points. A typical example of a large image residual is the case of a point with an RMS of 48.3 pixels and a 3D precision of σX= 0.002m, σY=0.003m, σZ= 0.003m. Processing of
this dataset although relatively straightforward to implement has several disadvantages that can be listed here as follows:
The method cannot be applied in amphorae with a broken rim. The 3D orientation of the 1 meter height amphorae is solely dependent on a 10 centimeter
diameter target and therefore any uncertainty in this small modeled plane will be propagated to the final orientation recovery of the amphorae.
The targets are not tied up rigidly and they are not completely planar in relation to the amphorae rim resulting in a point measurement uncertainty propagated in the photogrammetric triangulation as well as the 3D positions of the amphorae models.
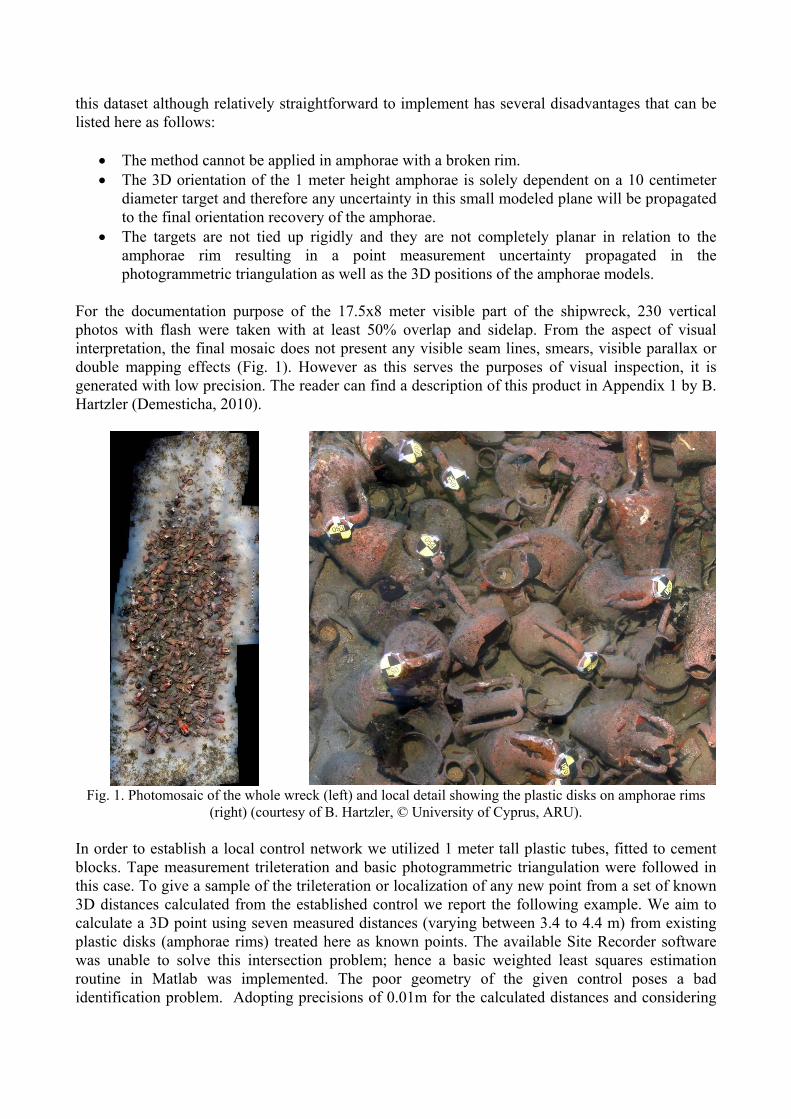
For the documentation purpose of the 17.5x8 meter visible part of the shipwreck, 230 vertical photos with flash were taken with at least 50% overlap and sidelap. From the aspect of visual interpretation, the final mosaic does not present any visible seam lines, smears, visible parallax or double mapping effects (Fig. 1). However as this serves the purposes of visual inspection, it is generated with low precision. The reader can find a description of this product in Appendix 1 by B. Hartzler (Demesticha, 2010).
Fig. 1. Photomosaic of the whole wreck (left) and local detail showing the plastic disks on amphorae rims
(right) (courtesy of B. Hartzler, © University of Cyprus, ARU). In order to establish a local control network we utilized 1 meter tall plastic tubes, fitted to cement blocks. Tape measurement trileteration and basic photogrammetric triangulation were followed in this case. To give a sample of the trileteration or localization of any new point from a set of known 3D distances calculated from the established control we report the following example. We aim to calculate a 3D point using seven measured distances (varying between 3.4 to 4.4 m) from existing plastic disks (amphorae rims) treated here as known points. The available Site Recorder software was unable to solve this intersection problem; hence a basic weighted least squares estimation routine in Matlab was implemented. The poor geometry of the given control poses a bad identification problem. Adopting precisions of 0.01m for the calculated distances and considering
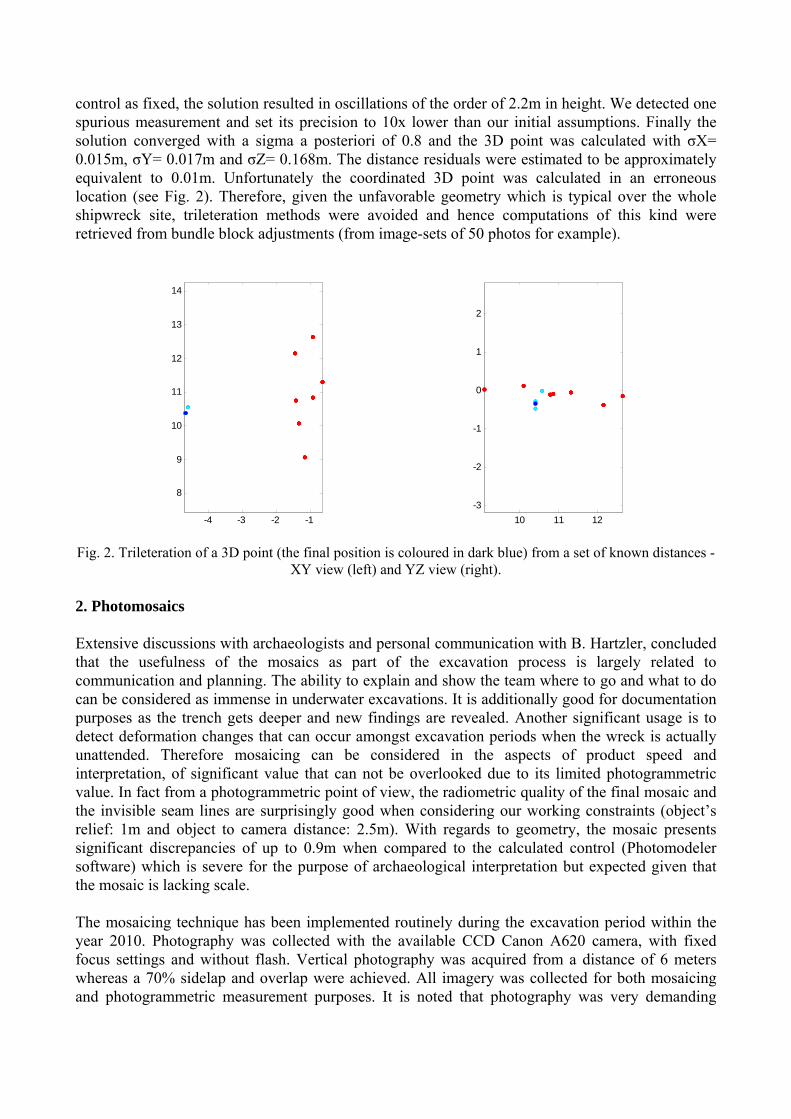
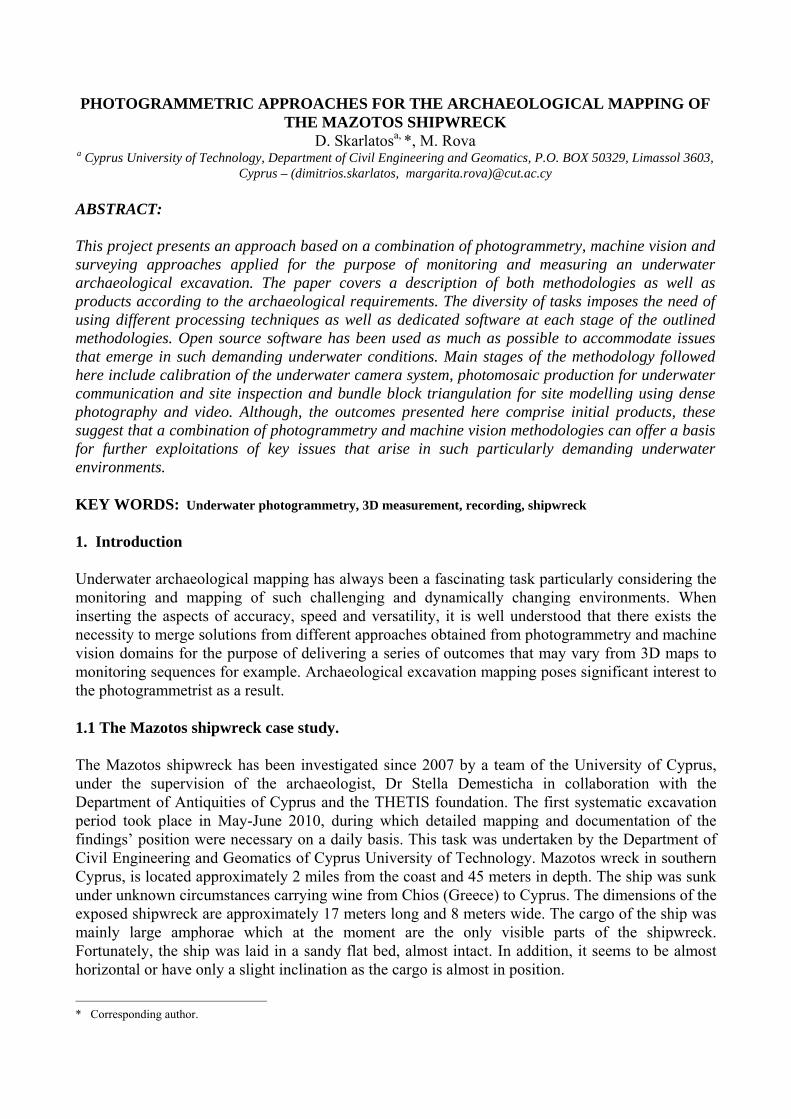
control as fixed, the solution resulted in oscillations of the order of 2.2m in height. We detected one spurious measurement and set its precision to 10x lower than our initial assumptions. Finally the solution converged with a sigma a posteriori of 0.8 and the 3D point was calculated with σX= 0.015m, σY= 0.017m and σZ= 0.168m. The distance residuals were estimated to be approximately equivalent to 0.01m. Unfortunately the coordinated 3D point was calculated in an erroneous location (see Fig. 2). Therefore, given the unfavorable geometry which is typical over the whole shipwreck site, trileteration methods were avoided and hence computations of this kind were retrieved from bundle block adjustments (from image-sets of 50 photos for example).
-4 -3 -2 -1
8
9
10
11
12
13
14
10 11 12
-3
-2
-1
0
1
2
Fig. 2. Trileteration of a 3D point (the final position is coloured in dark blue) from a set of known distances -
XY view (left) and YZ view (right). 2. Photomosaics Extensive discussions with archaeologists and personal communication with B. Hartzler, concluded that the usefulness of the mosaics as part of the excavation process is largely related to communication and planning. The ability to explain and show the team where to go and what to do can be considered as immense in underwater excavations. It is additionally good for documentation purposes as the trench gets deeper and new findings are revealed. Another significant usage is to detect deformation changes that can occur amongst excavation periods when the wreck is actually unattended. Therefore mosaicing can be considered in the aspects of product speed and interpretation, of significant value that can not be overlooked due to its limited photogrammetric value. In fact from a photogrammetric point of view, the radiometric quality of the final mosaic and the invisible seam lines are surprisingly good when considering our working constraints (object’s relief: 1m and object to camera distance: 2.5m). With regards to geometry, the mosaic presents significant discrepancies of up to 0.9m when compared to the calculated control (Photomodeler software) which is severe for the purpose of archaeological interpretation but expected given that the mosaic is lacking scale. The mosaicing technique has been implemented routinely during the excavation period within the year 2010. Photography was collected with the available CCD Canon A620 camera, with fixed focus settings and without flash. Vertical photography was acquired from a distance of 6 meters whereas a 70% sidelap and overlap were achieved. All imagery was collected for both mosaicing and photogrammetric measurement purposes. It is noted that photography was very demanding
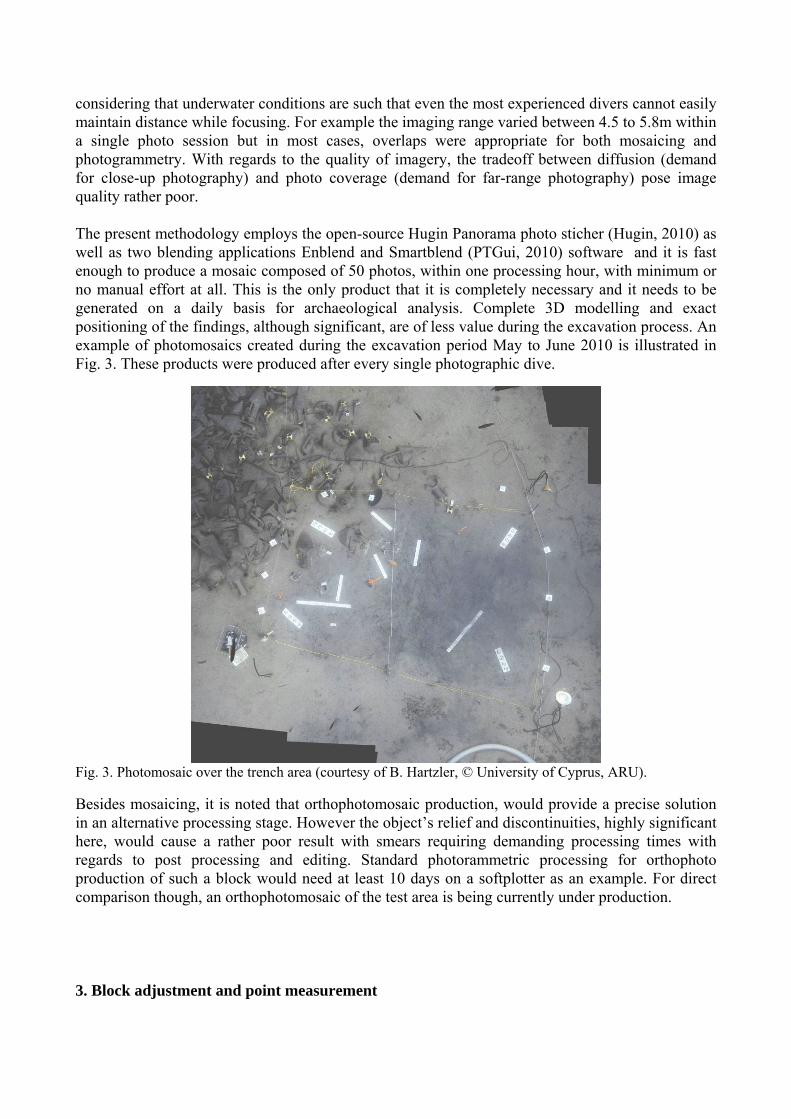
considering that underwater conditions are such that even the most experienced divers cannot easily maintain distance while focusing. For example the imaging range varied between 4.5 to 5.8m within a single photo session but in most cases, overlaps were appropriate for both mosaicing and photogrammetry. With regards to the quality of imagery, the tradeoff between diffusion (demand for close-up photography) and photo coverage (demand for far-range photography) pose image quality rather poor. The present methodology employs the open-source Hugin Panorama photo sticher (Hugin, 2010) as well as two blending applications Enblend and Smartblend (PTGui, 2010) software and it is fast enough to produce a mosaic composed of 50 photos, within one processing hour, with minimum or no manual effort at all. This is the only product that it is completely necessary and it needs to be generated on a daily basis for archaeological analysis. Complete 3D modelling and exact positioning of the findings, although significant, are of less value during the excavation process. An example of photomosaics created during the excavation period May to June 2010 is illustrated in Fig. 3. These products were produced after every single photographic dive.
Fig. 3. Photomosaic over the trench area (courtesy of B. Hartzler, © University of Cyprus, ARU).
Besides mosaicing, it is noted that orthophotomosaic production, would provide a precise solution in an alternative processing stage. However the object’s relief and discontinuities, highly significant here, would cause a rather poor result with smears requiring demanding processing times with regards to post processing and editing. Standard photorammetric processing for orthophoto production of such a block would need at least 10 days on a softplotter as an example. For direct comparison though, an orthophotomosaic of the test area is being currently under production.
3. Block adjustment and point measurement
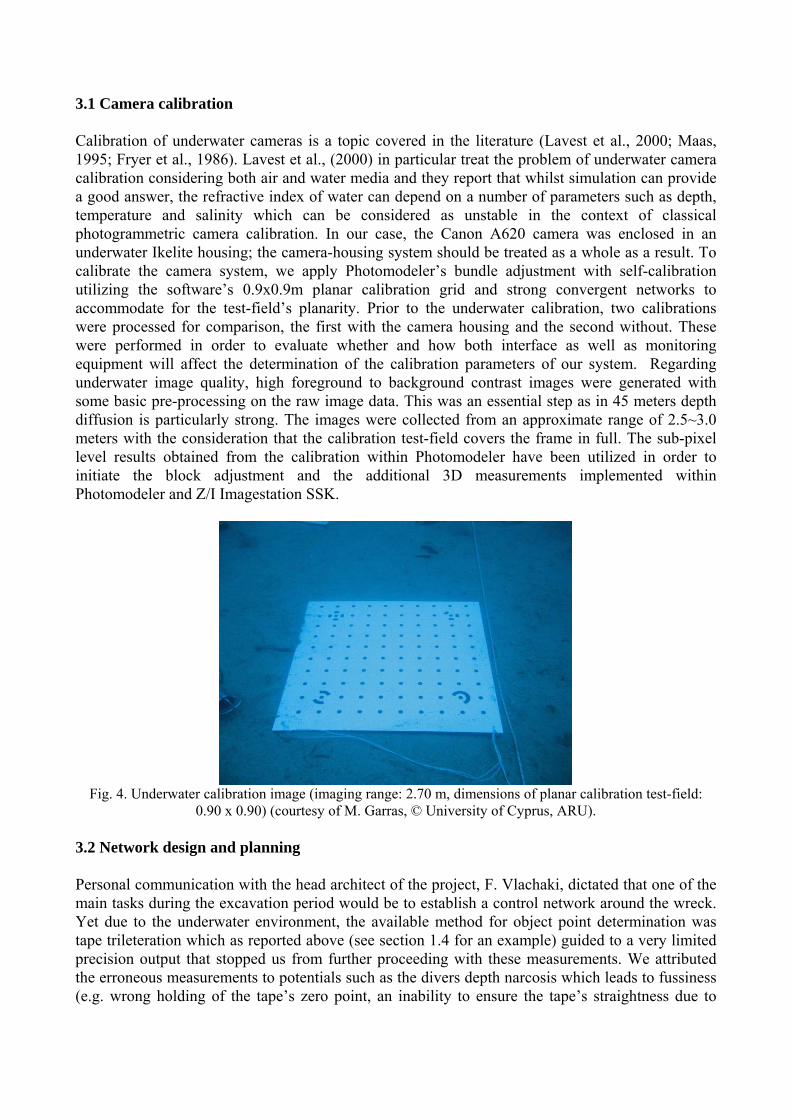
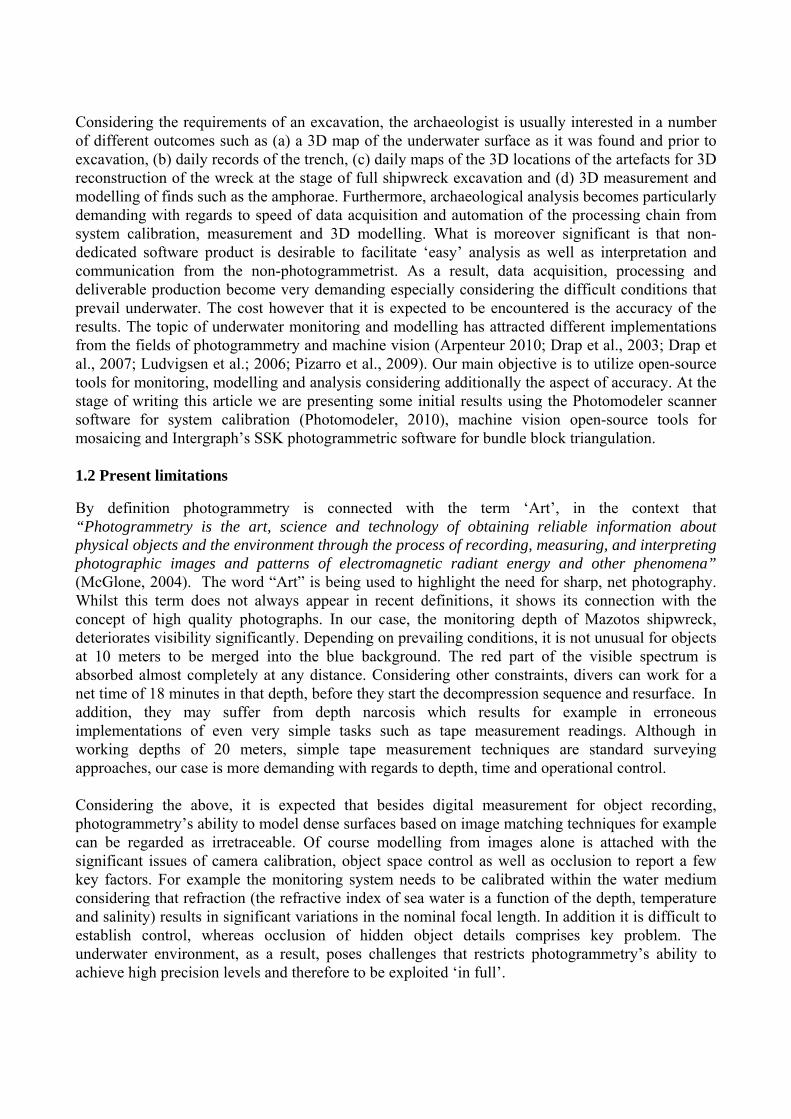
3.1 Camera calibration Calibration of underwater cameras is a topic covered in the literature (Lavest et al., 2000; Maas, 1995; Fryer et al., 1986). Lavest et al., (2000) in particular treat the problem of underwater camera calibration considering both air and water media and they report that whilst simulation can provide a good answer, the refractive index of water can depend on a number of parameters such as depth, temperature and salinity which can be considered as unstable in the context of classical photogrammetric camera calibration. In our case, the Canon A620 camera was enclosed in an underwater Ikelite housing; the camera-housing system should be treated as a whole as a result. To calibrate the camera system, we apply Photomodeler’s bundle adjustment with self-calibration utilizing the software’s 0.9x0.9m planar calibration grid and strong convergent networks to accommodate for the test-field’s planarity. Prior to the underwater calibration, two calibrations were processed for comparison, the first with the camera housing and the second without. These were performed in order to evaluate whether and how both interface as well as monitoring equipment will affect the determination of the calibration parameters of our system. Regarding underwater image quality, high foreground to background contrast images were generated with some basic pre-processing on the raw image data. This was an essential step as in 45 meters depth diffusion is particularly strong. The images were collected from an approximate range of 2.5~3.0 meters with the consideration that the calibration test-field covers the frame in full. The sub-pixel level results obtained from the calibration within Photomodeler have been utilized in order to initiate the block adjustment and the additional 3D measurements implemented within Photomodeler and Z/I Imagestation SSK.
Fig. 4. Underwater calibration image (imaging range: 2.70 m, dimensions of planar calibration test-field:
0.90 x 0.90) (courtesy of M. Garras, © University of Cyprus, ARU). 3.2 Network design and planning Personal communication with the head architect of the project, F. Vlachaki, dictated that one of the main tasks during the excavation period would be to establish a control network around the wreck. Yet due to the underwater environment, the available method for object point determination was tape trileteration which as reported above (see section 1.4 for an example) guided to a very limited precision output that stopped us from further proceeding with these measurements. We attributed the erroneous measurements to potentials such as the divers depth narcosis which leads to fussiness (e.g. wrong holding of the tape’s zero point, an inability to ensure the tape’s straightness due to
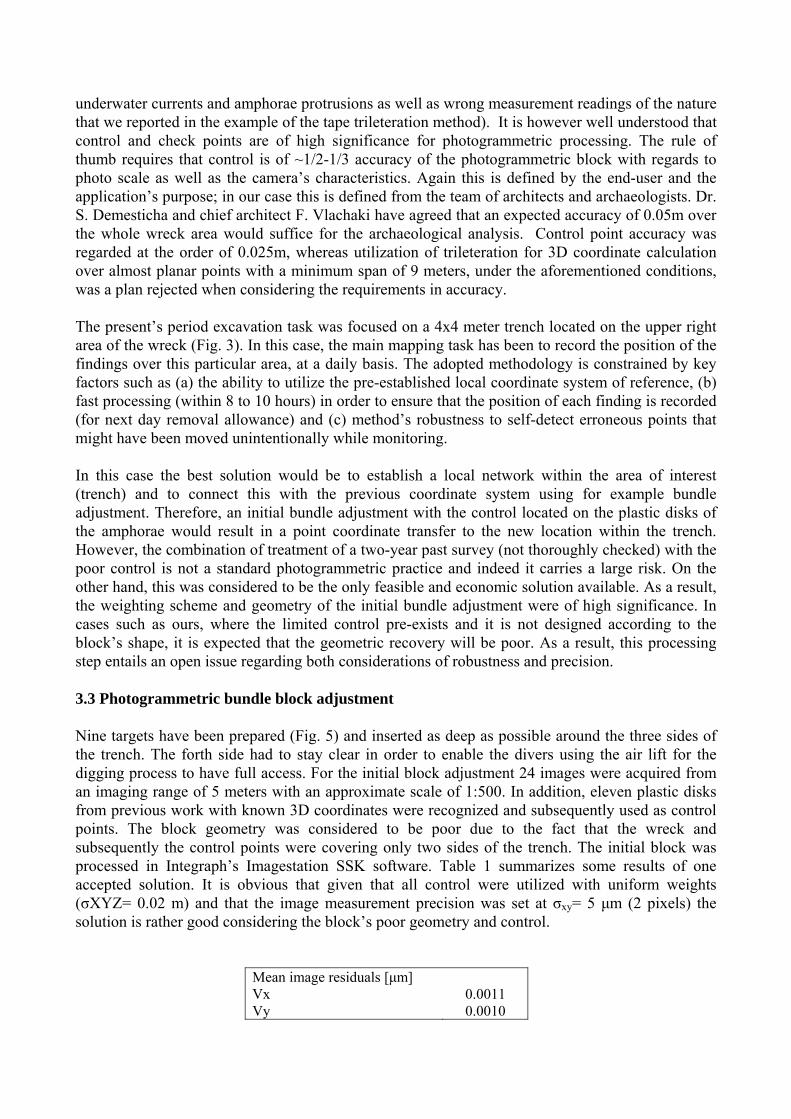
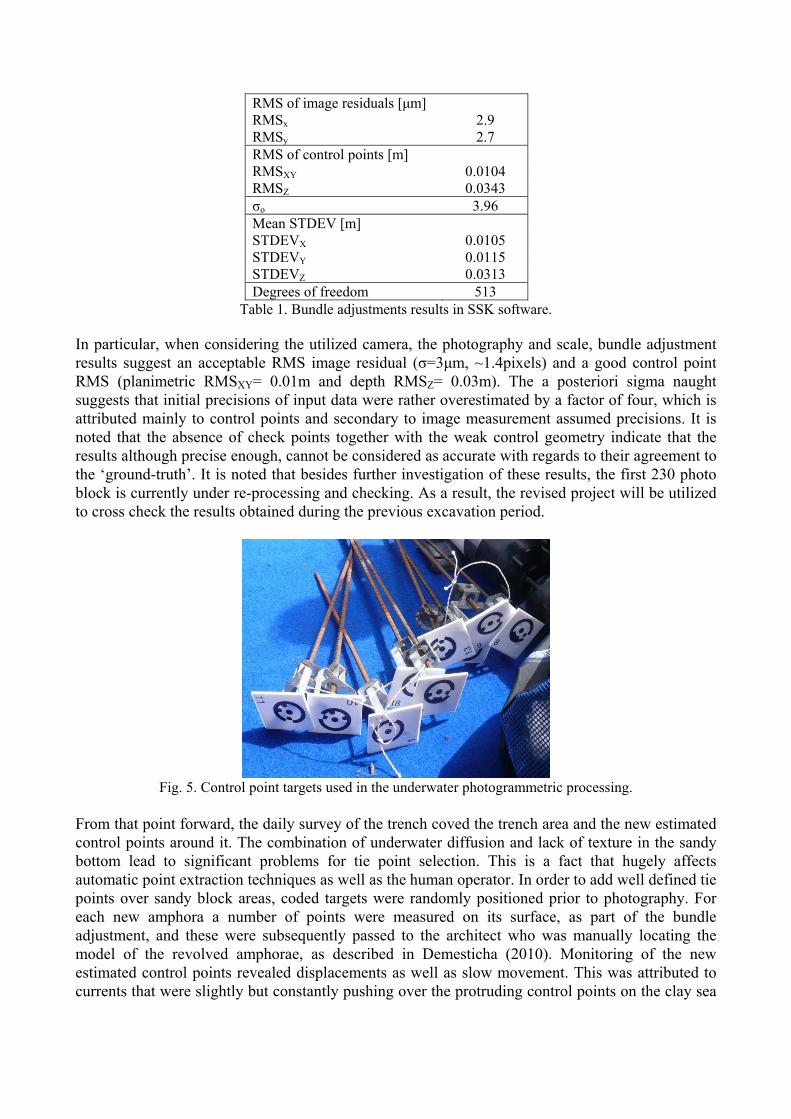
underwater currents and amphorae protrusions as well as wrong measurement readings of the nature that we reported in the example of the tape trileteration method). It is however well understood that control and check points are of high significance for photogrammetric processing. The rule of thumb requires that control is of ~1/2-1/3 accuracy of the photogrammetric block with regards to photo scale as well as the camera’s characteristics. Again this is defined by the end-user and the application’s purpose; in our case this is defined from the team of architects and archaeologists. Dr. S. Demesticha and chief architect F. Vlachaki have agreed that an expected accuracy of 0.05m over the whole wreck area would suffice for the archaeological analysis. Control point accuracy was regarded at the order of 0.025m, whereas utilization of trileteration for 3D coordinate calculation over almost planar points with a minimum span of 9 meters, under the aforementioned conditions, was a plan rejected when considering the requirements in accuracy. The present’s period excavation task was focused on a 4x4 meter trench located on the upper right area of the wreck (Fig. 3). In this case, the main mapping task has been to record the position of the findings over this particular area, at a daily basis. The adopted methodology is constrained by key factors such as (a) the ability to utilize the pre-established local coordinate system of reference, (b) fast processing (within 8 to 10 hours) in order to ensure that the position of each finding is recorded (for next day removal allowance) and (c) method’s robustness to self-detect erroneous points that might have been moved unintentionally while monitoring. In this case the best solution would be to establish a local network within the area of interest (trench) and to connect this with the previous coordinate system using for example bundle adjustment. Therefore, an initial bundle adjustment with the control located on the plastic disks of the amphorae would result in a point coordinate transfer to the new location within the trench. However, the combination of treatment of a two-year past survey (not thoroughly checked) with the poor control is not a standard photogrammetric practice and indeed it carries a large risk. On the other hand, this was considered to be the only feasible and economic solution available. As a result, the weighting scheme and geometry of the initial bundle adjustment were of high significance. In cases such as ours, where the limited control pre-exists and it is not designed according to the block’s shape, it is expected that the geometric recovery will be poor. As a result, this processing step entails an open issue regarding both considerations of robustness and precision. 3.3 Photogrammetric bundle block adjustment Nine targets have been prepared (Fig. 5) and inserted as deep as possible around the three sides of the trench. The forth side had to stay clear in order to enable the divers using the air lift for the digging process to have full access. For the initial block adjustment 24 images were acquired from an imaging range of 5 meters with an approximate scale of 1:500. In addition, eleven plastic disks from previous work with known 3D coordinates were recognized and subsequently used as control points. The block geometry was considered to be poor due to the fact that the wreck and subsequently the control points were covering only two sides of the trench. The initial block was processed in Integraph’s Imagestation SSK software. Table 1 summarizes some results of one accepted solution. It is obvious that given that all control were utilized with uniform weights (σXYZ= 0.02 m) and that the image measurement precision was set at σxy= 5 μm (2 pixels) the solution is rather good considering the block’s poor geometry and control.
Mean image residuals [μm] Vx 0.0011 Vy 0.0010
RMS of image residuals [μm] RMSx 2.9 RMSy 2.7 RMS of control points [m] RMSXY 0.0104 RMSZ 0.0343 σο 3.96 Mean STDEV [m] STDEVX 0.0105 STDEVY 0.0115 STDEVZ 0.0313 Degrees of freedom 513
Table 1. Bundle adjustments results in SSK software.
In particular, when considering the utilized camera, the photography and scale, bundle adjustment results suggest an acceptable RMS image residual (σ=3μm, ~1.4pixels) and a good control point RMS (planimetric RMSXY= 0.01m and depth RMSZ= 0.03m). The a posteriori sigma naught suggests that initial precisions of input data were rather overestimated by a factor of four, which is attributed mainly to control points and secondary to image measurement assumed precisions. It is noted that the absence of check points together with the weak control geometry indicate that the results although precise enough, cannot be considered as accurate with regards to their agreement to the ‘ground-truth’. It is noted that besides further investigation of these results, the first 230 photo block is currently under re-processing and checking. As a result, the revised project will be utilized to cross check the results obtained during the previous excavation period.
Fig. 5. Control point targets used in the underwater photogrammetric processing.
From that point forward, the daily survey of the trench coved the trench area and the new estimated control points around it. The combination of underwater diffusion and lack of texture in the sandy bottom lead to significant problems for tie point selection. This is a fact that hugely affects automatic point extraction techniques as well as the human operator. In order to add well defined tie points over sandy block areas, coded targets were randomly positioned prior to photography. For each new amphora a number of points were measured on its surface, as part of the bundle adjustment, and these were subsequently passed to the architect who was manually locating the model of the revolved amphorae, as described in Demesticha (2010). Monitoring of the new estimated control points revealed displacements as well as slow movement. This was attributed to currents that were slightly but constantly pushing over the protruding control points on the clay sea
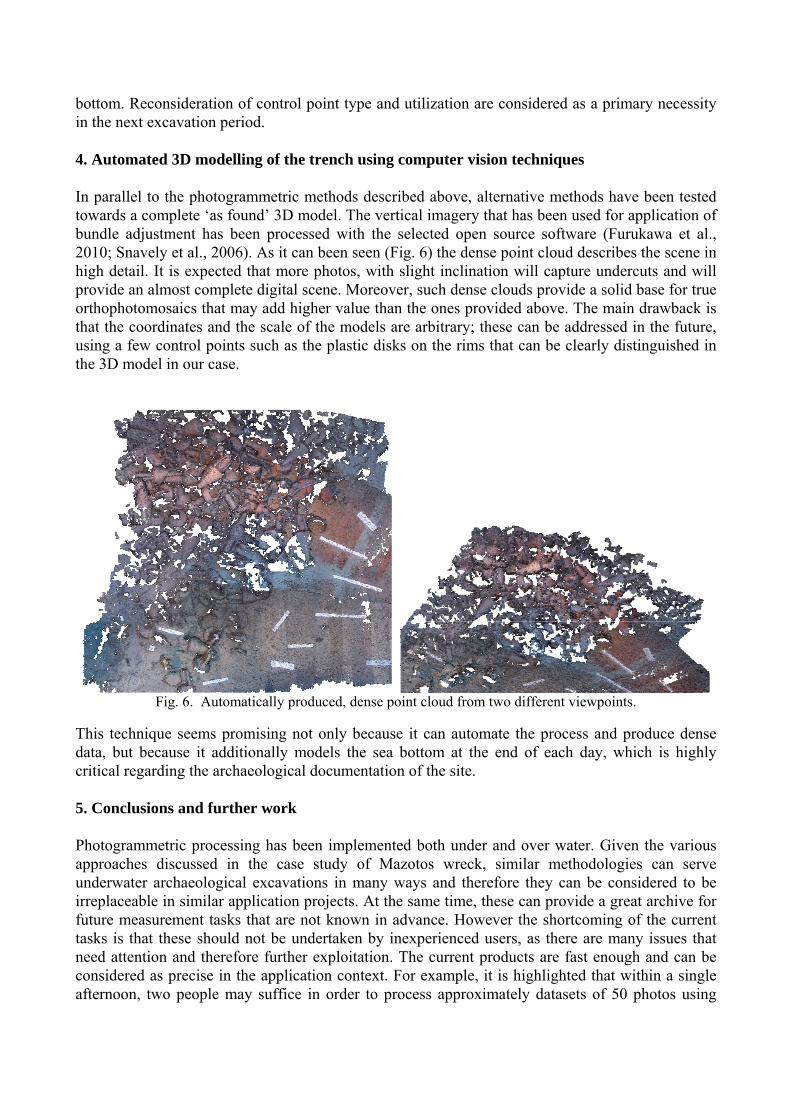
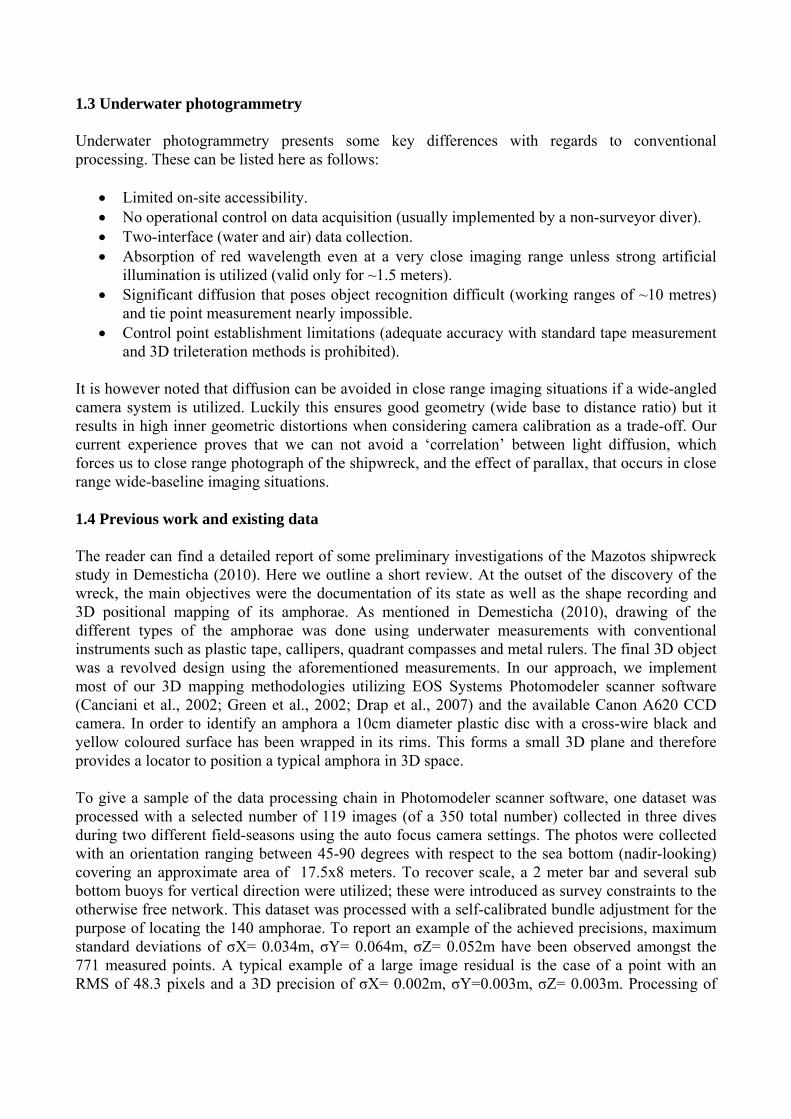
bottom. Reconsideration of control point type and utilization are considered as a primary necessity in the next excavation period. 4. Automated 3D modelling of the trench using computer vision techniques In parallel to the photogrammetric methods described above, alternative methods have been tested towards a complete ‘as found’ 3D model. The vertical imagery that has been used for application of bundle adjustment has been processed with the selected open source software (Furukawa et al., 2010; Snavely et al., 2006). As it can been seen (Fig. 6) the dense point cloud describes the scene in high detail. It is expected that more photos, with slight inclination will capture undercuts and will provide an almost complete digital scene. Moreover, such dense clouds provide a solid base for true orthophotomosaics that may add higher value than the ones provided above. The main drawback is that the coordinates and the scale of the models are arbitrary; these can be addressed in the future, using a few control points such as the plastic disks on the rims that can be clearly distinguished in the 3D model in our case.
Fig. 6. Automatically produced, dense point cloud from two different viewpoints.
This technique seems promising not only because it can automate the process and produce dense data, but because it additionally models the sea bottom at the end of each day, which is highly critical regarding the archaeological documentation of the site. 5. Conclusions and further work Photogrammetric processing has been implemented both under and over water. Given the various approaches discussed in the case study of Mazotos wreck, similar methodologies can serve underwater archaeological excavations in many ways and therefore they can be considered to be irreplaceable in similar application projects. At the same time, these can provide a great archive for future measurement tasks that are not known in advance. However the shortcoming of the current tasks is that these should not be undertaken by inexperienced users, as there are many issues that need attention and therefore further exploitation. The current products are fast enough and can be considered as precise in the application context. For example, it is highlighted that within a single afternoon, two people may suffice in order to process approximately datasets of 50 photos using
bundle adjustment procedures for positional recording of the findings, photomosaics production and dense 3D point cloud generation of the trench. Underwater conditions affect immensely the quality of the photos (the aspect of ‘art’ in the definition of photogrammetry) and therefore photography should be addressed with great care. Failure to do so, might lead to missing areas or even repetition of photographic dives. Equipment and photographic experience are highly appreciated here. Overall, the present deliverables suggest that to further improve our implemented methodologies the following considerations need to be accommodated for:
Good photography with regards to radiometric image quality and geometry. Control point establishment remains an open problem. Within the point cloud generation approach semi or fully automated procedures for
amphorae placement are expected to be supported. High degree of automation would improve product delivery regarding time requirements and
experience of personnel as well as automation would minimize human error. Point cloud registration to the local coordinate system. Expertise knowledge guidance is essential in order to avoid erroneous data collection and
processing of tasks. As a result, our future investigations are expected to include further processing of existing video sequence data using approaches such as optical flow towards an automated video-based capture and processing system. Of course to account for the significant aspects of precision and accuracy, control will be sought within the implementation tasks. Acknowledgements Authors would like to thank Cyprus University of Technology for the starting fund “More information”. Special thanks to B. Hartzler (Hellenic Institute of Marine Archaeology) for sharing the mosaicing process, architect F. Vlachaki (Hellenic Institute of Marine Archaeology) for commenting over problems of the 2008 survey of the wreck, M. Garras for reporting experience on the Photomodeler use and taking most of the underwater photos and L. Diamanti (National Technical University of Athens) for her participation in Photomodeler and SSK related tasks. References Canciani, M., Gambogi, P., Romano, G., Cannata, G., and Drap, P., 2002. Low cost digital photogrammetry for underwater archaeological site survey and artefact insertion. The case study of the Dolia Wreck in Secche della Meloria, Livorno, Italia. International Archives of Photogrammetry, Remote Sensing and Spatial Information Sciences 34.5/W12, pp. 95-100. Demesticha, S., 2010. The 4th-Century-BC Mazotos Shipwreck, Cyprus: A preliminary report. The International Journal of Nautical Archaeology, in press. Drap, P., Seinturier, J., Long, L., 2003. A photogrammetric process driven by an Expert System: A new approach for underwater archaeological surveying applied to the ‘Grand Ribaud F’ Etruscan wreck. In Proceedings of the 2003 Conference on Computer Vision and Pattern Recognition Workshop, Vol. 1, 6 pages.
Drap, P., Seinturier, J., Scaradozzi, D., Gambogi, P., Long, L., and Gauch, F., 2007, Photogrammetry for Virtual Exploration of Underwater archaeological sites, Proceedings of the 21st International Symposium, CIPA 2007: AntiCIPAting the Future of the Cultural Past: Athens (Greece), 01-06 October, Athens, 6 pages. Fryer J. G.and Fraser C.S. 1986. On the calibration of underwater cameras. The Photogrammetric Record, Vol. 12 (67) pp. 73-85. Furukawa, Y., Curless, B., Seitz, S., M., Szeliski, R., 2010. Towards Internet-scale Multi-view Stereo. In 2010 Computer Vision and Pattern Recognition Proceedings, 8 pages. Green, J., Matthews, S., Turanli, T., 2002. Underwater archaeological surveying using PhotoModeler, VirtualMapper: Different applications for different problems. The International Journal of Nautical Archaeology, Vol. 31 (2), pp. 283-92. Lavest, J., M., Rives, G., Lapresté, J., T., 2000. Underwater camera calibration. In: Lecture notes in computer science. Vol. 1843/2000 Springer Berlin / Heidelberg, pp. 654-668. Ludvigsen, M., Eustice, R., Singh, H., (2006). Photogrammetric models for marine archaeology. In: Proceedings of the IEEE/MTS Oceans Conference and Exhibition. 6 pages. Maas H. G., 1995. New developments in multimedia photogrammetry. Optical 3D measurement techniques III (Eds. A. Gruen , H. Kahmen) Wichman Verlag, Karlsruhe, 7 pages. McGlone J. C., 2004. Manual of Photogrammetry, Fifth edition. American Society for Photogrammetry and Remote Sensing. Pizarro, O., Eustice, R. M., Singh H., 2009. Large area 3-D reconstructions from underwater aerial surveys. IEEE Journal of Oceanic engineering, 34 (2), pp. 150-169. Snavely, N., Seitz, S., M., Szeliski, R., 2006. Photo Tourism: Exploring photo collections in 3D. In Proceedings of SIGGRAPH 2006, ACM Transactions on Graphics, pp. 835-846. Web references: Arpenteur, 2010. An ARchitectural Photogrammetric network tools for EdUcation and Research. http://sudek.esil.univmed.fr/arpenteur/spip/ (accessed 27/07/10). Hugin, 2010. Hugin Panorama photo stitcher software. http://hugin.sourceforge.net/ (accessed 27/07/10). Photomodeler, 2010. Photomodeler scanner software. http://www.photomodeler.com/products/pm-scanner.htm (accessed 27/07/10). PTGui, 2010. PT Gui supported applications. http://www.ptgui.com/plugins.html (accessed July accessed 27/07/10)