Embed Size (px)
Citation preview
[Type text]
PHOTON ENERGY N.V. CONSOLIDATED FINANCIAL REPORT
for the year ended 31 December 2012
2
Photon Energy N.V.
ANNUAL REPORT 2012
3
Content Page
1. Letter from the Management ...................................................................................................................... 4
2. Selected financial information ..................................................................................................................... 7
3. Company introduction .............................................................................................................................. 9
3.1. Company profile .................................................................................................................................. 10
3.2. Identification & Contact Details .................................................................................................................. 12
3.3. History ............................................................................................................................................. 12
3.4. Group Structure ................................................................................................................................... 16
3.5. Our Activities ...................................................................................................................................... 21
3.6. Statutory bodies .................................................................................................................................. 22
4. Report of the Management ...................................................................................................................... 26
4.1. Basic exposures and risks ......................................................................................................................... 27
4.2. Market description and market share ........................................................................................................... 31
4.3. Summary of the major achievements in 2012 .................................................................................................. 36
4.4. Important events in 2012, which had material impact on the Group’s business ............................................................. 36
4.5. Future plans ....................................................................................................................................... 37
4.6. Financial Ratios .................................................................................................................................... 38
4.7. Authorised Advisors Remuneration .............................................................................................................. 38
4.8. Statutory Auditor Remuneration ................................................................................................................. 38
4.9. Total Management Board Remuneration ....................................................................................................... 38
4.10. New Connect’s Good Practices ................................................................................................................... 38
4.11. Statement of Relations ........................................................................................................................... 39
4.12. Activities in R&D .................................................................................................................................. 39
4.13. Material off-balance sheet items ................................................................................................................ 39
4.14. Board of Directors’ statements .................................................................................................................. 39
5. Financial Section .................................................................................................................................. 41

4
1. Letter from the Management
5
CONSOLIDATED FINANCIAL REPORT Letter from the Management
Dear shareholders,
We are presenting to you our annual report for the year 2012, which was marked by the ongoing crisis in the
photovoltaic industry with continuing price declines for PV modules and other equipment while the support for
PV-based electricity generation was cut back dramatically in the traditional European PV markets Germany,
Italy, Spain and others. New growth markets like China, USA and Australia have to date not been able to
compensate for the decline in Europe. On the upside, 2012 will be remembered as the year when grid-parity
has been achieved in many parts of the world’s Sun Belt.
In 2012 we completed our corporate restructuring and implemented a structure based on six legally separated
business lines. The increasingly worsening situation on the Czech PV market led us to the discontinuation of our
local operating activities by disposal. The restructuring process was completed by a share swap in which
minority shareholders were able to swap their shares in the New Connect listed predecessor holding company
Phoenix Energy a.s. (formerly Photon Energy a.s.) into shares of Photon Energy NV in May 2013. On 4 June
2013, Photon Energy NV also listed its shares on the New Connect market of the Warsaw Stock Exchange.
In June 2012 we concentrated our portfolio of operating PV plants with a total installed base of 26 MWp in the
Czech Republic, Slovakia and Italy into our newly-established fully-owned subsidiary Photon Energy
Investments NV (PEI). In March 2013 PEI issued a 5-year corporate bond with an 8% p.a. coupon paid quarterly,
which is listed on the Frankfurt Stock Exchange.
Consolidated revenues in 2012 declined by 30% to EUR 16.2 million, most of which were realized by the sale of
29.3 GWh of PV-generated electricity, which was some 19% above plan. The year-on-year decline was mainly
driven by a sharp reduction in PV component trading and engineering services revenues, which also
contributed to the net loss widening to EUR 12.6 million, of which some EUR 3 million were due to one-off
losses on disposal during the Group’s restructuring.
The steep reductions and termination of support schemes for PV-generated electricity are behind the Group’s
expansion into markets outside the European Union for the development and construction of new PV plants.
After starting our Australian operations in 2011 the first two PV plants were completed in 2012, an office in
Toronto was opened with two staff and preparations for market entry in Turkey were made.
The traditional PV markets with large installed bases in the European Union remain very attractive for our
operations and maintenance business unit Photon Energy Operations given that the installed base across the
European Union currently exceeds 50 GWp. In a market with many underperforming PV plants and rapid
consolidation we see substantial potential to increase our business from 60 MWp under management as of
year-end 2012.
Concluding our letter we would like to thank all of you for the trust you have bestowed upon our Company. We
truly believe that the experience we gained managing the Group over the last two difficult years enables us to
6
become even more competitive and adaptive to challenges that we will face as we enter new markets globally.
We consider a transparent group structure in a stable jurisdiction like the Netherlands, good corporate
governance and proactive investor relations to be important elements in our quest to raise the capital and to
attract the talent required to develop our business globally. On the behalf of the Board of Directors of Photon
Energy NV we would like to express our strong commitment to value creation for all our shareholders.
Amsterdam, 30 June 2013
Board of Directors
Michael Gartner
Director
Georg Hotar
Director
7
2. Selected financial information
8
CONSOLIDATED FINANCIAL REPORT Selected financial information
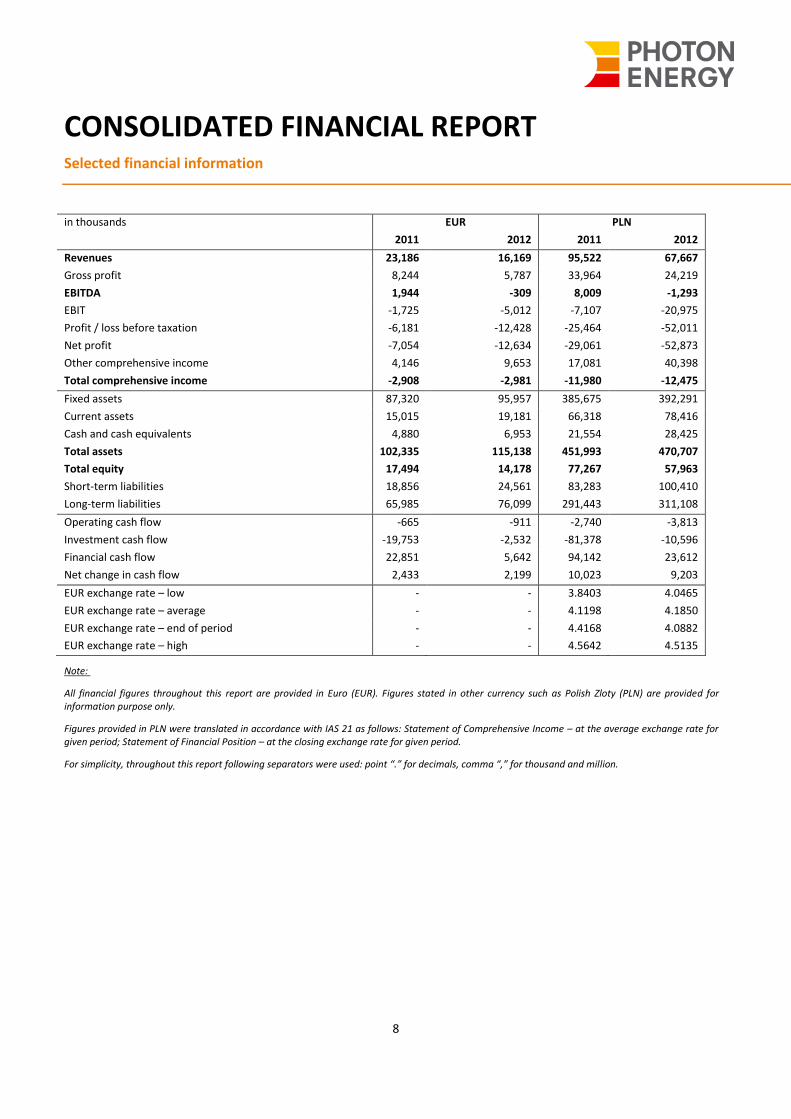
in thousands EUR PLN
2011 2012 2011 2012
Revenues 23,186 16,169 95,522 67,667
Gross profit 8,244 5,787 33,964 24,219
EBITDA 1,944 -309 8,009 -1,293
EBIT -1,725 -5,012 -7,107 -20,975
Profit / loss before taxation -6,181 -12,428 -25,464 -52,011
Net profit -7,054 -12,634 -29,061 -52,873
Other comprehensive income 4,146 9,653 17,081 40,398
Total comprehensive income -2,908 -2,981 -11,980 -12,475
Fixed assets 87,320 95,957 385,675 392,291
Current assets 15,015 19,181 66,318 78,416
Cash and cash equivalents 4,880 6,953 21,554 28,425
Total assets 102,335 115,138 451,993 470,707
Total equity 17,494 14,178 77,267 57,963
Short-term liabilities 18,856 24,561 83,283 100,410
Long-term liabilities 65,985 76,099 291,443 311,108
Operating cash flow -665 -911 -2,740 -3,813
Investment cash flow -19,753 -2,532 -81,378 -10,596
Financial cash flow 22,851 5,642 94,142 23,612
Net change in cash flow 2,433 2,199 10,023 9,203
EUR exchange rate – low - - 3.8403 4.0465
EUR exchange rate – average - - 4.1198 4.1850
EUR exchange rate – end of period - - 4.4168 4.0882
EUR exchange rate – high - - 4.5642 4.5135
Note:
All financial figures throughout this report are provided in Euro (EUR). Figures stated in other currency such as Polish Zloty (PLN) are provided for information purpose only.
Figures provided in PLN were translated in accordance with IAS 21 as follows: Statement of Comprehensive Income – at the average exchange rate for given period; Statement of Financial Position – at the closing exchange rate for given period.
For simplicity, throughout this report following separators were used: point “.” for decimals, comma “,” for thousand and million.
9
3. Company introduction
10
CONSOLIDATED FINANCIAL REPORT
3.1. Company profile
The company Photon Energy N.V. (“Photon Energy”, “PENV”, “Issuer” or “Company”) is a holding company of the Photon Energy Group and was incorporated under the laws of the Netherlands on 9 December 2010. The Photon Energy Group (“Group” or “PE Group”) globally offers comprehensive solutions and maintenance services for photovoltaic systems that cover their entire lifecycle. The Group is vertically integrated in the downstream segment of the photovoltaic industry. Through its six divisions the Company serves the needs of clients with extensive know-how in project development, investment management, project financing and insurance, technology solutions, turnkey contracting) as well as operations and maintenance. The Company has vast experience and a proven track record of completing photovoltaic projects for its own portfolio as well as for the third parties. It develops and builds brownfield, greenfield and rooftop installations. The Company’s power solutions provide solar and solar-hybrid power for a wide-range of customers and applications:
Commercial and residential buildings Municipalities and public buildings Remote communities Agricultural and industrial processes Remote mining operations Airports Telecom infrastructure Utility power grids Institutional and individual solar investors
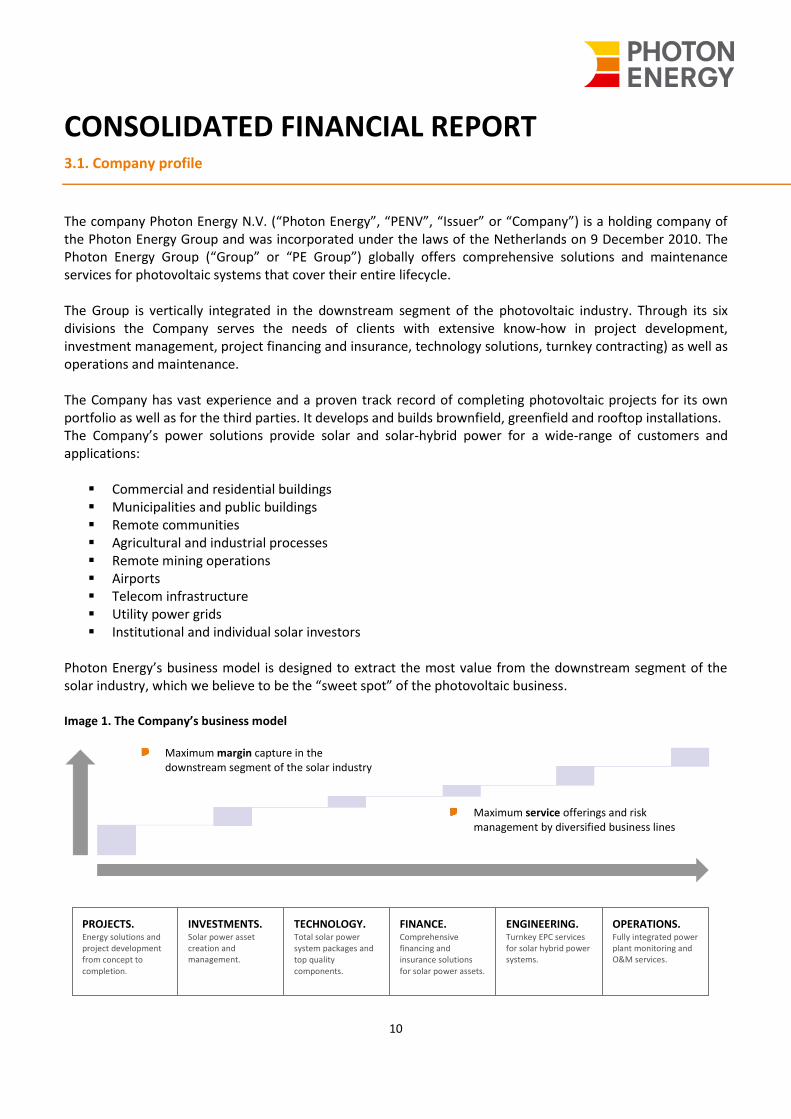
Photon Energy’s business model is designed to extract the most value from the downstream segment of the solar industry, which we believe to be the “sweet spot” of the photovoltaic business. Image 1. The Company’s business model
Maximum service offerings and risk management by diversified business lines
Maximum margin capture in the downstream segment of the solar industry
PROJECTS. Energy solutions and project development from concept to completion.
INVESTMENTS. Solar power asset creation and management.
TECHNOLOGY. Total solar power system packages and top quality components.
FINANCE. Comprehensive financing and insurance solutions for solar power assets.
ENGINEERING. Turnkey EPC services for solar hybrid power systems.
OPERATIONS. Fully integrated power plant monitoring and O&M services.
11
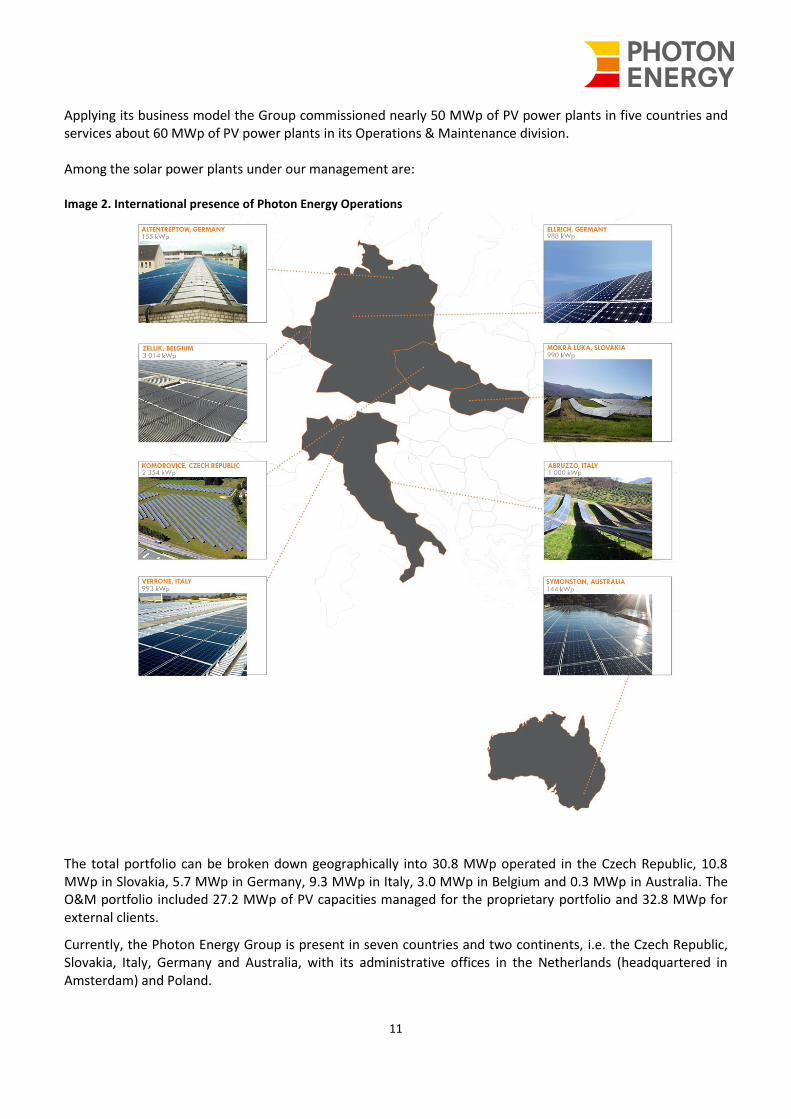
Applying its business model the Group commissioned nearly 50 MWp of PV power plants in five countries and services about 60 MWp of PV power plants in its Operations & Maintenance division. Among the solar power plants under our management are: Image 2. International presence of Photon Energy Operations
The total portfolio can be broken down geographically into 30.8 MWp operated in the Czech Republic, 10.8 MWp in Slovakia, 5.7 MWp in Germany, 9.3 MWp in Italy, 3.0 MWp in Belgium and 0.3 MWp in Australia. The O&M portfolio included 27.2 MWp of PV capacities managed for the proprietary portfolio and 32.8 MWp for external clients.
Currently, the Photon Energy Group is present in seven countries and two continents, i.e. the Czech Republic, Slovakia, Italy, Germany and Australia, with its administrative offices in the Netherlands (headquartered in Amsterdam) and Poland.
12
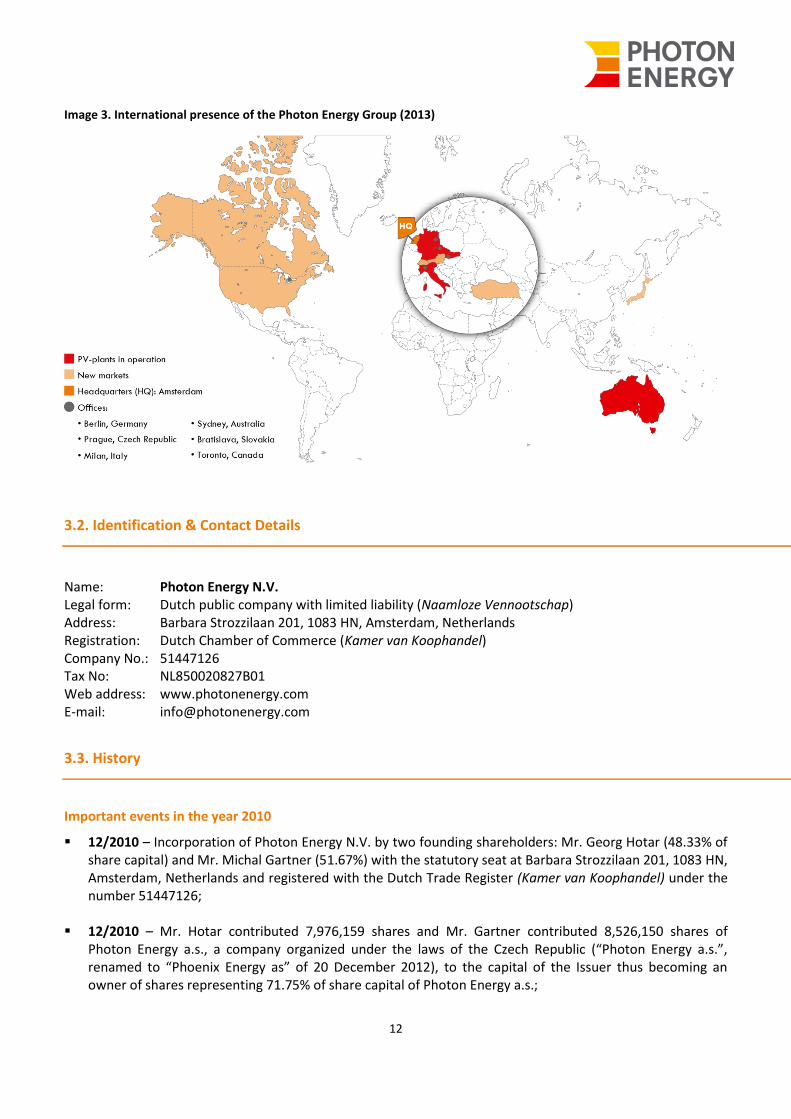
Image 3. International presence of the Photon Energy Group (2013)
3.2. Identification & Contact Details
Name: Photon Energy N.V. Legal form: Dutch public company with limited liability (Naamloze Vennootschap) Address: Barbara Strozzilaan 201, 1083 HN, Amsterdam, Netherlands Registration: Dutch Chamber of Commerce (Kamer van Koophandel) Company No.: 51447126 Tax No: NL850020827B01 Web address: www.photonenergy.com E-mail: [email protected]
3.3. History
Important events in the year 2010
12/2010 – Incorporation of Photon Energy N.V. by two founding shareholders: Mr. Georg Hotar (48.33% of share capital) and Mr. Michal Gartner (51.67%) with the statutory seat at Barbara Strozzilaan 201, 1083 HN, Amsterdam, Netherlands and registered with the Dutch Trade Register (Kamer van Koophandel) under the number 51447126;
12/2010 – Mr. Hotar contributed 7,976,159 shares and Mr. Gartner contributed 8,526,150 shares of Photon Energy a.s., a company organized under the laws of the Czech Republic (“Photon Energy a.s.”, renamed to “Phoenix Energy as” of 20 December 2012), to the capital of the Issuer thus becoming an owner of shares representing 71.75% of share capital of Photon Energy a.s.;
13
12/2010 – The shares of the Issuer were contributed by the two founding shareholders to Solar Power to
the People Cooperatief U.A. and Solar Future Cooperatief U.A.;
Important events in the year 2011:
11/2011 – The Issuer acquired from Photon Energy a.s. the following companies: 100% shares in Photon Energy Investments DE N.V., 100% shares in Photon Energy Investments SK N.V. and 100% shares in Photon Energy Investments IT N.V. All acquired companies were incorporated under the laws of the Netherlands, with their statutory seat in Amsterdam and a place of business at Barbara Strozzilaan 201, 1083 HN, Amsterdam;
11/2011 – The first photovoltaic rooftop installation in Italy (Verderio, province Lecco), with a total installed capacity of 261 kWp, was successfully completed and connected to the grid, securing the feed in premium of EUR 0.265/kWh on top of the electricity sales revenues of more than EUR 0.07/kWh;
12/2011 - Completion of the construction of 1.3 MWp PV power plants in Germany including Ellrich (1 MWp), Grundschule Ueckermünde (45 kWp), Altentreptow (156 kWp), Gymnasium Ueckermuende (27 kWp), Demmin (41kWp), Kindergarten Ueckermuende (25 kWp) and securing grid connection for Gymnasium Ueckermuende and Kindergarten Ueckermuende;
Important events in the year 2012:
3/2012 – Photon Energy Investments SK N.V., seated in Amsterdam, 100% owned by Photon Energy N.V., acquired 100% ownership interest in the following Slovak power plants: Babina II (1.0 MWp), Babina III (1.0 MWp), Mokra Luka II (0.96 MWp); Mokra Luka III (0.96 MWp); Jovice I (0.98 MWp), Jovice II (0.98 MWp), and additionally an ownership stake in the following joint-ventures: 70% ownership interest in the Blatna power plant (0.7 MWp), 60% ownership in the Prsa power plant (1.0 MWp); 50% ownership interest in the Myjava power plant (1.0 MWp), 50% ownership in the Polianka power plant (1.0 MWp), 50% ownership in the Brestovec power plant (0.85 MWp);
4/2012 – Photon DE SPV 1 GmbH, fully owned by the Issuer, sold three German rooftop projects: Grundschule Ueckermünde (45 kWp), Gymnasium Demmin (40.5 kWp) and Goetheschule (27 kWp) to third parties;
4/2012 – Messrs van Wijlen and van den Berg resigned from the Board of Directors of the Issuer;
5/2012 – The Issuer incorporated Photon Directors B.V with its statutory seat in Amsterdam and a place of business at Barbara Strozzilaan 201, 1083 HN, Amsterdam;
6/2012 - The Issuer incorporated Photon Energy Investments N.V., Photon Energy Engineering B.V., Photon Energy Operations N.V., Photon Energy Finance B.V. (later renamed to Photon Energy Projects B.V.), Photon Energy Technology B.V. and Photon Energy FinCo B.V., all companies, established under the laws of the Netherlands, having their statutory seat in Amsterdam and a place of business at Barbara Strozzilaan 201, 1083 HN, Amsterdam;
6/2012 – The Issuer acquired 100% shares in Photon Energy Investments CZ N.V. a company incorporated under the laws of the Netherlands, with its statutory seat in Amsterdam and a place of business at Barbara Strozzilaan 201, 1083 HN, Amsterdam. By this acquisition, the Issuer acquired rights to the portfolio of Czech power plants comprising the following power plants: Komorovice (2.35 MWp), Zvikov (2.03 MWp), Dolni Dvoriste (1.65 MWp), Svatoslav (1.23 MWp), Slavkov (1.16 MWp), Mostkovice SPV 1 (0.21 MWp),
14
Mostkovice SPV (0.93 MWp), Zdice I (1.50 MWp), Zdice II (1.50 MWp), Radvanice (2.31 MWp), Breclav Strechy (0.14 MWp);
6/2012 – The Issuer acquired 100% of Photon Corporate Services s.r.o., (subsequently renamed to Photon Energy Corporate Services CZ s.r.o.), with its registered seat at Uruguayska 17, Praha 2, 120 00, Czech Republic, and 100% of Photon Energy Australia Pty Ltd, with its registered address at 38 Ricketty Street, Mascot NSW 2020, Australia;
6/2012 – Completion and connection to the grid of a 1.0 MWp photovoltaic power plant in Biella, province Verrone, Italy;
7/2012 – The Issuer acquired 100% of Photon Energy Deutschland GmbH, subsequently renamed to Photon Energy Corporate Services DE GmbH and 100% of Photon DE SPV 5 GbH, subsequently renamed to Photon Energy Finance Europe GmbH, both companies having their registered office at Stralauer Platz 33/34, 10243, Berlin, Germany;
7/2012 – The Issuer acquired 100% of Photon Energy Polska Sp. z.o.o., with its registered office in Warsaw, Poland, incorporated under number KRS 0000356478;
9/2012 – Photon Energy Operations SW DE Gmbh, a fully owned subsidiary of the Issuer, signed an agreement with the insolvency administrator of SunConcept Service GmbH, on the basis of which it entered into operations and maintenance contracts, supported by the Insolvency Administrator (Goodwill), and acquired Customer Data and Project files of SunConcept. By the end of 2012, the Issuer signed 55 contracts with former Sunconcept customers and increased the capacity of PV power plants under operations by 4.5 MWp;
10/2012 – The Issuer incorporated Minority Shareholders Photon Energy B.V. (“MSBV”), with its statutory seat in Amsterdam and a place of business at Barbara Strozzilaan 201, 1083 HN, Amsterdam;
11/2012 – The Issuer acting as the sole shareholder of Photon Energy Investments N.V., increased its authorized capital to EUR 5,000,000. Upon the capital increase, the issued and paid up capital of Photon Energy Investments N.V. amounts to EUR 1,125,000;
11/2012 – The Issuer transferred 16,627,312 ordinary shares in the share capital of Photon Energy a.s., ISIN CZ005121202, to its 100% owned subsidiary, Minority Shareholders Photon Energy B.V. (“MSBV”). These shares were transferred as additional contribution in kind on the shares of MSBV and the value of contributed shares of Photon Energy a.s. is regarded as a non-stipulated share premium. The transfer of the shares of Photon Energy a.s. was effective as of 19 December 2012, i.e. the date of the credit entry of the shares in the security account in the name of MSBV;
12/2012 – The Issuer’s General Meeting decided to issue 18,400,000 new shares from the Issuer’s share premium reserve;
12/2012 – The Issuer transferred 100% of its shares in Minority Shareholders Photon Energy B.V. (“MSBV”) to Solar Future Cooperatief U.A. and Solar Power to the People Cooperatief U.A., namely the Issuer transferred 4,833 shares in MSBV to Solar Power to the People Cooperatief U.A., and 5,167 shares in MSBV to Solar Future Cooperatief U.A. As a result of this transaction, the Issuer’s holdings in MSBV and Photon Energy a.s. were reduced to zero;
12/2012 – The sole shareholders of the Issuer decided to dematerialize the total share capital of the Issuer with Euroclear Netherlands serving as Central Security Depository and a Polish Security Depository (Krajowy Depozyt Papierów Wartościowych, KDPW) serving as a secondary depositary and to introduce the Issuer’s shares to trading on NewConnect;
12/2012 – The sole shareholders of the Issuer adopted the amendment of the Articles of Association of the Issuer. The Deed of Amendment of the Articles of Association was executed by a notarial deed dated 18th December, 2012;

15
12/2012 – Solar Future Cooperatief U.A. and Solar Power to the People Cooperatief U.A. contributed in-kind 6,372,688 of the Issuer’s shares to Minority Shareholders Photon Energy B.V. (MSBV);
12/2012 – Photon Energy Investments DE N.V., fully owned by the Issuer, sold the ownership rights to the Ellrich power plan with a total installed capacity of nearly 1 MWp, outside of the Group.
16
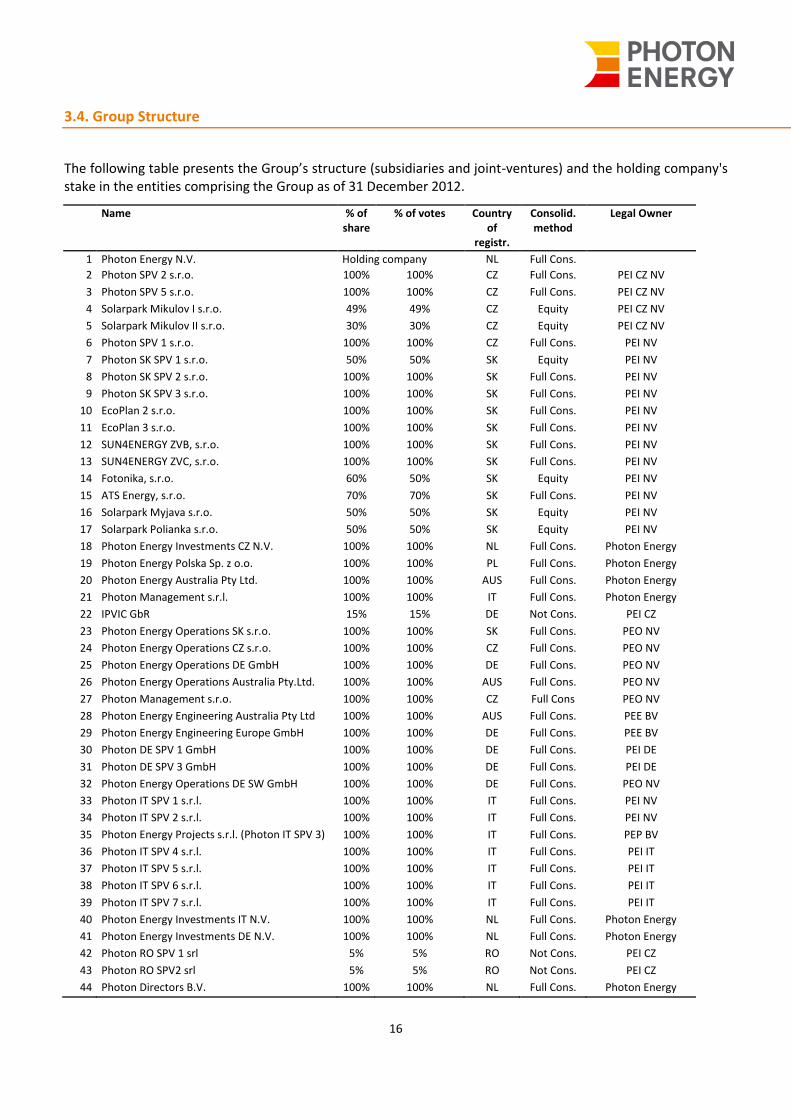
3.4. Group Structure
The following table presents the Group’s structure (subsidiaries and joint-ventures) and the holding company's stake in the entities comprising the Group as of 31 December 2012.
Name % of share
% of votes Country of
registr.
Consolid. method
Legal Owner
1 Photon Energy N.V. Holding company NL
Company
Full Cons.
2 Photon SPV 2 s.r.o. 100% 100% CZ Full Cons. PEI CZ NV
3 Photon SPV 5 s.r.o. 100% 100% CZ Full Cons. PEI CZ NV
4 Solarpark Mikulov I s.r.o. 49% 49% CZ Equity PEI CZ NV
5 Solarpark Mikulov II s.r.o. 30% 30% CZ Equity PEI CZ NV
6 Photon SPV 1 s.r.o. 100% 100% CZ Full Cons. PEI NV
7 Photon SK SPV 1 s.r.o. 50% 50% SK Equity PEI NV
8 Photon SK SPV 2 s.r.o. 100% 100% SK Full Cons. PEI NV
9 Photon SK SPV 3 s.r.o. 100% 100% SK Full Cons. PEI NV
10 EcoPlan 2 s.r.o. 100% 100% SK Full Cons. PEI NV
11 EcoPlan 3 s.r.o. 100% 100% SK Full Cons. PEI NV
12 SUN4ENERGY ZVB, s.r.o. 100% 100% SK Full Cons. PEI NV
13 SUN4ENERGY ZVC, s.r.o. 100% 100% SK Full Cons. PEI NV
14 Fotonika, s.r.o. 60% 50% SK Equity PEI NV
15 ATS Energy, s.r.o. 70% 70% SK Full Cons. PEI NV
16 Solarpark Myjava s.r.o. 50% 50% SK Equity PEI NV
17 Solarpark Polianka s.r.o. 50% 50% SK Equity PEI NV
18 Photon Energy Investments CZ N.V. 100% 100% NL Full Cons. Photon Energy
19 Photon Energy Polska Sp. z o.o. 100% 100% PL Full Cons. Photon Energy
20 Photon Energy Australia Pty Ltd. 100% 100% AUS Full Cons. Photon Energy
21 Photon Management s.r.l. 100% 100% IT Full Cons. Photon Energy
22 IPVIC GbR 15% 15% DE Not Cons. PEI CZ
23 Photon Energy Operations SK s.r.o. 100% 100% SK Full Cons. PEO NV
24 Photon Energy Operations CZ s.r.o. 100% 100% CZ Full Cons. PEO NV
25 Photon Energy Operations DE GmbH 100% 100% DE Full Cons. PEO NV
26 Photon Energy Operations Australia Pty.Ltd. 100% 100% AUS Full Cons. PEO NV
27 Photon Management s.r.o. 100% 100% CZ Full Cons PEO NV
28 Photon Energy Engineering Australia Pty Ltd 100% 100% AUS Full Cons. PEE BV
29 Photon Energy Engineering Europe GmbH 100% 100% DE Full Cons. PEE BV
30 Photon DE SPV 1 GmbH 100% 100% DE Full Cons. PEI DE
31 Photon DE SPV 3 GmbH 100% 100% DE Full Cons. PEI DE
32 Photon Energy Operations DE SW GmbH 100% 100% DE Full Cons. PEO NV
33 Photon IT SPV 1 s.r.l. 100% 100% IT Full Cons. PEI NV
34 Photon IT SPV 2 s.r.l. 100% 100% IT Full Cons. PEI NV
35 Photon Energy Projects s.r.l. (Photon IT SPV 3)
s.r.l.)
100% 100% IT Full Cons. PEP BV
36 Photon IT SPV 4 s.r.l. 100% 100% IT Full Cons. PEI IT
37 Photon IT SPV 5 s.r.l. 100% 100% IT Full Cons. PEI IT
38 Photon IT SPV 6 s.r.l. 100% 100% IT Full Cons. PEI IT
39 Photon IT SPV 7 s.r.l. 100% 100% IT Full Cons. PEI IT
40 Photon Energy Investments IT N.V. 100% 100% NL Full Cons. Photon Energy
41 Photon Energy Investments DE N.V. 100% 100% NL Full Cons. Photon Energy
42 Photon RO SPV 1 srl 5% 5% RO Not Cons. PEI CZ
43 Photon RO SPV2 srl 5% 5% RO Not Cons. PEI CZ
44 Photon Directors B.V. 100% 100% NL Full Cons. Photon Energy
17
Name % of share
% of votes Country of
registr.
Consolid. method
Legal Owner
45 Photon Energy Operations N.V. 100% 100% NL Full Cons. Photon Energy
46 Photon Energy Finance Europe GmbH 100% 100% NL Full Cons. Photon Energy
47 Photon Energy Projects B.V. 100% 100% NL Full Cons. Photon Energy
48 Photon Energy AUS SPV 1 Pty. Ltd. 100% 100% NL Full Cons. PEP BV
49 Photon Energy AUS SPV 2 Pty. Ltd. 100% 100% NL Full Cons. PEP BV
50 Photon Energy AUS SPV 3 Pty. Ltd. 100% 100% NL Full Cons. PEP BV
51 Photon Energy Investments N.V. 100% 100% NL Full Cons. Photon Energy
52 Photon Energy Engineering B.V. 100% 100% NL Full Cons. Photon Energy
53 Photon Energy Technology B.V. 100% 100% NL Full Cons. Photon Energy
54 Photon Energy FinCo B.V. 100% 100% NL Full Cons. Photon Energy
55 Photon Energy Corporate Services DE GmbH 100% 100% DE Full Cons. Photon Energy
56 Photon Energy Corporate Services CZ s.r.o. 100% 100% CZ Full Cons. Photon Energy
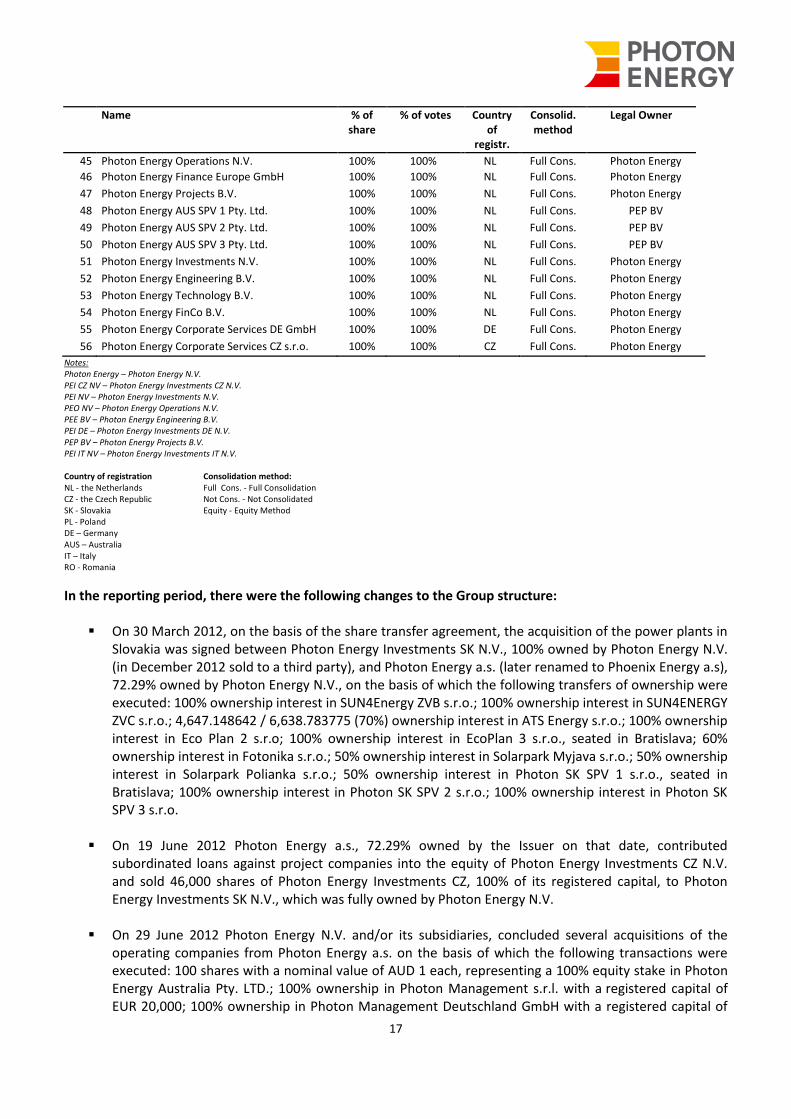
Notes: Photon Energy – Photon Energy N.V. PEI CZ NV – Photon Energy Investments CZ N.V. PEI NV – Photon Energy Investments N.V. PEO NV – Photon Energy Operations N.V. PEE BV – Photon Energy Engineering B.V. PEI DE – Photon Energy Investments DE N.V. PEP BV – Photon Energy Projects B.V. PEI IT NV – Photon Energy Investments IT N.V. Country of registration NL - the Netherlands CZ - the Czech Republic SK - Slovakia PL - Poland DE – Germany AUS – Australia IT – Italy RO - Romania
Consolidation method: Full Cons. - Full Consolidation Not Cons. - Not Consolidated Equity - Equity Method
In the reporting period, there were the following changes to the Group structure:
On 30 March 2012, on the basis of the share transfer agreement, the acquisition of the power plants in Slovakia was signed between Photon Energy Investments SK N.V., 100% owned by Photon Energy N.V. (in December 2012 sold to a third party), and Photon Energy a.s. (later renamed to Phoenix Energy a.s), 72.29% owned by Photon Energy N.V., on the basis of which the following transfers of ownership were executed: 100% ownership interest in SUN4Energy ZVB s.r.o.; 100% ownership interest in SUN4ENERGY ZVC s.r.o.; 4,647.148642 / 6,638.783775 (70%) ownership interest in ATS Energy s.r.o.; 100% ownership interest in Eco Plan 2 s.r.o; 100% ownership interest in EcoPlan 3 s.r.o., seated in Bratislava; 60% ownership interest in Fotonika s.r.o.; 50% ownership interest in Solarpark Myjava s.r.o.; 50% ownership interest in Solarpark Polianka s.r.o.; 50% ownership interest in Photon SK SPV 1 s.r.o., seated in Bratislava; 100% ownership interest in Photon SK SPV 2 s.r.o.; 100% ownership interest in Photon SK SPV 3 s.r.o.
On 19 June 2012 Photon Energy a.s., 72.29% owned by the Issuer on that date, contributed subordinated loans against project companies into the equity of Photon Energy Investments CZ N.V. and sold 46,000 shares of Photon Energy Investments CZ, 100% of its registered capital, to Photon Energy Investments SK N.V., which was fully owned by Photon Energy N.V.
On 29 June 2012 Photon Energy N.V. and/or its subsidiaries, concluded several acquisitions of the operating companies from Photon Energy a.s. on the basis of which the following transactions were executed: 100 shares with a nominal value of AUD 1 each, representing a 100% equity stake in Photon Energy Australia Pty. LTD.; 100% ownership in Photon Management s.r.l. with a registered capital of EUR 20,000; 100% ownership in Photon Management Deutschland GmbH with a registered capital of
18
EUR 25,000; 100% ownership in Photon Energy Deutschland GmbH with a registered capital of EUR 100,000; 100% ownership in Photon Engineering Deutschland GmbH with a registered capital of EUR 100,000; 100% ownership in Photon Corporate Services s.r.o. with a registered capital of CZK 200,000; 100% ownership in Photon Management s.r.o. with a registered capital of CZK 200,000.
On 12 November 2012, Photon Energy Investments N.V., signed contracts with Raiffeisenbank (“RLRE”)
on releveraging the Czech portfolio. On this basis, RLRE has refinanced and released additional 149 MCZK (EUR 5,811 thousands) to the financing of the current structure with 8 years tenor from now on, with a fixed interest rate of 5.19% p.a. applicable for the whole exposure. The increase is related to six CZ SPVs (SPV 4, SPV 6, SPV 10, SPV 11, Onyx I and Onyx II).
On 22 November 2012, on the basis of a civil law deed, Photon Energy N.V. contributed all shares that
it owned in Photon Energy a.s., listed on NewConnect market in Warsaw, to the Minority Shareholders Photon Energy B.V., and hence it reduced its direct share in the capital in Photon Energy a.s. from 72.29% to 0%.
On 28 November 2012, PEI DE N.V. sold the entire company DE SPV 2 for the selling price of EUR 25,000 and additional commitment of the buyer to repay significant part of the outstanding liabilities in total amount of EUR 1,887,000 to the Danish company EstatePartner A/S.
On 13 December 2012, the Italian projects Biella and Verderio (IT SPV 1, IT SPV 2) have been sold from
PEI IT NV to PEI N.V. for the total price of EUR 170 thousands
On 13 December 2012, Photon IT SPV3 s.r.l. has been renamed to "Photon Energy Projects s.r.l.". All the shares of Photon IT SPV 3 s.r.l. have been transferred from Photon Energy Investments IT N.V. to Photon Energy Projects B.V., for EUR 10,000 on the same date.
On 21 December 2012, Photon Energy N.V. sold its share in PEI SK N.V. to a third party, for the sales
price of 1 EUR. On the same date, an amendment of the Agreement on assignment and transfer of receivables between the PE N.V. and PEI SK N.V. was signed. Based on this amendment, the purchase price shall be paid ultimately five years after the date of signing the Agreement, it means in the year 2017.
List of new subsidiaries: In the reporting period, Photon Energy N.V. incorporated the following new subsidiaries:
Photon Energy AUS SPV 1 Pty Ltd (Australia) Photon Energy AUS SPV 2 Pty Ltd (Australia) Photon Energy AUS SPV 3 Pty Ltd (Australia) Photon Energy Engineering Australia Pty Ltd (Australia) Photon Energy Operations Australia Pty Ltd (Australia) Photon Directors B.V. (Netherlands) Photon Energy Investments N,V. (Netherlands) Photon Energy Engineering B.V. (Netherlands) Photon Energy Operations N.V. (Netherlands) Photon Energy Projects B.V. (Netherlands) Photon Energy Technology B.V. (Netherlands) Photon Energy Finco B.V. (Netherlands) Minority Shareholders Photon Energy B.V. (Netherlands)
Australian SPVs were incorporated as project companies for projects to be developed during the year. Photon
19
Energy Engineering Australia Pty Ltd and Photon Energy Operations Australia Pty Ltd will provide engineering as well as operations and maintenance services. All Dutch entities have been incorporated in order to implement the proper Group structure in line with the restructuring strategy executed during 2012. List of acquired subsidiaries: In 2012 no subsidiaries were acquired from third parties. The only acquisitions were performed as a part of the internal Group restructuring. However, since these are considered common control transactions, they are not considered acquisitions of subsidiaries. The following entities were transferred against the carrying value within the Group during the year 2012 as a result of the restructuring process:
Photon SK SPV 1 s.r.o. Photon SK SPV 2 s.r.o. Photon SK SPV 3 s.r.o. EcoPlan 2 s.r.o. EcoPlan 3 s.r.o, SUN4ENERGY ZVB, s.r.o. SUN4ENERGY ZVC, s.r.o. Fotonika, s.r.o. ATS Energy, s.r.o. Solarpark Myjava s.r.o. SolarDark Polianka s,r.o. Photon Energy Polska Sp. z o.o. Photon Energy Australia Pty Ltd. Photon Management s.r.l. Photon SPV 1 s.r.o. Photon SPV 2 s.r.o. Photon SPV 5 s.r.o. Solarpark Mikulov I s.r.o. Solamark Mikulov II s.r.o. Photon Energy Investments CZ N.V. IPVIC GbR Photon Energy Deutschland GmbH Photon Engineering Deutschland GmbH Photon Management Deutschland GmbH Photon Corporate Services s.r.o. Photon Management s.r.o.
List of disposed subsidiaries: During 2012 the following subsidiaries were disposed out of the Group:
Photon Energy Investments SK NV Photon Energy DE SPV 2 Phoenix Energy a.s. (former Photon Energy a.s.) Photon Electricity s.r.o. Solarni vecna bremena s.r.o. Stresni burza s.r.o. Photon FinCo s.r.o. Photon Energy Italia s.r.l. Photon Engineering Italia s.r.l. Golf Club Grygov s.r.o. Photon Engineering Slovensko s.r.o. Photon Engineering s.r.o.
20
Photon Import s.r.o. Photon Trading s.r.o.
After the reporting period the Group continued the restructuring process and the following events occurred from the beginning of the year 2013:
On 6 February 2013 Photon Energy Operations NV sold its share in Photon Management s.r.o. to a third party.
On 14 February 2013 Photon Energy Management s.r.l. was renamed to Photon Energy Operations IT s.r.l. and its legal seat was transferred to Milan.
In April 2013 Photon Energy AUS SPV 2 Pty Ltd (Australia) was sold to a third party.
In April 2013 Photon Energy AUS SPV 1 Pty Ltd (Australia) was sold by Photon Energy Projects B.V. to
Photon Energy Investments N.V.
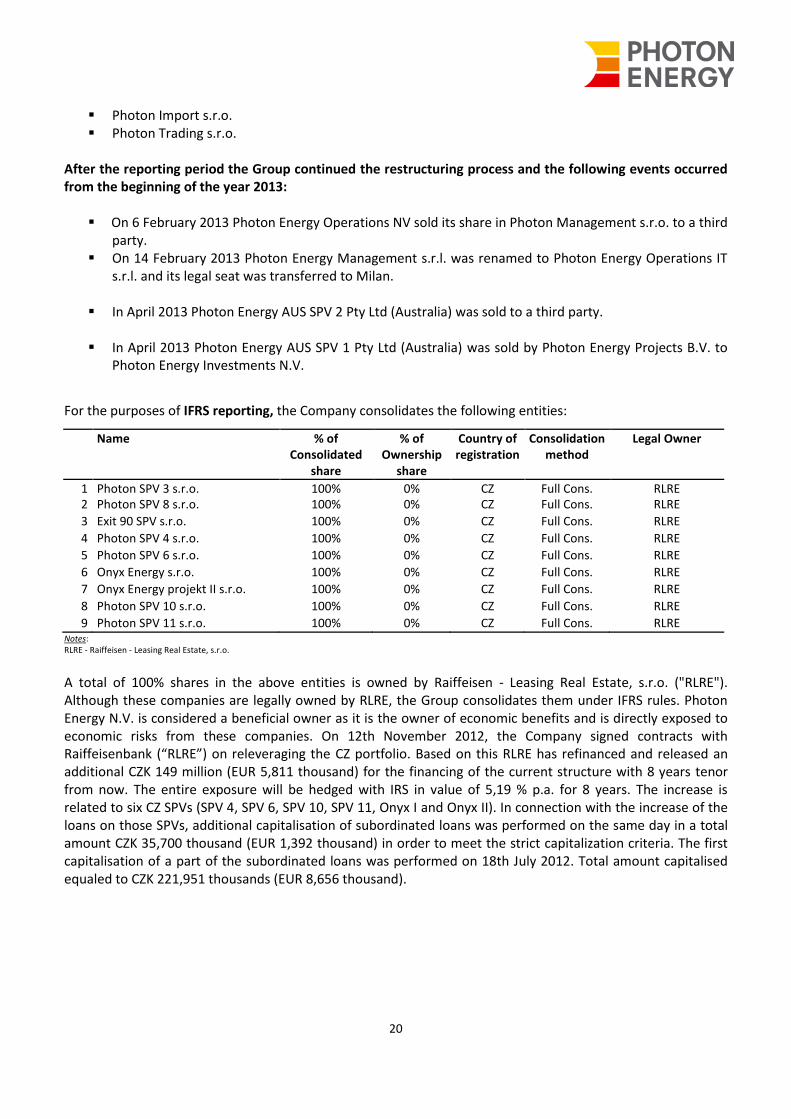
For the purposes of IFRS reporting, the Company consolidates the following entities:
Name % of Consolidated
share
% of Ownership
share
Country of registration
Consolidation method
Legal Owner
1 Photon SPV 3 s.r.o. 100% 0% CZ Full Cons. RLRE 2 Photon SPV 8 s.r.o. 100% 0% CZ Full Cons. RLRE
3 Exit 90 SPV s.r.o. 100% 0% CZ Full Cons. RLRE
4 Photon SPV 4 s.r.o. 100% 0% CZ Full Cons. RLRE
5 Photon SPV 6 s.r.o. 100% 0% CZ Full Cons. RLRE
6 Onyx Energy s.r.o. 100% 0% CZ Full Cons. RLRE
7 Onyx Energy projekt II s.r.o. 100% 0% CZ Full Cons. RLRE
8 Photon SPV 10 s.r.o. 100% 0% CZ Full Cons. RLRE
9 Photon SPV 11 s.r.o. 100% 0% CZ Full Cons. RLRE Notes: RLRE - Raiffeisen - Leasing Real Estate, s.r.o.
A total of 100% shares in the above entities is owned by Raiffeisen - Leasing Real Estate, s.r.o. ("RLRE"). Although these companies are legally owned by RLRE, the Group consolidates them under IFRS rules. Photon Energy N.V. is considered a beneficial owner as it is the owner of economic benefits and is directly exposed to economic risks from these companies. On 12th November 2012, the Company signed contracts with Raiffeisenbank (“RLRE”) on releveraging the CZ portfolio. Based on this RLRE has refinanced and released an additional CZK 149 million (EUR 5,811 thousand) for the financing of the current structure with 8 years tenor from now. The entire exposure will be hedged with IRS in value of 5,19 % p.a. for 8 years. The increase is related to six CZ SPVs (SPV 4, SPV 6, SPV 10, SPV 11, Onyx I and Onyx II). In connection with the increase of the loans on those SPVs, additional capitalisation of subordinated loans was performed on the same day in a total amount CZK 35,700 thousand (EUR 1,392 thousand) in order to meet the strict capitalization criteria. The first capitalisation of a part of the subordinated loans was performed on 18th July 2012. Total amount capitalised equaled to CZK 221,951 thousands (EUR 8,656 thousand).
21
3.5. Our Activities
Photon Energy N.V. is a holding company of the Photon Energy Group. The Photon Energy Group through its six divisions of expertise offers global comprehensive solutions and maintenance services relating to photovoltaic systems that cover their entire lifecycle.
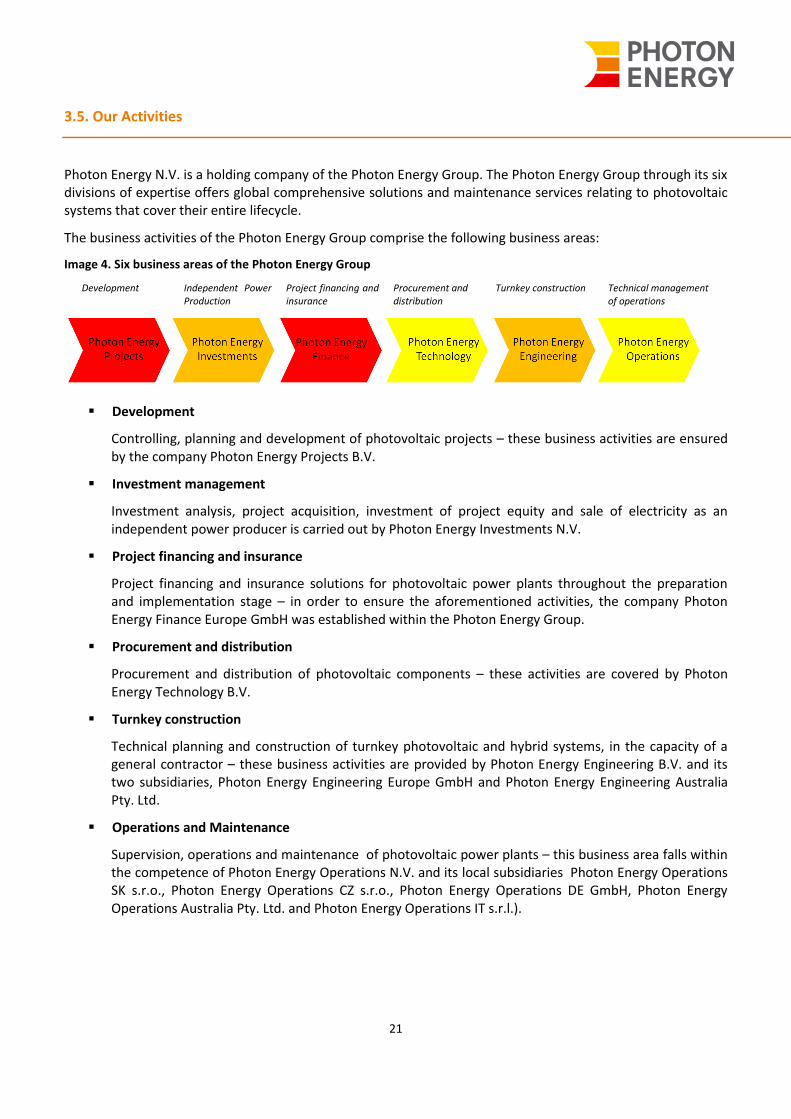
The business activities of the Photon Energy Group comprise the following business areas:
Image 4. Six business areas of the Photon Energy Group
Development Independent Power Production
Project financing and insurance
Procurement and distribution
Turnkey construction Technical management of operations
Development
Controlling, planning and development of photovoltaic projects – these business activities are ensured by the company Photon Energy Projects B.V.
Investment management
Investment analysis, project acquisition, investment of project equity and sale of electricity as an independent power producer is carried out by Photon Energy Investments N.V.
Project financing and insurance
Project financing and insurance solutions for photovoltaic power plants throughout the preparation and implementation stage – in order to ensure the aforementioned activities, the company Photon Energy Finance Europe GmbH was established within the Photon Energy Group.
Procurement and distribution
Procurement and distribution of photovoltaic components – these activities are covered by Photon Energy Technology B.V.
Turnkey construction
Technical planning and construction of turnkey photovoltaic and hybrid systems, in the capacity of a general contractor – these business activities are provided by Photon Energy Engineering B.V. and its two subsidiaries, Photon Energy Engineering Europe GmbH and Photon Energy Engineering Australia Pty. Ltd.
Operations and Maintenance
Supervision, operations and maintenance of photovoltaic power plants – this business area falls within the competence of Photon Energy Operations N.V. and its local subsidiaries Photon Energy Operations SK s.r.o., Photon Energy Operations CZ s.r.o., Photon Energy Operations DE GmbH, Photon Energy Operations Australia Pty. Ltd. and Photon Energy Operations IT s.r.l.).
22
3.6. Statutory bodies
In accordance with the legal requirements, the Company uses a one-tier board structure consisting of the Board of Directors. A Supervisory Board has not been established.
3.6.1. Board of Directors
The Board of Directors is responsible for the day-to-day operations of the Company. The Issuer’s Board of Directors has the following members:
Board of Directors in 2012
Name Position Date of birth Term of office expiry date
Georg Hotar Director (Bestuurder) 21.04.1975 No term of expiry
Michal Gartner Director (Bestuurder) 29.06.1968 No term of expiry
Georg Hotar – Director
Georg Hotar co-founded Photon Energy in 2008 and was the company’s CFO until 2011. In that year he was appointed CEO and has since spearheaded the group’s expansion in Europe and overseas. Georg Hotar has extensive knowledge of the solar energy industry as well as in international finance. In 2000 Georg Hotar established Central European Capital, a regional finance and strategy advisory boutique. He has also held various positions in financial services in London, Zurich and Prague. Georg Hotar is an Austrian national and holds a BSc Accounting and Finance degree from the London School of Economics and a Masters in Finance degree from the London Business School.
Michael Gartner – Director
Michael Gartner developed one of the first large PV installations in the Czech Republic before co-founding Photon Energy in 2008. Michael Gartner was CEO of Photon Energy until relocating to Australia to start Photon Energy Australia in 2011. Apart from growing the Australian business, Gartner is instrumental in driving Photon Energy’s off-grid and solar-hybrid power solutions. Before Photon Energy, Michael Gartner ran an investment boutique arranging Eurobond issues and offering sell-side M&A advisory. Between 1994 and 2004, he was an analyst and head of fixed income sales at ING and Commerzbank Securities in Prague. Michael Gartner is an Australian and Czech national and holds an MBA from the US Business School in Prague.
3.6.2. Supervisory Board Under Dutch law, a public company is required to establish a supervisory board if:
the issued share capital of the company together with the reserves pursuant to the balance of sheet amounts to at least EUR 16 million,
the company or a dependent company has established a work council pursuant to a statutory obligation and
the company together with its dependent companies employs at least one hundred employees in the Netherlands.
The company will only be under the obligation to establish a supervisory board if it meets such criteria on the balance sheet dates in three subsequent financial years. The Issuer does not meet the above described criteria
23
and therefore is not required to create a supervisory board. No Supervisory Board has been established. However, the Issuer has the intention to appoint an independent Supervisory Board in the future.
3.6.3. Employees
As of 31 December 2012 the Company had 71 employees (compared to 66 employees in 2011), of which: 2 were in the Netherlands , 14 in Germany , 3 are employed in Slovakia, 3 in Italy, 3 in Australia and the remaining 46 staff are employed in the Czech Republic.
3.6.4. Shares & shareholder structure
Share Capital as of 31 December 2012
Series (issue)
Type of shares
Type of preference
Limitation of share
right
Number of shares
Nominal value of series (issue)
[EUR]
Capital covered
with
Nominal value per share
[EUR]
A bearer - - 23,000,000 230,000.00 cash
0.01
Total number of shares 23,000,000 Total registered capital (EUR) 230,000.00
The authorised share capital amounts to EUR 230,000 divided in 23,000,000 shares of EUR 0.01 each. 23,000,000 shares have been issued and paid up. Photon Energy N.V. has issued new shares with a nominal value of 0.01 EUR to its current shareholders, Solar Power to the People Cooperatief U.A. and Solar Future Cooperatief U.A. (the share capital has thus been increase to 230,000.00 EUR and this increase has been charged to the share premium of the Company).
After the reporting period, on 10 April 2013, all 23,000,000 shares representing in total 100% of the share capital of the Company, were dematerialized with Euroclear Netherlands acting as a primary depository, and registered under ISIN no: NL0010391108. On 12 April, all 23,000,000 shares were dematerialized with the Polish National Depository for Securities, acting as a secondary depository.
Authorized Advisor:
The Company signed an agreement with Capital Solutions ProAlfa Sp. z o.o. on 14 May 2012. The agreement was amended as of 15 August 2012 and 29 April 2013 relating to the provision of services related to the management of the process of enabling minority shareholders of the company Phoenix Energy a.s. to subscribe to the shares in Photon Energy N.V. and performance of services as Authorized Advisor (in line with the Alternative Trading System Rules).
Company Name: Capital Solutions ProAlfa Sp. z o.o. Legal form: Polish Limited Liability Company Registered office: ul. Nowy Świat 51/3, 00-042 Warsaw, Poland Telephone: +48 22 892 00 75 Fax: +48 22 892 00 76 Email: [email protected]
24
Internet: www.cs-proalfa.pl Registration number: 0000150260 Shareholder Structure
As of 31 December 2012, the shareholder structure was as follows:
Shareholder No. of shares / votes
% of votes at the General Shareholders’ Meeting
Georg Hotar 11,109,000 48.3% Michael Gartner 11,891,000 51.7%
Total 23,000,000 100.00%
On 12th April 2013 Minority Shareholders Photon Energy B.V., a Dutch company, owned by two Dutch cooperatives: Solar Future Coöperatief U.A. controlled by Michael Gartner and Solar Power to the People Coöperatief U.A. controlled by Georg Hotar, initiated a public offering of 5,895,408 ordinary registered shares of the nominal value of EUR 0.01 each, issued by Photon Energy N.V. and representing in total 25.63% of the share capital of the Company and registered under ISIN no: NL0010391108, for the price of EUR 0.01 per share, and the total value of the offer calculated on the basis of the selling price that amounting to EUR 58,954.08 (“Public Offering”), in relation to the announcement of a tender offer to buy 5,895,408 shares of Phoenix Energy a.s., a company incorporated under Czech law, with its registered office at Prague 2 – Vinohrady, U Zvonařky 448/16, Postal Code 120 00, registered in the Commercial Register maintained by the Municipal Court in Prague, Section B, file no. 13779 (“Tender Offer”). The intention of the share swap was to enable the minority shareholders who had owned shares in Phoenix Energy a.s. for shares in Photon Energy N.V. and to introduce the Company’s shares to trading on the NewConnect market of the Warsaw Stock Exchange. As of the date of this report, the Shareholder Structure after completion of the share swap is as follows: As of 30 June 2013, the shareholder structure is as follows:
Shareholder No. of shares / votes
% of votes at the General Shareholders’ Meeting
Solar Future Cooperatief U.A. 8,590,739 37.35% Solar Power to the People Cooperatief U.A. 8,036,573 34.94% Minority Shareholders Photon Energy B.V. 1,263,074 5.49% Others 5,109,614 22.22%
Total 23,000,000 100.00%
Solar Power to the People Cooperatief U.A. is a cooperative established under the laws of the Netherlands, with its statutory seat in Amsterdam and its place of business at Barbara Strozzilaan 201, 1083 HN, Amsterdam, Netherlands. The Board of Directors has two members: Mr. Georg Hotar as Director A and Mr. Michael Gartner as Director B. Solar Future Cooperatief U.A. is a cooperative established under the laws of the Netherlands, with its statutory seat in Amsterdam and its place of business at Barbara Strozzilaan 201, 1083 HN, Amsterdam, Netherlands. The Board of Directors has two members: Mr. Michael Gartner as Director A and Mrs. Magda Gartnerova as Director B.

25
Minority Shareholders Photon Energy B.V. is a limited liability company established under the laws of the Netherlands, with its statutory seat in Amsterdam and its place of business at Barbara Strozzilaan 201, 1083 HN, Amsterdam, Netherlands. The board of Directors has one member, Mr. Georg Hotar.
3.6.5. Dividend policy The Company’s strategy is to create value for its shareholders through strong expansion in the globalizing PV industry. For as long as value-creating growth and investment opportunities exist, the Board of Directors does not intend to propose to distribute dividends to shareholders.

26
4. Report of the Management
27
CONSOLIDATED FINANCIAL REPORT
4.1. Basic exposures and risks
4.1.1. Operating & financial risks
Legislative, regulatory and market risks: The economic viability of energy production using PV installations (unless when selling directly to the consumer) depends on the incentive schemes introduced which include: Feed-in-Tariff (FiT) or green certificates, an obligation to purchase the total amount of energy originated from renewable sources, preferential loans, tax holidays or even non-repayable grants. However as those measure serve the purpose of meeting the goals set by politicians in terms of national targets of energy generation mix, as such they are a subject to changes resulting from shifts in political interests. In 2010 the Company experienced the introduction of such an adverse law in the Czech Republic, where the Group still holds the majority of its operations. As of November 2010 the new Renewable Energy Act imposed a levy of 26% on PV plants’ revenues, which significantly impacted the profitability of the business. Risk of legislative changes in Slovakia and Italy is at this moment considered as remote, however, it cannot be fully excluded. On the investment side the Company faces uncertainty in relation to the approval process for the construction of PV installations, grid connection and necessary permits. In particular, the Company must secure various licenses and permits to operate PV plants and while electricity distribution companies in the Czech Republic are compelled to connect renewable energy sources by law, the Company cannot exclude any delays in any of the described areas, which may have a material negative effect on the Company’s operating results and financial position. Risks related to the Group's structure: Because the Company conducts its business through its subsidiaries, its ability to pay dividends to shareholders depends on the earnings and cash flow of its subsidiaries and their ability to pay the Company dividends and to advance funds to it. Other contractual and legal restrictions applicable to the Company's subsidiaries could also limit its ability to obtain cash from them. The Company's right to participate in any distribution of its subsidiaries' assets upon their liquidation, reorganisation or insolvency would generally be subject to prior claims of the subsidiaries' creditors, including lenders and trade creditors. Risk related to personnel and property: There will always be risks involved in the operation and installation of PV plants and the installation of PV systems for third parties. The build-up of these business areas is occurring simultaneously, thus posing high demands on management resources. The operating risks relating to the development of PV projects and the installation and operation of PV systems include among others un-expected failure or damage to the PV panels and other technical equipment, theft or sabotage, or adverse weather conditions causing production interruptions and damage. The installation of PV systems on roofs involves specific risks such as damage to the roofs and higher wind-related stress. Risks related to key personnel: The successful realisation of the business strategy and the Group’s goals is significantly dependent on the knowledge, experience and contacts of the current management, especially that of the shareholders and members of the Board of Directors, Georg Hotar and Michael Gartner, who are responsible for the successful development of the Group on the basis of their knowledge of the industry and their expertise, as well as their customer contacts and strategic abilities. There is a risk that the dynamism of the commercial development will fall and/or that important know-how will be lost in the case of the resignation of either of the members of the Board of Directors. The loss of one or more managers could have a significantly adverse effect on the commercial activities and also on the asset value, financial standing and earning position of the Group.
28
Environmental risk: The business activity of the Group, particularly in the area of photovoltaic power plant construction, must comply with laws, regulations and directives valid in the location of the installation. These laws regulate e.g. emissions in the air, sewages, protection of soil and groundwater as well as health and security of people. Transgressions against these environmental provisions can be pursued according to civil, criminal and public law. Especially temporary provisions could encourage a third party to open a process or - given the circumstances - to demand costly measures to control and remove environmental pollution or to upgrade technical facilities. The properties necessary for photovoltaic power plants are partially owned by the respective SPV. It cannot be ruled out that these are contaminated sites. For removing these, the respective SPV may be responsible, regardless of the cause. This could result in liability risks and material costs in the context of administrative orders or requirements. All the mentioned circumstances can have a negative impact on the financial situation, status and results of the individual SPVs and the Group. Risks related to simultaneous application of Dutch and Polish law: Two legal systems - Dutch and Polish - may, from time to time, apply to the various legal processes related to the activities of the Company and/or to its Shares. Additional legal and/or operational risks may be connected to this situation. Because of the novelty and legal complexity and uncertainty involved, the Company’s management may be currently unaware of certain legal and/or operational risks. Construction and performance risk: A PV installation is based on several technical components, namely the solar panels converting sunlight into electricity, cabling, converters converting DC into AC, transformers and grid connection devices. There is always risk associated with the construction and installation of PV installations. Despite efforts made to reduce such risks, there can be no assurances that delays and cost overruns will not occur. Furthermore, the Company is partly dependent upon the ability of sub-contractors to install PV systems that meet specifications, performance parameters, quality standards and delivery schedules of the Company. Risk related to the technology: The technology involved in the production of electricity using PV is characterized by rapid fundamental developments. Currently the Company does not own any patents for the technology used in relation to PV technologies. However, the development of new technology may fundamentally change the economics of electricity production plants using PV technology. For various reasons the Company may not gain access to this new technology, which may put it at a significant disadvantage to its competitors. Contractual risks: The Company’s business depends on contracts with multiple parties including, but not limited to, land owners, banks, investors, suppliers, contractors, energy utilities and electricity customers. Each contract normally involves a substantial value or consideration to the Company. Furthermore, some of the contracts are governed by foreign law, which may create both legal and practical difficulties in case of a dispute or conflict. Risk related to the expansion: The Group focuses currently on the markets in Canada, the USA, Australia and Turkey. The top priority market is Australia followed by Canada and the USA. There is a risk that the market entry in the mentioned countries will fail or that it will not happen in the intended time period or not in the intended intensity. It is also not ensured whether in each case new markets will be open to the building of photovoltaic power plants as assumed in the strategy as the development of the photovoltaic business can be influenced unfavourably by plenty of factors, for example by general political, economic, infrastructural, legal and fiscal framework conditions, by unexpected changes of political and regulatory conditions and tariffs, recession, limited protection of intellectual property, problems with staffing and managing of positions in foreign affiliated companies or state subsidies to rival companies. Start-up losses can also be one of the results of entering a new market. All of the aforementioned factors could have a negative impact on the development of the business activity and also on the asset value, financial standing and earnings position of the Group.
29
Uninsured losses: The development and the operation of PV installations are subject to a number of risks and hazards, including adverse environmental conditions, theft, technical failure, changes in the regulatory environment and natural phenomena such as inclement weather conditions. Although Photon Energy maintains some insurance to protect against certain of these risks, the Company’s insurance will not cover all the potential risks associated with the development and operation of PV installations. Liquidity risks: The Company is dependent upon having access to short- and long term funding mainly in the form of project financing. There is a risk that the Group will not be able to arrange such project financing and/or that the credit market tightens or completely dries out for the PV industry, which would have an adverse effect on the liquidity of the Group and costs of debt financing in the short term as well as growth prospects in the long term. There can be no assurance that the Group may not experience net cash flow shortfalls exceeding the Group’s available funding sources. Furthermore, there can be no assurance that the Company or its subsidiaries will be able to raise new equity, or arrange new borrowing facilities, on favorable terms and in amounts necessary to conduct its ongoing and future operations, should this be required. Credit risk: Credit risk is the risk of financial loss to the Group if a customer or counterparty to a financial instrument fails to meet its contractual obligations, and arises principally from the Group's receivables from customers, including the electricity distributors. Currency risk: The Group is exposed to a currency risk on sales, purchases and borrowings that are denominated in a currency other than the respective functional currencies of Group entities. The transactions of the Group entities are denominated in CZK, EUR and AUD. Although mainly the CZK/EUR exchange rate experienced wide fluctuations in 2012, the Group is, typically, able to collect prepayments from its customers at the time of committing itself to purchases from third parties and thus to a large extent to mitigate currency risk. There is no financial hedging used by the company against the currency risk. Company’s management does not formally monitor the FX positions. Interest rate risks: The Company’s results are highly dependent on interest rates as a high proportion of project capital expenditure is debt financed. A substantial increase in interest rates may have a material negative impact on the project equity returns and thus profitability of the Company and returns to shareholders. Indebtness risk: The Group is burdened by high level of leverage as the business model assumes financing of individual projects in the model of 80/20 debt-to-equity ratio. A significant amount of debt outstanding, results in growing financial costs which expose the Group to a risk of insufficient cash flow to service the debt payments and hence the liquidity risk.
4.1.2. Political, economic and other uncertainties
Changes in the regulatory, legislative and fiscal framework (including tax rules) governing the production of energy using PV installations could have a material impact on the Group's operations. The largest uncertainty factors is the photovoltaic industry is still the regulatory framework, especially in the Eurozone states where a large number of photovoltaic power plants have so far been built on the basis of state managed support systems (feed-in-tariffs or green certificates). The rapid growth in those markets in recent years has been largely based on regulatory framework conditions and subsidies. Without state managed subsidy programmes photovoltaic would not yet be competitive, especially in comparison with the use of conventional energy sources. Therefore, the commercial operations of the Group are influenced by the continuation of the state managed subsidy programmes for photovoltaics.
30
Risks especially arise from new legal regulations which can exercise a significant influence on the demand for electricity generated from photovoltaics in the individual countries. For example, the state managed subsidy programme concerning the buyback price (feed-in-tariff) is guaranteed for a fixed period in the countries which follow this concept. The rate of remuneration depends on the country or on the valid buyback price as of the moment of the grid connection or according to the permit. The starting dates for the application of any new legal regulations are therefore of special significance. If new projects are subject to extraordinary delays, which make the grid connection possible only after such a starting date, whereby the facility’s profitability was originally calculated on the basis of the previously valid buyback price, this can adversely affect the profitability of the facility in question and could result in the revenues being lower than planned or even non-existent. Moreover, it cannot be ruled out that the low income from electricity production will no longer suffice to cover the ongoing costs, in particular the financing costs, so that the Group could be forced to cover the resulting difference or to sell off the photovoltaic facility at a price below the acquisition price. The buyback price and the subsidies for facilities which are already connected to the grid are fundamentally unaffected by new regulations. However, changes can come into effect at very short notice without any ongoing protection for investments which have already been made. It is possible that the state managed subsidies for renewable energy in general or for photovoltaics specifically in all markets will be reviewed in the courts and as such will be regarded as being against the law or reduced or abolished for some other reason. Issued consent could be revoked or the realisation of planned legislation aimed at supporting photovoltaic power may not be implemented. In addition, the introduction of changes to the state managed subsidy programmes with retroactive effect cannot be fully ruled out. For example, changes to the legal framework conditions for photovoltaics, which also applied to already existing solar facilities, were introduced in the Czech Republic in 2010. In particular, a solar levy introduced at a rate of 26% on the revenues from photovoltaic power plants with an installed output in excess of 30 kWp which were already grid-connected in 2009 and 2010 (the “solar levy”) was implemented for 2011 to 2013. Furthermore, the six-year corporate income tax exemption for photovoltaic power plants was also abolished. The Czech government stated that it intends to further extend the solar levy, which was only supposed to apply until the end of 2013, whereby at present there is no available information as to at what rate or for which period this solar levy increase should apply. If the extension of the solar levy at the current rate of 26% were adopted for the remaining service life of the photovoltaic power plants existing in the Group’s portfolio, this would result in a reduced yield from these photovoltaic power plants and a depreciation requirement for these photovoltaic power plants of up to 12.8 million EUR with the corresponding negative effects on the asset value, financial standing and the earning position of the SPVs and the whole Group. Therefore, the given regulatory framework cannot be taken for granted and temporary adjustments in the incentives schemes and national targets can be introduced ad-hoc, reflecting short-term fiscal needs of changes in the economic situation of the country. Such changes in the regulatory framework may have a material, adverse effect on the profitability of existing projects and future growth opportunities hence should be taken into consideration while assessing the risk of PV business. Moreover, companies operating internationally are also subject to various risks including risks of war, terrorist activities, political, civil or labour disturbances and embargoes. The Company currently operates in several European Union member countries including: Czech Republic, Slovakia, Germany, Italy, Poland and Netherlands as well as two non-EU countries – Canada and Australia. Among those we can distinguish between developed economies such as Germany, Italy, Netherlands and Australia with relatively stable political systems economic policies. However, most of the Group’s operations are still held in Central and Eastern European countries which are still perceived as emerging economies and hence may represent risks that are not encountered in countries with well-established economic and political systems. In addition, the legal and regulatory systems of the emerging European markets identified above may be less developed and less well enforced than in more developed countries. The Company’s ability to protect contractual and other legal rights in those regions may thus be limited compared to regions with more well established markets.
31
4.2. Market description and market share1
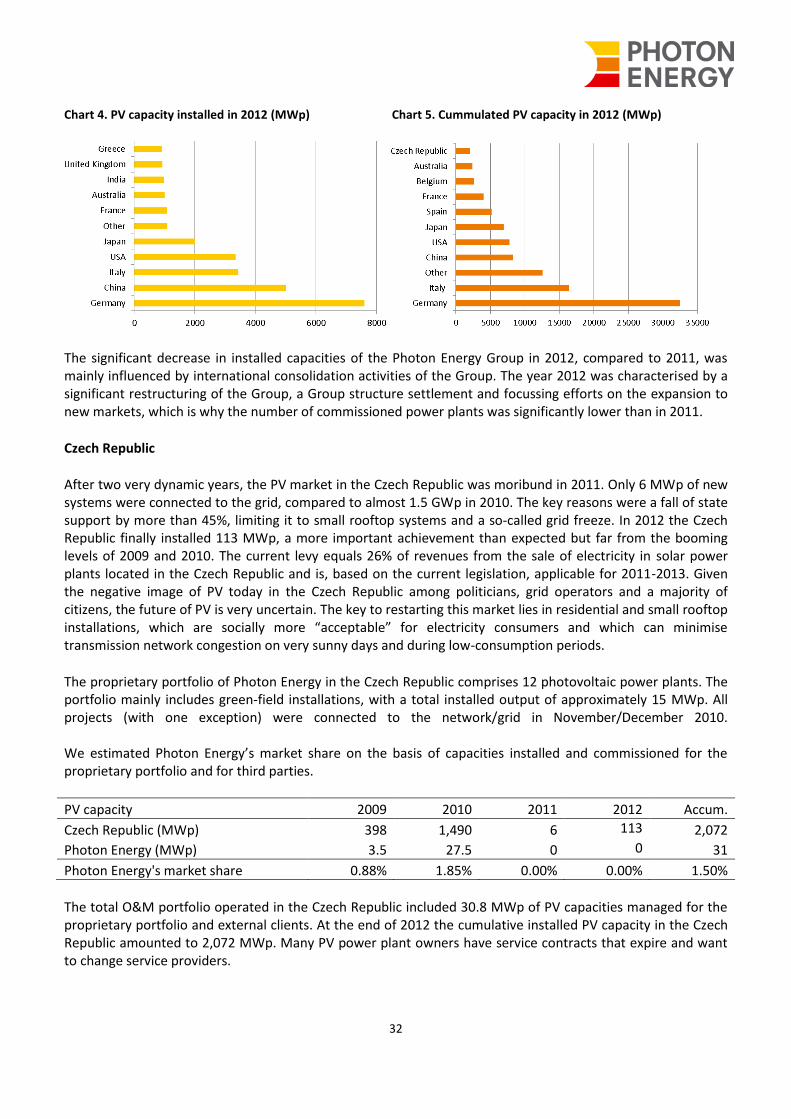
Market developments in 2012 2012 was another difficult year for the photovoltaic (PV) industry, which had experienced remarkable growth over the past decade and is on the way to becoming a major source of power generation in the world. After record growth in 2011, the global PV market stabilised, with capacity additions in 2012 slightly above those achieved in 2011. At the end of 2009, the world’s cumulative installed PV capacity was approaching 24 GWp. One year later it was 40.7 GWp and at the end of 2011 it was 71.1 GWp. In 2012, even during a time of economic crisis, an estimated 31 GWp of new PV capacity was commissioned globally – almost the same as in the record-setting year of 2011 – and the world’s cumulative PV capacity exceeded the 100 GWp mark and achieved just over 102 GWp. This installed base is sufficient to cover the annual power supply needs of over 30 million households. PV remains, after hydro and wind power, the third most important renewable energy source in terms of globally installed capacity. For the second year in a row and the second time in history, PV in 2012 was the number-one-electricity source in the European Union (EU) in terms of newly installed capacity. PV now covers 2.6% of the electricity demand and 5.2% of the peak electricity demand in Europe. Europe still accounts for the predominant share of the global PV market with 17.2 GWp of PV capacity connected to the grid in 2012 (55% of the world’s new PV installations), compared to 22.4 GWp in 2011 (74% of the world’s new PV installations). For the first time in more than a decade, the European market for PV declined compared to the previous year. In 2012, a record year for Germany with 7.6 GWp of newly connected systems, allowed the European market to keep a reasonable level of 17.2 GWp, with 11 GWp coming from this country and Italy alone. Behind these two, the UK, Greece, Bulgaria and Belgium provided a large part of the market growth. Looking at the geographical breakdown of the PV industry in terms of global cumulative installed capacity, Europe remains the world’s leading region with more than 70 GWp as of 2012, which represents 70% of the world’s cumulative PV capacity (compared to 75% of the world’s capacity in 2011). Next in the ranking are China (8.3 GWp) and the USA (7.8 GWp) followed by Japan (6.9 GWp). Many of the markets outside the EU – in particular China, the USA and Japan, but also Australia and India – have addressed only a very small part of their enormous potential. Several countries from large Sunbelt regions such as Africa, the Middle East, South East Asia and Latin America are on the brink of starting their development. Even so, the cumulative installed capacity outside Europe reached 30 GWp by 2012, demonstrating the ongoing rebalancing between Europe and the rest of the world and reflecting more closely the patterns in electricity consumption. In terms of global newly connected systems, for the seventh time in the last 13 years, Germany was the world’s top PV market, with 7.6 GW. China was second with an assumed 5 GWp, followed closely by Italy (3.4 GWp), the USA (3.3 GWp) and Japan with an estimated 2 GWp. Together, Germany, China, Italy, the USA and Japan accounted for nearly 21.3 GWp, or two-thirds of the global market during last year.
1 After European Photovoltaic Industry Association “Global market outlook” May 2013, www.epia.org
32
Chart 4. PV capacity installed in 2012 (MWp) Chart 5. Cummulated PV capacity in 2012 (MWp)
The significant decrease in installed capacities of the Photon Energy Group in 2012, compared to 2011, was mainly influenced by international consolidation activities of the Group. The year 2012 was characterised by a significant restructuring of the Group, a Group structure settlement and focussing efforts on the expansion to new markets, which is why the number of commissioned power plants was significantly lower than in 2011.
Czech Republic
After two very dynamic years, the PV market in the Czech Republic was moribund in 2011. Only 6 MWp of new systems were connected to the grid, compared to almost 1.5 GWp in 2010. The key reasons were a fall of state support by more than 45%, limiting it to small rooftop systems and a so-called grid freeze. In 2012 the Czech Republic finally installed 113 MWp, a more important achievement than expected but far from the booming levels of 2009 and 2010. The current levy equals 26% of revenues from the sale of electricity in solar power plants located in the Czech Republic and is, based on the current legislation, applicable for 2011-2013. Given the negative image of PV today in the Czech Republic among politicians, grid operators and a majority of citizens, the future of PV is very uncertain. The key to restarting this market lies in residential and small rooftop installations, which are socially more “acceptable” for electricity consumers and which can minimise transmission network congestion on very sunny days and during low-consumption periods.
The proprietary portfolio of Photon Energy in the Czech Republic comprises 12 photovoltaic power plants. The portfolio mainly includes green-field installations, with a total installed output of approximately 15 MWp. All projects (with one exception) were connected to the network/grid in November/December 2010. We estimated Photon Energy’s market share on the basis of capacities installed and commissioned for the proprietary portfolio and for third parties.
PV capacity 2009 2010 2011 2012 Accum.
Czech Republic (MWp) 398 1,490 6 113 2,072
Photon Energy (MWp) 3.5 27.5 0 0 31
Photon Energy's market share 0.88% 1.85% 0.00% 0.00% 1.50%
The total O&M portfolio operated in the Czech Republic included 30.8 MWp of PV capacities managed for the proprietary portfolio and external clients. At the end of 2012 the cumulative installed PV capacity in the Czech Republic amounted to 2,072 MWp. Many PV power plant owners have service contracts that expire and want to change service providers.
33
Slovak Republic
Slovakia experienced a relative boom at the end of 2010 and the first semester of 2011, but the volume of installations declined with newly installed capacity amounting to only 15 MW (compared to 321 MW in 2011) with a cumulative installed capacity of 523 MW. Slovakia has been experiencing a situation similar to the Czech Republic. Overwhelmed by the rapid development of large-scale systems, the government has since July 2011 limited the support scheme to systems of up to 100 kW. The level of tariffs has been dramatically reduced in 2012 to slightly below 0.20 €/kWh over 15 years, making PV investment less attractive than in neighbouring countries. Photon Energy Group currently owns shares in 11 SPVs in Slovakia with a total installed output of approximately 10.4 MWp. Each SPV operates one photovoltaic power plant. Photon Energy did not commission new capacities in 2012.
PV capacity 2009 2010 2011 2012 Accum.
Slovak Republic (MWp) 0 145 321 15 523
Photon Energy (MWp) 0 5.0 8.8 0 13.8
Photon Energy's market share - 3.45% 2.74% 0% 2.6%
The total O&M portfolio operated in Slovakia included 10.8 MWp of PV capacities managed for the proprietary portfolio and external clients. At the end of 2012 the cumulative installed PV capacity in Slovakia amounted to 523 MWp. Germany In 2012 Germany was the world’s top market, with 7.6 GWp of newly connected systems (compared to 7.5 GWp in 2011). Germany has seen three consecutive years with stable growth in connections, leading to a total installed capacity of a record 32.4 GWp. This was accompanied by a progressive evolution in market dynamics, with 2012 showing PV gradually becoming self-sustainable. With PV’s Levelised Cost of Electricity (LCOE) now lower than the price of retail electricity, at least in the residential and commercial segments in Germany, PV development can be at least partially driven by self-consumption rather than only FiTs. The proprietary portfolio in Germany is comprised of three photovoltaic power plants which are owned by the Group through one subsidiary Photon DE SPV 3. The total installed capacity of projects currently owned in Germany amounts to 255 kWp. One project (Kindergarten Ückermünde) was connected to the grid in December 2011, securing the highest feed-in-tariff, while the remaining two were connected to the grid in Q3 2012. In 2012 the Photon Energy Group installed 1,355.4 kWp and sold 4 plants with a total capacity of 112.5 kWp out of the Group. The total O&M portfolio operated in Germany included 9.3 MWp of PV capacities managed for the proprietary portfolio and external clients and is growing each year. Germany has seen three consecutive years with stable growth in connections, leading to a total installed capacity of a record 32.4 GW. There are many already constructed PV power plants that need to be maintained and monitored. In the wake of PV service providers going insolvent there is a large addressable market of PV power plants that need O&M services. An example for this opportunity is the case of German PV company SunConcept Service GmbH. Photon Energy Operations SW DE Gmbh, a fully owned subsidiary of Photon Energy N.V., signed an agreement with the insolvency administrator of SunConcept Service GmbH, on the basis of which it entered into operations and maintenance contracts. By the end of 2012, the Issuer had signed 55 contracts with former Sunconcept customers and increased the capacity of PV power plants under operations by 4.5 MWp.
34
Italy In Italy, 3.4 GWp of PV were connected to the grid in 2012. This is a significant decrease from the boom seen in 2011, with 9.45 GWp. But as was the case with Germany in 2011, many systems connected to the grid in Italy that year had actually been installed at the end of 2010. The numbers differ when analysing the market from an installation point of view. In this case, the Italian market was closer to 4-5 GWp in 2010, 6-7 GWp in 2011 and around 3.5 GWp in 2012. After the rush of 2011, the Italian market has returned to a level that nevertheless remains high. Having reached a financial cap for FiTs, the Italian market will experience the transition to the post-FiT era faster than many expected. In 2012 the proprietary portfolio comprised two rooftop photovoltaic power plants in Italy with the total capacity of 1,254.6 kWp. The plants were connected to the grid in November 2011 and June 2012, respectively. The total O&M portfolio operated in Italy comprised 3.0 MWp of PV plants managed for the proprietary portfolio and external clients. The Company seeks to develop its O&M activity on the Italian market as Italy is currently the second largest country worldwide in terms of installed PV capacity with 16.4 GWp at the end of 2012. Photon Energy intends to develop its business in Australia, North America and Turkey. Hence, below descriptions of these markets descriptions are presented below: Australia Australia is one of the sunniest continents in the world. The majority of photovoltaic power plants are connected to the electricity network. However, there are numerous “off-grid” solar power plants, meaning that they are independent from the electricity network – particularly in remote Australian villages. It is estimated that the solar irradiation in Australia is approximately 10,000 times higher than the annual energy consumption2. Solar irradiation is especially high in Central/Northwestern Australia. However, these regions are not connected to the national electricity network. In 2012 a total of 1,000 MWp were connected to the grid (compared to 837 MWp in 2011) with a cumulated capacity of 2,412 MWp (compared to 1,412 MWp in 2011), which represents a 71% increase compared to the previous year3. The number of photovoltaic power plants increased significantly. The number of photovoltaic installations increased tenfold in the period from 2009 - 20114. This increase was mainly caused by the remunerations for electricity supplied to the public network and goals in the area of renewable energy. Since June 2009 the Australian Government used generous discounts for solar module installations on family houses and public buildings under the “Solar Homes and Communities Plan”. This programme has been replaced by the “Solar Credits” programme, which is part of the “Renewable Energy Target” (RET). The RET relies on marketable certificates to guarantee market for further production of renewable energy. By 2016, prognoses rely on cumulated capacity of 4,900 MWp (moderate scenario) or 11,300 MWp (incentive-based scenario), as appropriate5. USA In the United States of America, a record was broken in 2012 with 3,346 MW were connected to the grid (compared to 1,867 MW in 2011). The cumulated capacity amounted to 7,777 MW, which represents a 76%
2 Australian Government – Geoscience; Australian Energy Resources Assessment 2012, Chapter 10 3 Global Market Outlook for Photovoltaics 2013-2017, p.15 4 Clean Energy Council; Clean Energy Australia Report 2011, pp. 32-42 5 EPIA: Chapter 3.3.c. “Australia”
35
increase compared to the previous year (4,431 MW)6. By 2016, various prognoses even predict a total installed output of 30,500 MW (moderate scenario) or 37,100 MW (incentive-based scenario). Canada/Ontario In 2012 a total of 268 MWp were connected to the grid (compared to 297 MWp in 2011) with the cumulated capacity reaching 765 MWp, which represents a 54% increase compared to the previous year (497 MWp)7. In 2011 the largest share (85%) was attributed to the province of Ontario and its generous support programme. By the end of 2016, the capacity is estimated to reach 3,200 MWp (moderate scenario) or even 4,300 MWp (incentive-based scenario)8. Canada has substantial solar energy resources, especially in Ontario, Quebec and in the Prairies. Numerous regions in Canada are only scarcely populated and remote. Photovoltaic installations are being frequently used as standalone energy production units, with no need to depend on the network in case of remote houses, telecommunication facilities, oil-control stations and pipelines, and navigation devices. Therefore solar energy in Canada is particularly attractive as a form of energy that provides substitute for oil. The most important impulse for Canadian photovoltaics has recently been the government support programme in Ontario, especially the incentive scheme for electricity supplied to the public grid. The programme for the support of clean renewable energy was the first programme of its kind in North America. Turkey Turkey is the most dynamically growing energy market in Europe. The investments necessary for energy production in the period from 2010 – 2030 are estimated at USD 250 billion. Energy consumption continues to increase by 8% annually. In 2010, the costs of fuel imports amounted to approximately USD 39 billion (and estimated at USD 50 billion for 2011). Approximately 71% of imported fuels are used for energy consumption9. Turkey is well-positioned within Europe in terms of solar energy. The conditions for solar energy production are comparable to Spain. If solar power plants were to cover just 0.5% of Turkey’s surface, it would be sufficient to satisfy the total energy needs of the country10. In 2012 a total of 2 MWp was connected to the grid (compared to 1 MWp in 2011) with the cumulated capacity reaching 9 MWp, which represents a 23% increase compared to the previous year (7 MWp)11. The consequences of the support programme, which was introduced in December 2010, are still to take full effect. The approval procedure for solar installations with a capacity of up to 500 kWp was simplified at the beginning of 2012, which should be a sufficient impulse for the market development12. In 2013 new installations are estimated with 50 MWp in 2013 and 1,000 MWp in 2014, whereas none of the installations will exceed a capacity of 500 kWp. Large projects are not expected before 201413.
6 Global Market Outlook for Photovoltaics 2013-2017, p.15 7 Global Market Outlook for Photovoltaics 2013-2017, p.15 8 EPIA: Chapter 3.3.c. “Canada” 9 Prof. Ture, Solar Energy Market in Turkey, presentation at the INTPOW Solar Day 2012, Oslo (Data: Ministry of Energy and National Resources, Turkey) 10 www.EntropyEnergy.net 11 Global Market Outlook for Photovoltaics 2013-2017, p.18 12 EPIA: Chapter 3.2.e. “Turkey” 13 Marc Roca. Turkey’s small scale solar plant rules to spur boom in installations; Bloomberg News, 1 March 2012
36
4.3. Summary of the major achievements in 2012
The year 2012 was characterised by the continuing restructuring of our Group as well as a Group structure settlement. As we also concentrated a lot of our resources on expanding to new markets, the number of power plants commissioned and the revenue for 2012 were significantly lower than in 2011. On the other hand, the revenues from sale of electricity increased. Photon Energy N.V. successfully completed the construction of the following power plants:
1 PV plant with a total capacity of 1 MWp in Italy for the proprietary portfolio The management arm Photon Energy Operations provided operations and maintenance services to:
intra-group companies with a total installed capacity of 27.2 MWp, third parties with a total installed capacity of 32.8 MWp.
The total portfolio can be broken down geographically into 30.8 MWp operated in the Czech Republic, 10.8 MWp in Slovakia, 5.7 MWp in Germany, 9.3 MWp in Italy, 3.0 MWp in Belgium and 0.3 MWp in Australia. The O&M portfolio included 27.2 MWp of PV capacities managed for the proprietary portfolio and 32.8 MWp for external clients. The total volume of electricity generation from proprietary power plants in 2012 amounted to 29.3 GWh, exceeding the energy forecast by approximately 19% on average.
4.4. Important events in 2012, which had material impact on the Group’s business
During 2012 the Photon Energy Group disposed of several mainly Czech subsidiaries to related and third parties. This decision was taken in view of the uncertain legislative future development of the solar industry in the Czech Republic. We also took steps paramount to completing the restructuring of the Group, the creation of a new structure under Dutch law and the plan to expand to new markets. The total loss resulting from the sale of these subsidiaries amounted to EUR 3,033 thousands. The loss has been calculated as the comparison of the net assets of disposed subsidiaries (EUR 3,058 thousands) and their sales price (EUR 25 thousands). In 2012, no subsidiaries were acquired from third parties. Acquisitions were made only as part of the aforementioned internal Group restructuring. Following the disposal of those companies, Photon Energy N.V. incorporated new Dutch entities, which recommenced activities previously performed by Czech subsidiaries. Following the disposal of Czech subsidiaries, all of which were sold to the parties, except for Photon Energy a.s (“PEAS”), which was sold to an entity owned by the controlling shareholders of the Group. As a consequence, PEAS left the consolidation scope of Photon Energy N.V. In December 2012 the following steps related to the sale of PEAS have been performed:
all shares of PEAS held by PENV were contributed to its newly-formed subsidiary Minority Shareholders Photon Energy B.V. (MSBV) as a non-stipulated share premium contribution, so that no new shares were issued.
PENV issued 18,400,000 new shares with a nominal value of EUR 0.01 each to its current shareholders, Solar Power to the People Cooperatief U.A. (SPP) and Solar Future Cooperatief U.A. (SF), so that the share capital increased to EUR 230,000)
37
PENV transferred all shares it held in MSBV to SPP and SF. Following these steps Photon Energy a.s. is no longer a part of the PENV Group. Subsequently, Photon Energy a.s. has been renamed with effective date as of 19. 12. 2012 to Phoenix Energy a.s.
4.5. Future plans
The objective of the Group is the geographic expansion and diversification of the portfolio, in order to use its global presence to minimise regional risk associated with fluctuations. The Group continuously monitors international developments in the area of solar technology and on the financial markets. It pays close attention to the development of regulations regarding the solar energy sector in individual countries. The expansion to countries such as Australia, Canada, and Turkey seems to be crucial in the light of current developments, as the Group believes such countries could provide a suitable environment for photovoltaic power plants on the basis of climatic conditions (especially solar radiation), existing infrastructure, possible project financing and legal framework conditions. Other markets are analysed on a continual basis. In order to reduce the dependence on government subsidies in the future, the Group’s strategy mainly targets expansion to markets that already have reached Grid Parity, i.e. the cost of PV-generated electricity is competitive with grid-supplied electricity. Apart from geographical diversification the Group intends to specialise in energy generation solutions providing hybrid-system and diesel-replacement solutions for energy-intensive industries. In this area Photon Energy intends to focus on industries such as mining, retail, agriculture, telecommunications and others. In case of remote off-grid locations, where usually irradiation levels are constantly high throughout the year, such energy solutions allow customers to reduce fuel consumption by up to 100%. In on-grid locations, energy efficiency solutions can materially lower monthly electricity bills. There is no one single solution since every customer has different needs, where the finance and the engineering world need to blend perfectly to deliver the solution our customers need. Photon Energy wants to position itself at the cutting edge of the industry, creating PV-based power solutions with the integration of energy storage and/or diesel generators. The Group has developed different accurate models for off-grid and on-grid systems with sufficient flexibility to adapt to a wide range of situations. The Group also intends to become a leading global provider of operations and maintenance services for photovoltaic plants, particularly in well-established markets with significant installed photovoltaic capacities such as Germany, Italy, the Czech Republic and Slovakia as well as Spain. Further expansion of O&M services is foreseen in countries where the Group currently develops and installs new PV power plants. In order to facilitate market penetration, the Group will selectively cooperate with local partners, if necessary.
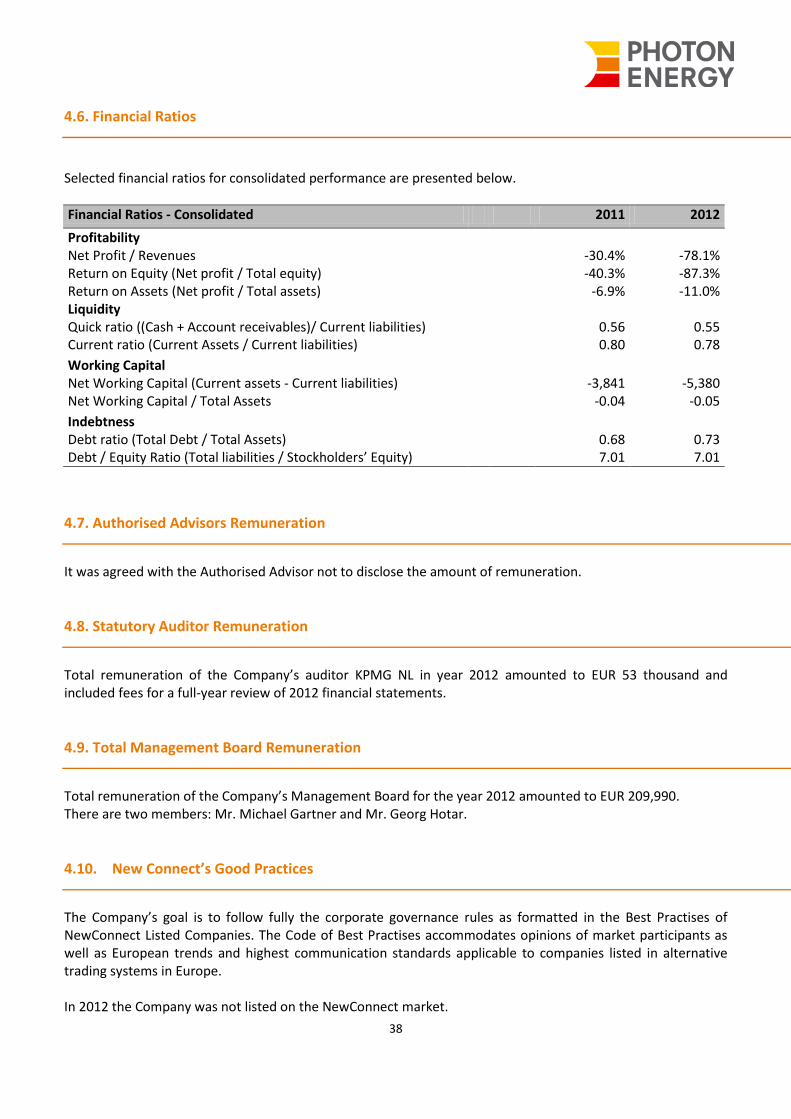
38
4.6. Financial Ratios
Selected financial ratios for consolidated performance are presented below.
Financial Ratios - Consolidated 2011 2012
Profitability Net Profit / Revenues
-30.4% -78.1%
Return on Equity (Net profit / Total equity)
-40.3% -87.3% Return on Assets (Net profit / Total assets)
-6.9% -11.0%
Liquidity Quick ratio ((Cash + Account receivables)/ Current liabilities)
0.56 0.55
Current ratio (Current Assets / Current liabilities)
0.80 0.78
Working Capital Net Working Capital (Current assets - Current liabilities)
-3,841 -5,380
Net Working Capital / Total Assets
-0.04 -0.05
Indebtness Debt ratio (Total Debt / Total Assets)
0.68 0.73
Debt / Equity Ratio (Total liabilities / Stockholders’ Equity)
7.01 7.01
4.7. Authorised Advisors Remuneration
It was agreed with the Authorised Advisor not to disclose the amount of remuneration.
4.8. Statutory Auditor Remuneration
Total remuneration of the Company’s auditor KPMG NL in year 2012 amounted to EUR 53 thousand and included fees for a full-year review of 2012 financial statements.
4.9. Total Management Board Remuneration
Total remuneration of the Company’s Management Board for the year 2012 amounted to EUR 209,990. There are two members: Mr. Michael Gartner and Mr. Georg Hotar.
4.10. New Connect’s Good Practices
The Company’s goal is to follow fully the corporate governance rules as formatted in the Best Practises of NewConnect Listed Companies. The Code of Best Practises accommodates opinions of market participants as well as European trends and highest communication standards applicable to companies listed in alternative trading systems in Europe. In 2012 the Company was not listed on the NewConnect market.
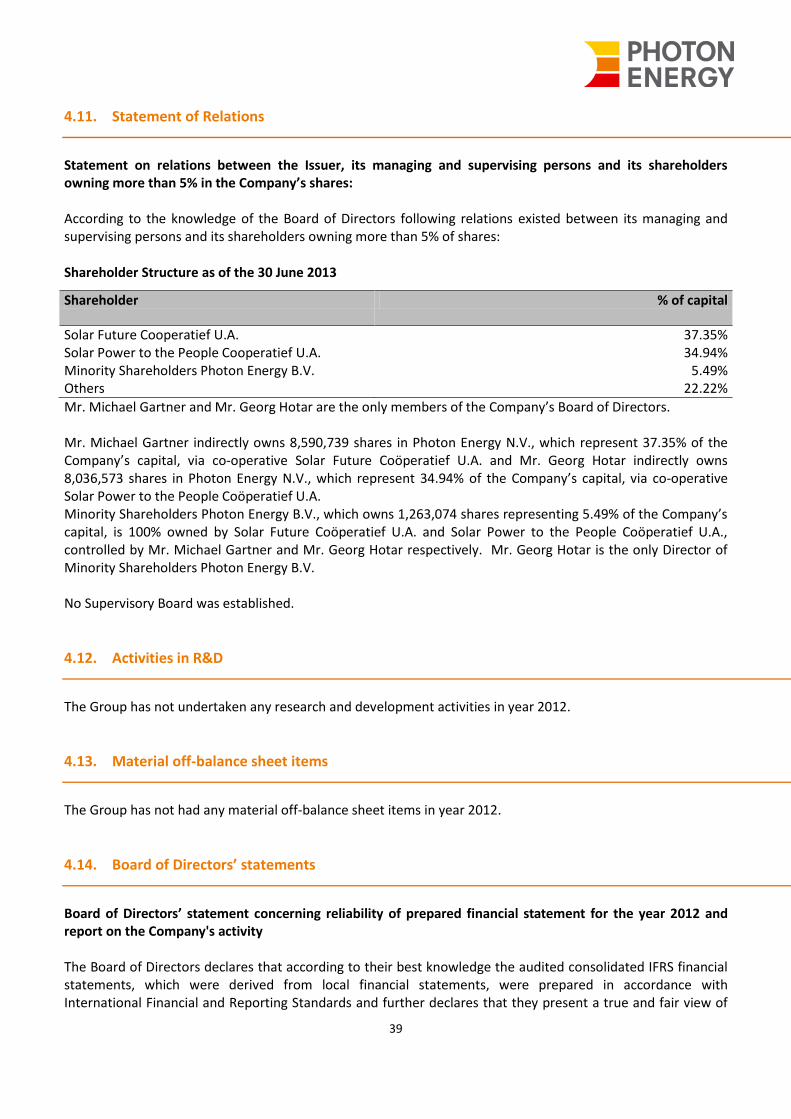
39
4.11. Statement of Relations
Statement on relations between the Issuer, its managing and supervising persons and its shareholders owning more than 5% in the Company’s shares: According to the knowledge of the Board of Directors following relations existed between its managing and supervising persons and its shareholders owning more than 5% of shares: Shareholder Structure as of the 30 June 2013
Shareholder % of capital
Solar Future Cooperatief U.A. 37.35% Solar Power to the People Cooperatief U.A. 34.94% Minority Shareholders Photon Energy B.V. 5.49% Others 22.22%
Mr. Michael Gartner and Mr. Georg Hotar are the only members of the Company’s Board of Directors. Mr. Michael Gartner indirectly owns 8,590,739 shares in Photon Energy N.V., which represent 37.35% of the Company’s capital, via co-operative Solar Future Coöperatief U.A. and Mr. Georg Hotar indirectly owns 8,036,573 shares in Photon Energy N.V., which represent 34.94% of the Company’s capital, via co-operative Solar Power to the People Coöperatief U.A. Minority Shareholders Photon Energy B.V., which owns 1,263,074 shares representing 5.49% of the Company’s capital, is 100% owned by Solar Future Coöperatief U.A. and Solar Power to the People Coöperatief U.A., controlled by Mr. Michael Gartner and Mr. Georg Hotar respectively. Mr. Georg Hotar is the only Director of Minority Shareholders Photon Energy B.V. No Supervisory Board was established.
4.12. Activities in R&D
The Group has not undertaken any research and development activities in year 2012.
4.13. Material off-balance sheet items
The Group has not had any material off-balance sheet items in year 2012.
4.14. Board of Directors’ statements
Board of Directors’ statement concerning reliability of prepared financial statement for the year 2012 and report on the Company's activity The Board of Directors declares that according to their best knowledge the audited consolidated IFRS financial statements, which were derived from local financial statements, were prepared in accordance with International Financial and Reporting Standards and further declares that they present a true and fair view of
40
the Company’s property and financial situation and its financial result as of the date of the publication of this report and that the report on the Report of the Management presents a fair view of the Issuer’s situation, including a description of basic exposures and risks. Michal Gärtner Georg Hotar Director Director Board of Directors’ statement concerning the entity entitled to audit the annual financial statement for the year 2012 The Board of Directors’ declares that the entity authorised to audit financial statements which audited annual consolidated financial statements was selected in accordance with legal regulations and that such entity and certified auditors who audited these statements met conditions to express their impartial and independent opinion on the audit, in accordance with relevant regulations of local law.
Michal Gärtner Georg Hotar Director Director
41
5. Financial Section
42
Photon Energy N.V.
Consolidated Financial Statements for the year ended 31 December 2012
Directors’ report ........................................................................................................................................ 46
Developments in 2012 ............................................................................................................................... 46
Financial instruments and risk management .................................................................................................. 49
Research and development ......................................................................................................................... 49
Personnel ................................................................................................................................................. 49
Strategy for 2013 ...................................................................................................................................... 50
Subsequent events .................................................................................................................................... 53
Consolidated statement of comprehensive income for the year ended 31 December .......................................... 55
Consolidated statement of financial position as at 31 December ...................................................................... 57
Consolidated statement of changes in equity for the year ended 31 December .................................................. 58
Consolidated statement of cash flows for the year ended 31 December ............................................................ 59
1. Reporting entity ............................................................................................................................... 60
2. Basis of preparation ......................................................................................................................... 60
2.1 Statement of compliance .................................................................................................................. 60
2.2 Basis of measurement ...................................................................................................................... 62
2.3 Functional currency .......................................................................................................................... 62
2.4 Use of estimates and judgments ........................................................................................................ 63
3. Application of new and revised EU IFRSs............................................................................................. 64
3.1 New and revised EU IFRSs affecting amounts reported in the current year (and/or prior years) ................ 64
3.2 New and revised IFRSs in issue but not yet effective ............................................................................ 64
4. Significant accounting policies ........................................................................................................... 65
4.1 Basis of consolidation ....................................................................................................................... 65
4.1.1 Business combinations ..................................................................................................................... 65
4.1.2 Subsidiaries .................................................................................................................................... 65
4.1.3 Special purpose entities .................................................................................................................... 65
4.1.4 Loss of control ................................................................................................................................. 66
4.1.5 Investments in associates and jointly controlled entities (equity-accounted investees) ............................. 66
4.1.6 Transactions eliminated on consolidation ............................................................................................ 66
4.2 Foreign currency .............................................................................................................................. 67
4.2.1 Foreign currency transactions ............................................................................................................ 67
4.2.2 Foreign operations ........................................................................................................................... 67
4.2.3 Borrowing costs ............................................................................................................................... 67
4.3 Financial instruments ....................................................................................................................... 67
43
4.3.1 Non-derivative financial assets .......................................................................................................... 67
4.3.2 Non-derivative financial liabilities ....................................................................................................... 68
4.3.3 Share capital ................................................................................................................................... 68
4.4 Property, plant and equipment .......................................................................................................... 69
4.4.1 Recognition and measurement .......................................................................................................... 69
4.4.2 Depreciation .................................................................................................................................... 69
4.5 Inventories ..................................................................................................................................... 70
4.6 Impairment ..................................................................................................................................... 71
4.6.1 Non-derivative financial assets .......................................................................................................... 71
4.6.2 Non-financial assets ......................................................................................................................... 72
4.7 Non-current assets held for sale or distribution .................................................................................... 72
4.8 Provisions ....................................................................................................................................... 73
4.8.1 Warranties ..................................................................................................................................... 73
4.9 Revenue ......................................................................................................................................... 74
4.9.1 Goods sold ...................................................................................................................................... 74
4.9.2 Services ......................................................................................................................................... 74
4.9.3 Construction contracts ...................................................................................................................... 74
4.9.4 Sale of electricity ............................................................................................................................. 74
4.10 Finance income and finance costs ...................................................................................................... 75
4.11 Income tax ..................................................................................................................................... 75
4.12 Earnings per share ........................................................................................................................... 76
4.13 Segment reporting ........................................................................................................................... 76
5. Determination of fair values .............................................................................................................. 77
5.1 Property, plant and equipment .......................................................................................................... 77
5.2 Inventories ..................................................................................................................................... 78
5.3 Trade and other receivables ............................................................................................................... 78
5.4 Non-derivative financial liabilities ....................................................................................................... 78
6. Financial risk management................................................................................................................ 79
6.1 Risk management framework ............................................................................................................ 79
6.2 Operational risk ............................................................................................................................... 79
6.3 Currency risk................................................................................................................................... 80
6.4 Credit risk ....................................................................................................................................... 80
6.5 Liquidity risk ................................................................................................................................... 81
6.6 Interest risk ................................................................................................................................... 81
7. Operating segments ......................................................................................................................... 82
8. Current assets held for sale ............................................................................................................... 88
9. Acquisitions of subsidiary and non-controlling interests; financial information for the joint ventures and
44
associates ................................................................................................................................................. 88
9.1 Establishment of new subsidiaries ...................................................................................................... 88
9.2 Acquisitions of subsidiaries ................................................................................................................ 88
9.3 Financial information for the joint ventures and associates .................................................................... 89
10. Revenue ......................................................................................................................................... 92
11. Cost of sales ................................................................................................................................... 92
11.1 Tax levy ......................................................................................................................................... 94
12. Other income .................................................................................................................................. 94
13. Other expenses ............................................................................................................................... 94
14. Administrative and personnel expenses .............................................................................................. 94
15. Finance income and finance costs ...................................................................................................... 95
16. Income tax expense ......................................................................................................................... 96
16.1 Income tax recognised in profit or loss ............................................................................................... 96
16.2 Income tax recognised in other comprehensive income ........................................................................ 96
16.3 Reconciliation of effective tax rate ..................................................................................................... 97
17. Property, plant and equipment .......................................................................................................... 98
18. Other investments ......................................................................................................................... 101
19. Deferred tax assets and liabilities..................................................................................................... 102
20. Inventories ................................................................................................................................... 104
21. Trade and other receivables ............................................................................................................ 104
22. Cash and cash equivalents .............................................................................................................. 106
23. Capital and reserves ...................................................................................................................... 106
24. Earnings per share ......................................................................................................................... 110
25. Loans and borrowings .................................................................................................................... 111
26. Trade and other payables ............................................................................................................... 113
27. Other long-term and short-term liabilities ......................................................................................... 114
27.1 Other long term liabilities ........................................................................................................... 114
27.2 Other short term liabilities .......................................................................................................... 114
27.3 Current tax liability .................................................................................................................... 114
27.4 Provisions ................................................................................................................................. 114
28. Financial instruments ..................................................................................................................... 115
28.1 Liquidity Risk ................................................................................................................................. 115
28.2 Credit risk ..................................................................................................................................... 116
28.3 Interest rate risk ........................................................................................................................... 117
28.4 Exchange rate risk ......................................................................................................................... 119
28.5 Tax levy risk ................................................................................................................................. 120
29. Related parties .............................................................................................................................. 122
45
29.1 Parent and ultimate controlling party................................................................................................ 122
30. Group entities ............................................................................................................................... 124
31. Subsequent events ........................................................................................................................ 129
32. Contingent assets and liabilities ...................................................................................................... 129
34. General ........................................................................................................................................ 133
35. Principles for the measurement of assets and liabilities and the determination of the result ..................... 133
36. Financial fixed assets ..................................................................................................................... 133
37. Loans ........................................................................................................................................... 137
38. Current assets ............................................................................................................................... 138
39 Shareholders’ equity ...................................................................................................................... 139
39.1 Reconciliation of movement in capital and reserves........................................................................ 139
39.2 Share capital and share premium ................................................................................................ 140
39.2.1 Ordinary shares ......................................................................................................................... 140
39.2.2 Unappropriated result ............................................................................................................... 140
39.2.3 Reconciliation of consolidated group equity with company equity .................................................... 140
40. Long-term liabilities ....................................................................................................................... 141
41. Current liabilities ........................................................................................................................... 141
42. Financial instruments ..................................................................................................................... 142
42.1 General .................................................................................................................................... 142
42.2 Fair value ................................................................................................................................ 142
43. Share in results from participating interests ...................................................................................... 142
44. Fees of the auditor ......................................................................................................................... 142
45. Related parties .............................................................................................................................. 143
45.1 Transactions with key management personnel ............................................................................... 143
45.1.1 Key management personnel compensation ................................................................................... 143
45.1.2 Key management personnel and director ...................................................................................... 143
45.1.3 Emoluments of directors and supervisory directors ........................................................................ 143
Other information .................................................................................................................................... 144
1. Emoluments of directors and supervisory directors............................................................................. 144
2. Provisions in the Articles of Association governing the appropriation of profit......................................... 144
3. Proposal for profit appropriation ...................................................................................................... 144
4. Subsequent events ........................................................................................................................ 144
5. Subsidiaries .................................................................................................................................. 144
6. Independent auditor’s report ........................................................................................................... 144
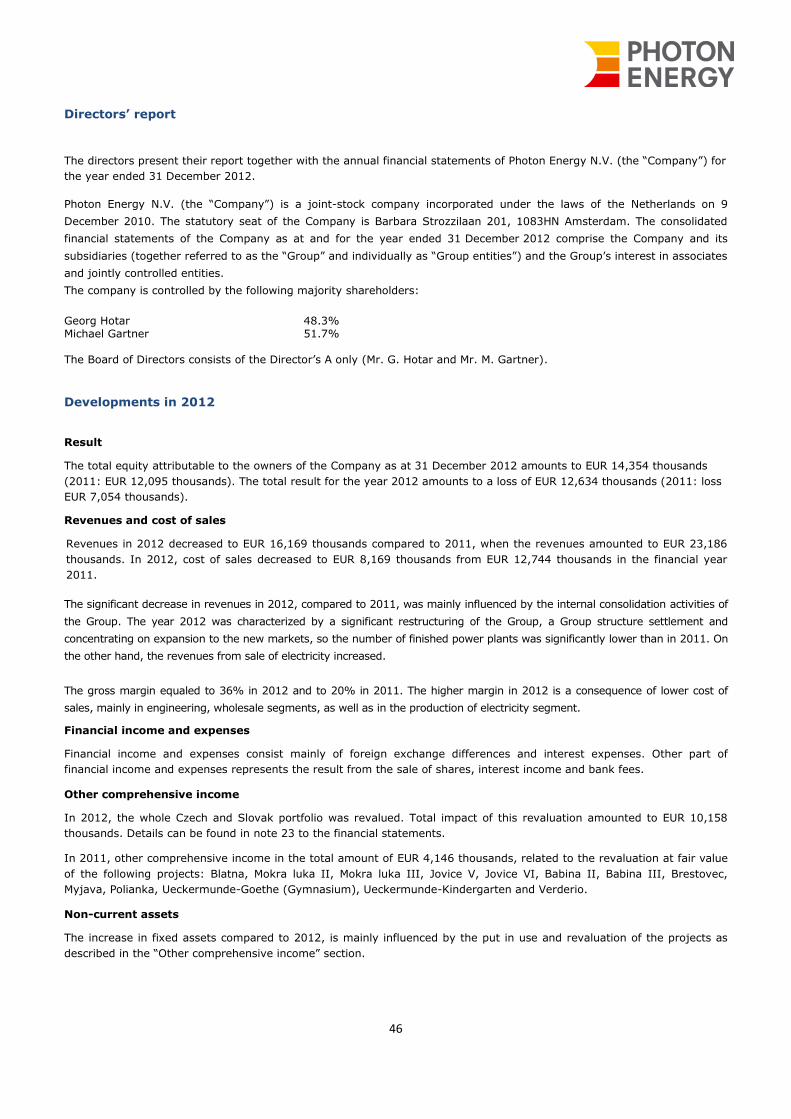
46
Directors’ report
The directors present their report together with the annual financial statements of Photon Energy N.V. (the “Company”) for
the year ended 31 December 2012.
Photon Energy N.V. (the “Company”) is a joint-stock company incorporated under the laws of the Netherlands on 9
December 2010. The statutory seat of the Company is Barbara Strozzilaan 201, 1083HN Amsterdam. The consolidated
financial statements of the Company as at and for the year ended 31 December 2012 comprise the Company and its
subsidiaries (together referred to as the “Group” and individually as “Group entities”) and the Group’s interest in associates
and jointly controlled entities.
The company is controlled by the following majority shareholders:
Georg Hotar 48.3% Michael Gartner 51.7% The Board of Directors consists of the Director’s A only (Mr. G. Hotar and Mr. M. Gartner).
Developments in 2012
Result
The total equity attributable to the owners of the Company as at 31 December 2012 amounts to EUR 14,354 thousands
(2011: EUR 12,095 thousands). The total result for the year 2012 amounts to a loss of EUR 12,634 thousands (2011: loss
EUR 7,054 thousands).
Revenues and cost of sales
Revenues in 2012 decreased to EUR 16,169 thousands compared to 2011, when the revenues amounted to EUR 23,186
thousands. In 2012, cost of sales decreased to EUR 8,169 thousands from EUR 12,744 thousands in the financial year
2011.
The significant decrease in revenues in 2012, compared to 2011, was mainly influenced by the internal consolidation activities of
the Group. The year 2012 was characterized by a significant restructuring of the Group, a Group structure settlement and
concentrating on expansion to the new markets, so the number of finished power plants was significantly lower than in 2011. On
the other hand, the revenues from sale of electricity increased.
The gross margin equaled to 36% in 2012 and to 20% in 2011. The higher margin in 2012 is a consequence of lower cost of
sales, mainly in engineering, wholesale segments, as well as in the production of electricity segment.
Financial income and expenses
Financial income and expenses consist mainly of foreign exchange differences and interest expenses. Other part of
financial income and expenses represents the result from the sale of shares, interest income and bank fees.
Other comprehensive income
In 2012, the whole Czech and Slovak portfolio was revalued. Total impact of this revaluation amounted to EUR 10,158
thousands. Details can be found in note 23 to the financial statements.
In 2011, other comprehensive income in the total amount of EUR 4,146 thousands, related to the revaluation at fair value
of the following projects: Blatna, Mokra luka II, Mokra luka III, Jovice V, Jovice VI, Babina II, Babina III, Brestovec,
Myjava, Polianka, Ueckermunde-Goethe (Gymnasium), Ueckermunde-Kindergarten and Verderio.
Non-current assets
The increase in fixed assets compared to 2012, is mainly influenced by the put in use and revaluation of the projects as
described in the “Other comprehensive income” section.
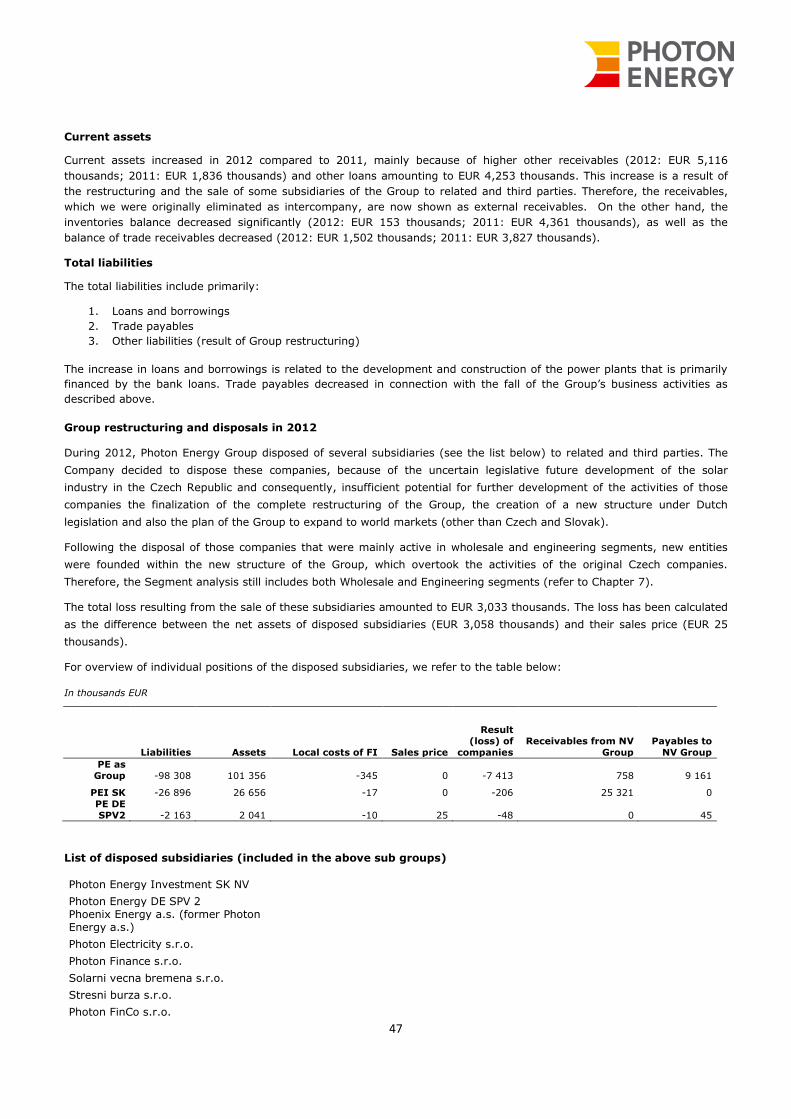
47
Current assets
Current assets increased in 2012 compared to 2011, mainly because of higher other receivables (2012: EUR 5,116
thousands; 2011: EUR 1,836 thousands) and other loans amounting to EUR 4,253 thousands. This increase is a result of
the restructuring and the sale of some subsidiaries of the Group to related and third parties. Therefore, the receivables,
which we were originally eliminated as intercompany, are now shown as external receivables. On the other hand, the
inventories balance decreased significantly (2012: EUR 153 thousands; 2011: EUR 4,361 thousands), as well as the
balance of trade receivables decreased (2012: EUR 1,502 thousands; 2011: EUR 3,827 thousands).
Total liabilities
The total liabilities include primarily:
1. Loans and borrowings
2. Trade payables
3. Other liabilities (result of Group restructuring)
The increase in loans and borrowings is related to the development and construction of the power plants that is primarily
financed by the bank loans. Trade payables decreased in connection with the fall of the Group’s business activities as
described above.
Group restructuring and disposals in 2012
During 2012, Photon Energy Group disposed of several subsidiaries (see the list below) to related and third parties. The
Company decided to dispose these companies, because of the uncertain legislative future development of the solar
industry in the Czech Republic and consequently, insufficient potential for further development of the activities of those
companies the finalization of the complete restructuring of the Group, the creation of a new structure under Dutch
legislation and also the plan of the Group to expand to world markets (other than Czech and Slovak).
Following the disposal of those companies that were mainly active in wholesale and engineering segments, new entities
were founded within the new structure of the Group, which overtook the activities of the original Czech companies.
Therefore, the Segment analysis still includes both Wholesale and Engineering segments (refer to Chapter 7).
The total loss resulting from the sale of these subsidiaries amounted to EUR 3,033 thousands. The loss has been calculated
as the difference between the net assets of disposed subsidiaries (EUR 3,058 thousands) and their sales price (EUR 25
thousands).
For overview of individual positions of the disposed subsidiaries, we refer to the table below:
In thousands EUR
Liabilities Assets Local costs of FI Sales price
Result
(loss) of
companies
Receivables from NV
Group
Payables to
NV Group
PE as
Group -98 308 101 356 -345 0 -7 413 758 9 161
PEI SK -26 896 26 656 -17 0 -206 25 321 0
PE DE
SPV2 -2 163 2 041 -10 25 -48 0 45
List of disposed subsidiaries (included in the above sub groups)
Photon Energy Investment SK NV
Photon Energy DE SPV 2 Phoenix Energy a.s. (former Photon Energy a.s.)
Photon Electricity s.r.o.
Photon Finance s.r.o.
Solarni vecna bremena s.r.o.
Stresni burza s.r.o.
Photon FinCo s.r.o.
48
Photon Energy Italia srl
Photon Engineering Italia srl
Golf Club Grygov s.r.o.
Photon Engineering Slovensko s.r.o.
Photon Engineering s.r.o.
Photon Import s.r.o.
Photon Trading s.r.o.
All the above mentioned receivables and payables were previously eliminated as they represented intercompany balances before
the sale out of the Group. Following the sale of these entities, this changed and such balances are now presented as receivables
from/payables to related and third parties.
All companies listed above, have been sold to the third parties, except for Photon Energy Group a.s (“PEAS”), which was
sold to an entity owned by the 2 shareholders’s of the Group. As a consequence, PEAS left the consolidation scope of
Photon Energy N.V. and became a sister company ultimately owned by the shareholders of the Group. We refer to the
below text for further details on this transaction. Consequently, balances with PEAS are presented as related party
balances as per 31 December 2012.
In December 2012, the following steps related to sale of Peas Group have been performed: 1 all shares of PE a.s. held by PENV were transferred to Minority Shareholders Photon Energy B.V. (MSBV), owned by the
shareholders through their holding entities: Solar Power and Solar Future (SP and SF) and were contributed as additional contribution in kind. No new shares of MSBV were issued and the value of contributed shares is regarded as a non-stipulated share premium.
2 PENV issued new shares with a nominal value of EUR 0.01 to its current shareholders, Solar Power and Solar Future (
the share capital has thus been increased to EUR 230 000 3 PENV transferred all shares it held in MSBV to SP and SF.
These steps mean that PE a.s. is not anymore the part of the PENV Group. Subsequently, Photon Energy a.s. has been
renamed with effective date as of 19. 12. 2012 to Phoenix Energy a.s.
Except for the parent company Photon Energy N.V, the sold entity Phoenix Energy a.s. (originally Photon Energy a.s. (“PEAS”))
also had minority shareholders. During the process of restructuring, where significant assets were transferred from PEAS Group
to PENV group, management committed itself to perform a share swap from PEAS to PENV, in order not to harm the rights of the
minority shareholders. Following the sale of this entity out of the Group, the minority share of Photon Energy a.s. (non-
controlling interest) has been transferred to Photon Energy N.V. in line with the common control principle (non-controlling
interest was transferred a level up, to the NV level).
MSBV, the Bidder, intended to acquire all shares currently owned by the Minority Shareholders in Phoenix Energy a.s. and in
return provides them with an opportunity to buy shares in Photon Energy N.V., in such a way that for each share sold within the
public tender offer, Minority Shareholders are entitled to buy one share in Photon Energy N.V. Alternatively, shareholders who
accept the tender offer and do not use their right to acquire shares in Photon Energy N.V., will be compensated in cash.
For details, refer to the Subsequent events chapter (description of share swap) and the Statement of changes in equity
(distribution of non-controlling interest to other equity components-this transaction is visible in the Statement of changes in
equity and shows the split of original non-controlling interest as gradually created within the history of the Group. After disposal
of PEAS, this non-controlling interest has been distributed within the adequate components of equity where it is attributable by
its substance).
49
Financial instruments and risk management
In 2012, financial instruments were only used to mitigate risks and were not used for trading purposes. We refer to the
notes in the financial statements for more details about the company’s financial instruments.
Principle risks
The Group has exposure to the following risks:
Credit risk,
Liquidity risk,
Market risk.
In the notes to the consolidated financial statements, information is included about the Group’s exposure to each of the
above risks, the Group’s objectives, policies and processes for measuring and managing risk, and the Group’s management
of capital.
Selected indicators
Debt to assets ratio (total liabilities/total assets)
2012: 0.87
2011: 0.83
Debt to equity ratio (total liabilities/shareholders’ equity)
2012: 6.95
2011: 7.01
Current ratio (current assets/current liabilities)
2012: 0.78
2011: 0.80
Debt to assets ratio increased in 2012 compared to 2011 due to higher indebtedness of the Company. Higher loans’
balances were used mainly for the financing of the project development, construction of power plants and market
expansion. The current ratio has slightly decreased, as well as debt to equity ratio.
Research and development
The Company does not perform any material research and development activities.
Personnel
During the year, the average number of staff employed by the company was 71 (2011: 66). Management expects that the
number of employees in 2013 will be approximately the same as in 2012.
From 1 January 2012 onwards the Board of Directors should endeavour to ensure that women represent at least 30% of its
directors. During 2012, the Board of the Company was represented by 2 male Directors and therefore the ratio of female
directors was below 30%. The composition of the Board is considered on a regular basis and if needed adjusted based on
the knowledge and experience of the Directors.
50
Strategy for 2013
The objective of the Group is the geographic expansion and diversification of the portfolio, in order to use its global
presence to minimize regional risk associated with fluctuations. The Group continuously monitors international
developments in the area of solar technology and on the financial markets. It particularly pays great deal of attention to
the development of subsidies for solar energy sector in individual countries. The expansion to countries such as Australia,
Canada, USA, and Turkey seems to be crucial in the light of current developments, as the Group believes such countries
could provide suitable environment for photovoltaic power plants on the basis of climatic preconditions (especially solar
radiation), existing infrastructure, possible project financing, and legal framework conditions. Other markets are analyzed
on continues basis.
In order to reduce dependence on government subsidies in the future, the Group’s strategy mainly targets portfolio
expansion to such markets that already apply Grid Parity, i.e. development of solar installations is also economically
feasible without government subsidies.
Apart from geographical diversification the Group intends to specialize in energy generation solutions providing hybrid-
system strategies and diesel-replacement solutions for energy-intensive industries, with the particular focus on segments
such as: mining, retail, agriculture telecoms and etc. The fuel price has an annual average increase of 7% and is
constantly changing, making it really difficult for those industries to have an accurate prediction on their operating costs.
In case of remote off-grid locations, where usually the irradiation levels are constantly high throughout the year, such
energy solutions allow the customers to reduce the fuel consumption up to 100%. In on-grid locations, the energy
efficiency solutions will drastically reduce the monthly electricity bill. There is no one single solution since every customer
has different needs, where the finance and the engineering world need to blend perfectly to deliver the solution our
customer needs. Photon Energy wants to position itself in the cutting edge of the industry, creating PV-based power
solutions with the integration of energy storage and/or diesel generators. The Group has developed different accurate
models for off-grid and on-grid system with the enough flexibility to adapt to different challenges that its customers face.
From mining, cement or telcom industries to agricultural remote locations, Photon Energy proposition to our customers is
increasing their corporate value with operating costs reduction, protection against fuel price hedging, ensure energy supply
and tackle environmental and local communities’ stewardship.
The Group intends also to become a leading global player providing operations and maintenance services for photovoltaic
investors, particularly on the well-established markets with significant installed photovoltaic capacities such as Germany,
Italy, Czech Republic and Slovakia. Further expansion of O&M services is foreseen in countries where the Group currently
develops and installs new PV power plants.
In order to facilitate market penetration, the Group will selectively cooperate with local partners, if necessary.
Market overview
Even though the strategy of Group targets the reduction of dependence on subsidy programs, the government support of
photovoltaic electricity is currently significant for the business activities of the Group.
The photovoltaic installations are supported in a number of countries, whereas the form of the government support varies
in a broad sense – both locally and regionally. For example, the standard form of support comprises laws that guarantee
fixed prices of energy produced from renewable sources (such as the Renewable Energy Act in Germany), on the basis of
which the electricity network operators are required to purchase electricity produced by solar installations at fixed prices.
Furthermore, loans with partial interest rate benefits are provided for the acquisition and development of photovoltaic
power plants.
The Group is aiming to, generate business development in Australia, North America and Turkey and other potential
markets. In these countries it aims to develop off-grid solutions and grid-parity solutions, which are based on Power
Purchase Agreements not dependent on feed-in-tariffs. New markets are entered through small-scale pilot projects and
through subsidiaries or partners in the respective countries. Projects are implemented only if the expected return is at
least 10 per cent. One of the key factors for entering new markets is a security in planning.
The Group is additionally developing hybrid power solutions aimed at customers in remote locations or regions currently
relying on Diesel generated power. With this technology Photon Energy wants to approach potential customers directly.
Additionally, the Operations division is expanding its Operations and Maintenance portfolio. In the past months it has
expanded to Italy and Belgium and is now active in six countries. One of the strategies is taking over customers with
power plants using components of the now defaulting companies.
51
Going concern
In 2013, the Company will be facing mainly the following challenges:
1 Penetration on new markets and securing the new projects
2 The company is dependent on external financing
External financing
In June 2012, Photon Energy N.V. agreed an amendment to the existing loan contract for the increase of the loan provided
to Photon Energy N.V. by a private financing company from the original EUR 6 million to EUR 8 million. The proceeds of the
increase of the loan of EUR 2 million were used to repay a loan provided to Photon Energy a.s. by the same party in the
amount of EUR 800 thousands. The interest rate remained the same as agreed with the borrower’s representatives and the
loan was originally due on 31 January 2013.
On 8th January 2013, PENV obtained a written confirmation from this private financing company, where the new terms
suggested by Management of PENV were accepted.
The newly agreed terms were the following:
- Repayment of EUR 500,000 of the loan principal;
- Repayment of EUR 1,500,000 of the loan principal per 31 March 2013;
- Repayment of the remaining loan principal of EUR 6,000,000 no later than 30 June 2013, with the option to repay
earlier per 30 April 2013 or 31 May 2013.
The company signed the respective amendment on 29th January 2013.
As of 31 March 2013, the Company repaid EUR 2,000,000 from the outstanding amount, so the outstanding balance as of
April 2013 equals to EUR 6,000,000.
Subsequently, Management of the Company has discussed with the representative of the private financing company the
next repayment date of 30 June 2013. Accordingly, a confirmation was obtained on 7 May 2013, which confirms that the
due date of loan will be prolonged till 31 December 2013.
Management is confident that it will be able to generate sufficient cash flow to repay this amount of EUR 6 million as per
31 December 2013 or to find alternatives with respect to this obligation. Currently, management is evaluating and
preparing multiple financing options.
The outstanding banking financing is paid in regular quarterly repayments. Both Czech and Slovak SPVs are able to repay
in accordance with the scheduled repayments from the cash flow generated from the electricity production.
Actual result and expected cash-flows 2013-2014
Net result of 2012 is primarily influenced by the significant internal restructuring performed in 2012 and the disposals of
subsidiaries as described above.
Significant components of the loss are VAT related interests (approx. EUR 1.5 mio), interest related to external non-
banking financing (approx. EUR 1 mio) and the loss related to sale of subsidiaries (together with result of the disposed
subsidiaries amounted to approximately EUR 8 mio). All the above mentioned components represent non-recurring items.
Additionally, the Group incurred higher administrative costs because of additional costs related to restructuring.
The latest cash-flow forecast for 2013 has been adjusted in line with the actual situation and management estimations of
the future development. The following inputs included in the model represent the main drivers of the plan:
Outputs:
1) Repayment of bank loans and loan from private financing company
2) Interest payments
52
3) Operational costs, incl. administrative, personnel, other
4) Trade payables
5) Investment costs
Inputs:
1) Electricity production revenues
2) O&M revenues
3) Trading, Engineering revenues
4) Refinancing of Slovak portfolio
Production revenues are based on the actual portfolio results based upon the previous 2 periods. Additionally, they include
also forecasted revenues from newly built power plants(expected development of 16 MW in 2013 and 40 MW in 2014).
These are expected to be developed and maintained in the own portfolio. O&M revenues are forecasted based on the
assumptions of a significant increase of the current portfolio, mainly in the Western European markets (e.g. Italy and
Germany) in approximately several tens of MW of new power plants under management. Photon Energy Operations is
expanding its O&M business in Italy by taking over service contracts (March 2013) for 8 power plants of 1 MWp each in the
Abruzzo region. Along with the existing contracts, Photon Energy Operations’ O&M services portfolio has now grown to
more than 73 MWp worldwide.
Trading and engineering revenues assume the acquisition of new projects to be developed either internally or externally.
Main markets are Australia, Turkey, Japan, USA (refer to Strategy section). Engineering revenues are based on the
assumption of development of 9,5 MW built in 2013 and 21 MW in 2014.
Based upon the above and in accordance with the strategy of the Company, management forecasts positive operational
cash flows for 2013.
Status of bond issuance
The bond issuance process of the subsidiary Photon Energy Investments N.V. was completed with the raised amount below
the original management estimations and has led to a reassessment of the investment strategy for the following months.
The proceeds from bond are intended to be used for further investment in the new projects.
However, the bond is open for trading on the market and therefore additional proceedings could be expected during the
whole period (1 year from listing).
Current development of the projects
As of April 2013, the Company has connected two projects in Australia- Fyshwick and Symonston. The capacity of
Symonston project is 144 kWp and capacity of Fyshwick project is 140 kWp.
Project Symonston is going to be sold to a third party within the year 2013. Project Fyshwick was sold in April 2013, the
payment will be received in three parts, the first part (85%) was received on 16 April 2013 (EUR 360 thousands). Another
10% will be received after the achievement of the planned production and 5% is retention to be received in 12 months
after connection. The contribution of these sales to the free cash flow amounts to EUR approximately 123 thousands in
2013.
Photon Energy Australia also continues in new tender processes for building power plants with a total installed capacity of
20MW, the final decision of the respective authorities is expected to be taken within 2nd quarter of 2013.
In addition to the above mentioned, an analysis of the Turkish, Japanese and other markets is currently performed with
the goal to identify the best investment opportunities, enabling further development of the Group.
Czech tax levy
The current Czech tax levy equals to 26% of revenues from the sale of electricity in power plants located in the Czech
Republic and is, based on the current legislation, applicable for 2011-2013.
At this moment, Management of the Group does not have any trustworthy or confirmed information about the future
53
decision of Czech Government on the prolongation of the Czech tax levy. Any formal binding decision has not been taken
so far.
For our analysis of the potential impact of prolongation of the tax levy, refer to the sensitivity analysis in chapter 28.5.
Management statement
In preparing these accounts on a going concern basis, management used their best estimates to forecast cash movements
over the next 12 months from the date of these accounts. However, as per today, management is of the opinion that a
material uncertainty exists with respect to going concern. Based on the cash-flow projections prepared for years 2013-
2014 (as described in detail above) and our expectation that a solution will be found to replace the external financing,
management believes that it remains appropriate to prepare the financial statements on a going concern basis. However,
these projections are based on assumptions including values and timing of expected liabilities settlement, generating
alternative financing with respect to the financing provided by the private financing company and possible Czech tax law
changes and therefore is subject to the material uncertainties aforementioned.
Subsequent events
On 6 February 2013, Photon Energy Operations NV sold its share in Photon Management s.r.o. for the sales price
of EUR 8 thousands
CZK 200 thousands to a third party. However as of the date of the sale, all activities of the Company had already
been transferred to newly founded companies within the Group.
On 14 February 2013, Photon Management s.r.l. has been renamed into “Photon Energy Operations IT s.r.l. and
its legal seat has been transferred to Milano, Largo Richini 6.
Photon Energy Investments NV issued in March 2013 a bond for the period of 5 years on the non-regulated part
of the Frankfurt stock exchange. The bond coupon is 8% p.a. and is paid quarterly.
In March 2013, Photon Energy Operations is expanding its O&M business in Italy by taking over service contracts
(March 2013) for 8 power plants of 1 MWp each in the Abruzzo region. Along with the existing contracts Photon
Energy Operations’ O&M services portfolio has now grown to more than 73 MWp worldwide.
On 19 April 2013, the Company announced the process of a share swap to the minority shareholders of Phoenix
Energy a.s.( originally Photon Energy a.s. sold out of the Group at the end of 2012) . Those minority shareholders
are offered to exchange their shares for shares of Photon Energy N.V. in the share one to one. The offer period
will last one month as of the announcement on 19 April 2013 and after formalization of this process, Photon
Energy N.V. will be listed in NewConnect, a non-regulated financing and trading platform organized by the
Warsaw Stock Exchange, as well and its shares will be publicly traded.
On 7 May 2013, the group obtained confirmation from the private financing company about the prolongation of
the due date of the provided loan from 30 June 2013 till 31 December 2013.
Management is not aware of any other significant subsequent events per the date of these financial statements.
Amsterdam, 17 May 2013 The Board of Directors: ____________________________ ____________________________
Michael Gartner, Director Georg Hotar, Director
54
Photon Energy N.V.
Consolidated Financial Statements for the year ended 31 December 2012
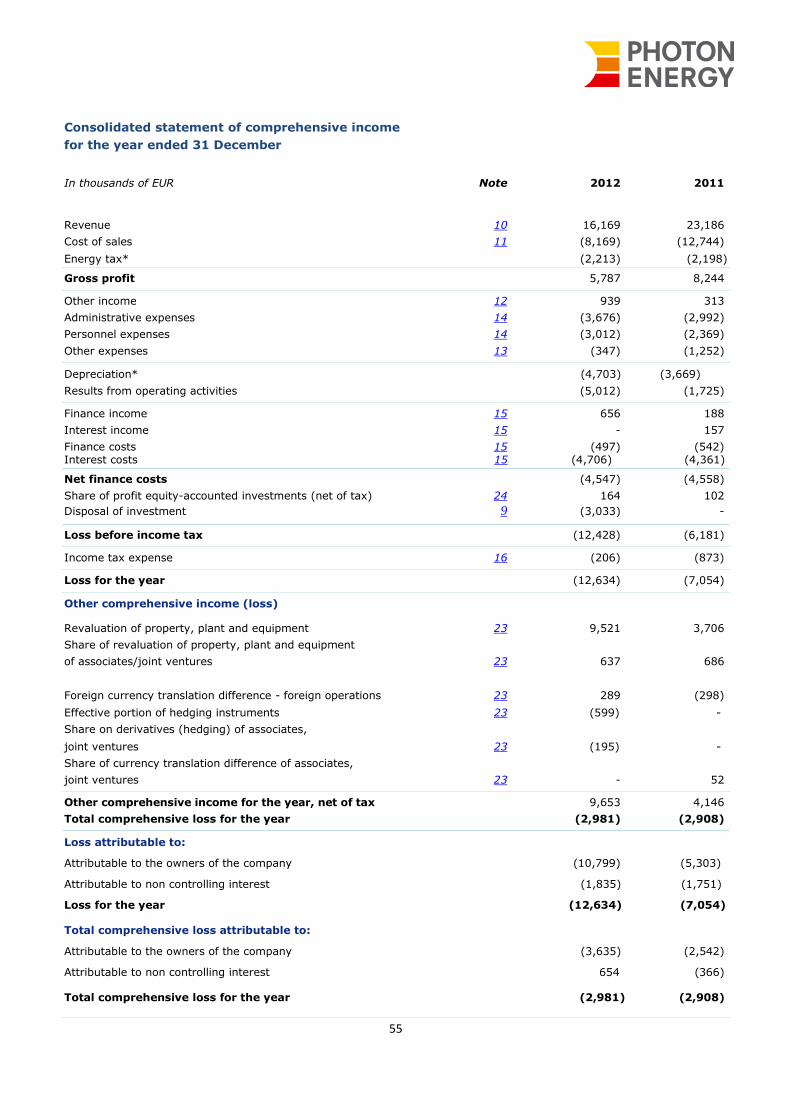
55
Consolidated statement of comprehensive income
for the year ended 31 December
In thousands of EUR Note 2012 2011
Revenue 10 16,169 23,186
Cost of sales 11 (8,169) (12,744)
Energy tax* (2,213) (2,198)
Gross profit 5,787 8,244
Other income 12 939 313
Administrative expenses 14 (3,676) (2,992)
Personnel expenses 14 (3,012) (2,369)
Other expenses 13 (347) (1,252)
Depreciation* (4,703) (3,669)
Results from operating activities (5,012) (1,725)
Finance income 15 656 188
Interest income 15 - 157
Finance costs 15 (497) (542) Interest costs 15 (4,706) (4,361)
Net finance costs (4,547) (4,558)
Share of profit equity-accounted investments (net of tax) 24 164 102
Disposal of investment 9 (3,033) -
Loss before income tax (12,428) (6,181)
Income tax expense 16 (206) (873)
Loss for the year (12,634) (7,054)
Other comprehensive income (loss)
Revaluation of property, plant and equipment 23 9,521 3,706
Share of revaluation of property, plant and equipment
of associates/joint ventures 23 637 686
Foreign currency translation difference - foreign operations 23 289 (298)
Effective portion of hedging instruments 23 (599) -
Share on derivatives (hedging) of associates,
joint ventures 23 (195) -
Share of currency translation difference of associates,
joint ventures 23 - 52
Other comprehensive income for the year, net of tax 9,653 4,146
Total comprehensive loss for the year (2,981) (2,908)
Loss attributable to:
Attributable to the owners of the company (10,799) (5,303)
Attributable to non controlling interest (1,835) (1,751)
Loss for the year (12,634) (7,054)
Total comprehensive loss attributable to:
Attributable to the owners of the company (3,635) (2,542)
Attributable to non controlling interest 654 (366)
Total comprehensive loss for the year (2,981) (2,908)

56
Earnings per share
Earnings per share (basic and diluted) (in EUR) 24 (0.469) (1.152)
Total comprehensive income per share (in EUR) 24 (0.158) (0.552)
* Energy tax has been moved below cost of sales and 2011 was adjusted accordingly. Depreciation was taken out of cost of sales and it is
presented separately, year 2011 was adjusted accordingly.
The notes on pages 21 to 90 are an integral part of these financial statements.
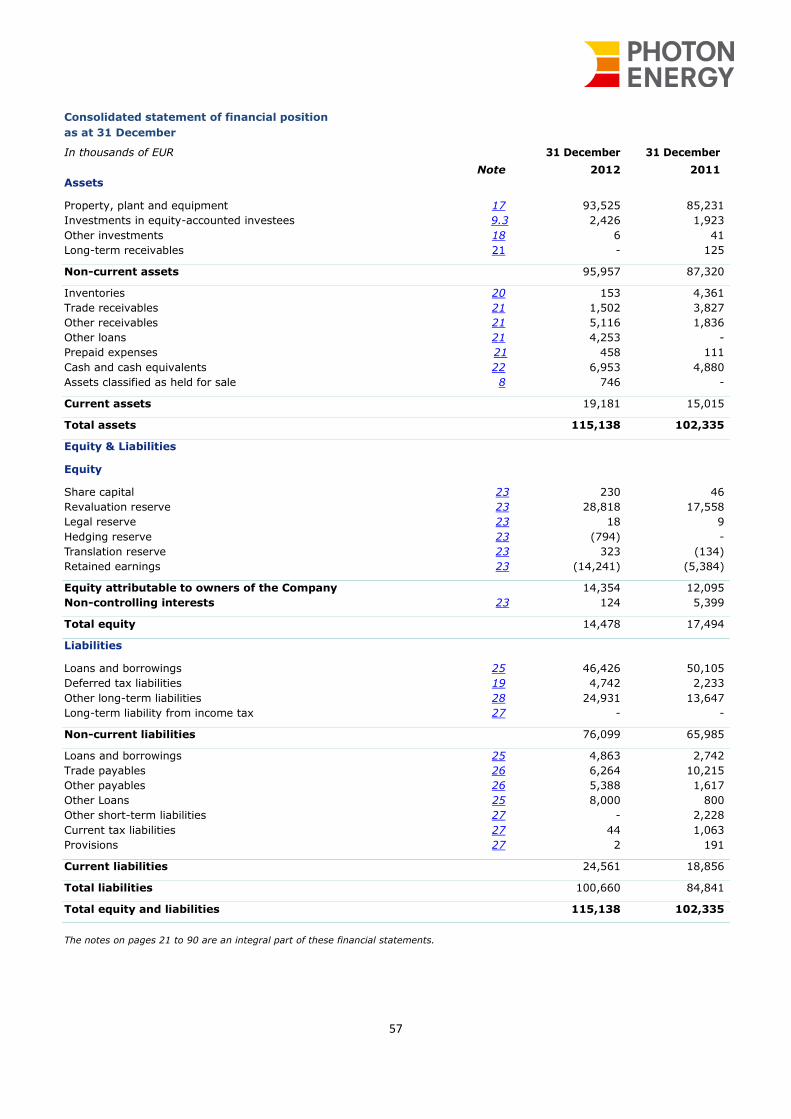
57
Consolidated statement of financial position
as at 31 December
In thousands of EUR 31 December 31 December
Note 2012 2011 Assets
Property, plant and equipment 17 93,525 85,231
Investments in equity-accounted investees 9.3 2,426 1,923
Other investments 18 6 41
Long-term receivables 21 - 125
Non-current assets 95,957 87,320
Inventories 20 153 4,361
Trade receivables 21 1,502 3,827
Other receivables 21 5,116 1,836
Other loans 21 4,253 -
Prepaid expenses 21 458 111
Cash and cash equivalents 22 6,953 4,880
Assets classified as held for sale 8 746 -
Current assets 19,181 15,015
Total assets 115,138 102,335
Equity & Liabilities
Equity
Share capital 23 230 46
Revaluation reserve 23 28,818 17,558
Legal reserve 23 18 9
Hedging reserve 23 (794) -
Translation reserve 23 323 (134)
Retained earnings 23 (14,241) (5,384)
Equity attributable to owners of the Company 14,354 12,095
Non-controlling interests 23 124 5,399
Total equity 14,478 17,494
Liabilities
Loans and borrowings 25 46,426 50,105
Deferred tax liabilities 19 4,742 2,233
Other long-term liabilities 28 24,931 13,647
Long-term liability from income tax 27 - -
Non-current liabilities 76,099 65,985
Loans and borrowings 25 4,863 2,742
Trade payables 26 6,264 10,215
Other payables 26 5,388 1,617
Other Loans 25 8,000 800
Other short-term liabilities 27 - 2,228
Current tax liabilities 27 44 1,063
Provisions 27 2 191
Current liabilities 24,561 18,856
Total liabilities 100,660 84,841
Total equity and liabilities 115,138 102,335
The notes on pages 21 to 90 are an integral part of these financial statements.
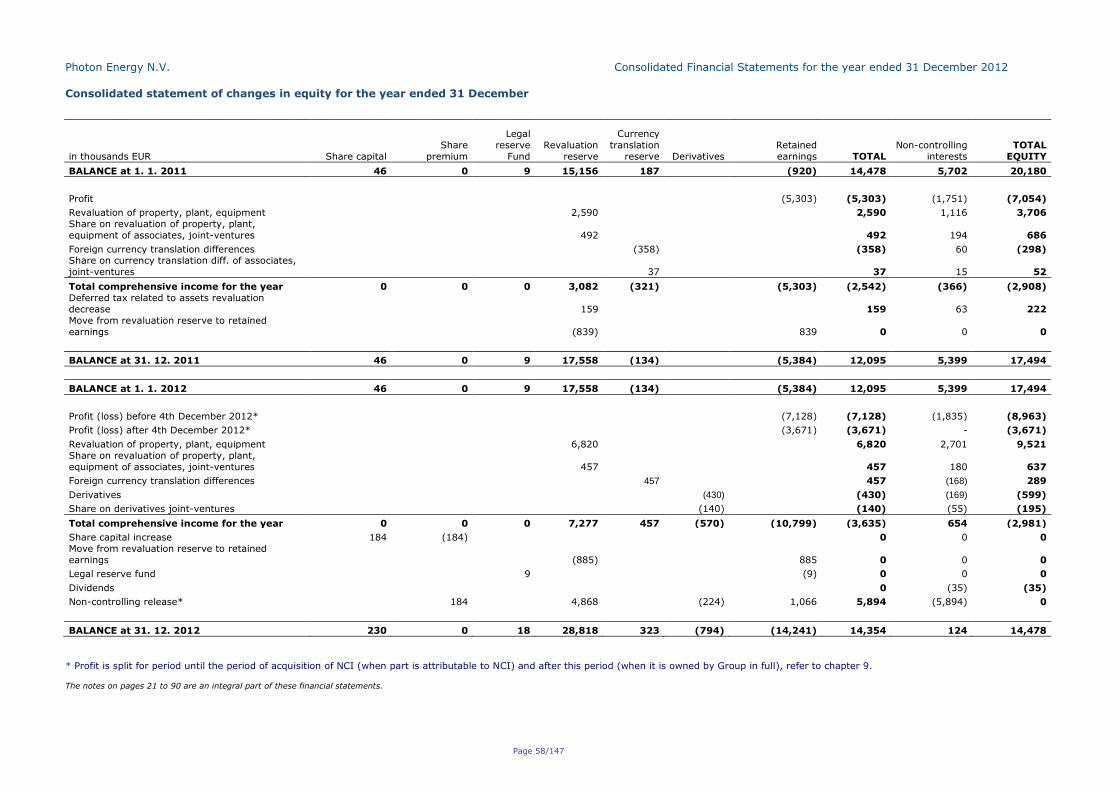
Photon Energy N.V. Consolidated Financial Statements for the year ended 31 December 2012
Page 58/147
Consolidated statement of changes in equity for the year ended 31 December
in thousands EUR Share capital
Share
premium
Legal
reserve
Fund
Revaluation
reserve
Currency
translation
reserve Derivatives
Retained
earnings TOTAL
Non-controlling
interests
TOTAL
EQUITY
BALANCE at 1. 1. 2011 46 0 9 15,156 187 (920) 14,478 5,702 20,180
Profit
(5,303) (5,303) (1,751) (7,054)
Revaluation of property, plant, equipment
2,590
2,590 1,116 3,706
Share on revaluation of property, plant,
equipment of associates, joint-ventures
492
492 194 686
Foreign currency translation differences
(358)
(358) 60 (298) Share on currency translation diff. of associates,
joint-ventures 37 37 15 52
Total comprehensive income for the year 0 0 0 3,082 (321)
(5,303) (2,542) (366) (2,908)
Deferred tax related to assets revaluation
decrease
159
159 63 222
Move from revaluation reserve to retained
earnings
(839)
839 0 0 0
BALANCE at 31. 12. 2011 46 0 9 17,558 (134) (5,384) 12,095 5,399 17,494
BALANCE at 1. 1. 2012 46 0 9 17,558 (134) (5,384) 12,095 5,399 17,494
Profit (loss) before 4th December 2012*
(7,128) (7,128) (1,835) (8,963)
Profit (loss) after 4th December 2012*
(3,671) (3,671) - (3,671)
Revaluation of property, plant, equipment
6,820
6,820 2,701 9,521
Share on revaluation of property, plant,
equipment of associates, joint-ventures
457
457 180 637
Foreign currency translation differences
457
457 (168) 289
Derivatives
(430)
(430) (169) (599)
Share on derivatives joint-ventures (140) (140) (55) (195)
Total comprehensive income for the year 0 0 0 7,277 457 (570) (10,799) (3,635) 654 (2,981)
Share capital increase 184 (184)
0 0 0
Move from revaluation reserve to retained
earnings
(885)
885 0 0 0
Legal reserve fund
9
(9) 0 0 0
Dividends
0 (35) (35)
Non-controlling release*
184
4,868
(224) 1,066 5,894 (5,894) 0
BALANCE at 31. 12. 2012 230 0 18 28,818 323 (794) (14,241) 14,354 124 14,478
* Profit is split for period until the period of acquisition of NCI (when part is attributable to NCI) and after this period (when it is owned by Group in full), refer to chapter 9.
The notes on pages 21 to 90 are an integral part of these financial statements.
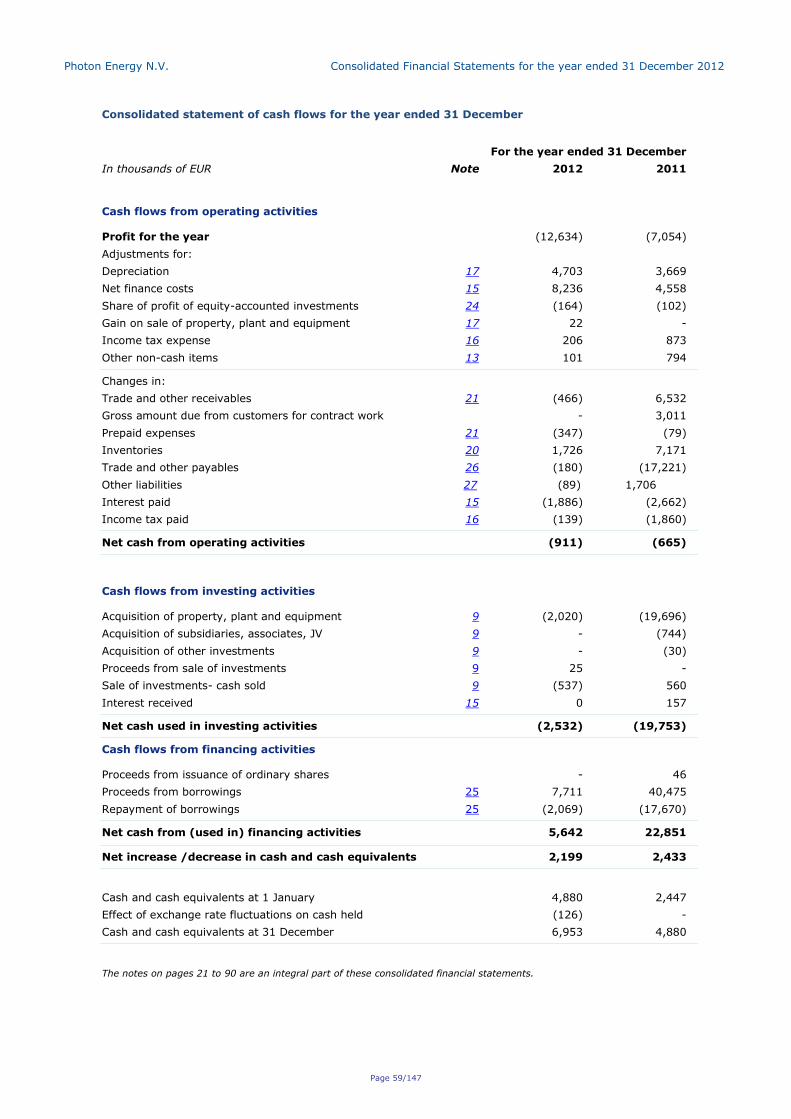
Photon Energy N.V. Consolidated Financial Statements for the year ended 31 December 2012
Page 59/147
Consolidated statement of cash flows for the year ended 31 December
For the year ended 31 December
In thousands of EUR Note 2012 2011
Cash flows from operating activities
Profit for the year (12,634) (7,054)
Adjustments for:
Depreciation 17 4,703 3,669
Net finance costs 15 8,236 4,558
Share of profit of equity-accounted investments 24 (164) (102)
Gain on sale of property, plant and equipment 17 22 -
Income tax expense 16 206 873
Other non-cash items 13 101 794
Changes in:
Trade and other receivables 21 (466) 6,532
Gross amount due from customers for contract work - 3,011
Prepaid expenses 21 (347) (79)
Inventories 20 1,726 7,171
Trade and other payables 26 (180) (17,221)
Other liabilities 27 (89) 1,706
Interest paid 15 (1,886) (2,662)
Income tax paid 16 (139) (1,860)
Net cash from operating activities (911) (665)
Cash flows from investing activities
Acquisition of property, plant and equipment 9 (2,020) (19,696)
Acquisition of subsidiaries, associates, JV 9 - (744)
Acquisition of other investments 9 - (30)
Proceeds from sale of investments 9 25 -
Sale of investments- cash sold 9 (537) 560
Interest received 15 0 157
Net cash used in investing activities (2,532) (19,753)
Cash flows from financing activities
Proceeds from issuance of ordinary shares - 46
Proceeds from borrowings 25 7,711 40,475
Repayment of borrowings 25 (2,069) (17,670)
Net cash from (used in) financing activities 5,642 22,851
Net increase /decrease in cash and cash equivalents 2,199 2,433
Cash and cash equivalents at 1 January 4,880 2,447
Effect of exchange rate fluctuations on cash held (126) -
Cash and cash equivalents at 31 December 6,953 4,880
The notes on pages 21 to 90 are an integral part of these consolidated financial statements.
Photon Energy N.V. Consolidated Financial Statements for the year ended 31 December 2012
Notes to the consolidated financial statements
Page 60/147
1. Reporting entity
Photon Energy N.V. (“Photon Energy” or the “Company”) is a joint-stock company incorporated under the laws of
Netherlands on 9 December 2010. The statutory seat of the Company is Barbara Strozzilaan 201, 1083HN Amsterdam. The
consolidated financial statements of the Company as at and for the year ended 31 December 2012 comprise the Company
and its subsidiaries (together referred to as the “Group” and individually as “Group entities”) and the Group’s interest in
associates and jointly controlled entities.
The Group is primarily engaged in the development of photovoltaic power plants. This activity involves securing suitable
sites by purchase or long-term lease, obtaining all licenses and permits, the design, installation of photovoltaic equipment,
financing, operations and maintenance. Photon Energy pursues a comprehensive strategy of focusing both on green-field
and rooftop installations while trying to cover the largest possible part of the value chain and lifecycle of the power plant.
2. Basis of preparation
2.1 Statement of compliance
The consolidated financial statements have been prepared in accordance with International Financial Reporting Standards
(IFRSs) as adopted by the European Union (“EU IFRSs”) and title 9 of the Netherlands Civil code. It represents the
international accounting standards adopted in the form of European Commission Regulations in accordance with Regulation
(EC) No 1606/2002 of the European Parliament and of the Council.
The consolidated financial statements were authorised for issue by the Board of Directors on 17 May 2013.
Going concern
In 2013, the Company will be facing mainly the following challenges:
1 Penetration on new markets and securing the new projects
2 The company is dependent on external financing
External financing
In June 2012, Photon Energy N.V. agreed an amendment to the existing loan contract for the increase of the loan provided
to Photon Energy N.V. by a private financing company from the original EUR 6 million to EUR 8 million. The proceeds of the
increase of the loan of EUR 2 million were used to repay a loan provided to Photon Energy a.s. by the same party in the
amount of EUR 800 thousands. The interest rate remained the same as agreed with the borrower’s representatives and the
loan was originally due on 31 January 2013.
On 8th January 2013, PENV obtained a written confirmation from this private financing company, where the new terms
suggested by Management of PENV were accepted.
The newly agreed terms were the following:
- Repayment of EUR 500,000 of the loan principal;
- Repayment of EUR 1,500,000 of the loan principal per 31 March 2013;
- Repayment of the remaining loan principal of EUR 6,000,000 no later than 30 June 2013, with the option to repay
earlier per 30 April 2013 or 31 May 2013.
The company signed the respective amendment on 29th January 2013.
As of 31 March 2013, the Company repaid EUR 2,000,000 from the outstanding amount, so the outstanding balance as of
April 2013 equals to EUR 6,000,000.
Subsequently, Management of the Company has discussed with the representative of the private financing company the
Photon Energy N.V. Consolidated Financial Statements for the year ended 31 December 2012
Notes to the consolidated financial statements
Page 61/147
next repayment date of 30 June 2013. Accordingly, a confirmation was obtained on 7 May 2013, which confirms that the
due date of loan will be prolonged till 31 December 2013.
Management is confident that it will be able to generate sufficient cash flow to repay this amount of EUR 6 million as per
31 December 2013 or to find alternatives with respect to this obligation. Currently, management is evaluating and
preparing multiple financing options.
The outstanding banking financing is paid in regular quarterly repayments. Both Czech and Slovak SPVs are able to repay
in accordance with the scheduled repayments from the cash flow generated from the electricity production.
Actual result and expected cash-flows 2013-2014
Net result of 2012 is primarily influenced by the significant internal restructuring performed in 2012 and the disposals of
subsidiaries as described above.
Significant components of the loss are VAT related interests (approx. EUR 1.5 mio), interest related to external non-
banking financing (approx. EUR 1 mio) and the loss related to sale of subsidiaries (together with result of the disposed
subsidiaries amounted to approximately EUR 8 mio). All the above mentioned components represent non-recurring items.
Additionally, the Group incurred higher administrative costs because of additional costs related to restructuring.
The latest cash-flow forecast for 2013 has been adjusted in line with the actual situation and management estimations of
the future development. The following inputs included in the model represent the main drivers of the plan:
Outputs:
6) Repayment of bank loans and loan from private financing company
7) Interest payments
8) Operational costs, incl. administrative, personnel, other
9) Trade payables
10) Investment costs
Inputs:
5) Electricity production revenues
6) O&M revenues
7) Trading, Engineering revenues
8) Refinancing of Slovak portfolio
Production revenues are based on the actual portfolio results based upon the previous 2 periods. Additionally, they include
also forecasted revenues from newly built powerplants(expected development of 16 MW in 2013 and 40 MW in 2014).
These are expected to be developed and maintained in the own portfolio. O&M revenues are forecasted based on the
assumptions of a significant increase of the current portfolio, mainly in the Western European markets (e.g. Italy and
Germany) in approximately several tens of MW of new powerplants under management. Photon Energy Operations is
expanding its O&M business in Italy by taking over service contracts (March 2013) for 8 power plants of 1 MWp each in the
Abruzzo region. Along with the existing contracts, Photon Energy Operations’ O&M services portfolio has now grown to
more than 73 MWp worldwide.
Trading and engineering revenues assume the acquisition of new projects to be developed either internally or externally.
Main markets are Australia, Turkey, Japan, USA (refer to Strategy section). Engineering revenues are based on the
assumption of development of 9,5 MW built in 2013 and 21 MW in 2014.
Based upon the above and in accordance with the strategy of the Company, management forecasts positive operational
cash flows for 2013.
Status of bond issuance
The bond issuance process of the subsidiary Photon Energy Investments N.V. was completed with the raised amount below
the original management estimations and has led to a reassessment of the investment strategy for the following months.
Photon Energy N.V. Consolidated Financial Statements for the year ended 31 December 2012
Notes to the consolidated financial statements
Page 62/147
The proceeds from bond are intended to be used for further investment in the new projects.
However, the bond is open for trading on the market and therefore additional proceedings could be expected during the
whole period (1 year from listing).
Current development of the projects
As of April 2013, the Company has connected two projects in Australia- Fyshwick and Symonston. The capacity of
Symonston project is 144 kWp and capacity of Fyshwick project is 140 kWp.
Project Symonston is going to be sold to a third party within the year 2013. Project Fyshwick was sold in April 2013, the
payment will be received in three parts, the first part (85%) was received on 16 April 2013 (EUR 360 thousands). Another
10% will be received after the achievement of the planned production and 5% is retention to be received in 12 months
after connection. The contribution of these sales to the free cash flow amounts to EUR approximately 123 thousands in
2013.
Photon Energy Australia also continues in new tender processes for building power plants with a total installed capacity of
20MW, the final decision of the respective authorities is expected to be taken within 2nd quarter of 2013.
In addition to the above mentioned, an analysis of the Turkish, Japanese and other markets is currently performed with
the goal to identify the best investment opportunities, enabling further development of the Group.
Czech tax levy
The current Czech tax levy equals to 26% of revenues from the sale of electricity in power plants located in the Czech
Republic and is, based on the current legislation, applicable for 2011-2013.
At this moment, Management of the Group does not have any trustworthy or confirmed information about the future
decision of Czech Government on the prolongation of the Czech tax levy. Any formal binding decision has not been taken
so far.
For our analysis of the potential impact of prolongation of the tax levy, refer to the sensitivity analysis in chapter 28.5.
Management statement
In preparing these accounts on a going concern basis, management used their best estimates to forecast cash movements
over the next 12 months from the date of these accounts. However, as per today, management is of the opinion that a
material uncertainty exists with respect to going concern. Based on the cash-flow projections prepared for years 2013-
2014 (as described in detail above) and our expectation that a solution will be found to replace the external financing,
management believes that it remains appropriate to prepare the financial statements on a going concern basis. However,
these projections are based on assumptions including values and timing of expected liabilities settlement, generating
alternative financing with respect to the financing provided by the private financing company and possible Czech tax law
changes and therefore is subject to the material uncertainties aforementioned.
2.2 Basis of measurement
The consolidated financial statements have been prepared on the historical cost basis except for the following material
items in the statement of financial position:
Property, plant and equipment - photovoltaic power plants are measured at revalued amounts (for revaluation
details refer to the note 23)
Investments in equity instruments are measured at fair value (for revaluation details refer to the 9.3 )
2.3 Functional currency
These financial statements are presented in EUR.
Photon Energy N.V. Consolidated Financial Statements for the year ended 31 December 2012
Notes to the consolidated financial statements
Page 63/147
The functional currencies used in the Group are CZK for Czech subsidiaries; EUR for Dutch, Italian, German and Slovak
companies and AUD for Australian subsidiaries. All financial information presented in EUR has been rounded to the nearest
thousand.
2.4 Use of estimates and judgments
The preparation of the consolidated financial statements in conformity with EU IFRSs requires management to make
judgements, estimates and assumptions that affect the application of accounting policies and the reported amounts of
assets, liabilities, income and expenses. Actual results may differ from these estimates.
Estimates and underlying assumptions are reviewed on an ongoing basis. Revisions to accounting estimates are recognised
in the period in which the estimates are revised and in any future periods affected.
Information about assumptions and estimation uncertainties that have a significant risk of resulting in a material
adjustment within the next financial year are included in the following notes:
Note 5.1 – key assumptions used in discounted cash flow projections related to the valuation of the photovoltaic
power plants
Include Investments in equity instruments as well
Note 28.2 – professional judgment and internal knowledge of customer related to the creation of the allowance
for bad and doubtful debts
Photon Energy N.V. Consolidated Financial Statements for the year ended 31 December 2012
Notes to the consolidated financial statements
Page 64/147
3. Application of new and revised EU IFRSs
3.1 New and revised EU IFRSs affecting amounts reported in the current year (and/or prior years)
The following new and revised EU IFRSs have been applied in the current period and have affected the amounts reported
in the financial statements.
IAS 1 Presentation of financial statements
The amendments: - Preserve the amendments made to IAS 1 in 2007 to require profit or loss and OCI to be presented together,
i.e. either as a single 'statement of profit or loss and comprehensive income', or a separate 'statement of profit
or loss' and a 'statement of comprehensive income' – rather than requiring a single continuous statement as
was proposed in the exposure draft
- Require entities to group items presented in OCI based on whether they are potentially reclassifiable to profit
or loss subsequently. i.e. those that might be reclassified and those that will not be reclassified
- Require tax associated with items presented before tax to be shown separately for each of the two groups of
OCI items (without changing the option to present items of OCI either before tax or net of tax).
IAS 24 Related parties’ disclosures
Revised standard is binding since 1 January 2011. It adjusted the definition of the related party, when the associates are
considered as related party in relation to the parent company and also to its subsidiary. Two associates of the one parent
company are not considered to be related parties. Clarifies the definition of related party. Include an explicit requirement
to disclose commitments involving related parties.
IFRS 7 Financial instrument: disclosure
Revised standard aimed to simplify and improve the information presented by the accounting unit, including decrease the
volume of data about the collaterals and adjust the qualitative information to provide better basis for the quantitative
information.
3.2 New and revised IFRSs in issue but not yet effective
The Group has not applied the following new and revised EU IFRSs that have been issued but are not yet effective (dates
in brackets shows effective date):
- Amendments to IAS 32 - Offsetting Financial Assets and Financial Liabilities (01/01/14);
- Amendments to IFRS 10, IFRS 11 and IFRS 12 Consolidated Financial Statements, Joint Arrangements and
Disclosure of Interests in Other Entities: Transition Guidance (01/01/13);
- Amendments to IFRS 7 - Disclosures—Offsetting Financial
- Assets and Financial Liabilities (01/01/2013);
- IAS 28 Investments in Associates and Joint Ventures (amended 2011) (01/01/2013);
- IFRS 10; IFRS 11; IFRS 12; IFRS 13 (01/01/2013);
The Group does not plan to adopt these standards early and the extent of the impact has not been determined as
management believes is will not have a significant impact.
Photon Energy N.V. Consolidated Financial Statements for the year ended 31 December 2012
Notes to the consolidated financial statements
Page 65/147
4. Significant accounting policies
The accounting policies set out below have been applied consistently to all periods presented in these consolidated
financial statements, and have been applied consistently by Group entities.
4.1 Basis of consolidation
The consolidated financial statements incorporate the financial statements of the Company and entities (including special
purpose entities) controlled by the Company (its subsidiaries). Control is achieved when the Company has the power to
govern the financial and operating policies of an entity so as to obtain benefits from its activities. In assessing control, the
Group takes into consideration potential voting rights that currently are exercisable.
4.1.1 Business combinations
Acquisition of businesses is accounted for using the acquisition method. The consideration transferred in a business
combination is measured at fair value, which is calculated as the sum of the acquisition date fair values of the assets
transferred by the Group, liabilities incurred by the Group to the former owners of the acquiree and the equity interests
issued by the Group in exchange for control of the acquiree. Acquisition related costs are recognized in profit or loss as
incurred.
Also refer to note 4.7.2 for the explanation of accounting for goodwill.
Transactions under common control are defined those operations arising from transfer of interests among the Company
and all other entities that are under the control of the shareholder(s). The assets and liabilities acquired through a
contribution in kind from the shareholder, are considered as an under common control transaction and therefore their
values in the Company financial statements have been performed in continuity to their values included in the last Parent
Company Photon Energy a.s. consolidated financial statements. Consequently, the differences needed to align the value of
the subsidiary, as recorded in the Company financial statements, to the value as recorded in the last Parent Company
consolidated financial statements, have been recognized as differences in the retained earnings. Further reference is made
to note 1 and note 23.
4.1.2 Subsidiaries
Subsidiaries are entities controlled by the Group. The financial statements of subsidiaries are included in the consolidated
financial statements from the date that control commences until the date that control ceases.
Income and expenses of subsidiaries acquired or disposed of during the year are included in the consolidated statement of
comprehensive income from the effective date of acquisition and up to the effective date of disposal, as appropriate. Total
comprehensive income of subsidiaries is attributed to the owners of the Company and to the non-controlling interests even if
doing so causes the non-controlling interests to have a deficit balance.
When necessary, adjustments are made to the financial statements of subsidiaries to bring their accounting policies into
line with Group accounting policies.
4.1.3 Special purpose entities
The Group includes special purpose entities (SPEs). The Group does not have any direct or indirect shareholdings in these
entities. An SPE is consolidated if, based on an evaluation of the substance of its relationship with the Group and the SPE’s
risks and rewards, the Group concludes that it controls the SPE. SPEs controlled by the Group were established under
terms that impose strict limitations on the decision-making powers of the SPEs’ management and that result in the Group
receiving the majority of the benefits related to the SPEs’ operations and net assets, being exposed to the majority of risks
Photon Energy N.V. Consolidated Financial Statements for the year ended 31 December 2012
Notes to the consolidated financial statements
Page 66/147
incident to the SPEs’ activities, and retaining the majority of the residual or ownership risks related to the SPEs or their
assets.
SPEs currently include entities owned by Raiffeisen – Leasing Real Estate, s.r.o. (“RLRE”). All these SPEs are financed by
RLRE.
Based on new contractual agreements, Company has right to apply call option for purchase of 100% share in the RLRE
SPVs in case of full repayment of external loans, security loans, and all the other financial liabilities of PEI NV (Photon
Energy Investments NV), RLRE SPEs and parent company PENV towards RLRE and Financing bank, plus payment of future
purchase price for the transfer of share in the SPEs.
See the list of SPEs in note 30.
4.1.4 Loss of control
Upon the loss of control, the Group derecognises the assets and liabilities of the subsidiary, any non-controlling interests
and the other components of equity related to the subsidiary. Any surplus or deficit arising on the loss of control is
recognised in profit or loss. If the Group retains any interest in the previous subsidiary, then such interest is measured at
fair value at the date that control is lost. Subsequently it is accounted for as an equity-accounted investee or as an
available-for-sale financial asset depending on the level of influence retained.
4.1.5 Investments in associates and jointly controlled entities (equity-accounted investees)
Associates are those entities in which the Group has significant influence, but not control, over the financial and operating
policies. Significant influence is presumed to exist when the Group holds 20 percent or more of the voting power of
another entity. Joint ventures are those entities over whose activities the Group has joint control, established by
contractual agreement and requiring unanimous consent for strategic financial and operating decisions.
Investments in associates and jointly controlled entities are accounted for using the equity method (equity-accounted
investees) and are recognised initially at cost. The cost of the investment includes transaction costs.
The consolidated financial statements include the Group’s share of the profit or loss and other comprehensive income, after
adjustments to align the accounting policies with those of the Group, from the date that significant influence or joint
control commences until the date that significant influence or joint control ceases.
When the Group’s share of losses exceeds its interest in an equity-accounted investee, the carrying amount of that
interest, including any long-term investments, is reduced to zero, and the recognition of further losses is discontinued
except to the extent that the Group has an obligation or has made payments on behalf of the investee.
4.1.6 Transactions eliminated on consolidation
Regarding subsidiaries all intra-group transactions, balances, income and expenses are eliminated in full on consolidation.
Regarding equity-accounted investees (see note 4.1.5) part of a margin on sales to these entities is eliminated. This part is
calculated as a percentage of margins equal to the percentage of entity's shares owned by the Group.
Photon Energy N.V. Consolidated Financial Statements for the year ended 31 December 2012
Notes to the consolidated financial statements
Page 67/147
4. Significant accounting policies (continued)
4.2 Foreign currency
4.2.1 Foreign currency transactions
Transactions in foreign currencies are translated to the respective functional currencies of Group entities at exchange rates at
the dates of the transactions. Monetary assets and liabilities denominated in foreign currencies at the reporting date are
translated to the functional currency at the exchange rate at that date. The foreign currency gain or loss on monetary items is
the difference between amortised cost in the functional currency at the beginning of the year, adjusted for effective interest
and payments during the year, and the amortised cost in foreign currency translated at the exchange rate at the end of the
year.
Non-monetary assets and liabilities denominated in foreign currencies that are measured at fair value are retranslated to the
functional currency at the exchange rate at the date that the fair value was determined. Non-monetary items in a foreign
currency that are measured in terms of historical cost are translated using the exchange rate at the date of the transaction.
Foreign currency differences arising on retranslation are recognised in profit or loss, except for differences arising on the
retranslation of available-for-sale equity investments.
4.2.2 Foreign operations
The assets and liabilities of foreign operations (those in Czech Republic and Australia as of 31 December 2012) are translated
into Euro at exchange rates at the reporting date. The income and expenses of foreign operations are translated into Euro at
exchange rates at the dates of the transactions.
4.2.3 Borrowing costs
Borrowing costs directly attributable to the acquisition, construction or production of qualifying assets, which are assets that
necessarily take a substantial period of time to get ready for their intended use or sale, are added to the cost of those assets,
until such time as the assets are substantially ready for their intended use or sale.
Investment income earned on the temporary investment of specific borrowings pending their expenditure on qualifying assets
is deducted from the borrowing costs eligible for capitalisation.
All other borrowing costs are recognised in profit or loss in the period in which they are incurred.
4.3 Financial instruments
Financial instruments are only used to mitigate risks and are not used for trading purposes.
4.3.1 Non-derivative financial assets
The Group initially recognises loans and receivables and deposits on the date that they are originated. All other financial
assets are recognised initially on the trade date, which is the date that the Group becomes a party to the contractual
provisions of the instrument.
The Group derecognises a financial asset when the contractual rights to the cash flows from the asset expire, or it
transfers the rights to receive the contractual cash flows on the financial asset in a transaction in which substantially all the
risks and rewards of ownership of the financial asset are transferred. Any interest in transferred financial assets that is
created or retained by the Group is recognised as a separate asset or liability.
Photon Energy N.V. Consolidated Financial Statements for the year ended 31 December 2012
Notes to the consolidated financial statements
Page 68/147
Financial assets and liabilities are offset and the net amount presented in the statement of financial position when, and only
when, the Group has a legal right to offset the amounts and intends either to settle on a net basis or to realise the asset and
settle the liability simultaneously.
The Group classifies non-derivative financial assets into the following categories: loans and receivables and available-for-
sale financial assets.
Loans and receivables
Loans and receivables are financial assets with fixed or determinable payments that are not quoted in an active market.
Such assets are recognised initially at fair value plus any directly attributable transaction costs. Subsequent to initial
recognition, loans and receivables are measured at amortised cost using the effective interest method, less any
impairment losses.
Cash and cash equivalents
Cash and cash equivalents comprise cash balances on bank accounts and cash on hand and call deposits with original
maturities of three months or less.
Available-for-sale financial assets
Available-for-sale financial assets are non-derivative financial assets that are designated as available for sale or are not
classified in any of the above categories of financial assets.
Subsequent to initial recognition, they are measured at fair value and changes therein, other than impairment losses and
foreign currency differences on available-for-sale debt instruments, are recognised in other comprehensive income and
presented in the fair value reserve in equity. When an investment is derecognized, the gain or loss accumulated in equity is
reclassified to profit or loss.
Available-for-sale financial assets comprise other shares, where the Group holds less than 20% of the voting power and
the Group has no control, joint control or significant influence over the investee.
4.3.2 Non-derivative financial liabilities
The Group initially recognises debt securities issued and subordinated liabilities on the date that they are originated. All
other financial liabilities are recognised initially on the trade date, which is the date that the Group becomes a party to the
contractual provisions of the instrument.
The Group classifies non-derivative financial liabilities into the other financial liabilities category. Such financial liabilities are
recognised initially at fair value less any directly attributable transaction costs. Subsequent to initial recognition, these
financial liabilities are measured at amortised cost using the effective interest method.
The Group derecognizes a financial liability when its contractual obligations are discharged, cancelled or expire.
Financial assets and liabilities are offset and the net amount presented in the statement of financial position when, and
only when, the Group has a legal right to offset the amounts and intends either to settle on a net basis or to realise the
asset and settle the liability simultaneously.
The Group classifies non-derivative financial liabilities into the other financial liabilities category. Such financial liabilities are
recognised initially at fair value plus any directly attributable transaction costs. Subsequent to initial recognition, these
financial liabilities are measured at amortised cost using the effective interest method.
4.3.3 Share capital
Ordinary shares
Ordinary shares are classified as equity. Consideration received above the nominal value of the ordinary shares is classified
in equity as Share premium. Incremental costs directly attributable to the issue of ordinary shares are recognized as a
deduction from equity, net of any tax effects.
Photon Energy N.V. Consolidated Financial Statements for the year ended 31 December 2012
Notes to the consolidated financial statements
Page 69/147
4.3.4. Derivative financial instruments
The Slovak SPVs own interest rate derivatives used for hedging. The purpose of the derivatives is to hedge against
movement of interest rates. Concluding the derivative contract was one of conditions required by the financing bank as
defined in the Loan contract. The change in value of these derivatives is recognized via equity of the Company and the
result is shown in the Derivatives reserve of the Company’s equity since 1 January 2012. Until then, they were recognised
via profit and loss. The Company does not use any other derivatives except for those described above.
The required documentation has been prepared and derivatives were successfully tested for effectiveness.
4.4 Property, plant and equipment
4.4.1 Recognition and measurement
Photovoltaic power plants are stated in the consolidated statement of financial position at their revalued amounts, being the
fair value at the date of revaluation, less any subsequent accumulated depreciation and subsequent accumulated
impairment losses. Revaluations are performed at sufficient regularity such that the carrying amounts do not differ
materially from those that would be determined using fair values at the end of each reporting period. The need for
revaluations is assessed every quarter.
For fair value determination see note 5.1.
Any revaluation surplus arising on the revaluation of such photovoltaic power plant is recognized in other comprehensive
income and accumulated in equity, except to the extent that the surplus reverses a revaluation deficit on the same asset
previously recognized in profit or loss. Any deficit on revaluation of such photovoltaic power plants is recognized in profit
or loss except to the extent that it reserves a previous revaluation surplus on the same asset, in which case the debit to
that extent is recognized in other comprehensive income.
Photovoltaic power plants, which the Company consolidates, in the course of construction are carried at cost, less any
recognized impairment loss. The cost of self-constructed assets includes the cost of materials and direct labour, any other
costs directly attributable to bringing the assets to a working condition for their intended use and capitalized borrowing
costs. Such properties are reported as Property, plant, equipment - Assets in progress and are classified to Property, plant
and equipment - Photovoltaic power plants when completed and ready for use. These assets are completed and ready for
use when the power plant is connected to the electricity network and all technical parameters necessary for electricity
production are completed. Depreciation of these assets, on the same basis as other property assets, commences when the
assets are ready for their intended use.
Additional costs capitalized in the value of the asset are included in the regular review of power plants value as done on
quarterly basis.
Included in the property plant and equipment are non separable intangible assets mainly relating to the rights to build and
operate photovoltaic power plants in a specific country. Because the items are non separable, the rights are included in
property, plant and equipment.
Fixtures and equipment are stated at cost less accumulated depreciation and accumulated impairment losses. Cost
includes expenditure that is directly attributable to the acquisition of the asset. The gain or loss on disposal of an item of
fixtures and equipment is determined by comparing the proceeds from disposal with the carrying amount of the property,
plant and equipment, and is recognized net within other income/other expenses in profit or loss.
4.4.2 Depreciation
Depreciation is recognized so as to write off the costs or revalued amount of property, plant and equipment (other than
land and properties under construction) less their residual values over their useful lives, using the straight-line method.
The estimated useful lives, residual values and depreciation methods are reviewed at the end of each reporting period,
Photon Energy N.V. Consolidated Financial Statements for the year ended 31 December 2012
Notes to the consolidated financial statements
Page 70/147
with the effect of any changes in estimate accounted for on a prospective basis.
Depreciation of revalued photovoltaic power plants is recognized in profit or loss. Every quarter the amount equal to the
difference between depreciation based on the revalued carrying amount of photovoltaic power plants and depreciation
based on asset’s original cost is transferred directly to retained earnings. On the subsequent sale or retirement of a
revalued property, the attributable revaluation surplus remaining in the properties revaluation reserve is transferred
directly to retained earnings.
Land is not depreciated.
The estimated useful lives for the current and comparative years are as follows (based on the professional judgement
combining the Feed in Tariff period and useful estimated live of the components and technology used in the power plants):
Photovoltaic power plants 20 years
Fixtures and equipments 3 – 10 years
4.5 Inventories
Inventories are measured at the lower of cost and net realisable value. The cost of inventories is based on the weighted
average principle, and includes expenditure incurred in acquiring the inventories, production or conversion costs and other
costs incurred in bringing them to their existing location and condition.
Net realisable value is the estimated selling price in the ordinary course of business, less the estimated costs of completion
and selling expenses.
Photon Energy N.V. Consolidated Financial Statements for the year ended 31 December 2012
Notes to the consolidated financial statements
Page 71/147
4. Significant accounting policies (continued)
4.6 Impairment
4.6.1 Non-derivative financial assets
A financial asset not carried at fair value through profit or loss is assessed at each reporting date to determine whether
there is objective evidence that it is impaired. A financial asset is impaired if objective evidence indicates that a loss event
has occurred after the initial recognition of the asset, and that the loss event had a negative effect on the estimated future
cash flows of that asset that can be estimated reliably.
Objective evidence that financial assets (including equity securities) are impaired can include default or delinquency by a
debtor, restructuring of an amount due to the Group on terms that the Group would not consider otherwise, indications
that a debtor or issuer will enter bankruptcy, adverse changes in the payment status of borrowers or issuers in the Group,
economic conditions that correlate with defaults or the disappearance of an active market for a security. In addition, for an
investment in an equity security, a significant or prolonged decline in its fair value below its cost is objective evidence of
impairment.
Loans and receivables
The Group considers evidence of impairment for loans and receivables at both a specific asset and collective level. All
individually significant receivables are assessed for specific impairment. All individually significant loans and receivables
found not to be specifically impaired are then collectively assessed for any impairment that has been incurred but not yet
identified. Loans and receivables that are not individually significant are collectively assessed for impairment by grouping
together loans and receivables with similar risk characteristics.
In assessing collective impairment the Group uses historical trends of the probability of default, the timing of recoveries
and the amount of loss incurred, adjusted for management’s judgement as to whether current economic and credit
conditions are such that the actual losses are likely to be greater or less than suggested by historical trends.
An impairment loss in respect of a financial asset measured at amortised cost is calculated as the difference between its
carrying amount and the present value of the estimated future cash flows discounted at the asset’s original effective interest
rate. Losses are recognised in profit or loss and reflected in an allowance account against loans and receivables. Interest on the
impaired asset continues to be recognised. When a subsequent event (e.g. repayment by a debtor) causes the amount of
impairment loss to decrease, the decrease in impairment loss is reversed through profit or loss.
Available-for-sale financial assets
Impairment losses on available-for-sale financial assets are recognised by reclassifying the losses accumulated in the fair
value reserve in equity, to profit or loss. The cumulative loss that is reclassified from equity to profit or loss is the
difference between the acquisition cost, net of any principal repayment and amortisation, and the current fair value, less
any impairment loss recognised previously in profit or loss. Changes in impairment provisions attributable to application of
the effective interest method are reflected as a component of interest income. If, in a subsequent period, the fair value of
an impaired available-for-sale debt security increases and the increase can be related objectively to an event occurring
after the impairment loss was recognised in profit or loss, then the impairment loss is reversed, with the amount of the
reversal recognised in profit or loss. However, any subsequent recovery in the fair value of an impaired available-for-sale
equity security is recognised in other comprehensive income.
Photon Energy N.V. Consolidated Financial Statements for the year ended 31 December 2012
Notes to the consolidated financial statements
Page 72/147
4. Significant accounting policies (continued)
4.6 Impairment (continued)
4.6.2 Non-financial assets
The carrying amounts of the Group’s non-financial assets, other than inventories and deferred tax assets are reviewed at
each reporting date to determine whether there is any indication of impairment. If any such indication exists, then the
asset’s recoverable amount is estimated. For goodwill, and intangible assets that have indefinite useful lives or that are not
yet available for use, the recoverable amount is estimated each year at the same time. An impairment loss is recognised if
the carrying amount of an asset or its related cash-generating unit (CGU) exceeds its estimated recoverable amount.
A CGU corresponds to the individual power plant operated by the legal entity. In 2012, the legal entity owns always only
one power plant.
The recoverable amount of an asset or CGU is the greater of its value in use and its selling price less costs to sell. In
assessing value in use, the estimated future cash flows are discounted to their present value using a pre-tax discount rate
that reflects current market assessments of the time value of money and the risks specific to the asset or CGU. For the
purpose of impairment testing, assets that cannot be tested individually are grouped together into the smallest group of
assets that generates cash inflows from continuing use that are largely independent of the cash inflows of other assets or
CGU. Subject to an operating segment ceiling test, for the purposes of goodwill impairment testing, CGUs to which
goodwill has been allocated are aggregated so that the level at which impairment testing is performed reflects the lowest
level at which goodwill is monitored for internal reporting purposes. Goodwill acquired in a business combination is
allocated to groups of CGUs that are expected to benefit from the synergies of the combination.
Impairment losses are recognised in profit or loss. Impairment losses recognised in respect of CGUs are allocated first to
reduce the carrying amount of any goodwill allocated to the CGU (group of CGUs), and then to reduce the carrying
amounts of the other assets in the CGU (group of CGUs) on a pro rata basis.
An impairment loss in respect of goodwill is not reversed. In respect of other assets, impairment losses recognised in prior
periods are assessed at each reporting date for any indications that the loss has decreased or no longer exists. An
impairment loss is reversed if there has been a change in the estimates used to determine the recoverable amount. An
impairment loss is reversed only to the extent that the asset’s carrying amount does not exceed the carrying amount that
would have been determined, net of depreciation or amortisation, if no impairment loss had been recognised.
4.7 Non-current assets held for sale or distribution
Non-current assets held for sale or distribution comprises assets and liabilities, which are expected to be recovered
primarily through sale or distribution rather than through continuing use. Immediately before classification as held for sale
or distribution, the assets, or components of a disposal group, are re-measured in accordance with the Group’s accounting
policies. Thereafter, generally, the assets, or disposal group, are measured at the lower of their carrying amount and fair
value less costs to sell. Any impairment loss on a disposal group first is allocated to goodwill, and then to remaining assets
and liabilities on a pro rata basis, except that no loss is allocated to inventories, financial assets, deferred tax assets,
employee benefit assets, which continue to be measured in accordance with the Group’s accounting policies.
Photon Energy N.V. Consolidated Financial Statements for the year ended 31 December 2012
Notes to the consolidated financial statements
Page 73/147
4. Significant accounting policies (continued)
4.7 Non-current assets held for sale or distribution (continued)
Impairment losses on initial classification as held for sale or distribution and subsequent gains and losses on re-
measurement are recognised in profit or loss. Gains are not recognised in excess of any cumulative impairment loss.
Once classified as held for sale or distribution, intangible assets and property, plant and equipment are no longer
amortised or depreciated.
4.8 Provisions
A provision is recognised if, as a result of a past event, the Group has a present legal or constructive obligation that can be
estimated reliably, and it is probable that an outflow of economic benefits will be required to settle the obligation.
Provisions are determined by discounting the expected future cash flows at a pre-tax rate that reflects current market
assessments of the time value of money and the risks specific to the liability.
4.8.1 Warranties
A provision for warranties is recognised when the underlying services are sold, i.e. when the construction contracts are
finished. The provision is based on historical warranty data and a weighting of all possible outcomes against their
associated probabilities.
Photon Energy N.V. Consolidated Financial Statements for the year ended 31 December 2012
Notes to the consolidated financial statements
Page 74/147
4. Significant accounting policies (continued)
4.9 Revenue
4.9.1 Goods sold
Revenue from the sale of goods in the course of ordinary activities is measured at the fair value of the consideration
received or receivable, net of returns, trade discounts and volume rebates. Revenue is recognised when persuasive
evidence exists, usually in the form of an executed sales agreement, that the significant risks and rewards of ownership
have been transferred to the customer, recovery of the consideration is probable, the associated costs and possible return
of goods can be estimated reliably, there is no continuing management involvement with the goods, and the amount of
revenue can be measured reliably. If it is probable that discounts will be granted and the amount can be measured
reliably, then the discount is recognised as a reduction of revenue as the sales are recognised.
The timing of the transfer of risks and rewards varies depending on the individual terms of the sales agreement (e.g.
Incoterms conditions).
4.9.2 Services
Revenue from services (e.g. maintenance, technical-administrative; installation) rendered is recognised in profit or loss in
proportion to the stage of completion of the transaction at the reporting date. The stage of completion is assessed by
reference to surveys of work performed.
4.9.3 Construction contracts
Contract revenue includes the initial amount agreed in the contract plus any variations in contract work, claims and
incentive payments, to the extent that it is probable that they will result in revenue and can be measured reliably. As soon
as the outcome of a construction contract can be estimated reliably, contract revenue is recognised in profit or loss in
proportion to the stage of completion of the contract. Contract expenses are recognised as incurred unless they create an
asset related to future contract activity.
The stage of completion is measured by reference to the contract costs incurred up to the reporting date as a percentage
of total estimated costs for each contract. When the outcome of a construction contract cannot be estimated reliably,
contract revenue is recognised only to the extent of contract costs incurred that are likely to be recoverable. An expected
loss on a contract is recognised immediately in profit or loss.
4.9.4 Sale of electricity
Revenues from sale of electricity are coming from the sale of electricity produced and sold to the local electricity
distributor. After the end of each month, the production reports are downloaded from the monitoring system and based on
the data from the report, the invoices are issued. The revenues are recognized in accordance with the delivered electricity.
Photon Energy N.V. Consolidated Financial Statements for the year ended 31 December 2012
Notes to the consolidated financial statements
Page 75/147
4. Significant accounting policies (continued)
4.10 Finance income and finance costs
Finance income comprises interest income on loans and net foreign currency gains. Interest income is recognised in profit
or loss using the effective interest rate method.
Finance costs comprise interest expense on borrowings, bank account fees and net foreign currency losses. Interest
expense is recognised using the effective interest rate method.
Borrowing costs that are not directly attributable to the acquisition, construction or production of a qualifying asset are
recognised in profit or loss. Borrowing costs incurred by the Group directly attributable to the construction of power plants
is capitalized in the cost of the related asset until the date of its completion.
Foreign currency gains and losses are reported on a net basis as either finance income or finance cost depending on whether
foreign currency movements are in a net gain or net loss position.
4.11 Income tax
Income tax expense comprises current and deferred tax. Current tax and deferred tax is recognised in profit or loss except
to the extent that it relates to a business combination, or items recognised directly in equity or in other comprehensive
income.
Current tax is the expected tax payable or receivable on the taxable income or loss for the year, using tax rates enacted or
substantively enacted at the reporting date, and any adjustment to tax payable in respect of previous years.
Deferred tax is recognised in respect of temporary differences between the carrying amounts of assets and liabilities for
financial reporting purposes and the amounts used for taxation purposes. Deferred tax is not recognised for:
Temporary differences on the initial recognition of assets or liabilities in a transaction that is not a business
combination and that affects neither accounting nor taxable profit or loss;
Temporary differences related to investments in subsidiaries and jointly controlled entities to the extent that it is
probable that they will not reverse in the foreseeable future; and
Taxable temporary differences arising on the initial recognition of goodwill.
A deferred tax liability is recognised for assets revaluation reported in other comprehensive income and other temporary
differences. Assets revaluation represents the revaluation of photovoltaic power plants described in note 4.4.1.
Photon Energy N.V. Consolidated Financial Statements for the year ended 31 December 2012
Notes to the consolidated financial statements
Page 76/147
4. Significant accounting policies (continued)
4.11 Income tax (continued)
Deferred tax is measured at the tax rates that are expected to be applied to temporary differences when they reverse,
based on the laws that have been enacted or substantively enacted by the reporting date.
Deferred tax assets and liabilities are offset if there is a legally enforceable right to offset current tax liabilities and assets,
and they relate to income taxes levied by the same tax authority on the same taxable entity, or on different tax entities, but
they intend to settle current tax liabilities and assets on a net basis or their tax assets and liabilities will be realised
simultaneously.
A deferred tax asset is recognised for unused tax losses, tax credits and deductible temporary differences, to the extent
that it is probable that future taxable profits will be available against which they can be utilised. Deferred tax assets are
reviewed at each reporting date and are reduced to the extent that it is no longer probable that the related tax benefit will
be realised.
4.12 Earnings per share
The Group uses ordinary shares only. The Group presents basic earnings per share and total comprehensive income per
share data.
Basic earnings per share is calculated by dividing the profit or loss attributable to ordinary shareholders of the Company by
the weighted average number of ordinary shares outstanding during the year.
Total comprehensive income per share is calculated by dividing the total comprehensive income attributable to ordinary
shareholders of the Company by the weighted average number of ordinary shares outstanding during the year.
4.13 Segment reporting
An operating segment is a component of the Group that engages in business activities from which it may earn revenues
and incur expenses, including revenues and expenses that relate to transactions with any of the Group’s other
components. All operating segments’ operating results are reviewed regularly by the Group’s management and directors to
make decisions about resources to be allocated to the segment and to assess its performance, and for which discrete
financial information is available.
Segment results that are reported include items directly attributable to a segment as well as those that can be allocated on
a reasonable basis. Unallocated items comprise mainly corporate assets (primarily the Company’s headquarters), head
office expenses, and other minor expenses non-allocable to the any of the segments.
Segment capital expenditure is the total cost incurred during the year to acquire property, plant and equipment, and
intangible assets other than goodwill.
Photon Energy N.V. Consolidated Financial Statements for the year ended 31 December 2012
Notes to the consolidated financial statements
Page 77/147
5. Determination of fair values
A number of the Group’s accounting policies and disclosures require the determination of fair value, for both financial and
non-financial assets and liabilities. Fair values have been determined for measurement and/or disclosure purposes based
on the following methods. When applicable, further information about the assumptions made in determining fair values is
disclosed in the notes specific to that asset or liability.
5.1 Property, plant and equipment
The fair value of items of plant, equipment, fixtures and fittings is based on the market approach, using quoted market
prices for similar items when available, or the income approach (an internally generated discounted cash-flow model) if
there is no market based evidence of the fair value. Otherwise, the depreciated replacement cost approach will be used,
when appropriate. The depreciated replacement cost estimates reflect adjustments for physical deterioration as well as
functional and economic obsolescence.
For photovoltaic power plants market prices are not available. Therefore, the income approach is used. Under this
approach the fair value of photovoltaic power plants is based on an internally generated discounted cash flow model,
discounted at weighted average cost of capital. Cash flows are calculated for the period equal to the duration of the
Feed-in-Tariff (period with guaranteed sales prices) in a given country and based on the expected after tax cost of debt
and expected cost of equity. On a quarterly basis, management reviews the expected debt costs of individual projects
vis-a-vis actual interest cost, financial market conditions, and interest rate for a 15-year state bond. On a quarterly
basis, management also reviews expected cost of equity for the period of the cash flow model.
The initial valuations were done as of the date of put in use of an individual power plant, and each model is periodically
reviewed and any potential change in inputs is considered.
The cash flow projections are prepared for 20 years in Czech Republic and 15 years in Slovak Republic, equal to the
duration of the projects.
The valuation for Czech SPVs (represented by option rights) was approximated by the current Project Value. Moreover
the valuation is based on Unlevered Free Cash Flow to Firm (FCFF) basis of the SPVs. The FCFF calculation used in the
valuation is consistent with the overall known definition and approaches.
FCFF was calculated on the basis what cash flow is available to the company's suppliers of capital, after deduction of
all operating expenses, taxes and necessary investments in working capital and fixed assets (in our case the best
estimate of the replacement of broken inverters). In our models FCFF was calculated based on EBITDA minus Tax
minus Other Cash Flow Items mainly the replacement reserve for Inverters. The FCFF was adjusted for tax effects,
due to the fact that the tax effect is taken into account in the WACC formula.
The adjusted FCFF is discounted by a discount rate which is based on the Weighted Average Cost of Capital (WACC) of
7%, which is post-tax.
The DCF models in Czech Republic already include the tax levy of 26% for the period of 2011-2013, so the impact of
this tax is included in the revaluation of the Czech portfolio. The tax levy is legally valid in the period of 2011 – 2013.
The management has no formal news that the tax levy will be prolonged to the following periods. However if this
happens, it will significantly impact the current valuations. Refer to note 28.5 for the sensitivity of the used
assumptions in relation to the tax levy.
The valuation of the Slovak SPVs is based on the Unlevered Free Cash Flow to Firm (FCFF) basis of the SPVs. The
discount rate is based on the Capital Asset Pricing Model (“CAPM”). The CAPM is used to determine the appropriate
required rate of return of an asset, if that asset is to be added to an already well-diversified portfolio, given that
Photon Energy N.V. Consolidated Financial Statements for the year ended 31 December 2012
Notes to the consolidated financial statements
Page 78/147
asset's non-diversifiable risk.
Due to the lack of data for the determination of the Beta, the discount rate was determined as the sum of risk
premium surcharges: The risk free rate is based on an average of 15 YR Slovak Government Bonds issued in 2004 and
2010; the market risk premium represents the specific market risks. Due to the retroactive changes in the Czech
Republic, a political risk premium has been included in the WACC. As the valuation is based on the discounted FCFF,
the discount rate used is based on the Weighted Average Cost of Capital (WACC). The total discount rate is 5%. There
is no tax levy applicable in the Slovak republic.
The valuation of Italian powerplants is based on the support scheme of Italy and has various specifics, mainly in
number of components of feed-in-tariff, i.e. FIT (quatro Conto Energia) that reflects also removal of asbestos from roof
and Sales of electricity to the electricity grid. Duration of support scheme in Italy is 20 years. The main three taxes
applicable for income of Italian company are IRES, IRAP, ICI (the principle adds up national and local tax). The tax
base for particular taxes is different. The remaining valuation principles remained the same compared with Slovak
model. Free Cash Flow to Firm is equal to EBITDA* - Tax. Since no debt financing is in place, the Free Cash Flow to
Equity is equal to Free Cash Flow to Firm. This value was therefore discounted by the WACC, in order to achieve the
total value of the project based on Entity approach valuation.
Any changes in the above described used assumptions could have a significant impact on the recognized fair values.
The revaluation reserve created, based on the DCF models, is annually released to the retained earnings in the amount
equal to the depreciation calculated from the amount of revaluation.
*EBITDA is not a measure used in EU IFRS. EBITDA relates to earnings before interest, taxes, depreciation and
amortization
5.2 Inventories
The fair value of inventories acquired in a business combination is determined based on the estimated selling price in the
ordinary course of business less the estimated costs of completion and sale, and a reasonable profit margin based on the
effort required to complete and sell the inventories.
5.3 Trade and other receivables
The fair value of trade and other receivables, excluding construction work in progress, but including service concession
receivables, is estimated at the present value of future cash flows, discounted at the market rate of interest at the
reporting date. This fair value is determined for disclosure purposes or when acquired in a business combination.
5.4 Non-derivative financial liabilities
The Group classifies non-derivative financial liabilities into the other financial liabilities category. Such financial liabilities
are recognised initially at fair value (estimated at the present value of the future cash outflows discounted by effective
interest rate) plus any directly attributable transaction costs. Subsequent to initial recognition, these financial liabilities are
measured at amortised cost using the effective interest method. For finance leases the market rate of interest is determined
by reference to similar lease agreements.
Photon Energy N.V. Consolidated Financial Statements for the year ended 31 December 2012
Notes to the consolidated financial statements
Page 79/147
6. Financial risk management
6.1 Risk management framework
The Group’s risk management policies are established to identify and analyse the risks faced by the Group, to set
appropriate risk limits and controls, and to monitor risks and adherence to limits. Risk management policies and systems
are reviewed regularly to reflect changes in market conditions and the Group’s activities. The Group, through its training
and management standards and procedures, aims to develop a disciplined and constructive control environment in which
all employees understand their roles and obligations.
6.2 Operational risk
The economic viability of energy production using photovoltaic power plants installations depends on Feed-in-Tariff (FiT)
systems. The FiT system can be negatively affected by a number of factors including, but not limited to, a reduction or
elimination in the FiT or green bonus per KWh produced, an elimination or reduction of the indexation of the FiT and a
shortening of the period for which the FiT applies to photovoltaic installations. On the investment side the Company faces
uncertainty in relation to the approval process for the construction of photovoltaic installations, grid connection and the
investment cost per KWp of installed capacity. The operating and financial results of the Company can be seriously affected
by a sudden or significant change in the regulatory environment in each of the countries where the Company or its
subsidiaries conduct business.
During the fourth quarter of 2010, the Czech parliament and the Czech government approved several changes in the legal
framework governing certain aspects of the photovoltaic and other industries. Those changes included mainly: (i) a 3 years
tax levy, newly introduced into the Czech tax system, of 26% on the revenues of photovoltaic power plants above 30kW of
installed capacity, completed in the years 2009 and 2010, (ii) the abolishment of a six-year corporate income tax
exemption for photovoltaic power plants, and (iii) a tenfold increase of the contractual fees previously agreed between the
photovoltaic power plant operators and the state Land Fund for the extraction of certain classes of land from the state
fund.
There is a certain risk that the validity of these measures could be extended and/or new measures could be introduced
such that they would affect already completed photovoltaic investments. In such cases the value of the proprietary
portfolio of photovoltaic power plants in the Czech Republic could be seriously negatively affected, refer to sensitivity
analysis in chapter 28.5.
Risk of legislative changes in Slovak Republic and Italy is at this moment considered as remote, however, it cannot be fully
excluded.
Changes in risk can have a significant impact on the assumptions used in the determination of fair value of property plant and equipment and related cash flows.
Photon Energy N.V. Consolidated Financial Statements for the year ended 31 December 2012
Notes to the consolidated financial statements
Page 80/147
6. Financial risk management (continued)
6.3 Currency risk
The Group is exposed to a currency risk on sales, purchases and borrowings that are denominated in a currency other than
the respective functional currencies of Group entities.
The transactions of the Group entities are denominated in CZK, EUR and AUD. Although mainly the CZK/EUR exchange rate
experienced wide fluctuations in 2012, the Group is, typically, able to collect prepayments from its customers at the time of
committing itself to purchases from third parties and thus to a large extent to mitigate currency risk. There is no financial
hedging used by the company against the currency risk. Company’s management does not formally monitor the FX positions.
6.4 Credit risk
Credit risk is the risk of financial loss to the Group if a customer or counterparty to a financial instrument fails to meet its
contractual obligations, and arises principally from the Group’s receivables from customers, including the electricity
distributors.
Trade and other receivables
The Group’s exposure to credit risk is influenced mainly by individual characteristics of each customer. However,
management also considers the demographics of the Group’s customer base, including the default risk of the industry and
country in which customers operate, as these factors may have an influence on credit risk. In most cases, the Company
requires advance payments (partial or 100%) for the delivery of electricity in order to minimise the credit risk.
Additionally, in case of new customers, the company looks for market references of the potential customers that are
available in public resources. The collections are regularly monitored by the responsible employees and any significant
overdue receivables are discussed with the management of the company. Management of the company is responsible for
the decision whether allowance is to be created or any other steps need to be performed.
The Group establishes an allowance for impairment that represents its estimate of incurred losses in respect of trade and
other receivables. The main components of this allowance are a specific loss component that relates to individually
significant exposures, and a collective loss component established for groups of similar assets in respect of losses that
have been incurred but not yet identified. The collective loss allowance is determined based on historical data of payment
statistics for similar financial assets based on the previous periods of the company’s existence.
Cash and cash equivalents
The Group held cash and cash equivalents of EUR 6,953 thousands at 31 December 2012 (2011: EUR 4,880 thousands),
which represents its maximum credit exposure on these assets. The cash and cash equivalents are held with banks and
financial institution counterparties. Only those banks and financial institutions, which were approved by the members of
the board of directors can be used by the company.
Cash held by the SPVs under legal ownership of the RLRE is restricted only for certain transactions, e.g. loan and related
interest provided to those SPV’s by Photon Energy Investments N.V. (originally by Photon Energy, a.s.) is subordinated to
the loan from RLRE and will be paid only after the repayment of the RLRE loan. Total amount of the cash owned by these
SPVs is EUR 2,246 thousands at 31 December 2012 (2011: EUR 1,599 thousands).
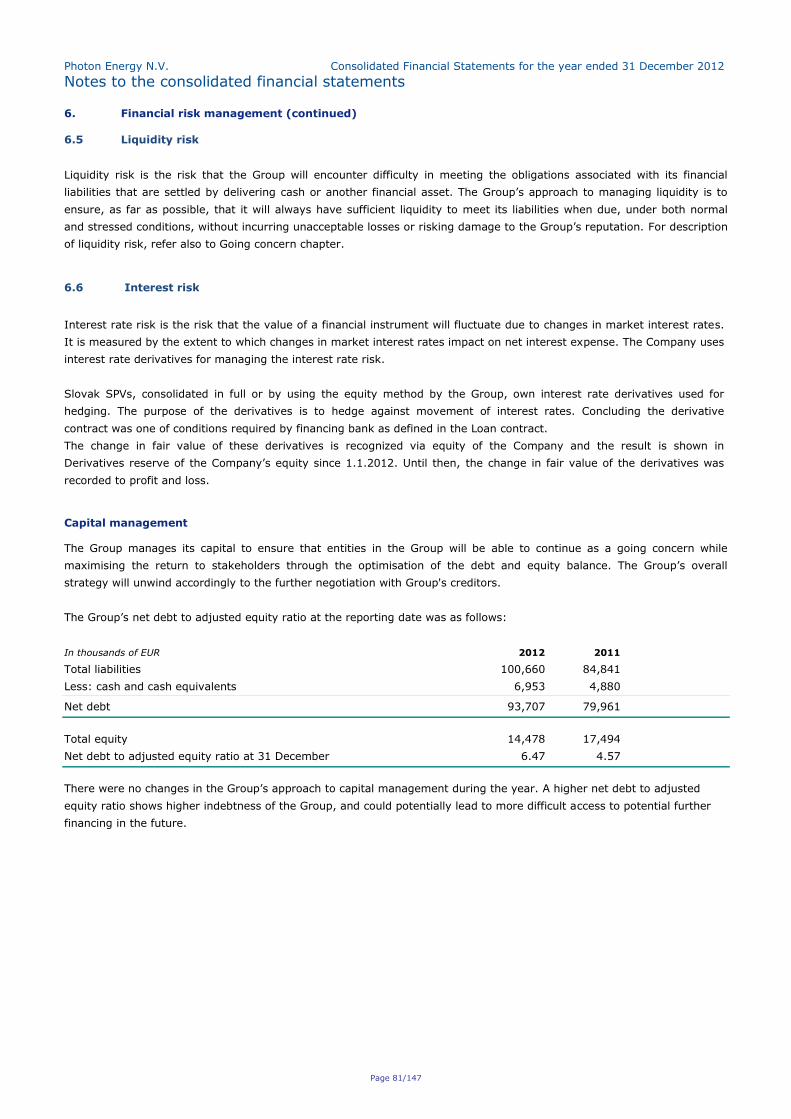
Photon Energy N.V. Consolidated Financial Statements for the year ended 31 December 2012
Notes to the consolidated financial statements
Page 81/147
6. Financial risk management (continued)
6.5 Liquidity risk
Liquidity risk is the risk that the Group will encounter difficulty in meeting the obligations associated with its financial
liabilities that are settled by delivering cash or another financial asset. The Group’s approach to managing liquidity is to
ensure, as far as possible, that it will always have sufficient liquidity to meet its liabilities when due, under both normal
and stressed conditions, without incurring unacceptable losses or risking damage to the Group’s reputation. For description
of liquidity risk, refer also to Going concern chapter.
6.6 Interest risk
Interest rate risk is the risk that the value of a financial instrument will fluctuate due to changes in market interest rates.
It is measured by the extent to which changes in market interest rates impact on net interest expense. The Company uses
interest rate derivatives for managing the interest rate risk.
Slovak SPVs, consolidated in full or by using the equity method by the Group, own interest rate derivatives used for
hedging. The purpose of the derivatives is to hedge against movement of interest rates. Concluding the derivative
contract was one of conditions required by financing bank as defined in the Loan contract.
The change in fair value of these derivatives is recognized via equity of the Company and the result is shown in
Derivatives reserve of the Company’s equity since 1.1.2012. Until then, the change in fair value of the derivatives was
recorded to profit and loss.
Capital management
The Group manages its capital to ensure that entities in the Group will be able to continue as a going concern while
maximising the return to stakeholders through the optimisation of the debt and equity balance. The Group’s overall
strategy will unwind accordingly to the further negotiation with Group's creditors.
The Group’s net debt to adjusted equity ratio at the reporting date was as follows:
In thousands of EUR 2012 2011
Total liabilities 100,660 84,841
Less: cash and cash equivalents 6,953 4,880
Net debt 93,707 79,961
Total equity 14,478 17,494
Net debt to adjusted equity ratio at 31 December 6.47 4.57
There were no changes in the Group’s approach to capital management during the year. A higher net debt to adjusted
equity ratio shows higher indebtness of the Group, and could potentially lead to more difficult access to potential further
financing in the future.
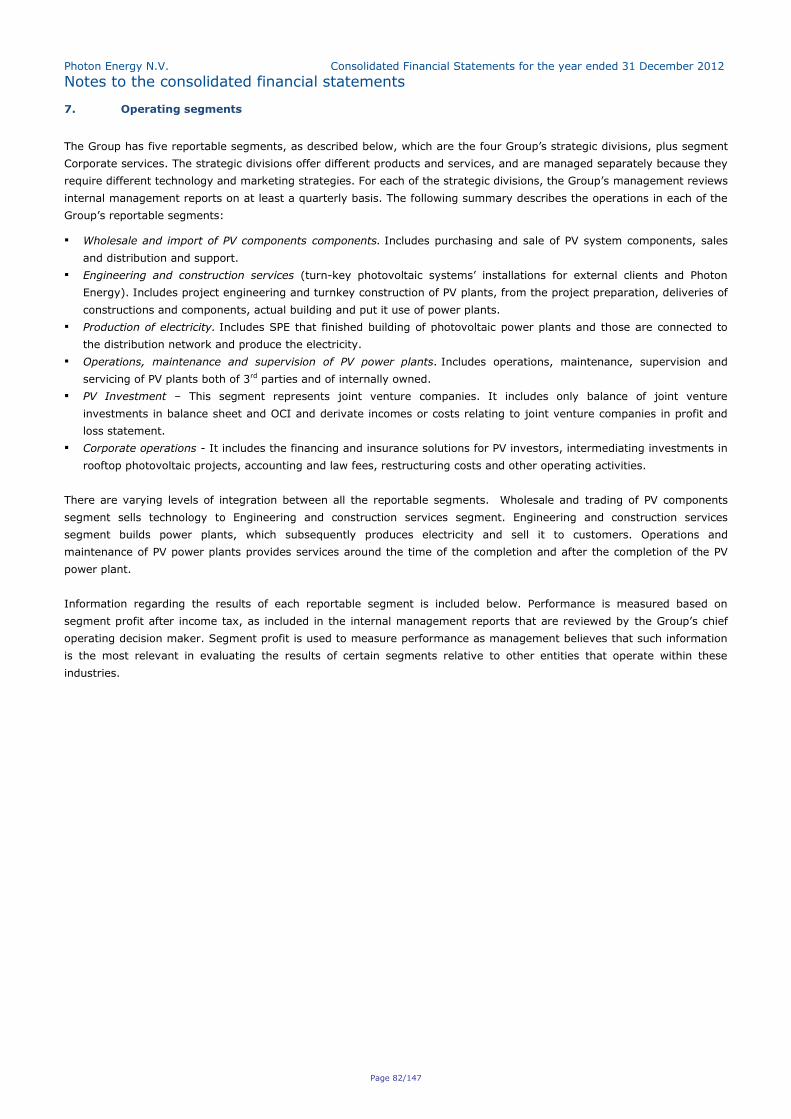
Photon Energy N.V. Consolidated Financial Statements for the year ended 31 December 2012
Notes to the consolidated financial statements
Page 82/147
7. Operating segments
The Group has five reportable segments, as described below, which are the four Group’s strategic divisions, plus segment
Corporate services. The strategic divisions offer different products and services, and are managed separately because they
require different technology and marketing strategies. For each of the strategic divisions, the Group’s management reviews
internal management reports on at least a quarterly basis. The following summary describes the operations in each of the
Group’s reportable segments:
Wholesale and import of PV components components. Includes purchasing and sale of PV system components, sales
and distribution and support.
Engineering and construction services (turn-key photovoltaic systems’ installations for external clients and Photon
Energy). Includes project engineering and turnkey construction of PV plants, from the project preparation, deliveries of
constructions and components, actual building and put it use of power plants.
Production of electricity. Includes SPE that finished building of photovoltaic power plants and those are connected to
the distribution network and produce the electricity.
Operations, maintenance and supervision of PV power plants. Includes operations, maintenance, supervision and
servicing of PV plants both of 3rd parties and of internally owned.
PV Investment – This segment represents joint venture companies. It includes only balance of joint venture
investments in balance sheet and OCI and derivate incomes or costs relating to joint venture companies in profit and
loss statement.
Corporate operations - It includes the financing and insurance solutions for PV investors, intermediating investments in
rooftop photovoltaic projects, accounting and law fees, restructuring costs and other operating activities.
There are varying levels of integration between all the reportable segments. Wholesale and trading of PV components
segment sells technology to Engineering and construction services segment. Engineering and construction services
segment builds power plants, which subsequently produces electricity and sell it to customers. Operations and
maintenance of PV power plants provides services around the time of the completion and after the completion of the PV
power plant.
Information regarding the results of each reportable segment is included below. Performance is measured based on
segment profit after income tax, as included in the internal management reports that are reviewed by the Group’s chief
operating decision maker. Segment profit is used to measure performance as management believes that such information
is the most relevant in evaluating the results of certain segments relative to other entities that operate within these
industries.
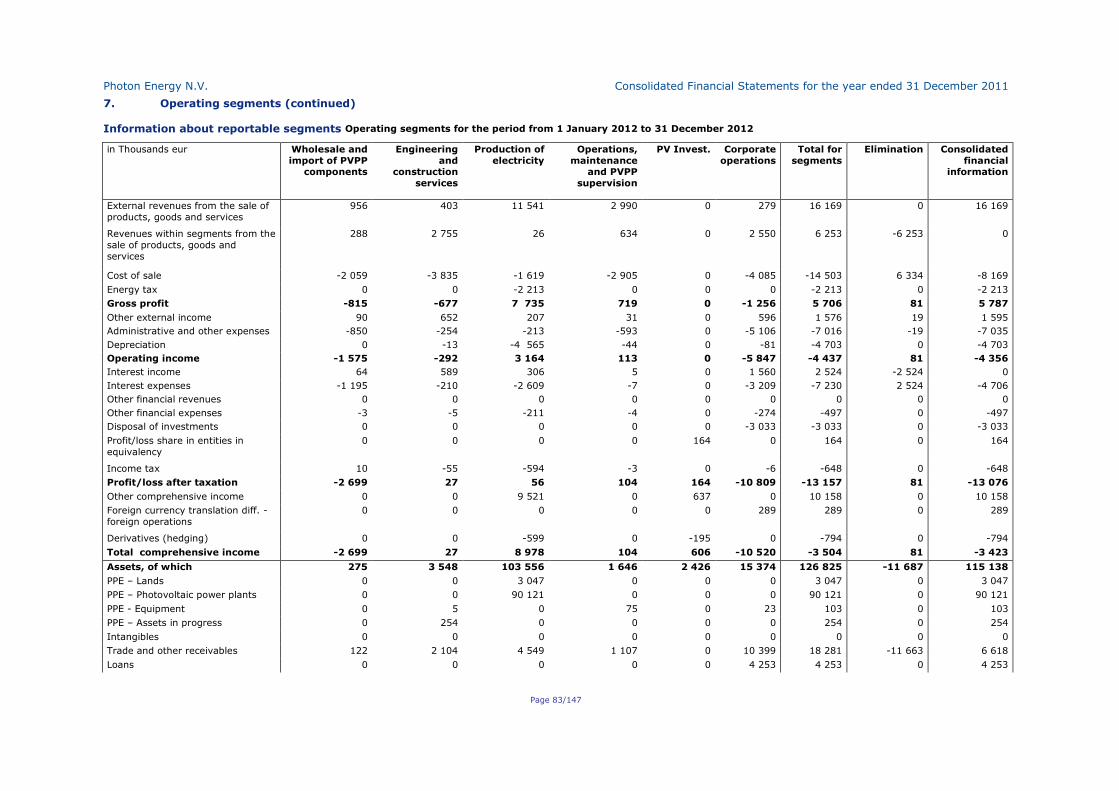
Photon Energy N.V. Consolidated Financial Statements for the year ended 31 December 2011
Page 83/147
7. Operating segments (continued)
Information about reportable segments Operating segments for the period from 1 January 2012 to 31 December 2012
in Thousands eur Wholesale and
import of PVPP components
Engineering
and construction
services
Production of
electricity
Operations,
maintenance and PVPP
supervision
PV Invest. Corporate
operations
Total for
segments
Elimination Consolidated
financial information
External revenues from the sale of
products, goods and services
956 403 11 541 2 990 0 279 16 169 0 16 169
Revenues within segments from the
sale of products, goods and
services
288 2 755 26 634 0 2 550 6 253 -6 253 0
Cost of sale -2 059 -3 835 -1 619 -2 905 0 -4 085 -14 503 6 334 -8 169
Energy tax 0 0 -2 213 0 0 0 -2 213 0 -2 213
Gross profit -815 -677 7 735 719 0 -1 256 5 706 81 5 787
Other external income 90 652 207 31 0 596 1 576 19 1 595
Administrative and other expenses -850 -254 -213 -593 0 -5 106 -7 016 -19 -7 035
Depreciation 0 -13 -4 565 -44 0 -81 -4 703 0 -4 703
Operating income -1 575 -292 3 164 113 0 -5 847 -4 437 81 -4 356
Interest income 64 589 306 5 0 1 560 2 524 -2 524 0
Interest expenses -1 195 -210 -2 609 -7 0 -3 209 -7 230 2 524 -4 706
Other financial revenues 0 0 0 0 0 0 0 0 0
Other financial expenses -3 -5 -211 -4 0 -274 -497 0 -497
Disposal of investments 0 0 0 0 0 -3 033 -3 033 0 -3 033
Profit/loss share in entities in
equivalency
0 0 0 0 164 0 164 0 164
Income tax 10 -55 -594 -3 0 -6 -648 0 -648
Profit/loss after taxation -2 699 27 56 104 164 -10 809 -13 157 81 -13 076
Other comprehensive income 0 0 9 521 0 637 0 10 158 0 10 158
Foreign currency translation diff. -
foreign operations
0 0 0 0 0 289 289 0 289
Derivatives (hedging) 0 0 -599 0 -195 0 -794 0 -794
Total comprehensive income -2 699 27 8 978 104 606 -10 520 -3 504 81 -3 423
Assets, of which 275 3 548 103 556 1 646 2 426 15 374 126 825 -11 687 115 138
PPE – Lands 0 0 3 047 0 0 0 3 047 0 3 047
PPE – Photovoltaic power plants 0 0 90 121 0 0 0 90 121 0 90 121
PPE - Equipment 0 5 0 75 0 23 103 0 103
PPE – Assets in progress 0 254 0 0 0 0 254 0 254
Intangibles 0 0 0 0 0 0 0 0 0
Trade and other receivables 122 2 104 4 549 1 107 0 10 399 18 281 -11 663 6 618
Loans 0 0 0 0 0 4 253 4 253 0 4 253
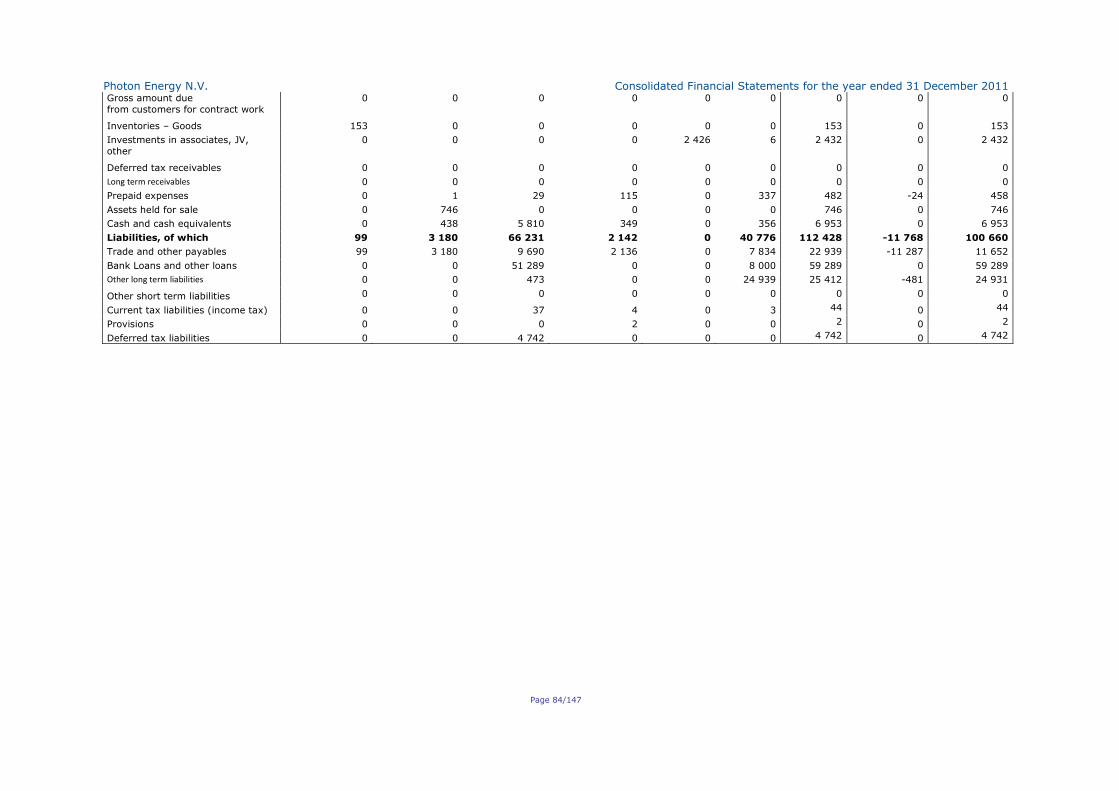
Photon Energy N.V. Consolidated Financial Statements for the year ended 31 December 2011
Page 84/147
Gross amount due
from customers for contract work
0 0 0 0 0 0 0 0 0
Inventories – Goods 153 0 0 0 0 0 153 0 153
Investments in associates, JV,
other
0 0 0 0 2 426 6 2 432 0 2 432
Deferred tax receivables 0 0 0 0 0 0 0 0 0
Long term receivables 0 0 0 0 0 0 0 0 0
Prepaid expenses 0 1 29 115 0 337 482 -24 458
Assets held for sale 0 746 0 0 0 0 746 0 746
Cash and cash equivalents 0 438 5 810 349 0 356 6 953 0 6 953
Liabilities, of which 99 3 180 66 231 2 142 0 40 776 112 428 -11 768 100 660
Trade and other payables 99 3 180 9 690 2 136 0 7 834 22 939 -11 287 11 652
Bank Loans and other loans 0 0 51 289 0 0 8 000 59 289 0 59 289
Other long term liabilities 0 0 473 0 0 24 939 25 412 -481 24 931
Other short term liabilities 0 0 0 0 0 0 0 0 0
Current tax liabilities (income tax) 0 0 37 4 0 3 44 0 44
Provisions 0 0 0 2 0 0 2 0 2
Deferred tax liabilities 0 0 4 742 0 0 0 4 742 0 4 742
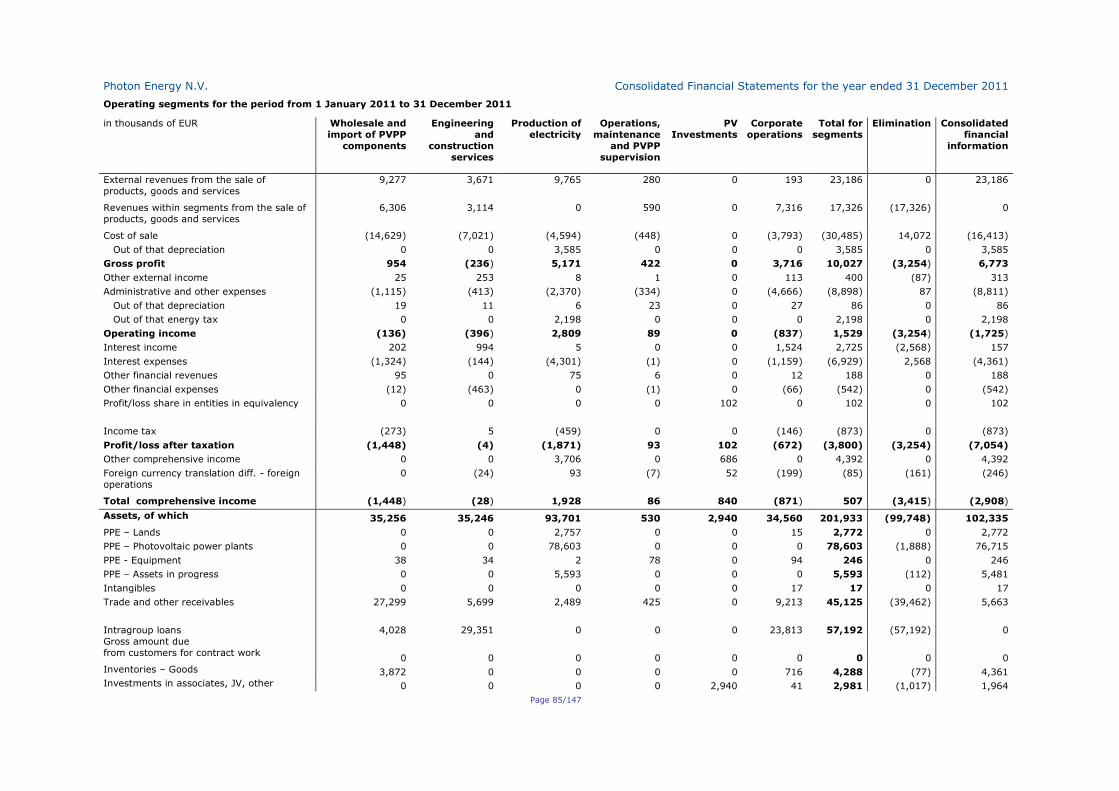
Photon Energy N.V. Consolidated Financial Statements for the year ended 31 December 2011
Page 85/147
Operating segments for the period from 1 January 2011 to 31 December 2011
in thousands of EUR Wholesale and
import of PVPP
components
Engineering
and
construction
services
Production of
electricity
Operations,
maintenance
and PVPP
supervision
PV
Investments
Corporate
operations
Total for
segments
Elimination Consolidated
financial
information
External revenues from the sale of
products, goods and services
9,277 3,671 9,765 280 0 193 23,186 0 23,186
Revenues within segments from the sale of
products, goods and services
6,306 3,114 0 590 0 7,316 17,326 (17,326) 0
Cost of sale (14,629) (7,021) (4,594) (448) 0 (3,793) (30,485) 14,072 (16,413)
Out of that depreciation 0 0 3,585 0 0 0 3,585 0 3,585
Gross profit 954 (236) 5,171 422 0 3,716 10,027 (3,254) 6,773
Other external income 25 253 8 1 0 113 400 (87) 313
Administrative and other expenses (1,115) (413) (2,370) (334) 0 (4,666) (8,898) 87 (8,811)
Out of that depreciation 19 11 6 23 0 27 86 0 86
Out of that energy tax 0 0 2,198 0 0 0 2,198 0 2,198
Operating income (136) (396) 2,809 89 0 (837) 1,529 (3,254) (1,725)
Interest income 202 994 5 0 0 1,524 2,725 (2,568) 157
Interest expenses (1,324) (144) (4,301) (1) 0 (1,159) (6,929) 2,568 (4,361)
Other financial revenues 95 0 75 6 0 12 188 0 188
Other financial expenses (12) (463) 0 (1) 0 (66) (542) 0 (542)
Profit/loss share in entities in equivalency 0 0 0 0 102 0 102 0 102
Income tax (273) 5 (459) 0 0 (146) (873) 0 (873)
Profit/loss after taxation (1,448) (4) (1,871) 93 102 (672) (3,800) (3,254) (7,054)
Other comprehensive income 0 0 3,706 0 686 0 4,392 0 4,392
Foreign currency translation diff. - foreign
operations
0 (24) 93 (7) 52 (199) (85) (161) (246)
Total comprehensive income (1,448) (28) 1,928 86 840 (871) 507 (3,415) (2,908)
Assets, of which 35,256 35,246 93,701 530 2,940 34,560 201,933 (99,748) 102,335
PPE – Lands 0 0 2,757 0 0 15 2,772 0 2,772
PPE – Photovoltaic power plants 0 0 78,603 0 0 0 78,603 (1,888) 76,715
PPE - Equipment 38 34 2 78 0 94 246 0 246
PPE – Assets in progress 0 0 5,593 0 0 0 5,593 (112) 5,481
Intangibles 0 0 0 0 0 17 17 0 17
Trade and other receivables 27,299 5,699 2,489 425 0 9,213 45,125 (39,462) 5,663
Intragroup loans 4,028 29,351 0 0 0 23,813 57,192 (57,192) 0
Gross amount due
from customers for contract work 0 0 0 0 0 0 0 0 0
Inventories – Goods 3,872 0 0 0 0 716 4,288 (77) 4,361 Investments in associates, JV, other 0 0 0 0 2,940 41 2,981 (1,017) 1,964
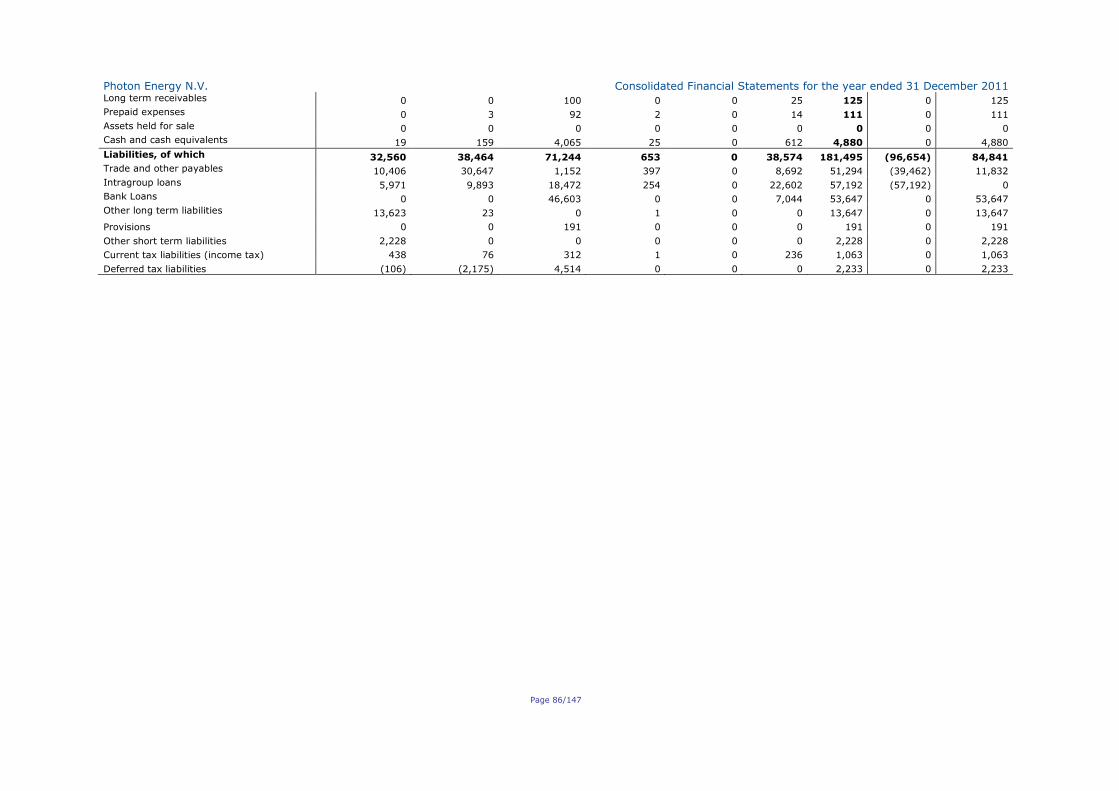
Photon Energy N.V. Consolidated Financial Statements for the year ended 31 December 2011
Page 86/147
Long term receivables 0 0 100 0 0 25 125 0 125
Prepaid expenses 0 3 92 2 0 14 111 0 111
Assets held for sale 0 0 0 0 0 0 0 0 0
Cash and cash equivalents 19 159 4,065 25 0 612 4,880 0 4,880
Liabilities, of which 32,560 38,464 71,244 653 0 38,574 181,495 (96,654) 84,841 Trade and other payables 10,406 30,647 1,152 397 0 8,692 51,294 (39,462) 11,832
Intragroup loans 5,971 9,893 18,472 254 0 22,602 57,192 (57,192) 0 Bank Loans 0 0 46,603 0 0 7,044 53,647 0 53,647
Other long term liabilities 13,623 23 0 1 0 0 13,647 0 13,647
Provisions 0 0 191 0 0 0 191 0 191
Other short term liabilities 2,228 0 0 0 0 0 2,228 0 2,228
Current tax liabilities (income tax) 438 76 312 1 0 236 1,063 0 1,063
Deferred tax liabilities (106) (2,175) 4,514 0 0 0 2,233 0 2,233
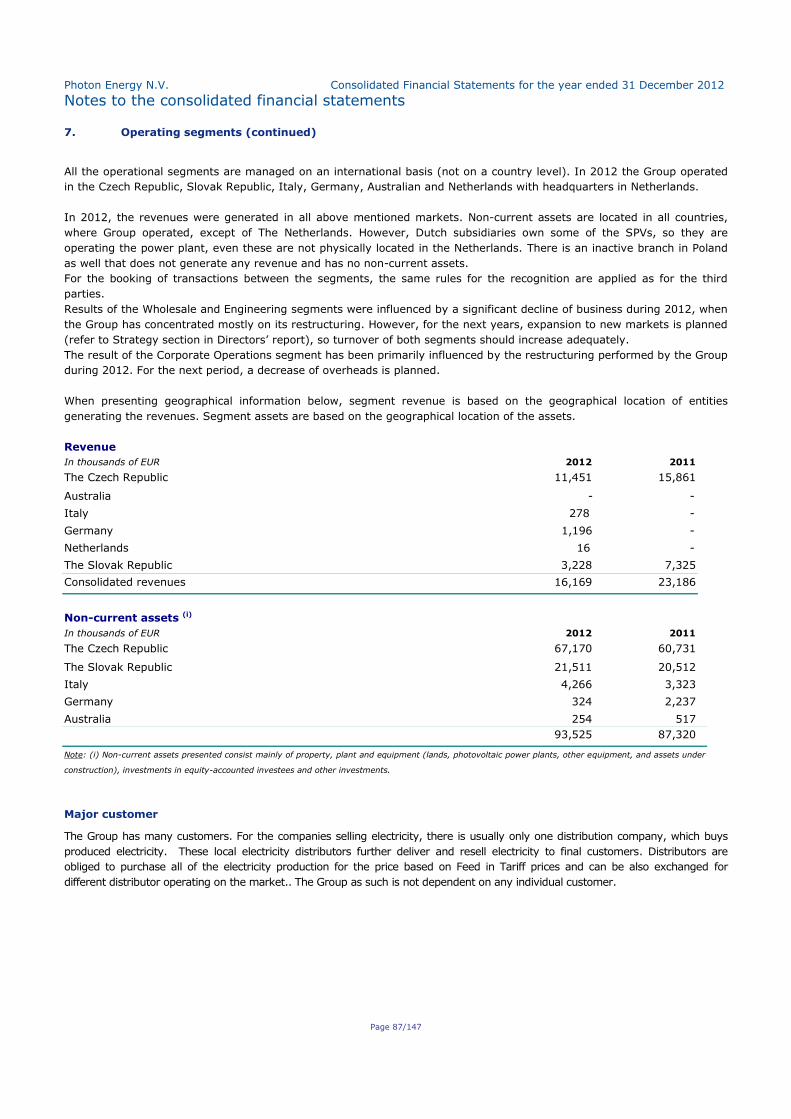
Photon Energy N.V. Consolidated Financial Statements for the year ended 31 December 2012
Notes to the consolidated financial statements
Page 87/147
7. Operating segments (continued)
All the operational segments are managed on an international basis (not on a country level). In 2012 the Group operated
in the Czech Republic, Slovak Republic, Italy, Germany, Australian and Netherlands with headquarters in Netherlands.
In 2012, the revenues were generated in all above mentioned markets. Non-current assets are located in all countries,
where Group operated, except of The Netherlands. However, Dutch subsidiaries own some of the SPVs, so they are
operating the power plant, even these are not physically located in the Netherlands. There is an inactive branch in Poland
as well that does not generate any revenue and has no non-current assets.
For the booking of transactions between the segments, the same rules for the recognition are applied as for the third
parties.
Results of the Wholesale and Engineering segments were influenced by a significant decline of business during 2012, when
the Group has concentrated mostly on its restructuring. However, for the next years, expansion to new markets is planned
(refer to Strategy section in Directors’ report), so turnover of both segments should increase adequately.
The result of the Corporate Operations segment has been primarily influenced by the restructuring performed by the Group
during 2012. For the next period, a decrease of overheads is planned.
When presenting geographical information below, segment revenue is based on the geographical location of entities
generating the revenues. Segment assets are based on the geographical location of the assets.
Revenue
In thousands of EUR 2012 2011
The Czech Republic 11,451 15,861
Australia - -
Italy 278 -
Germany 1,196 -
Netherlands 16 -
The Slovak Republic 3,228 7,325
Consolidated revenues 16,169 23,186
Non-current assets (i)
In thousands of EUR 2012 2011
The Czech Republic 67,170 60,731
The Slovak Republic 21,511 20,512
Italy 4,266 3,323
Germany 324 2,237
Australia 254 517
93,525 87,320
Note: (i) Non-current assets presented consist mainly of property, plant and equipment (lands, photovoltaic power plants, other equipment, and assets under
construction), investments in equity-accounted investees and other investments.
Major customer
The Group has many customers. For the companies selling electricity, there is usually only one distribution company, which buys
produced electricity. These local electricity distributors further deliver and resell electricity to final customers. Distributors are
obliged to purchase all of the electricity production for the price based on Feed in Tariff prices and can be also exchanged for
different distributor operating on the market.. The Group as such is not dependent on any individual customer.
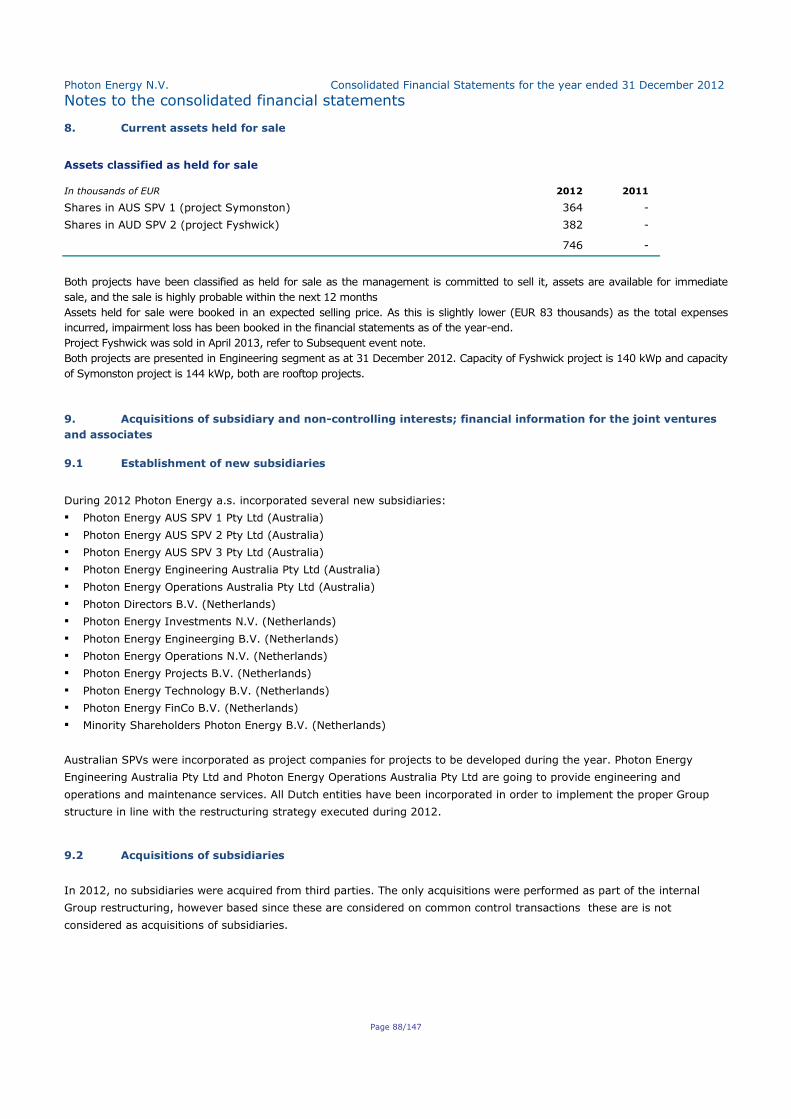
Photon Energy N.V. Consolidated Financial Statements for the year ended 31 December 2012
Notes to the consolidated financial statements
Page 88/147
8. Current assets held for sale
Assets classified as held for sale
In thousands of EUR 2012 2011
Shares in AUS SPV 1 (project Symonston) 364 -
Shares in AUD SPV 2 (project Fyshwick) 382 -
746 -
Both projects have been classified as held for sale as the management is committed to sell it, assets are available for immediate
sale, and the sale is highly probable within the next 12 months
Assets held for sale were booked in an expected selling price. As this is slightly lower (EUR 83 thousands) as the total expenses
incurred, impairment loss has been booked in the financial statements as of the year-end.
Project Fyshwick was sold in April 2013, refer to Subsequent event note.
Both projects are presented in Engineering segment as at 31 December 2012. Capacity of Fyshwick project is 140 kWp and capacity
of Symonston project is 144 kWp, both are rooftop projects.
9. Acquisitions of subsidiary and non-controlling interests; financial information for the joint ventures
and associates
9.1 Establishment of new subsidiaries
During 2012 Photon Energy a.s. incorporated several new subsidiaries:
Photon Energy AUS SPV 1 Pty Ltd (Australia)
Photon Energy AUS SPV 2 Pty Ltd (Australia)
Photon Energy AUS SPV 3 Pty Ltd (Australia)
Photon Energy Engineering Australia Pty Ltd (Australia)
Photon Energy Operations Australia Pty Ltd (Australia)
Photon Directors B.V. (Netherlands)
Photon Energy Investments N.V. (Netherlands)
Photon Energy Engineerging B.V. (Netherlands)
Photon Energy Operations N.V. (Netherlands)
Photon Energy Projects B.V. (Netherlands)
Photon Energy Technology B.V. (Netherlands)
Photon Energy FinCo B.V. (Netherlands)
Minority Shareholders Photon Energy B.V. (Netherlands)
Australian SPVs were incorporated as project companies for projects to be developed during the year. Photon Energy
Engineering Australia Pty Ltd and Photon Energy Operations Australia Pty Ltd are going to provide engineering and
operations and maintenance services. All Dutch entities have been incorporated in order to implement the proper Group
structure in line with the restructuring strategy executed during 2012.
9.2 Acquisitions of subsidiaries
In 2012, no subsidiaries were acquired from third parties. The only acquisitions were performed as part of the internal
Group restructuring, however based since these are considered on common control transactions these are is not
considered as acquisitions of subsidiaries.
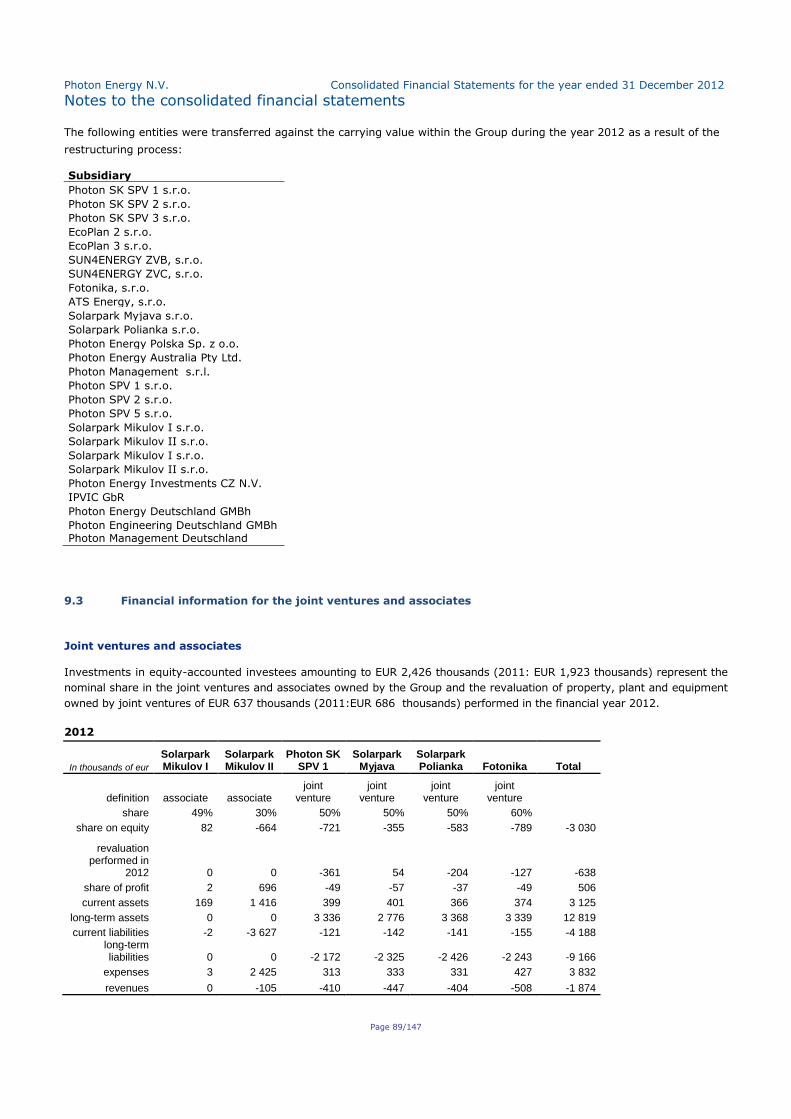
Photon Energy N.V. Consolidated Financial Statements for the year ended 31 December 2012
Notes to the consolidated financial statements
Page 89/147
The following entities were transferred against the carrying value within the Group during the year 2012 as a result of the
restructuring process:
Subsidiary
Photon SK SPV 1 s.r.o.
Photon SK SPV 2 s.r.o.
Photon SK SPV 3 s.r.o.
EcoPlan 2 s.r.o.
EcoPlan 3 s.r.o.
SUN4ENERGY ZVB, s.r.o.
SUN4ENERGY ZVC, s.r.o.
Fotonika, s.r.o.
ATS Energy, s.r.o.
Solarpark Myjava s.r.o.
Solarpark Polianka s.r.o.
Photon Energy Polska Sp. z o.o.
Photon Energy Australia Pty Ltd.
Photon Management s.r.l.
Photon SPV 1 s.r.o.
Photon SPV 2 s.r.o.
Photon SPV 5 s.r.o.
Solarpark Mikulov I s.r.o.
Solarpark Mikulov II s.r.o.
Solarpark Mikulov I s.r.o.
Solarpark Mikulov II s.r.o.
Photon Energy Investments CZ N.V.
IPVIC GbR
Photon Energy Deutschland GMBh
Photon Engineering Deutschland GMBh Photon Management Deutschland GMBh
9.3 Financial information for the joint ventures and associates
Joint ventures and associates
Investments in equity-accounted investees amounting to EUR 2,426 thousands (2011: EUR 1,923 thousands) represent the
nominal share in the joint ventures and associates owned by the Group and the revaluation of property, plant and equipment
owned by joint ventures of EUR 637 thousands (2011:EUR 686 thousands) performed in the financial year 2012.
2012
In thousands of eur
Solarpark Mikulov I
Solarpark Mikulov II
Photon SK SPV 1
Solarpark Myjava
Solarpark Polianka Fotonika Total
definition associate associate joint
venture joint
venture joint
venture joint
venture share 49% 30% 50% 50% 50% 60%
share on equity 82 -664 -721 -355 -583 -789 -3 030
revaluation performed in
2012 0 0 -361 54 -204 -127 -638
share of profit 2 696 -49 -57 -37 -49 506
current assets 169 1 416 399 401 366 374 3 125
long-term assets 0 0 3 336 2 776 3 368 3 339 12 819
current liabilities -2 -3 627 -121 -142 -141 -155 -4 188 long-term liabilities 0 0 -2 172 -2 325 -2 426 -2 243 -9 166
expenses 3 2 425 313 333 331 427 3 832
revenues 0 -105 -410 -447 -404 -508 -1 874
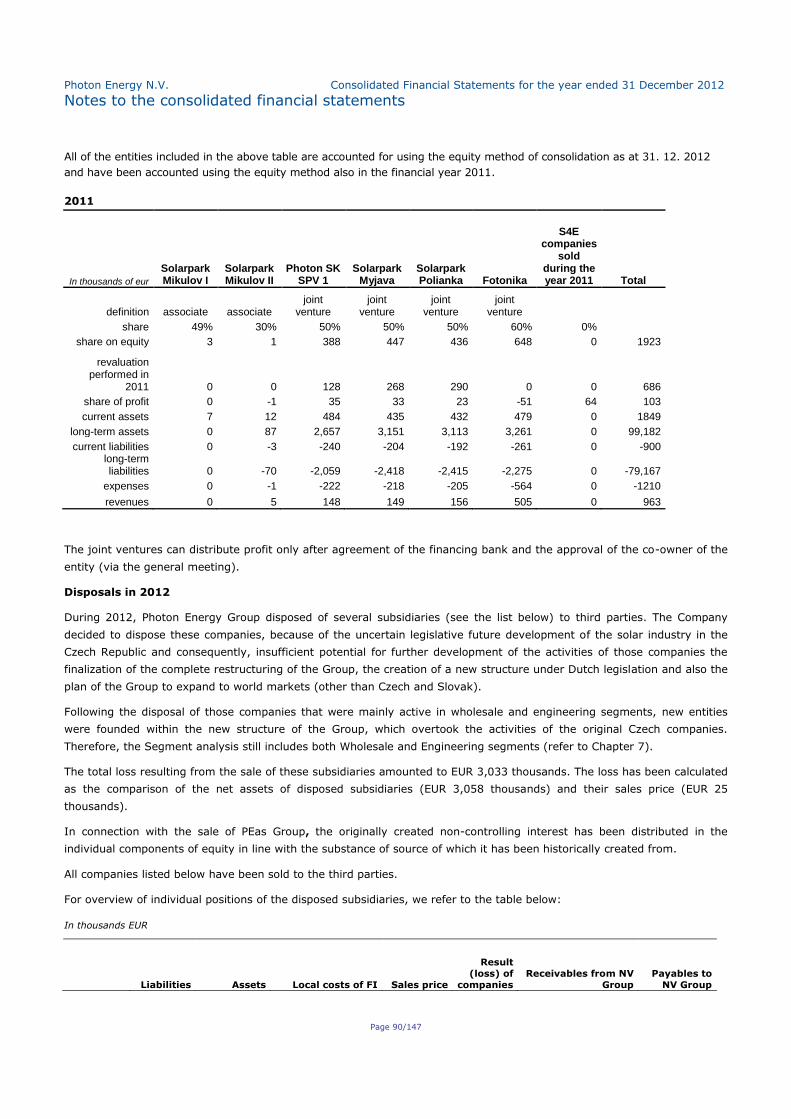
Photon Energy N.V. Consolidated Financial Statements for the year ended 31 December 2012
Notes to the consolidated financial statements
Page 90/147
All of the entities included in the above table are accounted for using the equity method of consolidation as at 31. 12. 2012
and have been accounted using the equity method also in the financial year 2011.
2011
In thousands of eur
Solarpark Mikulov I
Solarpark Mikulov II
Photon SK SPV 1
Solarpark Myjava
Solarpark Polianka Fotonika
S4E companies
sold during the year 2011 Total
definition associate associate joint
venture joint
venture joint
venture joint
venture share 49% 30% 50% 50% 50% 60% 0%
share on equity 3 1 388 447 436 648 0 1923
revaluation performed in
2011 0 0 128 268 290 0 0 686
share of profit 0 -1 35 33 23 -51 64 103
current assets 7 12 484 435 432 479 0 1849
long-term assets 0 87 2,657 3,151 3,113 3,261 0 99,182
current liabilities 0 -3 -240 -204 -192 -261 0 -900 long-term liabilities 0 -70 -2,059 -2,418 -2,415 -2,275 0 -79,167
expenses 0 -1 -222 -218 -205 -564 0 -1210
revenues 0 5 148 149 156 505 0 963
The joint ventures can distribute profit only after agreement of the financing bank and the approval of the co-owner of the
entity (via the general meeting).
Disposals in 2012
During 2012, Photon Energy Group disposed of several subsidiaries (see the list below) to third parties. The Company
decided to dispose these companies, because of the uncertain legislative future development of the solar industry in the
Czech Republic and consequently, insufficient potential for further development of the activities of those companies the
finalization of the complete restructuring of the Group, the creation of a new structure under Dutch legislation and also the
plan of the Group to expand to world markets (other than Czech and Slovak).
Following the disposal of those companies that were mainly active in wholesale and engineering segments, new entities
were founded within the new structure of the Group, which overtook the activities of the original Czech companies.
Therefore, the Segment analysis still includes both Wholesale and Engineering segments (refer to Chapter 7).
The total loss resulting from the sale of these subsidiaries amounted to EUR 3,033 thousands. The loss has been calculated
as the comparison of the net assets of disposed subsidiaries (EUR 3,058 thousands) and their sales price (EUR 25
thousands).
In connection with the sale of PEas Group, the originally created non-controlling interest has been distributed in the
individual components of equity in line with the substance of source of which it has been historically created from.
All companies listed below have been sold to the third parties.
For overview of individual positions of the disposed subsidiaries, we refer to the table below:
In thousands EUR
Liabilities Assets Local costs of FI Sales price
Result
(loss) of
companies
Receivables from NV
Group
Payables to
NV Group
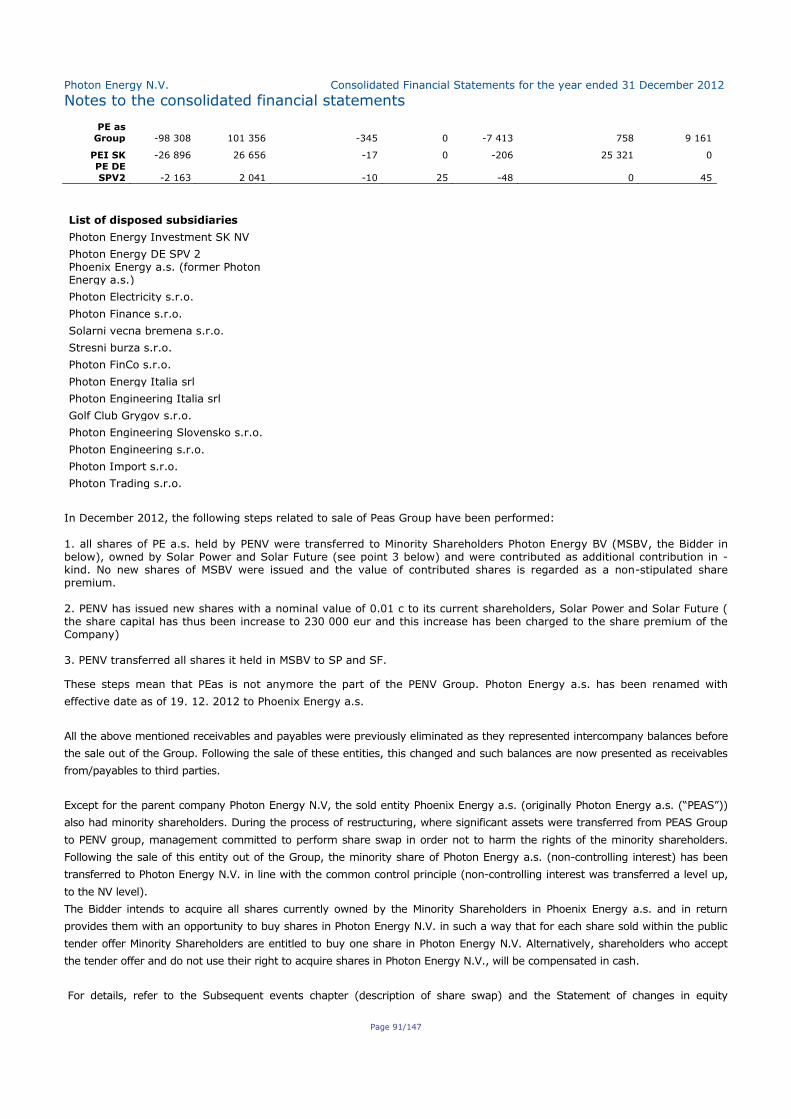
Photon Energy N.V. Consolidated Financial Statements for the year ended 31 December 2012
Notes to the consolidated financial statements
Page 91/147
PE as
Group -98 308 101 356 -345 0 -7 413 758 9 161
PEI SK -26 896 26 656 -17 0 -206 25 321 0
PE DE
SPV2 -2 163 2 041 -10 25 -48 0 45
List of disposed subsidiaries
Photon Energy Investment SK NV
Photon Energy DE SPV 2 Phoenix Energy a.s. (former Photon Energy a.s.)
Photon Electricity s.r.o.
Photon Finance s.r.o.
Solarni vecna bremena s.r.o.
Stresni burza s.r.o.
Photon FinCo s.r.o.
Photon Energy Italia srl
Photon Engineering Italia srl
Golf Club Grygov s.r.o.
Photon Engineering Slovensko s.r.o.
Photon Engineering s.r.o.
Photon Import s.r.o.
Photon Trading s.r.o.
In December 2012, the following steps related to sale of Peas Group have been performed:
1. all shares of PE a.s. held by PENV were transferred to Minority Shareholders Photon Energy BV (MSBV, the Bidder in below), owned by Solar Power and Solar Future (see point 3 below) and were contributed as additional contribution in -kind. No new shares of MSBV were issued and the value of contributed shares is regarded as a non-stipulated share premium. 2. PENV has issued new shares with a nominal value of 0.01 c to its current shareholders, Solar Power and Solar Future ( the share capital has thus been increase to 230 000 eur and this increase has been charged to the share premium of the Company) 3. PENV transferred all shares it held in MSBV to SP and SF.
These steps mean that PEas is not anymore the part of the PENV Group. Photon Energy a.s. has been renamed with
effective date as of 19. 12. 2012 to Phoenix Energy a.s.
All the above mentioned receivables and payables were previously eliminated as they represented intercompany balances before
the sale out of the Group. Following the sale of these entities, this changed and such balances are now presented as receivables
from/payables to third parties.
Except for the parent company Photon Energy N.V, the sold entity Phoenix Energy a.s. (originally Photon Energy a.s. (“PEAS”))
also had minority shareholders. During the process of restructuring, where significant assets were transferred from PEAS Group
to PENV group, management committed to perform share swap in order not to harm the rights of the minority shareholders.
Following the sale of this entity out of the Group, the minority share of Photon Energy a.s. (non-controlling interest) has been
transferred to Photon Energy N.V. in line with the common control principle (non-controlling interest was transferred a level up,
to the NV level).
The Bidder intends to acquire all shares currently owned by the Minority Shareholders in Phoenix Energy a.s. and in return
provides them with an opportunity to buy shares in Photon Energy N.V. in such a way that for each share sold within the public
tender offer Minority Shareholders are entitled to buy one share in Photon Energy N.V. Alternatively, shareholders who accept
the tender offer and do not use their right to acquire shares in Photon Energy N.V., will be compensated in cash.
For details, refer to the Subsequent events chapter (description of share swap) and the Statement of changes in equity
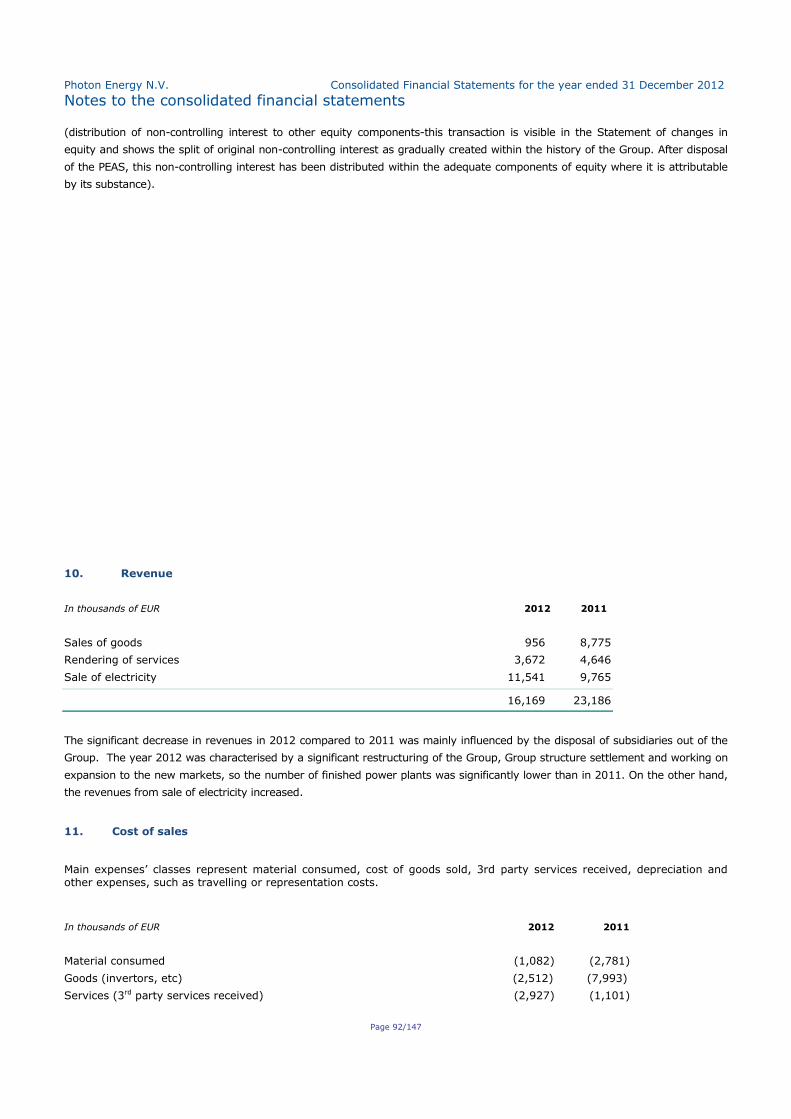
Photon Energy N.V. Consolidated Financial Statements for the year ended 31 December 2012
Notes to the consolidated financial statements
Page 92/147
(distribution of non-controlling interest to other equity components-this transaction is visible in the Statement of changes in
equity and shows the split of original non-controlling interest as gradually created within the history of the Group. After disposal
of the PEAS, this non-controlling interest has been distributed within the adequate components of equity where it is attributable
by its substance).
10. Revenue
In thousands of EUR 2012 2011
Sales of goods 956 8,775
Rendering of services 3,672 4,646
Sale of electricity 11,541 9,765
16,169 23,186
The significant decrease in revenues in 2012 compared to 2011 was mainly influenced by the disposal of subsidiaries out of the
Group. The year 2012 was characterised by a significant restructuring of the Group, Group structure settlement and working on
expansion to the new markets, so the number of finished power plants was significantly lower than in 2011. On the other hand,
the revenues from sale of electricity increased.
11. Cost of sales
Main expenses’ classes represent material consumed, cost of goods sold, 3rd party services received, depreciation and other expenses, such as travelling or representation costs.
In thousands of EUR 2012 2011
Material consumed (1,082) (2,781)
Goods (invertors, etc) (2,512) (7,993)
Services (3rd party services received) (2,927) (1,101)
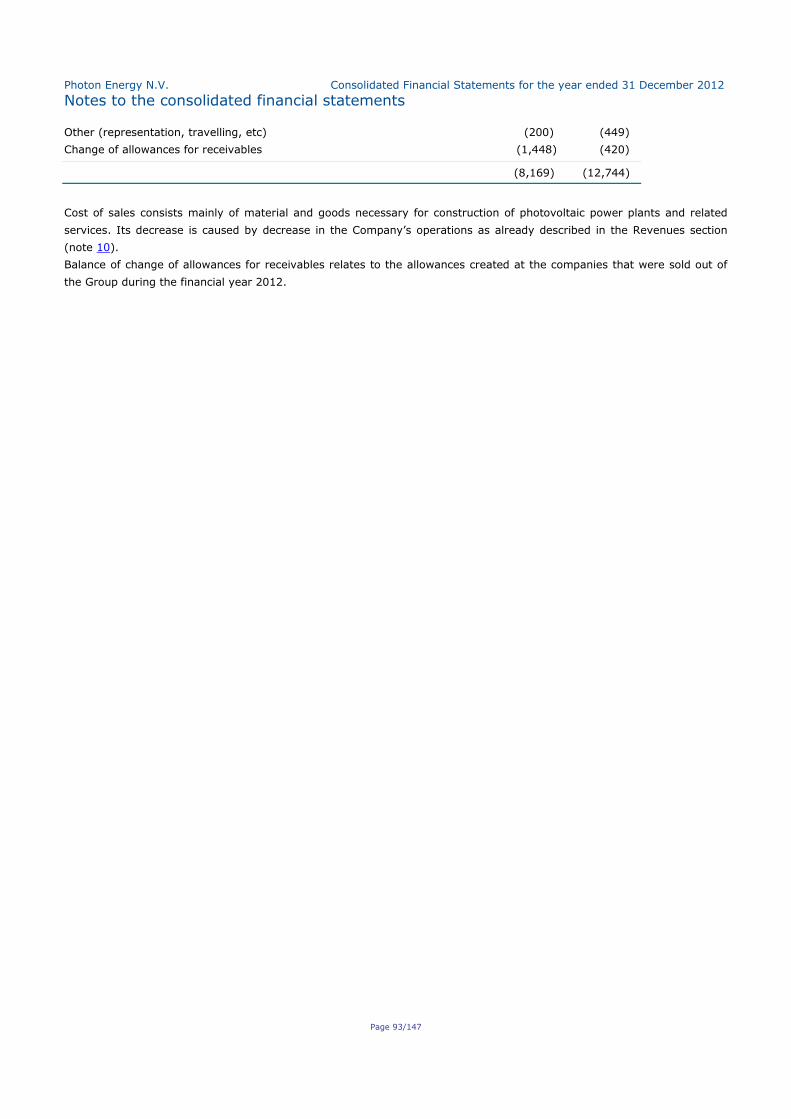
Photon Energy N.V. Consolidated Financial Statements for the year ended 31 December 2012
Notes to the consolidated financial statements
Page 93/147
Other (representation, travelling, etc) (200) (449)
Change of allowances for receivables (1,448) (420)
(8,169) (12,744)
Cost of sales consists mainly of material and goods necessary for construction of photovoltaic power plants and related
services. Its decrease is caused by decrease in the Company’s operations as already described in the Revenues section
(note 10).
Balance of change of allowances for receivables relates to the allowances created at the companies that were sold out of
the Group during the financial year 2012.
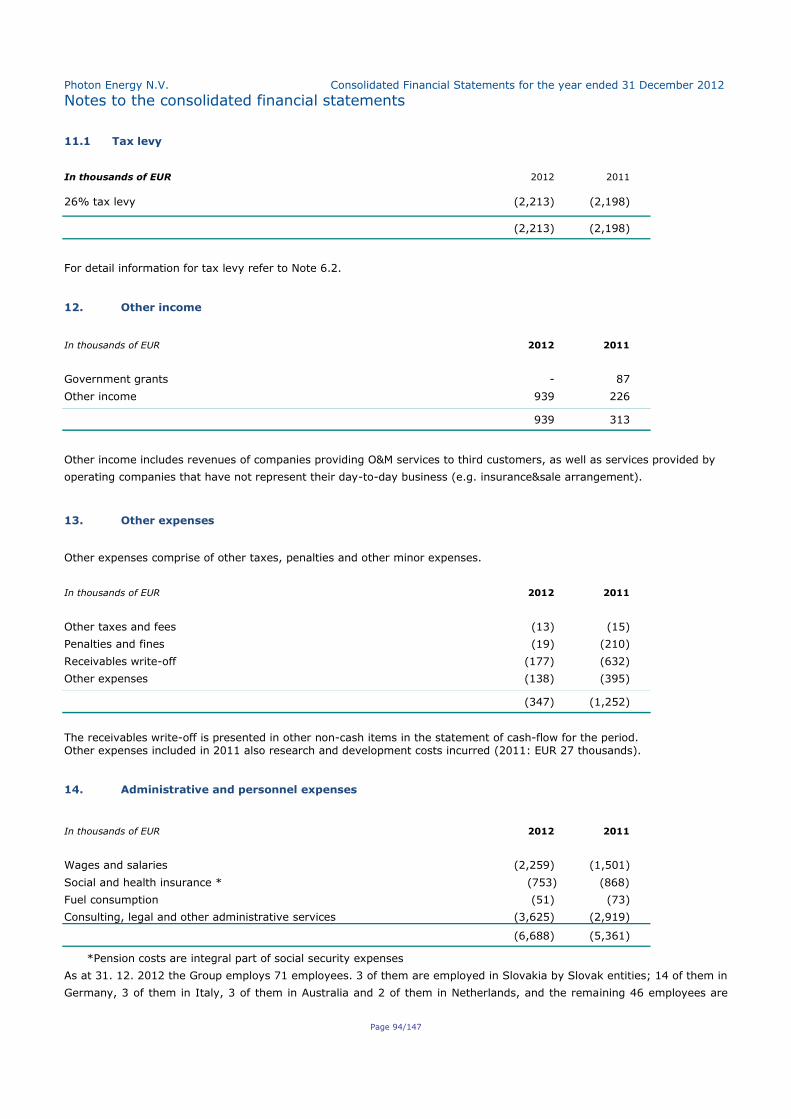
Photon Energy N.V. Consolidated Financial Statements for the year ended 31 December 2012
Notes to the consolidated financial statements
Page 94/147
11.1 Tax levy
In thousands of EUR 2012 2011
26% tax levy (2,213) (2,198)
(2,213) (2,198)
For detail information for tax levy refer to Note 6.2.
12. Other income
In thousands of EUR 2012 2011
Government grants - 87
Other income 939 226
939 313
Other income includes revenues of companies providing O&M services to third customers, as well as services provided by
operating companies that have not represent their day-to-day business (e.g. insurance&sale arrangement).
13. Other expenses
Other expenses comprise of other taxes, penalties and other minor expenses.
In thousands of EUR 2012 2011
Other taxes and fees (13) (15)
Penalties and fines (19) (210)
Receivables write-off (177) (632)
Other expenses (138) (395)
(347) (1,252)
The receivables write-off is presented in other non-cash items in the statement of cash-flow for the period. Other expenses included in 2011 also research and development costs incurred (2011: EUR 27 thousands).
14. Administrative and personnel expenses
In thousands of EUR 2012 2011
Wages and salaries (2,259) (1,501)
Social and health insurance * (753) (868)
Fuel consumption (51) (73)
Consulting, legal and other administrative services (3,625) (2,919)
(6,688) (5,361)
*Pension costs are integral part of social security expenses
As at 31. 12. 2012 the Group employs 71 employees. 3 of them are employed in Slovakia by Slovak entities; 14 of them in
Germany, 3 of them in Italy, 3 of them in Australia and 2 of them in Netherlands, and the remaining 46 employees are
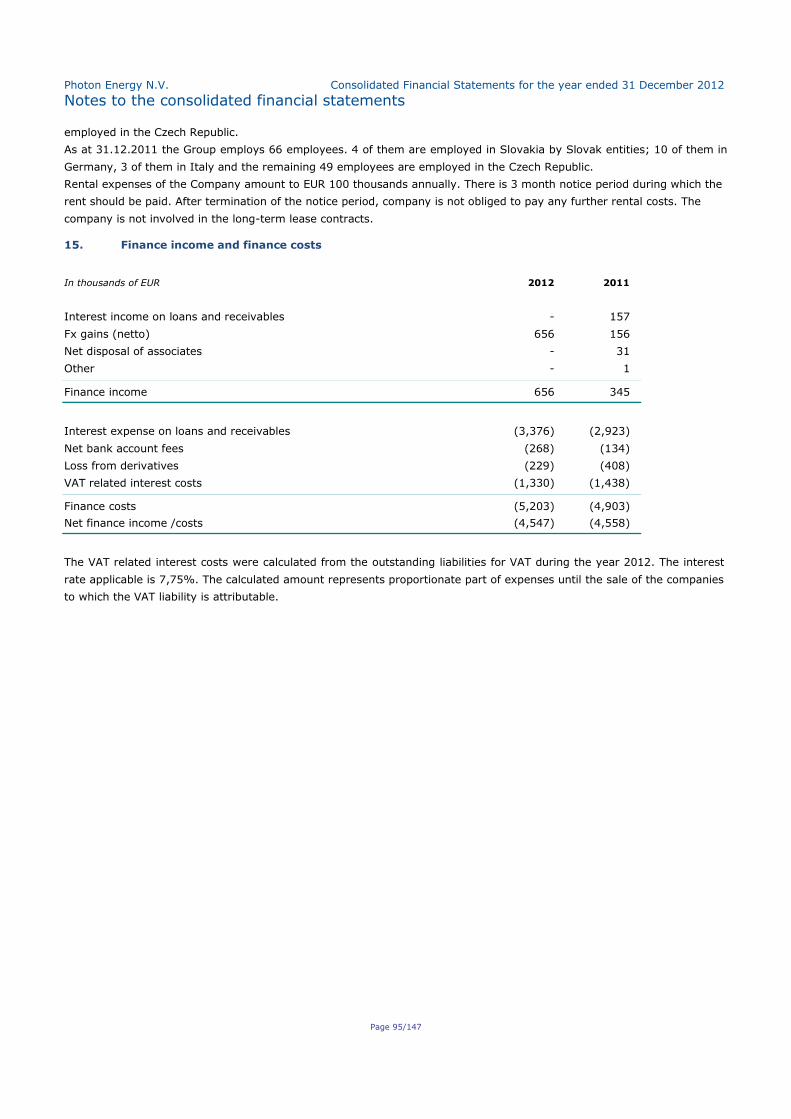
Photon Energy N.V. Consolidated Financial Statements for the year ended 31 December 2012
Notes to the consolidated financial statements
Page 95/147
employed in the Czech Republic.
As at 31.12.2011 the Group employs 66 employees. 4 of them are employed in Slovakia by Slovak entities; 10 of them in
Germany, 3 of them in Italy and the remaining 49 employees are employed in the Czech Republic.
Rental expenses of the Company amount to EUR 100 thousands annually. There is 3 month notice period during which the
rent should be paid. After termination of the notice period, company is not obliged to pay any further rental costs. The
company is not involved in the long-term lease contracts.
15. Finance income and finance costs
In thousands of EUR 2012 2011
Interest income on loans and receivables - 157
Fx gains (netto) 656 156
Net disposal of associates - 31
Other - 1
Finance income 656 345
Interest expense on loans and receivables (3,376) (2,923)
Net bank account fees (268) (134)
Loss from derivatives (229) (408)
VAT related interest costs (1,330) (1,438)
Finance costs (5,203) (4,903)
Net finance income /costs (4,547) (4,558)
The VAT related interest costs were calculated from the outstanding liabilities for VAT during the year 2012. The interest
rate applicable is 7,75%. The calculated amount represents proportionate part of expenses until the sale of the companies
to which the VAT liability is attributable.
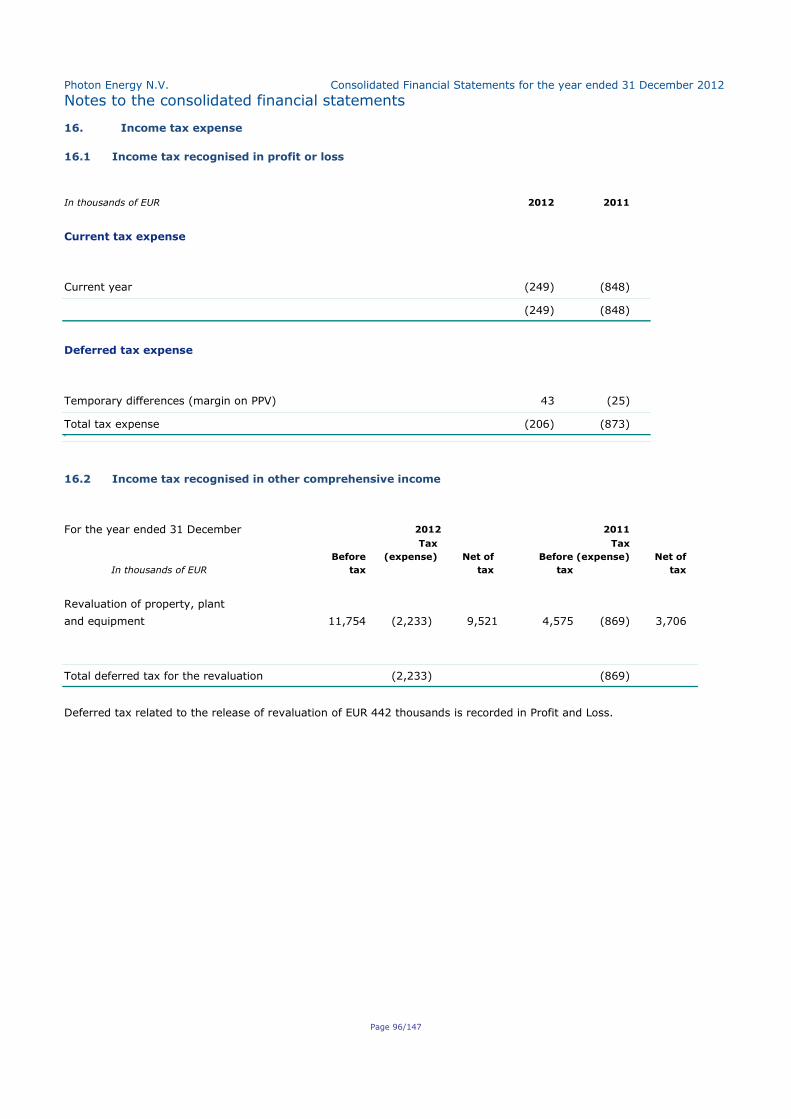
Photon Energy N.V. Consolidated Financial Statements for the year ended 31 December 2012
Notes to the consolidated financial statements
Page 96/147
16. Income tax expense
16.1 Income tax recognised in profit or loss
In thousands of EUR 2012 2011
Current tax expense
Current year (249) (848)
(249) (848)
Deferred tax expense
Temporary differences (margin on PPV) 43 (25)
Total tax expense (206) (873) T
16.2 Income tax recognised in other comprehensive income
For the year ended 31 December 2012 2011
Tax Tax
Before (expense) Net of Before (expense) Net of
In thousands of EUR tax tax tax tax
Revaluation of property, plant
and equipment 11,754 (2,233) 9,521 4,575 (869) 3,706
Total deferred tax for the revaluation (2,233) (869)
Deferred tax related to the release of revaluation of EUR 442 thousands is recorded in Profit and Loss.
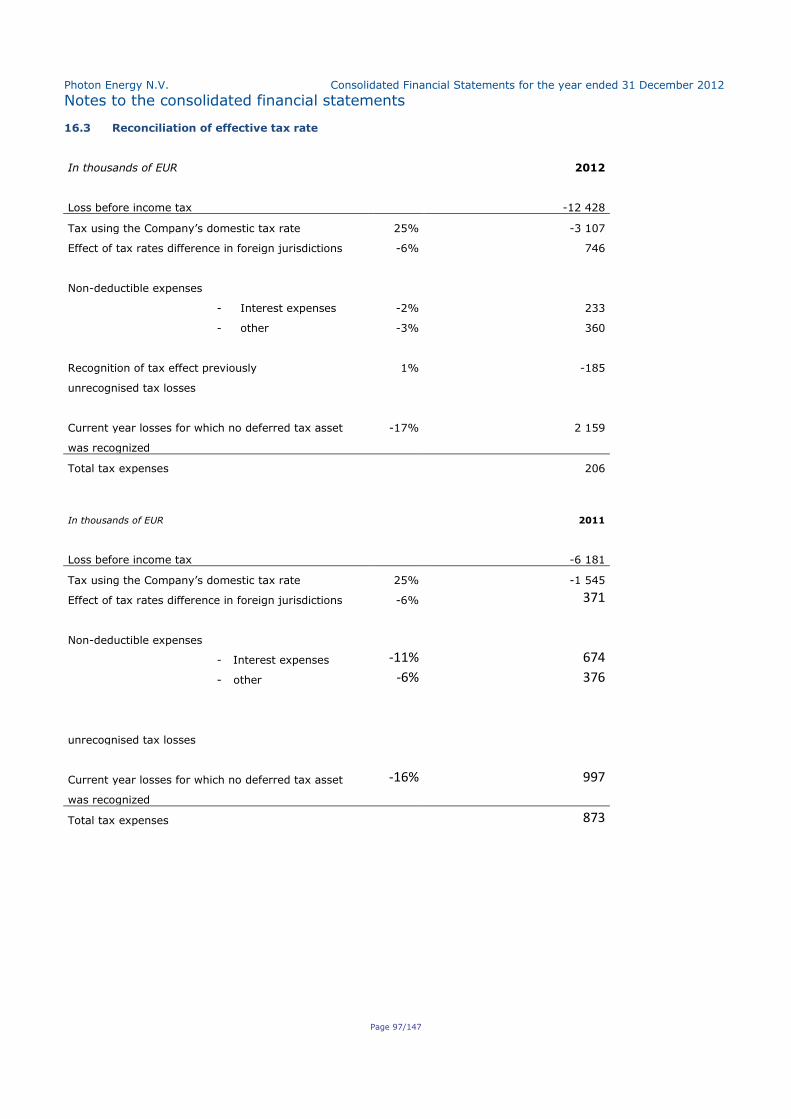
Photon Energy N.V. Consolidated Financial Statements for the year ended 31 December 2012
Notes to the consolidated financial statements
Page 97/147
16.3 Reconciliation of effective tax rate
In thousands of EUR
2012
Loss before income tax -12 428
Tax using the Company’s domestic tax rate 25% -3 107
Effect of tax rates difference in foreign jurisdictions -6% 746
Non-deductible expenses
- Interest expenses -2% 233
- other -3% 360
Recognition of tax effect previously 1% -185
unrecognised tax losses
Current year losses for which no deferred tax asset -17% 2 159
was recognized
Total tax expenses
206
In thousands of EUR
2011
Loss before income tax -6 181
Tax using the Company’s domestic tax rate 25% -1 545
Effect of tax rates difference in foreign jurisdictions -6% 371
Non-deductible expenses
- Interest expenses -11% 674
- other -6% 376
unrecognised tax losses
Current year losses for which no deferred tax asset -16% 997
was recognized
Total tax expenses
873
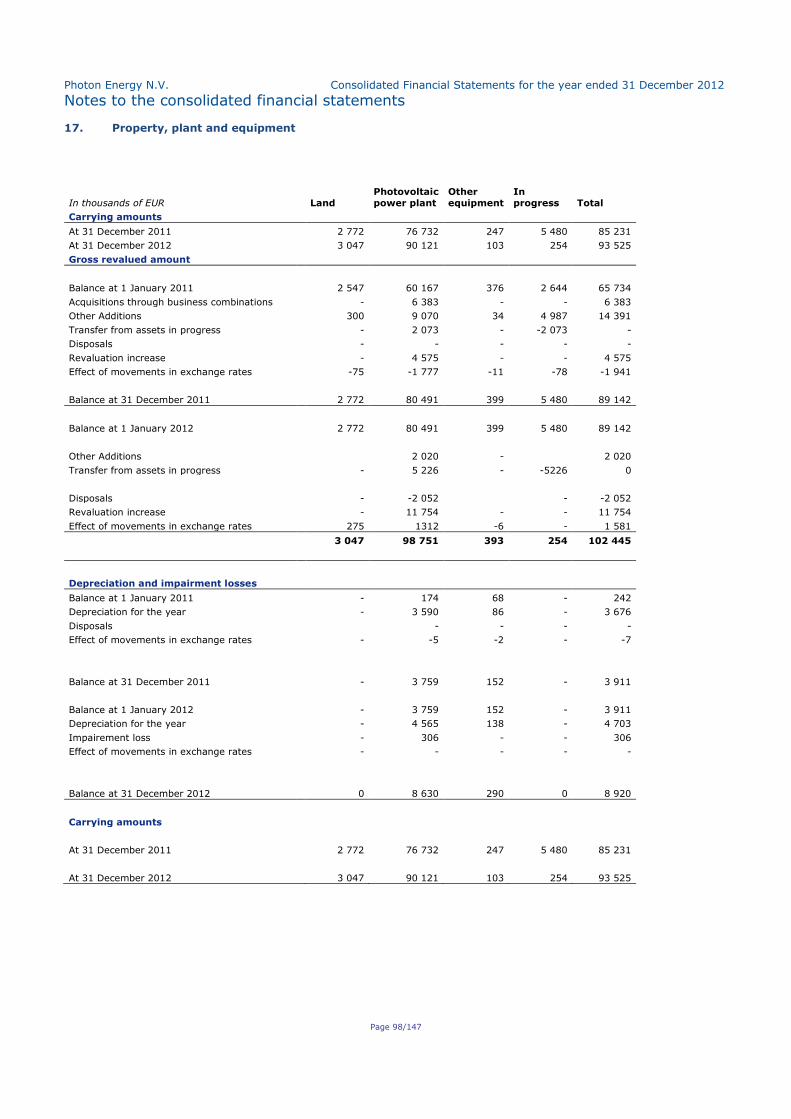
Photon Energy N.V. Consolidated Financial Statements for the year ended 31 December 2012
Notes to the consolidated financial statements
Page 98/147
17. Property, plant and equipment
In thousands of EUR Land
Photovoltaic
power plant
Other
equipment
In
progress Total
Carrying amounts
At 31 December 2011 2 772 76 732 247 5 480 85 231
At 31 December 2012 3 047 90 121 103 254 93 525
Gross revalued amount
Balance at 1 January 2011 2 547 60 167 376 2 644 65 734
Acquisitions through business combinations - 6 383 - - 6 383
Other Additions 300 9 070 34 4 987 14 391
Transfer from assets in progress - 2 073 - -2 073 -
Disposals
- - - - -
Revaluation increase - 4 575 - - 4 575
Effect of movements in exchange rates -75 -1 777 -11 -78 -1 941
Balance at 31 December 2011 2 772 80 491 399 5 480 89 142
Balance at 1 January 2012 2 772 80 491 399 5 480 89 142
Other Additions
2 020 -
2 020
Transfer from assets in progress - 5 226 - -5226 0
Disposals
- -2 052
- -2 052
Revaluation increase - 11 754 - - 11 754
Effect of movements in exchange rates 275 1312 -6 - 1 581
3 047 98 751 393 254 102 445
Depreciation and impairment losses
Balance at 1 January 2011 - 174 68 - 242
Depreciation for the year - 3 590 86 - 3 676
Disposals
- - - -
Effect of movements in exchange rates - -5 -2 - -7
Balance at 31 December 2011 - 3 759 152 - 3 911
Balance at 1 January 2012 - 3 759 152 - 3 911
Depreciation for the year - 4 565 138 - 4 703
Impairement loss
- 306 - - 306
Effect of movements in exchange rates - - - - -
Balance at 31 December 2012 0 8 630 290 0 8 920
Carrying amounts
At 31 December 2011 2 772 76 732 247 5 480 85 231
At 31 December 2012 3 047 90 121 103 254 93 525
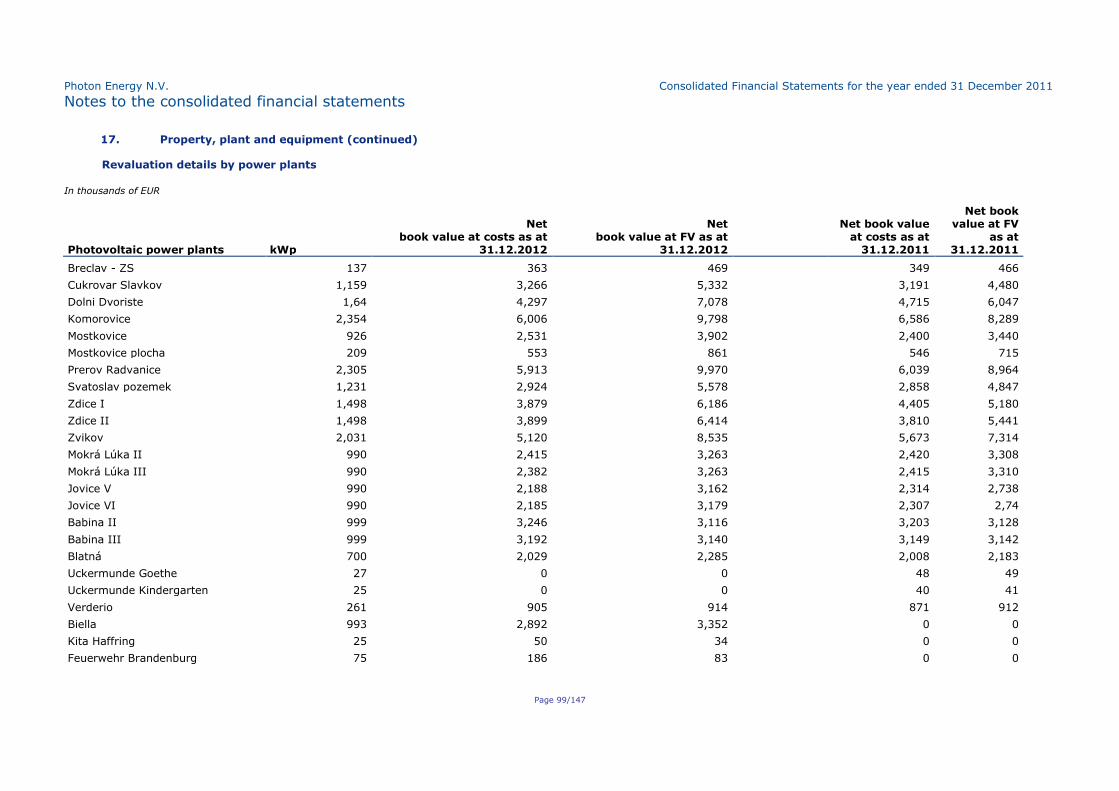
Photon Energy N.V. Consolidated Financial Statements for the year ended 31 December 2011
Notes to the consolidated financial statements
Page 99/147
17. Property, plant and equipment (continued)
Revaluation details by power plants
In thousands of EUR
Photovoltaic power plants kWp
Net book value at costs as at
31.12.2012
Net book value at FV as at
31.12.2012
Net book value at costs as at
31.12.2011
Net book value at FV
as at 31.12.2011
Breclav - ZS 137 363 469
349 466
Cukrovar Slavkov 1,159 3,266 5,332
3,191 4,480
Dolni Dvoriste 1,64 4,297 7,078
4,715 6,047
Komorovice 2,354 6,006 9,798
6,586 8,289
Mostkovice 926 2,531 3,902
2,400 3,440
Mostkovice plocha 209 553 861
546 715
Prerov Radvanice 2,305 5,913 9,970
6,039 8,964
Svatoslav pozemek 1,231 2,924 5,578
2,858 4,847
Zdice I 1,498 3,879 6,186
4,405 5,180
Zdice II 1,498 3,899 6,414
3,810 5,441
Zvikov 2,031 5,120 8,535
5,673 7,314
Mokrá Lúka II 990 2,415 3,263
2,420 3,308
Mokrá Lúka III 990 2,382 3,263
2,415 3,310
Jovice V 990 2,188 3,162
2,314 2,738
Jovice VI 990 2,185 3,179
2,307 2,74
Babina II 999 3,246 3,116
3,203 3,128
Babina III 999 3,192 3,140
3,149 3,142
Blatná 700 2,029 2,285
2,008 2,183
Uckermunde Goethe 27 0 0
48 49
Uckermunde Kindergarten 25 0 0
40 41
Verderio 261 905 914
871 912
Biella 993 2,892 3,352
0 0
Kita Haffring 25 50 34
0 0
Feuerwehr Brandenburg 75 186 83
0 0
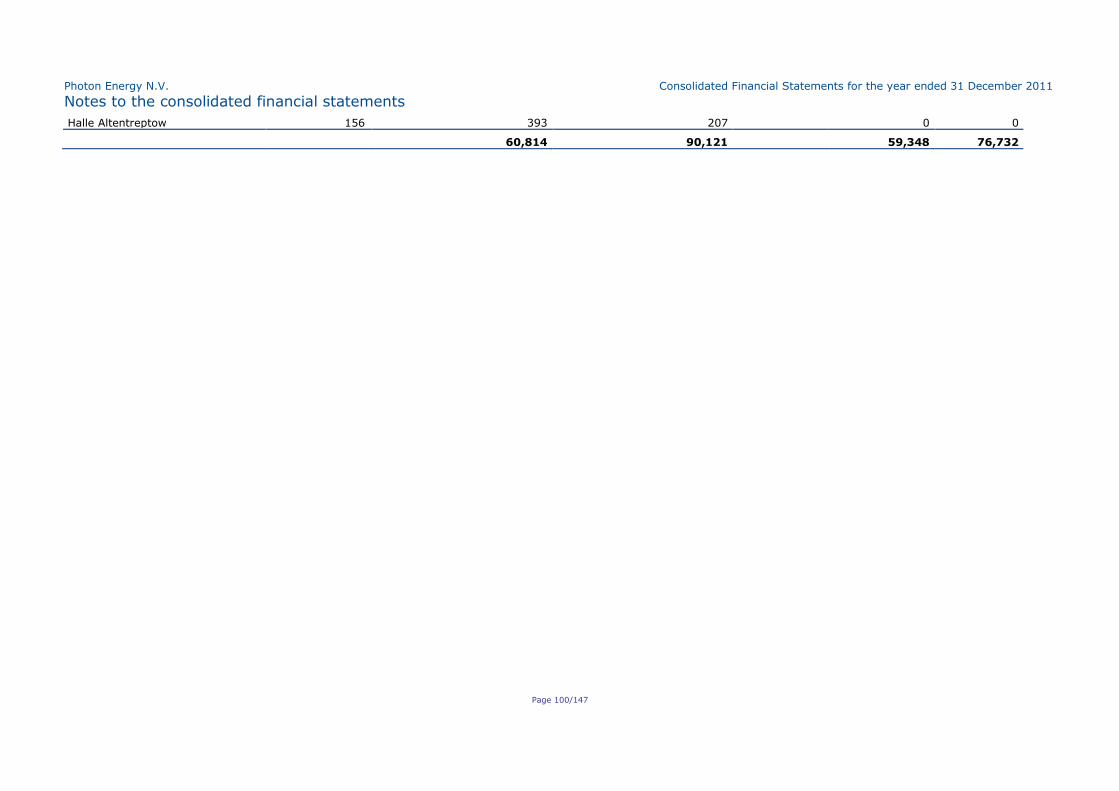
Photon Energy N.V. Consolidated Financial Statements for the year ended 31 December 2011
Notes to the consolidated financial statements
Page 100/147
Halle Altentreptow 156 393 207 0 0
60,814 90,121 59,348 76,732
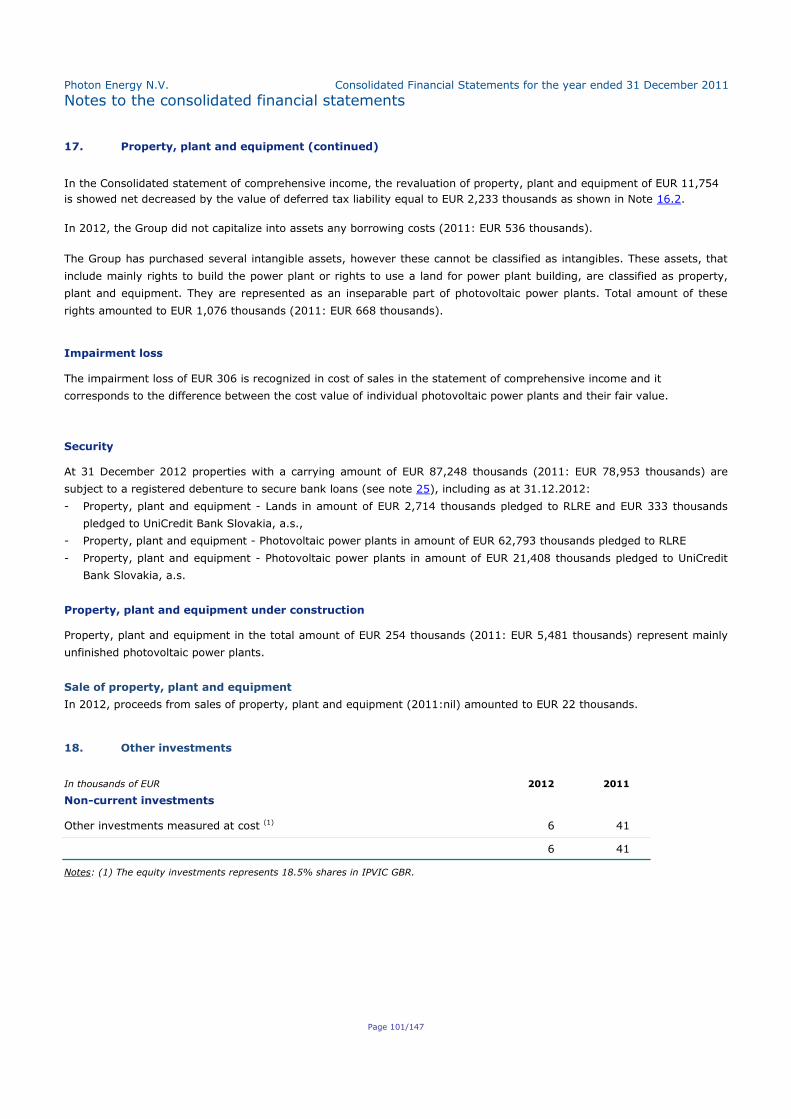
Photon Energy N.V. Consolidated Financial Statements for the year ended 31 December 2011
Notes to the consolidated financial statements
Page 101/147
17. Property, plant and equipment (continued)
In the Consolidated statement of comprehensive income, the revaluation of property, plant and equipment of EUR 11,754
is showed net decreased by the value of deferred tax liability equal to EUR 2,233 thousands as shown in Note 16.2.
In 2012, the Group did not capitalize into assets any borrowing costs (2011: EUR 536 thousands).
The Group has purchased several intangible assets, however these cannot be classified as intangibles. These assets, that
include mainly rights to build the power plant or rights to use a land for power plant building, are classified as property,
plant and equipment. They are represented as an inseparable part of photovoltaic power plants. Total amount of these
rights amounted to EUR 1,076 thousands (2011: EUR 668 thousands).
Impairment loss
The impairment loss of EUR 306 is recognized in cost of sales in the statement of comprehensive income and it
corresponds to the difference between the cost value of individual photovoltaic power plants and their fair value.
Security
At 31 December 2012 properties with a carrying amount of EUR 87,248 thousands (2011: EUR 78,953 thousands) are
subject to a registered debenture to secure bank loans (see note 25), including as at 31.12.2012:
- Property, plant and equipment - Lands in amount of EUR 2,714 thousands pledged to RLRE and EUR 333 thousands
pledged to UniCredit Bank Slovakia, a.s.,
- Property, plant and equipment - Photovoltaic power plants in amount of EUR 62,793 thousands pledged to RLRE
- Property, plant and equipment - Photovoltaic power plants in amount of EUR 21,408 thousands pledged to UniCredit
Bank Slovakia, a.s.
Property, plant and equipment under construction
Property, plant and equipment in the total amount of EUR 254 thousands (2011: EUR 5,481 thousands) represent mainly
unfinished photovoltaic power plants.
Sale of property, plant and equipment
In 2012, proceeds from sales of property, plant and equipment (2011:nil) amounted to EUR 22 thousands.
18. Other investments
In thousands of EUR 2012 2011
Non-current investments
Other investments measured at cost (1) 6 41
6 41
Notes: (1) The equity investments represents 18.5% shares in IPVIC GBR.
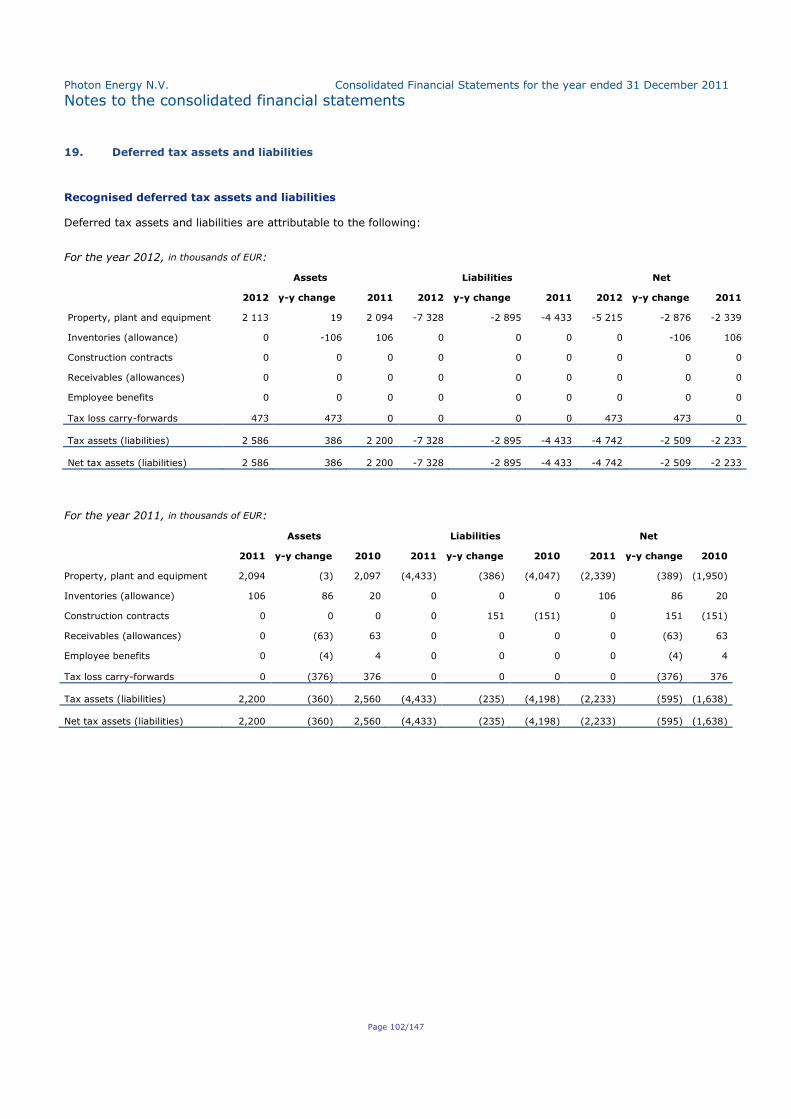
Photon Energy N.V. Consolidated Financial Statements for the year ended 31 December 2011
Notes to the consolidated financial statements
Page 102/147
19. Deferred tax assets and liabilities
Recognised deferred tax assets and liabilities
Deferred tax assets and liabilities are attributable to the following:
For the year 2012, in thousands of EUR:
Assets Liabilities Net
2012 y-y change 2011 2012 y-y change 2011 2012 y-y change 2011
Property, plant and equipment 2 113 19 2 094 -7 328 -2 895 -4 433 -5 215 -2 876 -2 339
Inventories (allowance) 0 -106 106 0 0 0 0 -106 106
Construction contracts 0 0 0 0 0 0 0 0 0
Receivables (allowances) 0 0 0 0 0 0 0 0 0
Employee benefits 0 0 0 0 0 0 0 0 0
Tax loss carry-forwards 473 473 0 0 0 0 473 473 0
Tax assets (liabilities) 2 586 386 2 200 -7 328 -2 895 -4 433 -4 742 -2 509 -2 233
Net tax assets (liabilities) 2 586 386 2 200 -7 328 -2 895 -4 433 -4 742 -2 509 -2 233
For the year 2011, in thousands of EUR:
Assets Liabilities Net
2011 y-y change 2010 2011 y-y change 2010 2011 y-y change 2010
Property, plant and equipment 2,094 (3) 2,097 (4,433) (386) (4,047) (2,339) (389) (1,950)
Inventories (allowance) 106 86 20 0 0 0 106 86 20
Construction contracts 0 0 0 0 151 (151) 0 151 (151)
Receivables (allowances) 0 (63) 63 0 0 0 0 (63) 63
Employee benefits 0 (4) 4 0 0 0 0 (4) 4
Tax loss carry-forwards 0 (376) 376 0 0 0 0 (376) 376
Tax assets (liabilities) 2,200 (360) 2,560 (4,433) (235) (4,198) (2,233) (595) (1,638)
Net tax assets (liabilities) 2,200 (360) 2,560 (4,433) (235) (4,198) (2,233) (595) (1,638)
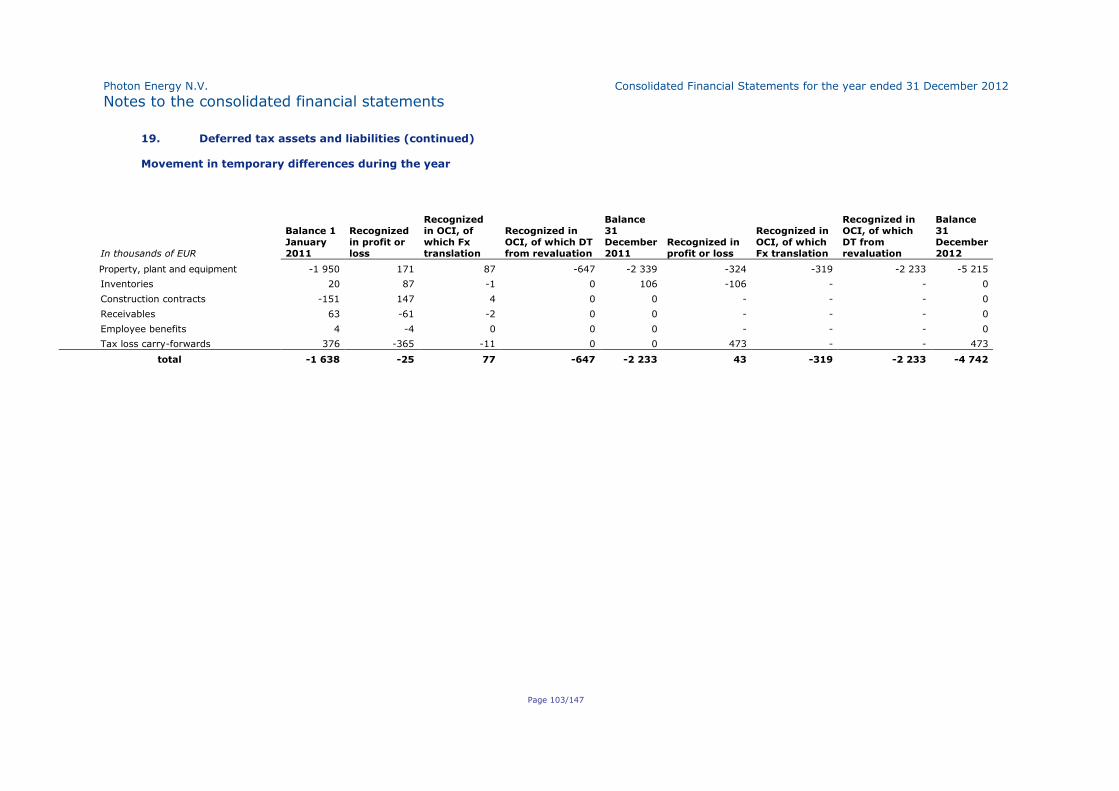
Photon Energy N.V. Consolidated Financial Statements for the year ended 31 December 2012
Notes to the consolidated financial statements
Page 103/147
19. Deferred tax assets and liabilities (continued)
Movement in temporary differences during the year
In thousands of EUR
Balance 1
January
2011
Recognized
in profit or
loss
Recognized
in OCI, of
which Fx
translation
Recognized in
OCI, of which DT
from revaluation
Balance
31
December
2011
Recognized in
profit or loss
Recognized in
OCI, of which
Fx translation
Recognized in
OCI, of which
DT from
revaluation
Balance
31
December
2012
Property, plant and equipment -1 950 171 87 -647 -2 339 -324 -319 -2 233 -5 215
Inventories 20 87 -1 0 106 -106 - - 0
Construction contracts -151 147 4 0 0 - - - 0
Receivables 63 -61 -2 0 0 - - - 0
Employee benefits 4 -4 0 0 0 - - - 0
Tax loss carry-forwards 376 -365 -11 0 0 473 - - 473
total -1 638 -25 77 -647 -2 233 43 -319 -2 233 -4 742
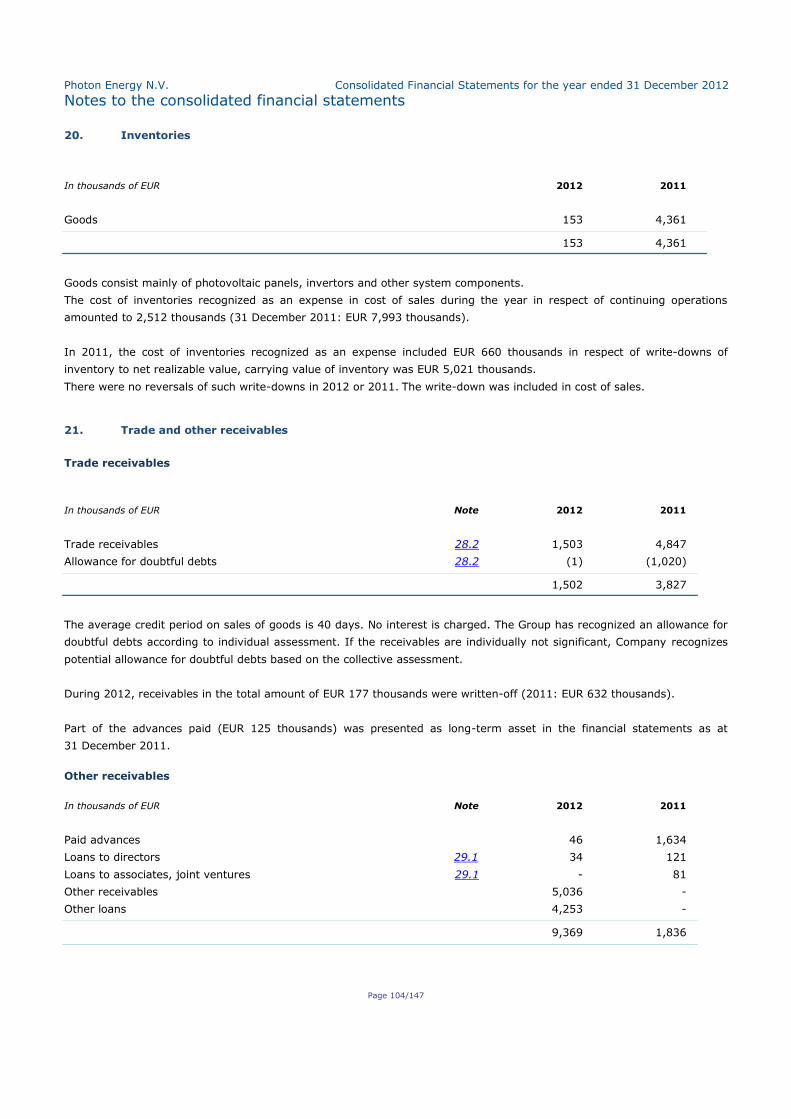
Photon Energy N.V. Consolidated Financial Statements for the year ended 31 December 2012
Notes to the consolidated financial statements
Page 104/147
20. Inventories
In thousands of EUR 2012 2011
Goods 153 4,361
153 4,361
Goods consist mainly of photovoltaic panels, invertors and other system components.
The cost of inventories recognized as an expense in cost of sales during the year in respect of continuing operations
amounted to 2,512 thousands (31 December 2011: EUR 7,993 thousands).
In 2011, the cost of inventories recognized as an expense included EUR 660 thousands in respect of write-downs of
inventory to net realizable value, carrying value of inventory was EUR 5,021 thousands.
There were no reversals of such write-downs in 2012 or 2011. The write-down was included in cost of sales.
21. Trade and other receivables
Trade receivables
In thousands of EUR Note 2012 2011
Trade receivables 28.2 1,503 4,847
Allowance for doubtful debts 28.2 (1) (1,020)
1,502 3,827
The average credit period on sales of goods is 40 days. No interest is charged. The Group has recognized an allowance for
doubtful debts according to individual assessment. If the receivables are individually not significant, Company recognizes
potential allowance for doubtful debts based on the collective assessment.
During 2012, receivables in the total amount of EUR 177 thousands were written-off (2011: EUR 632 thousands).
Part of the advances paid (EUR 125 thousands) was presented as long-term asset in the financial statements as at
31 December 2011.
Other receivables
In thousands of EUR Note 2012 2011
Paid advances 46 1,634
Loans to directors 29.1 34 121
Loans to associates, joint ventures 29.1 - 81
Other receivables 5,036 -
Other loans 4,253 -
9,369 1,836
Photon Energy N.V. Consolidated Financial Statements for the year ended 31 December 2012
Notes to the consolidated financial statements
Page 105/147
Other loans represent cash provided to companies sold within 2012 out of the Group, incl. Phoenix Energy a.s. and Photon
Engineering SK s.r.o. (in prior year eliminated as intercompany transaction). Interest charge of 3% is calculated from this
amount. Company’s management believes in the collectability of those receivables, either by standard way or by netting-
off procedure.
Other receivables consist mostly of original loans (in total amount of EUR 4,953) provided to former subsidiaries sold out
the Group. Interest charge of 3% is applied to the outstanding balances.
All these other loans and receivables were provided during the time when all companies were part of the Group and the
parent company provided them with financing of the activities.
Advances paid represent advances paid to suppliers mainly for photovoltaic panels.
Prepaid expenses amounted to EUR 458 thousands in 2012 (2011: EUR 111 thousands).
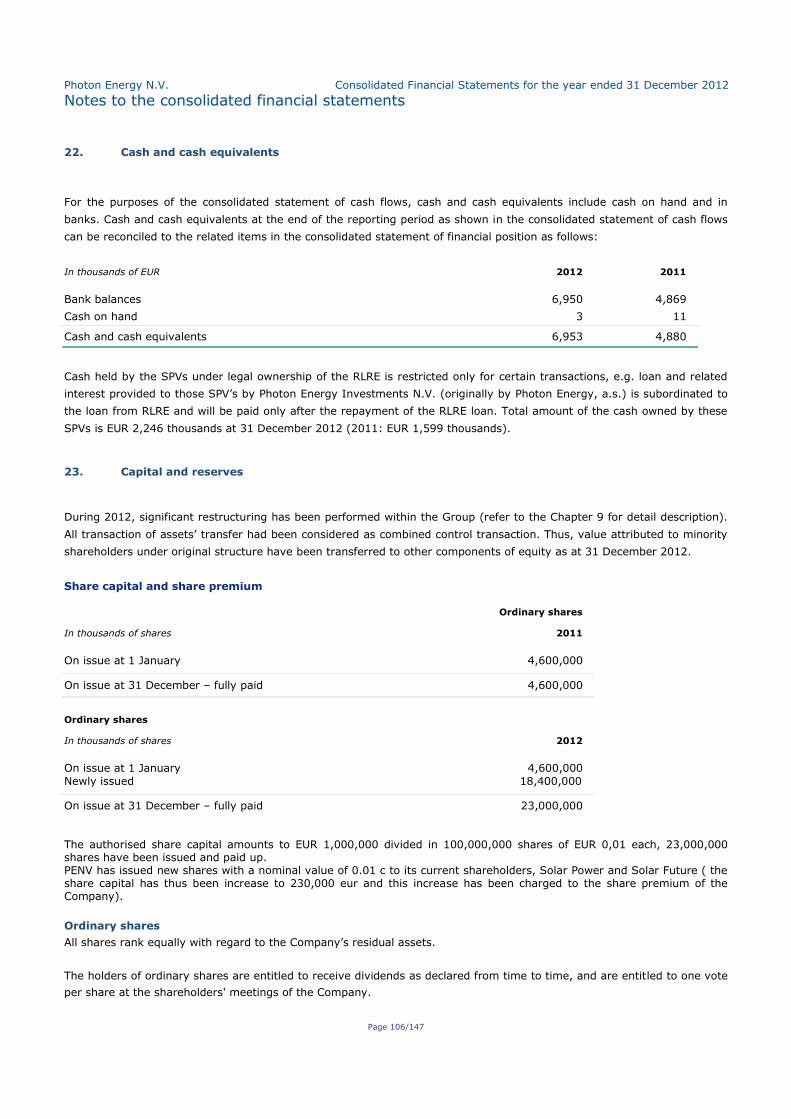
Photon Energy N.V. Consolidated Financial Statements for the year ended 31 December 2012
Notes to the consolidated financial statements
Page 106/147
22. Cash and cash equivalents
For the purposes of the consolidated statement of cash flows, cash and cash equivalents include cash on hand and in
banks. Cash and cash equivalents at the end of the reporting period as shown in the consolidated statement of cash flows
can be reconciled to the related items in the consolidated statement of financial position as follows:
In thousands of EUR 2012 2011
Bank balances 6,950 4,869
Cash on hand 3 11
Cash and cash equivalents 6,953 4,880
Cash held by the SPVs under legal ownership of the RLRE is restricted only for certain transactions, e.g. loan and related
interest provided to those SPV’s by Photon Energy Investments N.V. (originally by Photon Energy, a.s.) is subordinated to
the loan from RLRE and will be paid only after the repayment of the RLRE loan. Total amount of the cash owned by these
SPVs is EUR 2,246 thousands at 31 December 2012 (2011: EUR 1,599 thousands).
23. Capital and reserves
During 2012, significant restructuring has been performed within the Group (refer to the Chapter 9 for detail description).
All transaction of assets’ transfer had been considered as combined control transaction. Thus, value attributed to minority
shareholders under original structure have been transferred to other components of equity as at 31 December 2012.
Share capital and share premium
Ordinary shares
In thousands of shares 2011
On issue at 1 January 4,600,000
On issue at 31 December – fully paid 4,600,000
Ordinary shares
In thousands of shares 2012
On issue at 1 January 4,600,000
Newly issued 18,400,000
On issue at 31 December – fully paid 23,000,000 The authorised share capital amounts to EUR 1,000,000 divided in 100,000,000 shares of EUR 0,01 each, 23,000,000 shares have been issued and paid up. PENV has issued new shares with a nominal value of 0.01 c to its current shareholders, Solar Power and Solar Future ( the share capital has thus been increase to 230,000 eur and this increase has been charged to the share premium of the Company).
Ordinary shares
All shares rank equally with regard to the Company’s residual assets.
The holders of ordinary shares are entitled to receive dividends as declared from time to time, and are entitled to one vote
per share at the shareholders' meetings of the Company.
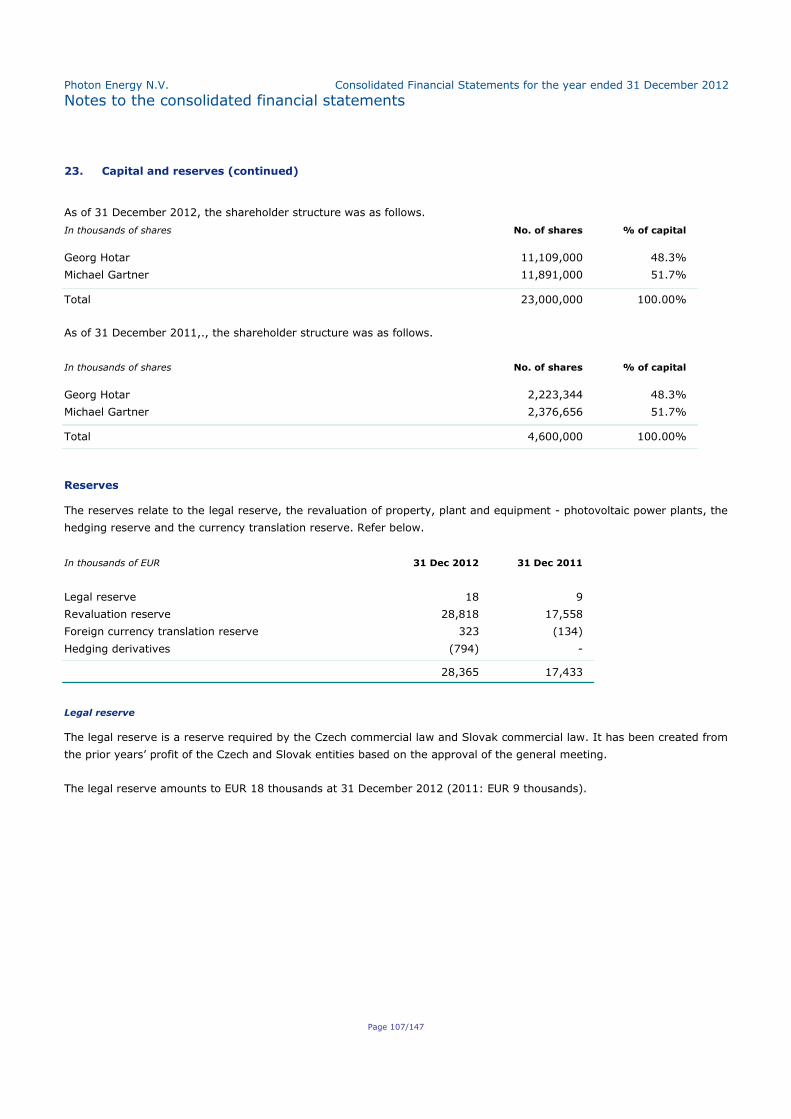
Photon Energy N.V. Consolidated Financial Statements for the year ended 31 December 2012
Notes to the consolidated financial statements
Page 107/147
23. Capital and reserves (continued)
As of 31 December 2012, the shareholder structure was as follows.
In thousands of shares No. of shares % of capital
Georg Hotar 11,109,000 48.3%
Michael Gartner 11,891,000 51.7%
Total 23,000,000 100.00%
As of 31 December 2011,., the shareholder structure was as follows.
In thousands of shares No. of shares % of capital
Georg Hotar 2,223,344 48.3%
Michael Gartner 2,376,656 51.7%
Total 4,600,000 100.00%
Reserves
The reserves relate to the legal reserve, the revaluation of property, plant and equipment - photovoltaic power plants, the
hedging reserve and the currency translation reserve. Refer below.
In thousands of EUR 31 Dec 2012 31 Dec 2011
Legal reserve 18 9
Revaluation reserve 28,818 17,558
Foreign currency translation reserve 323 (134)
Hedging derivatives (794) -
28,365 17,433
Legal reserve
The legal reserve is a reserve required by the Czech commercial law and Slovak commercial law. It has been created from
the prior years’ profit of the Czech and Slovak entities based on the approval of the general meeting.
The legal reserve amounts to EUR 18 thousands at 31 December 2012 (2011: EUR 9 thousands).
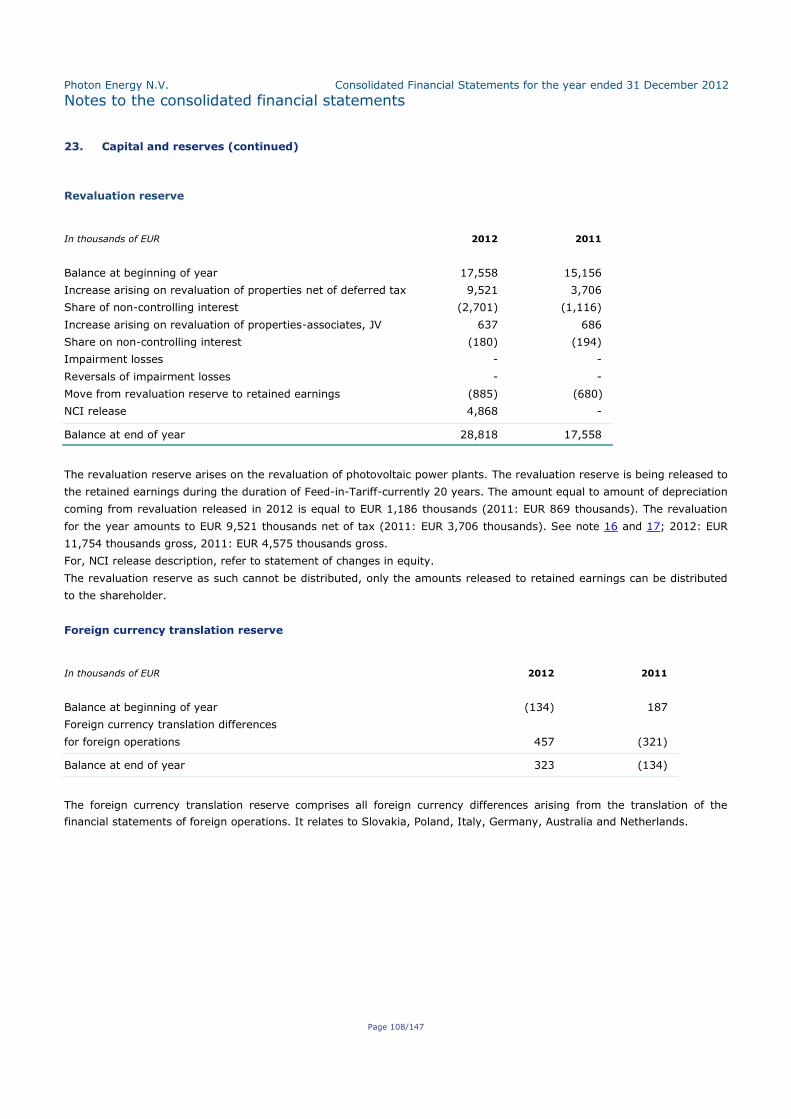
Photon Energy N.V. Consolidated Financial Statements for the year ended 31 December 2012
Notes to the consolidated financial statements
Page 108/147
23. Capital and reserves (continued)
Revaluation reserve
In thousands of EUR 2012 2011
Balance at beginning of year 17,558 15,156
Increase arising on revaluation of properties net of deferred tax 9,521 3,706
Share of non-controlling interest (2,701) (1,116)
Increase arising on revaluation of properties-associates, JV 637 686
Share on non-controlling interest (180) (194)
Impairment losses - -
Reversals of impairment losses - -
Move from revaluation reserve to retained earnings (885) (680)
NCI release 4,868 -
Balance at end of year 28,818 17,558
The revaluation reserve arises on the revaluation of photovoltaic power plants. The revaluation reserve is being released to
the retained earnings during the duration of Feed-in-Tariff-currently 20 years. The amount equal to amount of depreciation
coming from revaluation released in 2012 is equal to EUR 1,186 thousands (2011: EUR 869 thousands). The revaluation
for the year amounts to EUR 9,521 thousands net of tax (2011: EUR 3,706 thousands). See note 16 and 17; 2012: EUR
11,754 thousands gross, 2011: EUR 4,575 thousands gross.
For, NCI release description, refer to statement of changes in equity.
The revaluation reserve as such cannot be distributed, only the amounts released to retained earnings can be distributed
to the shareholder.
Foreign currency translation reserve
In thousands of EUR 2012 2011
Balance at beginning of year (134) 187
Foreign currency translation differences
for foreign operations 457 (321)
Balance at end of year 323 (134)
The foreign currency translation reserve comprises all foreign currency differences arising from the translation of the
financial statements of foreign operations. It relates to Slovakia, Poland, Italy, Germany, Australia and Netherlands.
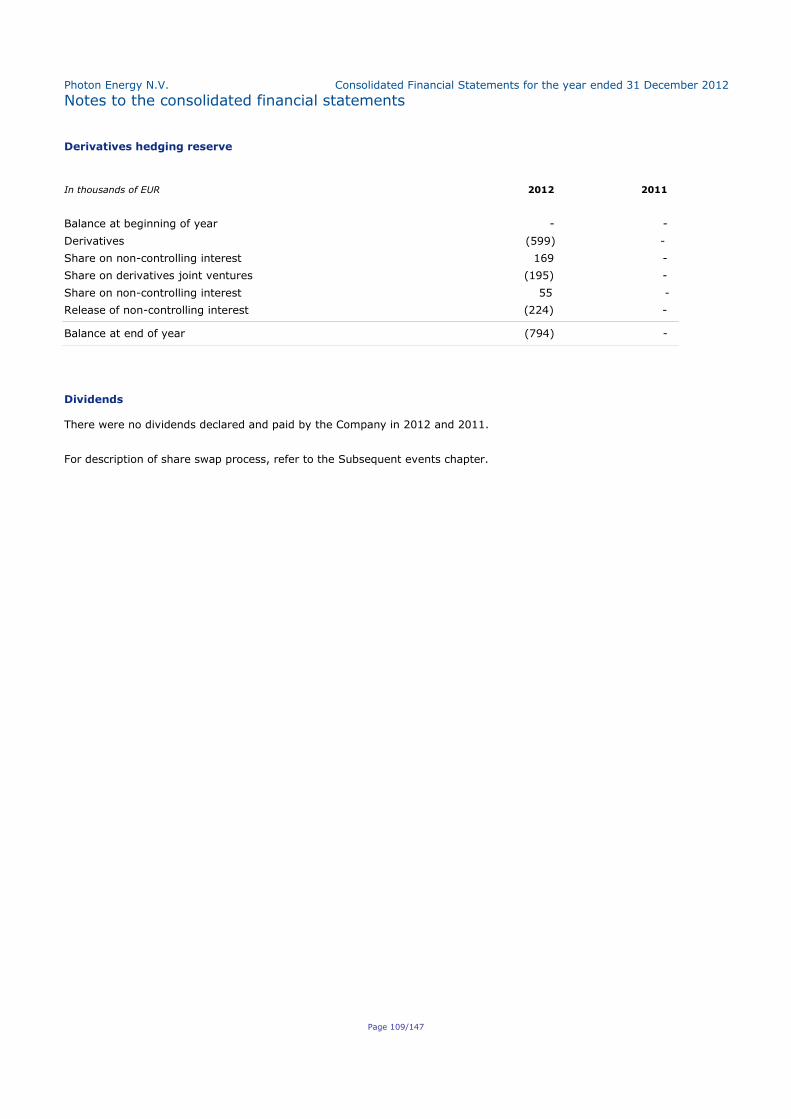
Photon Energy N.V. Consolidated Financial Statements for the year ended 31 December 2012
Notes to the consolidated financial statements
Page 109/147
Derivatives hedging reserve
In thousands of EUR 2012 2011
Balance at beginning of year - -
Derivatives (599) -
Share on non-controlling interest 169 -
Share on derivatives joint ventures (195) -
Share on non-controlling interest 55 -
Release of non-controlling interest (224) -
Balance at end of year (794) -
Dividends
There were no dividends declared and paid by the Company in 2012 and 2011.
For description of share swap process, refer to the Subsequent events chapter.
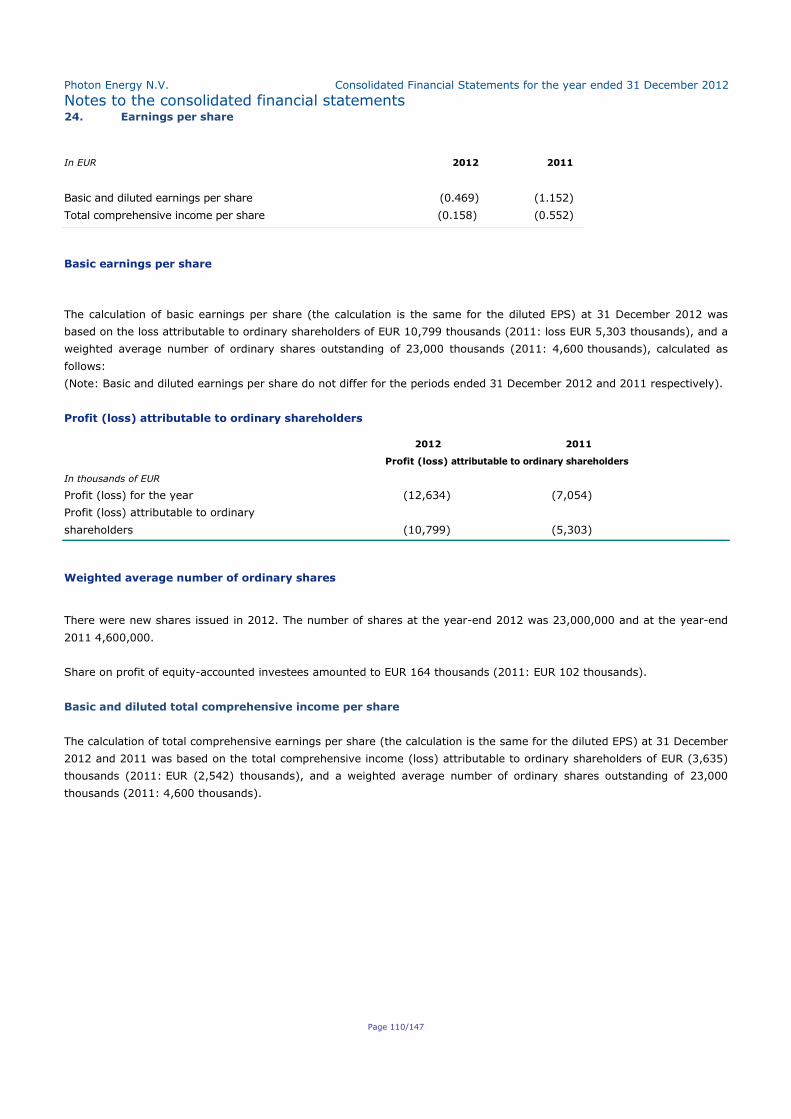
Photon Energy N.V. Consolidated Financial Statements for the year ended 31 December 2012
Notes to the consolidated financial statements
Page 110/147
24. Earnings per share
In EUR 2012 2011
Basic and diluted earnings per share (0.469) (1.152)
Total comprehensive income per share (0.158) (0.552)
Basic earnings per share
The calculation of basic earnings per share (the calculation is the same for the diluted EPS) at 31 December 2012 was
based on the loss attributable to ordinary shareholders of EUR 10,799 thousands (2011: loss EUR 5,303 thousands), and a
weighted average number of ordinary shares outstanding of 23,000 thousands (2011: 4,600 thousands), calculated as
follows:
(Note: Basic and diluted earnings per share do not differ for the periods ended 31 December 2012 and 2011 respectively).
Profit (loss) attributable to ordinary shareholders
2012 2011
Profit (loss) attributable to ordinary shareholders
In thousands of EUR
Profit (loss) for the year (12,634) (7,054)
Profit (loss) attributable to ordinary
shareholders (10,799) (5,303)
Weighted average number of ordinary shares
There were new shares issued in 2012. The number of shares at the year-end 2012 was 23,000,000 and at the year-end
2011 4,600,000.
Share on profit of equity-accounted investees amounted to EUR 164 thousands (2011: EUR 102 thousands).
Basic and diluted total comprehensive income per share
The calculation of total comprehensive earnings per share (the calculation is the same for the diluted EPS) at 31 December
2012 and 2011 was based on the total comprehensive income (loss) attributable to ordinary shareholders of EUR (3,635)
thousands (2011: EUR (2,542) thousands), and a weighted average number of ordinary shares outstanding of 23,000
thousands (2011: 4,600 thousands).
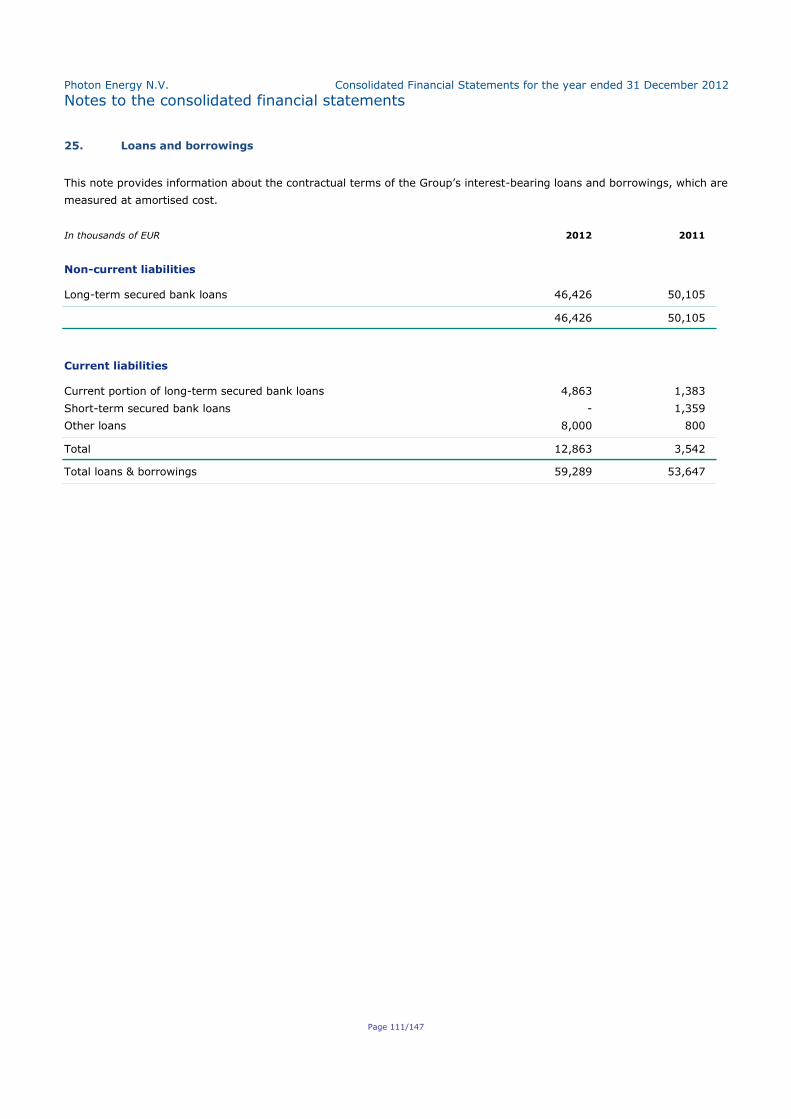
Photon Energy N.V. Consolidated Financial Statements for the year ended 31 December 2012
Notes to the consolidated financial statements
Page 111/147
25. Loans and borrowings
This note provides information about the contractual terms of the Group’s interest-bearing loans and borrowings, which are
measured at amortised cost.
In thousands of EUR 2012 2011
Non-current liabilities
Long-term secured bank loans 46,426 50,105
46,426 50,105
Current liabilities
Current portion of long-term secured bank loans 4,863 1,383
Short-term secured bank loans - 1,359
Other loans 8,000 800
Total 12,863 3,542
Total loans & borrowings 59,289 53,647
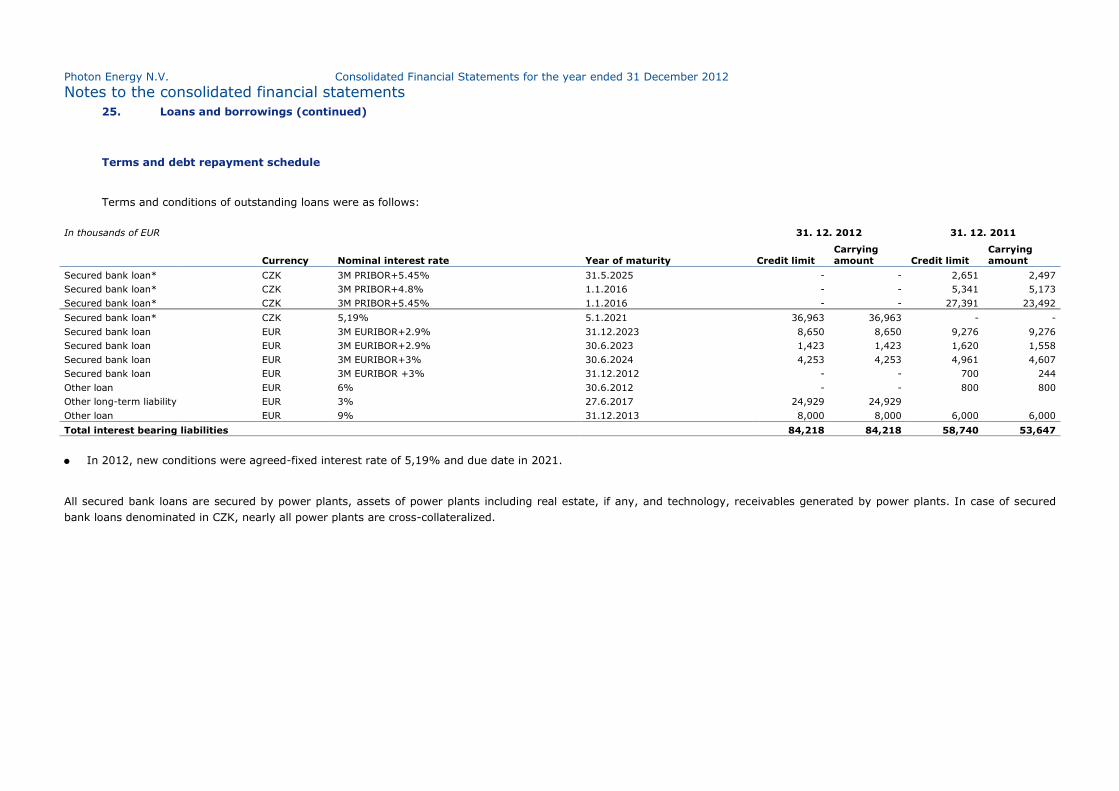
Photon Energy N.V. Consolidated Financial Statements for the year ended 31 December 2012
Notes to the consolidated financial statements
25. Loans and borrowings (continued)
Terms and debt repayment schedule
Terms and conditions of outstanding loans were as follows:
In thousands of EUR
31. 12. 2012 31. 12. 2011
Currency Nominal interest rate Year of maturity Credit limit
Carrying
amount Credit limit
Carrying
amount
Secured bank loan* CZK 3M PRIBOR+5.45% 31.5.2025 - - 2,651 2,497
Secured bank loan* CZK 3M PRIBOR+4.8% 1.1.2016 - - 5,341 5,173
Secured bank loan* CZK 3M PRIBOR+5.45% 1.1.2016 - - 27,391 23,492
Secured bank loan* CZK 5,19% 5.1.2021 36,963 36,963 - -
Secured bank loan EUR 3M EURIBOR+2.9% 31.12.2023 8,650 8,650 9,276 9,276
Secured bank loan EUR 3M EURIBOR+2.9% 30.6.2023 1,423 1,423 1,620 1,558
Secured bank loan EUR 3M EURIBOR+3% 30.6.2024 4,253 4,253 4,961 4,607
Secured bank loan EUR 3M EURIBOR +3% 31.12.2012 - - 700 244
Other loan
EUR 6% 30.6.2012 - - 800 800
Other long-term liability
EUR 3% 27.6.2017 24,929 24,929
Other loan
EUR 9% 31.12.2013 8,000 8,000 6,000 6,000
Total interest bearing liabilities
84,218 84,218 58,740 53,647
In 2012, new conditions were agreed-fixed interest rate of 5,19% and due date in 2021.
All secured bank loans are secured by power plants, assets of power plants including real estate, if any, and technology, receivables generated by power plants. In case of secured
bank loans denominated in CZK, nearly all power plants are cross-collateralized.
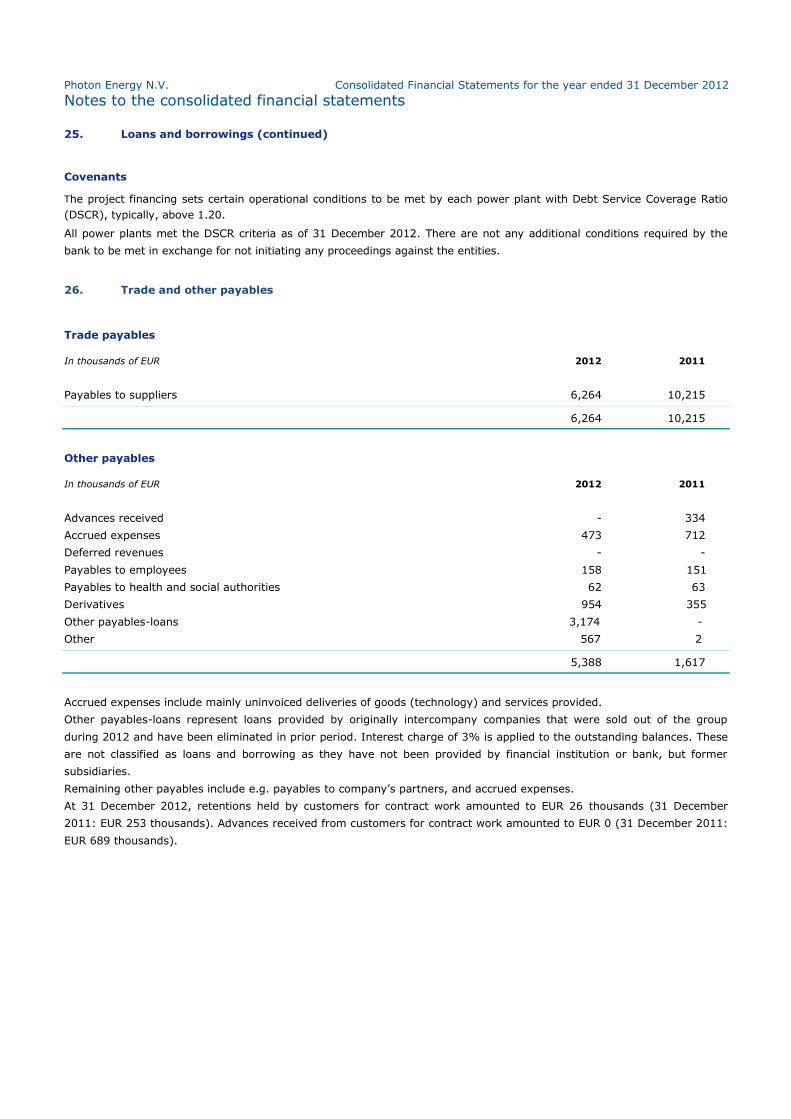
Photon Energy N.V. Consolidated Financial Statements for the year ended 31 December 2012
Notes to the consolidated financial statements
25. Loans and borrowings (continued)
Covenants
The project financing sets certain operational conditions to be met by each power plant with Debt Service Coverage Ratio
(DSCR), typically, above 1.20.
All power plants met the DSCR criteria as of 31 December 2012. There are not any additional conditions required by the
bank to be met in exchange for not initiating any proceedings against the entities.
26. Trade and other payables
Trade payables
In thousands of EUR 2012 2011
Payables to suppliers 6,264 10,215
6,264 10,215
Other payables
In thousands of EUR 2012 2011
Advances received - 334
Accrued expenses 473 712
Deferred revenues - -
Payables to employees 158 151
Payables to health and social authorities 62 63
Derivatives 954 355
Other payables-loans 3,174 -
Other 567 2
5,388 1,617
Accrued expenses include mainly uninvoiced deliveries of goods (technology) and services provided.
Other payables-loans represent loans provided by originally intercompany companies that were sold out of the group
during 2012 and have been eliminated in prior period. Interest charge of 3% is applied to the outstanding balances. These
are not classified as loans and borrowing as they have not been provided by financial institution or bank, but former
subsidiaries.
Remaining other payables include e.g. payables to company’s partners, and accrued expenses.
At 31 December 2012, retentions held by customers for contract work amounted to EUR 26 thousands (31 December
2011: EUR 253 thousands). Advances received from customers for contract work amounted to EUR 0 (31 December 2011:
EUR 689 thousands).
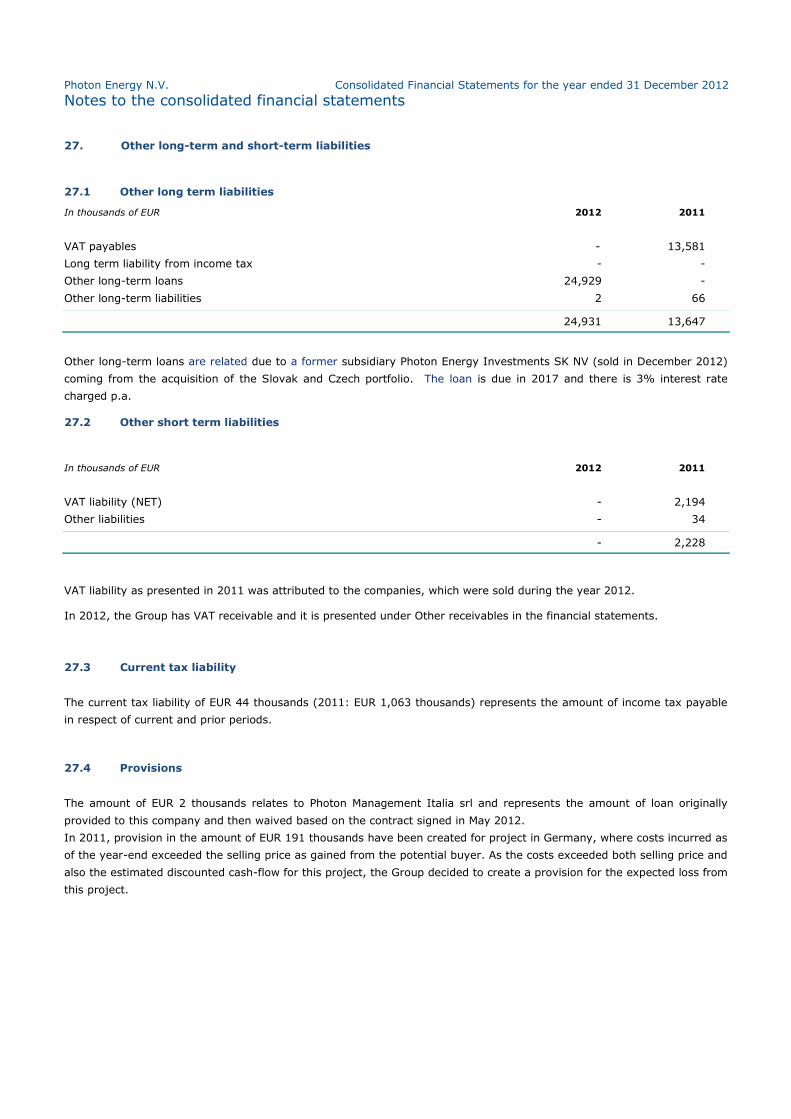
Photon Energy N.V. Consolidated Financial Statements for the year ended 31 December 2012
Notes to the consolidated financial statements
27. Other long-term and short-term liabilities
27.1 Other long term liabilities
In thousands of EUR 2012 2011
VAT payables - 13,581
Long term liability from income tax - -
Other long-term loans 24,929 -
Other long-term liabilities 2 66
24,931 13,647
Other long-term loans are related due to a former subsidiary Photon Energy Investments SK NV (sold in December 2012)
coming from the acquisition of the Slovak and Czech portfolio. The loan is due in 2017 and there is 3% interest rate
charged p.a.
27.2 Other short term liabilities
In thousands of EUR 2012 2011
VAT liability (NET) - 2,194
Other liabilities - 34
- 2,228
VAT liability as presented in 2011 was attributed to the companies, which were sold during the year 2012.
In 2012, the Group has VAT receivable and it is presented under Other receivables in the financial statements.
27.3 Current tax liability
The current tax liability of EUR 44 thousands (2011: EUR 1,063 thousands) represents the amount of income tax payable
in respect of current and prior periods.
27.4 Provisions
The amount of EUR 2 thousands relates to Photon Management Italia srl and represents the amount of loan originally
provided to this company and then waived based on the contract signed in May 2012.
In 2011, provision in the amount of EUR 191 thousands have been created for project in Germany, where costs incurred as
of the year-end exceeded the selling price as gained from the potential buyer. As the costs exceeded both selling price and
also the estimated discounted cash-flow for this project, the Group decided to create a provision for the expected loss from
this project.
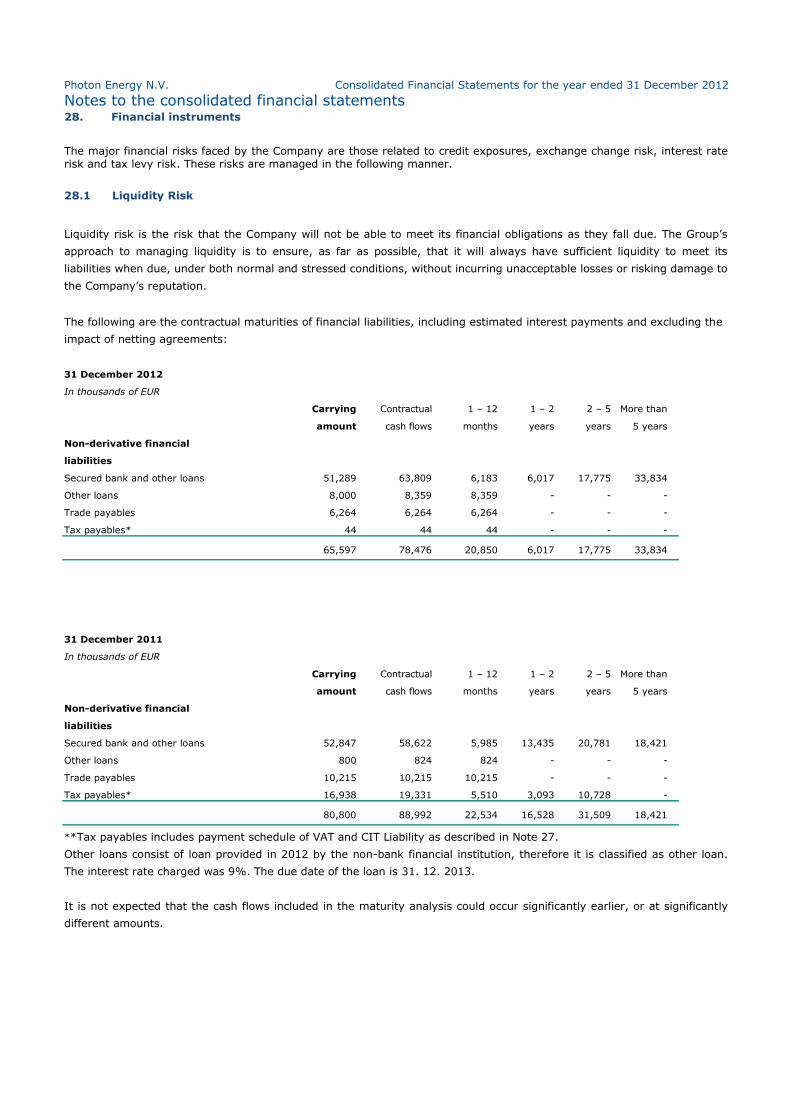
Photon Energy N.V. Consolidated Financial Statements for the year ended 31 December 2012
Notes to the consolidated financial statements
28. Financial instruments
The major financial risks faced by the Company are those related to credit exposures, exchange change risk, interest rate risk and tax levy risk. These risks are managed in the following manner.
28.1 Liquidity Risk
Liquidity risk is the risk that the Company will not be able to meet its financial obligations as they fall due. The Group’s
approach to managing liquidity is to ensure, as far as possible, that it will always have sufficient liquidity to meet its
liabilities when due, under both normal and stressed conditions, without incurring unacceptable losses or risking damage to
the Company’s reputation.
The following are the contractual maturities of financial liabilities, including estimated interest payments and excluding the
impact of netting agreements:
31 December 2012
In thousands of EUR
Carrying Contractual 1 – 12 1 – 2 2 – 5 More than
amount cash flows months years years 5 years
Non-derivative financial
liabilities
Secured bank and other loans 51,289 63,809 6,183 6,017 17,775 33,834
Other loans 8,000 8,359 8,359 - - -
Trade payables 6,264 6,264 6,264 - - -
Tax payables* 44 44 44 - - -
65,597 78,476 20,850 6,017 17,775 33,834
31 December 2011
In thousands of EUR
Carrying Contractual 1 – 12 1 – 2 2 – 5 More than
amount cash flows months years years 5 years
Non-derivative financial
liabilities
Secured bank and other loans 52,847 58,622 5,985 13,435 20,781 18,421
Other loans 800 824 824 - - -
Trade payables 10,215 10,215 10,215 - - -
Tax payables* 16,938 19,331 5,510 3,093 10,728 -
80,800 88,992 22,534 16,528 31,509 18,421
**Tax payables includes payment schedule of VAT and CIT Liability as described in Note 27.
Other loans consist of loan provided in 2012 by the non-bank financial institution, therefore it is classified as other loan.
The interest rate charged was 9%. The due date of the loan is 31. 12. 2013.
It is not expected that the cash flows included in the maturity analysis could occur significantly earlier, or at significantly
different amounts.
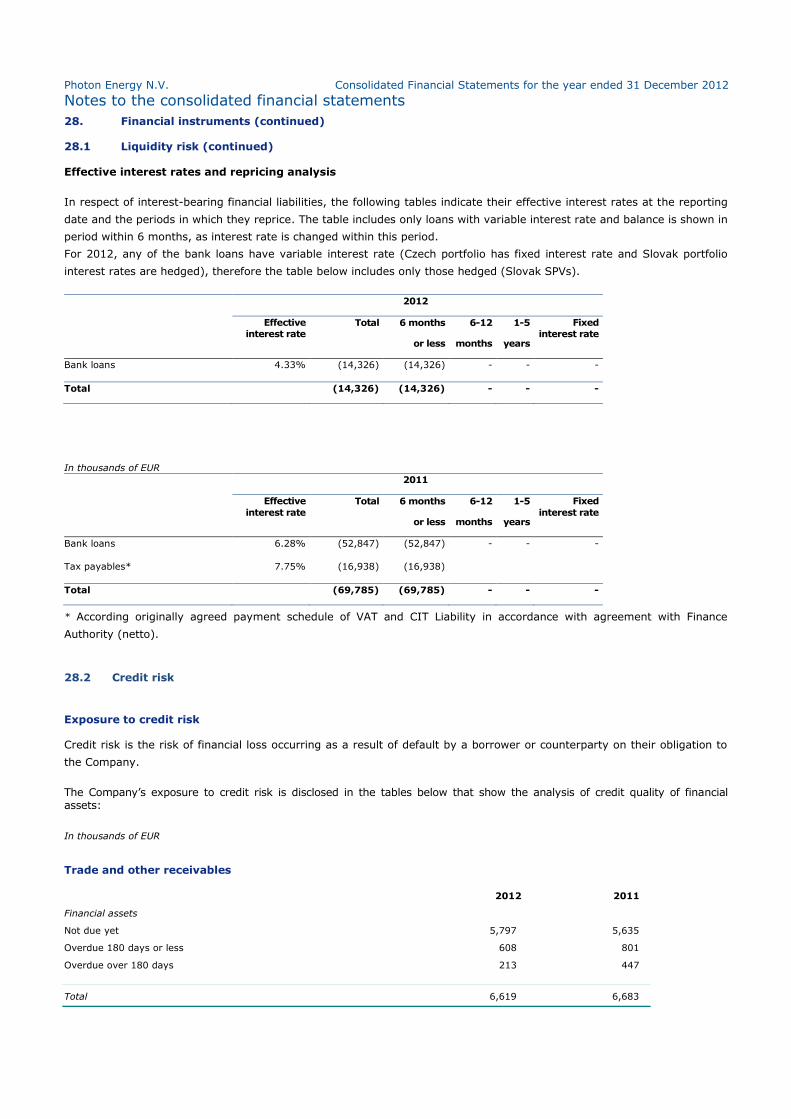
Photon Energy N.V. Consolidated Financial Statements for the year ended 31 December 2012
Notes to the consolidated financial statements
28. Financial instruments (continued)
28.1 Liquidity risk (continued)
Effective interest rates and repricing analysis
In respect of interest-bearing financial liabilities, the following tables indicate their effective interest rates at the reporting
date and the periods in which they reprice. The table includes only loans with variable interest rate and balance is shown in
period within 6 months, as interest rate is changed within this period.
For 2012, any of the bank loans have variable interest rate (Czech portfolio has fixed interest rate and Slovak portfolio
interest rates are hedged), therefore the table below includes only those hedged (Slovak SPVs).
2012
Effective
interest rate Total 6 months
or less
6-12
months
1-5
years
Fixed
interest rate
Bank loans 4.33% (14,326) (14,326) - - -
Total (14,326) (14,326) - - -
In thousands of EUR
2011
Effective
interest rate
Total 6 months
or less
6-12
months
1-5
years
Fixed
interest rate
Bank loans 6.28% (52,847) (52,847) - - -
Tax payables* 7.75% (16,938) (16,938)
Total (69,785) (69,785) - - -
* According originally agreed payment schedule of VAT and CIT Liability in accordance with agreement with Finance
Authority (netto).
28.2 Credit risk
Exposure to credit risk
Credit risk is the risk of financial loss occurring as a result of default by a borrower or counterparty on their obligation to
the Company.
The Company’s exposure to credit risk is disclosed in the tables below that show the analysis of credit quality of financial assets:
In thousands of EUR
Trade and other receivables
2012 2011
Financial assets
Not due yet 5,797 5,635
Overdue 180 days or less 608 801
Overdue over 180 days 213 447
Total 6,619 6,683
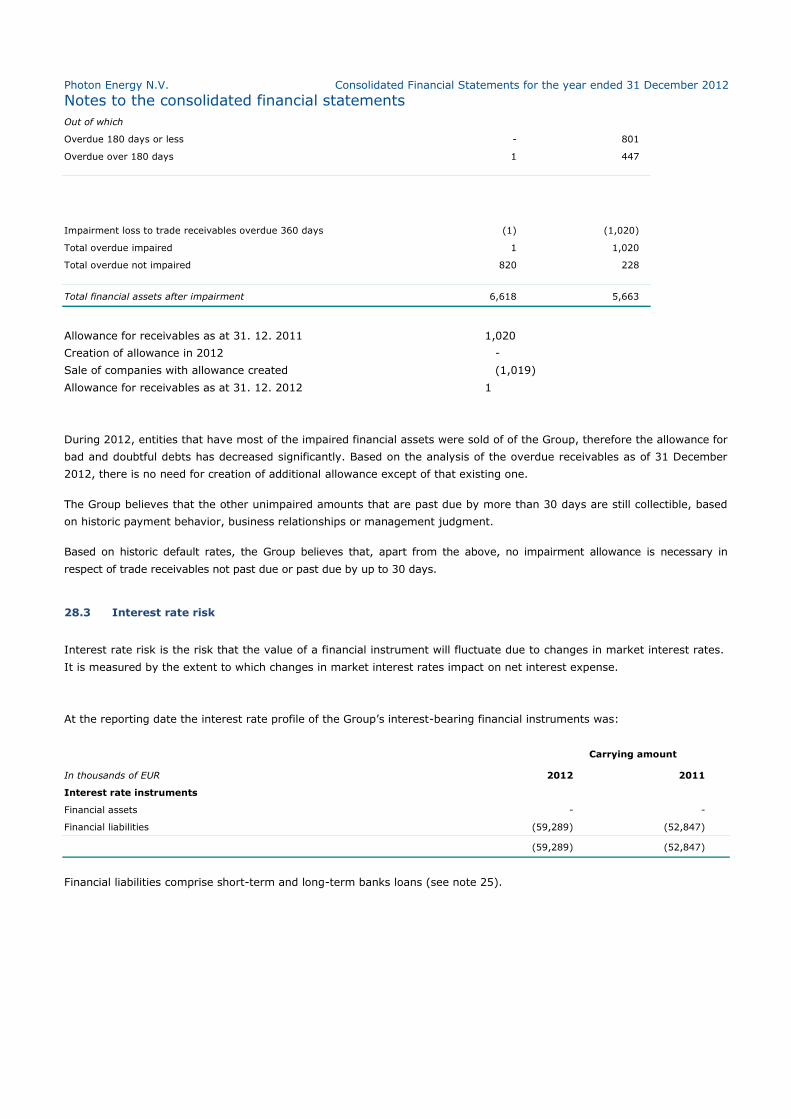
Photon Energy N.V. Consolidated Financial Statements for the year ended 31 December 2012
Notes to the consolidated financial statements
Out of which
Overdue 180 days or less - 801
Overdue over 180 days 1 447
Impairment loss to trade receivables overdue 360 days (1) (1,020)
Total overdue impaired 1 1,020
Total overdue not impaired 820 228
Total financial assets after impairment 6,618 5,663
Allowance for receivables as at 31. 12. 2011 1,020
Creation of allowance in 2012 -
Sale of companies with allowance created (1,019)
Allowance for receivables as at 31. 12. 2012 1
During 2012, entities that have most of the impaired financial assets were sold of of the Group, therefore the allowance for
bad and doubtful debts has decreased significantly. Based on the analysis of the overdue receivables as of 31 December
2012, there is no need for creation of additional allowance except of that existing one.
The Group believes that the other unimpaired amounts that are past due by more than 30 days are still collectible, based
on historic payment behavior, business relationships or management judgment.
Based on historic default rates, the Group believes that, apart from the above, no impairment allowance is necessary in
respect of trade receivables not past due or past due by up to 30 days.
28.3 Interest rate risk
Interest rate risk is the risk that the value of a financial instrument will fluctuate due to changes in market interest rates.
It is measured by the extent to which changes in market interest rates impact on net interest expense.
At the reporting date the interest rate profile of the Group’s interest-bearing financial instruments was:
Carrying amount
In thousands of EUR 2012 2011
Interest rate instruments
Financial assets - -
Financial liabilities (59,289) (52,847)
(59,289) (52,847)
Financial liabilities comprise short-term and long-term banks loans (see note 25).
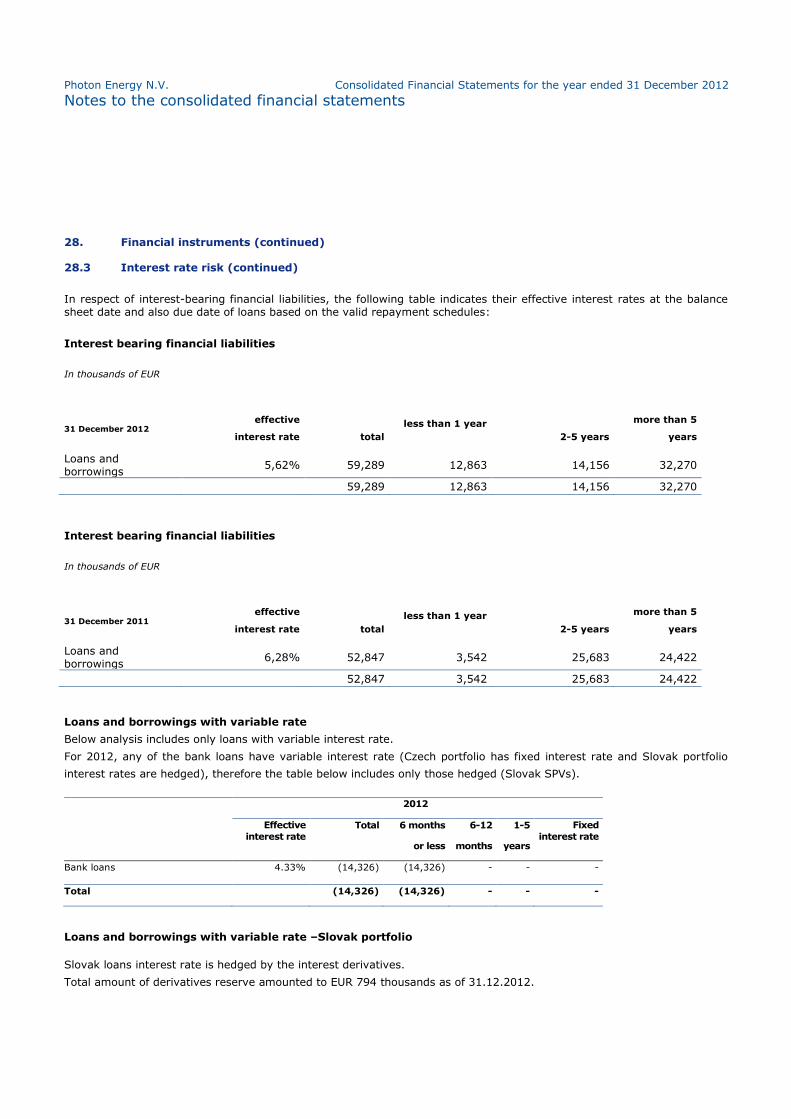
Photon Energy N.V. Consolidated Financial Statements for the year ended 31 December 2012
Notes to the consolidated financial statements
28. Financial instruments (continued)
28.3 Interest rate risk (continued)
In respect of interest-bearing financial liabilities, the following table indicates their effective interest rates at the balance sheet date and also due date of loans based on the valid repayment schedules:
Interest bearing financial liabilities
In thousands of EUR
31 December 2012 effective
interest rate
total
less than 1 year
2-5 years
more than 5
years
Loans and borrowings
5,62% 59,289 12,863 14,156 32,270
59,289 12,863 14,156 32,270
Interest bearing financial liabilities
In thousands of EUR
31 December 2011 effective
interest rate
total
less than 1 year
2-5 years
more than 5
years
Loans and borrowings
6,28% 52,847 3,542 25,683 24,422
52,847 3,542 25,683 24,422
Loans and borrowings with variable rate
Below analysis includes only loans with variable interest rate.
For 2012, any of the bank loans have variable interest rate (Czech portfolio has fixed interest rate and Slovak portfolio
interest rates are hedged), therefore the table below includes only those hedged (Slovak SPVs).
2012
Effective
interest rate
Total 6 months
or less
6-12
months
1-5
years
Fixed
interest rate
Bank loans 4.33% (14,326) (14,326) - - -
Total (14,326) (14,326) - - -
Loans and borrowings with variable rate –Slovak portfolio
Slovak loans interest rate is hedged by the interest derivatives.
Total amount of derivatives reserve amounted to EUR 794 thousands as of 31.12.2012.
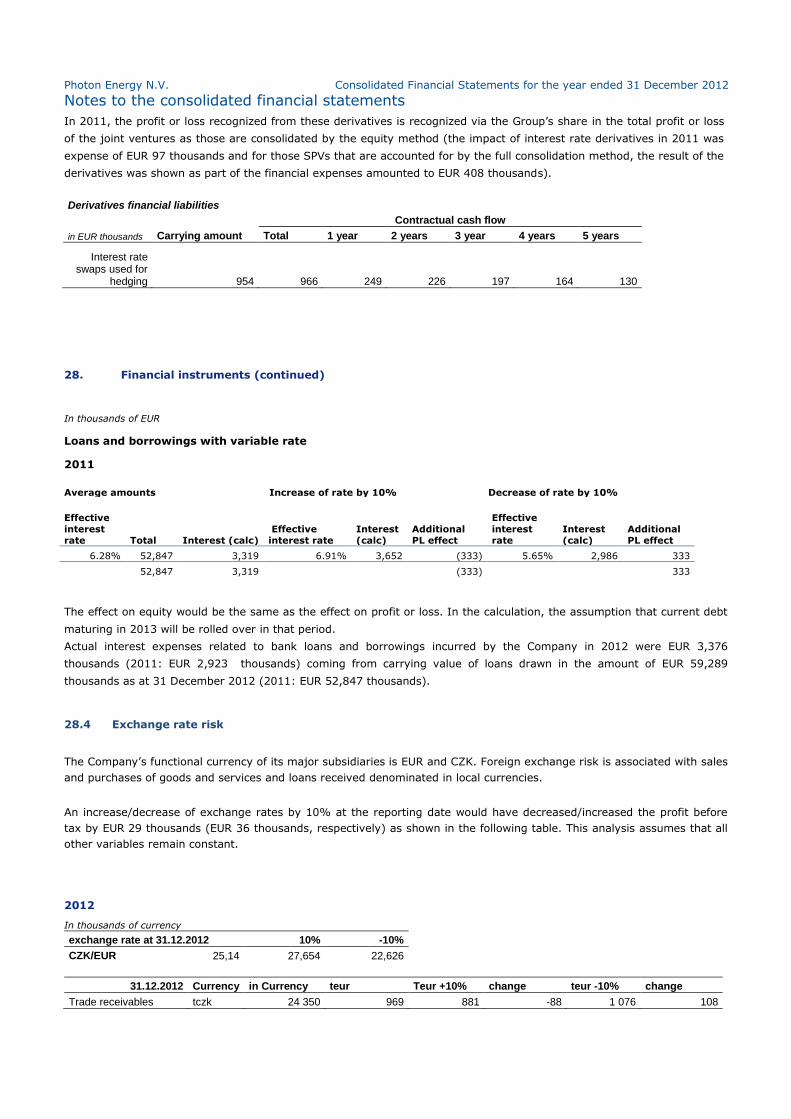
Photon Energy N.V. Consolidated Financial Statements for the year ended 31 December 2012
Notes to the consolidated financial statements
In 2011, the profit or loss recognized from these derivatives is recognized via the Group’s share in the total profit or loss
of the joint ventures as those are consolidated by the equity method (the impact of interest rate derivatives in 2011 was
expense of EUR 97 thousands and for those SPVs that are accounted for by the full consolidation method, the result of the
derivatives was shown as part of the financial expenses amounted to EUR 408 thousands).
Derivatives financial liabilities
Contractual cash flow
in EUR thousands Carrying amount Total 1 year 2 years 3 year 4 years 5 years
Interest rate swaps used for
hedging 954 966 249 226 197 164 130
28. Financial instruments (continued)
In thousands of EUR
Loans and borrowings with variable rate
2011
Average amounts Increase of rate by 10% Decrease of rate by 10%
Effective
interest
rate Total Interest (calc)
Effective
interest rate
Interest
(calc)
Additional
PL effect
Effective
interest
rate
Interest
(calc)
Additional
PL effect
6.28% 52,847 3,319 6.91% 3,652 (333) 5.65% 2,986 333
52,847 3,319 (333) 333
The effect on equity would be the same as the effect on profit or loss. In the calculation, the assumption that current debt
maturing in 2013 will be rolled over in that period.
Actual interest expenses related to bank loans and borrowings incurred by the Company in 2012 were EUR 3,376
thousands (2011: EUR 2,923 thousands) coming from carrying value of loans drawn in the amount of EUR 59,289
thousands as at 31 December 2012 (2011: EUR 52,847 thousands).
28.4 Exchange rate risk
The Company’s functional currency of its major subsidiaries is EUR and CZK. Foreign exchange risk is associated with sales
and purchases of goods and services and loans received denominated in local currencies.
An increase/decrease of exchange rates by 10% at the reporting date would have decreased/increased the profit before
tax by EUR 29 thousands (EUR 36 thousands, respectively) as shown in the following table. This analysis assumes that all
other variables remain constant.
2012
In thousands of currency
exchange rate at 31.12.2012 10% -10% CZK/EUR 25,14 27,654 22,626
31.12.2012 Currency in Currency teur Teur +10% change teur -10% change
Trade receivables tczk 24 350 969 881 -88 1 076 108
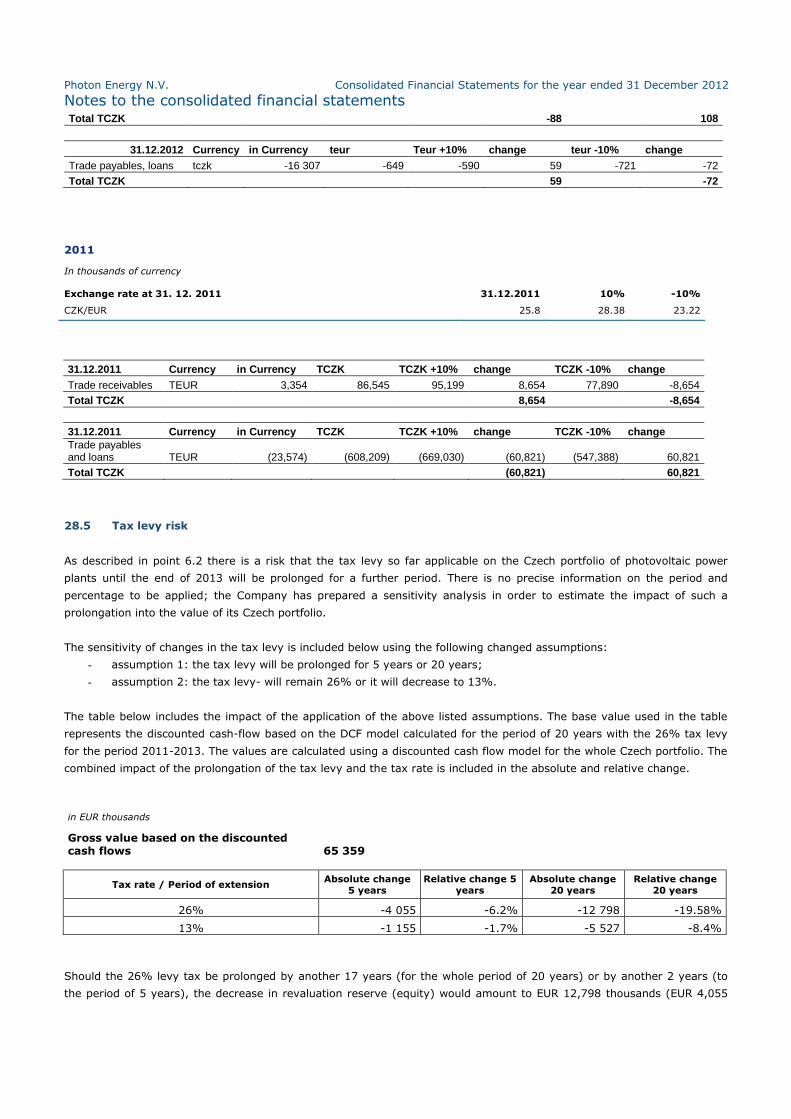
Photon Energy N.V. Consolidated Financial Statements for the year ended 31 December 2012
Notes to the consolidated financial statements
Total TCZK -88 108
31.12.2012 Currency in Currency teur Teur +10% change teur -10% change
Trade payables, loans tczk -16 307 -649 -590 59 -721 -72
Total TCZK 59 -72
2011
In thousands of currency
Exchange rate at 31. 12. 2011 31.12.2011 10% -10%
CZK/EUR 25.8 28.38 23.22
31.12.2011 Currency in Currency TCZK TCZK +10% change TCZK -10% change
Trade receivables TEUR 3,354 86,545 95,199 8,654 77,890 -8,654
Total TCZK 8,654 -8,654
31.12.2011 Currency in Currency TCZK TCZK +10% change TCZK -10% change
Trade payables and loans TEUR (23,574) (608,209) (669,030) (60,821) (547,388) 60,821
Total TCZK (60,821) 60,821
28.5 Tax levy risk
As described in point 6.2 there is a risk that the tax levy so far applicable on the Czech portfolio of photovoltaic power
plants until the end of 2013 will be prolonged for a further period. There is no precise information on the period and
percentage to be applied; the Company has prepared a sensitivity analysis in order to estimate the impact of such a
prolongation into the value of its Czech portfolio.
The sensitivity of changes in the tax levy is included below using the following changed assumptions:
- assumption 1: the tax levy will be prolonged for 5 years or 20 years;
- assumption 2: the tax levy- will remain 26% or it will decrease to 13%.
The table below includes the impact of the application of the above listed assumptions. The base value used in the table
represents the discounted cash-flow based on the DCF model calculated for the period of 20 years with the 26% tax levy
for the period 2011-2013. The values are calculated using a discounted cash flow model for the whole Czech portfolio. The
combined impact of the prolongation of the tax levy and the tax rate is included in the absolute and relative change.
in EUR thousands
Gross value based on the discounted cash flows
65 359
Tax rate / Period of extension Absolute change
5 years
Relative change 5
years
Absolute change
20 years
Relative change
20 years
26% -4 055 -6.2% -12 798 -19.58%
13% -1 155 -1.7% -5 527 -8.4%
Should the 26% levy tax be prolonged by another 17 years (for the whole period of 20 years) or by another 2 years (to
the period of 5 years), the decrease in revaluation reserve (equity) would amount to EUR 12,798 thousands (EUR 4,055
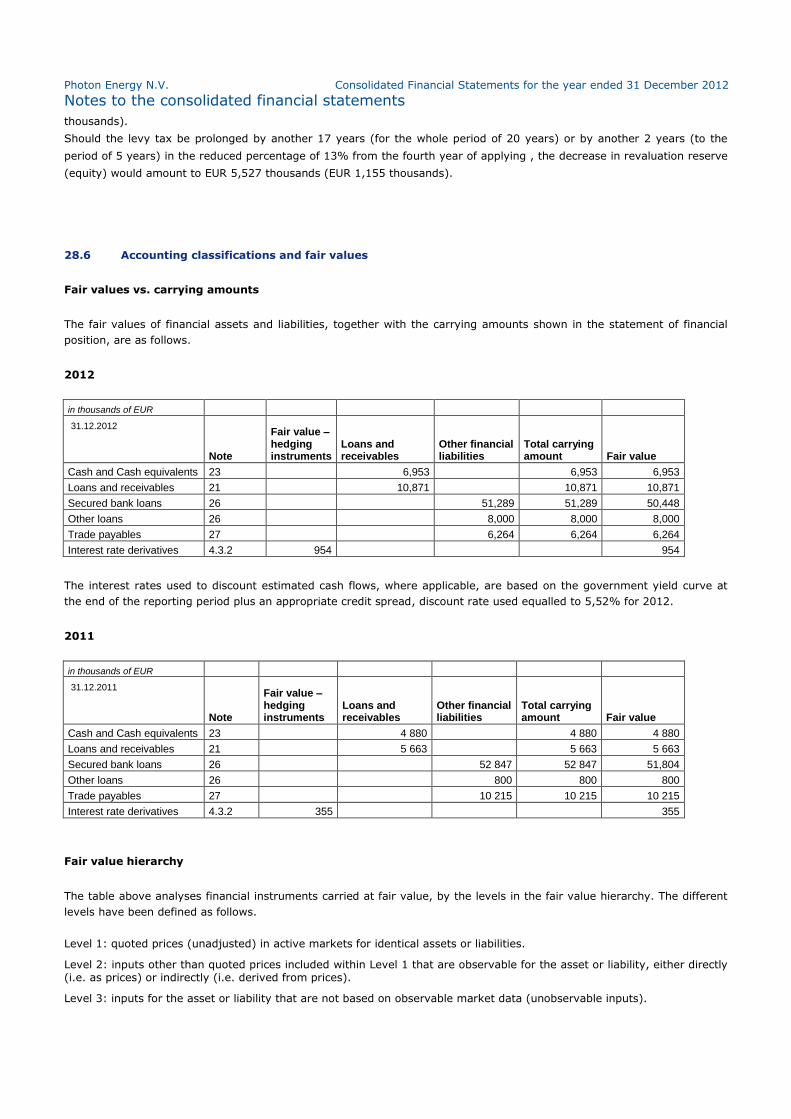
Photon Energy N.V. Consolidated Financial Statements for the year ended 31 December 2012
Notes to the consolidated financial statements
thousands).
Should the levy tax be prolonged by another 17 years (for the whole period of 20 years) or by another 2 years (to the
period of 5 years) in the reduced percentage of 13% from the fourth year of applying , the decrease in revaluation reserve
(equity) would amount to EUR 5,527 thousands (EUR 1,155 thousands).
28.6 Accounting classifications and fair values
Fair values vs. carrying amounts
The fair values of financial assets and liabilities, together with the carrying amounts shown in the statement of financial
position, are as follows.
2012
in thousands of EUR
31.12.2012
Note
Fair value – hedging instruments
Loans and receivables
Other financial liabilities
Total carrying amount Fair value
Cash and Cash equivalents 23
6,953 6,953 6,953
Loans and receivables 21
10,871 10,871 10,871
Secured bank loans 26
51,289 51,289 50,448
Other loans 26
8,000 8,000 8,000
Trade payables 27
6,264 6,264 6,264
Interest rate derivatives 4.3.2 954 954
The interest rates used to discount estimated cash flows, where applicable, are based on the government yield curve at
the end of the reporting period plus an appropriate credit spread, discount rate used equalled to 5,52% for 2012.
2011
in thousands of EUR
31.12.2011
Note
Fair value – hedging instruments
Loans and receivables
Other financial liabilities
Total carrying amount Fair value
Cash and Cash equivalents 23
4 880 4 880 4 880
Loans and receivables 21
5 663 5 663 5 663
Secured bank loans 26
52 847 52 847 51,804
Other loans 26
800 800 800
Trade payables 27
10 215 10 215 10 215
Interest rate derivatives 4.3.2 355 355
Fair value hierarchy
The table above analyses financial instruments carried at fair value, by the levels in the fair value hierarchy. The different
levels have been defined as follows.
Level 1: quoted prices (unadjusted) in active markets for identical assets or liabilities.
Level 2: inputs other than quoted prices included within Level 1 that are observable for the asset or liability, either directly (i.e. as prices) or indirectly (i.e. derived from prices).
Level 3: inputs for the asset or liability that are not based on observable market data (unobservable inputs).
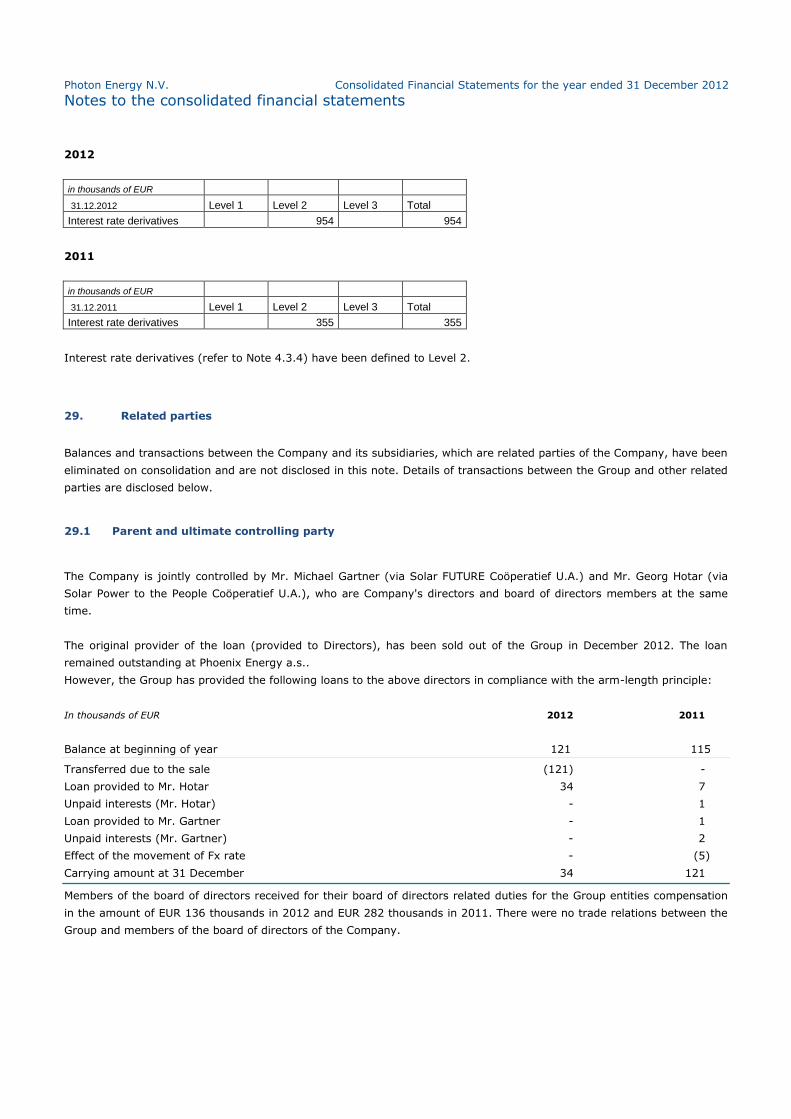
Photon Energy N.V. Consolidated Financial Statements for the year ended 31 December 2012
Notes to the consolidated financial statements
2012
in thousands of EUR
31.12.2012 Level 1 Level 2 Level 3 Total
Interest rate derivatives 954 954
2011
in thousands of EUR
31.12.2011 Level 1 Level 2 Level 3 Total
Interest rate derivatives 355 355
Interest rate derivatives (refer to Note 4.3.4) have been defined to Level 2.
29. Related parties
Balances and transactions between the Company and its subsidiaries, which are related parties of the Company, have been
eliminated on consolidation and are not disclosed in this note. Details of transactions between the Group and other related
parties are disclosed below.
29.1 Parent and ultimate controlling party
The Company is jointly controlled by Mr. Michael Gartner (via Solar FUTURE Coöperatief U.A.) and Mr. Georg Hotar (via
Solar Power to the People Coöperatief U.A.), who are Company's directors and board of directors members at the same
time.
The original provider of the loan (provided to Directors), has been sold out of the Group in December 2012. The loan
remained outstanding at Phoenix Energy a.s..
However, the Group has provided the following loans to the above directors in compliance with the arm-length principle:
In thousands of EUR 2012 2011
Balance at beginning of year 121 115
Transferred due to the sale (121) -
Loan provided to Mr. Hotar 34 7
Unpaid interests (Mr. Hotar) - 1
Loan provided to Mr. Gartner - 1
Unpaid interests (Mr. Gartner) - 2
Effect of the movement of Fx rate - (5)
Carrying amount at 31 December 34 121
Members of the board of directors received for their board of directors related duties for the Group entities compensation
in the amount of EUR 136 thousands in 2012 and EUR 282 thousands in 2011. There were no trade relations between the
Group and members of the board of directors of the Company.
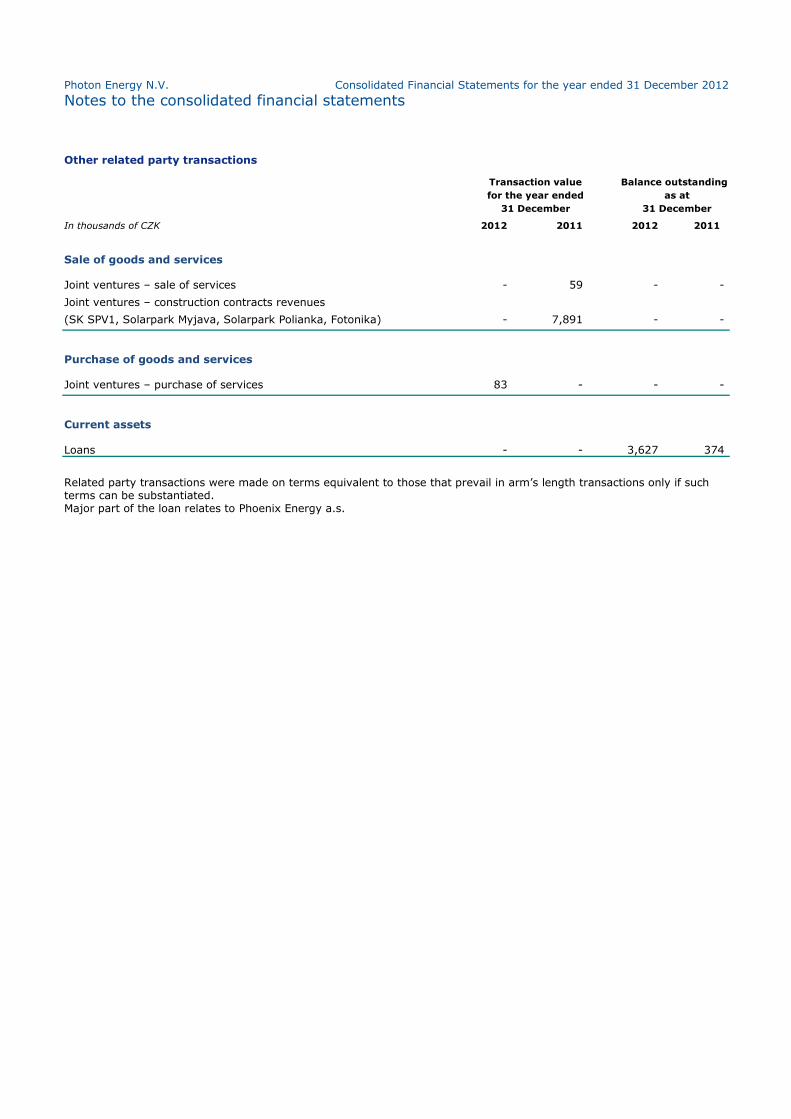
Photon Energy N.V. Consolidated Financial Statements for the year ended 31 December 2012
Notes to the consolidated financial statements
Other related party transactions
Transaction value Balance outstanding
for the year ended as at
31 December 31 December
In thousands of CZK 2012 2011 2012 2011
Sale of goods and services
Joint ventures – sale of services - 59 - -
Joint ventures – construction contracts revenues
(SK SPV1, Solarpark Myjava, Solarpark Polianka, Fotonika) - 7,891 - -
Purchase of goods and services
Joint ventures – purchase of services 83 - - -
Current assets
Loans - - 3,627 374
Related party transactions were made on terms equivalent to those that prevail in arm’s length transactions only if such terms can be substantiated. Major part of the loan relates to Phoenix Energy a.s.
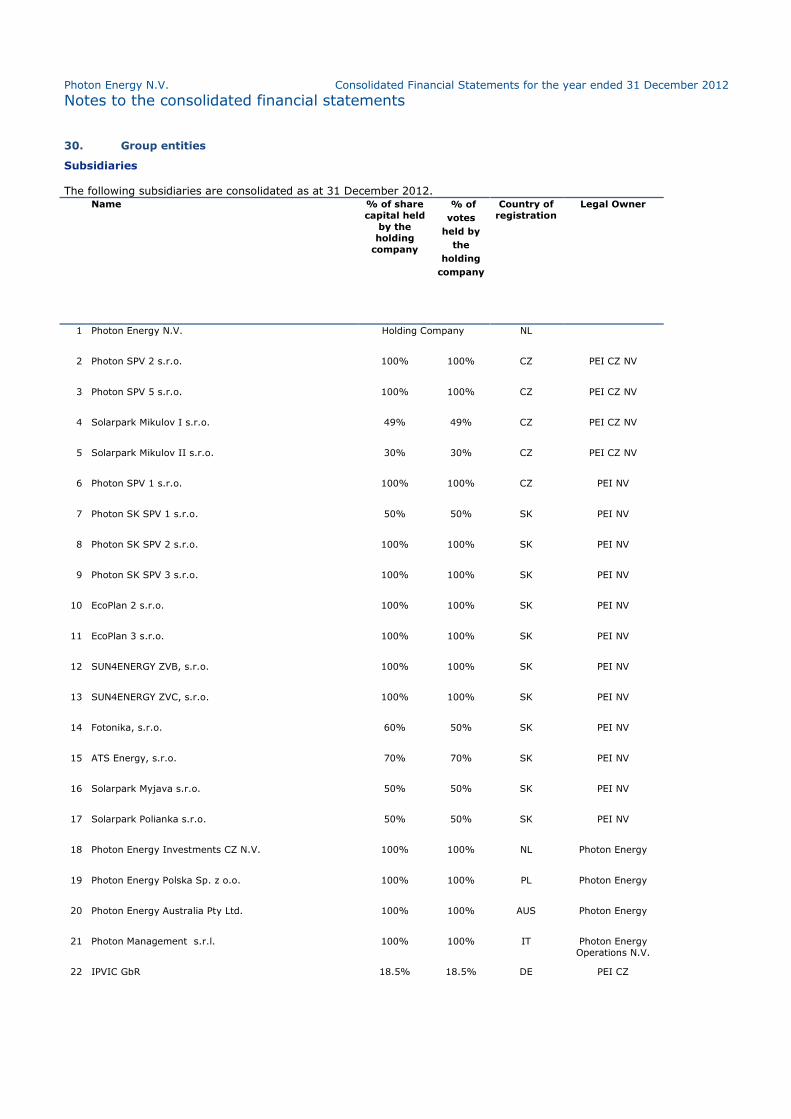
Photon Energy N.V. Consolidated Financial Statements for the year ended 31 December 2012
Notes to the consolidated financial statements
30. Group entities
Subsidiaries
The following subsidiaries are consolidated as at 31 December 2012. Name % of share
capital held
by the
holding
company
% of
votes
held by
the
holding
company
Country of
registration
Legal Owner
1 Photon Energy N.V. Holding Company NL
2 Photon SPV 2 s.r.o. 100% 100% CZ PEI CZ NV
3 Photon SPV 5 s.r.o. 100% 100% CZ PEI CZ NV
4 Solarpark Mikulov I s.r.o. 49% 49% CZ PEI CZ NV
5 Solarpark Mikulov II s.r.o. 30% 30% CZ PEI CZ NV
6 Photon SPV 1 s.r.o. 100% 100% CZ PEI NV
7 Photon SK SPV 1 s.r.o. 50% 50% SK PEI NV
8 Photon SK SPV 2 s.r.o. 100% 100% SK PEI NV
9 Photon SK SPV 3 s.r.o. 100% 100% SK PEI NV
10 EcoPlan 2 s.r.o. 100% 100% SK PEI NV
11 EcoPlan 3 s.r.o. 100% 100% SK PEI NV
12 SUN4ENERGY ZVB, s.r.o. 100% 100% SK PEI NV
13 SUN4ENERGY ZVC, s.r.o. 100% 100% SK PEI NV
14 Fotonika, s.r.o. 60% 50% SK PEI NV
15 ATS Energy, s.r.o. 70% 70% SK PEI NV
16 Solarpark Myjava s.r.o. 50% 50% SK PEI NV
17 Solarpark Polianka s.r.o. 50% 50% SK PEI NV
18 Photon Energy Investments CZ N.V. 100% 100% NL Photon Energy
19 Photon Energy Polska Sp. z o.o. 100% 100% PL Photon Energy
20 Photon Energy Australia Pty Ltd. 100% 100% AUS Photon Energy
21 Photon Management s.r.l. 100% 100% IT Photon Energy
Operations N.V.
22 IPVIC GbR 18.5% 18.5% DE PEI CZ
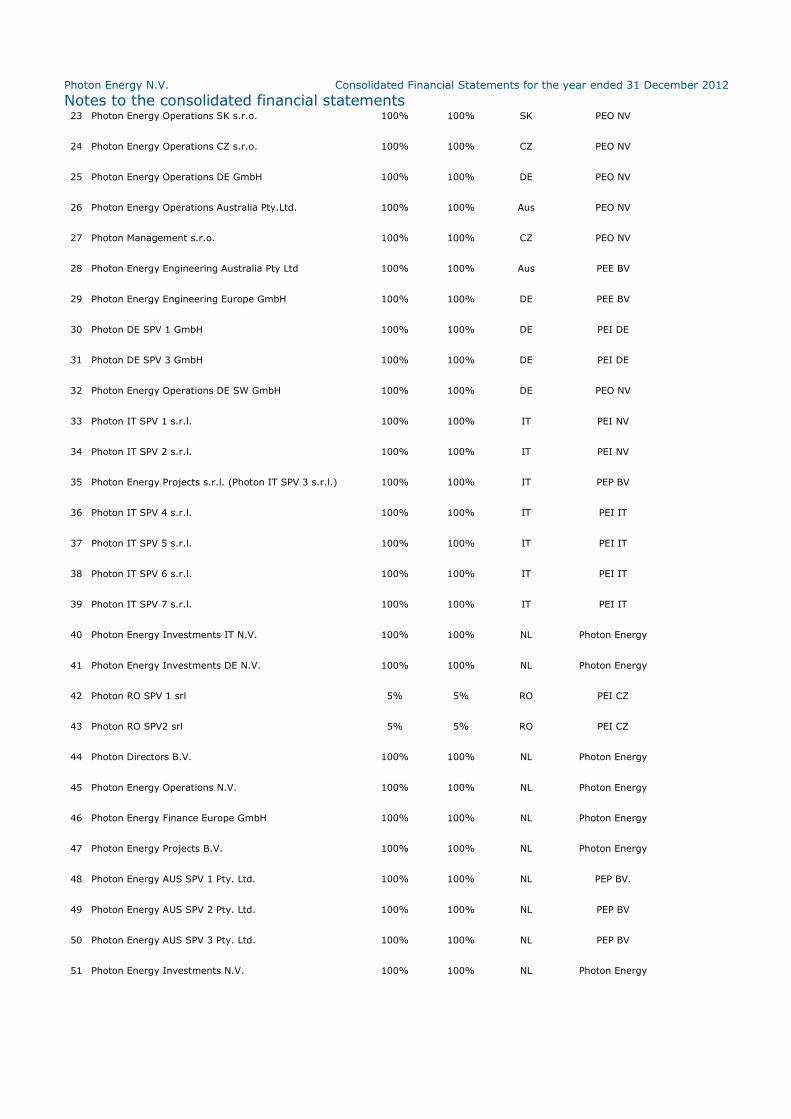
Photon Energy N.V. Consolidated Financial Statements for the year ended 31 December 2012
Notes to the consolidated financial statements
23 Photon Energy Operations SK s.r.o. 100% 100% SK PEO NV
24 Photon Energy Operations CZ s.r.o. 100% 100% CZ PEO NV
25 Photon Energy Operations DE GmbH 100% 100% DE PEO NV
26 Photon Energy Operations Australia Pty.Ltd. 100% 100% Aus PEO NV
27 Photon Management s.r.o. 100% 100% CZ PEO NV
28 Photon Energy Engineering Australia Pty Ltd
100% 100% Aus PEE BV
29 Photon Energy Engineering Europe GmbH
100% 100% DE PEE BV
30 Photon DE SPV 1 GmbH 100% 100% DE PEI DE
31 Photon DE SPV 3 GmbH 100% 100% DE PEI DE
32 Photon Energy Operations DE SW GmbH 100% 100% DE PEO NV
33 Photon IT SPV 1 s.r.l. 100% 100% IT PEI NV
34 Photon IT SPV 2 s.r.l. 100% 100% IT PEI NV
35 Photon Energy Projects s.r.l. (Photon IT SPV 3 s.r.l.) 100% 100% IT PEP BV
36 Photon IT SPV 4 s.r.l. 100% 100% IT PEI IT
37 Photon IT SPV 5 s.r.l. 100% 100% IT PEI IT
38 Photon IT SPV 6 s.r.l. 100% 100% IT PEI IT
39 Photon IT SPV 7 s.r.l. 100% 100% IT PEI IT
40 Photon Energy Investments IT N.V. 100% 100% NL Photon Energy
41 Photon Energy Investments DE N.V. 100% 100% NL Photon Energy
42 Photon RO SPV 1 srl 5% 5% RO PEI CZ
43 Photon RO SPV2 srl 5% 5% RO PEI CZ
44 Photon Directors B.V. 100% 100% NL Photon Energy
45 Photon Energy Operations N.V. 100% 100% NL Photon Energy
46 Photon Energy Finance Europe GmbH 100% 100% NL Photon Energy
47 Photon Energy Projects B.V. 100% 100% NL Photon Energy
48 Photon Energy AUS SPV 1 Pty. Ltd. 100% 100% NL PEP BV.
49 Photon Energy AUS SPV 2 Pty. Ltd. 100% 100% NL PEP BV
50 Photon Energy AUS SPV 3 Pty. Ltd. 100% 100% NL PEP BV
51 Photon Energy Investments N.V. 100% 100% NL Photon Energy
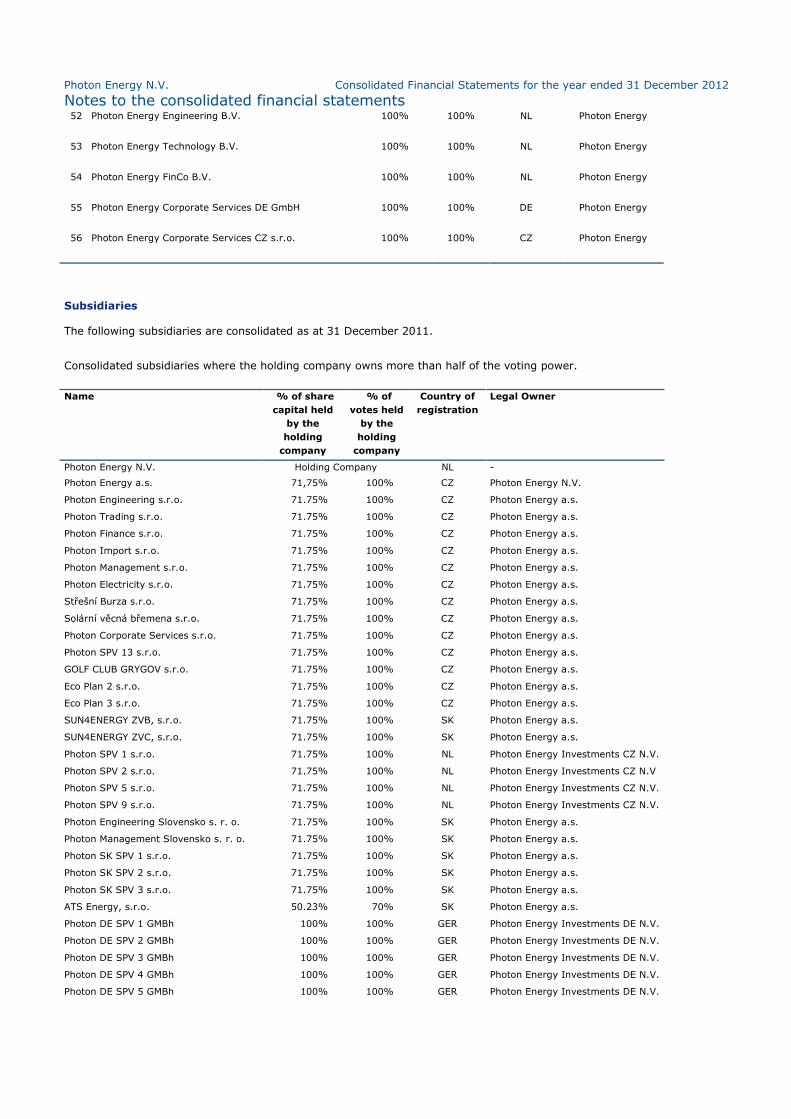
Photon Energy N.V. Consolidated Financial Statements for the year ended 31 December 2012
Notes to the consolidated financial statements
52 Photon Energy Engineering B.V. 100% 100% NL Photon Energy
53 Photon Energy Technology B.V. 100% 100% NL Photon Energy
54 Photon Energy FinCo B.V. 100% 100% NL Photon Energy
55 Photon Energy Corporate Services DE GmbH 100% 100% DE Photon Energy
56 Photon Energy Corporate Services CZ s.r.o. 100% 100% CZ Photon Energy
Subsidiaries
The following subsidiaries are consolidated as at 31 December 2011.
Consolidated subsidiaries where the holding company owns more than half of the voting power.
Name % of share
capital held
by the
holding
company
% of
votes held
by the
holding
company
Country of
registration
Legal Owner
Photon Energy N.V. Holding Company
-
NL -
Photon Energy a.s. 71,75% 100% CZ Photon Energy N.V.
Photon Engineering s.r.o. 71.75% 100% CZ Photon Energy a.s.
Photon Trading s.r.o. 71.75% 100% CZ Photon Energy a.s.
Photon Finance s.r.o. 71.75% 100% CZ Photon Energy a.s.
Photon Import s.r.o. 71.75% 100% CZ Photon Energy a.s.
Photon Management s.r.o. 71.75% 100% CZ Photon Energy a.s.
Photon Electricity s.r.o. 71.75% 100% CZ Photon Energy a.s.
Střešní Burza s.r.o. 71.75% 100% CZ Photon Energy a.s.
Solární věcná břemena s.r.o. 71.75% 100% CZ Photon Energy a.s.
Photon Corporate Services s.r.o. 71.75% 100% CZ Photon Energy a.s.
Photon SPV 13 s.r.o. 71.75% 100% CZ Photon Energy a.s.
GOLF CLUB GRYGOV s.r.o.
71.75% 100% CZ Photon Energy a.s.
Eco Plan 2 s.r.o. 71.75% 100% CZ Photon Energy a.s.
Eco Plan 3 s.r.o. 71.75% 100% CZ Photon Energy a.s.
SUN4ENERGY ZVB, s.r.o. 71.75% 100% SK Photon Energy a.s.
SUN4ENERGY ZVC, s.r.o. 71.75% 100% SK Photon Energy a.s.
Photon SPV 1 s.r.o. 71.75% 100% NL Photon Energy Investments CZ N.V.
Photon SPV 2 s.r.o. 71.75% 100% NL Photon Energy Investments CZ N.V
Photon SPV 5 s.r.o. 71.75% 100% NL Photon Energy Investments CZ N.V.
Photon SPV 9 s.r.o. 71.75% 100% NL Photon Energy Investments CZ N.V.
Photon Engineering Slovensko s. r. o. 71.75% 100% SK Photon Energy a.s.
Photon Management Slovensko s. r. o. 71.75% 100% SK Photon Energy a.s.
Photon SK SPV 1 s.r.o. 71.75% 100% SK Photon Energy a.s.
Photon SK SPV 2 s.r.o. 71.75% 100% SK Photon Energy a.s.
Photon SK SPV 3 s.r.o. 71.75% 100% SK Photon Energy a.s.
ATS Energy, s.r.o. 50.23% 70% SK Photon Energy a.s.
Photon DE SPV 1 GMBh 100% 100% GER Photon Energy Investments DE N.V.
Photon DE SPV 2 GMBh 100% 100% GER Photon Energy Investments DE N.V.
Photon DE SPV 3 GMBh 100% 100% GER Photon Energy Investments DE N.V.
Photon DE SPV 4 GMBh 100% 100% GER Photon Energy Investments DE N.V.
Photon DE SPV 5 GMBh 100% 100% GER Photon Energy Investments DE N.V.
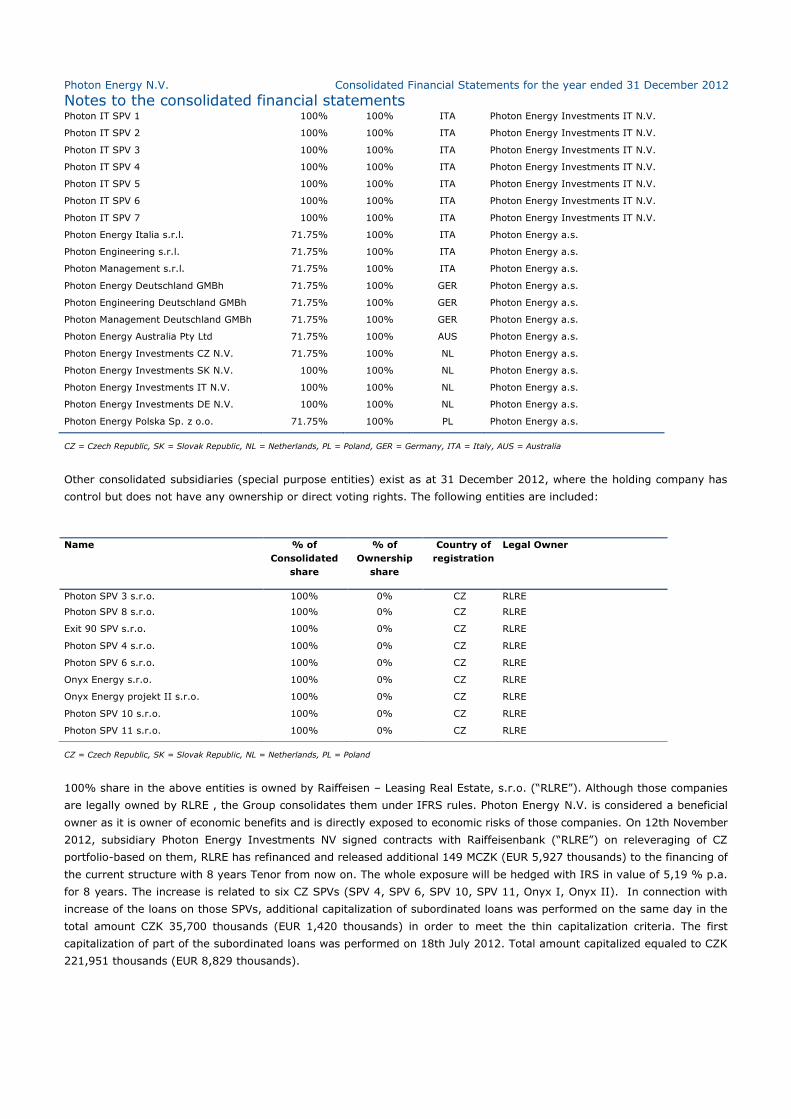
Photon Energy N.V. Consolidated Financial Statements for the year ended 31 December 2012
Notes to the consolidated financial statements
Photon IT SPV 1 100% 100% ITA Photon Energy Investments IT N.V.
Photon IT SPV 2 100% 100% ITA Photon Energy Investments IT N.V.
Photon IT SPV 3 100% 100% ITA Photon Energy Investments IT N.V.
Photon IT SPV 4 100% 100% ITA Photon Energy Investments IT N.V.
Photon IT SPV 5 100% 100% ITA Photon Energy Investments IT N.V.
Photon IT SPV 6 100% 100% ITA Photon Energy Investments IT N.V.
Photon IT SPV 7 100% 100% ITA Photon Energy Investments IT N.V.
Photon Energy Italia s.r.l. 71.75% 100% ITA Photon Energy a.s.
Photon Engineering s.r.l. 71.75% 100% ITA Photon Energy a.s.
Photon Management s.r.l. 71.75% 100% ITA Photon Energy a.s.
Photon Energy Deutschland GMBh 71.75% 100% GER Photon Energy a.s.
Photon Engineering Deutschland GMBh 71.75% 100% GER Photon Energy a.s.
Photon Management Deutschland GMBh 71.75% 100% GER Photon Energy a.s.
Photon Energy Australia Pty Ltd 71.75% 100% AUS Photon Energy a.s.
Photon Energy Investments CZ N.V. 71.75% 100% NL Photon Energy a.s.
Photon Energy Investments SK N.V. 100% 100% NL Photon Energy a.s.
Photon Energy Investments IT N.V. 100% 100% NL Photon Energy a.s.
Photon Energy Investments DE N.V. 100% 100% NL Photon Energy a.s.
Photon Energy Polska Sp. z o.o. 71.75% 100% PL Photon Energy a.s.
CZ = Czech Republic, SK = Slovak Republic, NL = Netherlands, PL = Poland, GER = Germany, ITA = Italy, AUS = Australia
Other consolidated subsidiaries (special purpose entities) exist as at 31 December 2012, where the holding company has
control but does not have any ownership or direct voting rights. The following entities are included:
Name % of
Consolidated
share
% of
Ownership
share
Country of
registration
Legal Owner
Photon SPV 3 s.r.o. 100% 0% CZ RLRE
Photon SPV 8 s.r.o. 100% 0% CZ RLRE
Exit 90 SPV s.r.o. 100% 0% CZ RLRE
Photon SPV 4 s.r.o. 100% 0% CZ RLRE
Photon SPV 6 s.r.o. 100% 0% CZ RLRE
Onyx Energy s.r.o. 100% 0% CZ RLRE
Onyx Energy projekt II s.r.o. 100% 0% CZ RLRE
Photon SPV 10 s.r.o. 100% 0% CZ RLRE
Photon SPV 11 s.r.o. 100% 0% CZ RLRE
CZ = Czech Republic, SK = Slovak Republic, NL = Netherlands, PL = Poland
100% share in the above entities is owned by Raiffeisen – Leasing Real Estate, s.r.o. (“RLRE”). Although those companies
are legally owned by RLRE , the Group consolidates them under IFRS rules. Photon Energy N.V. is considered a beneficial
owner as it is owner of economic benefits and is directly exposed to economic risks of those companies. On 12th November
2012, subsidiary Photon Energy Investments NV signed contracts with Raiffeisenbank (“RLRE”) on releveraging of CZ
portfolio-based on them, RLRE has refinanced and released additional 149 MCZK (EUR 5,927 thousands) to the financing of
the current structure with 8 years Tenor from now on. The whole exposure will be hedged with IRS in value of 5,19 % p.a.
for 8 years. The increase is related to six CZ SPVs (SPV 4, SPV 6, SPV 10, SPV 11, Onyx I, Onyx II). In connection with
increase of the loans on those SPVs, additional capitalization of subordinated loans was performed on the same day in the
total amount CZK 35,700 thousands (EUR 1,420 thousands) in order to meet the thin capitalization criteria. The first
capitalization of part of the subordinated loans was performed on 18th July 2012. Total amount capitalized equaled to CZK
221,951 thousands (EUR 8,829 thousands).

Photon Energy N.V. Consolidated Financial Statements for the year ended 31 December 2012
Notes to the consolidated financial statements
30. Group entities (continued)
Based on the new contractual agreements, PEI NV has the right to apply call option for purchase of 100% share in the
RLRE SPVs in case of full repayment of external loans, security loans, and all the other financial liabilities of PEI NV, RLRE
SPVs and parent company PENV towards RLRE and Financing bank, plus payment of future purchase price for the transfer
of share in the SPVs. When all the above conditions are met, PEINV can apply call option for purchase of 100% share in
the RLRE subsidiaries.
Photon Energy N.V. Consolidated Financial Statements for the year ended 31 December 2012
Notes to the consolidated financial statements
31. Subsequent events
On 6 February 2013, Photon Energy Operations NV sold its share in Photon Management s.r.o. for the sales price
of EUR 8 thousands (CZK 200 thousands) to a third party. However as of the date of the sale, all activities of the
Company had already been transferred to newly founded companies within the Group.
On 14 February 2013, Photon Management s.r.l. has been renamed into “Photon Energy Operations IT s.r.l. and
its legal seat has been transferred to Milano, Largo Richini 6.
Photon Energy Investments NV issued in March 2013 a bond for the period of 5 years on the non-regulated part
of the Frankfurt stock exchange. The bond coupon is 8% p.a. and is paid quarterly.
In March 2013, Photon Energy Operations is expanding its O&M business in Italy by taking over service contracts
(March 2013) for 8 power plants of 1 MWp each in the Abruzzo region. Along with the existing contracts Photon
Energy Operations’ O&M services portfolio has now grown to more than 73 MWp worldwide.
On 19 April 2013, the Company announced the process of a share swap to the minority shareholders of Phoenix
Energy a.s.( originally Photon Energy a.s. sold out of the Group at the end of 2012) . Those minority shareholders
are offered to exchange their shares for shares of Photon Energy N.V. in the share one to one. The offer period
will last one month as of the announcement on 19 April 2013 and after formalization of this process, Photon
Energy N.V. will be listed in NewConnect, a non-regulated financing and trading platform organized by the
Warsaw Stock Exchange, as well and its shares will be publicly traded.
On 7 May 2013, the group obtained confirmation from the private financing company about the prolongation of
the due date of the provided loan from 30 June 2013 till 31 December 2013.
Management is not aware of any other significant subsequent events per the date of these financial statements.
32. Contingent assets and liabilities
There are no significant contingent assets or liabilities that need to be disclosed.
Photon Energy N.V. Stand alone Financial Statements for the year ended 31 December 2012
Photon Energy N.V.
Stand alone Financial Statements
for the year ended 31 December 2012
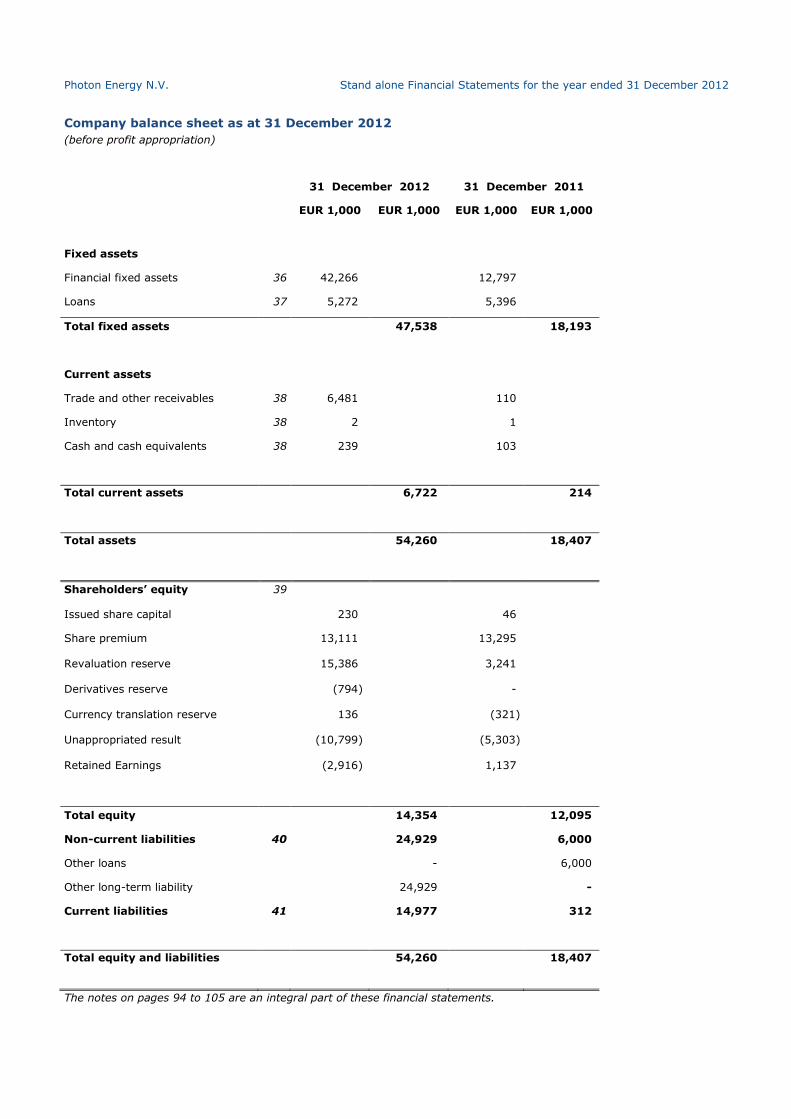
Photon Energy N.V. Stand alone Financial Statements for the year ended 31 December 2012
Company balance sheet as at 31 December 2012
(before profit appropriation)
31 December 2012 31 December 2011
EUR 1,000 EUR 1,000 EUR 1,000 EUR 1,000
Fixed assets
Financial fixed assets 36 42,266 12,797
Loans 37 5,272 5,396
Total fixed assets 47,538 18,193
Current assets
Trade and other receivables 38 6,481 110
Inventory 38 2 1
Cash and cash equivalents 38 239 103
Total current assets 6,722 214
Total assets 54,260 18,407
Shareholders’ equity 39
Issued share capital 230 46
Share premium 13,111 13,295
Revaluation reserve 15,386 3,241
Derivatives reserve (794) -
Currency translation reserve 136 (321)
Unappropriated result (10,799) (5,303)
Retained Earnings (2,916) 1,137
Total equity 14,354 12,095
Non-current liabilities 40 24,929 6,000
Other loans - 6,000
Other long-term liability 24,929 -
Current liabilities 41 14,977 312
Total equity and liabilities 54,260 18,407
The notes on pages 94 to 105 are an integral part of these financial statements.
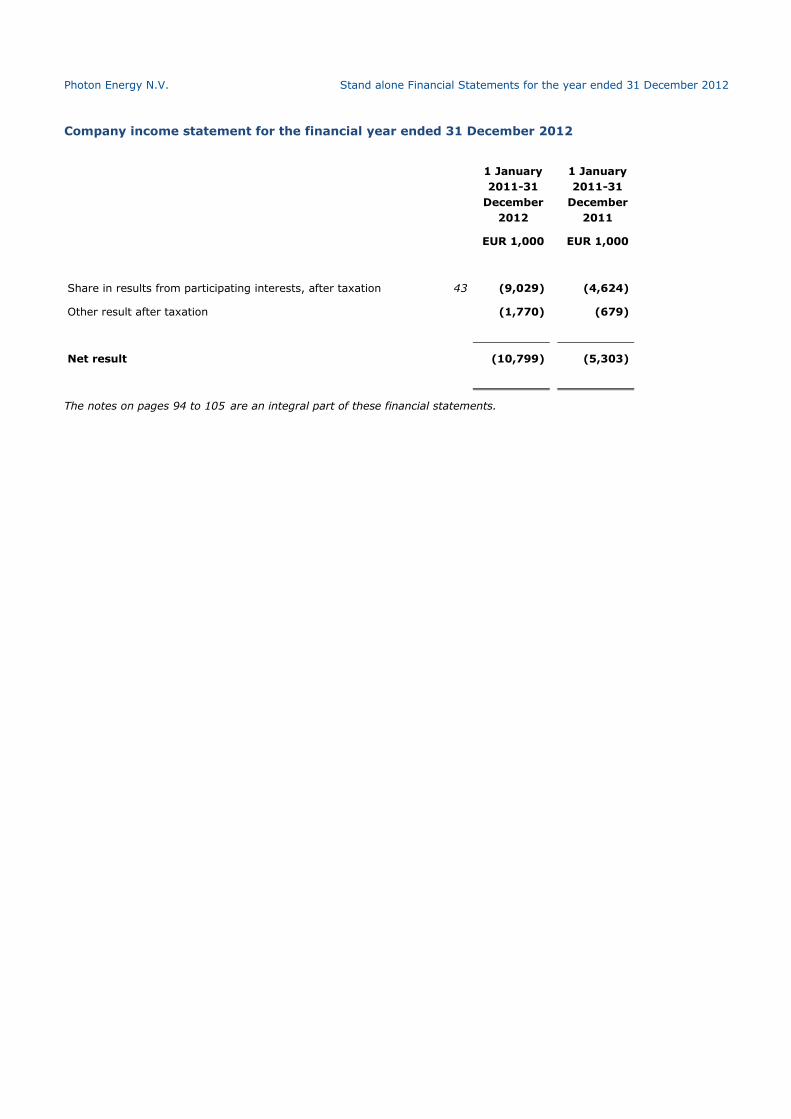
Photon Energy N.V. Stand alone Financial Statements for the year ended 31 December 2012
Company income statement for the financial year ended 31 December 2012
1 January
2011-31
December
2012
1 January
2011-31
December
2011
EUR 1,000 EUR 1,000
Share in results from participating interests, after taxation 43 (9,029) (4,624)
Other result after taxation (1,770) (679)
Net result (10,799) (5,303)
The notes on pages 94 to 105 are an integral part of these financial statements.
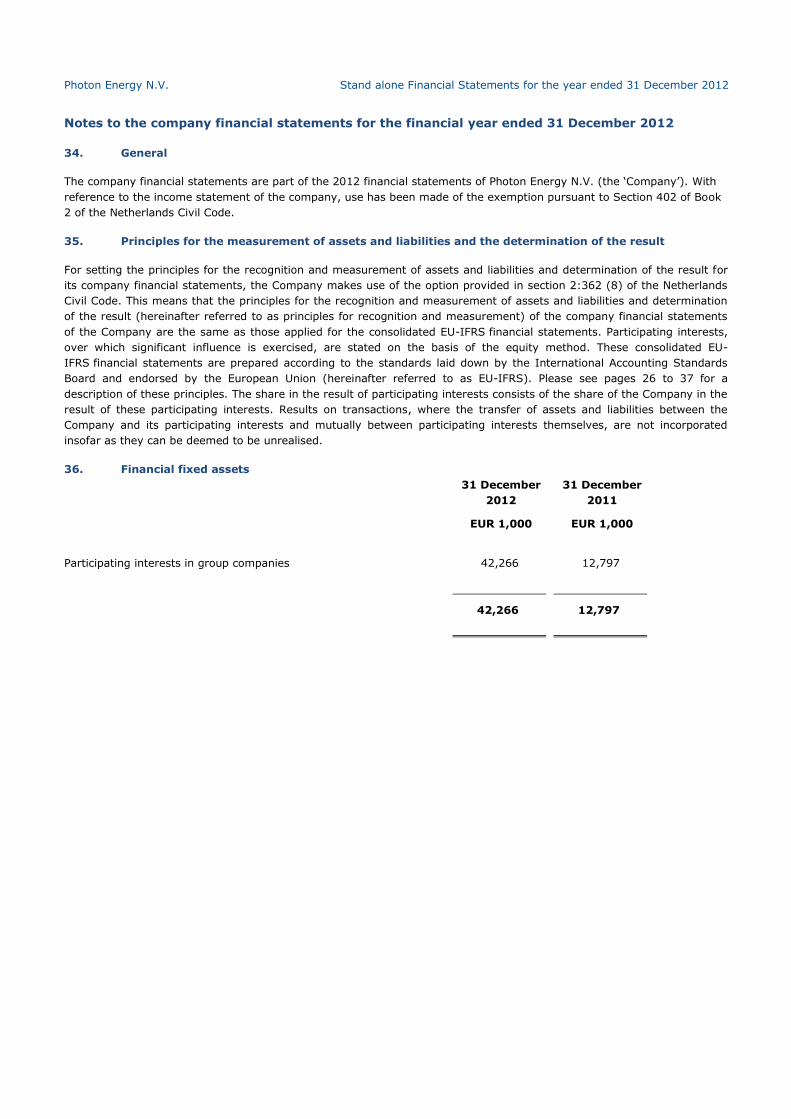
Photon Energy N.V. Stand alone Financial Statements for the year ended 31 December 2012
Notes to the company financial statements for the financial year ended 31 December 2012
34. General
The company financial statements are part of the 2012 financial statements of Photon Energy N.V. (the ‘Company’). With
reference to the income statement of the company, use has been made of the exemption pursuant to Section 402 of Book
2 of the Netherlands Civil Code.
35. Principles for the measurement of assets and liabilities and the determination of the result
For setting the principles for the recognition and measurement of assets and liabilities and determination of the result for
its company financial statements, the Company makes use of the option provided in section 2:362 (8) of the Netherlands
Civil Code. This means that the principles for the recognition and measurement of assets and liabilities and determination
of the result (hereinafter referred to as principles for recognition and measurement) of the company financial statements
of the Company are the same as those applied for the consolidated EU-IFRS financial statements. Participating interests,
over which significant influence is exercised, are stated on the basis of the equity method. These consolidated EU-
IFRS financial statements are prepared according to the standards laid down by the International Accounting Standards
Board and endorsed by the European Union (hereinafter referred to as EU-IFRS). Please see pages 26 to 37 for a
description of these principles. The share in the result of participating interests consists of the share of the Company in the
result of these participating interests. Results on transactions, where the transfer of assets and liabilities between the
Company and its participating interests and mutually between participating interests themselves, are not incorporated
insofar as they can be deemed to be unrealised.
36. Financial fixed assets
31 December
2012
31 December
2011
EUR 1,000 EUR 1,000
Participating interests in group companies 42,266 12,797
42,266 12,797
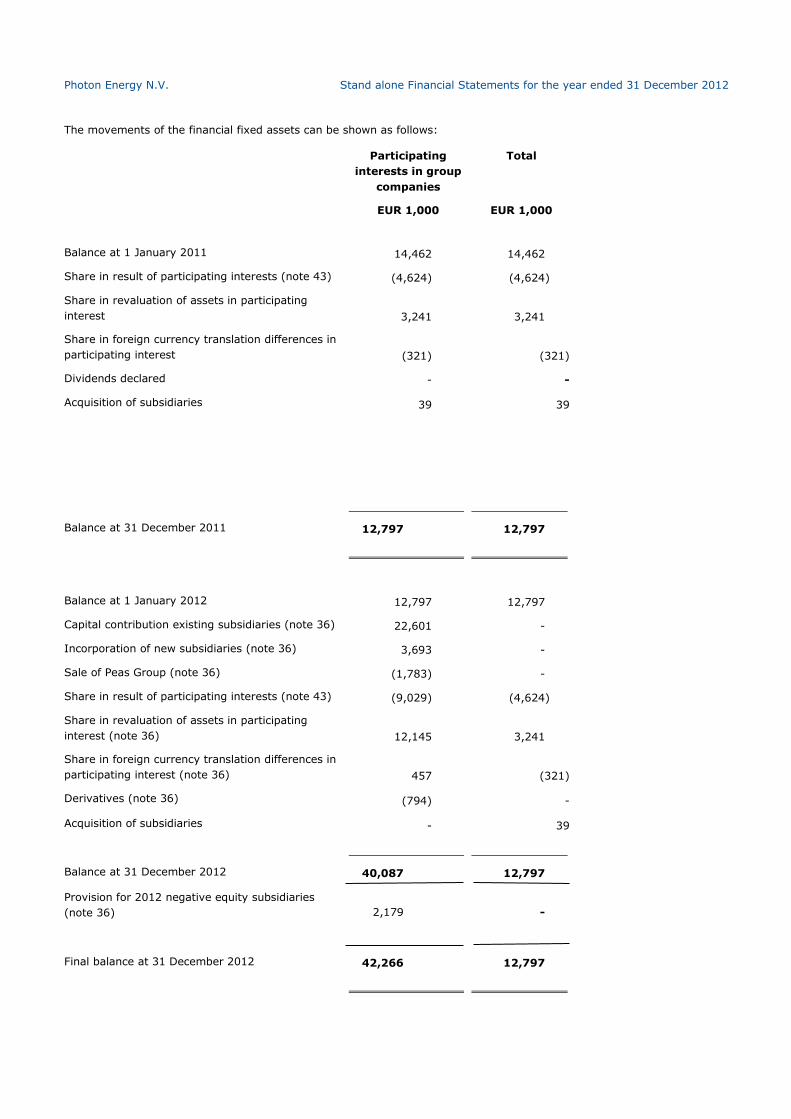
Photon Energy N.V. Stand alone Financial Statements for the year ended 31 December 2012
The movements of the financial fixed assets can be shown as follows: Participating
interests in group
companies
Total
EUR 1,000 EUR 1,000
Balance at 1 January 2011 14,462 14,462
Share in result of participating interests (note 43) (4,624) (4,624)
Share in revaluation of assets in participating
interest 3,241 3,241
Share in foreign currency translation differences in
participating interest (321) (321)
Dividends declared - -
Acquisition of subsidiaries 39 39
Balance at 31 December 2011 12,797 12,797
Balance at 1 January 2012 12,797 12,797
Capital contribution existing subsidiaries (note 36) 22,601 -
Incorporation of new subsidiaries (note 36) 3,693 -
Sale of Peas Group (note 36) (1,783) -
Share in result of participating interests (note 43) (9,029) (4,624)
Share in revaluation of assets in participating
interest (note 36) 12,145 3,241
Share in foreign currency translation differences in
participating interest (note 36) 457 (321)
Derivatives (note 36) (794) -
Acquisition of subsidiaries - 39
Balance at 31 December 2012 40,087 12,797
Provision for 2012 negative equity subsidiaries
(note 36) 2,179 -
Final balance at 31 December 2012 42,266 12,797
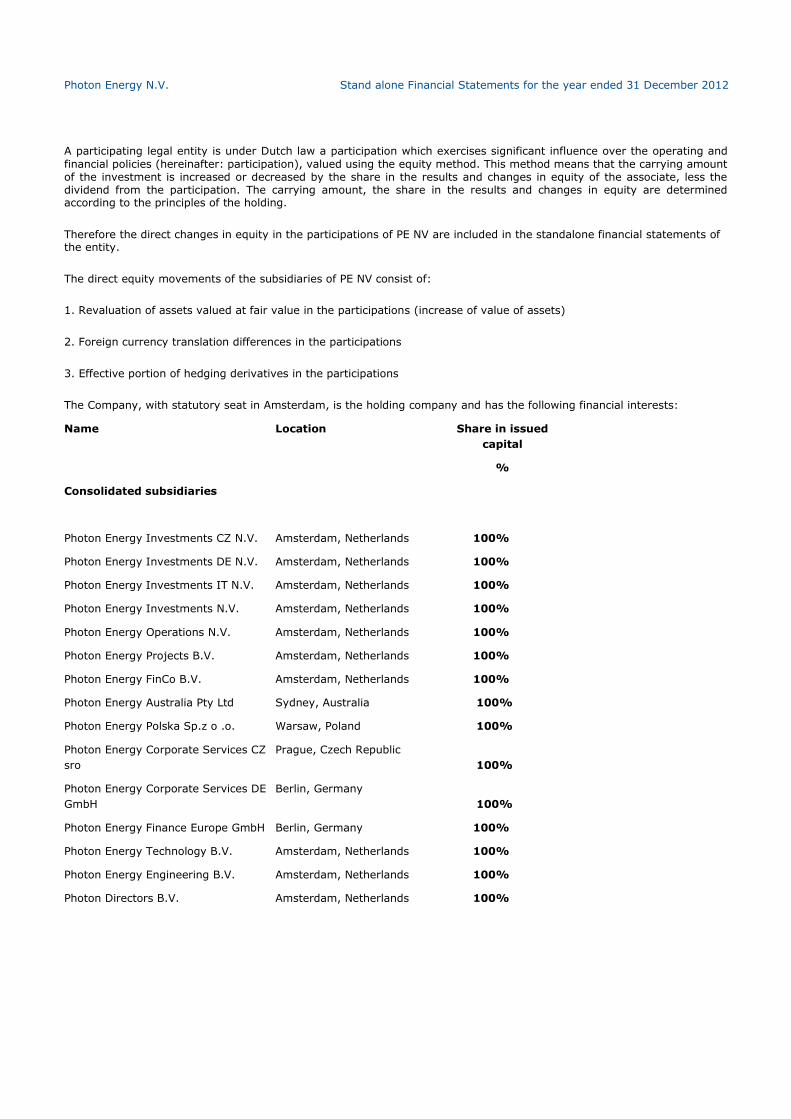
Photon Energy N.V. Stand alone Financial Statements for the year ended 31 December 2012
A participating legal entity is under Dutch law a participation which exercises significant influence over the operating and
financial policies (hereinafter: participation), valued using the equity method. This method means that the carrying amount of the investment is increased or decreased by the share in the results and changes in equity of the associate, less the dividend from the participation. The carrying amount, the share in the results and changes in equity are determined according to the principles of the holding.
Therefore the direct changes in equity in the participations of PE NV are included in the standalone financial statements of the entity.
The direct equity movements of the subsidiaries of PE NV consist of:
1. Revaluation of assets valued at fair value in the participations (increase of value of assets)
2. Foreign currency translation differences in the participations
3. Effective portion of hedging derivatives in the participations
The Company, with statutory seat in Amsterdam, is the holding company and has the following financial interests:
Name Location Share in issued
capital
%
Consolidated subsidiaries
Photon Energy Investments CZ N.V. Amsterdam, Netherlands 100%
Photon Energy Investments DE N.V. Amsterdam, Netherlands 100%
Photon Energy Investments IT N.V. Amsterdam, Netherlands 100%
Photon Energy Investments N.V. Amsterdam, Netherlands 100%
Photon Energy Operations N.V. Amsterdam, Netherlands 100%
Photon Energy Projects B.V. Amsterdam, Netherlands 100%
Photon Energy FinCo B.V. Amsterdam, Netherlands 100%
Photon Energy Australia Pty Ltd Sydney, Australia 100%
Photon Energy Polska Sp.z o .o. Warsaw, Poland 100%
Photon Energy Corporate Services CZ
sro
Prague, Czech Republic
100%
Photon Energy Corporate Services DE
GmbH
Berlin, Germany
100%
Photon Energy Finance Europe GmbH Berlin, Germany 100%
Photon Energy Technology B.V. Amsterdam, Netherlands 100%
Photon Energy Engineering B.V. Amsterdam, Netherlands 100%
Photon Directors B.V. Amsterdam, Netherlands 100%
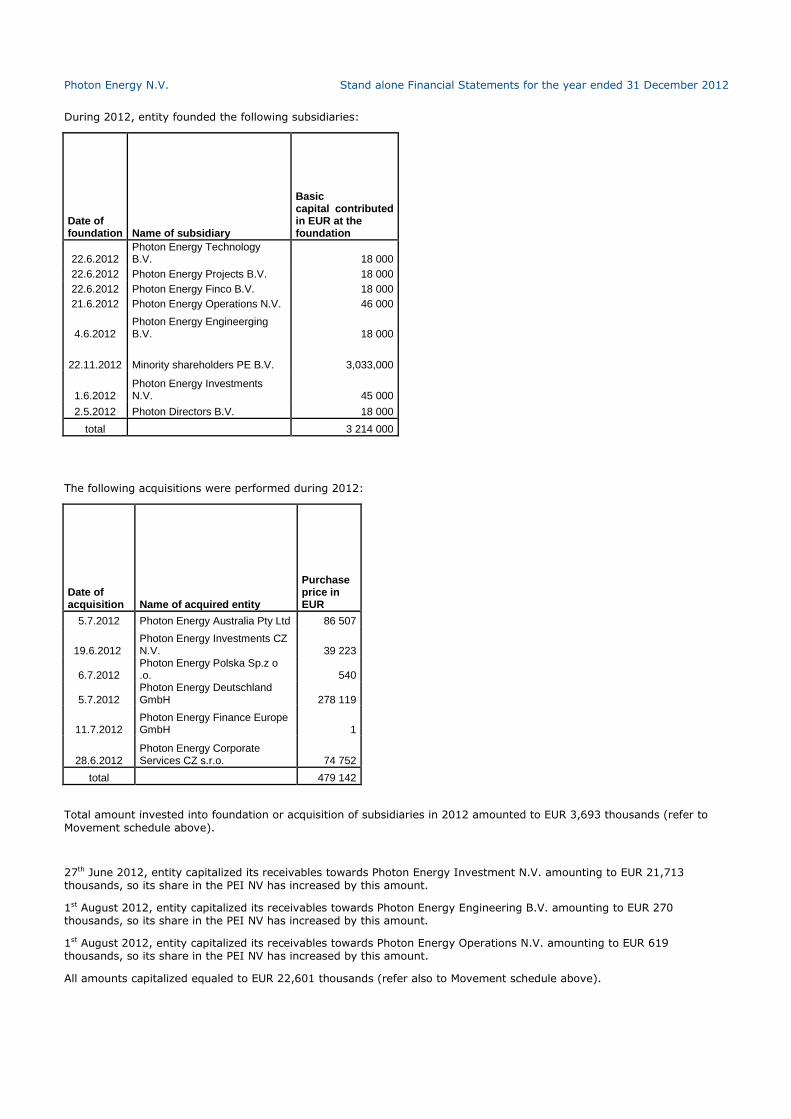
Photon Energy N.V. Stand alone Financial Statements for the year ended 31 December 2012
During 2012, entity founded the following subsidiaries:
Date of foundation Name of subsidiary
Basic capital contributed in EUR at the foundation
22.6.2012 Photon Energy Technology B.V. 18 000
22.6.2012 Photon Energy Projects B.V. 18 000
22.6.2012 Photon Energy Finco B.V. 18 000
21.6.2012 Photon Energy Operations N.V. 46 000
4.6.2012 Photon Energy Engineerging B.V. 18 000
22.11.2012 Minority shareholders PE B.V. 3,033,000
1.6.2012 Photon Energy Investments N.V. 45 000
2.5.2012 Photon Directors B.V. 18 000
total 3 214 000
The following acquisitions were performed during 2012:
Date of acquisition Name of acquired entity
Purchase price in EUR
5.7.2012 Photon Energy Australia Pty Ltd 86 507
19.6.2012 Photon Energy Investments CZ N.V. 39 223
6.7.2012 Photon Energy Polska Sp.z o .o. 540
5.7.2012 Photon Energy Deutschland GmbH 278 119
11.7.2012 Photon Energy Finance Europe GmbH 1
28.6.2012 Photon Energy Corporate Services CZ s.r.o. 74 752
total 479 142
Total amount invested into foundation or acquisition of subsidiaries in 2012 amounted to EUR 3,693 thousands (refer to
Movement schedule above).
27th June 2012, entity capitalized its receivables towards Photon Energy Investment N.V. amounting to EUR 21,713 thousands, so its share in the PEI NV has increased by this amount.
1st August 2012, entity capitalized its receivables towards Photon Energy Engineering B.V. amounting to EUR 270 thousands, so its share in the PEI NV has increased by this amount.
1st August 2012, entity capitalized its receivables towards Photon Energy Operations N.V. amounting to EUR 619 thousands, so its share in the PEI NV has increased by this amount.
All amounts capitalized equaled to EUR 22,601 thousands (refer also to Movement schedule above).
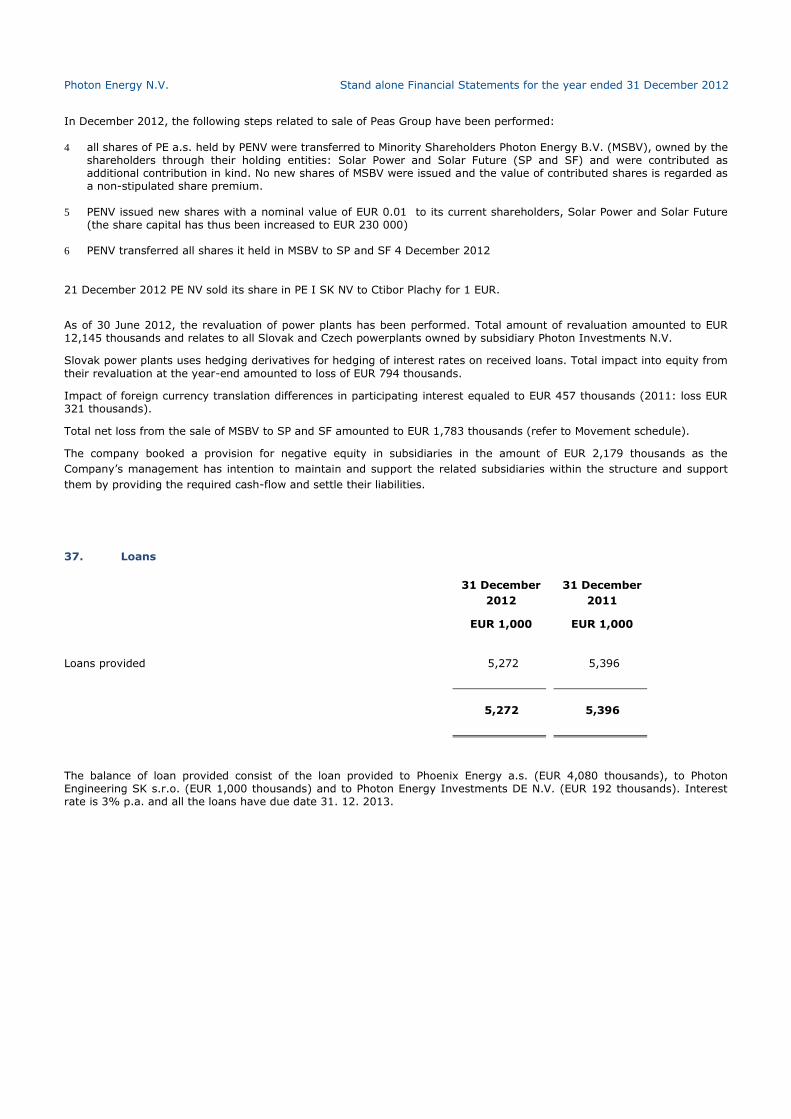
Photon Energy N.V. Stand alone Financial Statements for the year ended 31 December 2012
In December 2012, the following steps related to sale of Peas Group have been performed:
4 all shares of PE a.s. held by PENV were transferred to Minority Shareholders Photon Energy B.V. (MSBV), owned by the shareholders through their holding entities: Solar Power and Solar Future (SP and SF) and were contributed as additional contribution in kind. No new shares of MSBV were issued and the value of contributed shares is regarded as a non-stipulated share premium.
5 PENV issued new shares with a nominal value of EUR 0.01 to its current shareholders, Solar Power and Solar Future
(the share capital has thus been increased to EUR 230 000) 6 PENV transferred all shares it held in MSBV to SP and SF 4 December 2012
21 December 2012 PE NV sold its share in PE I SK NV to Ctibor Plachy for 1 EUR.
As of 30 June 2012, the revaluation of power plants has been performed. Total amount of revaluation amounted to EUR 12,145 thousands and relates to all Slovak and Czech powerplants owned by subsidiary Photon Investments N.V.
Slovak power plants uses hedging derivatives for hedging of interest rates on received loans. Total impact into equity from
their revaluation at the year-end amounted to loss of EUR 794 thousands.
Impact of foreign currency translation differences in participating interest equaled to EUR 457 thousands (2011: loss EUR 321 thousands).
Total net loss from the sale of MSBV to SP and SF amounted to EUR 1,783 thousands (refer to Movement schedule).
The company booked a provision for negative equity in subsidiaries in the amount of EUR 2,179 thousands as the
Company’s management has intention to maintain and support the related subsidiaries within the structure and support
them by providing the required cash-flow and settle their liabilities.
37. Loans
31 December
2012
31 December
2011
EUR 1,000 EUR 1,000
Loans provided 5,272 5,396
5,272 5,396
The balance of loan provided consist of the loan provided to Phoenix Energy a.s. (EUR 4,080 thousands), to Photon Engineering SK s.r.o. (EUR 1,000 thousands) and to Photon Energy Investments DE N.V. (EUR 192 thousands). Interest rate is 3% p.a. and all the loans have due date 31. 12. 2013.
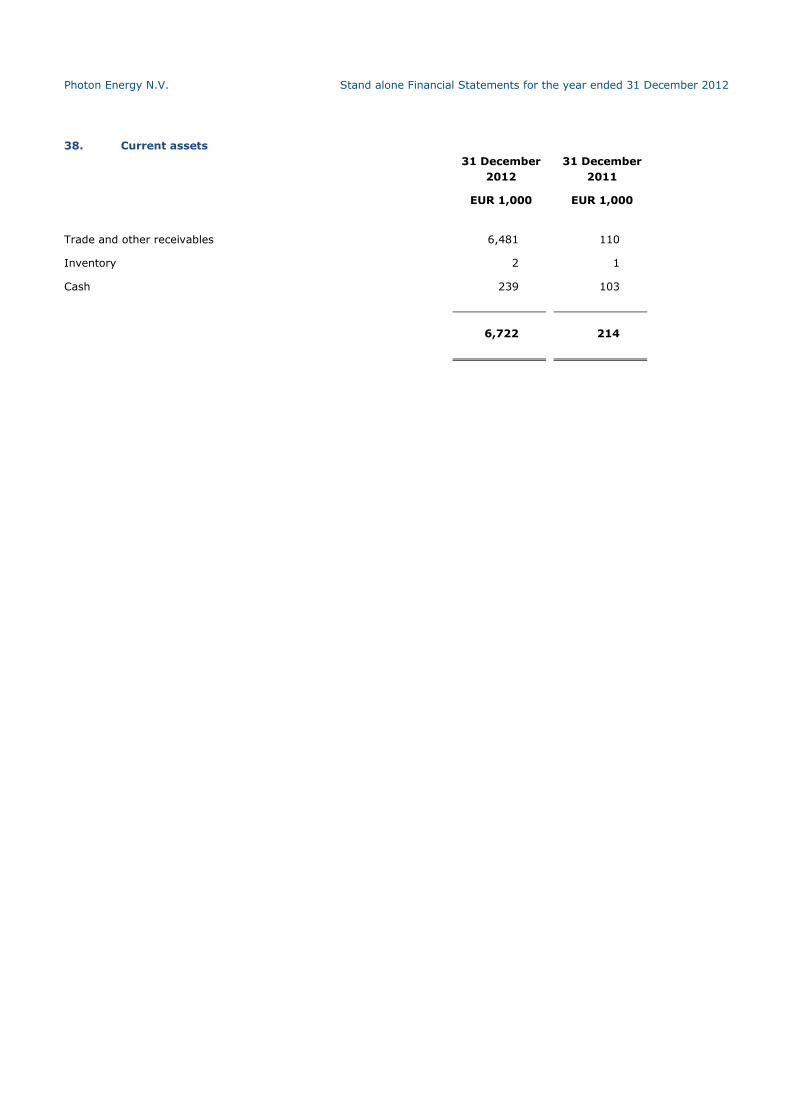
Photon Energy N.V. Stand alone Financial Statements for the year ended 31 December 2012
38. Current assets
31 December
2012
31 December
2011
EUR 1,000 EUR 1,000
Trade and other receivables 6,481 110
Inventory 2 1
Cash 239 103
6,722 214
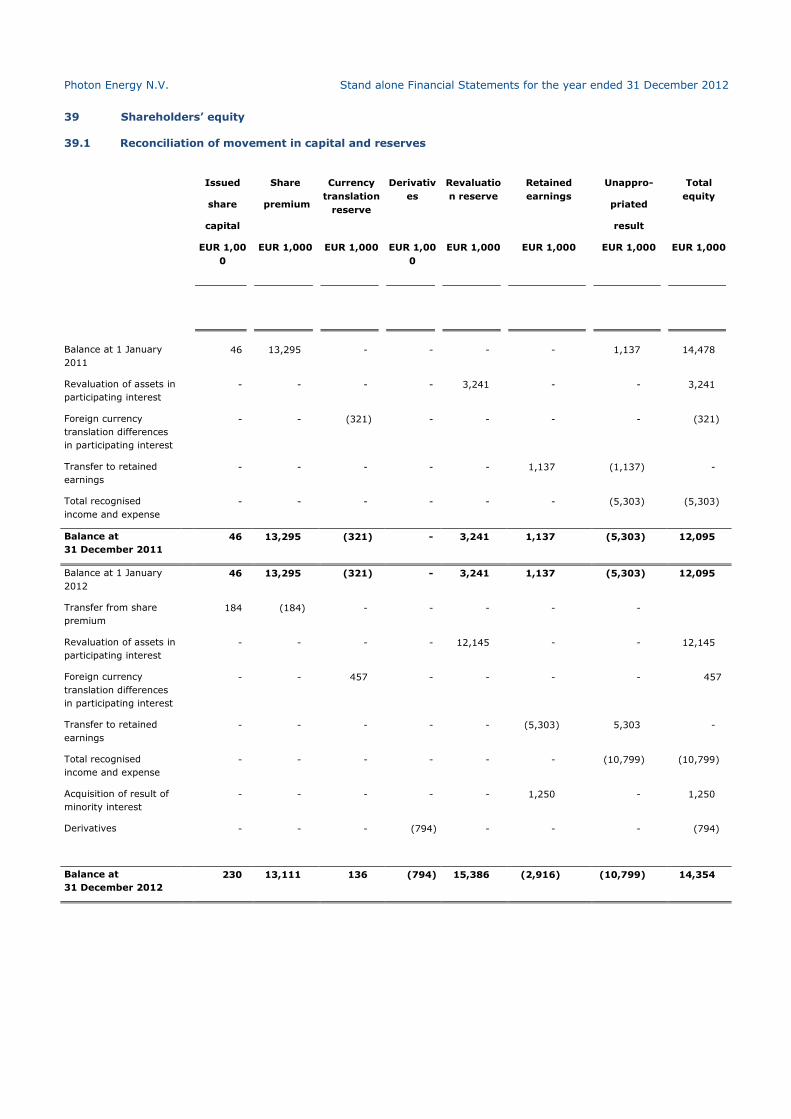
Photon Energy N.V. Stand alone Financial Statements for the year ended 31 December 2012
39 Shareholders’ equity
39.1 Reconciliation of movement in capital and reserves
Issued
share
capital
Share
premium
Currency
translation
reserve
Derivativ
es
Revaluatio
n reserve
Retained
earnings
Unappro-
priated
result
Total
equity
EUR 1,00
0
EUR 1,000 EUR 1,000 EUR 1,00
0
EUR 1,000 EUR 1,000 EUR 1,000 EUR 1,000
Balance at 1 January
2011
46 13,295 - - - - 1,137 14,478
Revaluation of assets in
participating interest
- - - - 3,241 - - 3,241
Foreign currency
translation differences
in participating interest
- - (321) - - - - (321)
Transfer to retained
earnings
- - - - - 1,137 (1,137) -
Total recognised
income and expense
- - - - - - (5,303) (5,303)
Balance at
31 December 2011
46 13,295 (321) - 3,241 1,137 (5,303) 12,095
Balance at 1 January
2012
46 13,295 (321) - 3,241 1,137 (5,303) 12,095
Transfer from share
premium
184 (184) - - - - -
Revaluation of assets in
participating interest
- - - - 12,145 - - 12,145
Foreign currency
translation differences
in participating interest
- - 457 - - - - 457
Transfer to retained
earnings
- - - - - (5,303) 5,303 -
Total recognised
income and expense
- - - - - - (10,799) (10,799)
Acquisition of result of
minority interest
- - - - - 1,250 - 1,250
Derivatives - - - (794) - - - (794)
Balance at
31 December 2012
230 13,111 136 (794) 15,386 (2,916) (10,799) 14,354
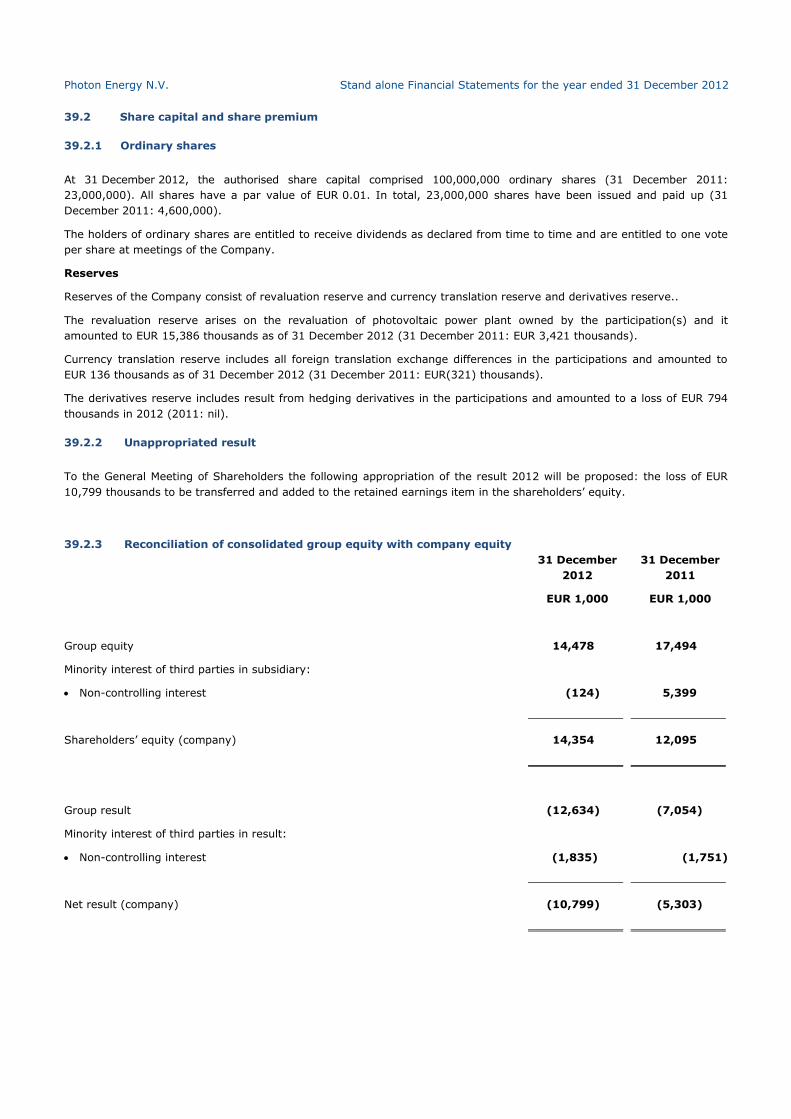
Photon Energy N.V. Stand alone Financial Statements for the year ended 31 December 2012
39.2 Share capital and share premium
39.2.1 Ordinary shares
At 31 December 2012, the authorised share capital comprised 100,000,000 ordinary shares (31 December 2011:
23,000,000). All shares have a par value of EUR 0.01. In total, 23,000,000 shares have been issued and paid up (31
December 2011: 4,600,000).
The holders of ordinary shares are entitled to receive dividends as declared from time to time and are entitled to one vote
per share at meetings of the Company.
Reserves
Reserves of the Company consist of revaluation reserve and currency translation reserve and derivatives reserve..
The revaluation reserve arises on the revaluation of photovoltaic power plant owned by the participation(s) and it
amounted to EUR 15,386 thousands as of 31 December 2012 (31 December 2011: EUR 3,421 thousands).
Currency translation reserve includes all foreign translation exchange differences in the participations and amounted to
EUR 136 thousands as of 31 December 2012 (31 December 2011: EUR(321) thousands).
The derivatives reserve includes result from hedging derivatives in the participations and amounted to a loss of EUR 794
thousands in 2012 (2011: nil).
39.2.2 Unappropriated result
To the General Meeting of Shareholders the following appropriation of the result 2012 will be proposed: the loss of EUR
10,799 thousands to be transferred and added to the retained earnings item in the shareholders’ equity.
39.2.3 Reconciliation of consolidated group equity with company equity
31 December
2012
31 December
2011
EUR 1,000 EUR 1,000
Group equity 14,478 17,494
Minority interest of third parties in subsidiary:
Non-controlling interest (124) 5,399
Shareholders’ equity (company) 14,354 12,095
Group result (12,634) (7,054)
Minority interest of third parties in result:
Non-controlling interest (1,835) (1,751)
Net result (company) (10,799) (5,303)
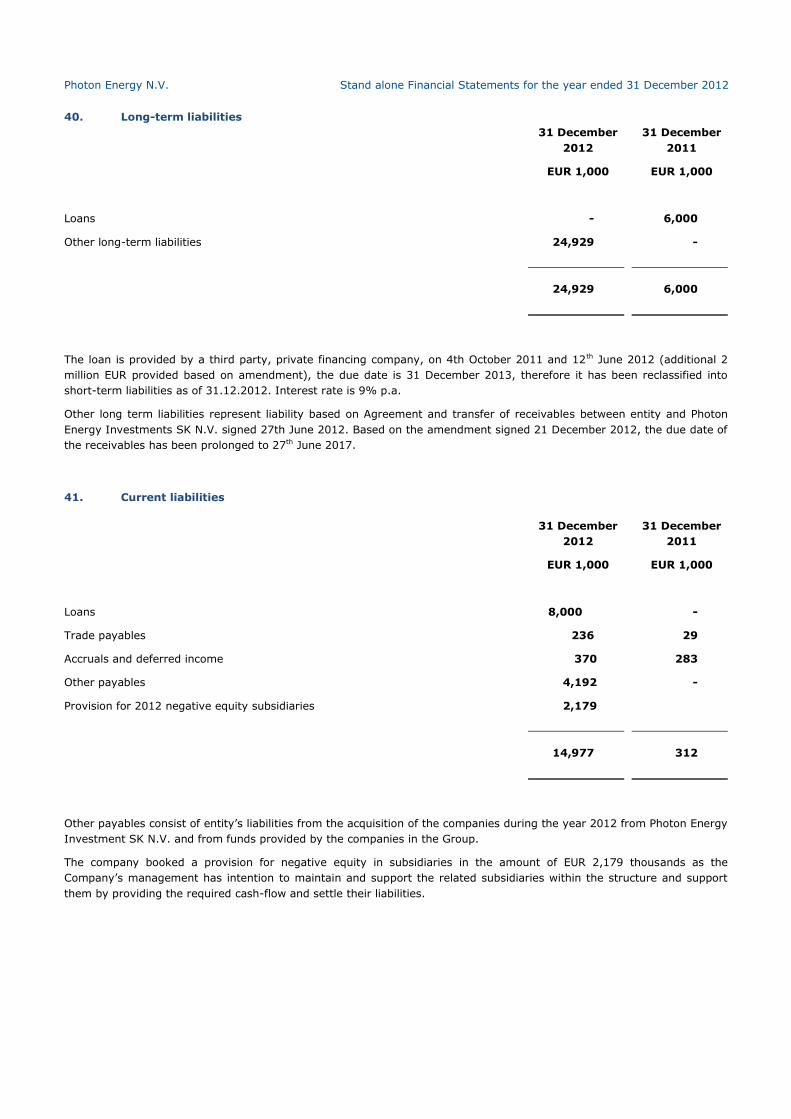
Photon Energy N.V. Stand alone Financial Statements for the year ended 31 December 2012
40. Long-term liabilities
31 December
2012
31 December
2011
EUR 1,000 EUR 1,000
Loans - 6,000
Other long-term liabilities 24,929 -
24,929 6,000
The loan is provided by a third party, private financing company, on 4th October 2011 and 12th June 2012 (additional 2
million EUR provided based on amendment), the due date is 31 December 2013, therefore it has been reclassified into
short-term liabilities as of 31.12.2012. Interest rate is 9% p.a.
Other long term liabilities represent liability based on Agreement and transfer of receivables between entity and Photon
Energy Investments SK N.V. signed 27th June 2012. Based on the amendment signed 21 December 2012, the due date of
the receivables has been prolonged to 27th June 2017.
41. Current liabilities
31 December
2012
31 December
2011
EUR 1,000 EUR 1,000
Loans 8,000 -
Trade payables 236 29
Accruals and deferred income 370 283
Other payables 4,192 -
Provision for 2012 negative equity subsidiaries 2,179
14,977 312
Other payables consist of entity’s liabilities from the acquisition of the companies during the year 2012 from Photon Energy
Investment SK N.V. and from funds provided by the companies in the Group.
The company booked a provision for negative equity in subsidiaries in the amount of EUR 2,179 thousands as the
Company’s management has intention to maintain and support the related subsidiaries within the structure and support
them by providing the required cash-flow and settle their liabilities.
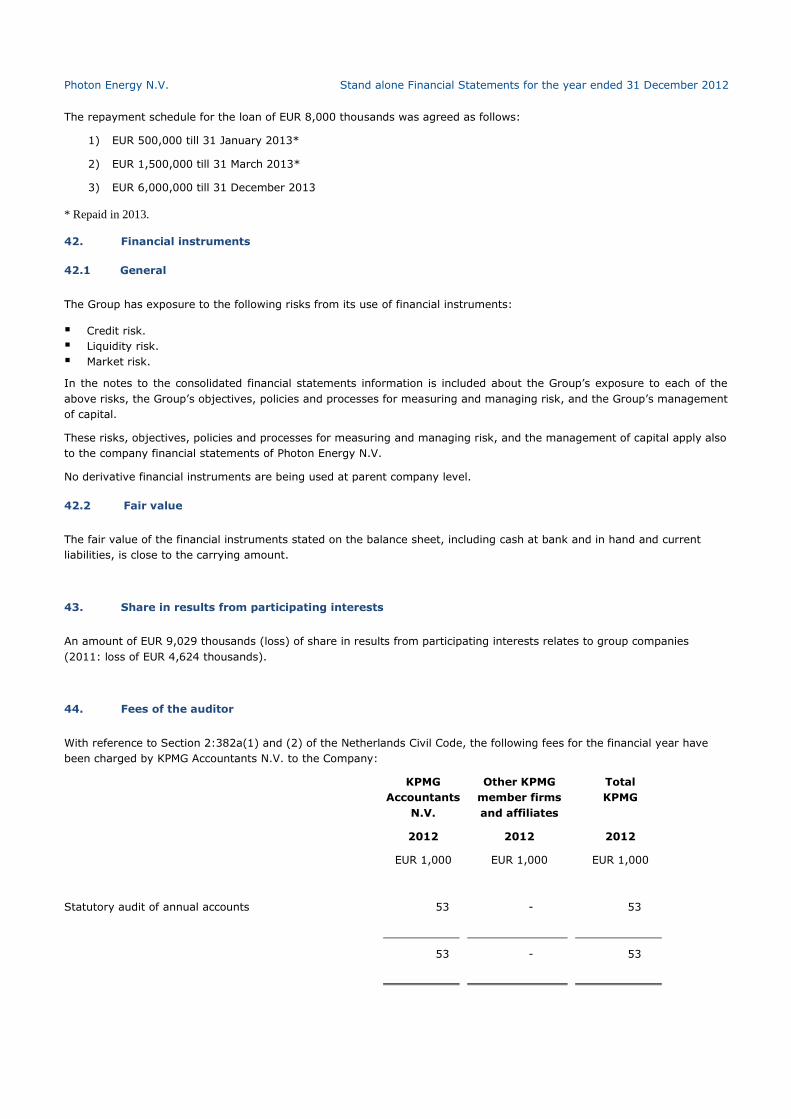
Photon Energy N.V. Stand alone Financial Statements for the year ended 31 December 2012
The repayment schedule for the loan of EUR 8,000 thousands was agreed as follows:
1) EUR 500,000 till 31 January 2013*
2) EUR 1,500,000 till 31 March 2013*
3) EUR 6,000,000 till 31 December 2013
* Repaid in 2013.
42. Financial instruments
42.1 General
The Group has exposure to the following risks from its use of financial instruments:
Credit risk.
Liquidity risk.
Market risk.
In the notes to the consolidated financial statements information is included about the Group’s exposure to each of the
above risks, the Group’s objectives, policies and processes for measuring and managing risk, and the Group’s management
of capital.
These risks, objectives, policies and processes for measuring and managing risk, and the management of capital apply also
to the company financial statements of Photon Energy N.V.
No derivative financial instruments are being used at parent company level.
42.2 Fair value
The fair value of the financial instruments stated on the balance sheet, including cash at bank and in hand and current
liabilities, is close to the carrying amount.
43. Share in results from participating interests
An amount of EUR 9,029 thousands (loss) of share in results from participating interests relates to group companies
(2011: loss of EUR 4,624 thousands).
44. Fees of the auditor
With reference to Section 2:382a(1) and (2) of the Netherlands Civil Code, the following fees for the financial year have
been charged by KPMG Accountants N.V. to the Company:
KPMG
Accountants
N.V.
Other KPMG
member firms
and affiliates
Total
KPMG
2012 2012 2012
EUR 1,000 EUR 1,000 EUR 1,000
Statutory audit of annual accounts 53 - 53
53 - 53
Photon Energy N.V. Stand alone Financial Statements for the year ended 31 December 2012
45. Related parties
45.1 Transactions with key management personnel
45.1.1 Key management personnel compensation
Key management personnel did not obtain any compensation for their activity for PE NV in 2012. However, they obtained
remuneration for their function from Phoenix Energy a.s., refer to Note 29.1 of the Consolidated financial statements.
45.1.2 Key management personnel and director
The directors of the Company control 100% of the voting shares of the Company. The Directors hold positions in other
group entities that result in having control or significant influence over the financial or operating policies of these entities.
45.1.3 Emoluments of directors and supervisory directors
No emoluments, including pension obligations as intended in Section 2:383(1) of the Netherlands Civil Code were charged
in the financial period to the Company. Directors receive the remuneration for their function from Phoenix Energy a.s.,
refer to Note 29.1 of the Consolidated financial statements.
Amsterdam, 17 May 2013 The Board of Directors: ____________________________ ____________________________
Michael Gartner, Director Georg Hotar, Director
Photon Energy N.V. Stand alone Financial Statements for the year ended 31 December 2012
Other information
1. Emoluments of directors and supervisory directors
No emoluments, including pension obligations as intended in Section 2:383(1) of the Netherlands Civil Code were charged
in the financial period to the Company.
2. Provisions in the Articles of Association governing the appropriation of profit
According to article 20 of the company’s Articles of Association, the profit is at the disposal of the General Meeting of
Shareholders, which can allocate the profit wholly or partly to the general or specific reserve funds.
The Company can only make payments to the shareholders and other parties entitled to the distributable profit for the
amount the shareholders’ equity are greater than the paid-up and called-up part of the capital plus the legally required
reserves.
3. Proposal for profit appropriation
The General Meeting of Shareholders will be asked to approve the following appropriation of the 2012 loss: an amount of
EUR 10,799 thousands to be added to the retained earnings.
4. Subsequent events
Please refer to note 31 of the consolidated financial statements.
For Photon Energy N.V. there were no other subsequent events affecting the situation at balance sheet date.
5. Subsidiaries
The Company has subsidiaries in Czech Republic, Slovak Republic, Italy, Germany, Poland and Australia. For the list of all
subsidiaries refer to the Note 30 of the Consolidated financial statements.
6. Independent auditor’s report
The independent auditor’s report is set forth on the next pages.
Photon Energy N.V. Stand alone Financial Statements for the year ended 31 December 2012
Photon Energy N.V. Stand alone Financial Statements for the year ended 31 December 2012
Photon Energy N.V. Stand alone Financial Statements for the year ended 31 December 2012
Photon Energy N.V. | Barbara Strozzilaan 201 | Amsterdam 1083 HN | Netherlands | Corporate number: 51447126 | VAT number: NL850020827B01 | www.photonenergy.com | T + 31.202.402.570


![BNG Bank N.V. reports... · MOODY'S INVESTORS SERVICE FINANCIAL INSTITUTIONS Key indicators Exhibit 2 BNG Bank N.V. (Consolidated Financials) [1] 06-192 12-182 12-172 12-162 12-152](https://img.pdfslide.net/doc/110x75/5fea5799059ba4168954967a/bng-bank-nv-reports-moodys-investors-service-financial-institutions-key.jpg)