Embed Size (px)
Citation preview
APS/123-QED
Photoproduction of neutral kaons on the liquid deuterium target in the thresholdregion
K. Tsukada, T. Takahashi,∗ T. Watanabe,† Y. Fujii, K. Futatsukawa, O. Hashimoto, K. Hirose, K. Ito,S. Kameoka, H. Kanda, K. Maeda, A. Matsumura, Y. Miura, H. Miyase, S. N. Nakamura, H. Nomura,
K. Nonaka, T. Osaka, Y. Okayasu, H. Tamura, H. Tsubota, M. Ukai,† H. Yamauchi, and M. WakamatsuDepartment of Physics, Tohoku University, Sendai 980-8578, Japan
T. Ishikawa, T. Kinoshita, F. Miyahara, T. Nakabayashi, H. Shimizu, T. Tamae, and H. YamazakiLaboratory of Nuclear Science, Tohoku University, Sendai 982-0826, Japan
A. SasakiDepartment of Electrical and Electronic Engineering, Akita University, Akita, 010-8502, Japan
O. KonnoDepartment of Electrical Engineering, Ichinoseki National College of Technology, Ichinoseki, 021-8511, Japan
P. Bydzovsky and M. SotonaNuclear Physics Institute, 25068, Rez, Czech Republic
(Dated: November 19, 2010)
The photoproduction process of neutral kaons on a liquid deuterium target is investigated nearthe threshold region, Eγ = 0.8–1.1 GeV. K0 events are reconstructed from positive and negativepions, and differential cross sections are derived. Experimental momentum spectra are comparedwith those calculated in the spectator model using a realistic deuteron wave function. Elementaryamplitudes as given by recent isobar models and a simple phenomenological model are used tostudy the effect of the new data on the angular behavior of the elementary cross section. The datafavor a backward-peaked angular distribution of the elementary n(γ, K0)Λ process, which providesadditional constraints on current models of kaon photoproduction. The present study demonstratesthat the n(γ, K0)Λ reaction can provide key information on the mechanism of the photoproductionof strangeness.
PACS numbers: 13.60.Le: 25.20.Lj
I. INTRODUCTION
Kaon production on a nucleon or a nucleus by the electromagnetic interaction provides invaluable information onthe strangeness production mechanism, since the electromagnetic interaction is better understood than the hadronicinteraction. Studies using real photon and electron beams were started in the early 1950s. The p(γ,K+)Λ reactionwas studied from the threshold up to 1.4 GeV by measuring the differential cross sections [1–6], total cross sections[7] and Λ polarizations [3, 5]. An experiment using the polarized target was also made [8]. The isobar model for kaonphotoproduction was developed to reproduce the experimental results in the 1960s [9].
Since the 1990s, new experiments have been carried out using advanced detector systems at accelerator facilitieswhich provide higher-quality photon or electron beams. There are six isospin channels of elementary kaon photo-production, p(γ, K+)Λ, p(γ,K+)Σ0, p(γ, K0)Σ+, n(γ, K0)Λ, n(γ, K0)Σ0, and n(γ, K+)Σ−, though kaon productionreactions with proton targets have mainly been investigated to date. The p(γ, K+)Λ reaction has been studied fromthe threshold region up to a photon energy of 2.95 GeV by measuring the differential and total cross sections atELSA/SAPHIR [10], JLab/CLAS [11] and SPring-8/LEPS [12]. Polarization transfer in the p(~γ,K+)~Λ reaction hasbeen also measured at CLAS [13], and the beam polarization asymmetries for the p(~γ, K+)Λ and p(~γ, K+)Σ0 reactionshave been measured at SPring-8/LEPS [12]. To date, several theoretical models have been proposed [14–20]. Althougha wide variety of observables in elementary kaon photoproduction processes has been investigated, no model has suc-cessfully explained them all. Therefore, further experimental and theoretical studies are eagerly awaited, particularly
∗Present address: Insitute of Particle and Nuclear Studies, High Energy Accelerator Organization (KEK), Tsukuba, 305-0801, Japan†Present address: Gifu University, Gifu, 501-1193, Japan
2
in other isospin channels. In particular, the n(γ, K0)Λ reaction is expected to greatly help clarify the strangenessphotoproduction process. This reaction has the following features:
(i) The Born term in the t-channel does not contribute, in contrast to reactions with K+ in the final state, becauseno charge is involved in the reaction.
(ii) The strong coupling constants in the u-channel for Σ0 and other isovector exchanges have the same value butare of opposite sign to those in the p(γ,K+)Λ reaction due to the isospin symmetry.
(iii) The electromagnetic coupling constants of resonances in the s- and t-channels, e.g. gN∗nγ and gK∗K0γ , aredifferent than those in the K+ photoproduction process.
Because of these characteristics, the interference among the diagrams in the K0Λ production process is quite differentfrom that in the K+Λ process. Due to this differences, it was indicated that the angular distribution of the K0Λproduction process shows a backward peak [21]. Therefore, comparison of K0 and K+ photoproduction data, especiallythe angular distribution, is very important for the investigation of the strangeness photoproduction mechanism. Note,that the absence of electric charge in the K0Λ process (the s-channel Born term is gauge-invariant by itself) makesimplementation of hadronic form factors easier than in the K+Λ case. Besides the features mentioned above, theinfluence of the higher mass resonances can be considered to be small in the present experiment, which was carriedout near the threshold, Eγ = 0.8–1.1 GeV.
Prior to the present experiment, the photoproduction of neutral kaons on a carbon target near the threshold energywas measured for the first time at the Laboratory of Nuclear Science (LNS) of Tohoku University [22]. Neutral kaonswere detected via the K0
S → π+π− decay channel using the Neutral Kaon Spectrometer (NKS). The cross sectionswere compared with those for K+ photoproduction [23] as a function of the incident photon energy. It was found thatthe cross sections for K0 and K+ production on 12C are almost of the same magnitude. The momentum spectra ofkaons were also compared with simple model calculations based on recent isobar models for elementary productionprocesses. However, analysis of the elementary reaction was limited because of the uncertainty due to the complexmany-body nature of the process on the carbon target.
As a next step, we carried out measurements of neutral kaons with NKS using a liquid deuterium target and reportthe results in this paper. In Sec. II, the experimental apparatus and methods are described. In Sec. III, event selection,derivation of the K0 momentum distributions, estimation of the background and detection efficiencies are discussed.Section IV presents results for momentum spectra for the deuteron target and their comparison with theoreticalpredictions. The conclusion is given in Sec. V.
II. EXPERIMENTAL APPARATUS
The K0 meson was inclusively measured via the π+π− decay channel using NKS, which was constructed andinstalled in the second experimental hall equipped with the STB-Tagger system [24] at LNS. NKS was originallyused as the TAGX spectrometer at the electron synchrotron of the Institute of Nuclear Study, University of Tokyo(INS-ES) [25]. In this section, the apparatuses of the beam line and the detectors of NKS are described.
A. Tagged-photon beams
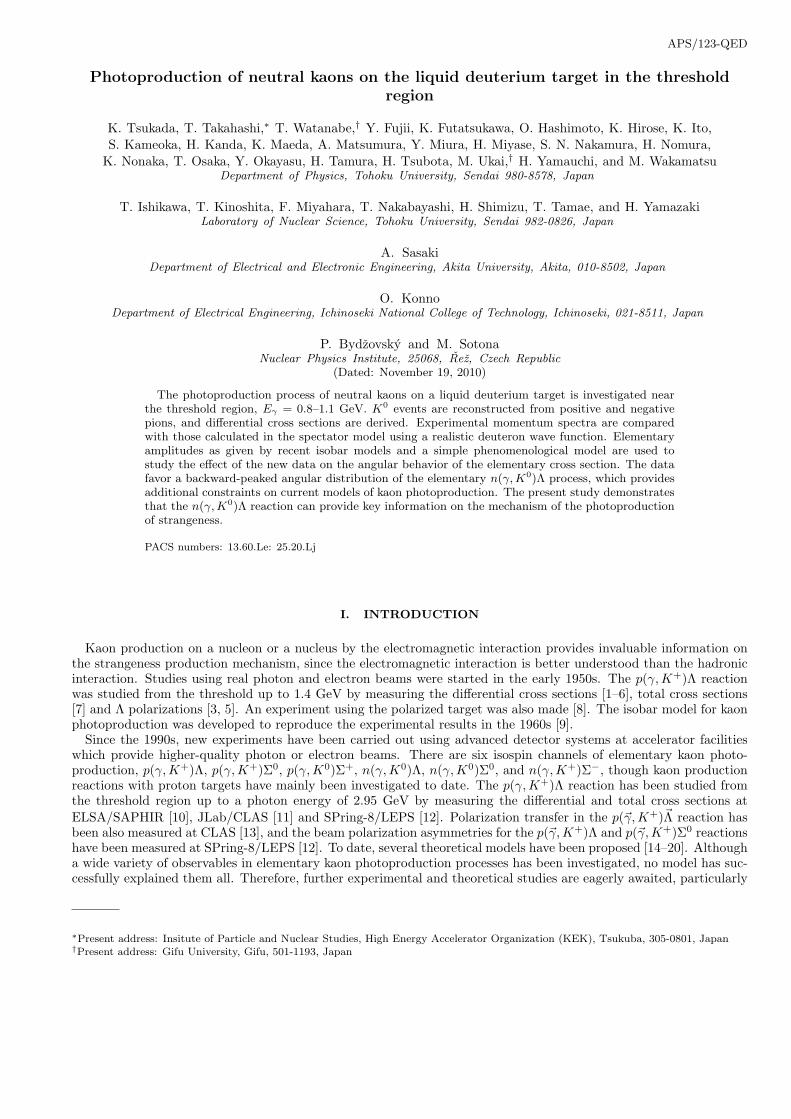
Figure 1 shows the experimental setup. A 200-MeV electron beam from the linear accelerator was injected intothe STretcher Booster (STB) ring, accelerated up to 1.2 GeV typically in 1.2 s, and then stored for 20 s in the ring.Bremsstrahlung photons were generated by inserting a radiator made of a carbon fiber of 11 µm φ at the entranceof one of the bending magnets. The generated photon energy was tagged by analyzing the momentum of a scatteredelectron with the bending magnet [24]. The tagging counter consisted of 50 plastic scintillators, the time resolutionbeing evaluated to be 240 ps. The duty factor was about 64% with an 18 s beam every 25 s.
The tagged energy range was 0.8–1.1 GeV and the accuracy of the energy was estimated to be ∆E = ±10 MeV(see Sect. II A 1). The total count rate of the counter array was 2 MHz on average.
As shown in Fig. 1, a sweep magnet of about 1.0 T and 0.5 m long was located between a extraction window andNKS to suppress the background of the e+ and e− created at the exit window of the photon beam. In addition, a 25cm long lead collimator with a 1.0 cm diameter aperture was placed just upstream of the sweep magnet to removethe photon beam halo. Furthermore, two helium bags were installed in the space between the sweep magnet and thetarget. The windows of the bags along the beam line were made of mylar film of 10 µm thickness. The size of thephoton beam at the target was 3–5 mm (σ).
3
STB-Taggerscintillator array
radiator
Sweepmagnet
circulated electron1.2 GeV
Neutral KaonSpectrometer
(NKS)
photon beam
collimator
0 3m
FIG. 1: Top view of the experimental setup in the second experimental hall at LNS. The electrons were accelerated up to 1.2GeV in the accelerator ring. Bremsstrahlung photons were generated by inserting a radiator. The scattered electrons weredetected by STB-Tagger. A collimator and sweep magnet were set on the photon beam line to remove the beam halo and thebackground from e+e− pair creation.
1. Energy calibration
Energy calibration of the STB-Tagger system was carried out prior to the series of K0 photoproduction experimentswith NKS.
In the calibration experiment, the sweep magnet was used as a spectrometer for e+e− pairs generated in theγ → e+e− conversion process. A copper converter of 0.9 mm φ was installed upstream of the magnet. The e+e− pairswere detected by a drift chamber installed downstream of the magnet. The momenta of e+e− pairs were analyzed usingthe magnetic field distribution calculated by the 3-dimensional finite element method program (TOSCA). Finally, thephoton energy was derived by Eγ = Ee+ + Ee− . The precision of the photon energy was determined to be ± 10 MeVconsidering the uncertainty of the magnetic field distribution.
B. NKS
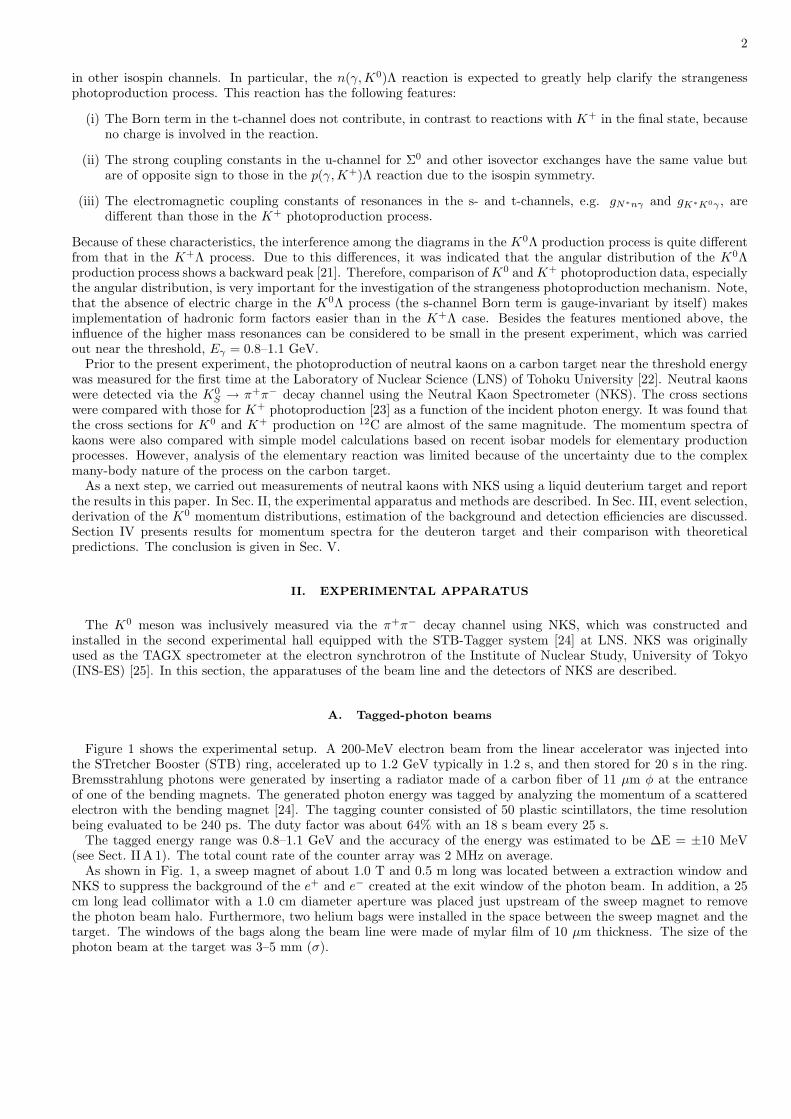
Figure 2 shows a schematic drawing of NKS and Fig. 3 shows the detector configuration. The spectrometer consistedof a 0.5-T dipole magnet of 107 cm diameter and 60 cm gap, with a pair of cylindrical drift chambers (CDC), a pair ofstraw drift chambers (SDC), inner and outer scintillator hodoscopes (IH, OH) and electron veto scintillation counters(EV).
IH surrounded the target 6 cm from the center. It was segmented into twelve pieces of 12 cm height and 0.5 cmthickness, covering the angular range from ±15 to ±160. The scintillation photons were guided from the bottomend of each scintillator to the outside of the magnet gap through bundles of optical fibers about 1.5 m long. The timeresolution of IH was about 470 ps (σ).
SDC covered the angular range from ±10 to ±170, and the radial range from 7.18 to 10.19 cm. SDC had fourlayers of sense wires made of gold plated tungsten of 20 µm φ with straw tubes made of aluminized mylar film 180µm thick. CDC covered the angular range from ±15 to ±165, and the radial range from 13.8 to 48.6 cm. Fieldwires were arranged hexagonally around a sense wire. Since all the wires were vertical, the information of the trackposition was horizontal only. CDC had twelve layers grouped into four groups, each having three layers. In the presentexperiment, nine layers of the twelve were used since the third layer of each group was not active. The CDC sensewires were made of gold plated tungsten of 30 µm φ for the inner two layers and of stainless steel for the third layers.The field wires were made of molybdenum of 100 µm φ. The drift chamber gas was a mixture of argon (50%) andethane (50%). High voltages were applied to the sense wires, typically +3000 V for CDC and +1900 V for SDC. Thespatial resolutions were about 400 µm for CDC and 500 µm for SDC.
OH hodoscopes were installed outside the drift chambers. They were segmented into 34 pieces, the size of each
4
FIG. 2: Schematic drawing of NKS. The drift chambers (CDC, SDC) were set among the poles.
Ma
gn
et
Yok
e
EV
1 m
g beam
EV
OH
OH
IH
SDC
xy
z
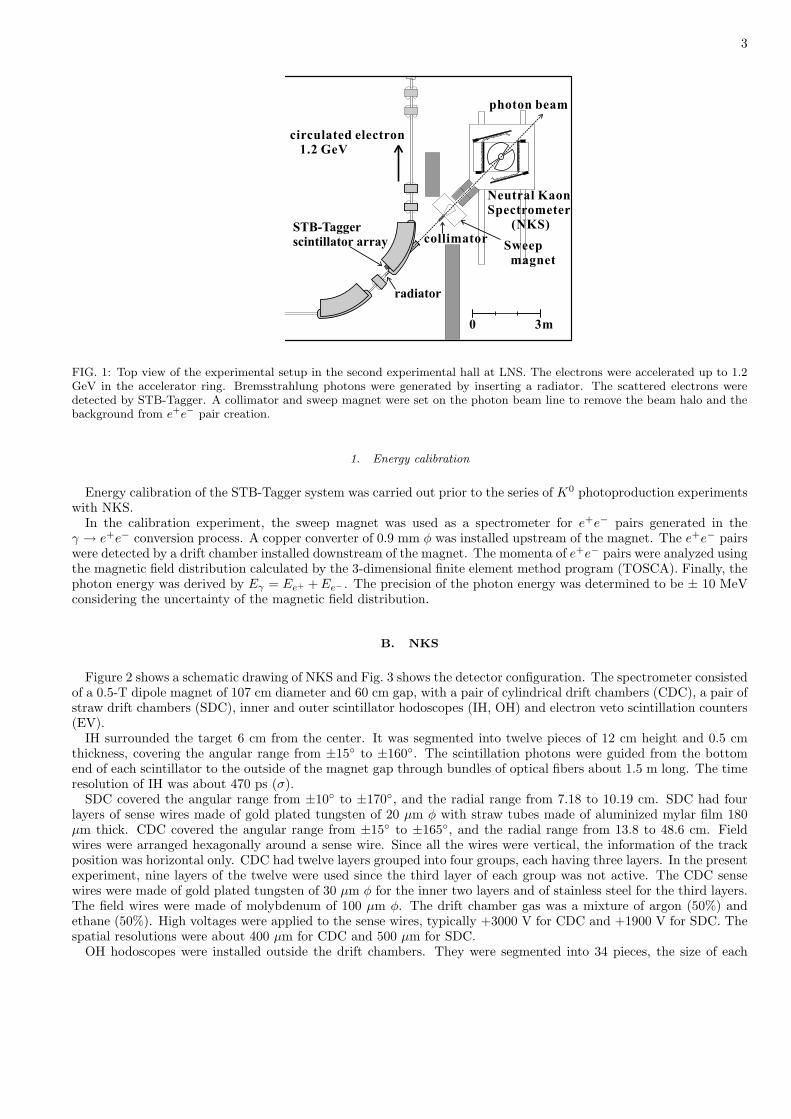
FIG. 3: Floor plan of the detector configuration and an example of two pion trajectories. The detectors were placed almostsymmetrically along the beam line.
counter being about 60 cm in height, 1.0 cm thick and typically 15 cm wide. Some of the scintillators were placedinside the magnet gap as shown in Fig. 3, and the scintillation photons were guided outside the magnet through thebundle of optical fibers. All the OH had photomultiplier tubes (PMT) at both ends and provided information on thetime of flight between IH and OH with a time resolution of 510 ps. The vertical position of charged particles hittingan OH was also given by the time difference of the signals from two PMTs. The vertical position resolution of OHwas about 4 cm.
The geometrical acceptance of NKS was about π sr and the momentum threshold was 80 MeV/c. K0s were identifiedby the invariant mass of π+π− pair measured in coincidence with the left and right detector arms.
EV scintillators were installed on the midplane of NKS and next to the OH array, as shown in Fig. 3, in orderto reject e+e− pairs which were distributed in the midplane and causing large background trigger. They covered avertical range ±2.5 cm at the OH array and therefore the NKS geometrical acceptance was reduced by about 8%.
C. Liquid deuterium target
The liquid deuterium target was inserted through the central holes of the pole and the yoke of the NKS magnetfrom the top of the yoke. The cryostat had a cylindrical part of 1200 mm long with a diameter of 100 mm for theinsertion. The target cell was contained at the lower end of the cryostat. The two stage Gifford-McMahon refrigerator
5
(Sumitomo Heavy Industry RD208B) was attached at the top of the cryostat. An oxigen free copper rod with adiameter of 25 mm and a length of 942 mm connected the second stage and the condenser placed near from the targetcell. The deuterium gas was pre-cooled at the first stage, liquefied at the consenser, and then stored in the cell.
The target cell was cylindrical and placed with its axis parallel to the beam line. The length of the cylinder was30 mm and the diameter was 50 mm. The cylindrical shell was made of aluminum of 1 mm thick and its entranceand exit window were covered with polyimide (Ube UPILEX-S) films of 75 µm thick. The vacuum chamber of thecryostat surrounding the target cell was made of carbon fiber reinforced plastic (CFRP) of 1.5 mm thick. It also hada entrance window of 40 mm for the gamma beam covered with a polyimide film of 75 µm thick. The target cell wasplaced at the 15 mm upstream from the center of NKS. The thickness and the position of the target was optimizedby a simple simulation for the K0 yield.
The typical temperature of the liquid deuterium was 19 ± 1 K; the pressure, 50 ± 2 kPa; and the density, 0.17g/cm3 in the data taking period. The target system was remotely controlled and monitored with a LabView programrunning on a Linux-PC for the easy and secure access via network.
D. Data acquisition system
The data for the hodoscope and tagger counters were fed into the TDC and ADC modules of the TKO which is adata acquisition system developed at KEK [26], then stored in a VME memory module (SMP) and read event by eventby Linux-PC through a VME-PCI interface module (Bit3-617). The signals of the drift chambers were pre-amplifiedand sent to the amplifier–discriminator cards about 7 m away from the chambers. The digitized data were transferredby 70 m twisted pair cables to the counting room and were recorded by the Lecroy 4290 TDC system. These datawere also read by Linux-PC through a CAMAC interface (TOYO CC7700).
A trigger signal was generated when more than two charged particles were detected in coincidence with the IH andOH in both the left and right arms, and at least one hit in the tagger counters. As mentioned before, the EV wasused as a veto in the trigger.
The data-acquisition efficiency was typically 90% with a trigger rate of 100 Hz.
III. ANALYSIS AND RESULTS
K0 was identified and measured by K0 → π+π− decay in the invariant mass of π+π−. π+(π−) was identifiedfrom the momentum, charge and velocity. The horizontal momenta of the charged particles were calculated fromthe curvature of the trajectories, and the vertical momentum information was extracted assuming that a verticalprojection was a straight line between the spectrometer center and the OH. The particle velocities were obtained fromthe flight length and the time-of-flight between the IH and OH.
A. Event selections
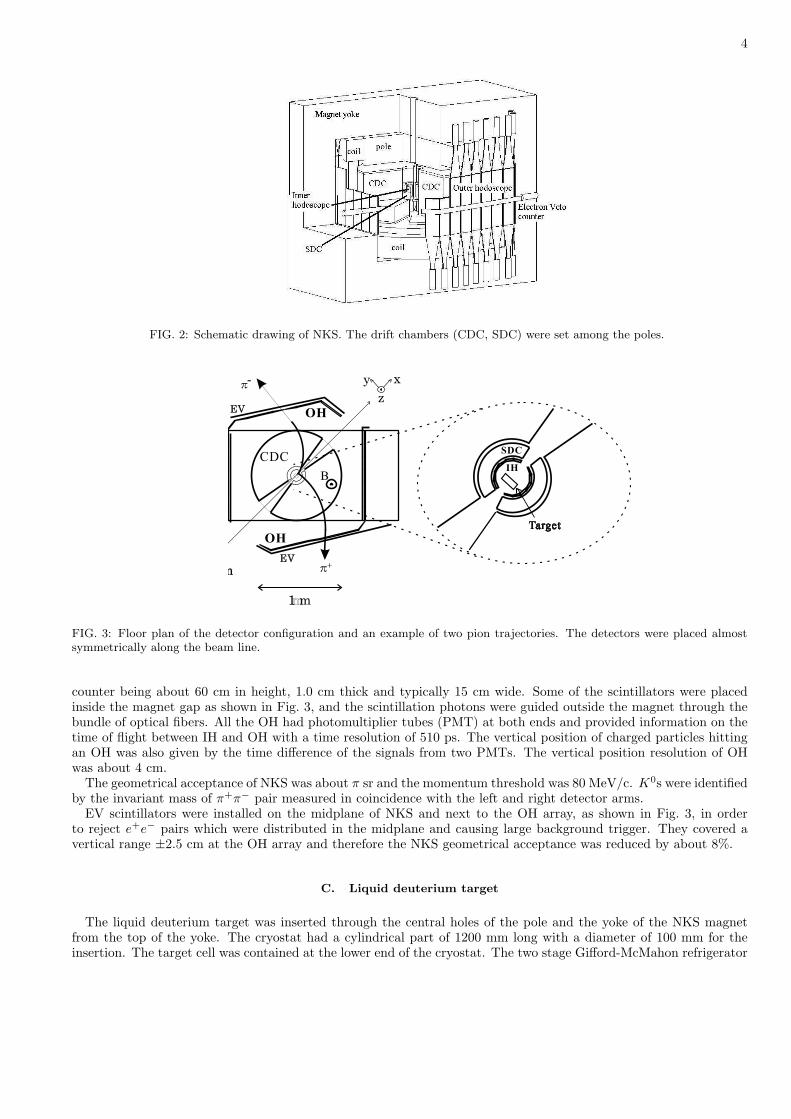
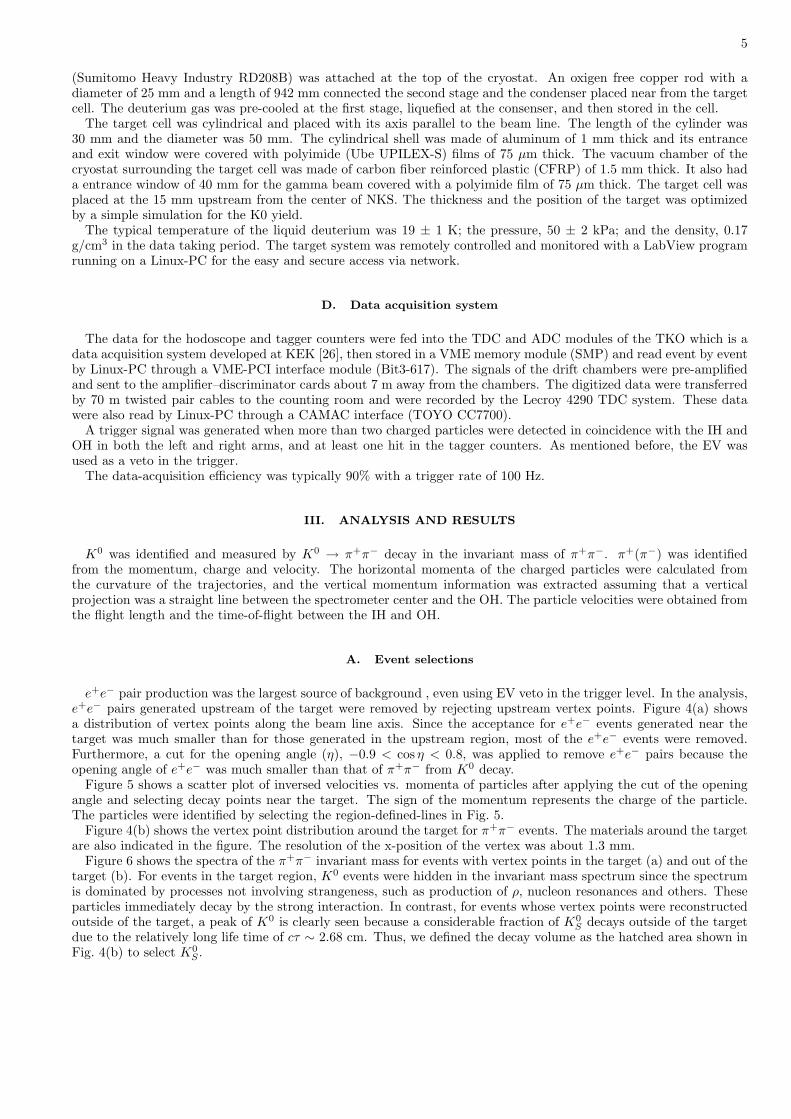
e+e− pair production was the largest source of background , even using EV veto in the trigger level. In the analysis,e+e− pairs generated upstream of the target were removed by rejecting upstream vertex points. Figure 4(a) showsa distribution of vertex points along the beam line axis. Since the acceptance for e+e− events generated near thetarget was much smaller than for those generated in the upstream region, most of the e+e− events were removed.Furthermore, a cut for the opening angle (η), −0.9 < cos η < 0.8, was applied to remove e+e− pairs because theopening angle of e+e− was much smaller than that of π+π− from K0 decay.
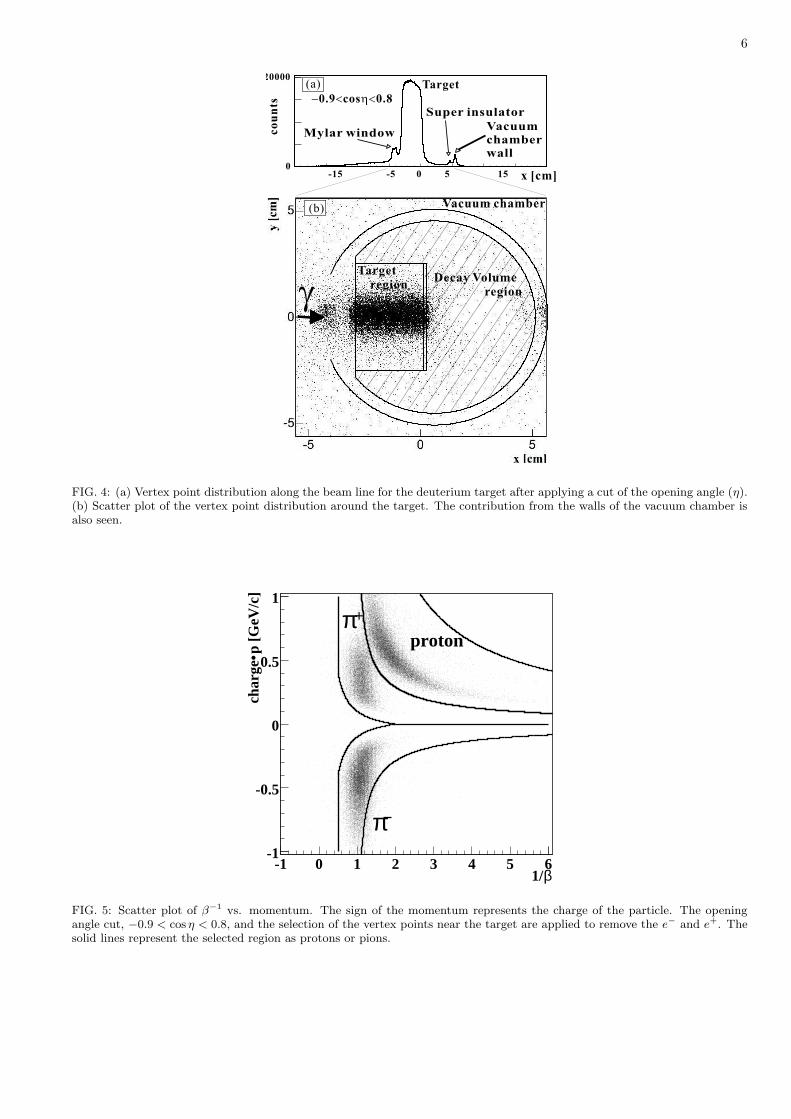
Figure 5 shows a scatter plot of inversed velocities vs. momenta of particles after applying the cut of the openingangle and selecting decay points near the target. The sign of the momentum represents the charge of the particle.The particles were identified by selecting the region-defined-lines in Fig. 5.
Figure 4(b) shows the vertex point distribution around the target for π+π− events. The materials around the targetare also indicated in the figure. The resolution of the x-position of the vertex was about 1.3 mm.
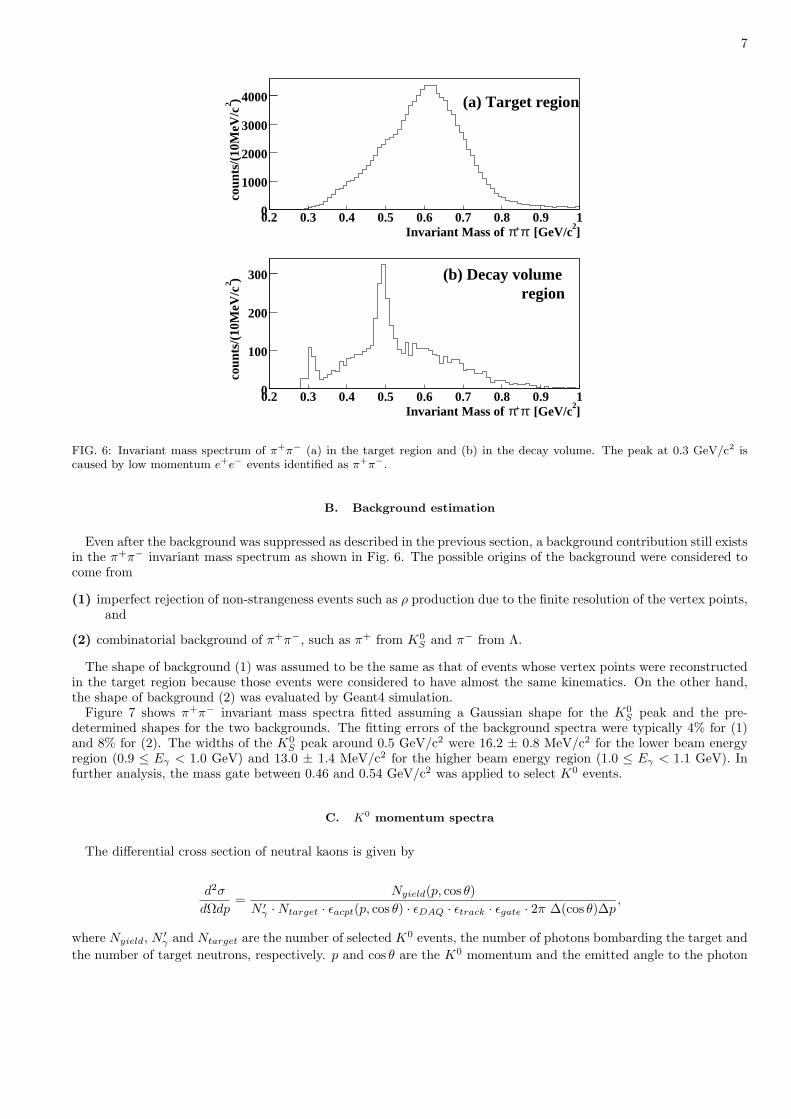
Figure 6 shows the spectra of the π+π− invariant mass for events with vertex points in the target (a) and out of thetarget (b). For events in the target region, K0 events were hidden in the invariant mass spectrum since the spectrumis dominated by processes not involving strangeness, such as production of ρ, nucleon resonances and others. Theseparticles immediately decay by the strong interaction. In contrast, for events whose vertex points were reconstructedoutside of the target, a peak of K0 is clearly seen because a considerable fraction of K0
S decays outside of the targetdue to the relatively long life time of cτ ∼ 2.68 cm. Thus, we defined the decay volume as the hatched area shown inFig. 4(b) to select K0
S .
6
-15 -5 0 5 150
20000
Vacuumchamberwall
Mylar window
Super insulator- < h<0.9 cos 0.8
(a)
x [cm]
co
un
ts
Target
Targetregion
Vacuum chamber(b)
gDecay Volume
region
FIG. 4: (a) Vertex point distribution along the beam line for the deuterium target after applying a cut of the opening angle (η).(b) Scatter plot of the vertex point distribution around the target. The contribution from the walls of the vacuum chamber isalso seen.
β1/-1 0 1 2 3 4 5 6
p [G
eV/c
]•
char
ge
-1
-0.5
0
0.5
1
proton+π
π
FIG. 5: Scatter plot of β−1 vs. momentum. The sign of the momentum represents the charge of the particle. The openingangle cut, −0.9 < cos η < 0.8, and the selection of the vertex points near the target are applied to remove the e− and e+. Thesolid lines represent the selected region as protons or pions.
7
]2
[GeV/c-π+πInvariant Mass of 0.2 0.3 0.4 0.5 0.6 0.7 0.8 0.9 1
)
2
coun
ts/(
10M
eV/c
0
1000
2000
3000
4000 (a) Target region
]2
[GeV/c-π+πInvariant Mass of 0.2 0.3 0.4 0.5 0.6 0.7 0.8 0.9 1
)
2
coun
ts/(
10M
eV/c
0
100
200
300 (b) Decay volumeregion
FIG. 6: Invariant mass spectrum of π+π− (a) in the target region and (b) in the decay volume. The peak at 0.3 GeV/c2 iscaused by low momentum e+e− events identified as π+π−.
B. Background estimation
Even after the background was suppressed as described in the previous section, a background contribution still existsin the π+π− invariant mass spectrum as shown in Fig. 6. The possible origins of the background were considered tocome from
(1) imperfect rejection of non-strangeness events such as ρ production due to the finite resolution of the vertex points,and
(2) combinatorial background of π+π−, such as π+ from K0S and π− from Λ.
The shape of background (1) was assumed to be the same as that of events whose vertex points were reconstructedin the target region because those events were considered to have almost the same kinematics. On the other hand,the shape of background (2) was evaluated by Geant4 simulation.
Figure 7 shows π+π− invariant mass spectra fitted assuming a Gaussian shape for the K0S peak and the pre-
determined shapes for the two backgrounds. The fitting errors of the background spectra were typically 4% for (1)and 8% for (2). The widths of the K0
S peak around 0.5 GeV/c2 were 16.2 ± 0.8 MeV/c2 for the lower beam energyregion (0.9 ≤ Eγ < 1.0 GeV) and 13.0 ± 1.4 MeV/c2 for the higher beam energy region (1.0 ≤ Eγ < 1.1 GeV). Infurther analysis, the mass gate between 0.46 and 0.54 GeV/c2 was applied to select K0 events.
C. K0 momentum spectra
The differential cross section of neutral kaons is given by
d2σ
dΩdp=
Nyield(p, cos θ)N ′
γ ·Ntarget · εacpt(p, cos θ) · εDAQ · εtrack · εgate · 2π ∆(cos θ)∆p,
where Nyield, N ′γ and Ntarget are the number of selected K0 events, the number of photons bombarding the target and
the number of target neutrons, respectively. p and cos θ are the K0 momentum and the emitted angle to the photon
8
]2Invariant Mass [GeV/c0.2 0.3 0.4 0.5 0.6 0.7 0.8 0.9 1
)
2
coun
ts/(
10M
eV/c
0
20
40
60
80
100
120
140
160
180
(a) <1.0 GeVγE≤0.9
AllGauss functionCombinatorial backgroundBackground from target
]2Invariant Mass [GeV/c0.2 0.3 0.4 0.5 0.6 0.7 0.8 0.9 1
)
2
coun
ts/(
10M
eV/c
0
20
40
60
80
100
120
140(b) 1.1 GeV≤γE≤1.0
All
Gauss function
Combinatorial background
Background from target
FIG. 7: Fitting results for π+π− invariant mass spectra in the photon energy ranges (a) from 0.9 to 1.0 GeV and (b) from1.0 to 1.1 GeV. The contribution around 0.4 GeV/c2 comes from the combinatorial background and that around 0.6 GeV/c2
comes from other process produced in the target region.
[GeV/c] K0p
0 0.2 0.4 0.6 0.8 1θ
cos0.50.60.70.80.91
]-1
0.02
GeV
/c)
•ac
cep
tan
ce[(
0.02 0
0.01
(a)
[GeV/c]K0p0 0.2 0.4 0.6 0.8 1
θ
cos
0.5
0.6
0.7
0.8
0.9
1
Selected region
0.1%
0.2%
(b)
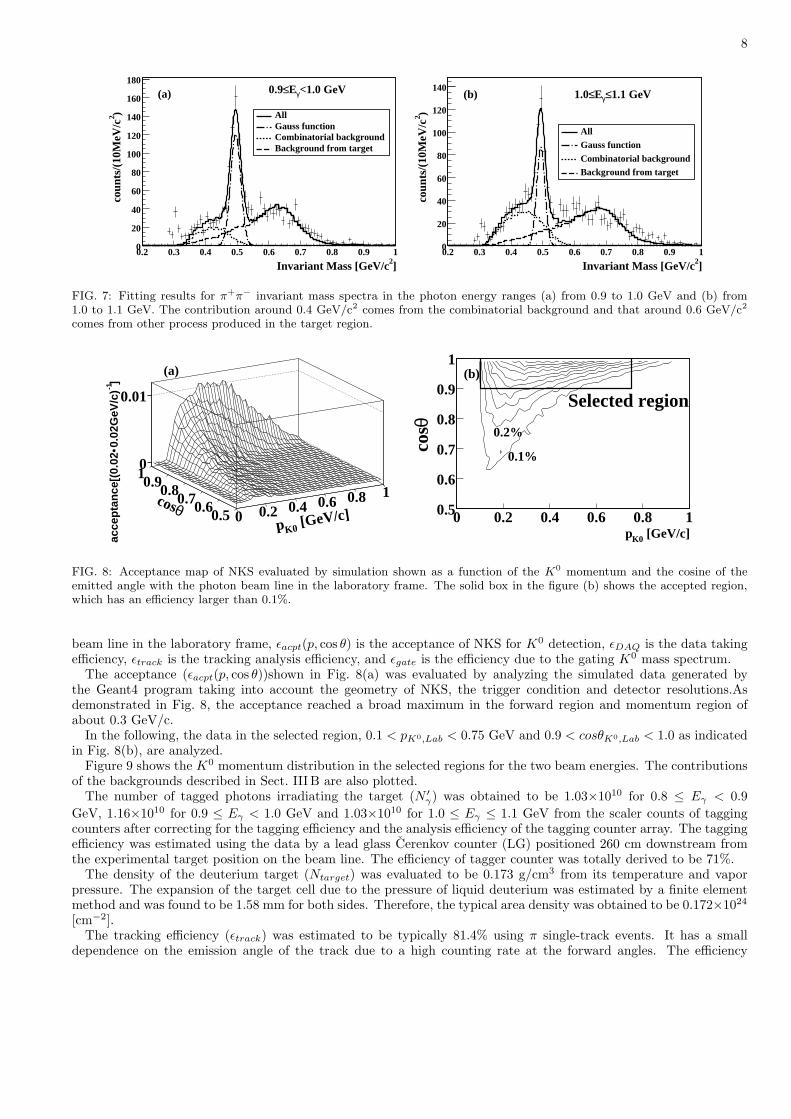
FIG. 8: Acceptance map of NKS evaluated by simulation shown as a function of the K0 momentum and the cosine of theemitted angle with the photon beam line in the laboratory frame. The solid box in the figure (b) shows the accepted region,which has an efficiency larger than 0.1%.
beam line in the laboratory frame, εacpt(p, cos θ) is the acceptance of NKS for K0 detection, εDAQ is the data takingefficiency, εtrack is the tracking analysis efficiency, and εgate is the efficiency due to the gating K0 mass spectrum.
The acceptance (εacpt(p, cos θ))shown in Fig. 8(a) was evaluated by analyzing the simulated data generated bythe Geant4 program taking into account the geometry of NKS, the trigger condition and detector resolutions.Asdemonstrated in Fig. 8, the acceptance reached a broad maximum in the forward region and momentum region ofabout 0.3 GeV/c.
In the following, the data in the selected region, 0.1 < pK0,Lab < 0.75 GeV and 0.9 < cosθK0,Lab < 1.0 as indicatedin Fig. 8(b), are analyzed.
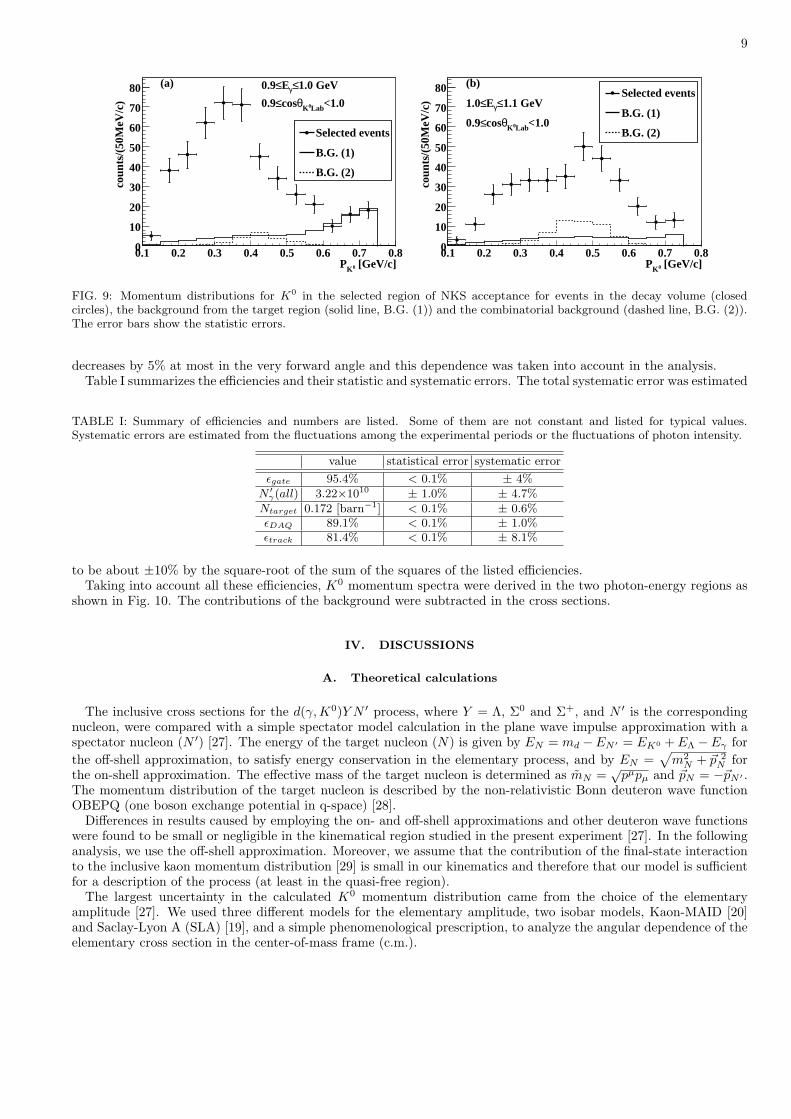
Figure 9 shows the K0 momentum distribution in the selected regions for the two beam energies. The contributionsof the backgrounds described in Sect. III B are also plotted.
The number of tagged photons irradiating the target (N ′γ) was obtained to be 1.03×10¹⁰ for 0.8 ≤ Eγ < 0.9
GeV, 1.16×10¹⁰ for 0.9 ≤ Eγ < 1.0 GeV and 1.03×10¹⁰ for 1.0 ≤ Eγ ≤ 1.1 GeV from the scaler counts of taggingcounters after correcting for the tagging efficiency and the analysis efficiency of the tagging counter array. The taggingefficiency was estimated using the data by a lead glass Cerenkov counter (LG) positioned 260 cm downstream fromthe experimental target position on the beam line. The efficiency of tagger counter was totally derived to be 71%.
The density of the deuterium target (Ntarget) was evaluated to be 0.173 g/cm3 from its temperature and vaporpressure. The expansion of the target cell due to the pressure of liquid deuterium was estimated by a finite elementmethod and was found to be 1.58 mm for both sides. Therefore, the typical area density was obtained to be 0.172×1024
[cm−2].The tracking efficiency (εtrack) was estimated to be typically 81.4% using π single-track events. It has a small
dependence on the emission angle of the track due to a high counting rate at the forward angles. The efficiency
9
[GeV/c]0KP0.1 0.2 0.3 0.4 0.5 0.6 0.7 0.8
coun
ts/(
50M
eV/c
)
0
10
20
30
40
50
60
70
80 (a) 1.0 GeV≤γE≤0.9
<1.0Lab0Kθcos≤0.9
Selected events
B.G. (1)
B.G. (2)
[GeV/c]0KP0.1 0.2 0.3 0.4 0.5 0.6 0.7 0.8
coun
ts/(
50M
eV/c
)
0
10
20
30
40
50
60
70
80 (b)
1.1 GeV≤γE≤1.0
<1.0Lab0Kθcos≤0.9
Selected events
B.G. (1)
B.G. (2)
FIG. 9: Momentum distributions for K0 in the selected region of NKS acceptance for events in the decay volume (closedcircles), the background from the target region (solid line, B.G. (1)) and the combinatorial background (dashed line, B.G. (2)).The error bars show the statistic errors.
decreases by 5% at most in the very forward angle and this dependence was taken into account in the analysis.Table I summarizes the efficiencies and their statistic and systematic errors. The total systematic error was estimated
TABLE I: Summary of efficiencies and numbers are listed. Some of them are not constant and listed for typical values.Systematic errors are estimated from the fluctuations among the experimental periods or the fluctuations of photon intensity.
value statistical error systematic error
εgate 95.4% < 0.1% ± 4%
N ′γ(all) 3.22×10¹⁰ ± 1.0% ± 4.7%
Ntarget 0.172 [barn−1] < 0.1% ± 0.6%εDAQ 89.1% < 0.1% ± 1.0%εtrack 81.4% < 0.1% ± 8.1%
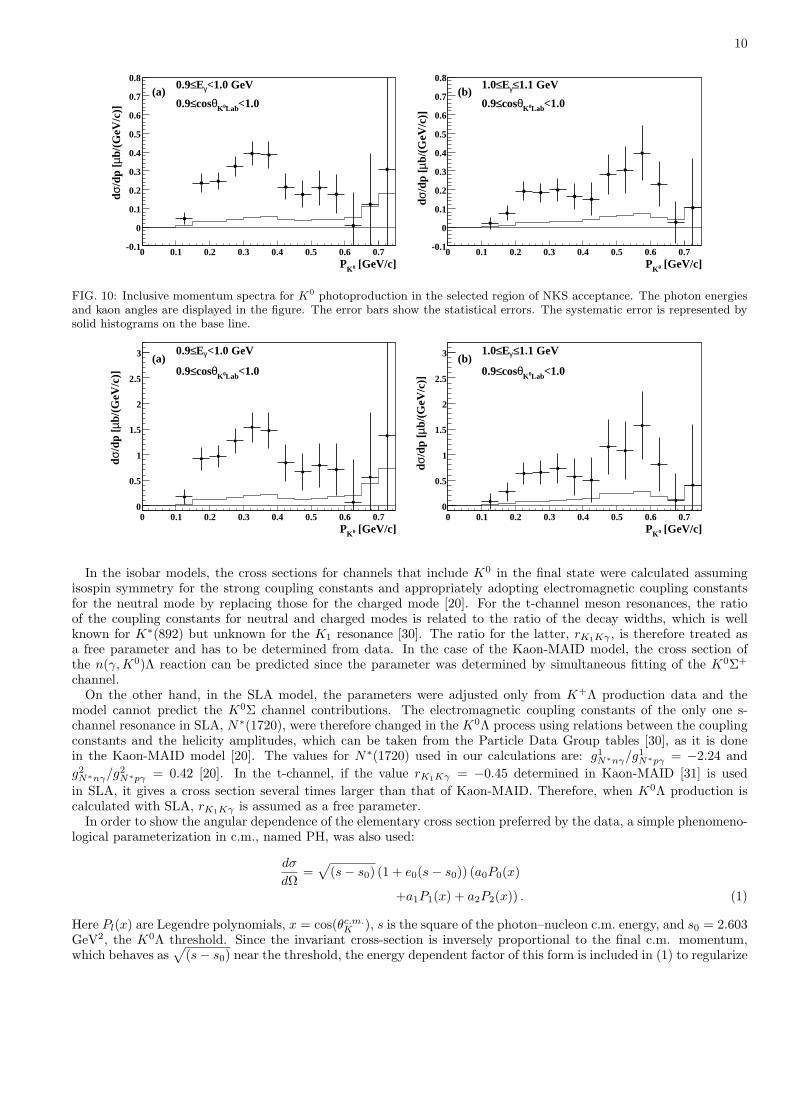
to be about ±10% by the square-root of the sum of the squares of the listed efficiencies.Taking into account all these efficiencies, K0 momentum spectra were derived in the two photon-energy regions as
shown in Fig. 10. The contributions of the background were subtracted in the cross sections.
IV. DISCUSSIONS
A. Theoretical calculations
The inclusive cross sections for the d(γ,K0)Y N ′ process, where Y = Λ, Σ0 and Σ+, and N ′ is the correspondingnucleon, were compared with a simple spectator model calculation in the plane wave impulse approximation with aspectator nucleon (N ′) [27]. The energy of the target nucleon (N) is given by EN = md −EN ′ = EK0 + EΛ −Eγ forthe off-shell approximation, to satisfy energy conservation in the elementary process, and by EN =
√m2
N + ~p 2N for
the on-shell approximation. The effective mass of the target nucleon is determined as mN =√
pµpµ and ~pN = −~pN ′ .The momentum distribution of the target nucleon is described by the non-relativistic Bonn deuteron wave functionOBEPQ (one boson exchange potential in q-space) [28].
Differences in results caused by employing the on- and off-shell approximations and other deuteron wave functionswere found to be small or negligible in the kinematical region studied in the present experiment [27]. In the followinganalysis, we use the off-shell approximation. Moreover, we assume that the contribution of the final-state interactionto the inclusive kaon momentum distribution [29] is small in our kinematics and therefore that our model is sufficientfor a description of the process (at least in the quasi-free region).
The largest uncertainty in the calculated K0 momentum distribution came from the choice of the elementaryamplitude [27]. We used three different models for the elementary amplitude, two isobar models, Kaon-MAID [20]and Saclay-Lyon A (SLA) [19], and a simple phenomenological prescription, to analyze the angular dependence of theelementary cross section in the center-of-mass frame (c.m.).
10
[GeV/c]0KP0 0.1 0.2 0.3 0.4 0.5 0.6 0.7
b/(G
eV/c
)]
µ
/dp
[σd
-0.1
0
0.1
0.2
0.3
0.4
0.5
0.6
0.7
0.8<1.0 GeVγE≤0.9
<1.0Lab0Kθcos≤0.9(a)
[GeV/c]0KP0 0.1 0.2 0.3 0.4 0.5 0.6 0.7
b/(G
eV/c
)]
µ/d
p [
σd
-0.1
0
0.1
0.2
0.3
0.4
0.5
0.6
0.7
0.81.1 GeV≤γE≤1.0
<1.0Lab0Kθcos≤0.9(b)
FIG. 10: Inclusive momentum spectra for K0 photoproduction in the selected region of NKS acceptance. The photon energiesand kaon angles are displayed in the figure. The error bars show the statistical errors. The systematic error is represented bysolid histograms on the base line.
[GeV/c]0KP0 0.1 0.2 0.3 0.4 0.5 0.6 0.7
b/(G
eV/c
)]
µ
/dp
[σd
0
0.5
1
1.5
2
2.5
3 <1.0 GeVγE≤0.9
<1.0Lab0Kθcos≤0.9(a)
[GeV/c]0KP0 0.1 0.2 0.3 0.4 0.5 0.6 0.7
b/(G
eV/c
)]
µ/d
p [
σd
0
0.5
1
1.5
2
2.5
3 1.1 GeV≤γE≤1.0
<1.0Lab0Kθcos≤0.9(b)
In the isobar models, the cross sections for channels that include K0 in the final state were calculated assumingisospin symmetry for the strong coupling constants and appropriately adopting electromagnetic coupling constantsfor the neutral mode by replacing those for the charged mode [20]. For the t-channel meson resonances, the ratioof the coupling constants for neutral and charged modes is related to the ratio of the decay widths, which is wellknown for K∗(892) but unknown for the K1 resonance [30]. The ratio for the latter, rK1Kγ , is therefore treated asa free parameter and has to be determined from data. In the case of the Kaon-MAID model, the cross section ofthe n(γ, K0)Λ reaction can be predicted since the parameter was determined by simultaneous fitting of the K0Σ+
channel.On the other hand, in the SLA model, the parameters were adjusted only from K+Λ production data and the
model cannot predict the K0Σ channel contributions. The electromagnetic coupling constants of the only one s-channel resonance in SLA, N∗(1720), were therefore changed in the K0Λ process using relations between the couplingconstants and the helicity amplitudes, which can be taken from the Particle Data Group tables [30], as it is donein the Kaon-MAID model [20]. The values for N∗(1720) used in our calculations are: g1
N∗nγ/g1N∗pγ = −2.24 and
g2N∗nγ/g2
N∗pγ = 0.42 [20]. In the t-channel, if the value rK1Kγ = −0.45 determined in Kaon-MAID [31] is usedin SLA, it gives a cross section several times larger than that of Kaon-MAID. Therefore, when K0Λ production iscalculated with SLA, rK1Kγ is assumed as a free parameter.
In order to show the angular dependence of the elementary cross section preferred by the data, a simple phenomeno-logical parameterization in c.m., named PH, was also used:
dσ
dΩ=
√(s− s0) (1 + e0(s− s0)) (a0P0(x)
+a1P1(x) + a2P2(x)) . (1)
Here Pl(x) are Legendre polynomials, x = cos(θc.m.K ), s is the square of the photon–nucleon c.m. energy, and s0 = 2.603
GeV2, the K0Λ threshold. Since the invariant cross-section is inversely proportional to the final c.m. momentum,which behaves as
√(s− s0) near the threshold, the energy dependent factor of this form is included in (1) to regularize
11
the invariant cross section.
B. Comparison of data with calculations
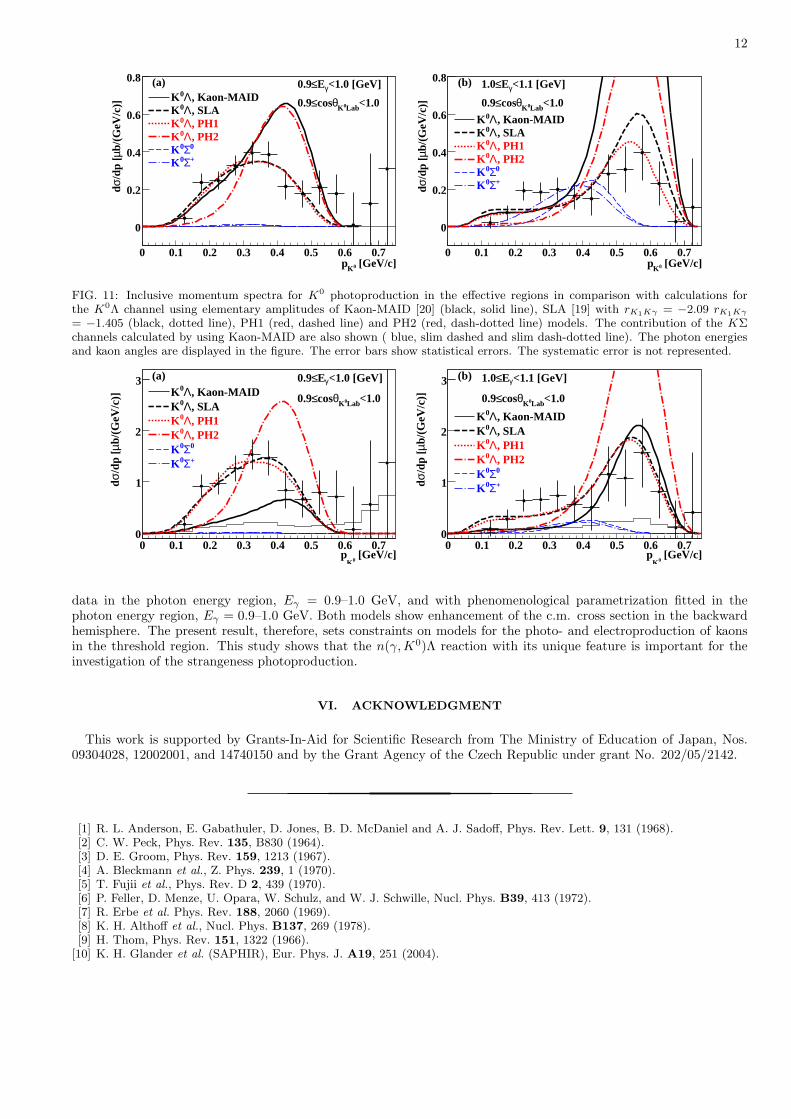
The measured inclusive spectra of the K0Y channels are shown in Fig. 11 together with theoretical curves. Con-tributions of the Σ photoproduction processes calculated with Kaon-MAID are also shown. These contributions areestimated to be at the very most 5% in the lower photon-energy region but up to 60% at the K0 momentum of 0.3GeV/c in the higher photon-energy region. Therefore, the rK1Kγ parameter of SLA was deduced from the data onlyin the lower photon-energy region where the contribution of the Σ channels is sufficiently small. The enhancement ofthe data points around 0.3 GeV/c seen in the higher photon-energy region can be attributed to Σ photoproduction,which however cannot be evaluated with SLA.
In both energy regions, it is found that Kaon-MAID gives cross sections larger than the present measured spectraand the shape of the calculated momentum spectra are considerably different from that of the data.
In both energy regions, it is found that Kaon-MAID gives cross sections smaller than the present measured spectrain the momentum region of PK0 < 0.4 GeV/c and the shape of the calculated momentum spectra are considerablydifferent from that of the data.
The theoretical spectrum with SLA was fitted with the rK1Kγ parameter in the lower photon-energy region. Themagnitude and shape of the momentum spectrum are reproduced well for rK1Kγ = −2.087 rK1Kγ = −1, 405. Notethat this value is related to the ratio of the decay width of the K1 meson, ΓK0
1→K0γ/ΓK+1 →K+γ = r2
K1Kγ = 4.36. Themagnitude of the cross section in the higher energy region is reproduced better by SLA than Kaon-MAID.
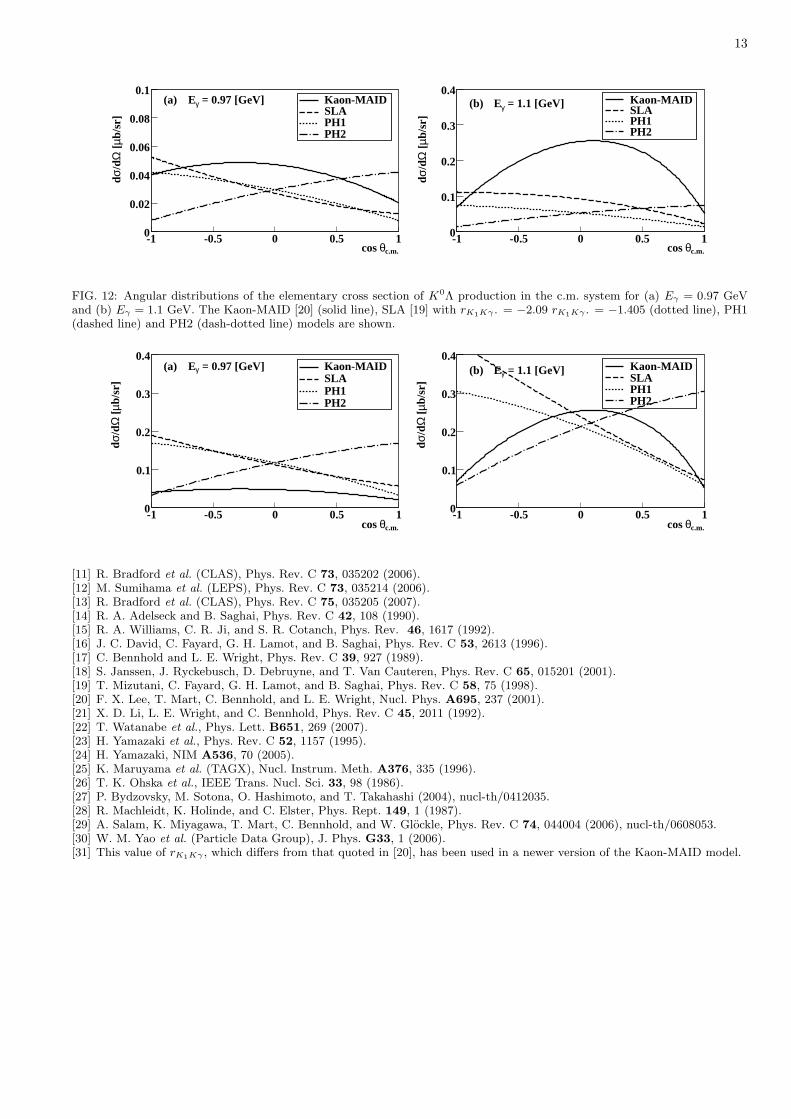
The difference of the shape of the momentum spectra in the laboratory system between Kaon-MAID and SLA inthe lower photon-energy region is caused by the different angular distribution of the elementary cross sections in thec.m. system, as shown in Fig. 12. The data, therefore, suggest that an enhancement of the elementary cross section inthe backward hemisphere is crucial to explain the K0 momentum spectrum shape. On the other hand, in the higherphoton-energy region, the difference of the momentum spectra is due not only to the angular distribution but also tothe magnitude of the cross section, as seen in Fig. 12(b).
To confirm these points, the spectrum in the lower photon-energy region were fitted by Eq. 1, in which the angulardistribution is given by Legendre polynomials up to second order. The best fit parameters (PH1) were obtained:a0 = 0.0884, a1 = −0.0535, a2 = −0.0098 and e0 = −0.132 with χ2/n.d.f. = 1.19. a0 = 0.3532, a1 = −0.2152,a2 = −0.0359 and e0 = −0.0866 with χ2/n.d.f. = 0.80. The phenomenological parametrization with the opposite signof a1 (PH2), giving the inverse angular distribution to that of PH1 is also shown in Fig. 11 and 12. In Fig. 11, it isshown that PH1, having a backward angular distribution in c.m. similar to that of SLA, gives a very good agreementwith the present data in both photon-energy regions. On the other hand, PH2, giving a momentum spectrum similarto that of Kaon-MAID and a forward peaked angular distribution in contrast to PH1, clearly contradicts the presentresult. Thus, a comparison of the data and predictions of models favors an angular distribution of the n(γ, K0)Λreaction in the c.m. system that is peaked at backward angles.
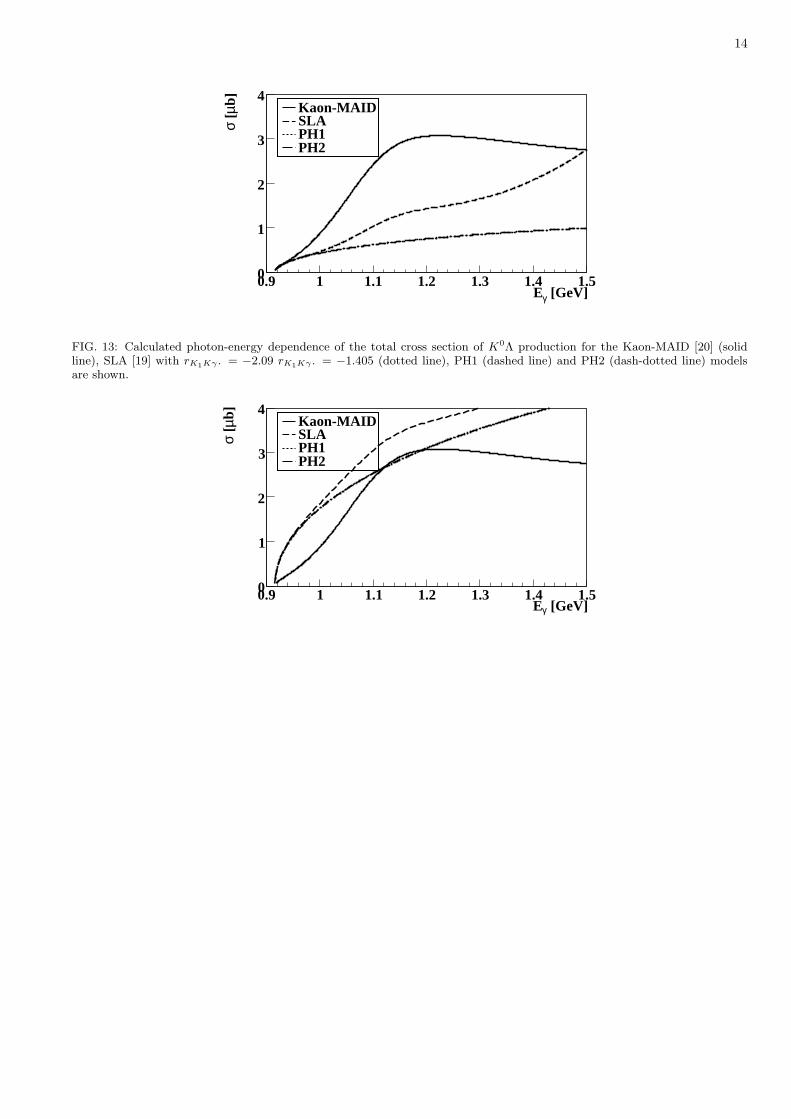
In Fig. 13, the photon energy dependence of the total cross section for K0Λ photoproduction is given for SLA withrK1Kγ = −2.087 rK1Kγ = −1.405, Kaon-MAID and the PH1 and PH2 parameterizations. The K0 total cross sectionsare not obtained in the present experiment due to the limited kinematical acceptance for K0. Kaon-MAID predictsa very sharp rise in the photon-energy dependence of the K0 total cross section near the threshold (Eγ < 1.2 GeV),while SLA, as well as PH1 and PH2, gives a flatter energy dependence and much smaller cross section in the thresholdregion. SLA and PH predicts a very sharp rise in the photon-energy dependence of the K0 total cross section nearthe threshold (Eγ < 1.1 GeV), while Kaon-MAID gives a flatter energy dependence and much smaller cross sectionin the threshold region.
V. SUMMARY
K0 photoproduction on a deuterium target was studied in the threshold region for the first time. The experimentwas conducted at LNS of Tohoku University following the measurement of quasi-free photoproduction of K0 on acarbon target.
Inclusive momentum distributions were obtained and compared with theoretical calculations. The calculations wereperformed in the plane wave impulse approximation using a realistic Bonn wave function OBEPQ for a deuteron,firstly with the recent isobar models, Kaon-MAID and Saclay-Lyon A, and secondly with simple phenomenologicalparameterization. Based on the comparison, the angular distributions of the elementary cross sections were examined.
The best agreement with the data was achieved with the SLA model, in which the ratio of the neutral-to-chargedelectromagnetic coupling constants for the K1 meson was obtained to be rK1Kγ = −2.09 rK1Kγ = −1.405 by fitting
12
[GeV/c]0Kp0 0.1 0.2 0.3 0.4 0.5 0.6 0.7
b/(G
eV/c
)]
µ/d
p [
σd
0
0.2
0.4
0.6
0.8 <1.0 [GeV]γE≤0.9
<1.0Lab0Kθcos≤0.9
(a), Kaon-MAIDΛ0K, SLAΛ0K, PH1Λ0K, PH2Λ0K0Σ0K+Σ0K
[GeV/c]0Kp0 0.1 0.2 0.3 0.4 0.5 0.6 0.7
b/(G
eV/c
)]
µ/d
p [
σd
0
0.2
0.4
0.6
0.8 <1.1 [GeV]γE≤1.0
<1.0Lab0Kθcos≤0.9
(b)
, Kaon-MAIDΛ0K, SLAΛ0K, PH1Λ0K, PH2Λ0K0Σ0K+Σ0K
FIG. 11: Inclusive momentum spectra for K0 photoproduction in the effective regions in comparison with calculations forthe K0Λ channel using elementary amplitudes of Kaon-MAID [20] (black, solid line), SLA [19] with rK1Kγ = −2.09 rK1Kγ
= −1.405 (black, dotted line), PH1 (red, dashed line) and PH2 (red, dash-dotted line) models. The contribution of the KΣchannels calculated by using Kaon-MAID are also shown ( blue, slim dashed and slim dash-dotted line). The photon energiesand kaon angles are displayed in the figure. The error bars show statistical errors. The systematic error is not represented.
[GeV/c]0K
p0 0.1 0.2 0.3 0.4 0.5 0.6 0.7
b/(G
eV/c
)]
µ/d
p [
σd
0
1
2
3 <1.0 [GeV]γE≤0.9
<1.0Lab0Kθcos≤0.9
(a), Kaon-MAIDΛ0K, SLAΛ0K, PH1Λ0K, PH2Λ0K0Σ0K+Σ0K
[GeV/c]0K
p0 0.1 0.2 0.3 0.4 0.5 0.6 0.7
b/(G
eV/c
)]
µ/d
p [
σd
0
1
2
3 <1.1 [GeV]γE≤1.0
<1.0Lab0Kθcos≤0.9
(b)
, Kaon-MAIDΛ0K, SLAΛ0K, PH1Λ0K, PH2Λ0K0Σ0K+Σ0K
data in the photon energy region, Eγ = 0.9–1.0 GeV, and with phenomenological parametrization fitted in thephoton energy region, Eγ = 0.9–1.0 GeV. Both models show enhancement of the c.m. cross section in the backwardhemisphere. The present result, therefore, sets constraints on models for the photo- and electroproduction of kaonsin the threshold region. This study shows that the n(γ,K0)Λ reaction with its unique feature is important for theinvestigation of the strangeness photoproduction.
VI. ACKNOWLEDGMENT
This work is supported by Grants-In-Aid for Scientific Research from The Ministry of Education of Japan, Nos.09304028, 12002001, and 14740150 and by the Grant Agency of the Czech Republic under grant No. 202/05/2142.
[1] R. L. Anderson, E. Gabathuler, D. Jones, B. D. McDaniel and A. J. Sadoff, Phys. Rev. Lett. 9, 131 (1968).[2] C. W. Peck, Phys. Rev. 135, B830 (1964).[3] D. E. Groom, Phys. Rev. 159, 1213 (1967).[4] A. Bleckmann et al., Z. Phys. 239, 1 (1970).[5] T. Fujii et al., Phys. Rev. D 2, 439 (1970).[6] P. Feller, D. Menze, U. Opara, W. Schulz, and W. J. Schwille, Nucl. Phys. B39, 413 (1972).[7] R. Erbe et al. Phys. Rev. 188, 2060 (1969).[8] K. H. Althoff et al., Nucl. Phys. B137, 269 (1978).[9] H. Thom, Phys. Rev. 151, 1322 (1966).
[10] K. H. Glander et al. (SAPHIR), Eur. Phys. J. A19, 251 (2004).
13
c.m.θcos -1 -0.5 0 0.5 1
b/sr
]
µ [Ω
/dσd
0
0.02
0.04
0.06
0.08
0.1 = 0.97 [GeV]γE(a) Kaon-MAID
SLAPH1PH2
c.m.θcos -1 -0.5 0 0.5 1
b/sr
]
µ [Ω
/dσd
0
0.1
0.2
0.3
0.4 = 1.1 [GeV]γE(b) Kaon-MAID
SLAPH1PH2
FIG. 12: Angular distributions of the elementary cross section of K0Λ production in the c.m. system for (a) Eγ = 0.97 GeVand (b) Eγ = 1.1 GeV. The Kaon-MAID [20] (solid line), SLA [19] with rK1Kγ . = −2.09 rK1Kγ . = −1.405 (dotted line), PH1(dashed line) and PH2 (dash-dotted line) models are shown.
c.m.θcos -1 -0.5 0 0.5 1
b/sr
]
µ [Ω
/dσd
0
0.1
0.2
0.3
0.4 = 0.97 [GeV]γE(a) Kaon-MAID
SLAPH1PH2
c.m.θcos -1 -0.5 0 0.5 1
b/sr
]
µ [Ω
/dσd
0
0.1
0.2
0.3
0.4 = 1.1 [GeV]γE(b) Kaon-MAID
SLAPH1PH2
[11] R. Bradford et al. (CLAS), Phys. Rev. C 73, 035202 (2006).[12] M. Sumihama et al. (LEPS), Phys. Rev. C 73, 035214 (2006).[13] R. Bradford et al. (CLAS), Phys. Rev. C 75, 035205 (2007).[14] R. A. Adelseck and B. Saghai, Phys. Rev. C 42, 108 (1990).[15] R. A. Williams, C. R. Ji, and S. R. Cotanch, Phys. Rev. 46, 1617 (1992).[16] J. C. David, C. Fayard, G. H. Lamot, and B. Saghai, Phys. Rev. C 53, 2613 (1996).[17] C. Bennhold and L. E. Wright, Phys. Rev. C 39, 927 (1989).[18] S. Janssen, J. Ryckebusch, D. Debruyne, and T. Van Cauteren, Phys. Rev. C 65, 015201 (2001).[19] T. Mizutani, C. Fayard, G. H. Lamot, and B. Saghai, Phys. Rev. C 58, 75 (1998).[20] F. X. Lee, T. Mart, C. Bennhold, and L. E. Wright, Nucl. Phys. A695, 237 (2001).[21] X. D. Li, L. E. Wright, and C. Bennhold, Phys. Rev. C 45, 2011 (1992).[22] T. Watanabe et al., Phys. Lett. B651, 269 (2007).[23] H. Yamazaki et al., Phys. Rev. C 52, 1157 (1995).[24] H. Yamazaki, NIM A536, 70 (2005).[25] K. Maruyama et al. (TAGX), Nucl. Instrum. Meth. A376, 335 (1996).[26] T. K. Ohska et al., IEEE Trans. Nucl. Sci. 33, 98 (1986).[27] P. Bydzovsky, M. Sotona, O. Hashimoto, and T. Takahashi (2004), nucl-th/0412035.[28] R. Machleidt, K. Holinde, and C. Elster, Phys. Rept. 149, 1 (1987).[29] A. Salam, K. Miyagawa, T. Mart, C. Bennhold, and W. Glockle, Phys. Rev. C 74, 044004 (2006), nucl-th/0608053.[30] W. M. Yao et al. (Particle Data Group), J. Phys. G33, 1 (2006).[31] This value of rK1Kγ , which differs from that quoted in [20], has been used in a newer version of the Kaon-MAID model.
14
[GeV]γE0.9 1 1.1 1.2 1.3 1.4 1.5
b]µ [σ
0
1
2
3
4Kaon-MAIDSLAPH1PH2
FIG. 13: Calculated photon-energy dependence of the total cross section of K0Λ production for the Kaon-MAID [20] (solidline), SLA [19] with rK1Kγ . = −2.09 rK1Kγ . = −1.405 (dotted line), PH1 (dashed line) and PH2 (dash-dotted line) modelsare shown.
[GeV]γE0.9 1 1.1 1.2 1.3 1.4 1.5
b]µ [σ
0
1
2
3
4Kaon-MAIDSLAPH1PH2