Embed Size (px)
Citation preview

1
Photosensitized and photocatalyzed degradation of azo dye using
Lnn+-TiO2 sol in aqueous solution under visible light irradiation
Yibing Xie a, b, Chunwei Yuan a, Xiangzhong Li b
a Key Laboratory of Molecular & Biomolecular Electronics, Southeast University,
Nanjing 210096, China
b Department of Civil and Structural Engineering, The Hong Kong Polytechnic
University, Hong Kong
Abstract
With attempts to improve the photocatalytic activity of titanium dioxide (TiO2)
catalysts and also extend the light absorption toward the visible light region, three
types of the lanthanide ion-modified titanium dioxide (Lnn+-TiO2) sol catalysts were
prepared by a chemical method of coprecipitation-peptization. The microstructure and
morphology of Lnn+-TiO2 sol samples were characterized by atom force microscope,
particle size distribution, and X-ray diffraction measurements. The analytical results
showed that these sol catalysts had better particles distribution and interfacial
adsorption ability than the powder catalysts in suspension. The photocatalytic
degradation of azo dye (X-3B) in Lnn+-TiO2 hydrosol reaction system was studied to
determine photocatalytic activity of the crystallized Lnn+-TiO2 sol catalysts. Both TiO2
and Lnn+-TiO2 sol catalysts demonstrated higher photocatalytic reactivity than
Deggusa P25 TO2 powder catalyst significantly. The experiments also confirmed that
the modification of TiO2 with lanthanide ions doping can improve the efficiency of
interfacial adsorption and photocatalytic reactivity with azo dye. The photocurrent
response of catalysts under visible light irradiation showed that the Lnn+-TiO2 sol
catalysts had significant absorption to visible light. Since this hydrosol reaction
system using the Lnn+-TiO2 sol catalyst has several advantages over most
conventional powder reaction systems, it may provide a new approach for further
development of photocatalytic reaction systems in the future.
Keywords: Hydrosol; Lanthanide ion; Photocatalysis; Photocurrent;
Photosensitization
This is the Pre-Published Version.

2
1. Introduction
Titanium dioxide (TiO2) has proven to be the most effective and suitable catalyst
for photocatalytic reaction due to its economical, chemically stable, and insoluble
properties [1-3]. So far, a variety of physical and chemical approaches have succeeded
to synthesize anatase and rutile TiO2 catalysts, including sputtering synthesis [4],
flame pyrolysis [5], electrochemical deposition [6], chemical vapor deposition [7],
precipitation [8], and sol-gel methods [9]. However, the physico-chemical properties
of the synthesized TiO2 particles are significantly affected by the precursor used and
the preparation procedure applied. For example, in the sol-gel methods, the
pretreatment of sol particles and thermal treatment of powder particles have been
observed to affect the phase formation and morphology of product TiO2 particles [10].
In these methods, high temperature above 450 °C in calcination is usually required to
form regular crystal structure. However, in the meantime, the high temperature
treatment can decline the surface area and also lose some surface hydroxyl groups of
TiO2 catalysts. Alternatively, a new method of chemical coprecipitation-peptization to
synthesize the crystallized TiO2 sol at low temperature of < 100 °C became attractive
to further improve the photocatalytic activity of TiO2 catalysts. Compared with most
TiO2 powders, theses TiO2 sol catalysts have several advantages of: (1) finer particle
size with more uniform distribution and better dispersion in water; (2) stronger
interfacial adsorption ability; and (3) easy coating on different supporting materials
including those substrates with a poor character of thermal resistance such as some
polymers, optical fibers, plastics, wood, and papers. However, it is generally believed
that most sol without high temperature treatment has an amorphous structure, which
contains non-bridging oxygen in the bulk TiO2 and a lot of Ti-O atomic arrangement
defects acting as centers for recombination of photogenerated electron-hole pairs.
Therefore, a regular crystal structure is the prerequisite for TiO2 semiconductor acting
as an effective photocatalyst [11]. Additionally, the crystal phase of TiO2 is also a
critical factor. The anatase phase usually showed a better photocatalytic activity than
the rutile phase [12,13].

3
On the other hand, many studies have succeeded in addition of either metals or
metallic oxides into TiO2 structure to extend the light absorption toward the visible
light range and also to eliminate the recombination of holes (h+) and electrons (e–).
Some recent studies have been focused on the doping with lanthanide ions/oxides
with 4f electron configuration because lanthanide ions could form complexes with
various Lewis bases including organic acids, amines, aldehydes, alcohols, and thiols
in the interaction of the functional groups with their f-orbital [14-16]. Xu et al. [14]
reported that doping with La3+, Ce3+, Er3+, Pr3+, Gd3+, Nd3+, or Sm3+ was beneficial to
NO2– adsorption. Ranjit and his co-workers [15,16] reported that doping with Eu3+,
Pr3+, or Yb3+ increased the adsorption capacity and also adsorption rate of TiO2
catalysts simultaneously in aqueous salicylic acid, t-cinnamic acid, and
p-chlorophenoxy-acetic acid solutions. However, the effect of lanthanide oxides on
the separation of electron-hole pairs and the photoresponse had not been extensively
investigated so far. For all lanthanide ions, they have special electronic structure of
4fx5dy which would lead to different optical properties and dissimilar catalytic
properties, and also have a redox couple of Lnn+/Ln(n+1)+ which would be able to form
the labile oxygen vacancies (OV) with the relatively high mobility of bulk oxygen
species [17].
In this study, three kinds of lanthanide ion-doped TiO2 (Lnn+-TiO2) sol catalysts
including Nd3+-TiO2, Eu3+-TiO2, and Ce4+-TiO2, and also a pure TiO2 sol catalyst
were prepared using a chemical method of coprecipitation-peptization at low
temperature and ambient pressure. The photocatalytic activity of these sol samples
was evaluated in photocatalytic degradation of azo dye (Reactive brilliant red – X-3B)
in aqueous solution under visible light irradiation.
2. Experimental
2.1. Materials
TiO2 powder (Degussa P25) with 80% anatase and 20% rutile was purchased from
Degussa AG Company, which had a BET area of 50 m2 g–1. Titanium tetrachloride

4
(TiCl4) chemical with reagent grade was obtained from J&K Chemical Ltd.
Neodymium oxide (Nd2O3), europium oxide (Eu2O3), and cerium oxide (CeO2) with
purity of > 99.9% were purchased from Aldrich Chemical Co. Reactive brilliant red
azo dye (X-3B) as a model chemical with reagent grade was obtained from Shanghai
Dyestuff Chemical Plant and used without further purification. All other chemicals
with analytical reagent grade were applied. Deionized and doubly distilled water was
used throughout this study.
2.2. Preparation of Lnn+-TiO2 sol catalysts
The Lnn+-TiO2 sol samples were prepared by coprecipitation-peptization with the
following procedure: lanthanide oxide (Nd2O3, Eu2O3, or CeO2) was respectively
dissolved into 100 mL of diluted hydrochloric acid solution with a proper amount up
to 3.0% Lnn+ by atom fraction; 50 mL of titanium titrechloride (TiCl4) was hydrolyzed
and diluted with the above frozen acidic solution at temperature below 0 °C under
vigorous stirring for 2 h; to ensure a complete hydrolysis, diluted aqueous ammonium
(NH4+) solution (10 wt.%) was added dropwise into the transparent TiCl4 solution to
obtain colloid precipitate at pH 10; the residual NH4+ and Cl– ions in the precipitate
were removed by washing with water till the pH of filtrate dropped to 7.5; the purified
Lnn+-TiO2 colloid suspension was continuously stirred at room temperature with
addition of nitric acid as a peptization aid and also a phase-transfer accelerant till pH
was further down to 1.5 to form the transparent Lnn+-TiO2 sol as primary rough sol;
This rough sol was further peptized for 8 h at 25 °C with stirring, and then digested at
70 °C for 12 h in an air-free condition; eventually the product Lnn+-TiO2 regular sol
was formed with uniform, stable, and transparent properties. These nano-sized sol
particles can maintain a homogenous distribution for a quite long time. In addition, a
TiO2 sol sample was also prepared in the same procedure, but without doping with
lanthanide ions.
2.3. Characterization of Ln3+-TiO2 sol catalysts
To determine the phase composition and crystal structure of the prepared sol

5
catalysts, X-ray diffraction (XRD) was carried out at room temperature using a X-ray
diffractometer (Shimadazu XD-3A) with graphite monochromatic copper radiation
(CuKα, λ = 0.15418 nm), 40 kV as accelerating voltage, 40 mA as emission current.
The particulate morphology of the sol catalysts was observed on atom force
microscope (AFM, Nanoscope III System). The average particle size and particle size
distribution (PSD) were determined by a light-scattering size analyzer (Zetasizer
3000HSA).
2.4. Photoreactor and Visible Light Source
A cylindrical quartz photoreactor with effective volume of 50 mL was used in this
study as illustrated in Fig. 1. A 150-W halogen tungsten lamp with the average
radiation intensity of 48.9 mW cm−2 and main emission in the range of 400-800 nm
was used together with the UV and IR cut-off filters as a visible light source.
[Fig. 1]
The photocatalytic activity of the prepared TiO2 and Lnn+-TiO2 sol catalysts was
investigated in the photocatalytic degradation of reactive brilliant red azo dye (X-3B)
in aqueous solution, while Degussa P25 TiO2 powder catalyst was also used for
comparison. The X-3B azo dye has a main absorption spectrum at 512-540 nm in the
visible light range and its molecular structure is illustrated in Fig. 2.
[Fig. 2]
A set of X-3B adsorption isotherm experiments was carried out with the following
procedure: the Lnn+-TiO2 sol or P25 TiO2 powder catalyst with a designated amount
of 2-20 mg was added into 10 mL of X-3B solution with an initial concentration of
100 mg L-1; this aqueous mixture was kept at 25 °C and stirred for 120 min in the
dark; then the mixture was centrifuged at 10,000 rpm for 15 min and then filtered by a
0.22-μm Millipore filter; the concentration of remaining X-3B in the mixture samples

6
after filtration was determined by a UV-VIS spectrometer (Shimadazu UV-2201).
A set of photocatalytic degradation experiments in aqueous X-3B solution was
performed with the following procedure: 20 mg of sol catalyst was added into 20 mL
of X-3B solution with an initial concentration of 100 mg L-1; prior to photoreaction,
the aqueous mixture was magnetically stirred in the dark for 30 min to reach
adsorption-desorption equilibrium; then the reaction mixture with stirring was
irradiated by the visible light from the top vertically; during the photoreaction,
samples were collected at a time interval of every 15 min and then filtered by the
0.22-μm Millipore filter for UV-VIS spectrum analysis to determine the concentration
of X-3B.
To determine the photo-response of such a hydrosol system under visible light
irradiation, a set of experiments to measure photocurrent-time spectra was conducted
in a standard three-electrode reactor system, which consists of a cell with a quartz side
window, a saturated calomel reference electrode (SCE), a platinum plate
counter-electrode (CE), and a indium-tin oxide (ITO) glass plate working electrode
(WE). The aqueous solution containing 1.0 g L−1 Lnn+-TiO2 sol and 100 mg L−1 X-3B
with an initial pH 3.5 was placed in the cell and the working electrode was dipped
into the solution. After 30 min, Lnn+-TiO2 sol and X-3B dye in the solution were
gradually adsorbed on the surface of the working electrode. Then the visible light was
turned on in front of the working electrode and the photocurrent-time (I–t) profile was
recorded with the CHI660 electrochemical workstation.
3. Results and discussion
3.1. XRD analysis
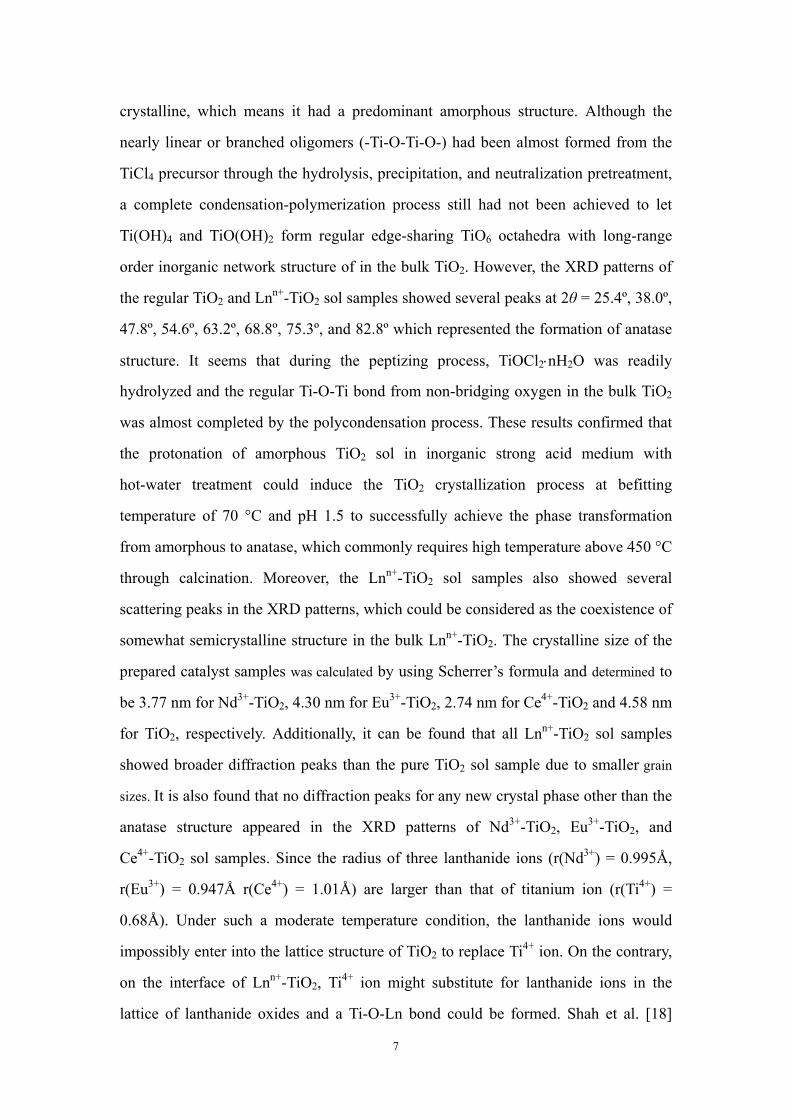
To determine the crystal structure and composition, the prepared TiO2 and
Lnn+-TiO2 sol samples were examined by XRD and the XRD patterns of different sol
catalysts are shown in Fig. 3. It can be noted that the rough TiO2 sol sample (Curve e)
did not have any significant diffraction peaks representing the characteristic of
7
crystalline, which means it had a predominant amorphous structure. Although the
nearly linear or branched oligomers (-Ti-O-Ti-O-) had been almost formed from the
TiCl4 precursor through the hydrolysis, precipitation, and neutralization pretreatment,
a complete condensation-polymerization process still had not been achieved to let
Ti(OH)4 and TiO(OH)2 form regular edge-sharing TiO6 octahedra with long-range
order inorganic network structure of in the bulk TiO2. However, the XRD patterns of
the regular TiO2 and Lnn+-TiO2 sol samples showed several peaks at 2θ = 25.4º, 38.0º,
47.8º, 54.6º, 63.2º, 68.8º, 75.3º, and 82.8º which represented the formation of anatase
structure. It seems that during the peptizing process, TiOCl2nH2O was readily
hydrolyzed and the regular Ti-O-Ti bond from non-bridging oxygen in the bulk TiO2
was almost completed by the polycondensation process. These results confirmed that
the protonation of amorphous TiO2 sol in inorganic strong acid medium with
hot-water treatment could induce the TiO2 crystallization process at befitting
temperature of 70 °C and pH 1.5 to successfully achieve the phase transformation
from amorphous to anatase, which commonly requires high temperature above 450 °C
through calcination. Moreover, the Lnn+-TiO2 sol samples also showed several
scattering peaks in the XRD patterns, which could be considered as the coexistence of
somewhat semicrystalline structure in the bulk Lnn+-TiO2. The crystalline size of the
prepared catalyst samples was calculated by using Scherrer’s formula and determined to
be 3.77 nm for Nd3+-TiO2, 4.30 nm for Eu3+-TiO2, 2.74 nm for Ce4+-TiO2 and 4.58 nm
for TiO2, respectively. Additionally, it can be found that all Lnn+-TiO2 sol samples
showed broader diffraction peaks than the pure TiO2 sol sample due to smaller grain
sizes. It is also found that no diffraction peaks for any new crystal phase other than the
anatase structure appeared in the XRD patterns of Nd3+-TiO2, Eu3+-TiO2, and
Ce4+-TiO2 sol samples. Since the radius of three lanthanide ions (r(Nd3+) = 0.995Å,
r(Eu3+) = 0.947Å r(Ce4+) = 1.01Å) are larger than that of titanium ion (r(Ti4+) =
0.68Å). Under such a moderate temperature condition, the lanthanide ions would
impossibly enter into the lattice structure of TiO2 to replace Ti4+ ion. On the contrary,
on the interface of Lnn+-TiO2, Ti4+ ion might substitute for lanthanide ions in the
lattice of lanthanide oxides and a Ti-O-Ln bond could be formed. Shah et al. [18]

8
proposed that Nd3+ resides in the octahedral interstitial site for Nd3+-TiO2 and the high
oxygen affinities of interstitially locating neodymium ion effectively create a
localized positive charge around Ti or form an oxygen vacancy. In this study, the
result of only anatase crystalline structure for Lnn+-TiO2 catalyst means that the phase
behavior of the doping lanthanide oxide is either an amorphous structure or an
interstitial solid solution between interconnecting TiO6 octahedrons.
[Fig. 3]
3.2. AFM analysis
To determine the morphology of catalysts, Lnn+-TiO2 sol and P25 TiO2 powder
catalysts were observed by AFM and their images are shown in Fig. 4. It can be seen
that TiO2 sol particles appeared a spherical shape and had an average particle size of
about 25 nm. It was observed that these TiO2 sol particles were uniformly distributed
and no agglomeration was observed. Compared with the sol samples, P25 TiO2
powder particles were significantly bigger with a particle size of about 45 nm and
aggregated size of about hundreds nanometer. The AFM results showed that TiO2 sol
had no significant aggregation and better dispersion in its colloid solution than P25
TiO2 powder. Furthermore, three types of Lnn+-TiO2 sol catalysts had a similar
spherical shape with smaller particle sizes of about 10 nm, 8 nm, and 12 nm for
Nd3+-TiO2, Eu3+-TiO2 and Ce4+-TiO2, respectively. These results indicated that
lanthanide ion doping could hinder the aggregation and growth of sol particles, which
resulted in the decrease in grain sizes and the increase in the specific surface areas.
[Fig. 4]
3.3. PSD analysis
Due to interaction between sol particles in the aqueous dispersion medium, these
particles seldom have a uniform size and normally vary in a certain range [19,20]. The
particle size distribution of catalysts greatly influences their properties of adsorption

9
and photoactivity. In this study, the particle size of TiO2 and Ln3+-TiO2 catalysts was
analyzed by the light-scatting size analyzer and the particle size distribution of
different catalysts is presented in Fig. 5. The results demonstrated that P25 TiO2
powder had a PSD in the range 148-208 nm with a mean value of 174 nm in its
aqueous suspension and the pure TiO2 sol had a PSD in the range of 13.8-35.3 nm
with a mean value of 21.1 nm. These results indicated that all the sol catalysts were
much smaller in size and had a single-modal distribution characteristic with more
uniform PSD than the P25 TiO2 powder catalyst. Furthermore, the results showed that
Nd3+-TiO2 sol had an average size of 8.5 nm and PSD from 4.6 to 16.4 nm; Eu3+-TiO2
sol had an average size of 3.5 nm and PSD from 3.5 to 17.2 nm; and Ce4+-TiO2 sol
had an average size of 10.5 nm and PSD from 8.5 to 18.6 nm. These data confirmed
that the particle size of TiO2 sol was further reduced by doping with lanthanide ions
significantly. Therefore, above experimental results indicated that the modification by
lanthanide ions would be beneficial to stabilize the nano-sized Lnn+-TiO2 sol particles
in aqueous solution with a good dispersion nature. These PSD results of TiO2 and
Lnn+-TiO2 sol samples were in good agreement to the results by the AFM
measurement.
[Fig. 5]
3.4. X-3B adsorption isotherm
Since the heterogeneous photocatalytic reaction mainly occurrs at the interface of
substrate and photocatalyst, the interfacial adsorption effect and affinity property play
important roles in an overall reaction rate [21,22]. The effect of adsorption-desorption
equilibrium was investigated between X-3B and different catalysts in aqueous
solution under darkness.
On the basis of experimental data, X-3B adsorption isotherms on the different
Lnn+-TiO2 catalysts were calculated using the Langmuir adsorption model as Equation
1.

10
maxae
max
e
KC
C
11 (1)
where Ce is the equilibrium concentration of the substrate in the solution in mol L-1,
Ka is the adsorption equilibrium constant in L mol-1, and max is the saturated
adsorption amount in mol g-1.
The experimental results are expressed by plotting Ce/Γads versus Ce in Fig. 6. It
can be seen that the adsorption data were well fitted by the Langumiur model in its
linear form. The saturation adsorption capacity was determined from high to low as
0.0606 mmol g−1 for Eu3+-TiO2 > 0.0579 mmol g−1 for Nd3+-TiO2 > 0.0500 mmol g−1
for Ce4+-TiO2 > 0.0413 mmol g−1 for TiO2 > 0.0345 mmol g−1 for P25 TiO2. These
results indicated that all the Lnn+-TiO2 sol catalysts exhibited higher adsorption
capacity than both the TiO2 sol and P25 TiO2 powder. Since the Lnn+-TiO2 sol had
finer particle size, larger special surface area and much better dispersion in aqueous
solution than the TiO2 sample, these factors would result in better adsorption ability
physically. Furthermore, the lanthanide ions of Lnn+-TiO2 sol particle could form the
O-Ln-O-Ti-O structure by chemical bonding with oxygen ions [15], while X-3B dye
molecule is negatively charged due to the –SO3Na group in its chemical structure. In
this case, the Lnn+ ions could act as Lewis acid because of their partial unoccupied 4f
atomic orbits and X-3B dye could act as Lewis base due to its π electron conjugation
structure. Consequently the formation of a Lewis acid-base complex of
RSO3−···Lnn+-TiO2 between lanthanide ion and X-3B dye in aqueous solution could
enhance the interface adsorption chemically as well [23].
[Fig. 6]
3.5. Photocatalytic degradation of X-3B under visible light irradiation
To evaluate the photocatalytic activity of Lnn+-TiO2 catalysts, several experiments
of X-3B degradation were carried out in either aqueous solution or suspension with

11
the initial X-3B concentration of 100 mg L−1 and catalysts dosage of 1.0 g L−1. Each
experiment lasted for 120 min and samples were collected every 15 min for analysis
to determine X-3B concentration by the UV-VIS spectroscopy. The experimental
results are shown in Fig. 7. The results showed that X-3B concentration decreased
under visible illumination remarkably. The Langmuir-Hinshelwood (L-H) kinetic
equation was one of the most useful models to describe this type of reaction. However,
in this study, the KadsC0 values in the adsorption tests were determined to be 0.1119
for P25 TiO2 powder, 0.1715 for TiO2 sol, 0.2179 for Ce4+-TiO2 sol, 0.2792 for
Eu3+-TiO2, 0.2642 for Nd3+-TiO2, respectively. Since these KadsC values were much
lower than 1, the L-H model can be simplified into the first-order model. The
experimental data were well fitted by the first-order model and the kinetic constant k
of X-3B degradation using different catalysts are presented in Table 1. The
experimental results indicated that the reaction rates with different catalysts from high
to low were ranked as Nd3+-TiO2 sol > Eu3+-TiO2 sol > Ce4+-TiO2 sol > TiO2 sol >
P25 TiO2 powder. These results confirmed that all the sol catalysts performed faster
degradation rates than the powder catalyst and all the Lnn+-TiO2 sol catalysts
performed better than the pure TiO2 sol. Among them, Nd3+-TiO2 sol catalyst
achieved the highest X-3B degradation rate.
[Fig. 7]
[Table 1]
Since X-3B dye is a photosensitizer under visible illumination, the direct
photolysis and photosensitized oxidation should be considered in this dye-Lnn+-TiO2
hydrosol system. The X-3B dye could be oxidized by the singlet oxygen (1O2*(S1)),
which is generated from ground state oxygen (3O2) by absorbing photon energy
emitted from the excited triplet state of dye molecule (3Dye*(T1)). However, the
experimental result shown in Fig. 7 confirmed that the direct photolysis of X-3B
under visible illumination for 120 min was only achieved by about 1.4%. It means

12
that the direct photolysis was an insignificant factor due to low electron or energy
transfer efficiency between the molecule complex (O2···Dye).
It is generally believed that the TiO2/UV photocatalytic oxidation in aqueous
solution highly depends on (1) the generation efficiency of electron-hole from
catalysts under illumination, (2) the separation efficiency of photogenerated electrons,
and (3) the transfer efficiency of electrons and holes to surrounding supports or
compounds adsorbed on the catalyst surface. However, the mechanism of
photoreaction in such a Dye/TiO2/Visible light system is actually more complicated
than that in a TiO2/UV light system.
3.6. Photoelectron generation under visible light illumination
To study the generation of photoelectrons in the X-3B/Lnn+-TiO2/Vis light
hydrosol system, three sets of experiments were carried out to measure the
photocurrent response of X-3B dye and Lnn+-TiO2 catalysts under visible light
illumination in an on-off cycle mode. The first set of photocurrent experiments was
conducted using P25 TiO2 powder and pure TiO2 sol, respectively in the aqueous
solution with and without X-3B, and the results are shown in Fig. 8. The results
showed that no significant photocurrent response occurred in both the P25 TiO2
powder suspension and pure TiO2 sol solution without X-3B dye, while visible light
was either on or off. However, when X-3B dye existed in aqueous solution, it can be
seen clearly that the photocurrent upsurge and dropping off occurred, while visible
light was on and off in two cycles. The photocurrent intensity quickly increased to
0.352 μA in the X-3B /P25 TiO2 powder suspension and to 0.495 μA in the
X-3B/TiO2 sol solution, respectively. These results confirmed that photoelectrons
were generated under visible light illumination by X-3B dye, but not the TiO2
catalysts. Under visible light illumination, the X-3B dye was exited from its ground
singlet state to the excited triplet state. Then X-3B dye injected its excited electrons
into the conduction band of TiO2 to generate photoelectrons in the system.

13
[Fig. 8]
The second set of photocurrent experiments was carried out using three Ln3+-TiO2
catalysts in aqueous solution without X-3B dye and the experimental results are
shown in Fig. 9. The results showed that the photocurrent was maintained at almost 0
during the initial period in the dark and rapidly increased to 0.265 μA for Nd3+-TiO2,
0.122 μA for Eu3+-TiO2 and 0.245 μA for Ce4+-TiO2, respectively, once light was on.
In the meantime, it was also found that the photocurrent dropped off sharply to about
0.02 μA, while light was off. These results confirmed that the photoelectrons were
successfully generated under visible light illumination by the Ln3+-TiO2 catalysts.
Comparing the results of two sets of experiments, it can be indicated that X-3B was
more sensitive than the Ln3+-TiO2 catalysts to generate photocurrent under visible
light illumination. Since lanthanide metals have partially-filled atomic d or f shell, the
electrons at Lnn+ 4f orbit could conduct electron-excitation and electron-transition to
build up lanthanide ions with a higher valence state by absorbing proper photons
energy. Consequently, surrounding Lnn+ ions may mutually bond due to
self-sensitization and form positively-charged lanthanide ions cluster (Lnp)q+ (q>3p).
This lanthanide cluster had discrete empty multi-energy levels below the conduction
band of crystalline TiO2. Their presence allowed a new electronic transition from the
TiO2 valence band to the empty lanthanide ion cluster energy levels known as a
sub-band gap with less energy than TiO2 valence-conduction band transition [24].
[Fig. 9]
The third set of photocurrent experiments was carried out in the X-3B/Lnn+-TiO2
solution under visible light illumination and the experimental results are shown in Fig.
10. The results demonstrated that photocurrent intensity was generated up to higher
levels of 0.565 μA for X-3B/Eu3+-TiO2, 0.634 μA for X-3B/Nd3+-TiO2, and 0.816 μA
for X-3B/Ce4+-TiO2, respectively during the instant illumination time. Once light was
off, photocurrent quickly dropped off to 0.074 μA for X-3B/Eu3+-TiO2, 0.092 μA for

14
X-3B/Nd3+-TiO2 and 0.062 μA for X-3B/Ce4+-TiO2, respectively. The experimental
results indicated that the photocurrent generation in the X-3B/Lnn+-TiO2 system was
significantly stronger than that in either Lnn+-TiO2 only or X-3B only. Furthermore,
the experimental results demonstrated two different patterns of photocurrent-time
profiles. In the X-3B/Nd3+-TiO2 and X-3B/Ce4+-TiO2 hydrosol systems, once light
was on, the photocurrent rapidly increased to 0.634 μA for Nd3+-TiO2 and 0.816 μA
for Ce4+-TiO2, respectively and well maintained within instant illumination time.
Once light was off, their current quickly dropped off to 0.092 μA for Nd3+-TiO2 and
0.062 μA for Ce4+-TiO2, respectively. However, in the Eu3+-TiO2 hydrosol system, the
photocurrent instantly increased as well once light was on and further increased to a
peak value of 0.565 μA after 20 seconds gradually. Once light was off, it decreased to
the initial value of 0.074 μA, but not as quickly as those in the X-3B/Ce4+-TiO2 and
X-3B/Nd3+-TiO2 systems. Additionally, the higher photocurrent generation indicated
excellent light absorption ability of the X-3B/Lnn+-TiO2 system.
[Fig. 10]
3.7. Efficiency of photoelectron trapping and transferring
On the other hand, the lanthanide ions bonded on the surface of TiO2 particles
could act as good scavengers to trap photoelectrons, resulting in depressing
photocurrent generation. As an overall result, only a small amount of electrons
photogenerated can transfer to the working electrode to form an out-circuit.
Comparing the photocurrent generation in three systems under the same experimental
condition, the higher photocurrent intensity occurred in the X-3B/Ce4+-TiO2 solution
might indicate that cerium ion had weaker electron-trapping capacity, while the lower
photocurrent intensity occurred in the X-3B/Eu3+-TiO2 solution pointed out that
europium ion had stronger electron-trapping capacity. According to the standard redox
potentials of E0(O2/O2-) = +0.338 V, E0(Nd3+/Nd2+) = -0.40 V, E0(Eu3+/Eu2+) = -0.35 V,
E0(Ce4+/Ce3+) = +1.76 V, and Evb(TiO2) = -0.5 V versus NHE, the presence of Nd3+
and Eu3+ ion on the TiO2 surface may promote the following reactions:

15
Step 1: dye* + CB(TiO2) dye+ + e-CB(TiO2) (electron injection)
Step 2: Eu3+ + e Eu2+ or Nd3+ + e Nd2+ (electron trapping)
Step 3: Eu2+ + O2 Eu3+ + O2– or Nd2+ + O2 Nd3+ + O2
– (electron transferring)
However, cerium ion can only undergo electronic trapping (Step 2) of Ce4+ + e
Ce3+, but the reversed reaction with oxygen from Ce3+ to Ce4+ to achieve electron
transferring (Step 3) is forbidden due to its higher redox potential than that of O2/O2-.
Consequently, its catalytic efficiency gradually declined because of the suppression of
further recovery electron transfer. Therefore, Eu3+-TiO2 and Nd3+-TiO2 catalysts
demonstrated better photocatalytic activity than Ce4+-TiO2 catalyst for X-3B
degradation under visible light irradiation. It is a good agreement between the results
of photocatalytic degradation experiments and photocurrent response experiments.
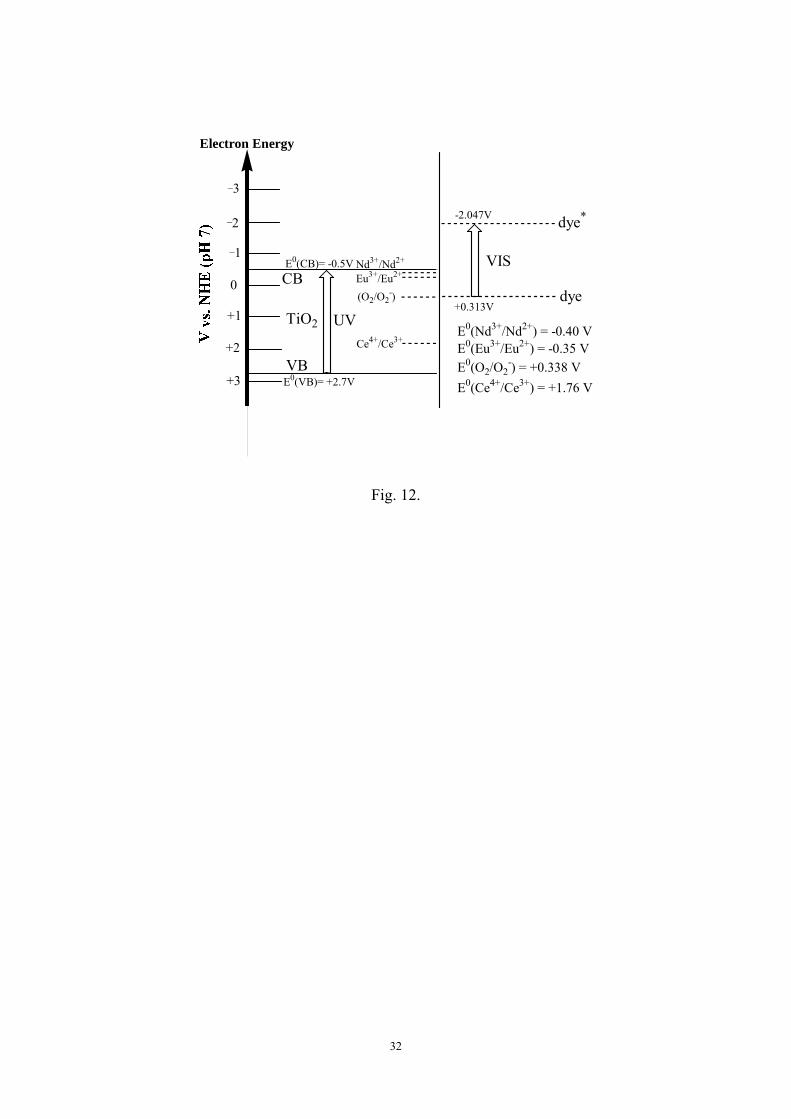
3.8. Mechanism of photosensitization of X-3B/Lnn+-TiO2 under visible light
illumination
It is generally believed that pure TiO2 can not be directly excited by visible light
due to its high band-gap of 3.2 eV. The X-3B/Ln3+-TiO2 under visible light
illumination has an entirely different mechanism of photo-excitation from TiO2 under
UV irradiation. The X-3B dye sensitization process involves the excitation of dye
molecules by absorbing visible light photons and subsequent electron injection from
excitation state dye to TiO2 conduction band (CB). Then electrons underwent transfer
process from CB to the working electrode (ITO conductive film) and finally formed
out-circuit. In such a Dye/Lnn+-TiO2/Vis hydrosol system, Lnn+-TiO2 particles act as a
bridge-band connecting X-3B dye and working electrode. Some key reactions are
proposed in Equations 2-7.
Dye + h Dye* (2)
Dye* + TiO2 TiO2 (e–) + Dye+· (3)
TiO2 (e–) + O2 O2
–· + TiO2 (4)
Lnn+ + TiO2 (e–) Ln(n-1)+ + TiO2 (5)
Ln(n-1)+ + O2 O2– + Lnn+ (6)
O2–· + Dye+· Intermediates or final products (7)

16
In the above reactions, dye can be excited under visible light illumination
(Equation 2). The excited state dye molecule can inject electrons into the conduction
band of TiO2 (Equation 3) and may be trapped by the electron scavengers of usually
surrounding oxygen molecule (Equation 4). In the meantime, it is also extremely
susceptible for the recombination between cationic radicals and the electrons if the
injection electrons accumulate in the CB of TiO2. So, the electrons trapping (Equation
5) and electrons transferring (Equation 6) become two key steps to inhibit
electron-cationic radical recombination. The cationic radical (dye+·) produced by
electron injection is less stable than the probe molecule in ground state dye. As a
result, unstable dye cationic radicals can be directly degraded into its products by
reacting with super-oxidizing anionic radials or other active oxygen (HO·, HOO· and
O2–·) (Equation 7). In particular, the lanthanide ion doped in TiO2 plays an important
role in promoting the electron trapping and electron transferring significantly in the
Dye/Ln3+-TiO2 hydrosol system. The photosensitization reaction mechanism and
potential states in the Dye/Lnn+-TiO2/Vis system are further illustrated in Figs. 11 and
12, respectively.
[Fig. 11]
[Fig. 12]
4. Conclusion
TiO2 sol particles with 3.0 at.% lanthanide ion modification was prepared using
chemical coprecipitation-peptization route. Lnn+-TiO2 sol particles showed regular
crystal structure and narrow particle size distribution. Direct conversion from
amorphous to nanocrystalline phase was achieved at moderate temperature of 70 °C
and strong acidic condition of pH 1.5. The Lnn+-TiO2 sol exhibited better interfacial
adsorption effects under the dark condition and higher photocatalytic activity under
visible light irradiation than pure TiO2 sol and P25 TiO2 powder. Concerning the

17
photocurrent response in X-3B/Lnn+-TiO2/Vis hydrosol system, Nd3+-TiO2 and
Eu3+-TiO2 showed weaker photoelectrons generation than Ce4+-TiO2, probably due to
the difference of electron-scavenging capability by different lanthanide ions. In terms
of X-3B degradation efficiency, Nd3+-TiO2 and Eu3+-TiO2 showed higher
photocatalytic activity than Ce4+-TiO2, which might result from the difference of
standard redox potentials of Lnn+/Ln(n-1)+ ion pairs.
Acknowledgements
This work was financially supported by the Hi-Tech Research and Development
Program (863 Program) of China (Grant No. 2002AA302304), the National Natural
Science Foundation of China (Grant No. 60121101) and also the Research Grants
Council of Hong Kong (Grant No. PolyU5148/03E).
References
[1] A. Fujishima, T.N. Rao, D.A. Tryk, J. Photochem. Photobiol. C: Rev. 1 (2001) 1.
[2] J.M. Herrmann, Catal. Today 53 (1999) 11.
[3] S. Malato, J. Blanco, A Vidal, D. Alarcon, M.I. Maldonado, J. Caceres, W.
Gernjak, Solar Energy 75 (2003) 329.
[4] D. Mardare, M. Tasca, M. Delibas, G.I. Rusu, Appl. Surf. Sci. 156 (2000) 200.
[5] S.U.M. Khan, M. Al-Shahry, W.B. Ingler Jr, Science 297 (2002) 2243.
[6] G.M.Wang, H. Chen, H. Zhang, C.W. Yuan, Z.H. Lu, G.M. Wang, W.Y. Yang,
Appl. Surf. Sci. 135 (1998) 97.
[7] D.H. Kuo, C.N. Shueh, Chem. Vap. Deposition 9 (2003) 265.
[8] T. Kawahara, T. Ozawa, M. Iwasaki, H. Tada, S. Ito, J. Colloid Interf. Sci. 267
(2003) 377.
[9] N.I. Al-Salim, S.A. Bagshaw, A. Bittar, T. Kemmitt, A.J. McQuillan, A.M. Mills,
M.J. Ryan, J. Mater. Chem. 10 (2000) 2358.
[10] S.S. Watson, D. Beydoun, J.A. Scott, R. Amal, Chem. Eng. J. 95 (2003) 213.
[11] H.K. Park, D.K. Kim, C.H. Kim, J. Am. Ceram. Soc. 80 (1997) 743.
[12] D. Švadlák, J. Shánélová, J. Málek, L.A. Pérez-Maqueda, J.M. Criado, T.

18
Mitsuhashi, Thermochim. Acta 414 (2004) 137.
[13] M. Koelsch, S. Cassaignon, C. Ta Thanh Minh, J.F. Guillemoles, J.P. Jolivet,
Thin Solid Films 86-92 (2004) 451.
[14] W. Xu, Y. Gao, H.Q. Liu, J. Catal. 207 (2002) 151.
[15] K.T. Ranjit, I. Willner, S.H. Bossmann, A.M. Braun, J. Catal. 204 (2001) 305.
[16] K.T. Ranjit, I. Willner, S.H. Bossmann, A.M. Braun, Environ. Sci. Technol. 35
(2001) 1544.
[17] B.M. Reddy, P.M. Sreekanth, E.P. Reddy, Y. Yamada, Q. Xu, H. Sakurai, T.
Kobayashi, J. Phys. Chem. B 106 (2002) 5695.
[18] S.I. Shah, W. Li, C.P. Huang, O. Jung, C. Ni, PNAS. 99 (2002), 6482-6486.
[19] E. Reverchon, P.G. Della, D. Sannino, P. Ciambelli, Powder Technol. 102 (1999)
127.
[20] A.A. Gribb, J.F. Banfield, Am. Mineral. 82 (1997) 717.
[21] P. Davit, G. Martra, S. Coluccia, V. Augugliaro, E. Garcia López, V. Loddo, G.
Marci, L. Palmisano, M. Schiavello, J. Mol. Cataly. A: Chem. 204–205 (2003)
693.
[22] F.Y. Oliva, L.B. Avalle, O.R. Cámara, C.P. De Pauli, J Colloid Interf. Sci. 261
(2003) 299.
[23] K.T. Ranjit, H. Cohen, I. Willner, S.H. Bossmann, A.M. Braun, J. Mater Sci. 34
(1999) 5273.
[24] Y.B. Xie, C.W. Yuan, Appl. Surf. Sci. 221 (2004) 17.

19
Table 1 Kinetic parameters of X-3B photodegradation under visible light irradiation
Photocatalyst kap (min-1) t1/2 (min) r (%) R
P25 0.00554 125.3 59.76 0.9977
TiO2 sol 0.00667 103.9 67.92 0.9972
Nd3+-TiO2 sol 0.01499 46.2 89.14 0.9973
Eu3+-TiO2 sol 0.01246 55.6 85.25 0.9978
Ce4+-TiO2 sol 0.00729 95.1 72.39 0.9905
kap−apparent rate constant (min-1); t1/2−Half-Life (min); r−X-3B photodegradation
ratio (%); R−correlation coefficient

20
List of Figure Captions
Fig. 1. Schematic diagram of visible light photocatalytic reaction equipment
Fig. 2. Molecule structure of dye X-3B (Chemical formula = C19H10O7N6Cl2S2Na2,
Molar mass = 615g mol−1)
Fig. 3. XRD patterns of Eu3+-TiO2 sol, Ce4+-TiO2 sol, Nd3+-TiO2 sol, regular TiO2 sol
and rough TiO2 sol particles
Fig. 4. AFM micrograph of P25 TiO2 powder particles and TiO2 sol particles
Fig. 5. PSD of Eu3+-TiO2, Nd3+-TiO2, Ce4+-TiO2, pure TiO2 sol particles and P25 TiO2
powder particles
Fig. 6. X-3B adsorption isotherms on the different catalysts by plotting Ce/Γads versus
Ce (Ce the ratio of the equilibrium concentration and ads the adsorbed
amounts of X-3B)
Fig. 7. Variation of X-3B concentration in terms of visible light irradiation time using
different photocatalysts: (◄) blank; () P25 TiO2 powder; (▼) TiO2 sol; (▲)
Ce4+-TiO2 sol; () Eu3+-TiO2 sol; (■) Nd3+-TiO2 sol
Fig. 8. Photocurrent response of ITO electrode in (a) X-3B/TiO2 hydrosol (b)
X-3B/P25 TiO2 suspension (c) P25 TiO2 suspension (d) TiO2 hydrosol
system under visible light irradiation-darkness impulse condition
Fig. 9. Photocurrent response of ITO electrode in Lnn+-TiO2 sol, TiO2 sol and P25
TiO2 suspension under visible light irradiation-darkness impulse condition
Fig. 10. Photocurrent response of ITO electrode in X-3B/Lnn+-TiO2 hydrosol under
visible light irradiation-darkness impulse condition
Fig. 11. Proposed mechanism of photosensitization reaction in Dye/Lnn+-TiO2/Vis
system
Fig. 12. Schematic illustration of valence & conduction band potentials of TiO2 and
excitation & ground state potentials of X-3B molecule along with the
standard reduction potentials of lanthanide ion pairs

21
Photoreactor
HalogenTungstenLamp
Optical Fiber
IR FilterUV Filter
Focus
Fig. 1.

22
OH NH
NaO3S SO3Na
N
CN
C
N C
Cl
ClN N
Fig. 2.
23
10 20 30 40 50 60 70 80 90
a Eu3+-TiO2 sol
b Ce4+-TiO2 sol
c Nd3+-TiO2 sol
d regular TiO2 sol
e rough TiO2 sol
Rela
tive in
tensi
ty (
a.u
.)
2 theta (degree)
68.863.2
54.647.838.0
25.4 (101)
75.3 82.8b
c
d
e
a
Fig. 3.

24
Fig. 4.

25
0 10 20 30 150 180 2100
10
20
30
40
50
Per
centa
ge o
f part
icle
s num
ber
Particle size (nm)
Eu3+-TiO2 sol
Nd3+-TiO2 sol
Ce4+-TiO2 sol
pure TiO2 sol
P25 TiO2 powder
Fig. 5.

26
0.08 0.10 0.12 0.14 0.164
6
8
10
12
14
16 P25 TiO
2 powder
TiO2 sol
Ce4+-TiO2 sol
Nd3+-TiO2 sol
Eu3+-TiO2 sol
Ce/
ads
(g
L–1
)
Ce(mmol L–1)
Fig. 6.

27
0 20 40 60 80 100 1200
20
40
60
80
100
C0 = 100 mg L-1
X-3B P25 TiO
2 + X-3B
TiO2 sol + X-3B
Ce4+-TiO2 sol + X-3B
Eu3+-TiO2 sol + X-3B
Nd3+-TiO2 sol + X-3B
C/C
0 (%
)
Time (min)
Fig. 7.

28
0 20 40 60 80 1000.0
0.2
0.4
0.6
0.8
c
Pho
tocu
rrent
(
)
Time (s)
a TiO2 sol + X-3B
b P25 TiO2 powder + X-3B
c P25 TiO2 powder
d TiO2 sol
light-off light-off light-offlight-onlight-on
d
b
a
Fig. 8.

29
0 20 40 60 80 1000.0
0.1
0.2
0.3
0.4a Ce4+-TiO
2 sol d TiO
2 sol
b Nd3+-TiO2 sol e P25 TiO
2 powder
c Eu3+-TiO2 sol
Pho
tocu
rre
nt (A
)
Time (s)
light-off light-off light-offlight-onlight-on
ab
c
de
Fig. 9.

30
0 20 40 60 80 1000.0
0.2
0.4
0.6
0.8
1.0
1.2
Photo
curr
ent (A
)
Time (s)
a Ce4+-TiO2 sol + X-3B
b Nd3+-TiO2 sol + X-3B
c Eu3+-TiO2 sol + X-3B
light-on light-on light-offlight-offlight-off
b
c
a
Fig. 10.

31
O2-/O2
CB
VB
O2
O2
O2 TiO2 dye (S0)
dye*(S1)e...dye+﹞
e
ee
Lnn+
Ln(n-1)+/Lnn+
Injection
Trapping
Lnn+ cluster
UV
Visible light
Trapping
TransferringTransmission
Excitation
Fig. 11.
32
TiO2
VB
CB
UV
VIS
dye*
dye
Electron Energy
E0(Nd3+/Nd2+) = -0.40 V
Nd3+/Nd2+
Eu3+/Eu2+
E0(Eu3+/Eu2+) = -0.35 V
E0(Ce4+/Ce3+) = +1.76 V
Ce4+/Ce3+
E0(CB)= -0.5V
E0(VB)= +2.7V
-2.047V
+0.313V
E0(O2/O2-) = +0.338 V
(O2/O2-)
_1
0
+1
+2
+3
_3
_2
Fig. 12.