Embed Size (px)
Citation preview

ULTRASONIC-ASSISTED EXTRACTION OF
CELLULOSE FROM SUGARCANE BAGASSE
PHUANG KE SHONG
UNIVERSITI TUNKU ABDUL RAHMAN

ULTRASONIC-ASSISTED EXTRACTION OF CELLULOSE
FROM SUGARCANE BAGASSE
PHUANG KE SHONG
A project report submitted in partial fulfilment of the
requirements for the award of the degree of
Bachelor of Engineering (Hons) Petrochemical Engineering
Faculty of Engineering and Green Technology
Universiti Tunku Abdul Rahman
May 2019

ii
DECLARATION
I hereby declare that this project report is based on my original work except for
citations and quotations which have been duly acknowledged. I also declare that it has
not been previously and concurrently submitted for any other degree or award at
UTAR or other institutions.
Signature : _________________________
Name : _________________________
ID No. : _________________________
Date : _________________________

iii
APPROVAL FOR SUBMISSION
I certify that this project report entitled “ULTRASONIC-ASSISTED
EXTRACTION OF CELLULOSE FROM SUGARCANE BAGASSE” was
prepared by PHUANG KE SHONG has met the required standard for submission in
partial fulfilment of the requirements for the award of Bachelor of Engineering (Hons)
Petrochemical Engineering at Universiti Tunku Abdul Rahman.
Approved by,
Signature : _________________________
Supervisor : Dr. Chng Lee Muei
Date : _________________________
iv
The copyright of this report belongs to the author under the terms of the
copyright Act 1987 as qualified by Intellectual Property Policy of Universiti Tunku
Abdul Rahman. Due acknowledgement shall always be made of the use of any material
contained in, or derived from, this report.
© 2019, Phuang Ke Shong. All right reserved.

v
ACKNOWLEDGEMENTS
First and foremost, I would like to express my sincere thanks to those who have
involved and assisted me throughout my research time. Besides that, I would like to
express my gratitude and sincere appreciation to my supervisor, Dr. Chng Lee Muei
for her support, guidance, motivation, assistance and enormous patience. With her
patience, useful comments and valuable feedback, I am able to complete my research
project on time.
Furthermore, my sincere thanks and appreciation also goes to the UTAR
Faculty of Engineering and Green Technology laboratory officers who teaches me and
guides me on the equipment and device usage during my experimental research in
laboratory.
Last but not least, I would like to convey my gratitude to my beloved parents
and friends who have support me, encourage me and help me throughout this research.

vi
ULTRASONIC-ASSISTED EXTRACTION OF CELLULOSE FROM
SUGARCANE BAGASSE
ABSTRACT
The large amount of lignocellulosic biomass have contributed to the environmental
issues. Therefore, it is essential to recycle them and convert it into more useful
products via environmental friendly technology. In this research, sugarcane bagasse
(SCB) is used as the feedstock for cellulose extraction since it can be easily found
worldwide with about 50 %(w/w) of cellulose content. In addition, ultrasonic-assisted
alkaline extraction was used as the green technology to obtain the cellulose with vital
consideration to reduce the chemical and energy usage compared to current
conventional extraction technology. The SCB was autoclaved with distilled water
before undergo ultrasonic extraction in alkali medium. The treatments were carried out
by manipulating three different processing parameters, which are ultrasonic amplitude
of 20 %, 30 % and 40 %, temperature at 70 oC, 80 oC and 90 oC and concentration of
potassium hydroxide solution vary from 0.25 M to 1.25 M, with interval of 0.25 M.
Approximate 56.58 %(w/w) to 83.22 %(w/w) of cellulose has been successfully
extracted from SCB samples. It was found that SCB treated at ultrasonic amplitude of
30 %, 80 oC and 1.25 M KOH resulted the highest amount of cellulose. This treated
SCB sample was then further converted into carboxymethyl cellulose (CMC) through
alkalization with 17.5 %(w/v) NaOH and etherification process by addition of sodium
monochloroacetate (SMCA). The synthesis process gave CMC with degree of
substitution of 0.3624. A low DS was obtained as the experiment is not carried out in
optimum condition. Meanwhile, a film is successfully produced, further assure the
properties of produced CMC. The characteristics of each of the treated SCB and CMC
were analysed by Fourier Transform Infrared Spectroscopy (FTIR), Differential
Scanning Calorimetry (DSC) and High Pressure Liquid Chromatography (HPLC). The
testing further verified that the properties of cellulose and CMC extracted from SCB
are significantly promising for large scale production.

vii
TABLE OF CONTENTS
DECLARATION ii
APPROVAL FOR SUBMISSION iii
COPYRIGHT iv
ACKNOWLEDGEMENTS v
ABSTRACT vi
TABLE OF CONTENTS vii
LIST OF TABLES x
LIST OF FIGURES xiii
LIST OF SYMBOLS / ABBREVIATIONS xviii
LIST OF APPENDICES xix
CHAPTER
1 INTRODUCTION 1
1.1 Background of Study 1
1.2 Problem Statement 3
1.3 Aims and Objectives 5
1.4 Scope of Study 6
2 LITERATURE REVIEW 7
2.1 Feedstock for Cellulose Production 7
2.2 Characteristics of Sugarcane Bagasse 10
2.3 Cellulose Production Process 12
2.4 Pretreatment Technology in Cellulose Extraction 14
2.4.1 Autoclaving 14
viii
2.4.2 Soxhlet Extraction 14
2.4.3 Steam Explosion 16
2.4.4 Liquid Hot Water Treatment 17
2.4.5 Wet Oxidation 17
2.4.6 Acid Hydrolysis Treatment 19
2.4.7 Alkaline Hydrolysis Treatment 20
2.4.8 Organosolv Treatment 21
2.4.9 Ultrasonic-assisted Treatment 22
2.5 Production of Carboxymethyl Cellulose (CMC) 24
3 METHODOLOGY 27
3.1 Research Flow Chart 27
3.2 Material and Chemicals 29
3.3 Preparation of Sugarcane Bagasse Powder 29
3.4 Pretreatment of SCB 30
3.5 Treatment for Extraction of Cellulose from SCB 31
3.6 Synthesis of CMC from Cellulose 33
3.7 Characterization of SCB, treated SCB and CMC 33
3.7.1 Fourier Transform Infrared Spectroscopy
(FTIR)
33
3.7.2 Differential Scanning Calorimeter (DSC)
Analysis
34
3.7.3 High Performance Liquid Chromatography
(HPLC) for Carbohydrate Content Analysis
34
3.7.4 Film Preparation 35
3.7.5 Determination of Degree of Substitution
(DS) of CMC
35
4 RESULTS AND DISCUSSION 36
4.1 SCB Characterization 36
4.2 Comparison between Autoclave and Reflux
Pretreatment
40

ix
4.3 Effect of Ultrasonic Amplitude on Pretreated
SCB
46
4.4 Effect of Temperature on Pretreated SCB 50
4.5 Effect of Potassium Hydroxide Concentration on
Pretreated SCB
53
4.6 Analysis of Cellulose Extraction from Treated
SCB
58
4.7 Comparison of Cellulose Extraction with
Commercialised Process
60
4.8 CMC Characterization 63
5 CONCLUSION AND RECOMMENDATION 67
5.1 Conclusion 67
5.2 Recommendation 68
REFERENCES 70
APPENDICES 82

x
LIST OF TABLES
TABLE TITLE PAGE
2.1 Content of Cellulose, Hemicellulose and Lignin in Agriculture
Waste
8
2.2 Application of CMC in Various Industry 25
3.1 Chemical Used in the Research 29
3.2 Treatment at Various Amplitudes by Using Ultrasonic
Homogenizer
32
3.3 Treatment at Various Temperatures by Using Ultrasonic
Homogenizer
32
3.4 Treatment at Various Potassium Hydroxide Solution
Concentration
32
4.1 Carbohydrate Content of SCB Based on HPLC Analysis 40
4.2 Yield of Pretreated SCB 40
4.3 Assignment of Absorption Band in Autoclave and Reflux SCB 41
4.4 Yield of Treated SCB After Ultrasonic-Assisted Alkali Treatment 42
4.5 Assignment of Absorption Band in SCB, Autoclave or Reflux
SCB with Ultrasonic Treatment
43

xi
4.6 DSC Thermograms of Autoclave or Reflux SCB with Ultrasonic
Treatment
45
4.7 Carbohydrate Content of Treated SCB Based on HPLC Analysis 45
4.8 Yield of Treated SCB at Various Ultrasonic Amplitude 46
4.9 Assignment of Absorption Band in Treated SCB at Various
Ultrasonic Amplitude
47
4.10 DSC Thermograms of Treated SCB at Various Ultrasonic
Amplitude
49
4.11 Carbohydrate Content of Treated SCB at Various Ultrasonic
Amplitude Based on HPLC Analysis
49
4.12 Yield of Treated SCB at Various Temperature 50
4.13 Assignment of Absorption Band in Treated SCB at Various
Temperature
51
4.14 DSC Thermograms of Treated SCB at Various Temperature 52
4.15 Carbohydrate Content of Treated SCB at Various Temperature
Based on HPLC Analysis
53
4.16 Yield of Treated SCB at Various Potassium Hydroxide
Concentration
54
4.17 Assignment of Absorption Band in Treated SCB at Various KOH
Concentration
55
4.18 DSC Thermograms of Treated SCB at Various KOH
Concentration
56
xii
4.19 Carbohydrate Content of Treated SCB at Various KOH
Concentration Based on HPLC Analysis
57
4.20 Carbohydrate Content of Treated SCB at 80 oC, 30 % Ultrasonic
Amplitude and 0.75 M KOH Based on HPLC Analysis
58
4.21 Analysis of Standard Error of Mean and Confidence Interval of
Carbohydrate Content in Treated SCB at 80 oC, 30 % Ultrasonic
Amplitude and 0.75 M KOH
60
4.22 Assignment of Absorption Band in CMC and SCB 64
H.1 Summary of Total Carbohydrate Content in Treated SCB at
Different Ultrasonic Amplitude
108
I.1 Summary of Total Carbohydrate Content in Treated SCB at
Different Temperature
111
J.1 Summary of Total Carbohydrate Content in Treated SCB at
Different KOH Concentration
115
K.1 Yield of CMC 116

xiii
LIST OF FIGURES
FIGURE TITLE PAGE
2.1 Structure of Lignocellulosic Biomass with Cellulose,
Hemicellulose, and Lignin
10
2.2 Structure Unit of Lignin 11
2.3 Structure of Cellulose 12
2.4 Production of Cellulose from Wood Pulp 13
2.5 Process Flow for Production of CMC 24
3.1 Research Flow Chart 28
3.2 Reflux Pretreatment Setup 30
3.3 Ultrasonic Homogenizer Equipment Setup 31
4.1 FTIR Spectra of Raw Sugarcane Bagasse 37
4.2 DSC Thermograph of SCB 38
4.3 HPLC Chromatogram of SCB 39
4.4 FTIR Spectra of SCB Pretreated with Autoclave and Reflux 41
4.5 FTIR Spectra of Autoclave or Reflux SCB with Ultrasonic
Treatment
43

xiv
4.6 DSC Thermograph of Autoclave or Reflux SCB with Ultrasonic
Treatment
44
4.7 FTIR Spectra of Treated SCB at Various Ultrasonic Amplitude 47
4.8 DSC Thermograph of Treated SCB at Various Ultrasonic
Amplitude
48
4.9 FTIR Spectra of Treated SCB at Various Temperature 51
4.10 DSC Thermograph of Treated SCB at Various Temperature 52
4.11 FTIR Spectra of Treated SCB at Various KOH Concentration 54
4.12 DSC Thermograph of Treated SCB at Various KOH
Concentration
56
4.13 Error Bar of Carbohydrate Content of Treated SCB at 80 oC, 30 %
Ultrasonic Amplitude and 0.75 M KOH
59
4.14 Process Flow for Extraction of Cellulose in Industry 61
4.15 Process Flow for Modified Cellulose Extraction Process 62
4.16 Appearance of CMC 63
4.17 FTIR Spectra of SCB and CMC 64
4.18 DSC Thermograph of SCB and CMC 65
4.19 Film Production from Synthesize CMC 66
A.1 FTIR Spectra of Autoclave Pretreatment SCB 82
A.2 FTIR Spectra of Reflux Pretreatment SCB 82

xv
A.3 FTIR Spectra of Autoclaved SCB with Ultrasonic Treatment 83
A.4 FTIR Spectra of Refluxed SCB with Ultrasonic Treatment 83
A.5 FTIR Spectra of Treated SCB at Ultrasonic Amplitude of 20 % 84
A.6 FTIR Spectra of Treated SCB at Ultrasonic Amplitude of 30 % 84
A.7 FTIR Spectra of Treated SCB at Ultrasonic Amplitude of 40 % 85
A.8 FTIR Spectra of Treated SCB at Temperature of 70 oC 85
A.9 FTIR Spectra of Treated SCB at Temperature of 80 oC 86
A.10 FTIR Spectra of Treated SCB at Temperature of 90 oC 86
A.11 FTIR Spectra of Treated SCB at KOH Concentration of 0.25 M 87
A.12 FTIR Spectra of Treated SCB at KOH Concentration of 0.50 M 87
A.13 FTIR Spectra of Treated SCB at KOH Concentration of 0.75 M 88
A.14 FTIR Spectra of Treated SCB at KOH Concentration of 1.0 M 88
A.15 FTIR Spectra of Treated SCB at KOH Concentration of 1.25 M 89
B.1 DSC Thermograph of Refluxed SCB with Ultrasonic Treatment 90
B.2 DSC Thermograph of Autoclaved SCB with Ultrasonic Treatment 90
B.3 DSC Thermograph of Treated SCB at Ultrasonic Amplitude of
20 %
91
B.4 DSC Thermograph of Treated SCB at Ultrasonic Amplitude of
30 %
91

xvi
B.5 DSC Thermograph of Treated SCB at Ultrasonic Amplitude of
40 %
92
B.6 DSC Thermograph of Treated SCB at Temperature of 70 oC 92
B.7 DSC Thermograph of Treated SCB at Temperature of 80 oC 93
B.8 DSC Thermograph of Treated SCB at Temperature of 90 oC 93
B.9 DSC Thermograph of Treated SCB at KOH Concentration of
0.25 M
94
B.10 DSC Thermograph of Treated SCB at KOH Concentration of
0.50 M
94
B.11 DSC Thermograph of Treated SCB at KOH Concentration of
0.75 M
95
B.12 DSC Thermograph of Treated SCB at KOH Concentration of
1.0 M
95
B.13 DSC Thermograph of Treated SCB at KOH Concentration of
1.25 M
96
C.1 HPLC Analysis for Dextrose at 0.4 g/L 97
C.2 Dextrose Calibration Curve 97
D.1 HPLC Analysis for Xylose at 0.4 g/L 98
D.2 Xylose Calibration Curve 98
E.1 HPLC Analysis for Arabinose at 0.4 g/L 99
E.2 Arabinose Calibration Curve 99

xvii
F.1 HPLC Chromatogram of Sugarcane Bagasse 100
G.1 HPLC Chromatogram of Autoclaved SCB with Ultrasonic
Treatment
102
G.2 HPLC Chromatogram of Refluxed SCB with Ultrasonic Treatment 104
H.1 HPLC Chromatogram of Treated SCB at Ultrasonic Amplitude
of 20 %
106
H.2 HPLC Chromatogram of Treated SCB at Ultrasonic Amplitude
of 30 %
108
H.3 HPLC Chromatogram of Treated SCB at Ultrasonic Amplitude
of 40 %
108
I.1 HPLC Chromatogram of Treated SCB at Temperature of 70 oC 109
I.2 HPLC Chromatogram of Treated SCB at Temperature of 80 oC 111
I.3 HPLC Chromatogram of Treated SCB at Temperature of 90 oC 111
J.1 HPLC Chromatogram of Treated SCB at KOH Concentration of
0.25 M
112
J.2 HPLC Chromatogram of Treated SCB at KOH Concentration of
0.50 M
114
J.3 HPLC Chromatogram of Treated SCB at KOH Concentration of
0.75 M
114
J.4 HPLC Chromatogram of Treated SCB at KOH Concentration of
1.0 M
114
J.5 HPLC Chromatogram of Treated SCB at KOH Concentration of
1.25 M
115

xviii
LIST OF SYMBOLS / ABBREVIATIONS
AGU Anhydroglucopyranose units
CMC Carboxymethyl cellulose
DS Degree of Substitution
DSC Differential Scanning Calorimetry
FTIR Fourier Transform Infrared Spectroscopy
HPLC High Pressure Liquid Chromatography
HCl Hydrochloric acid
KBr Potassium bromide
KOH Potassium hydroxide
NaCl Sodium chloride
NaOH Sodium hydroxide
SCB Sugarcane bagasse
SEM Scanning electron microscopy
SMCA Sodium monochloroacetate
H2SO4 Sulphuric acid
XRD X-ray Powder Diffraction
xix
LIST OF APPENDICES
APPENDIX TITLE PAGE
A FTIR Spectra of Treated SCB 82
B DSC Thermograph of Treated SCB 90
C HPLC Calibration Curve for Dextrose 97
D HPLC Calibration Curve for Xylose 98
E HPLC Calibration Curve for Arabinose 99
F Calculation of Carbohydrate Content of Sugarcane Bagasse in
HPLC
100
G HPLC Analysis of Autoclaved and Refluxed SCB with Ultrasonic
Treatment
102
H HPLC Analysis of Treated SCB at Different Ultrasonic Amplitude 106
I HPLC Analysis of Treated SCB at Different Temperature 109
J HPLC Analysis of Treated SCB at Different KOH Concentration 112
K Yield of CMC 116
L Calculation of Degree of Substitution 116

CHAPTER 1
INTRODUCTION
1.1 Background of Study
Lately, agricultural residues have been generated greatly from various industries which
leads to environmental challenges. The agricultural residues include sugarcane
bagasse, maize stalk, sisal, oil cakes, rice husk and coconut husk. These residue is also
known as lignocellulosic biomass. Therefore, recycling of this residue is essential to
reduce the pollution to the environment, on the same time extracting useful products
such as lignin and cellulose, which turn the wastes into profit (Adebisi et al., 2017).
Some of these lignocellulosic biomass serve as feedstock material for
conversion into biogas, steam and power generation. Generally, lignocellulosic
biomass comprises the major component of cellulose, hemicellulose and lignin.
Sugarcane bagasse (SCB) is an agricultural waste which is available globally and
inexpensive since the yield is continuously supplied without running out. In Brazil, the
supply of SCB can be up to 186 million tons per year (Karp et al., 2013).
SCB is the major byproduct produced in sugarcane industry. SCB is the cane
fibrous residue which can be obtained through the crushing of sugarcane to extract the
juice. The growth region and surrounding condition of the sugarcane will affect its
constituents (Parameswaran, 2009). Generally, approximate 41-55 %(w/w) of SCB is
cellulose with 20.0-27.5 %(w/w) of hemicellulose, 18.0-26.3 %(w/w) of lignin and
about 7 %(w/w) of other inorganic materials (Mokhena et al., 2018). All these
biopolymers are strongly intermeshed and chemically bonded (Pérez et al., 2002).

2
The current properties of lignocellulosic biomass is resistant to enzymatic
attack. Besides that, the strong crystalline arrangement of cellulose and the resistance
of lignin to microbial attack have create difficulty to the hydrolysis process (Rocha et
al., 2012). Thus, treatment is needed to disrupt and solubilise hemicellulose and lignin
from the lignocellulosic biomass, thereby enhance the efficiency in extracting
cellulose from SCB for further usage in other application. Several types of treatment
can be carried out which includes physicochemical, chemical, mechanical,
hydrothermal and enzymatic treatment. Steam explosion is one of the common method
for physicochemical treatment while mechanical treatment normally utilized
ultrasonic or microwave system. The most common treatment is chemical treatment
which uses acid, alkali and organic solvent. On the other hand, hot water and wet
oxidation are examples for hydrothermal treatment. Along the treatment process, the
structure of the SCB, lignin and hemicellulose is broken down and solubilised (Karp
et al., 2013). As the result, cellulose is extracted from the lignocellulosic material,
SCB. The yield of cellulose obtained is dependent on the condition of different process
parameters. An effective treatment will limits the formation of degrade products and
by-products, while carry out the treatment at lower capital and operating cost. It is
advisable to employ the treatment process which is environmentally friendly and low
energy usage, on the same time, able to extract the adequate amount of cellulose.
Cellulose is a long chain homopolymer composed of β-1,4 glycosidic bonds
linked D-glucose subunits. Hydrogen bonds and van der Waals forces link the long
chain together (Karp et al., 2013). It is a natural polysaccharide that exist within cell
coats of plants. Cellulose consists of both amorphous and crystalline region. Moreover,
cellulose is a very stable insoluble compound, biodegradable, non-toxic and have high
thermal stability and tensile strength, which make it widely used in various application
(Quesada Cabrera et al., 2011). It is mainly used as raw material in the form of cement
composite in construction and for chemical conversions (Klemm, Schmauder and
Heinze, 2005). The main cellulose derivatives are cellulose ether and cellulose ester
which frequently used in pharmaceutical and cosmetic industries. Ethyl cellulose (EC),
hydroxypropyl cellulose (HPC) and carboxymethyl cellulose (CMC) are the examples
for cellulose ether. Meanwhile, cellulose ester includes cellulose acetate (CA),
cellulose acetate phthalate (CAP) and cellulose acetate trimelitate (CAT) (Shokri and
Adibkia, 2013).
3
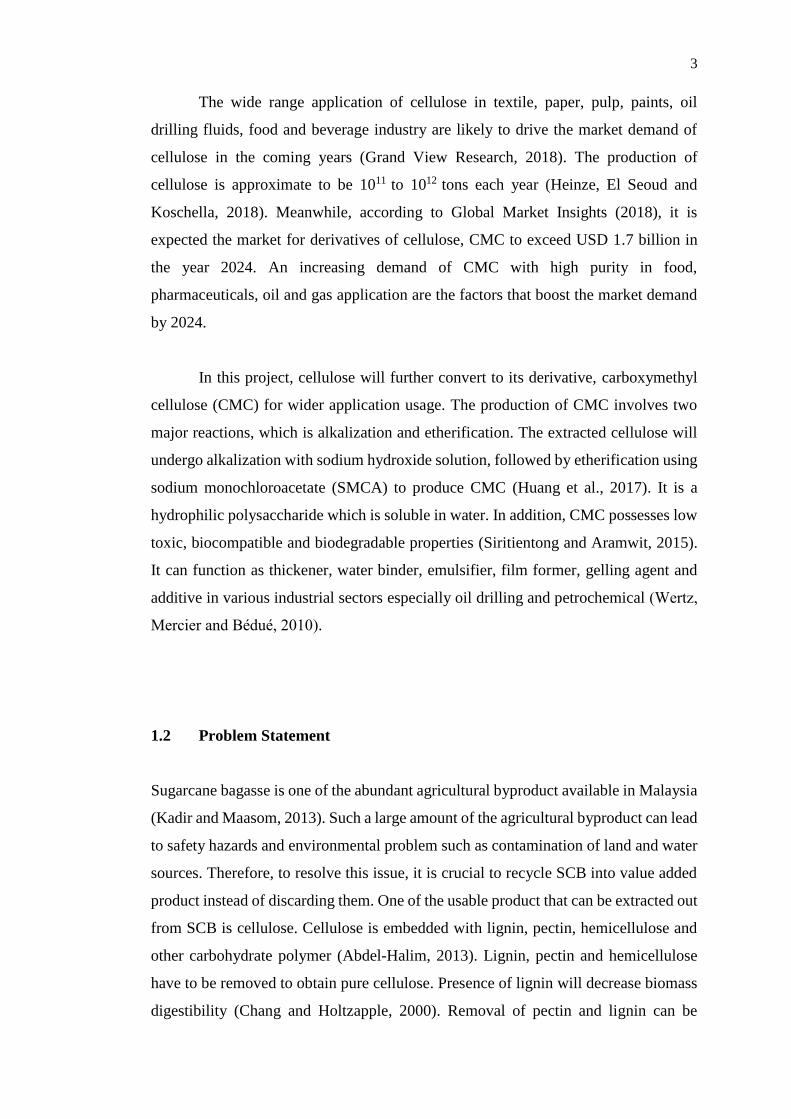
The wide range application of cellulose in textile, paper, pulp, paints, oil
drilling fluids, food and beverage industry are likely to drive the market demand of
cellulose in the coming years (Grand View Research, 2018). The production of
cellulose is approximate to be 1011 to 1012 tons each year (Heinze, El Seoud and
Koschella, 2018). Meanwhile, according to Global Market Insights (2018), it is
expected the market for derivatives of cellulose, CMC to exceed USD 1.7 billion in
the year 2024. An increasing demand of CMC with high purity in food,
pharmaceuticals, oil and gas application are the factors that boost the market demand
by 2024.
In this project, cellulose will further convert to its derivative, carboxymethyl
cellulose (CMC) for wider application usage. The production of CMC involves two
major reactions, which is alkalization and etherification. The extracted cellulose will
undergo alkalization with sodium hydroxide solution, followed by etherification using
sodium monochloroacetate (SMCA) to produce CMC (Huang et al., 2017). It is a
hydrophilic polysaccharide which is soluble in water. In addition, CMC possesses low
toxic, biocompatible and biodegradable properties (Siritientong and Aramwit, 2015).
It can function as thickener, water binder, emulsifier, film former, gelling agent and
additive in various industrial sectors especially oil drilling and petrochemical (Wertz,
Mercier and Bedue, 2010).
1.2 Problem Statement
Sugarcane bagasse is one of the abundant agricultural byproduct available in Malaysia
(Kadir and Maasom, 2013). Such a large amount of the agricultural byproduct can lead
to safety hazards and environmental problem such as contamination of land and water
sources. Therefore, to resolve this issue, it is crucial to recycle SCB into value added
product instead of discarding them. One of the usable product that can be extracted out
from SCB is cellulose. Cellulose is embedded with lignin, pectin, hemicellulose and
other carbohydrate polymer (Abdel-Halim, 2013). Lignin, pectin and hemicellulose
have to be removed to obtain pure cellulose. Presence of lignin will decrease biomass
digestibility (Chang and Holtzapple, 2000). Removal of pectin and lignin can be

4
carried out through dewaxing and delignification process which require substantial
amount of chemicals and energy to obtain high quality cellulose. The monomer of
cellulose is glucose. Cellulose has a polymer chain length of 10,000 glucose units and
is linear in structure (Chen, 2014). Besides that, the morphology of cellulose can be
combination of crystalline and amorphous region. They are rigid and less reactive to
reaction.
In recent years, chemical treatment have been practised widely in industry as
compared to other treatments. Acid hydrolysis treatment causes the disruption of
lignocellulosic structure, whereby hemicellulose is solubilised. The common acid used
in the treatment includes phosphoric acid, sulphuric acid, hydrochloric acid and acetic
acid at various level of concentration (Supranto et al., 2015). However, the use of
concentrated acid could leads to the corrosion of equipment. Meanwhile, some of the
organic acid have high flammability which would result in high pressure solvents
(Balan, 2014). Dilute acid will be more favour in assisting the extraction of cellulose
since it tend to remove large amount of hemicellulose (Yang and Wyman, 2008).
On the other hand, alkaline treatment can effectively remove lignin through
disruption of the structural linkage, dissolve the hemicellulose and maximize the
cellulose content (Karp et al., 2013). Sodium hydroxide, potassium hydroxide, lime
and ammonia are example of alkali employed in this process. However, there is still
the presence of minor hemicellulose in the mixture. Further treatment is needed to
remove the hemicellulose (Bian et al., 2012). Besides that, large amount of water is
needed especially when utilized alkaline hydrogen peroxide and lime in the treatment
(Balan, 2014).
The steam explosion and liquid hot water treatment is one of the technology
that can be used to extract cellulose. However, there need to be conducted in high
temperature and pressure, thus require high control on operating parameters.
Meanwhile, wet oxidation conducted at high temperature assists the cleavage of
hemicellulose and lignin. The treatment process is exothermic and requires oxygen gas
supply (Tarherzadeh and Karimi, 2008). On the other hand, ultrasonic treatment
utilizes ultrasound wave to induce cavitation phenomena on the cell wall, causing the
solubilisation of lignin and hemicellulose (Sun et al, 2004). Ultrasonic treatment

5
requires shorter extraction time and smaller amount of solvent as compared to other
treatment (Anna and Zdenka, 2010). Ultrasonic treatment has been widely practised in
laboratory scale based. However, researcher have found some difficulties to achieve
extraction in industrial scale (Vilkhu et al., 2008).
Aside from this common treatment which utilized the usage of large amount of
chemicals to extract cellulose, there is a need to develop a treatment process which
require a mild reaction conditions and less energy demand with a higher yield of
extracted cellulose. Therefore, this research will study on the use of alkali with the
assist of ultrasonic homogenizer to increase the extraction efficiency.
1.3 Aims and Objectives
The objectives of this research is to:
i. prepare and characterize the sugarcane bagasse.
ii. investigate the effect of ultrasonic-assisted extraction process to the yield of
cellulose by varying the temperature, ultrasonic amplitude and alkali
concentration.
iii. characterize extracted cellulose with DSC, FTIR and HPLC.
iv. convert extracted cellulose to carboxymethyl cellulose.

6
1.4 Scope of Study
The scope of study are listed as follows:
i. Study the use of renewable lignocellulosic biomass, sugarcane bagasse as the
feedstock for cellulose extraction process. The characteristics and availability
of sugarcane in Malaysia is studied.
ii. Study the preparation of sugarcane bagasse powder process. The sugarcane
bagasse will need to be dried, cut and crush into smaller size powder for
cellulose extraction.
iii. Study the treatment method required in assisting the extraction of cellulose
from the sugarcane bagasse. Ultrasonic-assisted treatment in potassium
hydroxide solution is used in the cellulose extraction process.
iv. Study the structure of the treated sugarcane bagasse. FTIR, DSC and HPLC
characterization test will be carry out for treated sugarcane bagasse to
determine its properties.
v. Study and analyse the yield of extracted cellulose. The obtained cellulose will
further undergo chemical process to produce carboxymethyl cellulose.
vi. Study the properties of carboxymethyl cellulose produced from cellulose
extracted from sugarcane bagasse. The properties include degree of
substitution and production of film from synthesised carboxymethyl cellulose.

CHAPTER 2
LITERATURE REVIEW
2.1 Feedstock for Cellulose Production
Cellulose is one of the most abundant polymer available worldwide. It is a common
organic compound which serve as feedstock for the production of pulp, fibrous
chemical and cellulose derivatives for various application (Chen, 2014). The
production of cellulose is approximate 1011 to 1012 tons per annual (Heinze, El Seoud
and Koschella, 2018). The commercial source of cellulose are mainly comes from
wood pulp which consists of 40-50 %(w/w) cellulose and cotton linters with 90
%(w/w) cellulose content.
The cellulose in wood pulp is obtained through the treatment of the wood plant.
Pulping process is employed to separate lignin, hemicellulose and other substances
from the wood either by mechanical or chemical means. On the other hand, cotton
linter is the short fiber of seed hairs attached around the cotton seed. It is relatively
curly with cylindrical shape and has thick wall. The good accessibility of cotton linter
to chemical reagents have make it a high reactivity material as compared to cotton
staple fiber. High purity of cellulose content can be obtained from cotton linter through
bleaching process (Heinze, El Seoud and Koschella, 2018). However, environmental
drawback such as pesticide usage during cotton cultivation have make the dependent
of production of cellulose to cotton linter decreases (Olsson and Westman, 2013).

8
In view of the arising environmental problem with the resulting adverse effect
due to increase of residue waste, an alternative source for the production of cellulose
is studied and developed. Recently, lignocellulosic biomass as a renewable source has
been used in extracting cellulose. It has become the alternative feedstock since it
mainly consists of cellulose, hemicellulose and lignin. The main source of
lignocellulosic biomass comes from agricultural waste such as sugarcane bagasse,
wheat straw, maize stalk, corn cob, coconut husk, nut shell and empty fruit brunch.
Other biomass can be derived from food wastes, forest residues, municipal and
industrial wastes (Lee, Hamid and Zain, 2014). Table 2.1 shows the content of
cellulose, hemicellulose and lignin in some of the agriculture waste.
Table 2.1: Content of Cellulose, Hemicellulose and Lignin in Agriculture Waste.
Agriculture
waste
Cellulose
%(w/w)
Hemicellulose
%(w/w)
Lignin
%(w/w)
Source
Corn cob 45 35 15 (Sun and
Cheng, 2002)
Coconut husk 20-25 3-12 35-45 (Cabral et al.,
2016)
Palm kernel
cake
35.7 30.3 15.6 (Shibata et al.,
2008)
Sugarcane
bagasse
40-50 25-35 18-24 (Mandal and
Chakrabarty,
2011)
Wheat straw 35-45 20-30 15 (del Río et al.,
2012)
The high fixed carbon content in corn cob make the removal of lignin to be
difficult (Shariff et al., 2016). The fixed carbon is the residue of combustible biomass
after the ash and volatile matter have been eliminated. The aromatic ring structure with
various branches have cause lignin in corn cob only degrades at temperature higher

9
than 900 oC (Satimanont, Luengnaruemitchai and Wongkasemjit, 2012). This will lead
to presence of lignin in cellulose of corn cob. Meanwhile, the extraction of cellulose
from palm kernel cake involves several processes, from oil extraction, pretreatment,
bleaching to delignification process. More chemicals are involved in the extraction
process, such as hexane used to extract oil, sodium hydroxide, sodium chlorite to
delignify wood and acetic acid to hydrolyse hemicellulose. The usage of sodium
chlorite and acetic acid have to be optimum as they are toxic and hazardous (Bono et
al., 2009). The high usage of chemical will increase the operational cost. On the other
hand, wheat straw have high ash content of 6-12 weight percent. Therefore the
inorganic compounds within wheat straw will react with each other at high
temperatures (NL Agency, 2013). Besides that, it has high carbon to nitrogen content
which result in a low biodegradability. The separation of hemicellulose and lignin from
cellulose will take a longer time.
Sugarcane bagasse (SCB) is a renewable source and can be obtained in
Malaysia even though the cultivation of sugarcane is relatively small, with annual
production of 5714 tons of sugarcane in 2016 (Quandl, 2018). SCB is the fiber residue
obtained from the crushing of sugarcane in sugar milling process. Basically, fresh
sugarcane is composed of 43-52 %(w/w) of fiber, with moisture content of 45-50
%(w/w) at wet basis and 2-6 %(w/w) soluble solids. Meanwhile, composition of
cellulose inside SCB is approximate 26.6-54.3 %(w/w), with 14.3–24.45 %(w/w) of
lignin and 22.3-29.7 %(w/w) hemicellulose (Katyal, Thambimuthu and Valix, 2003).
It has served as raw material for the generation of steam and electricity in boiler. The
heating value of approximate 7738 ± 100 kJ/kg enables bagasse to act as alternative
fuel within the boiler by burning as a pile, thus increases the combustion efficiency
(Barroso et al., 2003). Moreover, it is cheap and has low pollution to the environment.

10
2.2 Characteristics of Sugarcane Bagasse
The growth of sugarcane is commonly found in tropical and subtropical countries. The
world largest sugarcane producer is Brazil with production of 659 million tons of
sugarcane per year (Carvalho, 2016). In addition, sugarcane has play an important role
in producing billions of gallons of fuel in Brazil, making them energy independent
country. Sugarcane bagasse is the left over cane stalk residue from the crushing of the
sugarcane for juice extraction. The two main components of the sugarcane stalk are
inner pitch surrounded by outer rind. (Mokhena et al., 2018).
Nowadays, the use of sugarcane bagasse as feedstock for the production of
chemicals, fuels and additives has been increased. Furthermore, it can also be used in
making biodegradable products, such as paper, plates and toilet paper. It is one of the
lignocellulosic biomass with abundant supply. Hence, it has become the alternate
renewable source to compensate with the depletion of petroleum and fossil fuel
resources. Every lignocellulosic biomass comprises of three main biopolymers, which
are cellulose, hemicellulose with lignin as shown in Figure 2.1. The exact composition
of the biopolymers are vary depending on the source and type of biomass.
Figure 2.1: Structure of Lignocellulosic Biomass with Cellulose, Hemicellulose and
Lignin (Alonso, Wettstein and Dumesic, 2012).
11
Hemicellulose is a polysaccharide with much lower molecular weight as
compared to cellulose. It composed of different monomers that may vary according to
its source, mainly from hardwood and softwood. Besides that, there is only small
amount of crystalline region presence in hemicellulose (Chen, 2014). The large portion
of amorphose structure in hemicellulose make it easily hydrolysed by hemicellulase
enzyme, hot dilute acid or cold 5 %(w/v) NaOH solution. It forms chemical bonds with
lignin and hydrogen bond with cellulose microfibrils (Chen, 2014; O’Hara, 2011).
Hemicellulose normally concentrated in primary and secondary layer of plant cell wall
(Saleh, 2014). For SCB, the hemicellulose mainly composed of xylan polysaccharides
with glucoronic acid and arabinose as the side groups (Brienzo et al., 2016).
Meanwhile, hemicellulose film have oxygen permeability property which make it
favourable material for production of food packaging. (Hansen and Plackett, 2008).
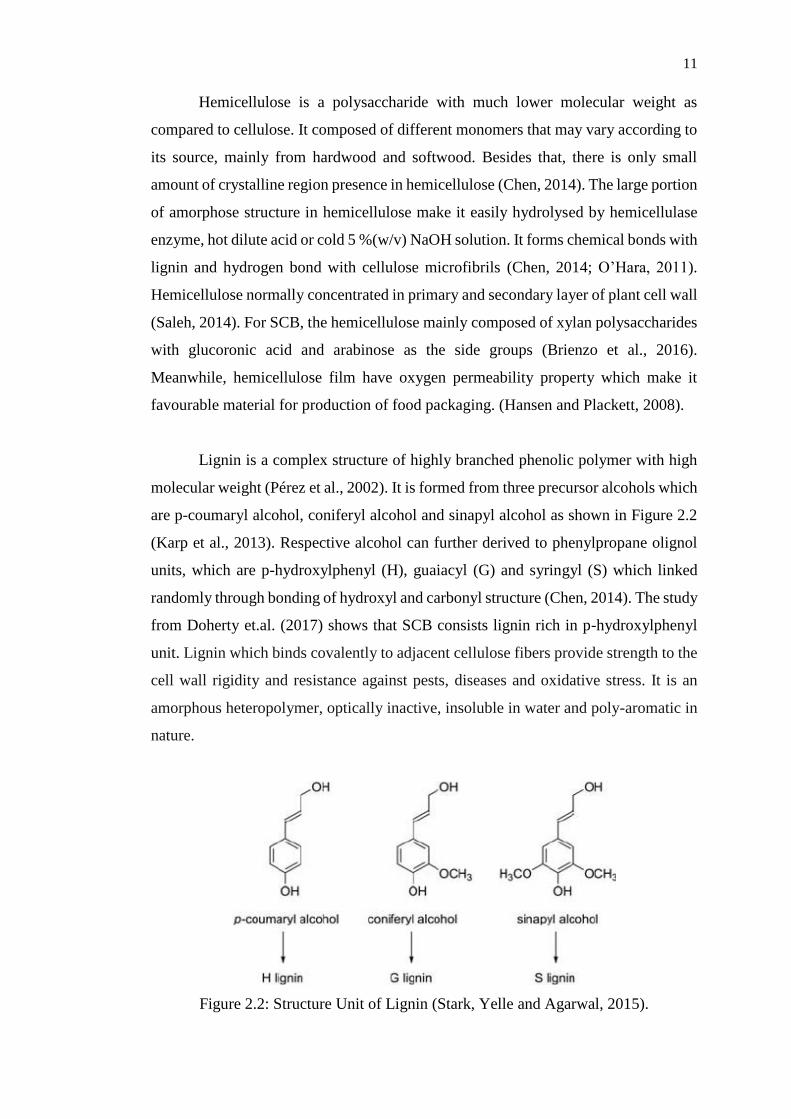
Lignin is a complex structure of highly branched phenolic polymer with high
molecular weight (Pérez et al., 2002). It is formed from three precursor alcohols which
are p-coumaryl alcohol, coniferyl alcohol and sinapyl alcohol as shown in Figure 2.2
(Karp et al., 2013). Respective alcohol can further derived to phenylpropane olignol
units, which are p-hydroxylphenyl (H), guaiacyl (G) and syringyl (S) which linked
randomly through bonding of hydroxyl and carbonyl structure (Chen, 2014). The study
from Doherty et.al. (2017) shows that SCB consists lignin rich in p-hydroxylphenyl
unit. Lignin which binds covalently to adjacent cellulose fibers provide strength to the
cell wall rigidity and resistance against pests, diseases and oxidative stress. It is an
amorphous heteropolymer, optically inactive, insoluble in water and poly-aromatic in
nature.
Figure 2.2: Structure Unit of Lignin (Stark, Yelle and Agarwal, 2015).

12
Cellulose is the main constituent of the lingocellulosic plant cell wall with
about 30-50 %(w/w) of content in lignocellulosic biomass. It is a linear polymer
comprises of D-anhydroglucopyranose (AGU) unit linked together by β-1,4-
glycosidic bonds. There are three hydroxyl groups attached to AGU, with secondary
OH on C2 and C3 position and a primary OH on C6 as shown in Figure 2.3 (Olsson
and Westman, 2013). Meanwhile, the number of AGU unit within the chain can be
expressed as the degree of polymerization. Normally, SCB will have the degree of
polymerization between 800 to 1900 (O’Hara, 2011). These polysaccharide chains are
packed together in microfibrils by hydrogen bonds. Meanwhile, these microfibrils
attached to each other by hemicelluloses and other polymer, with lignin as cover
(Taherzadeh and Karimi, 2008). The reactivity of cellulose can be affected by its
amorphous and crystalline structure. The high crystallinity of cellulose has make it
insoluble in most of the common solvent (Viera et al., 2007).
Figure 2.3: Structure of Cellulose (Credou and Berthelot, 2014).
2.3 Cellulose Production Process
Every lignocellulosic biomass mainly composes of cellulose, hemicellulose and lignin.
Cellulose is the main component in lignocellulosic biomass which consist of mostly
crystalline and some amorphous structure, embedded in composite structure, mainly
composed of lignin and hemicellulose. It can be found in the rigid cell wall of the plant
and is associated with hydrogen bonding, making it resist to destruct or degrade in
organic solvent (Singh and Singh, 2012). The commercialized cellulose production are
mainly from wood pulp and cotton linter.

13
The cellulose in wood pulp can be obtained through pulping process shown in
Figure 2.4. The bark has to be removed from the wood, which then cut into chips.
Firstly, it will be fed into digester for alteration of its structure into individual fibers.
The digester is favoured to operate in continuous mode since it requires lesser capital
investment as compared to batch mode. In the process, sodium sulphide is used to
dissolve lignin structure in the presence of heat. However, there is still presence of
small amount of lignin and short chain carbohydrate within the structure. A further
treatment is required to purify the structure and obtained a pure cellulose. Then, the
wood pulp is mixed with chlorine to get rid of the remaining lignin. It is a continuous
operation at low pH and short treatment time. After that, the chlorinated pulp proceeds
to caustic soda extraction to remove any of the chlorinated lignin and short chain
carbohydrate. Finally, the wood cellulose will undergo bleaching process to obtain a
whiter cellulose since wood pulp is brownish. Sulphur dioxide can be soured on the
cellulose to kill any residual of bleach (Wayman, 1958).
Figure 2.4: Production of Cellulose from Wood Pulp (Wayman, 1958).
Meanwhile, cotton ball is harvested and separated to cotton seed and linter fuzz
through grinning process. The cotton seed and linter fuzz is further processed in oil
mill to produce vegetable oil. During the process, linter is being separated out before
oil is pressed. The cotton linter obtained need to be purified to obtained pure cellulose.
Firstly, it will undergo bale opening to remove any contamination and impurities such
as sand, stone and pectin. Then, caustic soda is added in the digestion process to
solubilised pectin, protein and saponify fats and waxes. The cotton linter is then go
through bleaching process to obtain high purity cellulose (Heinze, El Seoud and
Koschella, 2018).

14
2.4 Pretreatment Technology in Cellulose Extraction
2.4.1 Autoclaving
Pretreatment of biomass is studied to remove the impurities such as ash and wax before
it is treated for cellulose extraction process. One of the pretreatment is by autoclaving,
whereby it works with the combination of pressure, steam, temperature and time
(Avinash, 2018). Autoclave is a sterilizer that operates at high pressure, thereby
increase the heat content in autoclave and enable the steam to reach high temperature
(Judelson, 2004). In the extraction of cellulose from SCB, a high temperature will
induce the breakage of intramolecular hydrogen bonds of the impurities component,
which is lignin and hemicellulose, thereby solubilised the unwanted component. The
common temperature used in autoclave is 121 oC.
The autoclave provides sterilization and disinfection function. The high
temperature helps to remove contamination and kill microorganism, spore and bacteria
by dehydrating the cell (Avinash, 2018). Autoclave is also used in assist the
determination of carbohydrate and lignin content in rice hull (Martín et al., 2007). On
the other hand, combination of alkaline pretreatment with autoclave at 121 oC for 40
minutes is used to solubilise the lignin and hemicellulose content in coconut husk
(Eduardo et al., 2016). Meanwhile, Wheat straw or wood chips undergo autoclaving
process at 121 oC for 60 minutes to eliminate the germinated spores within the
composition (Kuijk et al., 2016).
2.4.2 Soxhlet Extraction
Soxhlet extraction is used in removing wax, oil and break the chain of hemicellulose
and lignin. It is a continuous extraction whereby the mixture is repeatedly washed with
organic solvent under reflux in a special glassware. There is supply of inert gas in the
setup to prevent oxidation during extraction (Ain and Sukri, 2012).

15
The setup of soxhlet extractor consists of thimble equipped with condenser on
top and connected to conical flask at the bottom. The solid mixture wrapped with small
cloth is placed inside the thimble, in which solvent will pass through the area. A hot
plate is placed at the bottom of the flask to maintain the temperature of solvent at
desired temperature, ensuring the flow of solvent vapour housing the solid mixture.
Meanwhile, solvent vapour that rises up through distillation arm will be cool down by
condenser and drip back to the extraction chamber (Ain and Sukri, 2012). The solvent
will gradually filled up the extraction chamber, resulting in the removal of solvent
through siphon side arms.
The cycle is generally repeated for 6 hours to remove the unwanted component
such as wax, lignin and hemicellulose inside SCB with chloroform/ethanol (2:1, v/v)
as organic solvent (Liu et al, 2006). On the other hand, cornstalk undergo 24 hours of
soxhlet extraction in toluene/ethanol (2:1, v/v) to isolate hemicellulose from the
structure (Shui et al., 2017). Besides that, hexane is used to separate the lipids and
hydrocarbon compound in wheat straw through 6 hours of soxhlet extraction (Naik et
al., 2010). The extraction time is varied according to the type of material being
extracted.
The common organic solvents used in soxhlet extraction are ethanol,
isopropanol, hexane and combination of toluene with ethanol. The solvent used is
based on the polarity of the extracted material. Ethanol and isopropanol are polar
solvent, thus it should be used to extract materials that are less likely soluble in water.
Meanwhile, hexane and toluene are non-polar solvent. They can be used to extract wax
which is non polar, similar properties as them without harming the safety of
environment. Besides that, hexane is relative easy to be removed from the solid and
only require low energy usage due to its low sensible of heat. In addition, it does not
cause great harmful to human skin even expose with long usage time (Anderson,
2018). Soxhlet extraction is normally used as treatment because it gives a good and
even contact between biomass and solvent, enhancing the transfer equilibrium.
Furthermore, the equipment is inexpensive and the temperature of the process can be
maintained, thereby assisting the extraction process (Luque and García-Ayuso, 1998).

16
2.4.3 Steam Explosion
Steam explosion is one of the physicochemical treatment used to treat lignocellulosic
biomass. This treatment process is carried out at high pressure vary from 0.69 MPa to
4.83 MPa and temperature range of 160 oC to 260 oC. (Karp et al., 2013). A sudden
reduce in pressure will result in the explosive decompression of biomass, subsequently
breakdown the lignocellulosic structure. Meanwhile, the high temperature will disrupt
and degrade the hemicellulose and lignin structure within the agriculture biomass.
The factors such as residence time, temperature and pressure of treatment will
affect the steam explosion treatment. A high temperature and short residence time will
assist in hemicellulose solubilisation (Kumar et al., 2009). The studies of Saelee et al.
(2014) on steam explosion treatment of SCB was carried out at temperature of 195 oC
for 15 minutes. It has shown that the initial 44.5 %(w/w) of cellulose content within
SCB have increase to 65.7 %(w/w) after treatment with steam explosion. On the other
hand, the hemicellulose and lignin content have decreases after treatment. It was found
out that the hemicellulose have a larger reduction as compared to lignin since lignin
only undergoes partial hydrolysis and decomposition. The strong interaction of
cellulose fibers with polyphenolic compounds resulting in a lower reduction of lignin
(Saelee et al., 2014).
Steam explosion only needs a lower capital investment and create less
environmental impact to the environment. The common chemicals used in the
treatment are ethanol and 1-2 %(w/v) of sodium hydroxide solution. The quantity
requires are little, thus less hazardous (Avellar and Glasser, 1998). Meanwhile, there
are treatment that does not require any input of chemical. However, there is some
limitation such as the disruption of lignin is incomplete and only small portion of xylan
fraction is removed. In addition, the current reactor available is in batch design, thus
prohibiting treatment in large volume (Jacquet et al., 2015).

17
2.4.4 Liquid Hot Water Treatment
Liquid hot water is cooked under high pressure which allow the penetration of water
into the lignocellulosic biomass. As a result, the hot liquid water percolating through
the lignocellulosic biomass causing solubilisation of hemicellulose and lignin under
high temperature that subsequently leach out the biopolymer (Taherzadeh and Karimi,
2008). Inside the reactor, the operation mode of liquid hot water treatment can be either
in concurrent, countercurrent or flow through configuration (Mosier et al., 2005). It is
environmental friendly hydrothermal treatment since no chemical is required in this
process. In addition, it has high pentosan recovery and less formation of undesired
product due to the high removal of hemicellulose in oligomers form. Generally, this
treatment mainly removes hemicellulose and small amount of lignin (Taherzadeh and
Karimi, 2008).
The high temperature of water enable the breakage of bonding in
lignocellulosic biomass, thereby eliminates the need for size reduction of the
lignocellulosic biomass before the treatment (Mosier et al., 2005). From the studies of
Allen et al. (1996), SCB is completely immersed within the liquid hot water at
temperature of 190 to 230 oC. All hemicellulose with more than 60 % of the acid-
insoluble lignin is solubilised in the water medium. The residence time of the process
can be reduced by adding the hot liquid water into the reactor instead of preheat the
cool water inside the reactor. This treatment enables a better pH control which help to
reduce the formation of inhibitors (Maurya, Singla and Negi, 2015). However, the
large water consumption in the treatment is a major issue that need to be considered.
2.4.5 Wet Oxidation
Wet oxidation is suitable to be used as treatment for lignocellulosic biomass with high
lignin content. The important parameters in this treatment are temperature, oxygen
pressure and reaction time. Typically, the biomass will be treated with water and air
or oxygen at temperature higher than 120 oC with reaction time of 10 to 20 minutes.
Besides that, the air pressure inside the reaction vessel is maintained at 12 bar (Brodeur

18
et al., 2011). Initially, the wet oxidation process will form acid from hydrolytic
process. The increases of acid concentration will cause the breakdown of
hemicellulose into lower molecular weight fragment (Mcginnis, Wilson and Mullen,
1983).
The studies of Martín, Klinke and Thomsen (2007) on wet oxidation treatment
of SCB has shown that the optimum amount of cellulose is obtained at temperature of
195 oC and residence time of 15 minutes in alkali medium with the addition of sodium
carbonate (Na2CO3). The treatment is carried out in alkaline condition, obtaining 70
%(w/w) of cellulose content. On the other hand, the initial 31.1 %(w/w) of
hemicellulose and 11.4 %(w/w) of lignin has reduced to 4.1 %(w/w) and 9.5 %(w/w)
respectively. The phenolic derivatives unit inside lignin are reactive to the wet
oxidation condition. Thus, the high temperature and long residence time with alkaline
medium facilitate the solubilisation of lignin. The alkaline medium also helps to reduce
the formation of toxic by-product such as furaldehydes. Meanwhile, the wet oxidation
at same temperature and residence time but in acidic medium will gives low
hemicellulose fraction as well, on the same time a lower cellulose content since acid
has destruct some of the cellulose, forming by-product such as carboxylic acid.
Besides that, wet oxidation of rice husk at temperature of 195 oC and residence
time of 10 minutes with addition of 1 g sodium carbonate (Na2CO3) has extracted 68.6
%(w/w) of cellulose. The content of lignin and hemicellulose has reduced drastically
under the high pressure and temperature condition (Banerjee et al., 2009).
Furthermore, the cellulose content in wheat straw which undergo wet oxidation at 170
oC and residence time of 10 minutes in alkali medium has increases from 38 %(w/w)
to 74.1 %(w/w). The amount of hemicellulose has reduced half due to its branched
structure which make it unstable during wet oxidation (Bjerre et al., 1996). The
drawback of this treatment is it requires to operate at high temperature and pressure,
leading to high utility and maintenance cost. Besides that, cost of oxygen will need to
be taken into consideration for this treatment (Martín, Klinke and Thomsen, 2007).

19
2.4.6 Acid Hydrolysis Treatment
The chemical treatment used to treat the lignocellulosic biomass includes acid
hydrolysis, alkali hydrolysis and organosolv treatment. The acid hydrolysis treatment
can be performed in concentrated or diluted form to extract the cellulose. The most
common acid used is sulphuric acid, while the other type of acids used are nitric acid,
hydrochloric acid, phosphoric acid and acetic acid. This treatment could carried out at
temperature range of 130 oC to 210 oC, with 0.2 %(w/w) to 2.5 %(w/w) of acid
(Brodeur et al., 2011).
The use of dilute acid is more favourable to be used in industry scale since it
will form less furfural and hydroxymethylfurfural. Besides that, it can avoid the
hydrolysis of hemicellulose into monomers which can subsequently degrades to
furfural (Brienzo et.al., 2016). Meanwhile, concentrated acid treatment is the contrary
of dilute acid treatment as it will form the inhibiting compounds such as furfural and
phenolic acid. The high concentration of acid will cause corrosion problem since it is
toxic and hazardous chemical which need to be handle with care. On the other hand,
dilute acid helps to reduce the occurrence of corrosion problem. Nowadays, the two
common dilute acid treatment process available can be carried out either at high
temperature with a short residence time or low temperature with longer retention time
(Maurya, Singla and Negi, 2015).
The research conducted by Canilha et al. (2011) shows 59.3 %(w/w) of
cellulose, 3.7 %(w/w) of hemicellulose and 33.8 %(w/w) of lignin in 41.7 %(w/w) of
solubilised SCB when immersed in 2.5 M of dilute sulphuric acid at temperature of
150 oC and residence time of 30 minutes. A high reaction rate can be achieved through
dilute acid treatment. It was found that hemicellulose solubilise more rapidly as
compared to lignin. This phenomena happens because dilute acid can easily hydrolyse
acetylated glucuronoarabinoxylan, which present within hemicellulose. Meanwhile,
the lignin still available in a large proportion due to the condensation reactions which
prevent the solubilisation of lignin (Candido, Godoy and Gonçalves, 2012). The
structure of cellulose does not break down since it has high crystallinity. Therefore,
the final product consists of cellulose and lignin will need to undergo further reaction
to obtain pure cellulose (Neureiter et al., 2002). Similar result obtained when corn cobs

20
undergo acid treatment using 5 %(w/v) of sulphuric acid. The amount of cellulose has
increased from 42.75 %(w/w) to 55.37 %(w/w) while 45 %(w/w) of hemicellulose has
decreased to 29.11 %(w/w) as the reaction time increases from 10 to 40 minutes. The
amount of lignin being removed is very low (Ogunbayo, Olanipekun and Babatunde,
2016).
2.4.7 Alkaline Hydrolysis Treatment
Alkaline hydrolysis is the most common treatment used in extraction of cellulose
because less degradation of cellulose occurs (Karp et al., 2013). It commonly uses
sodium hydroxide, potassium hydroxide, ammonium hydroxide and calcium
hydroxide as the treatment agent. It can be carried out at lower temperature and higher
alkali concentration with a longer treatment time (Mosier et al., 2005). Alkali treatment
can alter and degrade ester and glycosidic side chains of lignin without disrupt the
other components, assist the removal of acetyl and uronic acid present in hemicellulose
(Brodeur et al., 2011).
The common alkali used will be sodium hydroxide, NaOH since it has
relatively high alkalinity which can assist the fractionation of lignocellulosic biomass
(Bensah and Mensah, 2013). Dilute NaOH helps to loosen and separate the bonds and
linkage between the lignin, thereby disrupt the lignin structure, providing a bigger
internal surface area which will promotes the intake of water for further disruption of
lignin. This treatment is preferable since it can be carried out in milder condition,
solubilise the lignin without affecting other component (Brienzo et.al., 2016). The
remaining hemicellulose and cellulose can be further separated at room temperature.
In the alkaline treatment developed by Henderson, Champagne and Tudoret
(2003), the extraction of cellulose from SCB can achieved up to 70 %(w/w) by using
0.5 N potassium hydroxide, KOH at temperature of 70 oC with duration of 1 hour. The
process involves the soaking of SCB in the alkaline solution medium and mix it for a
period of time. On the other hand, coconut husk which undergo 5 %(w/v) NaOH alkali
treatment shows the increases of cellulose content from 24.7 %(w/w) to 55.17 %(w/w).

21
The alkali treatment also leads to reduction on its lignin content from 40.1 %(w/w) to
29.91 %(w/w) (Cabral et al., 2016). When wheat straw is pretreated with 1.5 %(w/v)
NaOH, around 60 %(w/w) of lignin content is solubilised and removed (Sun, Lawther
and Banks, 1995).
Recently, treatment with lime has draws the attention of researcher since it only
requires low cost and easily recovered as compared to other alkaline treatment. Besides
that, it can be operated under low temperature and pressure (Chang, Nagwani and
Holtzapple, 1998). Kim (2004) has shown that the lime treatment of corn stover at
temperature range of 25 oC to 55 oC is able to solubilise lignin and hemicellulose
without affecting the cellulose content of material, hence increase the crystallinity of
corn stover. Despite the advantage of lime treatment, there are some drawbacks as
compared to other alkali reagent. Lime is slightly insoluble in water, thus making the
dissolving rate to be lower and more water is needed in the treatment to overcome the
low solubility (Bensah and Mensah, 2013).
2.4.8 Organosolv Treatment
Organosolv treatment utilize organic solvent, with or without acid catalyst to extract
cellulose from lignocellulosic biomass by breaking the internal network of
hemicellulose and lignin. Methanol, acetone and ethylene glycol are the common
solvent used in this treatment process (Kumar et al., 2009). The acid catalyst such as
hydrochloric acid, phosphoric acid and formic acid are added to enhance the
degradation of lignin. Moreover, it enables the treatment to be carried out at
temperature below 180 oC. Low acid concentration will assure the maximum degrade
of lignin with high cellulose content. This treatment assist the extraction of cellulose
while lignin and hemicellulose are separated out from biomass (Zhao, Cheng and Liu,
2009).
Generally, the lignocellulosic biomass is treated with organic solvent at
temperature range of 100-250 oC depending on the presence of catalyst. Then, lignin
is removed and hemicellulose is solubilised along the treatment process. After the

22
treatment, organic solvent will be drained out of the reactor. Since the organic solvent
is expensive, recovery process is needed to recover the solvent, which on the same
time causes consumption of energy. The organic solvent has to be evaporated and
condensed before recycle back to the reactor (Zhao, Cheng and Liu, 2009). However,
the disadvantage of this treatment is that organic solvent has relatively high volatility
that limit the treatment to be conducted in a tight or non-explosive medium.
From the study of Area, Felissia and Vallejos (2009), SCB undergo alkali
pretreatment using NaOH followed by organosolv treatment of ethanol with sulphuric
acid as catalyst. Under optimum condition at temperature of 160 oC and residence time
of 120 minutes, the lignin presence is the lowest. Basically, the crystallinity of treated
SCB is increased as more amorphous lignin and hemicellulose is removed during the
treatment. Besides that, acetone-based organosolv treatment with acetone-water 50:50
%(w/w) conducted on wheat straw at 205 oC has shown a high cellulose recovery of
93 %(w/w), with 79 %(w/w) of lignin is being solubilised (Huijgen, Reith and den Uil,
2010). In the research of Fialho (2015), corn cob in ethanol:water, 50:50 %(w/w) gave
79 %(w/w) of lignin removal and high amount of hemicellulose is solubilised at 190
oC. It is favourable to use low molecular weight alcohol such as methanol and ethanol
as the solvent since it has lower boiling point which can be recovered by simple
distillation with relative lower energy. However, the treatment with ethanol is safer
since it is less hazard compared to methanol (Mesa et al., 2011).
2.4.9 Ultrasonic-assisted Treatment
Ultrasonic-assisted treatment is a mechanical treatment which helps to separate the
component of lignocellulosic biomass and extract mainly the low molecular weight
components. The sonication will induce cavitation, forming bubbles which will grow,
oscillate and split at critical pressure. The collapse of the cavitation bubbles causes
generation of shock wave which carry energy, thereby assist the components of
lignocellulosic biomass to be removed and extracted out (Segneanu et al., 2013).
Lignin and hemicellulose are removed out through homolysis of lignin-carbohydrate
bonds during sonication process (Ur Rehman et al., 2013). The range of frequency of

23
ultrasound is between 20 kHz to 1 GHz. Different frequency will gives different
vibration which propagate at various speed (Gonzalez-Fernandez et.al, 2015).
Usually, the ultrasonic process will be assisted with physical or chemical treatment for
the extraction of cellulose.
Liu et al. (2006) had come out with a research whereby extracting cellulose by
treating the SCB with chlorite followed by ultrasonic irradiation process. The
composition of SCB before pretreatment has 43.6 %(w/w) of cellulose. In the
treatment, sodium chlorite is an alkali added for the removal of hemicellulose from
SCB. Then, SCB undergo ultrasonic process in the presence of 10 %(w/v) potassium
hydroxide, KOH at temperature of 23 oC for 16 hours. The treatment has extracted
57.2 %(w/w) of cellulose. The increases of cellulose amount is due to the presence of
alkali which disrupted the cell wall of SCB and solubilised hemicellulose that present
at outer surface of SCB.
On the other hand, ultrasound-assisted ammonia treatment have been carried
out by Ramadoss and Muthukumar (2014). SCB is added with 10 %(w/v) liquid
ammonia at 80 oC and undergo ultrasonic for 45 minutes. The untreated SCB with 38
%(w/w) of cellulose has increase to 56.1 %(w/w) after the treatment. Ammonia is a
volatile chemical that can break the complex bonds in SCB and degrade molecular
structure of lignin. This treatment gives the benefit of no by-product formation and can
be carried out at moderate temperature. Besides that, the ultrasonic treatment of wheat
straw with 0.5 M KOH for 35 minutes has solubilised 50 %(w/w) of the lignin,
extracting a higher amount of cellulose (Sun and Tomkinson, 2002).
The acceleration of extraction of cellulose during ultrasonic treatment can be
achieved due to the mechanical and chemical effects of ultrasound process. The
extraction efficiency is depending on the frequency, temperature and duration of
ultrasonic process. The frequency of ultrasound at 10 to 100 kHz is ideal in assisting
the degradation and breakage of lignocellulosic biomass (Ur Rehman et al., 2013).
Meanwhile, the temperature of ultrasonic process is dependent on the type of
lignocellulosic biomass. The temperature changes between 20 to 60 oC will not affect
the dynamics of cavitation formed. However, a large uplift of temperature will result

24
in adverse effect of the ultrasonic treatment process, since more volatile components
are formed in the cavity (Prabhu, Gogate and Pandit, 2004). Lastly, different
lignocellulosic biomass has an ideal duration for ultrasonic treatment. The increase of
duration without exceeding the limit helps to increase the delignification of
lignocellulosic biomass, thus increase the extraction of cellulose (Ur Rehman et al.,
2013).
2.5 Production of Carboxymethyl Cellulose (CMC)
The low solubility of treated cellulose in water or organic solvents has reduces its
usage in some of the industrial process. The way to overcome this problem is by further
converting cellulose into its derivative such as carboxymethyl cellulose (CMC) which
is soluble in water due to the presence of hydroxyl and carboxylic groups (Golbaghi,
Khamforoush and Hatami, 2017). It involves a simple and low cost production process.
The process flow for production of CMC is shown in Figure 2.5 which involves two
main reaction steps which are alkalization and etherification.
Figure 2.5: Process Flow for Production of CMC (Shui et al., 2017).
CMC is a linear long chain polysaccharide that is biodegradable and non-toxic.
The physical and chemical properties of CMC are determined by their molecular
weight, the number of carboxymethyl group per anhydroglucose unit (AGU), which is
also known as degree of substitution (DS) and clustering of carboxyl substituent’s in
each polymer chains (Singh and Singh, 2012). The DS will affect CMC solubility,
shearing stability and its rheological behavior (Bono et.al., 2009). A high DS can be
achieved by uplift the concentration of NaOH to 30 %(w/v), whereby causing CMC
has more resistant to degradation. It has extensive usage in various industries such as

25
in pharmaceutical, oil drilling, paint, paper, textile, cosmetics, detergent and food
industries. Table 2.2 shows the application and function of CMC in each of the
industries.
Table 2.2: Application of CMC in Various Industry.
Industry Application Function Reference
Detergent Laundry Anti-dirt agent (Singh and
Singh, 2012)
Food Ice cream Thickener (Lavanya et al.,
2011)
Oil drilling Ingredient of drilling
mud
-Viscosity modifier
-Water retention agent
(Lavanya et al.,
2011)
Pharmaceutical Drug formulation Gelling agent (Shokri and
Adibkia, 2013)
Textile Printing paste Thickener (Fijan et al.,
2009)
During the production of CMC, it will firstly undergo alkalization as shown in
Equation 2.1 by mixing the cellulose powder with isopropanol at different sodium
hydroxide (NaOH) concentration. Isopropanol serves as the function to provide
accessibility of etherifying agent to the reaction centers of cellulose chain. The reaction
efficiency is high when using low polarity solvent such as isopropanol (Toǧrul and
Arslan, 2003). The mixture is then place in water bath and undergo stirring process to
alkalize the cellulose. Sodium hydroxide is able to swollen the cellulose chain, thereby
providing the space for the substitution of sodium carboxymethyl group in cellulose
units (Alizadeh, Mousavi and Labbafi, 2017).
After that, different amount of sodium monochloroacetate (SMCA) is added
and mechanically stirred to initiate the etherification process as shown in Equation 2.2.
A larger amount of SMCA can result in increasing of CMC yield (Huang et al., 2017).

26
SMCA is the reagent that substitutes hydroxyl group at C2, C3 and C6 with sodium
carboxymethyl group (Alizadeh, Mousavi and Labbafi, 2017).The solid residue
formed is filtered and neutralized with acetic acid to remove the leftover NaOH in the
mixture. Next, the CMC formed is being washed with ethanol and filtered to obtain a
pure product. The residual of alcohol is removed by drying in an oven at temperature
range of 60 to 80 oC. The purified CMC will be in white or cream color, tasteless and
odorless. Equation 2.2 also shows the presence of NaCl as by-product during the
production of CMC.
RCellOH + NaOH → RCellOH. NaOH (2.1)
RCellOH. NaOH + ClCH2COONa → RCellOCH2COONa + NaCl + H2O (2.2)
Where,
RCellOH = Cellulose chain
RCellOH.NaOH = Alkali cellulose
ClCH2COONa = Sodium monochloroacetate
RCellOCH2COONa = Carboxymethyl cellulose
NaCl = Sodium chloride

CHAPTER 3
METHODOLOGY
3.1 Research Flow Chart
The feedstock used to extract cellulose in this study is sugarcane bagasse (SCB).
Figure 3.1 presented the research flow chart. At first, SCB was collected and prepared
in powder form for subsequent treatment. Autoclave and reflux pretreatment were
performed and pretreatment resulted higher cellulose content was selected. Then,
pretreated SCB further undergo alkaline ultrasonic-assisted extraction by varying the
ultrasonic amplitude, temperature and concentration of potassium hydroxide solution.
The sample with highest amount of cellulose was further converted to carboxymethyl
cellulose (CMC) through alkalization and etherification process. Characterization of
SCB, treated SCB and CMC were carried out to determine its properties.

28
Figure 3.1: Research Flow Chart.
Preparation of sugarcane bagasse (SCB) powder
Characterization of SCB: FTIR, DSC, HPLC
Pretreatment
Drying
Alkaline ultrasonic-assisted treatment
Purification and drying
Alkalization
Characterization of treated SCB: FTIR, DSC, HPLC
Etherification
Purification and drying
Characterization of CMC: FTIR, DSC, Degree of substitution

29
3.2 Material and Chemicals
Table 3.1: Chemical Used in the Research.
Chemical Source Purity
Ethanol HmbG Chemicals, UK 95-98 %
Glycerol R&M Chemicals, UK 99.8 %
Hydrochloric acid Qrec, Johor 37 %
Methanol Merck, UK 99.9 %
Nitric acid Merck, UK 70 %
Potassium hydroxide R&M Chemicals, UK -
Sodium hydroxide R&M Chemicals, UK -
Sodium monochloroacetate
(SMCA)
Merck, UK 98 %
Sulphuric acid R&M Chemicals, UK 95-98 %
Isopropanol Parchem, Singapore 99.5 %
3.3 Preparation of Sugarcane Bagasse Powder
The sugarcane bagasse (SCB) was collected from Kampar, Perak and cleaned before
cut into small pieces. It was then dried in an oven overnight at 60 oC. The mass of the
SCB was weighed and drying process continues until achieved a constant mass. Then,
the dried SCB was ground and crushed to powder using a crusher and a mortar. After
that, the grounded powder will be filtered to 18 mesh size. The SCB powder obtained
will be stored in an air-tight container to preserve in dry condition.

30
3.4 Pretreatment of SCB
Approximate 10 g of dried SCB powder were undergo pretreatment to remove wax
and small amount of lignin and hemicellulose by refluxing in 500 ml of 95-98 %(v/v)
ethanol at 80 oC for 2 hours. Figure 3.2 shows the set-up of the refluxing process. Then,
it was washed with distilled water and dried in the oven at 60 oC for 16 hours.
Figure 3.2: Reflux Pretreatment Setup.
On the other hand, another pretreatment was studied to determine the ideal
pretreatment for extraction of cellulose from SCB. 10 g of the dried and ground SCB
were added into Scott bottle with 200 ml of distilled water. Then, it was placed inside
autoclave machine and treated for 30 minutes at 120 oC (Abo-State et al., 2013). Next,
the treated SCB was filtered and the precipitate was dried in the oven at 60 oC for 16
hours.

31
3.5 Treatment for Extraction of Cellulose from SCB
Ultrasonic-assisted alkali treatment as shown in Figure 3.3 was used to extract the
cellulose from SCB. Firstly, 5 g of pretreated SCB was added into beaker containing
150 ml of potassium hydroxide (KOH) solution. The duration of ultrasonic treatment
was fixed to 30 minutes. Meanwhile, the manipulated parameters in this research are
the amplitude of ultrasonic homogenizer, treatment temperature and concentration of
potassium hydroxide. For each 10 minutes interval, the beaker was taken out from the
ultrasonic homogenizer and heated with a heating plate to its desired temperature with
the purpose to overcome the inconsistency of the temperature during the treatment.
There were 11 sets of experiments conducted by varying one of the
manipulated parameter while the other two parameters were fixed. First investigated
parameter was ultrasonic amplitude at 20 %, 30 % and 40 % as shown in Table 3.2
while the treatment temperature and KOH concentration were fixed at 80 oC and 0.75
M respectively. Meanwhile, Table 3.3 shows the treatment temperature was being
manipulated at 70 oC, 80 oC and 90 oC, with ultrasonic amplitude of 30 % and 0.75 M
of KOH were fixed along the process. Concentration of potassium hydroxide solution
was manipulated within the range of 0.25 M to 1.25 M, with interval of 0.25 M as
tabulated in Table 3.4. Ultrasonic amplitude of 30 % with temperature of 80 oC were
constant when concentration of KOH was varied.
Figure 3.3: Ultrasonic Homogenizer Equipment Setup.

32
Table 3.2: Treatment at Various Amplitudes by Using Ultrasonic Homogenizer.
Experiment
No.
SCB (g) Temperature
(oC)
Concentration of
potassium
hydroxide (M)
Amplitude
(%)
1 5 80 0.75 20
2 5 80 0.75 30
3 5 80 0.75 40
Table 3.3: Treatment at Various Temperatures by Using Ultrasonic Homogenizer.
Experiment
No.
SCB (g) Temperature
(oC)
Concentration of
potassium
hydroxide (M)
Amplitude
(%)
4 5 70 0.75 30
5 5 80 0.75 30
6 5 90 0.75 30
Table 3.4: Treatment at Various Potassium Hydroxide Solution Concentration.
Experiment
No.
SCB (g) Temperature
(oC)
Concentration of
potassium
hydroxide (M)
Amplitude
(%)
7 5 80 0.25 30
8 5 80 0.5 30
9 5 80 0.75 30
10 5 80 1.0 30
11 5 80 1.25 30
After the treatment process, the mixture was stirred at 900 rpm for 10 minutes.
Then, it was washed continuously for 3 times with 200 ml distilled water to remove
the potassium hydroxide and soluble extractives products. After that, the residue was
dried in the oven at 60 oC for 16 hours. The dried treated SCB was weighted and the
yield of treated SCB was calculated using Equation 3.1.
33
𝑌𝑖𝑒𝑙𝑑 𝑜𝑓 𝑡𝑟𝑒𝑎𝑡𝑒𝑑 𝑆𝐶𝐵 (%) = 𝑤𝑒𝑖𝑔ℎ𝑡 𝑜𝑓 𝑡𝑟𝑒𝑎𝑡𝑒𝑑 𝑆𝐶𝐵 (𝑔)
𝑤𝑒𝑖𝑔ℎ𝑡 𝑜𝑓 𝑆𝐶𝐵 𝑢𝑠𝑒𝑑 (𝑔) 𝑥 100 % (3.1)
Characterization tests including FTIR, HPLC and DSC were carried out to
study the properties of treated SCB.
3.6 Synthesis of CMC from Cellulose
Firstly, 5 g of cellulose powder was added with 100 ml of isopropanol into Scott bottle.
Then, it undergoes alkalization process by addition of 10 ml of 17.5 %(w/v) NaOH
drop wise and let it stirred for 1 hour at ambient temperature. Next, 6 g of SMCA was
added into the mixture with continuous stirring for 2 hours in water bath with
temperature maintaining at 50 oC. The mixture obtained is then filtered and purified
with hot ethanol for 3 times to remove undesired product. After that, the mixture was
filtered with 200 ml of methanol. The obtained CMC was dried in an oven at 60 oC
(Bono et al., 2009). After that, it was weighted and the yield of CMC was calculated
using Equation 3.2.
𝑌𝑖𝑒𝑙𝑑 𝑜𝑓 𝐶𝑀𝐶 (%) = 𝑤𝑒𝑖𝑔ℎ𝑡 𝑜𝑓 𝑑𝑟𝑖𝑒𝑑 𝐶𝑀𝐶 (𝑔)
𝑤𝑒𝑖𝑔ℎ𝑡 𝑜𝑓 𝑐𝑒𝑙𝑙𝑢𝑙𝑜𝑠𝑒 𝑢𝑠𝑒𝑑 (𝑔) 𝑥 100 % (3.2)
3.7 Characterization of SCB, treated SCB and CMC
3.7.1 Fourier Transform Infrared Spectroscopy (FTIR)
FTIR serves as the function in determining the functional groups changes within a
biopolymer substance (Alizadeh, Mousavi and Labbafi, 2017). In the research, FTIR
spectrophotometer helps to identify functional group presence in SCB by mixing 1 %
of dried ground sample with potassium bromide (KBr) to produce pellets (Zhang et
al., 2013). Then, each spectrum with step size of 4 cm-1 was collected for 28 scans.

34
The recorded infra spectra was in the wavelength range of 400 to 4000 cm-1 (Singh and
Singh, 2012). Samples that tested using FTIR includes grounded SCB, treated SCB
and CMC.
3.7.2 Differential Scanning Calorimeter (DSC) Analysis
DSC is a type of thermal analysis that identify the changes of heat capacity of SCB
with temperature. This analysis allows the determination of melting and phase change
transition of lignocellulosic biomass. About 3 to 10 mg of SCB powder were sealed in
an aluminium crucible covered with lid at atmospheric pressure and flushed with ultra-
pure dry nitrogen at flow rate of 10 ml/min. The sample was then heated from 25 to
500 oC at heating rate of 10 oC/min. The scale for temperature and energy used in DSC
equipment were calibrated using iridium (Filho et al., 2007). This analysis was also
performed for treated SCB and CMC.
3.7.3 High Performance Liquid Chromatography (HPLC) for Carbohydrate
Content Analysis
HPLC helps in determining the amount of simple sugar units in solution (Käuper et
al., 1998). The analysis started by hydrolysing 300 mg of treated SCB with 3 ml of 72
%(v/v) sulphuric acid in a 30 oC water bath maintaining at 30 oC for 1 hour. Continuous
stirring is keep constant along the hydrolysing process. After that, mixture was diluted
with 84 ml of deionised water. Then, the mixture was autoclaved at 121 oC for 1 hour
(Nuno and Carvalho, 2009). The mixture was neutralised with 2 ml of 1 M of sodium
hydroxide solution at low temperature for complete precipitation of H2SO4. The
neutralized solution was centrifuged for 15 minutes. Then, the supernatant is diluted
with distilled water before filter with syringe filter. The obtained solution was analysed
by using HPLC that equipped with ion exchange, Bio-Rad Organic Acid (H+ form)
column which operates at 60 oC. The concentration of H2SO4, 0.005 M was used as
mobile solution with pump flow rate of 0.6 ml/min (Heinze and Pfeiffer, 1999).

35
3.7.4 Film Preparation
Firstly, 1 g of CMC is added into 50 ml of distilled water at 70 oC until it is fully
solubilised in it. Then, 0.5 ml of glycerol is added as a plasticizer and stirred for 10
minutes at 70 oC. The film solution is then cooled down to ambient temperature and
cast onto a petri dishes. Film solution is then evaporated at room temperature for 36
hours and the film is obtained (Tufan et al., 2016).
3.7.5 Determination of Degree of Substitution (DS) of CMC
Degree of substitution is the measurement on amount of hydroxyl group in cellulose
which replaced by carboxymethyl group of SMCA. Firstly, 1 g of CMC was mixed
with 50 ml of 95 %(v/v) ethanol. Then, 5 ml of 2 M nitric acid was added into the
mixture and agitated for 10 minutes. Next, the mixture was heated for 5 minutes and
stirred further for 15 minutes. The mixture was then left to settle. It was filtered and
washed with 100 ml of hot ethanol for 3 times. After that, the precipitate was washed
with 50 ml of methanol. The final product was dried in an oven at 105 oC for 3 hours.
After drying, about 0.5 g of CMC was added into 100 ml of water in a 250 ml
Erlenmeyer flask and stirred. Then, 25 ml of 0.3 M NaOH was added and boiled for
20 minutes. Finally, the mixture was titrated with 0.3 M of HCl by using
phenolphthalein as the indicator (Tufan et al., 2016). HCl was added until the indicator
colour changes from pink to colourless. The amount of HCl solution used was
recorded. Equation 3.3 and 3.4 show the calculation for degree of substitution.
𝐷𝑒𝑔𝑟𝑒𝑒 𝑜𝑓 𝑆𝑢𝑏𝑠𝑡𝑖𝑡𝑢𝑡𝑖𝑜𝑛 = 0.162 𝑥 𝐴
1 − 0.058 𝑥 𝐴 (3.3)
𝐴 =𝐵𝐶 − 𝐷𝐸
𝐹 (3.4)
Where, B = Volume of NaOH added in ml,
C = Concentration of NaOH added,
D = Volume of HCl consumed in ml,
E = Concentration of HCl added,
F = Weight of sample used in g.

CHAPTER 4
RESULTS AND DISCUSSION
4.1 SCB Characterization
Sugarcane bagasse is the feedstock used for extraction of cellulose. The characteristics
of SCB were determined through fourier-transform infrared (FTIR)
spectrophotometer, differential scanning calorimetry (DSC) and high performance
liquid chromatography (HPLC). FTIR testing is used to determine the functional group
of SCB as shown in Figure 4.1.
The large absorption band shown at 3432 cm-1 indicates the axial deformation
of O-H group in SCB due to presence of carbohydrates and lignin (Mothé and De
Miranda, 2009). The peak at 2928 cm-1 is characterised as symmetrical stretching of
C-H group. At 2367 cm-1, the band is attributed to asymmetric stretching of CO2. On
the other hand, the band at 1723 cm-1 belongs to stretching vibration of carbonyl bond
C=O of hemicellulose. The carbonyl stretching of C=C bond with aromatic ring of
lignin produces a peak at 1628 cm-1 (Viera et al., 2007). These bands are commonly
found in lignin structure. The small band at 1440 cm-1 is associated to CH2 symmetric
bending of lignin (Liu et al., 2006). Meanwhile, the band at 1375 cm-1 is in connection
with deformation of C-H in polysaccharides (J. X. Sun, Xu, et al., 2004). The peak at
1247 cm-1 originates from C-O stretching of aryl group in lignin (Le Troedec et al.,
2008). Moreover, the C-O-C asymmetric stretching due to pyranose ring skeletal
vibration of cellulose and hemicellulose is seen at 1150 cm-1 (Yang et al., 2007). The
band intensity at 1053 cm-1 arises from O-H symmetric stretching of primary alcohol.
The region at 910 cm-1 represents β-glycosidic linkage between glucose in cellulose.

37
It is contributed by the deformation of glycosidic C-H bonds and OH bending (Liu et
al., 2006). There are many weak peaks presence in between 880 and 600 cm-1 which
refers to the aromatic structure of the components (Varma and Mondal, 2016). The
absorption band at 828 cm-1 is corresponds to the aromatic C-H deformations (J. X.
Sun, Xu, et al., 2004).
Figure 4.1: FTIR Spectra of Raw Sugarcane Bagasse.
DSC is used to determine the thermal degradation behaviour of lignin,
hemicellulose and cellulose in SCB. It was being conducted at heating rate of 10
oC/min with nitrogen gas flow rate of 10 ml/min. The specific enthalpy of SCB
observed in Figure 4.2 is -373.76 J/g with temperature peak of 57.11 oC. This
endothermic peak indicates the removal of moisture due to heating of the sample. The
elimination of moisture normally occurred at temperature below 100 oC (Mandal and
Chakrabarty, 2011). The enthalpy of SCB was represented by the integral area of the
first endothermic peak, which is -373.76 J as presented in Figure 4.2. The high
enthalpy is attributed to the large amount of amorphous region in SCB.
Meanwhile, the second endothermic peak presents in 344.80 oC refers to the
decomposition of cellulose in SCB (Ramajo-escalera et al., 2006). It was within the
cellulose thermal decomposition range of 300-375 oC for most of the organic biomass
4000.0 3600 3200 2800 2400 2000 1800 1600 1400 1200 1000 800 600 400.0
56.00
56.5
57.0
57.5
58.0
58.5
59.0
59.5
60.0
60.5
61.0
61.5
62.0
62.5
63.0
63.5
64.0
64.5
65.0
65.5
66.0
66.5
67.0
67.5
68.00
cm-1
%T
SCB
3432
2928
2367 2345
1628
1053
1723
1375
1440
1247
1159
910 828
855

38
product (Chen, 2014). An exothermic peak present at 324 oC was corresponded to the
charring process of lignin due to its aromatic structure (Yang et al., 2007).
Figure 4.2: DSC Thermograph of SCB.
HPLC helps to carry out the qualitative analysis and quantitative determination
of monosaccharide content such as xylose, dextrose, glucose, galactose and arabinose
in SCB (Lavarack, Griffin and Rodman, 2002). The prepared dextrose, xylose and
arabinose solution at various concentration of 0.2 g/L, 0.4 g/L, 0.6 g/L, 0.8 g/L and 1.0
g/L were injected into HPLC to determine its retention time and HPLC area as shown
in Appendix C, D and E respectively. From Appendix C, the dextrose retention time
is within 10.004 minutes to 10.012 minutes. As for xylose, the area peak is prominent
at retention time of 10.628 minutes to 10.634 minutes as presented in Appendix D.
The retention time of arabinose shown in Appendix E is in the range from 11.376
minutes to 11.898 minutes. On the other hand, Appendix C, D and E also show the
preparation of the calibration curve for dextrose, xylose and arabinose. The sugar
content can be detected through refractive index detector.
Since cellulose is a polysaccharide which insoluble in water, it needs to be
converted into dextrose through acid hydrolysis process at high temperature of 121 oC
for 1 hour (Öhgren et al., 2007). Cellulose composition could be calculated through
analysis in HPLC column based on the dextrose content. Meanwhile, xylose is the
Integral -224.07 mJ normalized -224.07 Jg^-1 Onset 328.21 °C Peak 344.80 °C Endset 370.36 °C Left Limit 326.90 °C Right Limit 376.96 °C Heating Rate 10.00 °Cmin^-1
Integral -373.76 mJ normalized -373.76 Jg^-1 Onset 26.02 °C Peak 57.11 °C Endset 84.32 °C Left Limit 26.05 °C Right Limit 109.13 °C Heating Rate 10.00 °Cmin^-1
SCB, 15.03.2019 10:09:19 SCB, 1.0000 mg
mW
-2.0
-1.5
-1.0
-0.5
0.0
0.5
1.0
min °C 40 60 80 100 120 140 160 180 200 220 240 260 280 300 320 340 360 380 400 420 440 460 480
0 2 4 6 8 10 12 14 16 18 20 22 24 26 28 30 32 34 36 38 40 42 44 46
^exo SCB 15.03.2019 10:53:42
Lab: METTLER

39
dominant monosaccharide component presence in hemicellulose of SCB (Brienzo et
al., 2016). Besides that, hemicellulose also composed of arabinose which bonded to
the backbone of xylose (Lavarack, Griffin and Rodman, 2002). As for lignin, it can be
in soluble or insoluble form. Since HPLC can only analyse and detect the solubilised
reducing sugar, the soluble lignin is estimated based on the xylose and arabinose
content.
In Figure 4.3, the dextrose peak presents at 10.008 minutes gives an area of
169801. The retention time is within the range of the standard retention time of
dextrose obtained in Appendix C. From calculation in Appendix F, the dextrose
content in SCB is 41.01 %(w/w), which means there is 0.1230 g of dextrose component
in 0.3 g of SCB. Besides that, 17.65 %(w/w) of xylose at retention time of 10.636
minutes is observed and small amount of arabinose about 5.56 %(w/w) which hardly
be seen in Figure 4.3 is detected at retention time of 11.443 minutes. The amount of
cellulose present in the SCB used in this research is 41.01 %(w/w), within the range
of 40 to 50 %(w/w) of cellulose present in SCB that is being used by Mandal and
Chakrabarty (2011) in their research. Moreover, Table 4.1 reveals the total
carbohydrate content for SCB is 64.22 %(w/w), matches the SCB carbohydrate content
of 60 to 80 %(w/w) as studied by Ramadoss and Muthukumar (2014).
Figure 4.3: HPLC Chromatogram of SCB.

40
Table 4.1: Carbohydrate Content of SCB Based on HPLC Analysis.
Dextrose
%(w/w)
Xylose
%(w/w)
Arabinose
%(w/w)
Total
carbohydrate
%(w/w)
SCB 41.01 17.65 5.56 64.22
4.2 Comparison between Autoclave and Reflux Pretreatment
The SCB was first pretreated with autoclave or reflux to remove traces amount of
minerals, impurities and wax within the structure before undergoing ultrasonic
treatment. According to Table 4.2, the yield of pretreated SCB is higher in autoclave
treatment, which is 94.52 %(w/w) as compared to SCB treated in reflux.
Table 4.2: Yield of Pretreated SCB.
Pretreatment Mass of SCB before
pretreatment (g)
Mass of SCB after
pretreatment (g)
Yield of pretreated
SCB %(w/w)
Autoclave 10.0005 9.4524 94.52
Reflux 10.0000 8.8529 88.53
FTIR spectra in Figure 4.4 shows that the peaks presence for autoclave and
reflux pretreatment were similar to SCB. There is still presence of peak at 1253 cm-1,
small intensity of absorption band at wavelength of 1438 cm-1 and 1730 cm-1,
indicating the pretreatment does not fully solubilised hemicellulose and lignin in SCB.
The assignment of absorption band for both pretreatment are summarised in Table 4.3.

41
Figure 4.4: FTIR Spectra of SCB Pretreated with Autoclave and Reflux.
Table 4.3: Assignment of Absorption Band in Autoclave and Reflux SCB (Liu et al.,
2006; Viera et al., 2007).
Wavenumber (cm-1) Vibration
Autoclave Reflux
3422 3422 axial deformation of O-H group
2929 2929 symmetrical stretching of C-H group
2364 2368 asymmetric stretching of CO2
1730 1723 stretching of C=O
1636 1637 carbonyl stretching of C=C bond with
aromatic ring
1438 1438 CH2 symmetric bending of lignin
1253 1253 C-O stretching of aryl group
1165 1161 C-O-C asymmetric stretching
1053 1053 C-O symmetric stretching of primary
alcohol
663 607 C-OH out of plane bending
4000.0 3600 3200 2800 2400 2000 1800 1600 1400 1200 1000 800 600 400.0
46.5
48
49
50
51
52
53
54
55
56
57
58
59
60
61
62
63
64
65
66
67
68
69
70
71.2
cm-1
%T
Autoclave pretreatment
Reflux pretreatment
3422
2929
2364
2345
1626
1253
1165
1053
663
3422
2929 2368 2345
1637
1253
1161
1053
607
1730
1723
1438
1438

42
Since the treatment of SCB with autoclave and reflux did not fully remove the
hemicellulose and lignin content in SCB, it further undergoes ultrasonic treatment to
enhance the extraction of cellulose. During ultrasonic treatment, the ultrasonic
amplitude of 30 %, treatment temperature of 80 oC with KOH concentration of 0.75
M were fixed along the treatment. Table 4.4 shows the yield of treated SCB with reflux
pretreatment and ultrasonic-assisted alkali treatment is slightly higher compared to
autoclave pretreatment with ultrasonic-assisted alkali treatment. FTIR, DSC and
HPLC analysis are carried out to determine the exact composition of treated SCB.
Table 4.4: Yield of treated SCB after ultrasonic-assisted alkali treatment.
Pretreat
method
Mass of SCB before
ultrasonic treatment
(g)
Mass of SCB after
ultrasonic treatment
(g)
Yield of treated
SCB %(w/w)
Autoclave 5.0012 2.3171 46.33
Reflux 5.0014 2.4557 49.10
FTIR analysis in Figure 4.5 has shown a similar absorption band for both
treatment method. It can be seen that the peak at 1723 cm-1 and 1247 cm-1 present in
SCB have disappeared in treated SCB samples, indicating removal of lignin and
hemicellulose during the ultrasonic treatment (Viera et al., 2007). On the other hand,
a small intensity of absorption band at 1435 cm-1 is still presence after refluxed
treatment, revealing that there is still presence of insoluble lignin after reflux treatment.
The vibration band at 1105 cm-1 is due to the C-O-C glycol ether band stretching
(Corrales et al., 2012). It is also refers to crystalline cellulose (Zhang et al., 2013). The
other absorption band presence is similar as SCB, which can be found in Table 4.5.

43
Figure 4.5: FTIR Spectra of Autoclave or Reflux SCB with Ultrasonic Treatment.
Table 4.5: Assignment of Absorption Band in SCB, Autoclave or Reflux SCB with
Ultrasonic Treatment (Liu et al., 2006; Viera et al., 2007).
Wavenumber (cm-1) Vibration
SCB Autoclave Reflux
3432 3431 3422 axial deformation of O-H group
2928 2928 2927 symmetrical stretching of C-H group
2367 2345 2345 asymmetric stretching of CO2
1723 - - stretching vibration of C=O
1628 1608 1608 carbonyl stretching of C=C bond with
aromatic ring
1440 - 1435 CH2 symmetric bending of lignin
1375 1378 1376 C-H deformation
1247 - - C-O stretching of aryl group
- 1105 1105 C-O-C stretching
1053 1052 1054 C-O symmetric stretching of primary
alcohol
910 900 897 β-glycosidic linkage
- 611 607 C-OH out of plane bending
4000.0 3600 3200 2800 2400 2000 1800 1600 1400 1200 1000 800 600 400.0
52.0
53
54
55
56
57
58
59
60
61
62
63
64
65
66
67
68.0
cm-1
%T
Autoclave with ultrasonic
Reflux with ultrasonic
3422
2927
2345
2105
1608
1054
607 897
1105
1376
3431
2928
2369
2345
1608
1052
611
900
1105
1378
1435

44
From the DSC graph in Figure 4.6, the SCB sample which undergo autoclave
treatment with ultrasonic extraction has peak temperature of 68.72 oC with specific
enthalpy of -204.34 J/g. On the other hand, the peak temperature for SCB sample with
reflux and ultrasonic treatment is 77.54 oC. The endotherm temperature for water
desorption process in reflux treatment is higher, portraying the increase of amorphous
content in SCB (Lee, Wahit and Othman, 2015). Besides that, the specific enthalpy of
reflux treatment sample is -242.43 J/g, higher than the value obtained from autoclave
treatment sample. The larger area of endothermic peak denotes presence of larger
fraction of amorphous cellulose. The water absorption capability in cellulose is
dependent on the availability of the free hydroxyl groups. Thus, water absorption
occurs in amorphous region of cellulose, disregard the presence of free hydroxyl group
on the surface of the crystallites (Bertran and Dale, 1986).
The second endothermic peak is observed for autoclave treatment sample.
From Table 4.6, the endothermic peak temperature at 352.56 oC is associated with the
thermal degradation of cellulose attributed by the breakage of glycosidic bond (Lee,
Wahit and Othman, 2015). The second endothermic peak indicates the presence of
crystalline cellulose in the sample (Poletto, 2016). Meanwhile, the second peak is
insignificant for reflux treatment sample mainly due to the large portion of amorphous
cellulose in the treated sample as shown in the first endothermic peak area.
Figure 4.6: DSC Thermograph of Autoclave or Reflux SCB with Ultrasonic
Treatment.
Sample: Reflux , 4.0000 mg
Sample: Autoclave , 3.0000 mg
mW
-3
-2
-1
0
1
2
min °C 40 60 80 100 120 140 160 180 200 220 240 260 280 300 320 340 360 380 400 420 440 460 480
0 2 4 6 8 10 12 14 16 18 20 22 24 26 28 30 32 34 36 38 40 42 44 46
^exo
Lab: METTLER

45
Table 4.6: DSC Thermograms of Autoclave or Reflux SCB with Ultrasonic
Treatment.
Treatment
method
1st Endothermic peak 2nd Endothermic peak
To, oC Tp,
oC Δh, J/g To, oC Tp,
oC Δh, J/g
Autoclave 31.04 68.72 -204.34 325.99 352.56 -41.88
Reflux 35.84 77.54 -242.43 - - -
To - Onset temperature, Tp - Peak temperature, Δh - Specific enthalpy
After SCB undergoes autoclave or reflux pretreatment with ultrasonic
treatment, it was clearly seen that there is a drastic increase in cellulose content as
compared to the raw SCB. The cellulose content is 41.01 %(w/w) in untreated SCB.
When SCB undergoes autoclave or reflux with ultrasonic treatment, cellulose content
of 75.83 %(w/w) and 72.86 %(w/w), respectively are obtained. Autoclave operates at
high temperature and pressure can help to remove the impurities and decrease lignin
content in SCB (Giraud, Fonty and Besle, 1997). On the other hand, SCB refluxed
with ethanol aids in extracting the wax found on the surface of SCB, thereby enhance
the extraction of cellulose (Qi et al., 2016). Table 4.7 presented autoclaved SCB with
ultrasonic treatment has higher yield in term of cellulose as compared to refluxed SCB
with ultrasonic treatment while the large amount of arabinose in refluxed SCB
portrayed the presence of highly branching xylan chains in SCB (Sun et al., 2004).
This comparison concluded that autoclave pretreatment is more effective in assisting
ultrasonic treatment to extract cellulose from SCB.
Table 4.7: Carbohydrate Content of Treated SCB Based on HPLC Analysis.
Treatment Method Dextrose
%(w/w)
Xylose
%(w/w)
Arabinose
%(w/w)
Total
carbohydrate
%(w/w)
Autoclave +
ultrasonic-assisted
alkaline treatment
75.83 12.97 4.08 92.89
Reflux +
ultrasonic-assisted
alkaline treatment
72.86 15.89 7.20 95.94

46
FTIR spectra for both autoclave and reflux pretreatment followed by
ultrasonic-assisted alkali treatment have shown the disappearing of peak for carbonyl
bond C=O of hemicellulose and C-O stretching of aryl group in lignin. However there
is still small intensity of absorption band for CH2 symmetric bending of lignin exist in
refluxed SCB. Besides, DSC thermograph of sample with autoclave pretreatment and
further ultrasonic-assisted alkali treatment indicates larger portion of crystalline
cellulose. Autoclave followed with ultrasonic treatment also provide a higher amount
of extracted cellulose as observed in HPLC analysis, whereby the pretreatment
medium required in autoclave is water, cheaper as compared to reflux treatment which
require ethanol as the solvent. Thus, autoclave is chosen as the pretreatment process
for SCB before it undergo ultrasonic extraction process.
4.3 Effect of Ultrasonic Amplitude on Pretreated SCB
The ultrasonic homogenizer is operated at frequency of 20 kHz and power of 500 W.
The frequency is within the range of 10 to 100 kHz recommended by Gogate, Sutkar
and Pandit (2011) for the breakage of biomass bonding and degradation of biopolymer.
Based on Table 4.8, the yield of treated SCB at ultrasonic amplitude of 40 %,
temperature of 80 oC and KOH concentration of 0.75 M is the highest, 53.95 %(w/w).
Table 4.8: Yield of Treated SCB at Various Ultrasonic Amplitude.
Amplitude
(%)
Mass of SCB before
treatment (g)
Mass of SCB after
treatment (g)
Yield of treated
SCB %(w/w)
20 5.0008 2.3893 47.78
30 5.0000 2.3870 47.74
40 5.0004 2.6975 53.95
Figure 4.7 shows a similar FTIR spectra peak of 3 samples treated at ultrasonic
amplitude of 20 %, 30 % and 40 %. However, for sample treated at ultrasonic
amplitude of 20 % and 40 %, the absorption band at 1607 cm-1 and 1600 cm-1 reveal
the C=C stretching of aromatic ring in lignin (Kline et al., 2010). Meanwhile, the peak

47
of 1625 cm-1 exists in sample treated in ultrasonic amplitude of 30 % refers to O-H
bond of cellulose structure (Golbaghi, Khamforoush and Hatami, 2007). Table 4.9
summarizes the functional group and type of vibration for each band presence in the
FTIR spectra.
Figure 4.7: FTIR Spectra of Treated SCB at Various Ultrasonic Amplitude.
Table 4.9: Assignment of Absorption Band in Treated SCB at Various Ultrasonic
Amplitude (Liu et al., 2006; Viera et al., 2007).
Amplitude Functional
group
Type of vibration
20 % 30 % 40 %
3422 3432 3422 O-H Stretching
2927 2928 2928 C-H Symmetric stretching
2373 2345 2367 CO2 Asymmetric stretching
1607 - 1600 C=C Symmetric stretching
- 1625 - O-H Bending
1054 1055 1054 C-O Symmetric stretching
897 898 897 - β-glycosidic linkage
4000.0 3600 3200 2800 2400 2000 1800 1600 1400 1200 1000 800 600 400.0
48.0
49
50
51
52
53
54
55
56
57
58
59
60
61
62
63
64
65
66
67
68
69
70.0
cm-1
%T
Amplitude: 20 %
Amplitude: 40 %
Amplitude: 30 %
3422
2373 2345 1607
1054
2927
897
3432
2928
2345 2139
1625
1055
608
893
3422
2928
2367 2345
1600
1054
618
897
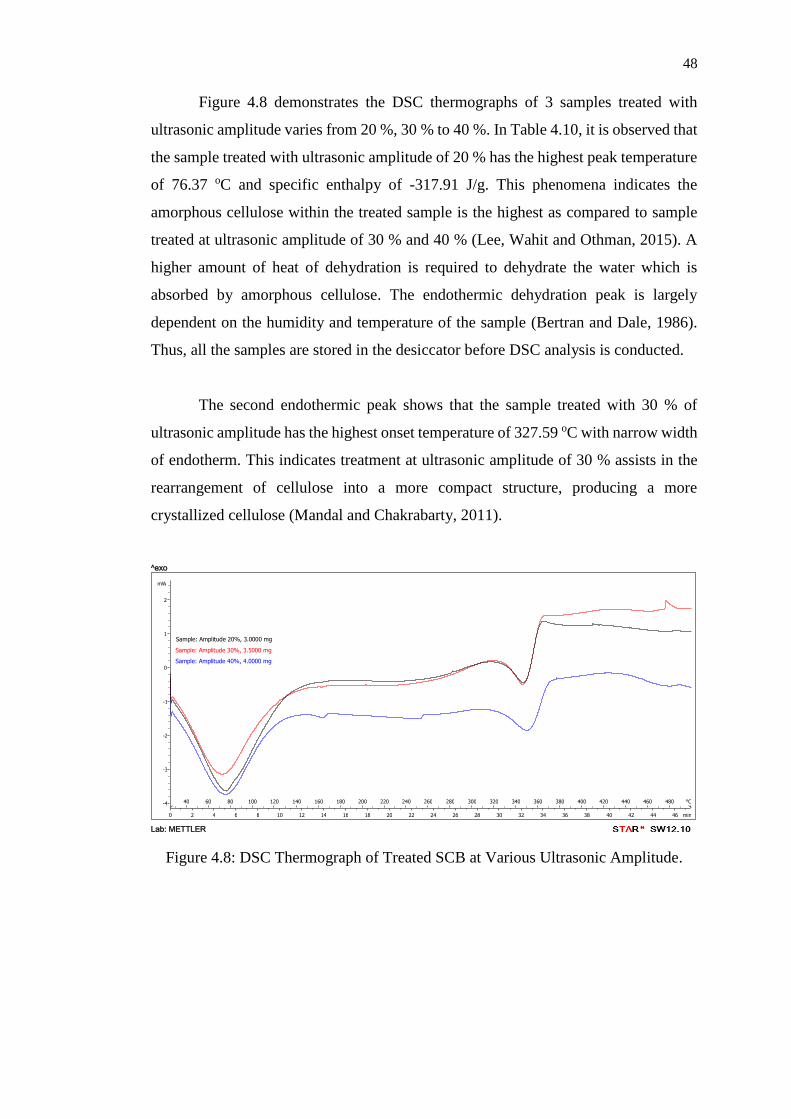
48
Figure 4.8 demonstrates the DSC thermographs of 3 samples treated with
ultrasonic amplitude varies from 20 %, 30 % to 40 %. In Table 4.10, it is observed that
the sample treated with ultrasonic amplitude of 20 % has the highest peak temperature
of 76.37 oC and specific enthalpy of -317.91 J/g. This phenomena indicates the
amorphous cellulose within the treated sample is the highest as compared to sample
treated at ultrasonic amplitude of 30 % and 40 % (Lee, Wahit and Othman, 2015). A
higher amount of heat of dehydration is required to dehydrate the water which is
absorbed by amorphous cellulose. The endothermic dehydration peak is largely
dependent on the humidity and temperature of the sample (Bertran and Dale, 1986).
Thus, all the samples are stored in the desiccator before DSC analysis is conducted.
The second endothermic peak shows that the sample treated with 30 % of
ultrasonic amplitude has the highest onset temperature of 327.59 oC with narrow width
of endotherm. This indicates treatment at ultrasonic amplitude of 30 % assists in the
rearrangement of cellulose into a more compact structure, producing a more
crystallized cellulose (Mandal and Chakrabarty, 2011).
Figure 4.8: DSC Thermograph of Treated SCB at Various Ultrasonic Amplitude.
Sample: Amplitude 40%, 4.0000 mg
Sample: Amplitude 30%, 3.5000 mg
Sample: Amplitude 20%, 3.0000 mg
mW
-4
-3
-2
-1
0
1
2
min °C 40 60 80 100 120 140 160 180 200 220 240 260 280 300 320 340 360 380 400 420 440 460 480
0 2 4 6 8 10 12 14 16 18 20 22 24 26 28 30 32 34 36 38 40 42 44 46
^exo
Lab: METTLER

49
Table 4.10: DSC Thermograms of Treated SCB at Various Ultrasonic Amplitude.
Ultrasonic
amplitude, %
1st Endothermic peak 2nd Endothermic peak
To, oC Tp,
oC Δh, J/g To, oC Tp,
oC Δh, J/g
20 32.60 76.37 -317.91 326.44 348.31 -56.97
30 31.05 72.72 -228.11 327.59 347.80 -52.51
40 31.60 75.20 -191.11 322.65 351.38 -51.41
To - Onset temperature, Tp - Peak temperature, Δh - Specific enthalpy
The ultrasonic amplitude that being used in this research can only be adjusted
from 20 % to 40 %. According to the calculation demonstrated in Appendix H, the
extracted cellulose at low (20 %) and medium (30 %) ultrasonic amplitude are
increasing, from 70.44 %(w/w) to 73.92 %(w/w). However, from Table 4.11, the SCB
treated at 40 % ultrasonic amplitude only extract 56.58 %(w/w) of cellulose, which is
1.5263 g out of the total treated SCB of 2.6975 g. The reason for reduction of extracted
cellulose at high ultrasonic amplitude might caused by the adverse cavitation effects.
This phenomena happened as high ultrasonic amplitude will generate larger amount of
cavitational bubbles at the tip of the ultrasonic transducer, which will hinder the energy
transfer to the solvent medium containing SCB (Ramadoss and Muthukumar, 2016).
Therefore, less amount of cellulose is being extracted. The arabinose present in the
treated SCB is relative small, unable to observe through the peak in the HPLC
chromatogram. It can be explained that location of arabinose in the branches of
macromolecules have make it easier to be hydrolysed during the alkaline ultrasonic
treatment process (Martín, Klinke and Thomsen, 2007).
Table 4.11: Carbohydrate Content of Treated SCB at Various Ultrasonic Amplitude
Based on HPLC Analysis.
Ultrasonic
amplitude
(%)
Dextrose
%(w/w)
Xylose
%(w/w)
Arabinose
%(w/w)
Total
carbohydrate
%(w/w)
20 70.44 10.46 1.02 82.52
30 73.92 9.78 3.98 87.68
40 56.58 9.98 2.05 68.61

50
The extraction of cellulose is happened at different ultrasonic amplitude,
thereby the FTIR spectra for each treatment is similar. In summary, the SCB treated at
ultrasonic amplitude of 30 % estimating better thermal stability with larger amount of
cellulose detected by DSC while treatment conducted at 30 % of ultrasonic amplitude
has successfully extracted high amount of cellulose as well. Therefore, treatment at
ultrasonic amplitude of 30 % has been selected to study for following extraction
parameters.
4.4 Effect of Temperature on Pretreated SCB
The temperature of treatment is varied from 70 oC to 90 oC, with the interval of 10 oC
during the ultrasonic extraction process. In this case, ultrasonic amplitude was fixed at
30 % with KOH concentration of 0.75 M. It is shown in Table 4.12 that the yield of
SCB is the lowest when the sample is treated at 90 oC.
Table 4.12: Yield of Treated SCB at Various Temperature.
Temperature
(oC)
Mass of SCB before
treatment (g)
Mass of SCB after
treatment (g)
Yield of treated
SCB %(w/w)
70 5.0009 2.5236 50.46
80 5.0012 2.4291 48.57
90 5.0006 2.3033 46.06
Figure 4.9 shows the FTIR spectra of 3 samples treated at different temperature
of 70 oC, 80 oC and 90 oC. The only difference observed in this three treated samples
is C=C aromatic stretching in lignin at 1600 cm-1 that detected in sample treated at 90
oC. Other than that, similar spectra peak is observed for the three treated samples as
presented in Table 4.13. No peak at range of 1511-1515 cm-1 and 1323-1327 cm-1 are
detected in samples, indicating the absence of C=C of aromatic ring and C=O bond of
syringyl unit in lignin (Kline et al., 2010).

51
Figure 4.9: FTIR Spectra of Treated SCB at Various Temperature.
Table 4.13: Assignment of Absorption Band in Treated SCB at Various Temperature
(Liu et al., 2006; Viera et al., 2007).
Temperature Functional
group
Type of vibration
70 oC 80 oC 90 oC
3432 3423 3422 O-H Stretching
2929 2927 2925 C-H Symmetric stretching
2367 2375 2367 CO2 Asymmetric stretching
1638 1634 - O-H Bending
1380 1373 1376 C-H In the plane bending
1164 1168 - C-O-C Antisymmetric
stretching
1053 1064 1055 C-O Symmetric stretching
902 897 902 - β-glycosidic linkage
4000.0 3600 3200 2800 2400 2000 1800 1600 1400 1200 1000 800 600 400.0
53.0
54
55
56
57
58
59
60
61
62
63
64
65
66
67.0
cm-1
%T
70 degC
80 degC
90 degC
3432
2929
2367
1638
1053 1380
1164
902
1095
3423
2375
1654
1064 2927
1373
1168
897
3422
2925
2367
1600
1055
669 902
1376

52
According to the DSC analysis as presented in Figure 4.10, at different
temperature, it is observed that the peak temperature of the first endothermic curve is
decreasing from 70 oC to 90 oC. The SCB sample treated at temperature of 90 oC
consist of the lowest peak temperature at 72.75 oC with specific enthalpy of -189.08
J/g. This indicates more crystalline component is present within this sample, less heat
is needed to dehydrate the moisture (Poletto, 2016).
Meanwhile, the sample treated at 70 oC gives a broader and lower peak
temperature of 347.39 oC at second endothermic peak. The specific enthalpy needed
to degrade the cellulose is lowest, -27.01 J/g as observed in Table 4.14, due to less
crystallize cellulose is present within the sample (Poletto, 2016).
Figure 4.10: DSC Thermograph of Treated SCB at Various Temperature.
Table 4.14: DSC Thermograms of Treated SCB at Various Temperature.
Temperature,
oC
1st Endothermic peak 2nd Endothermic peak
To, oC Tp,
oC Δh, J/g To, oC Tp,
oC Δh, J/g
70 34.16 74.03 -238.64 319.52 347.39 -27.01
80 31.12 73.94 -166.41 321.99 351.96 -66.85
90 30.81 72.75 -189.08 324.63 353.12 -53.89
To - Onset temperature, Tp - Peak temperature, Δh - Specific enthalpy
Sample: 80 degC, 3.0000 mg
Sample: 90 degC, 3.0000 mg
Sample: 70 degC, 3.0000 mg
mW
-4
-3
-2
-1
0
1
min °C 40 60 80 100 120 140 160 180 200 220 240 260 280 300 320 340 360 380 400 420 440 460 480
0 2 4 6 8 10 12 14 16 18 20 22 24 26 28 30 32 34 36 38 40 42 44 46
^exo
Lab: METTLER

53
The calculations based on HPLC analysis in Appendix I show that the extracted
cellulose at temperature of 70 oC, 80 oC and 90 oC are 63.75 %(w/w), 70.31 %(w/w)
and 73.59 %(w/w) respectively. The dextrose found for this three samples in HPLC
chromatogram are at retention time of 10.002 minutes to 10.007 minutes, similar to
the retention time obtained for standard dextrose. The increase of temperature is able
to disrupt and break down the solute and biomass matrix interaction such as Van der
Waals force, hydrogen bonding and covalent bonding present in between
hemicellulose and lignin of SCB (Ramadoss and Muthukumar, 2016). Thus, from
Table 4.15, it can be found that the xylose content has been reduced from
17.65 %(w/w) before treatment to weight composition below 10 %. In addition, the
high temperature with the presence of alkali enhance the reaction rate thus assist higher
cellulose extraction. Hence, maximum extraction of cellulose is obtained when SCB
treated at 90 oC as depicted in Table 4.15.
Table 4.15: Carbohydrate Content of Treated SCB at Various Temperature Based on
HPLC Analysis.
Temperature
(oC)
Dextrose
%(w/w)
Xylose
%(w/w)
Arabinose
%(w/w)
Total
carbohydrate
%(w/w)
70 63.75 9.46 1.71 74.92
80 70.31 9.52 3.48 83.31
90 73.59 9.72 2.11 85.42
4.5 Effect of Potassium Hydroxide Concentration on Pretreated SCB
From Table 4.16, the yield of treated SCB decrease as the concentration of potassium
hydroxide concentration increase. This may due to the alkaline KOH that assist the
disruption of covalent bond between lignocellulosic components in SCB, thereby
hydrolyse hemicellulose and lignin present in SCB into soluble products (Castañón-
Rodríguez et al., 2015). The research was carried out at ultrasonic amplitude of 30 %
and temperature of 80 oC.

54
Table 4.16: Yield of Treated SCB at Various Potassium Hydroxide Concentration.
KOH
concentration
(M)
Mass of SCB before
treatment (g)
Mass of SCB after
treatment (g)
Yield of treated
SCB %(w/w)
0.25 5.0002 2.8360 56.72
0.50 5.0012 2.5520 51.03
0.75 5.0011 2.3928 47.85
1.0 5.0003 2.2787 45.57
1.25 5.0004 2.1768 43.53
The FTIR spectra of 5 samples treated at KOH concentration of 0.25 M, 0.50
M, 0.75 M, 1.0 M and 1.25 M are presented in Figure 4.11. The FTIR spectra for this
five samples have shown a similar spectra peak, excluding the C=C aromatic stretching
in lignin which present at 1599 cm-1 in SCB treated at 0.25 M of KOH. When SCB
treated at low alkali concentration, the lignin bonding is not fully break, causing the
presence of lignin in the sample. Table 4.17 provides an overview of the functional
group and type of vibration for each band presence in the FTIR spectra.
Figure 4.11: FTIR Spectra of Treated SCB at Various KOH Concentration.
4000.0 3600 3200 2800 2400 2000 1800 1600 1400 1200 1000 800 600 400.0
45.0
46
48
50
52
54
56
58
60
62
64
66
68
70
72
74.0
cm-1
%T
0.25 M
0.50 M
1.25 M
1.0 M
0.75 M
3435
2369 1638
1059
618
2930 1378
1105
891
3422
2917
2365
1637
1053
594 559
1373
1112
897
3421
2916
2372 1638
1371
1061
899 610
1105 3433
2917
2370 1638
1054 1375
1116
891
3422
2917
2365
1599
1033
669
1375
1109
912

55
Table 4.17: Assignment of Absorption Band in Treated SCB at Various KOH
Concentration (Liu et al., 2006; Viera et al., 2007).
KOH Concentration Functional
group
Type of vibration
0.25 M 0.50 M 0.75 M 1.0 M 1.25 M
3422 3422 3433 3421 3435 O-H Stretching
2917 2917 2917 2916 2930 C-H Symmetric
stretching
2365 2365 2370 2372 2360 CO2 Asymmetric
stretching
- 1637 1638 1638 1628 O-H Bending
1375 1373 1375 1371 1378 C-H In the plane
bending
1109 1112 1116 1105 1105 C-O-C Stretching
1053 1053 1054 1055 1059 C-O Symmetric
stretching
912 897 891 899 891 - β-glycosidic
linkage
660 - - 610 618 C-OH Out of plane
bending
The SCB sample with treatment at 1.25 M of sodium hydroxide treatment gives
the lowest peak temperature of 66.11 oC and low specific enthalpy, -165.71 J/g as
indicated in Table 4.18. Thus, it has high cellulose crystallinity content as compared
to other sample treated with lower concentration of sodium hydroxide solution. The
alkali treatment assists the removal of lignin by causing swelling of the biomass. This
swelling will increase the internal surface area of SCB, on the same time weaken and
break the bond linkage of lignin with other component such as cellulose and
hemicellulose (Bussemaker and Zhang, 2013). Therefore, it probably leads to the high
amount of crystallize cellulose within the sample.
For second endotherm peak, the high peak temperature, 356.38 oC is observed
in sample treated with the highest sodium hydroxide concentration as shown in Figure
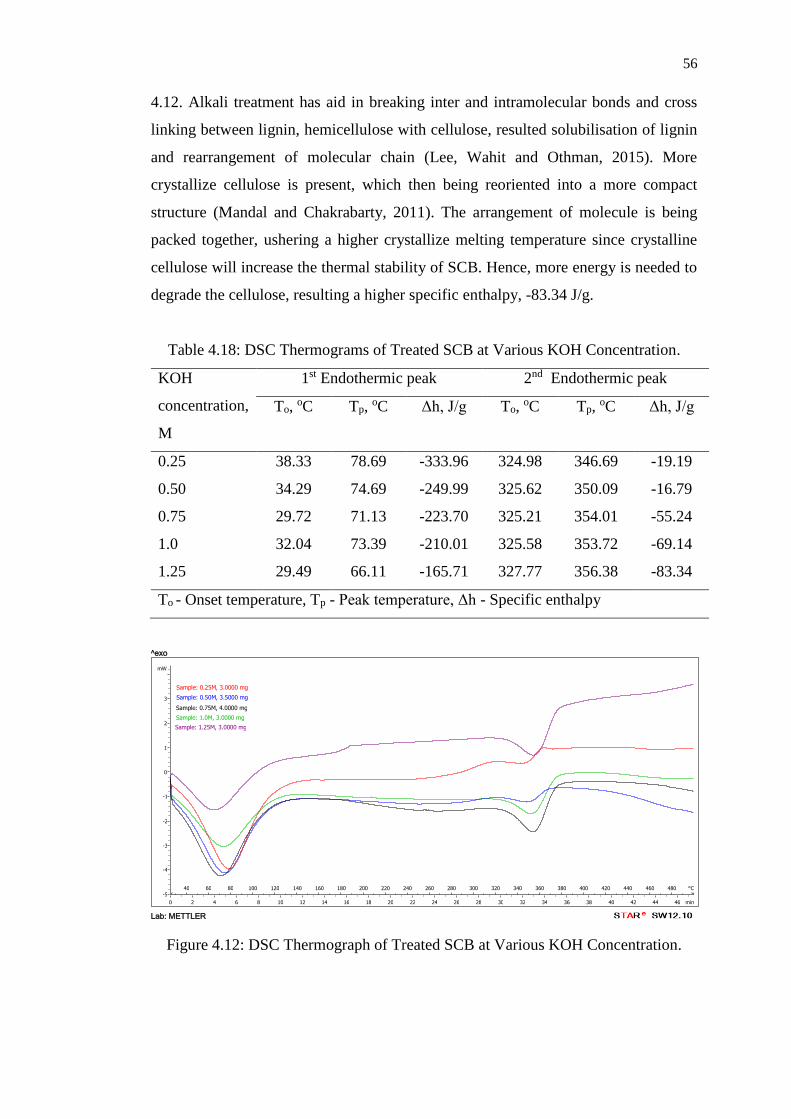
56
4.12. Alkali treatment has aid in breaking inter and intramolecular bonds and cross
linking between lignin, hemicellulose with cellulose, resulted solubilisation of lignin
and rearrangement of molecular chain (Lee, Wahit and Othman, 2015). More
crystallize cellulose is present, which then being reoriented into a more compact
structure (Mandal and Chakrabarty, 2011). The arrangement of molecule is being
packed together, ushering a higher crystallize melting temperature since crystalline
cellulose will increase the thermal stability of SCB. Hence, more energy is needed to
degrade the cellulose, resulting a higher specific enthalpy, -83.34 J/g.
Table 4.18: DSC Thermograms of Treated SCB at Various KOH Concentration.
KOH
concentration,
M
1st Endothermic peak 2nd Endothermic peak
To, oC Tp,
oC Δh, J/g To, oC Tp,
oC Δh, J/g
0.25 38.33 78.69 -333.96 324.98 346.69 -19.19
0.50 34.29 74.69 -249.99 325.62 350.09 -16.79
0.75 29.72 71.13 -223.70 325.21 354.01 -55.24
1.0 32.04 73.39 -210.01 325.58 353.72 -69.14
1.25 29.49 66.11 -165.71 327.77 356.38 -83.34
To - Onset temperature, Tp - Peak temperature, Δh - Specific enthalpy
Figure 4.12: DSC Thermograph of Treated SCB at Various KOH Concentration.
Sample: 1.25M, 3.0000 mg
Sample: 1.0M, 3.0000 mg
Sample: 0.50M, 3.5000 mg
Sample: 0.25M, 3.0000 mg
Sample: 0.75M, 4.0000 mg
mW
-5
-4
-3
-2
-1
0
1
2
3
min °C 40 60 80 100 120 140 160 180 200 220 240 260 280 300 320 340 360 380 400 420 440 460 480
0 2 4 6 8 10 12 14 16 18 20 22 24 26 28 30 32 34 36 38 40 42 44 46
^exo
Lab: METTLER

57
HPLC analysis is used to determine the amount of cellulose being extracted
when SCB treated at different KOH concentration. It is observed that the extraction of
cellulose in SCB is improved progressively when undergo ultrasonic treatment at
higher KOH concentration as depicted in Table 4.19. Calculation in Appendix J
presents 83.22 %(w/w) of cellulose is extracted when treated with 1.25 M of KOH.
Alkali treatment assists the degradation and cleavage of ester and glycosidic side
chains, causing the swelling of lignin and hemicellulose, which then being released
into the alkaline solution, thereby enhance the separation and extraction of cellulose
(Liu et al., 2006). Meanwhile, the ultrasonic irradiation mechanically disrupt the cell
wall, increases the accessibility of alkali to SCB, thus enhances the mass transfer of
component in SCB, in which accelerate the cellulose extraction process (Sun et al.,
2004). Hence, it is observed that 65.9 %(w/w) of xylose and 76.1 %(w/w) of arabinose
removal are achieved when treated with 1.25 M of KOH. Since hemicelluloses are
present on the outer surface of SCB cell wall, thus enable hemicellulose to solubilise
easily in alkaline solution (Liu et al., 2006). When conducting the experiment, it is
found that the alkaline solution containing SCB after treatment was turned to viscous
state, indicating the solubilisation of hemicellulose since it is relative affinity to water
(Chen, 2014). In addition, treatment with alkali reduces the possibility of sugar
degradation in SCB (Velmurugan and Muthukumar, 2012). Thus, it can be found the
total carbohydrate content in treated SCB is relatively higher, at the range of
85.65 %(w/w) to 90.58 %(w/w).
Table 4.19: Carbohydrate Content of Treated SCB at Various KOH Concentration
Based on HPLC Analysis.
KOH
concentration
(M)
Dextrose
%(w/w)
Xylose
%(w/w)
Arabinose
%(w/w)
Total
carbohydrate
%(w/w)
0.25 65.82 17.52 3.61 86.96
0.50 69.03 12.06 4.55 85.65
0.75 73.43 9.97 2.26 85.66
1.0 76.00 8.04 1.70 85.74
1.25 83.22 6.02 1.33 90.58

58
Treatment of SCB with 1.25 M of KOH is selected since FTIR spectra for all
SCB treated at different concentration of KOH are similar. However, the sample which
gives the highest amount of cellulose and shows great extraction of cellulose with least
hemicellulose and lignin content is SCB which undergo treatment at 1.25 M of KOH.
4.6 Analysis of Cellulose Extraction from Treated SCB
The manipulation variables investigated in this research are ultrasonic amplitude,
temperature and concentration of KOH. When one of the parameter is being
manipulated, the other two parameters will be in constant. In the midst of manipulating
the three parameters, there are three sets of data with same parameters are being
repeated, which is SCB treated at ultrasonic amplitude of 30 %, temperature of 80 oC
and 0.75 M of KOH. The carbohydrate content of the treated SCB can be found in
Table 4.20.
Table 4.20: Carbohydrate Content of Treated SCB at 80 oC, 30 % Ultrasonic
Amplitude and 0.75 M KOH Based on HPLC Analysis.
Experiment
No
Dextrose
%(w/w)
Xylose
%(w/w)
Arabinose
%(w/w)
Total
carbohydrate
%(w/w)
2 73.92 9.78 3.98 87.68
5 70.31 9.52 3.48 83.31
9 73.43 9.97 2.26 85.66
Based on the data collected from these three sets of experiments, a standard
error bar is plotted in Figure 4.13 to estimate the range of deviation for each collected
data from the mean value. A smaller standard error of mean values indicates the data
collected has higher accuracy. By referring to Figure 4.13, the standard error of mean
for dextrose is small. The deviation range is in control, without largely affect the
accuracy of the amount of cellulose extraction. A tiny error bar is observed for the
xylose and arabinose component exist in treated SCB. This means that the dissolution

59
of xylose and arabinose were very concise in each of the treatment. Smaller standard
error of mean indicate the mean value of xylose and arabinose content are relatively
precise and accurate.
Figure 4.13: Error Bar of Carbohydrate Content of Treated SCB at 80 oC, 30 %
Ultrasonic Amplitude and 0.75 M KOH.
This standard error of mean is then used to compute confidence interval for
determination of possible interval probability in which the mean will fall (McHugh,
2008). 95 % of confidence interval is used in this research. Based on Table 4.21, the
95 % confidence interval for dextrose is 2.2158 %(w/w), implying there is 95 %
probability whereby the data obtained is within the calculated confidence interval.
From the calculation, it is known that the confidence interval for cellulose extraction
is within the range of 70.3375 %(w/w) to 74.7692 %(w/w). In this research, the
cellulose extracted are 73.92 %(w/w), 70.31 %(w/w) and 73.43 %(w/w), whereby one
of the cellulose extracted was less than the interval limit. The reason for the difference
in cellulose extraction may be attributed to the inconsistency of temperature supplied
during the ultrasonic treatment. Since the sample needs to be heated up every 10
minutes, heat might dissipated to the environment when moving the sample from hot
plate to the ultrasonic homogenizer box. Meanwhile, xylose, arabinose and total
carbohydrate content in treated SCB were in close agreement with the value predicted
0
10
20
30
40
50
60
70
80
90
100
Dextrose Xylose Arabinose Total Carbohydrate
%(w
/w)

60
in 95 % confidence interval. Due to limitation of time and budget, the other samples
with different parameters were conducted for one time. From the analysis of this three
replicates, it can be considered the yield of extracted cellulose and dissolution of
hemicellulose and lignin were accurate without large deviation.
Table 4.21: Analysis of Standard Error of Mean and Confidence Interval of
Carbohydrate Content in Treated SCB at 80 oC, 30 % Ultrasonic Amplitude and 0.75
M KOH.
Mean Standard
deviation
Standard
error of
mean
95 %
Confidence
interval,
%(w/w)
Lower
bound,
%(w/w)
Upper
Bound,
%(w/w)
Dextrose 72.5533 1.9582 1.1306 2.2158 70.3375 74.7692
Xylose 9.7567 0.2259 0.1304 0.2556 9.5010 10.0123
Arabinose 3.2400 0.8848 0.5108 1.0012 2.2388 4.2412
Total
carbohydrate
85.5500 2.1871 1.2627 2.4749 83.0751 88.0249
4.7 Comparison of Cellulose Extraction with Commercialised Process
Cellulose is the main component in lignocellulosic biomass which consist of mostly
crystalline and some amorphous structure, embedded in composite structure, mainly
consist of lignin and hemicellulose. It can be found in the rigid cell wall of the plant
and is associated with hydrogen bonding, making it resist to destruction or degradation
in most of the organic solvent (Singh and Singh, 2012). Therefore, several consecutive
steps as shown in Figure 4.14 are required in assisting the extraction of cellulose in
industry.

61
Figure 4.14: Process Flow for Extraction of Cellulose in Industry (Huang et al.,
2017).
Firstly, the juice in sugarcane is being extracted out, leaving SCB as the fibrous
residue. The lignocellulosic biomass, SCB obtained will need to be cut into small
pieces and dried in oven at temperature range of 60 to 80 oC (Huang et al., 2017). Then,
the dried SCB is grounded into powder and filtered using a mesh sieve. The SCB
powder will then undergo treatment process to remove hemicellulose and lignin,
thereby extract out the cellulose. The hemicellulose content can be solubilised and
removed by cooking the SCB in the presence of alkali medium, mainly sodium
hydroxide. After that, the mixture is bleached with bleaching agent such as hydrogen
peroxide (H2O2) or sodium chlorite (NaClO2) in acidic solution to whiten the cellulosic
fibers and help in complete removal of lignin (Huang et al., 2017). However, the
decomposition of NaClO2 will emit chlorine dioxide, a strong oxidation gas. Therefore,
the rate of evolution of chlorine dioxide needs to be controlled by manipulate the
bleaching bath temperature or its pH by addition of weak acid (Abdel-Halim, 2014).
Hence, acetic acid is presence within the bleaching agent used. Further, the mixture
will be filtered and washed with distilled water and ethanol to remove impurities and
any breakdown products (Sun, et al., 2004). Lastly, the extracted cellulose is dried and
ready to be used.

62
Meanwhile, in current research, the extraction process is modified by addition
of ultrasonic treatment with alkali which shown in Figure 4.15 to enhance the
extraction process. Before that, SCB mixed in distilled water has undergo autoclave
pretreatment to remove impurities and wax present in SCB (Giraud, Fonty and Besle,
1997). Then, SCB undergo ultrasonic treatment by utilising KOH as the alkali
medium. The mechanical vibration generated by ultrasonic homogenizer creates
pressure wave which induced the formation of cavitation bubbles. The collapse of
bubble during compression of the pressure wave causes generation of shock wave
which provides adequate shear force to break the bonding of SCB, enhance mass
transfer and thereby facilitate cellulose extraction. Furthermore, alkali medium aids in
solubilised hemicellulose component by cleavage of glycosidic linkage (Bussemaker
and Zhang, 2013). In the case of lignin, the ether linkage is susceptible to hydroxyl
attack when treated with alkali. Lastly, treated SCB is washed and purified with
distilled water and ethanol. The modified extraction process with combination of
ultrasonic and alkali solvent requires lesser use of chemical as compared to the
commercialised cellulose extraction process. This method is more economical saving
and has lesser impact to environment (Bussemaker and Zhang, 2013).
Figure 4.15: Process Flow for Modified Cellulose Extraction Process.

63
4.8 CMC Characterization
Based on experimental results discussed before, SCB was treated at ultrasonic
amplitude of 30 %, temperature of 80 oC and 1.25 M of KOH to produce cellulose for
synthesis of carboxymethyl cellulose (CMC). Since cellulose is insoluble in most of
the solvent, further production to CMC actually increases the applicability of cellulose
(Viera et al., 2007). The synthesis process gave CMC yield of 165.45 %(w/w) as
tabulated in Table K.1 in Appendix K. The high yield is resulted from the reaction of
cellulose with sodium monochloroacetic acid, whereby the hydroxyl group of cellulose
is substituted with carboxymethyl group (Tasaso, 2015). Figure 4.16 displays the
appearance of CMC which is light brownish in colour.
Figure 4.16: Appearance of CMC.
FTIR spectra of CMC compared with SCB is presented in Figure 4.17. It is
found that there are similar absorption bands between CMC and SCB. For example,
hydroxyl group of OH stretching is present at wavenumber of 3432 cm-1, C-H aliphatic
group at peak of 2928 cm-1 and 2930 cm-1, CO2 at absorption band of 2367 cm-1,
hydrocarbon group of CH2 scissoring at 1425 cm-1 to 1440 cm-1 and β-glycosidic bond
at 895 cm-1 to 910 cm-1 (Corrales et al., 2012) . Meanwhile, C=O bond in hemicellulose
at peak of 1723 cm-1, C=C bond and C-O bond of lignin at absorption band of 1628
cm-1 and 1247 cm-1 in SCB are absent in CMC, portraying most of the hemicellulose
and lignin were removed during treatment (Golbaghi, Khamforoush and Hatami,
2007). The presence of new peak at 1608 cm-1 verify the occurrence of methylation

64
reaction in extracted cellulose. It is the evidence on which the hydroxyl group in
cellulose is being substituted with carboxymethyl, COONa group (Bono et al., 2009).
Comparison of the absorption band between CMC and SCB were tabulated in Table
4.22.
Figure 4.17: FTIR Spectra of SCB and CMC.
Table 4.22: Assignment of Absorption Band in CMC and SCB (Viera et al., 2007).
Wavenumber (cm-1) Vibration
SCB CMC
3432 3432 axial deformation of O-H group
2928 2930 symmetrical stretching of C-H group
2367 2368 asymmetric stretching of CO2
1723 - stretching vibration of C=O
1628 - carbonyl stretching of C=C bond with
aromatic ring
- 1608 stretching vibration of COO- group
1440 1425 CH2 symmetric bending of lignin
1375 - C-H deformation
1247 - C-O stretching of aryl group
1053 1069 C-O symmetric stretching of primary alcohol
910 895 β-glycosidic linkage
4000.0 3600 3200 2800 2400 2000 1800 1600 1400 1200 1000 800 600 400.0
56.00
56.5
57.0
57.5
58.0
58.5
59.0
59.5
60.0
60.5
61.0
61.5
62.0
62.5
63.0
63.5
64.0
64.5
65.0
65.5
66.0
66.5
67.0
67.50
cm-1
%T CMC
SCB
3432
2368
1608
1425 1069
602
2930
1162
1118
895
3432
2928
2367
1628
1053
1723
1440
1375
1247
828 910 855

65
DSC analysis in Figure 4.18 demonstrates the endothermic peak of CMC is
broader and requires more heat of dehydration as compared to SCB. CMC has peak
temperature at 80.34 oC, comparatively higher than peak temperature of SCB at 57.11
oC. On the other hand, the specific enthalpy for CMC is - 382.98 J/g while SCB has
specific enthalpy of -373.76 J/g. The presence of this endothermic peak in CMC was
likely due to the interaction between water and hydroxyl groups in cellulose which
were not being substituted (Viera et al., 2007). Moreover, the high temperature peak
and specific enthalpy indicates CMC is less crystalline as compared to SCB (Bertran
and Dale, 1986). Reduction of crystallinity in CMC was mainly influenced by the
alkalization of 17.5 %(w/v) of NaOH which causes the cleavage of hydrogen bond of
cellulose (Singh and Singh, 2012).
Figure 4.18: DSC thermograph of SCB and CMC.
Degree of substitution is a very important indicator used to determine the extent
on which the substitution of carboxymethyl group in cellulose structure of C2, C3 and
C6 are being carried out. It is identified through potentiometric titration whereby the
sample was titrated with 0.3 M of HCl until solution turns colourless (Bono et al.,
2009). From Appendix L, the degree of substitution (DS) calculated is 0.3624. The
average DS for cellulose which undergo alkalization followed by carboxymethylation
process with SMCA was in the range of 0.4-1.3 (Reuben and Conner, 1983). When
DS is below 0.4, CMC produced is swellable but insoluble (Waring and Parsons,
Sample: SCB, 1.0000 mg
Sample: CMC, 4.0000 mg
mW
-10
-8
-6
-4
-2
0
2
4
min °C 40 60 80 100 120 140 160 180 200 220 240 260 280 300 320 340 360 380 400 420 440 460 480
0 2 4 6 8 10 12 14 16 18 20 22 24 26 28 30 32 34 36 38 40 42 44 46
^exo
Lab: METTLER

66
2001). The reason of low DS obtained in this research was due to the reaction not being
carried out in optimum condition. The temperature, time of reaction, different
concentration of NaOH and amount of SMCA used will affect the value of DS.
According to research conducted by Alizadeh, Mousavi and Labbafi (2017), DS of
0.78 was obtained for CMC produced from cellulose extracted from SCB when NaOH
concentration of 30 %(w/v) was used. An optimum NaOH concentration will avoid
the predomnating of side reaction, which reduce DS due to formation of sodium
glycolates. Meanwhile, the carboxymethylation process was carried out at 55 oC for 3
hours. Longer time provides more time for carboxymethylation reaction, result in
higher DS (Toǧrul and Arslan, 2003). Besides, the accessibility of etherification agent
to cellulose chain is influenced by the solvent used (Zhao et al., 2003). The substitution
of carboxymethyl group can be further enhanced by using mixture of solvent as
reaction medium at appropriate ratio (Pitaloka et al., 2017).
The properties of CMC produced can be further identified by producing a film
as shown in Figure 4.19. Glycerol was added in film production which serve as
plasticizing agent to overcome brittleness. This film is used for material that are non-
toxic, biocompatible and non-allergenic (Tufan et al., 2016). In summary, cellulose
extracted from SCB using ultrasound-assisted alkali treatment is promising as
feedstock to produce CMC for industries application including oil-drilling industries.
Figure 4.19: Film Production from Synthesize CMC.

CHAPTER 5
CONCLUSION AND RECOMMENDATION
5.1 Conclusion
In conclusion, the extraction of cellulose upon autoclaved pretreatment with
ultrasonic-assisted treatment was successfully been carried out. FTIR spectra has
shown the disappearance or decrease in intensity of absorption band for hemicellulose
and lignin, portraying the treatment process have reduced and solubilised the
hemicellulose and lignin component in SCB. The thermal stability of cellulose
extracted is estimated through DSC testing. On the other hand, the two step treatments
have extracted approximate 56.58 %(w/w) to 83.22 %(w/w) of cellulose from SCB
samples. The cellulose, hemicellulose and lignin content in treated SCB were
determined by using HPLC.
There are three operating parameters being manipulated along this research
study, which are ultrasonic amplitude, temperature and KOH concentration. It was
observed that highest amount of cellulose, 83.22 %(w/w) was extracted when SCB
treated at optimum condition of 30 % ultrasonic amplitude, 80 oC and 1.25 M KOH.
This result portrayed the successful pretreatment of autoclave which help in removal
of soluble impurities and lignin in SCB. Meanwhile, the ultrasonic-assisted treatment
in alkali medium aids in breaking the bonding of hemicellulose and lignin, enhance
mass transfer and thereby facilitate cellulose extraction. As for DSC thermographs, it
has the lowest peak temperature at the first endothermic peak with the highest peak
temperature at second endothermic peak, estimating the presence of cellulose content
in the treated sample.

68
Besides that, CMC has been synthesized from the treated SCB with the highest
cellulose content to further enhance its application. It was found that the degree of
substitution of carboxyl group on cellulose is 0.3624 through potentiometric titration.
FTIR spectra has confirmed the presence of carboxyl group at absorption wavelength
of 1608 cm-1. In addition, the production of film has given supporting evidence for the
properties of produced CMC where it is widely used in various industries due to its
solubility properties.
In current research, SCB is used as the feedstock since it has high availability
with promising cellulose content about 50 %(w/w). The combination of ultrasonic
treatment with alkali medium is an effective modified method which can be used in
extracting higher amount of cellulose to accommodate its application in various
industries. Mild alkali treatment result in lower degradation and formation of side
products. Meanwhile, the ultrasonic treatment is more economic saving since the
treatment requires less chemical usage and shorter extraction time.
5.2 Recommendation
SCB as the feedstock consists of relative higher cellulose content as compared
to other lignocellulosic biomass. This cellulose can be used in textile, paper, paints,
cosmetic and pharmaceutical industry. In this research, the treatment of SCB with
autoclave and ultrasonic-assisted treatment has successful extracted large amount of
cellulose. However, there are still places for improvement after conducting this
experiment. Firstly, in this research, the temperature of the SCB treatment medium is
unstable since hot plate is not able to place within the ultrasonic homogenizer protector
box. The temperature of treated medium will fluctuate within 5 oC. Therefore, when
manipulating the temperature of SCB in alkali medium, it is recommended to use
jacketed beaker to maintain its temperature during the ultrasonic treatment process.
Besides that, a further study on the type of solvent used during the ultrasonic
treatment can be conducted since different chemicals will affect the viscosity of the
SCB mixture solution, which in turn the ultrasonic effect on the solution. Other than

69
that, the reaction time and ultrasonic duty cycle can be studied as it can bring different
effect on the amount of cellulose extracted.
In addition, X-ray diffraction (XRD) and scanning electron microscopy (SEM)
characterization can be used to further determine the properties of the treated SCB.
XRD can be carried out to determine the exact amount of crystalline and amorphous
component in SCB constituents before and after the treatment process. This will aid in
determine the amount of cellulose being extracted since it is crystalline in nature as
compared to hemicellulose and lignin. On the other hand, SEM helps to analyse the
structure change within SCB and treated SCB, whether there is removal or damage on
hemicellulose and lignin after undergo autoclave and ultrasonic treatment.

REFERENCES
Abdel-Halim, E.S., 2013. Chemical modification of cellulose extracted from
sugarcane bagasse: Preparation of hydroxyethyl cellulose. Arabian Journal of
Chemistry, 7(3), pp. 362–371.
Abo-State, M., Ragab, A., EL-Gendy, N., Farahat, L. and Madian, H., 2013. Effect of
different pretreatments on egyptian sugar-cane bagasse saccharification and
bioethanol production. Egyptian Journal of Petroleum, 22(1), pp.161-167.
Adebisi, J., Agunsoye, J., Bello, S., Haris, M., Ramakokovhu, M., Daramola, M. and
Hassan, S., 2017. Proximate Analysis and Physicochemical Properties of Sugarcane
Bagasse, Cassava Periderm and Maize Stalk. In: International Workshop on
Advanced Functional Nanomaterials – IWAN 4. India, March 2017. Chennai,
India: INER. Available at: <https://www.researchgate.net/publication/317340899
_Proximate_Analysis_and_Physicochemical_Properties_of_Sugarcane_Bagasse_
Cassava_Periderm_and_Maize_Stalk> [Accessed 16 Jun. 2018].
Ain, N. and Sukri, B., 2012. Effect of different types of solvent on extraction of
phenolic compounds from cosmos caudatus. Degree. University Malaysia Pahang.
Alizadeh Asl, S., Mousavi, M. and Labbafi, M., 2017. Synthesis and Characterization
of Carboxymethyl Cellulose from Sugarcane Bagasse. Journal of Food
Processing & Technology, 08(08), pp. 1-6.
Allen, S.G., Kam, L.C., Zemann, A.J. and Antal, M.J., 1996. Fractionation of sugar
cane with hot, compressed, liquid water. Industrial and Engineering Chemistry
Research, 35(8), pp.2709–2715.
Alonso D.M., Wettstein S.G. and Dumesic J.A., 2012. Bimetallic catalysts for
upgrading of biomass to fuels and chemicals. Chemical Society Review,
41(24), pp. 8075–8098.
Anderson, G.E., 2018. Solvent Extraction. [online] Available at:
<http://lipidlibrary.aocs.org/OilsFats/content.cfm?ItemNumber=40337>
[Accessed 12 Aug. 2018].
Anna, E. and Zdenka, H., 2010. An overview on the application of ultrasound in
extraction, separation and purification of plant polysaccharides. Central European
Journal of Chemistry, 8(2), pp.243–257.

71
Area, M.C., Felissia, F.E. and Vallejos, M.E., 2009. Ethanol-water fractionation of
sugar cane bagasse catalyzed with acids. Cellulose Chemistry and Technology,
43(7-8), pp.271–279.
Avellar, B.K. and Glasser, W.G., 1998. Steam-assisted biomass fractionation. I.
Process considerations and economic evaluation. Biomass and Bioenergy, 14(3),
pp.205–218.
Avinash, K., 2018. Autoclave Sterilization Principle & Working PDF PPT - Autoclave
Validation - Autoclave Diagram [online] Available at:
<https://pharmawiki.in/autoclave-sterilization-principle-working-pdf-ppt-
autoclave-validation-autoclave-diagram/> [Accessed 14 Feb. 2019].
Balan, V., 2014. Current Challenges in Commercially Producing Biofuels from
Lignocellulosic Biomass. ISRN Biotechnology, 2014(i), pp. 1–31.
Banerjee, S., Sen, R., Pandey, R.A., Chakrabarti, T., Satpute, D., Giri, B.S. and
Mudliar, S., 2009. Evaluation of wet air oxidation as a pretreatment strategy for
bioethanol production from rice husk and process optimization. Biomass and
Bioenergy, 33(12), pp.1680–1686.
Barroso, J., Barreras, F., Amaveda, H. and Lozano, A. (2003). On the optimization of
boiler efficiency using bagasse as fuel☆. Fuel, 82(12), pp.1451-1463.
Batelaan, J.G., Van Ginkel, C.G. and Balk, F., 1992. Carboxymethylcellulose (CMC).
Handbook of Environmental Chemistry, 3, pp.329–336.
Bensah, E.C. and Mensah, M., 2013. Chemical pretreatment methods for the
production of cellulosic ethanol: Technologies and innovations. International
Journal of Chemical Engineering, 2013, pp.1-21.
Bertran, M.S. and Dale, B.E., 1986. Determination of Cellulose Accessibility by
Differential Scanning Calorimetry. Journal of Applied Polymer Science, 32,
pp.4241–4253.
Bian, J., Peng, F., Peng, X., Peng, P., Xu, F. and Sun, R., 2012. Acetic Acid Enhanced
Purification of Crude Cellulose from Sugarcane Bagasse: Structural and
Morphological Characterization. BioResources, 7(4), pp. 4626-4639.
Bjerre, A.B., Bjerring, A., Ploger, A. and Schmidt, A.S., 1996. Pretreatment of Wheat
Straw Using Combined Wet Oxidation and Alkaline Hydrolysis Resulting in
Convertible Cellulose and Hemicellulose. Biotechnology and Bioengineering,
49(5), pp.568–577.
Bono, A., Ying P.H., Yan, F.Y., Muei, C.L., Sarbatly, R., Krishnaiah, D., 2009.
Synthesis and Characterization of Carboxymethyl Cellulose from Palm Kernel
Cake. Advance in Natural Applied Sciences, 3(31), pp.5–11.

72
Brienzo, M., Carvalho, A.F.A., Figueiredo, F.C.De. and Neto, P.D.O., 2016.
Sugarcane Bagasse Hemicellulose Properties, Extraction Technologies and
Xylooligosaccharides Production. In : G. Leonard Riley ed. Food Waste. New
York: Nova Science Publishers, Inc. pp. 155-188.
Brodeur, G., Yau, E., Badal, K., Collier, J., Ramachandran, K. and Ramakrishnan, S.,
2011. Chemical and Physicochemical Pretreatment of Lignocellulosic Biomass: A
Review. Enzyme Research, 2011, pp.1-17.
Bussemaker, M. and Zhang, D., 2013. Effect of Ultrasound on Lignocellulosic
Biomass as a Pretreatment for Biorefinery and Biofuel Applications. Industrial &
Engineering Chemistry Research, 52(10), pp.3563-3580.
Cabral, M., Abud, A., Silva, C. and Almeida, R., 2016. Bioethanol production from
coconut husk fiber. Ciência Rural, 46(10), pp.1872-1877.
Candido. R.G., Godoy, G.G., Gonçalves, A., 2012. Study of Sugarcane Bagasse
Pretreatment with Sulfuric Acid as a Step of Cellulose Obtaining. International
Journal of Biological, Biomolecular, Agricultural, Food and Biotechnological
Engineering, 6(1), pp.6–10.
Canilha, L., Santos, V., Rocha, G., Almeida e Silva, J., Giulietti, M., Silva, S., Felipe,
M., Ferraz, A., Milagres, A. and Carvalho, W., 2011. A study on the pretreatment
of a sugarcane bagasse sample with dilute sulfuric acid. Journal of Industrial
Microbiology & Biotechnology, 38(9), pp.1467-1475.
Carvalho, D.M.D., 2016. Some Factors Affecting the Production of Second
Generation Ethanol from Eucalyptus, Sugarcane Bagasse and Sugarcane Straw.
PhD. Federal University of Viçosa.
Castañón-Rodríguez, J., Welti-Chanes, J., Palacios, A., Torrestiana-Sanchez, B.,
Ramírez de León, J., Velázquez, G. and Aguilar-Uscanga, M., 2015. Influence of
high pressure processing and alkaline treatment on sugarcane bagasse
hydrolysis. CyTA - Journal of Food, 13(4), pp.1-8.
Chang, V. and Holtzapple, M., 2000. Fundamental Factors Affecting Biomass
Enzymatic Reactivity. Applied Biochemistry and Biotechnology, 84-86(1-9), pp.5-
38.
Chang, V.S., Nagwani, M. and Holtzapple, M.T., 1998. Lime pretreatment of crop
residues bagasse and wheat straw. Applied Biochemistry and Biotechnology - Part
A Enzyme Engineering and Biotechnology, 74(3), pp.135–159.
Chen, H., 2014. Biotechnology of lignocellulose: Theory and practice. Netherlands:
Springer.
Corrales, R., Mendes, F., Perrone, C., Sant’Anna, C., de Souza, W., Abud, Y., Bon, E.
and Ferreira-Leitão, V., 2012. Structural evaluation of sugar cane bagasse steam
pretreated in the presence of CO2 and SO2. Biotechnology for Biofuels, 5(1), pp.1-
8.

73
Credou, J. and Berthelot, T., 2014. Cellulose: from biocompatible to bioactive
material. Journal of Materials Chemistry B, 2(30), pp.4767-4788.
del Río, J., Rencoret, J., Prinsen, P., Martínez, Á., Ralph, J. and Gutiérrez, A., 2012.
Structural Characterization of Wheat Straw Lignin as Revealed by Analytical
Pyrolysis, 2D-NMR, and Reductive Cleavage Methods. Journal of Agricultural
and Food Chemistry, 60(23), pp.5922-5935.
Doherty, W., Halley, P., Edye, L., Rogers, D., Cardona, F., Park, Y. and Woo, T.,
2007. Studies on polymers and composites from lignin and fiber derived from
sugar cane. Polymers for Advanced Technologies, 18(8), pp.673-678.
Eduardo, C., Silva, D.F., Maria, I.R. and Garcia, R., 2016. Bioethanol production from
coconut husk fiber. Cellulose Chemistry and Technology, 46, pp.1872–1877.
Fialho, J.N.D., 2015. Development of selective fractionation methods for the
integrated upgrade of corn cobs in the biorefinery framework. Master. Instituto
Superior Técnico Lisboa.
Fijan, R., Basile, M., Šostar-Turk, S., Žagar, E., Žigon, M. and Lapasin, R., 2009. A
study of rheological and molecular weight properties of recycled polysaccharides
used as thickeners in textile printing. Carbohydrate Polymers, 76(1), pp.8–16.
Filho, G., de Assunção, R., Vieira, J., Meireles, C., Cerqueira, D., da Silva Barud, H.,
Ribeiro, S. and Messaddeq, Y., 2007. Characterization of methylcellulose produced
from sugar cane bagasse cellulose: Crystallinity and thermal properties. Polymer
Degradation and Stability, 92(2), pp.205–210.
Giraud, I., Fonty, G. and Besle, Jm., 1997. Effect of sterilization by autoclaving of
maize and sugarcane bagasse cell walls on chemical and biological susceptibility.
Reproduction Nutrition Development, EDP Sciences, 37 (Suppl), pp.56-56.
Global Market Insights, I., 2018. Carboxymethyl Cellulose Market to cross $1.7bn by
2024: Global Market Insights, Inc. [online] Available at: <https://globenewswire.
com/news-release/2018/04/04/1459946/0/en/Carboxymethyl-Cellulose-Market-to-
cross-1-7bn-by-2024-Global-Market-Insights-Inc.html> [Accessed 16 Jun. 2018].
Gogate, P., Sutkar, V. and Pandit, A., 2011. Sonochemical reactors: Important design
and scale up considerations with a special emphasis on heterogeneous
systems. Chemical Engineering Journal, 166(3), pp.1066-1082.
Golbaghi, L., Khamforoush, M. and Hatami, T., 2017. Carboxymethyl cellulose
production from sugarcane bagasse with steam explosion pulping: Experimental,
modeling, and optimization. Carbohydrate Polymers, 174, pp.780–788.
Gonzalez-Fernandez, C., Timmers, R.A., Ruiz, B. and Molinuevo-Salces, B., 2015.
Ultrasound-Enhanced Biogas Production from Different Substrates. In: Fang, Z.,
Jr, R. and Qi, X., eds. Production of biofuels and chemicals with ultrasound.
Netherland: Springer. pp.209-242.

74
Grand View Research, 2018. Chemical Cellulose Market Analysis, Market Size,
Application Analysis, Regional Outlook, Competitive Strategies and Forecasts,
2014 To 2020 [online] Available at: <https://www.grandviewresearch.com/
industry-analysis/chemical-cellulose-market> [Accessed 16 Jun. 2018].
Granström, M., 2009. Cellulose Derivatives: Synthesis, Properties and Applications.
University of Helsinki.
Hansen, N. and Plackett, D., 2008. Sustainable Films and Coatings from
Hemicelluloses: A Review. Biomacromolecules, 9(6), pp.1493-1505.
Heinze, T. and Pfeiffer, K., 1999. Studies on the synthesis and characterization of
carboxymethylcellulose. Die Angewandte Makromolekulare Chemie, 266(1),
pp.37–45.
Heinze, T., El Seoud, O. and Koschella, A., 2018. Cellulose derivatives: Synthesis,
Structure, and Properties. 1st ed. Switzerland: Springer International Publishing.
Henderson, B., Champagne, P. and Tudoret, M.-J., 2003. The chemical separation of
cellulose from lignin in sugarcane bagasse. In: 8th Environmental and Sustainable
Engineering Specialty Conference of the Canadian Society for Civil Engineering.
Canada, 4-7 June 2003.
Huang, C.M.Y., Chia, P.X., Lim, C.S.S., Nai, J.Q., Ding, D.Y., Seow, P.B., Wong,
C.W., and Chan, E.W.C., 2017. Synthesis and characterisation of carboxymethyl
cellulose from various agricultural wastes. Cellulose Chemistry and Technology,
51(7–8), pp. 665–672.
Huijgen, W., Reith, J. and den Uil, H., 2010. Pretreatment and Fractionation of Wheat
Straw by an Acetone-Based Organosolv Process. Industrial & Engineering
Chemistry Research, 49(20), pp.10132-10140.
Jacquet, N., Maniet, G., Vanderghem, C., Delvigne, F. and Richel, A., 2015.
Application of Steam Explosion as Pretreatment on Lignocellulosic Material: A
Review. Industrial and Engineering Chemistry Research, 54(10), pp.2593–2598.
Judelson, H., 2004. Operation of The Autoclaves. [online] Available at:
<http://www.vliz.be/docs/Zeecijfers/autoclaveoperation.pdf> [Accessed 12
Aug. 2018].
Kadir, A. A. and Maasom, N., 2013. Recycling Sugarcane Bagasse Waste into Fired
Clay Brick. International Journal of Zero Waste Generation, 1(1), pp. 21–26.
Karp, S., Woiciechowski, A., Soccol, V. and Soccol, C., 2013. Pretreatment Strategies
for Delignification of Sugarcane Bagasse: A Review. Brazilian Archives of Biology
and Technology, 56(4), pp.679-689.
Katyal, S., Thambimuthu, K. and Valix, M., 2003. Carbonisation of bagasse in a fixed
bed reactor: influence of process variables on char yield and
characteristics. Renewable Energy, 28(5), pp.713-725.

75
Käuper, P., Kulicke, W., Horner, S., Saake, B., Puls, J., Kunze, J., Fink, H., Heinze,
U., Heinze, T., Klohr, E., Thielking, H. and Koch, W., 1998. Development and
evaluation of methods for determining the pattern of functionalization in sodium
carboxymethylcelluloses. Angewandte Makromolekulare Chemie, 260(4571),
pp.53–63.
Kim, S.H., 2004. Lime pretreatment and enzymatic hydrolysis of corn stover. PhD.
Texas A&M University.
Klemm, D., Philipp, B., Heinze, T., Heinze, U. and Wagenknecht, W.,
1998. Comprehensive cellulose chemistry, Volume 1, Fundamentals and
Analytical Methods. Weinheim: Wiley-VCH.
Klemm, D., Schmauder, H. and Heinze, T., 2005. Cellulose. In: A. Steinbuchel, ed.
2006. Biopolymers online. New York: Wiley. pp 275-287.
Kline, L.M., Hayes, D.G., Womac, A.R. and Labbé, N., 2010. Simplified
determination of lignin content in hard and soft woods via UV-spectrophotometric
analysis of biomass dissolved in ionic liquids. BioResources, 5(3), pp.1366-1383.
Kuijk, S.J.A.V., Río, J.C., Rencoret, J., Gutiérrez, A., Sonnenberg, A.S.M., Baars,
J.J.P., Hendriks, W.H. and Cone, J.W, 2016. Selective ligninolysis of wheat straw
and wood chips by the white-rot fungus Lentinula edodes and its influence on in
vitro rumen degradability. Journal of Animal Science and Biotechnology, pp.1–14.
Kumar, P., Barrett, D.M., Delwiche, M.J. and Stroeve, P., 2009. Methods for
pretreatment of lignocellulosic biomass for efficient hydrolysis and biofuel
production. Industrial and Engineering Chemistry Research, 48(8), pp.3713–3729.
Lavanya, D., Kulkarni, P.K., Dixit, M., Raavi, P.K. and Krishna, L.N.V., 2011.
Sources of Cellulose and Their Applications – A Review. International Journal of
Drug Formulation and Research, (6), pp.19–38.
Lavarack, B., Griffin, G. and Rodman, D., 2002. The acid hydrolysis of sugarcane
bagasse hemicellulose to produce xylose, arabinose, glucose and other
products. Biomass and Bioenergy, 23(5), pp.367-380.
Le Troedec, M., Sedan, D., Peyratout, C., Bonnet, J., Smith, A., Guinebretiere, R.,
Gloaguen, V. and Krausz, P., 2008. Influence of various chemical treatments on
the composition and structure of hemp fibres. Composites Part A: Applied Science
and Manufacturing, 39(3), pp.514-522.
Lee, C.Y., Wahit, M.U. and Othman, N., 2015. Thermal and Flexural Properties of
Regenerated Cellulose(Rc)/Poly(3-Hydroxybutyrate)(Phb)Biocomposites. Jurnal
Technologi, 75(11), pp. 107-112.
Lee, H.V., Hamid, S.B.A. and Zain, S.K., 2014. Conversion of Lignocellulosic
Biomass to Nanocellulose: Structure and Chemical Process. The Scientific World
Journal, 2014, pp. 1–20.

76
Liu, C.F., Ren, J.L., Xu, F., Liu, J.J., Sun, J.X. and Sun, R.C., 2006. Isolation and
characterization of cellulose obtained from ultrasonic irradiated sugarcane bagasse.
Journal of Agricultural and Food Chemistry, 54(16), pp.5742–5748.
Lorenz, T., 1996. A Hypothesis for determining the maximum viscosity of sodium
carboxymethylcellulose in solutions of divalent cations of high ionic strength.
Master. Rochester Institute of Technology.
Luque de Castro, M.D. and García-Ayuso, L.E., 1998. Soxhlet extraction of solid
materials: An outdated technique with a promising innovative future. Analytica
Chimica Acta, 369(1–2), pp.1–10.
Mandal, A. and Chakrabarty, D., 2011. Isolation of nanocellulose from waste
sugarcane bagasse (SCB) and its characterization. Carbohydrate Polymers, 86(3),
pp.1291-1299.
Martín, C., Jackson, G., Perez, M., Lόpez, Y., Hernández, E. and Plasencia, Y., 2007.
Acid prehydrolysis, alkaline delignification and enzymatic hydrolysis of rice
hulls. Cellulose Chemistry and Technology, 41(2–3), pp.129-135.
Martín, C., Klinke, H.B. and Thomsen, A.B., 2007. Wet oxidation as a pretreatment
method for enhancing the enzymatic convertibility of sugarcane bagasse. Enzyme
and Microbial Technology, 40(3), pp.426–432.
Maurya, D.P., Singla, A. and Negi, S., 2015. An overview of key pretreatment
processes for biological conversion of lignocellulosic biomass to bioethanol. 3
Biotech, 5(5), pp.597–609.
Mcginnis, G.D., Wilson, W.W. and Mullen, C.E., 1983. Biomass Pretreatment with
Water and High-Pressure Oxygen. the Wet-Oxidation Process. Industrial and
Engineering Chemistry Product Research and Development, 22(2), pp.352–357.
McHugh, M., 2008. Standard error: meaning and interpretation. Biochemia Medica,
pp.7-13.
Mesa, L., González, E., Cara, C., González, M., Castro, E. and Mussatto, S.I., 2011.
The effect of organosolv pretreatment variables on enzymatic hydrolysis of
sugarcane bagasse. Chemical Engineering Journal, 168(3), pp.1157–1162.
Mokhena, T., Mochane, M., Motaung, T., Linganiso, L., Thekisoe, O. and Songca, S.,
2018. Sugarcane Bagasse and Cellulose Polymer Composites. In: A. Oliveira ed.
Sugarcane Techology and Research. Brazil: IntechOpen. pp. 226-228.
Mosier, N., Wyman, C., Dale, B., Elander, R., Lee, Y.Y., Holtzapple, M. and Ladisch,
M., 2005. Features of promising technologies for pretreatment of lignocellulosic
biomass. Bioresource Technology, 96(6), pp.673–686.
Mothé, C.G. and De Miranda, I.C., 2009. Characterization of sugarcane and coconut
fibers by thermal analysis and FTIR. Journal of Thermal Analysis and Calorimetry,
97(2), pp.661–665.

77
Mulyatno, H.A. and Pratama, O.I., 2017. Synthesis of Carboxymethyl Cellulose
(CMC) from Banana Tree Stem : Influence of Ratio of Cellulose with Sodium
Chloroacetate To Properties of Carboxymethyl Cellulose. Equlibrium Journal of
Chemical Engineering, 16(2), pp.33-37.
Naik, S., Goud, V.V., Rout, P.K., Jacobson, K., Dalai, A.K., 2010. Characterization of
Canadian biomass for alternative renewable biofuel. Renewable Energy, 35(8),
pp.1624–1631.
Neureiter, M., Danner, H., Thomasser, C., Saidi, B. and Braun, R., 2002. Dilute-Acid
Hydrolysis of Sugarcane Bagasse at Varying Conditions. Applied Biochemistry and
Biotechnology, 98-100(1-9), pp.49-58.
NL Agency, 2013. Rice straw and Wheat straw Potential feedstocks for the Biobased
Economy. [online] Available at: <https://english.rvo.nl/sites/default/files/2013/
12/Straw%20report%20AgNL%20June%202013.pdf> [Accessed 24 Jun. 2018].
Nuno, R. and Carvalho, L. De, 2009. Dilute acid and enzymatic hydrolysis of
sugarcane bagasse for biogas production. Master. Technical University of Lisbon.
O’Hara, I., 2011. Cellulosic ethanol from sugarcane bagasse in Australia : exploring
industry feasibility through systems analysis, techno-economic assessment and
pilot plant development. PhD. Queensland University of Technology.
Ogunbayo, A., Olanipekun, O. and Babatunde, D., 2016. Effect of Pre-treatment
method on the Hydrolysis of Corn cob and Sawdust. Anadolu University Journal of
Science and Technology-A Applied Sciences and Engineering, 17(3), pp.795-811.
Öhgren, K., Vehmaanperä, J., Siika-Aho, M., Galbe, M., Viikari, L. and Zacchi, G.,
2007. High temperature enzymatic prehydrolysis prior to simultaneous
saccharification and fermentation of steam pretreated corn stover for ethanol
production. Enzyme and Microbial Technology, 40(4), pp.607–613.
Olsson, C. and Westman, G., 2013. Direct Dissolution of Cellulose: Background,
Means and Applications. In: T. Van de Ven ed. Cellulose–Fundamental Aspects.
New York: InTech. pp.143–178.
Parameswaran, B., 2009. Sugarcane Bagasse. In: P. Singh Nee Nigam and A. Pandey,
eds. 2009. Biotechnology for Agro-Industrial Residues Utilisation: Utilisation of
Agro-Residues. U.K; India : Springer. pp. 239-248.
Pérez, J., Muñoz-Dorado, J., de la Rubia, T. and Martínez, J., 2002. Biodegradation
and biological treatments of cellulose, hemicellulose and lignin: an
overview. International Microbiology, 5(2), pp.53-63.
Pitaloka, A.B., Saputra, A.H. and Nasikin, M., 2017. The Effect of Isopropyl Alcohol-
2-Butanol Mixed Solvent on Degree of Substitution of Carboxymethyl Cellulose
from Water Hyacinth ( Eichhornia Crassipes ) Cellulose. International Journal of
Applied Engineering Research, 12(22), pp.12546–12553.
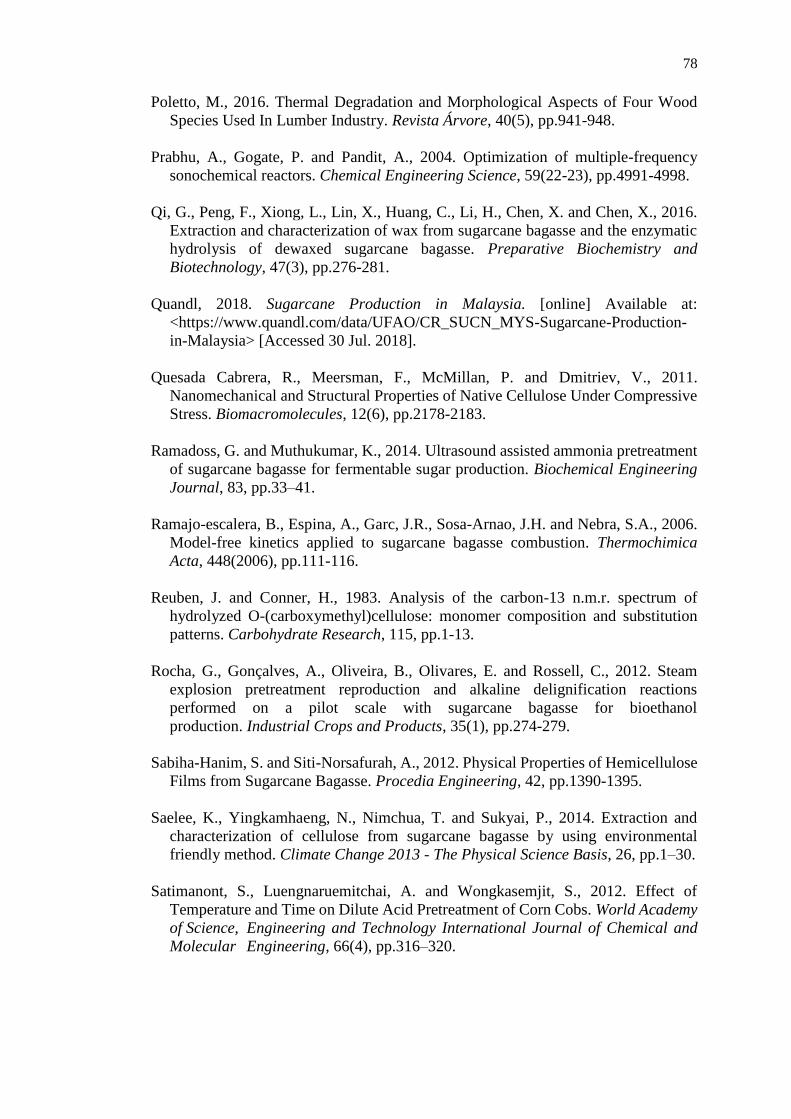
78
Poletto, M., 2016. Thermal Degradation and Morphological Aspects of Four Wood
Species Used In Lumber Industry. Revista Árvore, 40(5), pp.941-948.
Prabhu, A., Gogate, P. and Pandit, A., 2004. Optimization of multiple-frequency
sonochemical reactors. Chemical Engineering Science, 59(22-23), pp.4991-4998.
Qi, G., Peng, F., Xiong, L., Lin, X., Huang, C., Li, H., Chen, X. and Chen, X., 2016.
Extraction and characterization of wax from sugarcane bagasse and the enzymatic
hydrolysis of dewaxed sugarcane bagasse. Preparative Biochemistry and
Biotechnology, 47(3), pp.276-281.
Quandl, 2018. Sugarcane Production in Malaysia. [online] Available at:
<https://www.quandl.com/data/UFAO/CR_SUCN_MYS-Sugarcane-Production-
in-Malaysia> [Accessed 30 Jul. 2018].
Quesada Cabrera, R., Meersman, F., McMillan, P. and Dmitriev, V., 2011.
Nanomechanical and Structural Properties of Native Cellulose Under Compressive
Stress. Biomacromolecules, 12(6), pp.2178-2183.
Ramadoss, G. and Muthukumar, K., 2014. Ultrasound assisted ammonia pretreatment
of sugarcane bagasse for fermentable sugar production. Biochemical Engineering
Journal, 83, pp.33–41.
Ramajo-escalera, B., Espina, A., Garc, J.R., Sosa-Arnao, J.H. and Nebra, S.A., 2006.
Model-free kinetics applied to sugarcane bagasse combustion. Thermochimica
Acta, 448(2006), pp.111-116.
Reuben, J. and Conner, H., 1983. Analysis of the carbon-13 n.m.r. spectrum of
hydrolyzed O-(carboxymethyl)cellulose: monomer composition and substitution
patterns. Carbohydrate Research, 115, pp.1-13.
Rocha, G., Gonçalves, A., Oliveira, B., Olivares, E. and Rossell, C., 2012. Steam
explosion pretreatment reproduction and alkaline delignification reactions
performed on a pilot scale with sugarcane bagasse for bioethanol
production. Industrial Crops and Products, 35(1), pp.274-279.
Sabiha-Hanim, S. and Siti-Norsafurah, A., 2012. Physical Properties of Hemicellulose
Films from Sugarcane Bagasse. Procedia Engineering, 42, pp.1390-1395.
Saelee, K., Yingkamhaeng, N., Nimchua, T. and Sukyai, P., 2014. Extraction and
characterization of cellulose from sugarcane bagasse by using environmental
friendly method. Climate Change 2013 - The Physical Science Basis, 26, pp.1–30.
Satimanont, S., Luengnaruemitchai, A. and Wongkasemjit, S., 2012. Effect of
Temperature and Time on Dilute Acid Pretreatment of Corn Cobs. World Academy
of Science, Engineering and Technology International Journal of Chemical and
Molecular Engineering, 66(4), pp.316–320.

79
Segneanu, A., Cziple, F., Vlazan, P., Sfirloaga, P., Grozescu, I. and Gherman, V.D.,
2013. Biomass Extraction Methods. In: M.D. Matovic ed. Biomass Now -
Sustainable Growth and Use. InTech. pp.390–399.
Shariff, A., Mohamad Aziz, N., Ismail, N. and Abdullah, N., 2016. Corn Cob as a
Potential Feedstock for Slow Pyrolysis of Biomass. Journal of Physical Science,
27(2), pp.123-137.
Shibata, M., Varman, M., Tono, Y., Miyafuji, H. and Saka, S., 2008. Characterization
in Chemical Composition of the Oil Palm (Elaeis guineensis). Journal of the Japan
Institute of Energy, 87(5), pp.383-388.
Shokri, J. and Adibkia, K., 2013. Application of Cellulose and Cellulose Derivatives
in Pharmaceutical Industries. In: T. Van de Ven and L. Godbout, eds. Cellulose -
Medical, Pharmaceutical and Electronic Applications. Rijeka: InTech. pp. 47-66.
Shui, T., Feng, S., Chen, G., Li, A., Yuan, Z., Shui, H., Takashi, K. and Xu, C., 2017.
Synthesis of sodium carboxymethyl cellulose using bleached crude cellulose
fractionated from cornstalk. Biomass and Bioenergy, 105, pp.51–58.
Singh, R.K. and Singh, A.K., 2012. Optimization of reaction conditions for preparing
carboxymethyl cellulose from corn cobic agricultural waste. Waste and Biomass
Valorization, 4(1), pp.129–137.
Siritientong, T. and Aramwit, P., 2015. Characteristics of Carboxymethyl
Cellulose/Sericin Hydrogels and the Influence of Molecular Weight of
Carboxymethyl Cellulose. Macromolecular Research, 23(9), pp. 861–866.
Stark, N., Yelle, D. and Agarwal, U., 2015. Techniques for Characterizing Lignin. In:
O. Faruk and M. Sain, eds. Lignin in Polymer Composites. Canada: Elsevier. pp.49-
66.
Stigsson, V., Kloow, G. and Germgård, U., 2006. The influence of the solvent system
used during manufacturing of CMC. Cellulose, 13(6), pp.705-712.
Sun, J., Sun, R., Sun, X. and Su, Y., 2004. Fractional and physico-chemical
characterization of hemicelluloses from ultrasonic irradiated sugarcane
bagasse. Carbohydrate Research, 339(2), pp.291-300.
Sun, J.X., Sun, X.F., Zhao, H. and Sun, R.C., 2004. Isolation and characterization of
cellulose from sugarcane bagasse. Polymer Degradation and Stability, 84(2),
pp.331–339.
Sun, R. and Tomkinson, J., 2002. Comparative study of lignins isolated by alkali and
ultrasound-assisted alkali extractions from wheat straw. Ultrasonics
Sonochemistry, 9, pp.85–93.
Sun, R., Lawther, J.M. and Banks, W.B., 1995. Influence of alkaline pre-treatments
on the cell wall components of wheat straw. Industrial Crops and Products, 4,
pp.127–145.

80
Sun, Y. and Cheng, J., 2002. Hydrolysis of lignocellulosic materials for ethanol
production: a review. Bioresource Technology, 83(1), pp.1-11.
Supranto, S., Tawfiequrrahman, A. and Yunanto, D. E., 2015. Sugarcane bagasse
conversion to high refined cellulose using nitric acid, sodium hydroxide and
hydrogen peroxide as the delignificating agents. Journal of Engineering Science
and Technology, 10, pp. 35–46.
Taherzadeh, M. and Karimi, K., 2008. Pretreatment of Lignocellulosic Wastes to
Improve Ethanol and Biogas Production: A Review. International Journal of
Molecular Sciences, 9(9), pp.1621-1651.
Tasaso, P., 2015. Optimization of Reaction Conditions for Synthesis of
Carboxymethyl Cellulose from Oil Palm Fronds. International Journal of Chemical
Engineering and Applications, 6(2), pp.101-104.
Toǧrul, H. and Arslan, N., 2003. Production of carboxymethyl cellulose from sugar
beet pulp cellulose and rheological behaviour of carboxymethyl cellulose.
Carbohydrate Polymers, 54(1), pp.73–82.
Tufan, M., Uraz, E., Tosun, C. and Gercel, H., 2016. Synthesis and Characterization
of Carboxymethyl Cellulose Film From Pistachio Shells. International Journal of
Advances in Science, Engineering and Technology, (41), pp.2321–9009.
Ur Rehman, M.S., Kim, I., Chisti, Y. and Han, J.I., 2013. Use of ultrasound in the
production of bioethanol from lignocellulosic biomass. Energy Education Science
and Technology Part A: Energy Science and Research, 30(2), pp.1391–1410.
Varma, A.K. and Mondal, P., 2016. Physicochemical Characterization and Pyrolysis
Kinetic Study of Sugarcane Bagasse Using Thermogravimetric Analysis. Journal
of Energy Resources Technology, 138(5), pp.052205-1–052205-11.
Velmurugan, R. and Muthukumar, K., 2012. Ultrasound-assisted alkaline pretreatment
of sugarcane bagasse for fermentable sugar production : Optimization through
response surface methodology. Bioresource Technology, 112, pp.293–299.
Viera, R., Filho, G., de Assunção, R., S. Meireles, C., Vieira, J. and de Oliveira, G.,
2007. Synthesis and characterization of methylcellulose from sugar cane bagasse
cellulose. Carbohydrate Polymers, 67(2), pp.182-189.
Vilkhu, K., Mawson, R., Simons, L. and Bates, D., 2008. Applications and
opportunities for ultrasound assisted extraction in the food industry — A review.
Innovative Food Science and Emerging Technologies, 9, pp.161–169.
Waring, M. and Parsons, D., 2001. Physico-chemical characterisation of
carboxymethylated spun cellulose fibres. Biomaterials, 22(9), pp.903-912.
Wayman, M., 1958. The manufacture of chemical cellulose from wood. The
Canadian Journal of Chemical Engineering, 36(6), pp.271-276.

81
Wertz, J., Mercier, J. and Bedue, O., 2010. Cellulose science and technology. 1st ed.
Switzerland: EPFL Press.
Yang, H., Yan, R., Chen, H., Lee, D.H. and Zheng, C., 2007. Characteristics of
hemicellulose, cellulose and lignin pyrolysis. Fuel, 86(12–13), pp.1781–1788.
Zhang, A., Liu, C., Sun, R. and Xie, J., 2013. Extraction, Purification, and
Characterization of Lignin Fractions from Sugarcane Bagasse. BioResources, 8(2),
pp. 1604-1614.
Zhang, Z., Rackemann, D.W., Doherty, W.O.S. and O’Hara, I.M., 2013. Glycerol
carbonate as green solvent for pretreatment of sugarcane bagasse. Biotechnology
for Biofuels, 6(1), pp.1-10.
Zhao, H., Cheng, F., Li, G. and Zhang, J., 2003. Optimization of a process for
carboxymethyl cellulose (CMC) preparation in mixed solvents. International
Journal of Polymeric Materials, 52(9), pp.749-759.
Zhao, X., Cheng, K. and Liu, D., 2009. Organosolv pretreatment of lignocellulosic
biomass for enzymatic hydrolysis. Applied Microbiology and Biotechnology, 82(5),
pp.815–827.
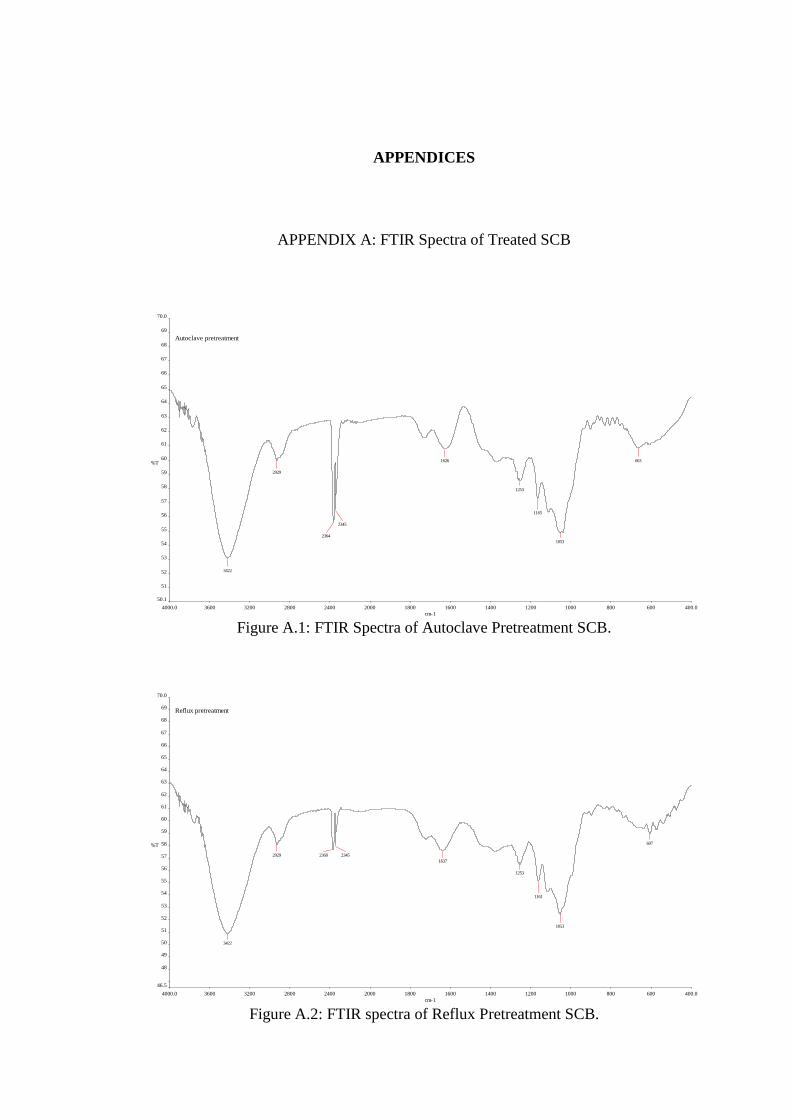
APPENDICES
APPENDIX A: FTIR Spectra of Treated SCB
Figure A.1: FTIR Spectra of Autoclave Pretreatment SCB.
Figure A.2: FTIR spectra of Reflux Pretreatment SCB.
4000.0 3600 3200 2800 2400 2000 1800 1600 1400 1200 1000 800 600 400.0
50.1
51
52
53
54
55
56
57
58
59
60
61
62
63
64
65
66
67
68
69
70.0
cm-1
%T
Autoclave pretreatment
3422
2929
2364
2345
1626
1253
1165
1053
663
4000.0 3600 3200 2800 2400 2000 1800 1600 1400 1200 1000 800 600 400.0
46.5
48
49
50
51
52
53
54
55
56
57
58
59
60
61
62
63
64
65
66
67
68
69
70.0
cm-1
%T
Reflux pretreatment
3422
2929 2368 2345
1637
1253
1161
1053
607

83
Figure A.3: FTIR Spectra of Autoclaved SCB with Ultrasonic Treatment.
Figure A.4: FTIR Spectra of Refluxed SCB with Ultrasonic Treatment.
4000.0 3600 3200 2800 2400 2000 1800 1600 1400 1200 1000 800 600 400.0
54.0
55
56
57
58
59
60
61
62
63
64
65
66
67
68.0
cm-1
%T
Autoclave with ultrasonic
3431
2928
2369
2345
1608
1052
611
1378
1105
900
4000.0 3600 3200 2800 2400 2000 1800 1600 1400 1200 1000 800 600 400.0
53.0
54
55
56
57
58
59
60
61
62
63
64
65
66
67
68.0
cm-1
%T
Reflux with ultrasonic
3422
2927
2345 2105
1608
1054
607
1376
897
1105

84
Figure A.5: FTIR Spectra of Treated SCB at Ultrasonic Amplitude of 20 %.
Figure A.6: FTIR Spectra of Treated SCB at Ultrasonic Amplitude of 30 %.
4000.0 3600 3200 2800 2400 2000 1800 1600 1400 1200 1000 800 600 400.0
48.0
49
50
51
52
53
54
55
56
57
58
59
60
61
62.0
cm-1
%T
Set 1 - Amplitude: 20%
3422
2373
2345
1607
1054
2927
897
4000.0 3600 3200 2800 2400 2000 1800 1600 1400 1200 1000 800 600 400.0
56.00
56.5
57.0
57.5
58.0
58.5
59.0
59.5
60.0
60.5
61.0
61.5
62.0
62.5
63.0
63.5
64.0
64.5
65.0
65.5
66.0
66.5
67.0
67.5
68.0
68.5
69.00
cm-1
%T
Set 2 - Amplitude:30%
3432
2928
2345
2139
1625
1055
608
1375
893

85
Figure A.7: FTIR Spectra of Treated SCB at Ultrasonic Amplitude of 40 %.
Figure A.8: FTIR Spectra of Treated SCB at Temperature of 70 oC.
4000.0 3600 3200 2800 2400 2000 1800 1600 1400 1200 1000 800 600 400.0
53.00
53.5
54.0
54.5
55.0
55.5
56.0
56.5
57.0
57.5
58.0
58.5
59.0
59.5
60.0
60.5
61.0
61.5
62.0
62.5
63.0
63.5
64.0
64.5
65.0
65.5
66.00
cm-1
%T
Set 3 - Amplitude:40%
3422
2928
2367
2345
1600
1054
618
897
4000.0 3600 3200 2800 2400 2000 1800 1600 1400 1200 1000 800 600 400.0
55.00
55.5
56.0
56.5
57.0
57.5
58.0
58.5
59.0
59.5
60.0
60.5
61.0
61.5
62.0
62.5
63.0
63.5
64.0
64.5
65.0
65.5
66.0
66.5
67.0
67.50
cm-1
%T
Set 4 - 70 degC
3432
2929
2367
2345
1638
10531380
1164
902
1095

86
Figure A.9: FTIR Spectra of Treated SCB at Temperature of 80 oC.
Figure A.10: FTIR Spectra of Treated SCB at Temperature of 90 oC.
4000.0 3600 3200 2800 2400 2000 1800 1600 1400 1200 1000 800 600 400.0
52.00
52.5
53.0
53.5
54.0
54.5
55.0
55.5
56.0
56.5
57.0
57.5
58.0
58.5
59.0
59.5
60.0
60.5
61.0
61.5
62.0
62.5
63.00
cm-1
%T
Set 5 - 80 degC
3423
2375
2345
1654
1064
29271168
1373
897
4000.0 3600 3200 2800 2400 2000 1800 1600 1400 1200 1000 800 600 400.0
53.00
53.5
54.0
54.5
55.0
55.5
56.0
56.5
57.0
57.5
58.0
58.5
59.0
59.5
60.0
60.5
61.0
61.5
62.0
62.5
63.0
63.5
64.0
64.5
65.00
cm-1
%T
Set 6 - 90 degC
3422
2925
2367
2345
1600
1055
669
1376
902
1107

87
Figure A.11: FTIR Spectra of Treated SCB at KOH Concentration of 0.25 M.
Figure A.12: FTIR Spectra of Treated SCB at KOH Concentration of 0.50 M.
4000.0 3600 3200 2800 2400 2000 1800 1600 1400 1200 1000 800 600 400.0
60.00
60.5
61.0
61.5
62.0
62.5
63.0
63.5
64.0
64.5
65.0
65.5
66.0
66.5
67.0
67.5
68.0
68.5
69.0
69.5
70.0
70.5
71.00
cm-1
%T
Set 7 - 0.25M
3422
2917
2365
2345
1599
1033
669
1375
1109
912
4000.0 3600 3200 2800 2400 2000 1800 1600 1400 1200 1000 800 600 400.0
58.00
58.5
59.0
59.5
60.0
60.5
61.0
61.5
62.0
62.5
63.0
63.5
64.0
64.5
65.0
65.5
66.0
66.5
67.0
67.5
68.0
68.5
69.00
cm-1
%T
Set 8 - 0.50M
3422
2917
2365
2345
1637
1053
594
559
1373
1112
897

88
Figure A.13: FTIR Spectra of Treated SCB at KOH Concentration of 0.75 M.
Figure A.14: FTIR Spectra of Treated SCB at KOH Concentration of 1.0 M.
4000.0 3600 3200 2800 2400 2000 1800 1600 1400 1200 1000 800 600 400.0
55.00
55.5
56.0
56.5
57.0
57.5
58.0
58.5
59.0
59.5
60.0
60.5
61.0
61.5
62.0
62.5
63.0
63.5
64.0
64.5
65.00
cm-1
%T
Set 9 - 0.75M
3433
2917
2370
2345
1638
1054
1375
1116
891
4000.0 3600 3200 2800 2400 2000 1800 1600 1400 1200 1000 800 600 400.0
47.0
48
49
50
51
52
53
54
55
56
57
58
59
60
61
62
63
64.0
cm-1
%T
Set 10 - 1.0M
3421
2916
2372
2345
1638
1371
1061
899
610
1105

89
Figure A.15: FTIR Spectra of Treated SCB at KOH Concentration of 1.25 M.
4000.0 3600 3200 2800 2400 2000 1800 1600 1400 1200 1000 800 600 400.0
46.00
46.5
47.0
47.5
48.0
48.5
49.0
49.5
50.0
50.5
51.0
51.5
52.0
52.5
53.0
53.5
54.0
54.5
55.0
55.5
56.0
56.5
57.0
57.5
58.00
cm-1
%T
Set 11 - 1.25M
3435
2369
2345
1638
1059
618
2930 1378
1105
891

90
APPENDIX B: DSC Thermograph of Treated SCB
Figure B.1: DSC Thermograph of Refluxed SCB with Ultrasonic Treatment.
Figure B.2: DSC Thermograph of Autoclaved SCB with Ultrasonic Treatment.

91
Figure B.3: DSC Thermograph of Treated SCB at Ultrasonic Amplitude of 20 %.
Figure B.4: DSC Thermograph of Treated SCB at Ultrasonic Amplitude of 30 %.

92
Figure B.5: DSC Thermograph of Treated SCB at Ultrasonic Amplitude of 40 %.
Figure B.6: DSC Thermograph of Treated SCB at Temperature of 70 oC.

93
Figure B.7: DSC Thermograph of Treated SCB at Temperature of 80 oC.
Figure B.8: DSC Thermograph of Treated SCB at Temperature of 90 oC.

94
Figure B.9: DSC Thermograph of Treated SCB at KOH Concentration of 0.25 M.
Figure B.10: DSC Thermograph of Treated SCB at KOH Concentration of 0.50 M.

95
Figure B.11: DSC Thermograph of Treated SCB at KOH Concentration of 0.75 M.
Figure B.12: DSC Thermograph of Treated SCB at KOH Concentration of 1.0 M.

96
Figure B.13: DSC Thermograph of Treated SCB at KOH Concentration of 1.25 M.

97
APPENDIX C: HPLC Calibration Curve for Dextrose
Figure C.1: HPLC Analysis for Dextrose at 0.4 g/L.
Figure C.2: Dextrose Calibration Curve.
y = 245652x
R² = 0.9986
0
50000
100000
150000
200000
250000
300000
0 0.2 0.4 0.6 0.8 1 1.2
HP
LC
Are
a
Concentration (g/L)

98
APPENDIX D: HPLC Calibration Curve for Xylose
Figure D.1: HPLC Analysis for Xylose at 0.4 g/L.
Figure D.2: Xylose Calibration Curve.
y = 244412x
R² = 0.9987
0
50000
100000
150000
200000
250000
300000
0 0.2 0.4 0.6 0.8 1 1.2
HP
LC
Are
a
Concentration (g/L)

99
APPENDIX E: HPLC Calibration Curve for Arabinose
Figure E.1: HPLC Analysis for Arabinose at 0.4 g/L.
Figure E.2: Arabinose Calibration Curve.
y = 269291x
R² = 0.9897
0
50000
100000
150000
200000
250000
300000
0 0.2 0.4 0.6 0.8 1 1.2
HP
LC
Are
a
Concentration (g/L)

100
APPENDIX F: Calculation of Carbohydrate Content of Sugarcane Bagasse in HPLC
Figure F.1: HPLC Chromatogram of Sugarcane Bagasse.
(I) From calibration curve of HPLC area vs concentration of dextrose:
y = 245652x
HPLC area obtained at 10.008 minutes = 169801
169801 = 245652x
x = 0.6912 g/L
M1V1 = M2V2
M1 [5 mL] = [0.6912 g/L] [10 mL]
M1 = 1.3825 g/L
Dextrose content = concentration (M1) x total volume
= 1.3825 g/L x 0.089 L
= 0.1230 g
(II) From calibration curve of HPLC area vs concentration of xylose:
y = 244412x
HPLC area obtained at 10.636 minutes = 72719
72719 = 244412x
x = 0.2975 g/L

101
M1V1 = M2V2
M1 [5 mL] = [0.2975 g/L] [10 mL]
M1 = 0.5951 g/L
Xylose content = concentration (M1) x total volume
= 0.5951 g/L x 0.089 L
= 0.0530 g
(III) From calibration curve of HPLC area vs concentration of arabinose:
y = 269291x
HPLC area obtained at 11.443 minutes = 25247.1
25247.1 = 269291x
x = 0.0938 g/L
M1V1 = M2V2
M1 [5 mL] = [0.0938 g/L] [10 mL]
M1 = 0.1875 g/L
Arabinose content = concentration (M1) x total volume
= 0.1875 g/L x 0.089 L
= 0.0167 g
(IV) Mass of estimated cellulose content
= [0.1230 g / 0.3 g x 100 %] x 0.3 g
= 0.1230 g
(V) Total carbohydrates content in weight percentage
= [0.1230 g + 0.0530 g + 0.0167 g] / 0.3 g x 100 %
= 64.23 wt %
(VI) Mass of estimated carbohydrate content
= 64.23 wt % x 0.3 g
= 0.1927 g

102
APPENDIX G: HPLC Analysis of Autoclaved and Refluxed SCB with Ultrasonic
Treatment
Figure G.1: HPLC Chromatogram of Autoclaved SCB with Ultrasonic Treatment.
(I) From calibration curve of HPLC area vs concentration of dextrose:
y = 245652x
HPLC area obtained at 10.014 minutes = 317534
317534 = 245652x
x = 1.2926 g/L
M1V1 = M2V2
M1 [5 mL] = [1.2926 g/L] [10 mL]
M1 = 2.5852 g/L
Dextrose content = concentration (M1) x total volume
= 2.5852 g/L x 0.088 L
= 0.2275 g
(II) From calibration curve of HPLC area vs concentration of xylose:
y = 244412x
HPLC area obtained at 10.641 minutes = 54025.5
54025.5 = 244412x
x = 0.2210 g/L

103
M1V1 = M2V2
M1 [5 mL] = [0.2210 g/L] [10 mL]
M1 = 0.4421 g/L
Xylose content = concentration (M1) x total volume
= 0.4421 g/L x 0.088 L
= 0.0389 g
(III) From calibration curve of HPLC area vs concentration of arabinose:
y = 269291x
HPLC area obtained at 11.446 minutes = 18746.8
18746.8 = 269291x
x = 0.0696 g/L
M1V1 = M2V2
M1 [5 mL] = [0.0696 g/L] [10 mL]
M1 = 0.1392 g/L
Arabinose content = concentration (M1) x total volume
= 0.1392 g/L x 0.088 L
= 0.0122 g
(IV) Mass of estimated cellulose content
= [0.2275 g / 0.3 g x 100 %] x 2.3171 g
= 1.7571 g
(V) Total carbohydrates content in weight percentage
= [0.2275 g + 0.0389 g + 0.0122 g] / 0.3 g x 100 %
= 92.89 wt %
(VI) Mass of estimated carbohydrate content
= 92.89 wt % x 2.3171 g
= 2.1523 g

104
Figure G.2: HPLC Chromatogram of Refluxed SCB with Ultrasonic Treatment.
(I) From calibration curve of HPLC area vs concentration of dextrose:
y = 245652x
HPLC area obtained at 10.007 minutes = 305067
305067 = 245652x
x = 1.2419 g/L
M1V1 = M2V2
M1 [5 mL] = [1.2419 g/L] [10 mL]
M1 = 2.4837 g/L
Dextrose content = concentration (M1) x total volume
= 2.4837 g/L x 0.088 L
= 0.2186 g
(II) From calibration curve of HPLC area vs concentration of xylose:
y = 244412x
HPLC area obtained at 10.634 minutes = 66191
66191 = 244412x
x = 0.2708 g/L

105
M1V1 = M2V2
M1 [5 mL] = [0.2708 g/L] [10 mL]
M1 = 0.5416 g/L
Xylose content = concentration (M1) x total volume
= 0.5416 g/L x 0.088 L
= 0.0477 g
(III) From calibration curve of HPLC area vs concentration of arabinose:
y = 269291x
HPLC area obtained at 11.441 minutes = 33043.6
33043.6 = 269291x
x = 0.1227 g/L
M1V1 = M2V2
M1 [5 mL] = [0.1227 g/L] [10 mL]
M1 = 0.2454 g/L
Arabinose content = concentration (M1) x total volume
= 0.2454 g/L x 0.088 L
= 0.0216 g
(IV) Mass of estimated cellulose content
= [0.2186 g / 0.3 g x 100 %] x 2.4557 g
= 1.7891 g
(V) Total carbohydrates content in weight percentage
= [0.2186 g + 0.0477 g + 0.0216 g] / 0.3 g x 100 %
= 95.94 wt %
(VI) Mass of estimated carbohydrate content
= 95.94 wt % x 2.4557 g
= 2.3560 g

106
APPENDIX H: HPLC Analysis of Treated SCB at Different Ultrasonic Amplitude
Figure H.1: HPLC Chromatogram of Treated SCB at Ultrasonic Amplitude of 20 %.
(I) From calibration curve of HPLC area vs concentration of dextrose:
y = 245652x
HPLC area obtained at 9.999 minutes = 294963
294963 = 245652x
x = 1.2007 g/L
M1V1 = M2V2
M1 [5 mL] = [1.2007 g/L] [10 mL]
M1 = 2.4015 g/L
Dextrose content = concentration (M1) x total volume
= 2.4015 g/L x 0.088 L
= 0.2113 g
(II) From calibration curve of HPLC area vs concentration of xylose:
y = 244412x
HPLC area obtained at 10.625 minutes = 43564.9
43564.9 = 244412x
x = 0.1782 g/L

107
M1V1 = M2V2
M1 [5 mL] = [0.1782 g/L] [10 mL]
M1 = 0.3565 g/L
Xylose content = concentration (M1) x total volume
= 0.3565 g/L x 0.088 L
= 0.0314 g
(III) From calibration curve of HPLC area vs concentration of arabinose:
y = 269291x
HPLC area obtained at 11.422 minutes = 7415.25
7415.25 = 269291x
x = 0.0275 g/L
M1V1 = M2V2
M1 [5 mL] = [0.0275 g/L] [10 mL]
M1 = 0.0551 g/L
Arabinose content = concentration (M1) x total volume
= 0.0551 g/L x 0.088 L
= 0.0048 g
(IV) Mass of estimated cellulose content
= [0.2113 g / 0.3 g x 100 %] x 2.3893 g
= 1.6831 g
(V) Total carbohydrates content in weight percentage
= [0.2113 g + 0.0314 g + 0.0048 g] / 0.3 g x 100 %
= 82.52 wt %
(VI) Mass of estimated carbohydrate content
= 82.52 wt % x 2.3893 g
= 1.9715 g

108
Figure H.2: HPLC Chromatogram of Treated SCB at Ultrasonic Amplitude of 30 %.
Figure H.3: HPLC Chromatogram of Treated SCB at Ultrasonic Amplitude of 40 %.
Table H.1: Summary of Total Carbohydrate Content in Treated SCB at Different
Ultrasonic Amplitude.
Ultrasonic amplitude 20 % 30 % 40 %
Dextrose Retention time, (min) 9.999 10.002 9.998
Mass, (g) 0.2113 0.2217 0.1697
Xylose Retention time, (min) 10.625 10.628 10.625
Mass, (g) 0.0314 0.0293 0.0300
Arabinose Retention time, (min) 11.422 11.425 11.418
Mass, (g) 0.0049 0.0119 0.0006
Mass of total carbohydrate, (g) 1.9715 2.0930 1.8508
Mass of estimated cellulose, (g) 1.6831 1.7645 1.5263

109
APPENDIX I: HPLC Analysis of Treated SCB at Different Temperature
Figure I.1: HPLC Chromatogram of Treated SCB at Temperature of 70 oC.
(I) From calibration curve of HPLC area vs concentration of dextrose:
y = 245652x
HPLC area obtained at 10.002 minutes = 266933 g/L
y = 245652x
266933 = 245652x
x = 1.0866 g/L
M1V1 = M2V2
M1 [5 mL] = [1.0866 g/L] [10 mL]
M1 = 2.1733 g/L
Dextrose content = concentration (M1) x total volume
= 2.1733 g/L x 0.088 L
= 0.1912 g
(II) From calibration curve of HPLC area vs concentration of xylose:
y = 244412x
HPLC area obtained at 10.628 minutes = 39404.9
39404.9 = 244412x
x = 0.1612 g/L

110
M1V1 = M2V2
M1 [5 mL] = [0.1612 g/L] [10 mL]
M1 = 0.3225 g/L
Xylose content = concentration (M1) x total volume
= 0.3225 g/L x 0.088 L
= 0.0284 g
(III) From calibration curve of HPLC area vs concentration of arabinose:
y = 269291x
HPLC area obtained at 11.425 minutes = 7867.73
7867.73 = 269291x
x = 0.0292 g/L
M1V1 = M2V2
M1 [5 mL] = [0.0292 g/L] [10 mL]
M1 = 0.0584 g/L
Arabinose content = concentration (M1) x total volume
= 0.0584 g/L x 0.088 L
= 0.0051 g
(IV) Mass of estimated cellulose content
= [0.1912 g / 0.3 g x 100 %] x 2.5236 g
= 1.6088 g
(V) Total carbohydrates content in weight percentage
= [0.1912 g + 0.0284 g + 0.0051 g] / 0.3 g x 100 %
= 74.92 wt %
(VI) Mass of estimated carbohydrate content
= 74.92 wt % x 2.5236 g
= 1.8907 g

111
Figure I.2: HPLC Chromatogram of Treated SCB at Temperature of 80 oC.
Figure I.3: HPLC Chromatogram of Treated SCB at Temperature of 90 oC.
Table I.1: Summary of Total Carbohydrate Content in Treated SCB at Different
Temperature.
Temperature 70 oC 80 oC 90 oC
Dextrose Retention time, (min) 10.002 10.005 10.007
Mass, (g) 0.1912 0.2109 0.2208
Xylose Retention time, (min) 10.628 10.631 10.634
Mass, (g) 0.0284 0.0286 0.0292
Arabinose Retention time, (min) 11.425 11.421 11.427
Mass, (g) 0.0051 0.0105 0.0063
Mass of total carbohydrate, (g) 1.8907 2.0237 1.9674
Mass of estimated cellulose, (g) 1.6088 1.7079 1.6950

112
APPENDIX J: HPLC Analysis of Treated SCB at Different KOH Concentration
Figure J.1: HPLC Chromatogram of Treated SCB at KOH Concentration of 0.25 M.
(I) From calibration curve of HPLC area vs concentration of dextrose:
y = 245652x
HPLC area obtained at 10.001 minutes = 275618
275618 = 245652x
x = 1.1220 g/L
M1V1 = M2V2
M1 [5 mL] = [1.1220 g/L] [10 mL]
M1 = 2.2440 g/L
Dextrose content = concentration (M1) x total volume
= 2.2440 g/L x 0.088 L
= 0.1975 g
(II) From calibration curve of HPLC area vs concentration of xylose:
y = 244412x
HPLC area obtained at 10.629 minutes = 73008.5 g/L
73008.5 = 244412x
x = 0.2987 g/L

113
M1V1 = M2V2
M1 [5 mL] = [0.2987 g/L] [10 mL]
M1 = 0.5974 g/L
Xylose content = concentration (M1) x total volume
= 0.5974 g/L x 0.088 L
= 0.0526 g
(III) From calibration curve of HPLC area vs concentration of arabinose:
y = 269291x
HPLC area obtained at 11.426 minutes = 16585
16585 = 269291x
x = 0.0616 g/L
M1V1 = M2V2
M1 [5 mL] = [0.0616 g/L] [10 mL]
M1 = 0.1232 g/L
Arabinose content = concentration (M1) x total volume
= 0.1232 g/L x 0.088 L
= 0.0108 g
(IV) Mass of estimated cellulose content
= [0.1975 g / 0.3 g x 100 %] x 2.8360 g
= 1.8668 g
(V) Total carbohydrates content in weight percentage
= [0.1975 g + 0.0526 g + 0.0108 g] / 0.3 g x 100 %
= 86.96 wt %
(VI) Mass of estimated carbohydrate content
= 86.96 wt % x 2.8360 g
= 2.4662 g

114
Figure J.2: HPLC Chromatogram of Treated SCB at KOH Concentration of 0.50 M.
Figure J.3: HPLC Chromatogram of Treated SCB at KOH Concentration of 0.75 M.
Figure J.4: HPLC Chromatogram of Treated SCB at KOH Concentration of 1.0 M.

115
Figure J.5: HPLC Chromatogram of Treated SCB at KOH Concentration of 1.25 M.
Table J.1: Summary of Total Carbohydrate Content in Treated SCB at Different
KOH Concentration.
KOH concentration 0.25 M 0.50 M 0.75 M 1.0 M 1.25 M
Dextrose
Retention
time, (min)
10.001 10.004 10.008 10.003 10.004
Mass, (g) 0.1975 0.2071 0.2203 0.2280 0.2497
Xylose
Retention
time, (min)
10.629 10.631 10.634 10.629 10.628
Mass, (g) 0.0526 0.0362 0.0299 0.0241 0.0181
Arabinose
Retention
time, (min)
11.426 11.433 11.437 11.433 11.435
Mass, (g) 0.0108 0.0137 0.0068 0.0051 0.0040
Mass of total
carbohydrate, (g)
2.4662 2.1858 2.0497 1.9539 1.9717
Mass of estimated
cellulose, (g)
1.8668 1.7618 1.7571 1.7318 1.8116

116
APPENDIX K: Yield of CMC
Table K.1: Yield of CMC.
Mass of extracted
cellulose (g)
Mass of CMC, (g) Yield of
CMC, %(w/w)
5.0034 8.2779 165.45
APPENDIX L: Calculation of Degree of Substitution
From Equation 3.4,
A = 𝐵𝐶 − 𝐷𝐸
𝐹
= 25 (0.3) − 21.7(0.3)
0.5
= 1.98
Equation 3.3 is used to calculate degree of substitution by substituting the calculated
A value.
Degree of Substitution = 0.162 𝑥 𝐴
1 − 0.058 𝑥 𝐴
= 0.162 𝑥 1.98
1 − 0.058 𝑥 1.98
= 0.3624