Embed Size (px)
Citation preview

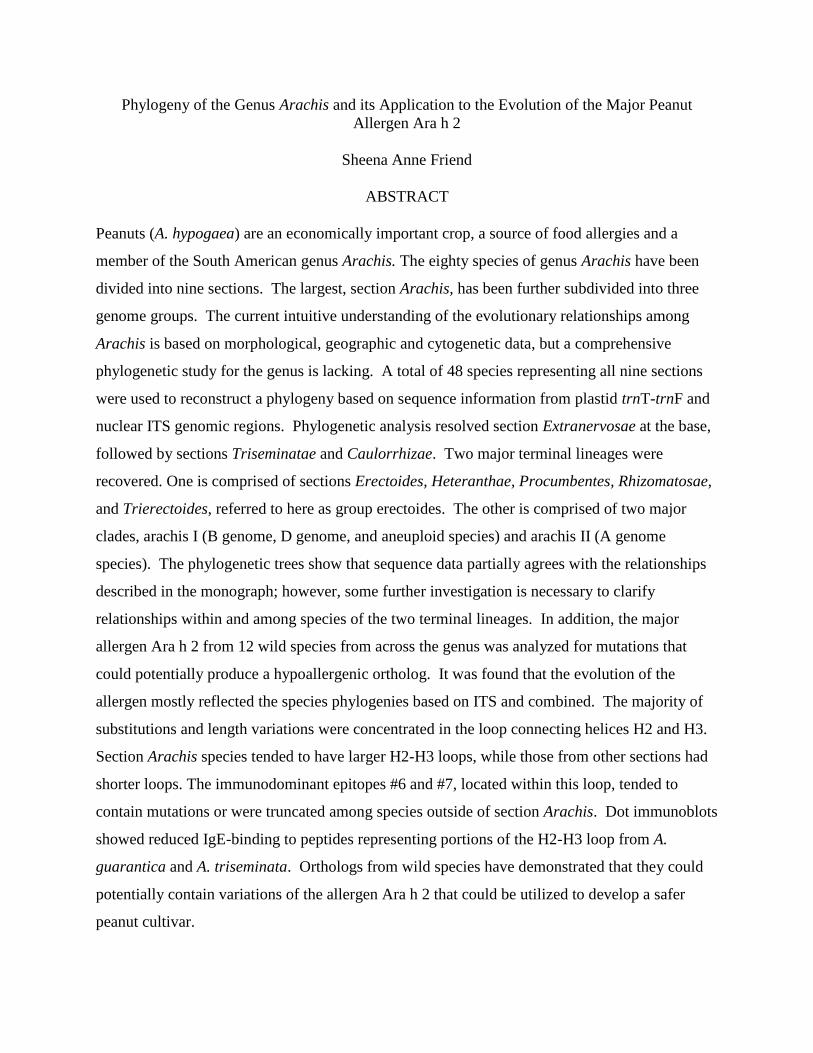
Phylogeny of the Genus Arachis and its Application to the Evolution of the Major Peanut
Allergen Ara h 2
Sheena Anne Friend
Dissertation submitted to the faculty of the Virginia Polytechnic Institute and State University in
partial fulfillment of the requirements for the degree of
Doctor of Philosophy
In
Biological Sciences
Khidir W. Hilu, Chair
David R. Bevan
Liwu Li
Jill C. Sible
August 6, 2010
Blacksburg, Virginia
Keywords: Arachis, peanut, phylogeny, Ara h 2, evolution
Copyright 2010, Sheena Anne Friend
Phylogeny of the Genus Arachis and its Application to the Evolution of the Major Peanut
Allergen Ara h 2
Sheena Anne Friend
ABSTRACT
Peanuts (A. hypogaea) are an economically important crop, a source of food allergies and a
member of the South American genus Arachis. The eighty species of genus Arachis have been
divided into nine sections. The largest, section Arachis, has been further subdivided into three
genome groups. The current intuitive understanding of the evolutionary relationships among
Arachis is based on morphological, geographic and cytogenetic data, but a comprehensive
phylogenetic study for the genus is lacking. A total of 48 species representing all nine sections
were used to reconstruct a phylogeny based on sequence information from plastid trnT-trnF and
nuclear ITS genomic regions. Phylogenetic analysis resolved section Extranervosae at the base,
followed by sections Triseminatae and Caulorrhizae. Two major terminal lineages were
recovered. One is comprised of sections Erectoides, Heteranthae, Procumbentes, Rhizomatosae,
and Trierectoides, referred to here as group erectoides. The other is comprised of two major
clades, arachis I (B genome, D genome, and aneuploid species) and arachis II (A genome
species). The phylogenetic trees show that sequence data partially agrees with the relationships
described in the monograph; however, some further investigation is necessary to clarify
relationships within and among species of the two terminal lineages. In addition, the major
allergen Ara h 2 from 12 wild species from across the genus was analyzed for mutations that
could potentially produce a hypoallergenic ortholog. It was found that the evolution of the
allergen mostly reflected the species phylogenies based on ITS and combined. The majority of
substitutions and length variations were concentrated in the loop connecting helices H2 and H3.
Section Arachis species tended to have larger H2-H3 loops, while those from other sections had
shorter loops. The immunodominant epitopes #6 and #7, located within this loop, tended to
contain mutations or were truncated among species outside of section Arachis. Dot immunoblots
showed reduced IgE-binding to peptides representing portions of the H2-H3 loop from A.
guarantica and A. triseminata. Orthologs from wild species have demonstrated that they could
potentially contain variations of the allergen Ara h 2 that could be utilized to develop a safer
peanut cultivar.

iii
ACKNOWLEDGEMENTS
Dr. Khidir Hilu invited me to join his lab as an undergraduate and gave me the
opportunity to continue the peanut project as a graduate student. He has provided me with the
encouragement and support throughout my graduate education, for which I could not thank him
enough. I also am very thankful for the guidance from my committee members, Dr. David
Bevan, Dr. Liwu Li, and Dr. Jill Sible. Their advice and willingness to meet with me were a
tremendous help throughout this project.
I would like to thank the former and current members of the Hilu lab, who were more
than just lab mates. Dr. Michelle Barthet-Parker, you were a great inspiration and mentor when I
was an undergraduate and during the beginning of my graduate education. Sunny Crawley,
you’ve helped me troubleshoot problems in research, been my partner in crime in our adventures
in pedagogy, and most of all, has been a great friend. Chelsea Black, Daniel Serrano, Muni Ali,
and Rachel Maczis, your enthusiasm for the project was such a joy, and I thank so much for all
the help you gave. Dr. Dietmar Quandt, thank you for the guidance on the analyses for the
phylogeny chapter. Adrianna, Dipan, Stephanie, Atia, Keenan and Brittany: you all help keep
things in the lab fun.
I also would like to thank my parents, Ralph and Teresa Friend, my siblings, Christina
Pittman and Steven Friend, and my grandmother, Josefa Esguerra, for their never-ending love
and support.
I thank Mary Wilkerson for reviewing many parts of my dissertation and keeping cookies
and other desserts in the kitchen!

iv
Last but not least, I would like to thank Aaron Elliott. You are my greatest support and
source of encouragement. Thank you for reviewing the majority of my dissertation. Most of all, I
thank you for patiently waiting for me as I worked on my degree.
DEDICATION
I dedicate this dissertation to my family who has supported their “forever student” in all of my
academic pursuits.
I also dedicate this to my fellow Hokies, whom we lost on April 16, 2007, especially Ryan
Christopher Clark and Michael Steven Pohle, Jr.

v
Table of Content
CHAPTER 1: Literature Review 1
Introduction 2
Genus Arachis 6
Taxonomy and Geographic Distribution 6
Arachis hypogaea gene pools 8
Evolutionary relationships among the sections of Arachis 12
Genomes of Section Arachis 16
Origin of the tetraploid crop peanut, A. hypogaea 19
Peanut allergy 22
Peanut allergens 22
Conglutin Allergen: Ara h 2 26
Homology Modeling 29
Homology models of the Ara h 2 allergen from the peanut crop 31
Project Objectives 34
Literature Cited 35
CHAPTER 2: Species, genomes and section relationships in genus Arachis (Fabaceae): A
molecular phylogeny 43
Abstract 44
Introduction 45
Materials and methods 48
Taxon sampling 48
DNA extraction, amplification, cloning, and sequencing 49
Cloning and sequencing of sec. Arachis tetraploid ITS alleles 50
Sequence alignment and phylogenetic analyses 50
Results 56
ITS alleles and sequence statistics 56
ITS based phylogeny 57
trnT-trnF based phylogeny 69
Phylogenies based on combined ITS and trnT-trnF data 72
Discussion 75

vi
Molecular Evolution 75
Phylogeny of the genus Arachis 77
Systematic implication 85
Literature Cited 89
CHAPTER 3: In search of a hypoallergenic peanut among wild relatives 96
Abstract 97
Introduction 98
Materials and Methods 100
Amplification of Ara h 2 orthologs 100
Sequence alignment and phylogenetic analysis 102
In silico protein structure characterization: secondary structure prediction and solvent
accessibility 102
Homology models of Ara h 2 orthologs 103
Epitope prediction 104
Human sera 105
Dot immunoblots of epitope orthologs from wild Arachis conglutin proteins 105
Results 106
Nucleic acid and peptide sequences of orthologs from Ara h 2 106
Phylogenetic relationships among Ara h 2 orthologs 107
Secondary and tertiary structures among Ara h 2 orthologs 113
Antibody binding to peptides representing part of loop region within Ara h 2 orthologs 118
Discussion 125
Literature Cited 132
CHAPTER 4: General Conclusions 137
Research Influence on my Teaching Philosophy 142
Literature Cited 143
APPENDIX A: Acknowledgements 146
APPENDIX B: Homology Model Assessment 148
APPENDIX C: Predicted Secondary Structure and Epitopes among Ara h 2 Orthologs from
Arachis Species 176
vii
Table of Figures
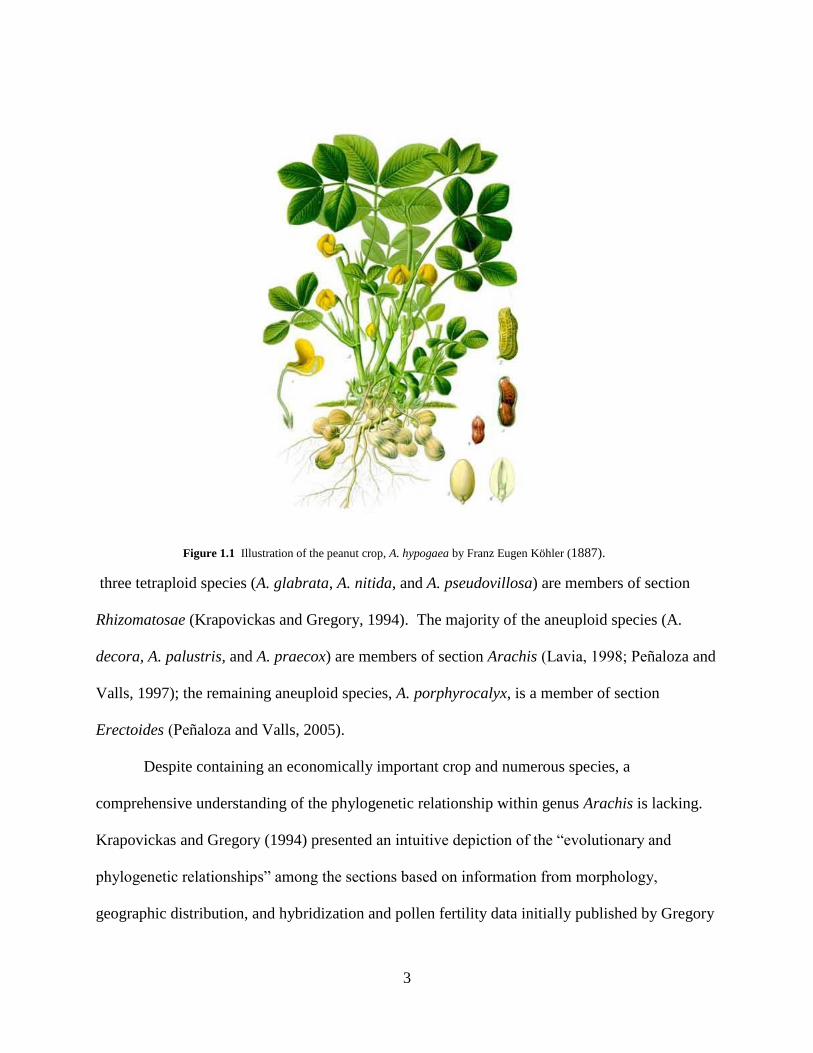
Figure 1.1 Illustration of the peanut crop, A. hypogaea by Franz Eugen Köhler (1887). 3
Figure 1.2 Geographic distribution of Arachis species across South America as described by
Krapovickas and Gregory (1994) shown in gray shaded area. 10
Figure 1.3 Gene pools for the peanut crop Arachis hypogaea. 11
Figure 1.4 Sectional relationships within genus Arachis presented in the monograph by
Krapovickas and Gregory, (1994). 14
Figure 1.5 NMR-determined structures of (A) Ric C 2 (PDB ID 1PSY) from castor bean
(Ricinus communis; Pantoja-Uceda et al. 2003and (B) Ara h 6 (PDB ID 1W2Q) from
peanut (Arachis hypogaea; Lehmann et al., 2006), which have been used as template
structures for homology models of Ara h 2 from A. hypogaea. 32
Figure 2.1 Examples of chromatograms of sec. Arachis allotetraploids ITS sequences showing
double peaks and a singleton base-pair insertion. 58
Figure 2.2 Haplotype networks for sec. Arachis diploid species and clones for the
allotetraploids A. hypogaea (H) and A. monticola (M): a. ITS1 and b. ITS2 regions. 59
Figure 2.3 Bayesian inference 50% phylogeny majority rule consensus trees for Arachis rooted
with Stylosanthes humilis and S. fruticosa and used GTR+Γ+I model based on sequences
from nuclear ribosomal ITS region (left) and trnT-trnF region (right). 63
Figure 2.4 Arachis phylogeny generated using Bayesian inference based on ITS expanded
dataset, indels coded as characters, and GTR+Γ+I model. 66
Figure 2.5 Arachis phylogeny based on combined ITS and trnT-trnF datasets analyzed with BI,
indels included as characters. 73
Figure 3.1 Amino acid sequences of Ara h 2 orthologs from twelve wild Arachis species aligned
with the two isoforms from the peanut crop (Ara h 2.01 and Ara h 2.02). 111
Figure 3.2 Strict consensus trees based on (A) nucleotide and (B) peptide sequences analyzed
using MP 114
Figure 3.3 Model of Ara h 2 ortholog from Arachis duranensis (green) compared to the Ara h 6
template (PDB ID 1W2Q; gray). 117
Figure 3.4 Homology models of Ara h 2 orthologs from section Arachis species generated by
Modeller 9v6. 119
Figure 3.5 Predicted epitopes for Ara h 2 ortholog from A. batizocoi. 122

viii
Figure 3.6 A. Dot Immunoblot of Ara h 2 ortholog peptides. 124
Figure B.1 ANOLEA energy plot for Ara h 6 (PDB ID 1W2Q) template from the crop, A.
hypogaea. 150
Figure B.2 ANOLEA energy plot for Ara h 2 ortholog from A. batizocoi (section Arachis). 151
Figure B.3 ANOLEA energy plot for Ara h 2 ortholog from A. duranensis/A. hypogaea Ara h
2.01 (section Arachis). 152
Figure B.4 ANOLEA energy plot for Ara h 2 ortholog from A. glandulifera (section Arachis).
153
Figure B. 5 ANOLEA energy plot for Ara h 2 ortholog from A. ipaensis/A. hypogaea Ara h 2.02
(section Arachis). 154
Figure B.6 ANOLEA energy plot for Ara h 2 ortholog from A. palustris (section Arachis). 155
Figure B.7 ANOLEA energy plot for Ara h 2 ortholog from A. pintoi (section Caulorrhizae).
156
Figure B.8 ANOLEA energy plot for Ara h 2 ortholog from A. paraguariensis (section
Erectoides). 157
Figure B.9 ANOLEA energy plot for Ara h 2 ortholog from A. macedoi (section
Extranervosae). 158
Figure B.10 ANOLEA energy plot for Ara h 2 ortholog from A. dardani (section Heteranthae).
159
Figure B.11 ANOLEA energy plot for Ara h 2 ortholog from A. rigonii (section Procumbentes).
160
Figure B.12 ANOLEA energy plot for Ara h 2 ortholog from A. guarantica (section
Trierectoides). 161
Figure B.13 ANOLEA energy plot for Ara h 2 ortholog from A. triseminata (section
Triseminatae). 162
Figure B.14 A. ProSA overall model quality, shows the template Ara h 6 (PDB ID) scored as
well as other structures that were determined using NMR. 163
Figure B.15 A. ProSA overall model quality, shows the model of the A. batizocoi Ara h 2
ortholog scored as well as an NMR-determined structure. 164
Figure B.16 A. ProSA overall model quality, shows the model of the A. dardani (section
Heteranthae) Ara h 2 ortholog scored as well as an NMR-determined structure. 165
ix
Figure B.17 A. ProSA overall model quality, shows the model of the A. duranensis/ Ara h
2.01scored as well as an NMR-determined structure. 166
Figure B.18 A. ProSA overall model quality, shows the model of the A. glandulifera Ara h 2
ortholog scored as well as an NMR-determined structure. 167
Figure B.19 A. ProSA overall model quality, shows the model of the A. guarantica (section
Trierectoides) Ara h 2 ortholog scored as well as an NMR-determined structure. 168
Figure B.20 A. ProSA overall model quality, shows the model of the A. ipaensis/Ara h 2.02
ortholog scored as well as an NMR-determined structure. 169
Figure B.21. A. ProSA overall model quality, shows the model of the A. macedoi (section
Extranervosae) Ara h 2 ortholog scored as well as an NMR-determined structure. 170
Figure B.22. A. ProSA overall model quality, shows the model of the A. palustris Ara h 2
ortholog scored as well as an NMR-determined structure 171
Figure B.23 A. ProSA overall model quality, shows the model of the A. paraguariensis (section
Erectoides) Ara h 2 ortholog scored as well as an NMR-determined structure. 172
Figure B.24 A. ProSA overall model quality, shows the model of the A. pintoi (section
Caulorrhizae) Ara h 2 ortholog scored as well as an NMR-determined structure. 173
Figure B.25 A. ProSA overall model quality, shows the model of the A. rigonii (section
Procumbentes) Ara h 2 ortholog scored as well as an NMR-determined structure. 174
Figure B.26 A. ProSA overall model quality, shows the model of the A. triseminata (section
Triseminatae) Ara h 2 ortholog scored as well as an NMR-determined structure. 175
Figure C.1. Secondary structure prediction using PROFsec. 177

x
Table of Tables
Table 1.1 The classification of Arachis sections with genomes of each section are designated
within the parentheses. 8
Table 1.2 Identified peanut allergens, their function and protein classification. 25
Table 1.3 IgE binding epitopes present in Ara h 2 represented by single-letter amino acid code
initially identified by Stanley et al. (1997). 28
Table 2.1 Arachis and outgroup species included in this study. 51
Table 3.1 Open reading frame length of Ara h 2 orthologs from 12 wild species of Arachis
belonging to eight sections. 101
Table 3.2 Peptide sequences in cultivated peanut and species and five wild species representing
portion of the loop containing the immunodominant epitope motif DPYSPS and
variations of that motif. 106
Table 3.3 Characterization of Ara h 2 orthologs from wild species based on in silico methods.
109
Table B.1 Summary of Ramachandran plots for Ara h 2 orthologs models assessed by
PROCHECK. 149
Table B.2 Overall Model Quality z-score for Ara h 2 ortholog models assessed by ProSA, with
scores from species within section Arachis on the left and those from other sections of
Arachis on the right. 149
Table C.1. Linear and conformational epitopes predicted by ElliPro server. 178
Table C.2. Conformational epitopes predicted by the DiscoTope server based on the Ara h 2
models 183

1
Chapter 1: Literature Review

2
Introduction
The economically important peanut crop (Arachis hypogaea L.) is a member of the
legume family Fabaceae (Figure 1.1). The peanut is the second-most widely grown seed legume
in the world and a major contributor to the global production of consumable oil and protein. It is
one of the top 30 crops that feed the world (Hammer et al., 2003) and is cultivated in over 100
countries with a 38.2 million metric tons global production (FAOSTAT, 2009). Not only is the
peanut a good source of high temperature cooking oil, but also it is an economical source of
proteins and nutrients. In the United States, peanuts are often consumed directly or in
confections (Mottern, 1973), and the average American consumes approximately eight pounds of
peanuts annually (Saavedra-Delgado, 1989).
The crop peanut is the most well-known member of the legume genus Arachis. The
Krapovickas and Gregory (1994) monograph of Arachis recognized 69 species, all native to
South America, and divided them into nine sections, predominantly based on morphological
traits and geographic distribution: Arachis, Caulorrhizae, Erectoides, Extranervosae,
Heteranthae, Procumbentes, Rhizomatosae, Trierectoides, and Triseminatae. An additional 11
species have been identified and taxonomically classified into the sections proposed in that
monograph (Valls and Simpson, 2005). Section Arachis, the largest section, has been further
subdivided into three groups of species based on genome types (A, B and D) as determined by
the chromosome morphology and crossability data (Husted, 1933; Smartt et al., 1978a; Stalker,
1991). The majority of the Arachis species are diploids based on x=10 (Krapovickas and
Gregory, 1994). Five tetraploid (2n = 4x = 40) and four aneuploid species (2n = 2x = 18) are
present in the genus Krapovickas and Gregory, 994 Lavia, 998 Pe ñaloza and Valls, 1997).
Section Arachis contains two tetraploids, A. hypogaea and A. monticola, while the remaining
3
three tetraploid species (A. glabrata, A. nitida, and A. pseudovillosa) are members of section
Rhizomatosae (Krapovickas and Gregory, 1994). The majority of the aneuploid species (A.
decora, A. palustris, and A. praecox) are members of section Arachis Lavia, 998 Pe ñaloza and
Valls, 1997); the remaining aneuploid species, A. porphyrocalyx, is a member of section
Erectoides Pe ñaloza and Valls, 2005).
Despite containing an economically important crop and numerous species, a
comprehensive understanding of the phylogenetic relationship within genus Arachis is lacking.
Krapovickas and Gregory (1994) presented an intuitive depiction of the “evolutionary and
phylogenetic relationships” among the sections based on information from morphology,
geographic distribution, and hybridization and pollen fertility data initially published by Gregory
Figure 1.1 Illustration of the peanut crop, A. hypogaea by Franz Eugen Köhler (1887).

4
and Gregory (1979). Based on these data, Erectoides, Extranervosae, Heteranthae,
Trierectoides, and Triseminatae are considered to be sections of “older” origin, while Arachis,
Caulorrhizae, Procumbentes, and Rhizomatosae are considered relatively more “recent” in origin
(Krapovickas and Gregory, 1994). Since the publication of the monograph, studies on Arachis
examining the evolutionary relationship have resulted in inconsistent scenarios regarding species
relationships. The unclear and inconsistent evolutionary picture for the Arachis genus has been
due to the use of small taxon sampling, lack of sectional representation, and insufficient markers
(Halward et al., 1991; Hilu and Stalker, 1995; Hopkins et al., 1999; Lu and Pickersgill, 1993;
Raina et al., 2001). Thus, the proposed species and section relationships of this genus have not
been assessed well.
Here I present phylogenies that examine the species, genome, and sectional relationships
within the genus Arachis generated using DNA sequence information from the nuclear ribosomal
internal transcribed spacer (ITS) and plastid intergenic spacers and intron of transfer RNAs
regions, trnT-trnL-trnF. The resulting phylogenies and species groupings were compared to the
sections proposed in the monograph (Krapovickas and Gregory, 1994). This approach is not
without precedent as sequence data have previously been used in phylogenetic studies to clarify
relationships among economically important crops and remaining species within its genus
(Buckler and Holtsford, 1996; Chacón et al., 2008; Golovnina et al., 2007; Kellogg and Appels,
1995; Warwick and Sauder, 2005). A robust phylogeny will not only benefit crop breeders
seeking to improve growth and production, but also could be applied to the serious, life-
threatening medical issue of peanut allergy.
Food allergies, peanut allergies in particular, have become a major health issue in the past
decade because of the potential to cause severe to fatal reactions (Warner, 1999). Allergies to

5
peanuts and tree nuts affect approximately 1.3% of adults in America (Sicherer et al., 2003). In
children, the prevalence of peanut allergies has almost doubled in the past decade (Grundy et al.,
2002). Possible explanation of the increased prevalence includes earlier exposure to peanut (in
utero or through breast milk) or through the growing number of foods that have small amounts of
nuts (Hourihane et al., 1996; Sampson, 1996). Another possible explanation for the rise in food
allergies is the “hygiene hypothesis,” which suggests that the lack of exposure to infectious
agents has caused the incidence of food allergies to increase (Strachan, 1989). The more severe
reaction to food allergy is anaphylaxis, which Bock et al. (2001) reported to cause 150 deaths in
the US annually. Of these, 80% are due to accidental consumption of peanuts or tree nuts (Bock
et al., 2001).
The sources of peanut allergies have been identified as ten seed storage proteins found in
the cotyledons of the seeds, referred to as Ara h 1-11 (Asero et al., 2002; Burks et al., 1992;
Burks et al., 1991; Kleber-Janke et al., 1999; Krause et al., 2009; Pons et al., 2002; Rabjohn et
al., 1999). The allergens Ara h 3 and Ara h 4 were found to be isoforms of the same protein
(Boldt et al., 2005). Of the ten allergens, Ara h 2 (conglutin seed storage protein) is considered
to be the most important allergen due to its ability to stimulate an allergic reaction at very low
doses (Koppelman et al., 2004). Interestingly, this potent allergen exists in two forms in the
cotyledon (Chatel et al., 2003). The allergen has been studied mainly in the peanut crop;
however, Ramos (2006) has looked at the Ara h 2 allergen in wild species proposed as the
progenitors of the crop using Southern blotting, sequence comparison, genomic in situ
hybridization (GISH) and fluorescence in situ hybridization (FISH). Each of the two isoforms of
the Ara h 2 proteins was contributed by A and B genome progenitors of the tetraploid peanut
crop, A. duranensis and A. ipaensis, respectively.

6
In this dissertation, I also examined the molecular changes in the allergen Ara h 2 in
fifteen wild Arachis species. The focus was on the changes in a loop region that contains
epitopes consistently recognized by peanut sensitive persons. Bioinformatics methods were
utilized to assess the changes and their potential effects on the protein structure. Homology
modeling was used to predict the influence mutations and insertions/deletions to the amino acid
sequence had on the tertiary structure. I predicted potential antibody binding epitopes using T-
cell epitope programs to determine if the Ara h 2 orthologs were less likely to be allergenic.
Mutations found in the loop region with immunodominant epitopes were evaluated using dot
immunoblotting. Differences in antibody binding affinity for the loop regions were assessed
through the use of synthetic peptides probed with Ara h 2 specific antibodies generated in
chicken or sera from peanut-sensitive persons.
In addition to looking at the variation in the allergen Ara h 2 in wild Arachis species, I
have also compared the species grouping for the gene and phylogeny for genus Arachis. The
genus phylogeny will be used as a scaffold on which the evolution of the allergen gene will be
mapped. The evolution of the allergen Ara h 2 orthologs in the peanut genus serves as a case
study that can set the stage for future studies examining allergenic properties of the protein in the
wild species. Genes found to be hypoallergenic can potentially be transferred to the crop.
Genus Arachis
Taxonomy and Geographic Distribution
The genus Arachis is a member of the family Fabaceae, subfamily Papilionoideae, tribe
Dalbergieae (Wojciechowski et al., 2004). Pohill (1981) initially placed Arachis in the tribe
Aeschynomeneae despite the lack of lamented pods. Based on matK/trnK sequence data, Lavin
et al. (2001) resolved Arachis in the tribe Dalbergieae within the Pterocarpus clade.

7
Linnaeus described the crop species Arachis hypogaea in 1753. The first wild species of
Arachis were not described until almost ninety years later (Bentham, 1841). Taxonomic
assessments of the genus were completed in the early to mid-twentieth century (Chevalier, 1933;
Chevalier, 1934, 1936; Hoehne, 1940), but these evaluations did not categorize species
consistently. Each taxonomist had his own classification and, thus, strong incongruence existed.
In the early 1970s and early 1990s, researchers attempted to clarify the taxonomic nomenclature
for sections within Arachis (Table 1.1; Gregory et al., 1973; Krapovickas, 1969; Singh and
Simpson, 1994). However, these taxonomic treatments of the genus were not considered to be
valid under the rules of the International Code of Botanical Nomenclature (Ressler, 1980).
The latest treatment of the Arachis genus by Krapovickas and Gregory (1994) provided detailed
descriptions of species and compiled geographic, morphological, and crossability data. This
classification recognized sixty-nine species in the genus and divided them into nine sections
(Table 1.1). Eleven species were recognized by Simpson and Valls (2005) based on an
examination of additional taxa samples collected since the publication of the monograph.
Simpson and Valls (2005) identified three new species and elevated eight samples to species
status.

8
Table 1.1 The classification of Arachis sections with genomes of each section are designated within the
parentheses.
Gregory et al., 1979 Singh and Simpson, 1994 Krapovickas and Gregory, 1994
Ambrinervosae (AM)
Arachis (A1, A2, A3)
Caulorrhizae (C)
Erectoides (E1, E2, E3)
Extranervosae (Ex)
Rhizomatosae (R1, R2)
Triseminalae (T)
Ambrinervosae (AM)
Arachis(A1, A2, A3)
Caulorrhizae (C)
Erectoides (E1, E2)
Extranervosae (Ex)
Procumbentes (E3)
Rhizomatosae (R1, R2)
Triseminalae (T)
Arachis (A1, A2, A3)
Caulorrhizae (C)
Erectoides (E2)
Extranervosae (Ex)
Heteranthae (AM)
Procumbentes(E3)
Rhizomatosae (R1, R2)
Triseminatae (T)
Trierectoides (E1)
Geographically, the Arachis species can be found east of the Andes Mountains and south
of the Amazon River (Figure 1.1), mainly in Argentina, Bolivia, Brazil, Paraguay, and Uruguay
(Krapovickas and Gregory, 1994). The distribution of the species throughout these countries
follows the flow of the rivers, which are hypothesized to be the main route of seed distribution
for this genus. The areas around the eastern boarder of Bolivia and western Brazil are believed
to be the areas in which the majority of species diversity lies (Jarvis et al., 2003). Gregory et al.
(1980) cited central Brazil as the center of origin for Arachis and northern Argentina or southern
Bolivia as the center of origin of the crop peanut.
Arachis hypogaea gene pools
The peanut crop is known to have a narrow genetic background and thus improvement through
the use of germplasm from wild Arachis species could be used to improve the crop’s ability to

9
resist disease and drought (Kochert et al., 1996). Gene pools provide plant breeders an informal
view of the relationships between the crop and its wild relatives. Harlan (1992) provided broad
descriptions of gene pools to indicate the genetic relationship between a crop and its related wild
species. The primary gene pool (GP-1) consists of the wild and cultivated varieties that are
defined to be part of the same species (Figure 1.1). When crossing members of GP-1, fertile
hybrids produced appear to have good chromosome paring and, thus, gene integration would be
straightforward. For the cultivated peanut crop, wild and domesticated varieties of A. hypogaea
are considered to be part of the primary gene pool (Rao and Murty, 1994). Another species
considered to be part of the GP-1 for the crop is A. monticola. The other allotetraploid species of
section Arachis can produce fertile hybrids with the crop (Stalker, 1990; Wynne and Halward,
1989). The second gene pool (GP-2) as defined by Harlan (1992) consists of species that can
produce hybrids with the crop; albeit, these hybrids are often sterile, may not reach maturity, or
are difficult to propagate. Based on this definition of GP-2 species, A. monticola could be
included in the GP-1 for A. hypogaea. In accordance with Harlan (1992), the GP-2 is comprised
of diploid species taxonomically classified within section Arachis as hybridization between the
crop and these species rarely produces viable progeny (Wynne and Halward, 1989). The tertiary
gene pool (GP-3) consists of species that can be crossed with the crop and produce hybrids that
are sterile or abort during development (Harlan, 1992). Species belonging to the other sections
of Arachis are considered to be members of the GP-3 as these species are unable to produce
fertile, viable hybrids when crossed with A. hypogaea (Gregory and Gregory, 1979; Krapovickas
and Gregory, 1994).

10
Figure 1.2 Geographic distribution of Arachis species across South America as described by Krapovickas
and Gregory (1994) shown in gray shaded area. Countries where Arachis species are found are indicated.

11
Figure 1.3 Gene pools for the peanut crop Arachis hypogaea.

12
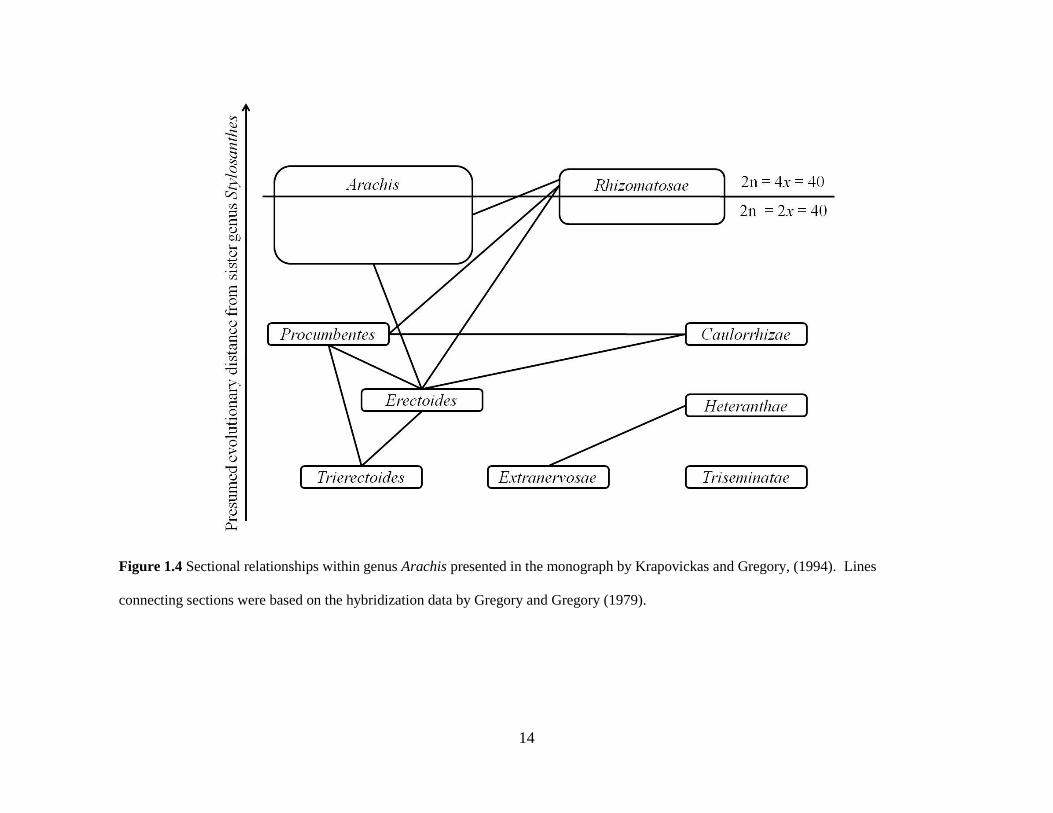
Evolutionary relationships among the sections of Arachis
The majority of studies examining species of the peanut genus Arachis generally focus on
section Arachis, which contains the crop A. hypogaea. Very few studies have investigated the
other sections, and none in great detail.
Gregory and Gregory (1979) conducted one of the first studies examining intrasectional
and intersectional relationships in Arachis based on crossability and pollen fertility data. In this
study, ninety-one accessions of nineteen species of Arachis and ten varieties of A. hypogaea
were included to examine the cross-compatibility relationship. Pollen fertility within sections
ranged from 0.2% (section Extranervosae) to 86.8% (section Caulorrhizae). The average pollen
fertility from hybrids produced from intersectional crosses was low, 1.9%. Species from section
Erectoides had more success at generating intersectional hybrids than any other section. Also,
Gregory and Gregory (1979) concluded that species of section Erectoides retained shared
elements with sections Arachis, Caulorrhizae, Heteranthae, and the tetraploid species of section
Rhizomatosae. At the time this study was conducted, sections Procumbentes and Trierectoides
were included in section Erectoides. Based on these results Gregory and Gregory (1979)
suggested that section Erectoides shared a common ancestor with the sections that produced
hybrids. Species of section Triseminalae, presently recognized as section Triseminatae (A.
triseminata), and the diploid species for section Rhizomatosae (A. burkartii) did not produce
hybrids with any other sections. While the ability to obtain intersectional hybrids is an important
indicator of sectional relationships, genetic barriers developed from the autogamous reproductive
system could mask relationships among sections (Krapovickas and Gregory, 1994). Krapovickas
and Gregory (1994) combined data on geographic distribution, morphology with the crossability

13
and pollen sterility data from the Gregory and Gregory (1979) study and proposed an intuitive
prediction of species relationship among sections within genus Arachis (Figure 1.3).
Species and sectional relationships among Arachis have also been evaluated based on
molecular information (Barkley et al., 2007; Creste et al., 2005; Galgaro et al., 1998; Galgaro et
al., 1997; Gimenes et al., 2002a; Gimenes et al., 2000; Santos et al., 2003). Galgaro et al.
(1998) used restriction fragment length polymorphism (RFLP) and random amplification of
polymorphic DNAs (RAPD) markers to study the relationships among 13 species from sections
Arachis, Caulorrhizae, Extranervosae, Heteranthae, and Triseminatae. The data were analyzed
phenetically using Unweighted Pair Group Method with Arithmetic Mean (UPGMA). Phenetic
methods predict species relationships based on the presence or absence of data and do not
consider the evolutionary history. The phenograms generated using RFLP and RAPD data
resulted in three major clusters. Two of the clusters were homogeneous: one cluster comprised
of species from section Extranervosae, and the second cluster was made up of the four
accessions of A. hypogaea. The third cluster was a heterogeneous cluster that included species
of sections Caulorrhizae, Triseminatae, and Heteranthae. UPGMA phenograms based on
RAPD or RFLP data used in the Galgaro et al. (1998) were not in agreement on the placement of
A. dardani of section Heteranthae and placed the validity of the section in question.
14
Figure 1.4 Sectional relationships within genus Arachis presented in the monograph by Krapovickas and Gregory, (1994). Lines
connecting sections were based on the hybridization data by Gregory and Gregory (1979).

15
Santos et al. (2003) used RAPD data analyzed using phenetic methods to examine
relationships among sections Arachis, Erectoides, Procumbentes, Rhizomatosae, and
Trierectoides. The accessions formed two clusters in the dendrogram; one consisted of species
from section Arachis, while the other cluster contained species from the remaining sections
divided into two subclusters. They suggested that sections Procumbentes and Rhizomatosae are
more closely related to sections Erectoides and Trierectoides than to section Arachis. Sections
Erectoides, Procumbentes, and Trierectoides depict a genetic affinity that was previously
recognized by Gregory and Gregory (1979).
In another UPGMA phenetic analysis, Gimenes et al. (2002b) used Amplified Fragment
Length Polymorphism (AFLP) markers to assess relationships among twenty species from
sections Arachis, Caulorrhizae, Erectoides, Extranervosae, Heteranthae, Procumbentes, and
Rhizomatosae. Three major clusters were also recovered in their phenogram. Section
Rhizomatosae species did not group together as expected. The diploid member of this section, A.
burkartii, was grouped with species from section Caulorrhizae, while the tetraploid species, A.
glabrata, grouped with species from section Erectoides. This study suggests that the diploid and
tetraploid species of section Rhizomatosae are not closely related, and thus, the validity of this
section comes into question.
Hoshino et al. (2006) was the first to represent all sections of Arachis using
microsatellites and analyzing the data with UPGMA. The majority of the species grouped in
their respective sections as defined by Krapovickas and Gregory (1994). However, the validity
of section Heteranthae was once again questioned as members of section Heteranthae failed to
group together, which was previously observed in the Galgaro et al. (1998) study.
16
Of the studies that examined the intersectional relationships within genus Arachis, very
few had commented on its evolutionary history (Gregory and Gregory, 1979; Krapovickas and
Gregory, 1994). Gregory and Gregory (1979) concluded that the “most ancient of species” in
Arachis were from sections Extranervosae, Erectoides (E1), and Rhizomatosae (R1) based on
data from cross-compatibility. In the monograph by Krapovickas and Gregory (1994), an
institutive depiction of the evolutionary and phylogenetic relationships among the Arachis
sections was provided. The E1 genome group was raised to sectional classification, section
Trierectoides, and was considered to be the “most primitive” of the genus due to its high degree
of genetic isolation and morphological characters that are found only in this section. The
phylogenetic relationship of the Arachis genus remains unclear since the studies to date
examining this genus looked at selected sections or used few representative species and none
used a phylogenetic approach (Galgaro et al., 1998; Gimenes et al., 2002a). A study examining
relationship of the entire genus and with adequate sampling is needed.
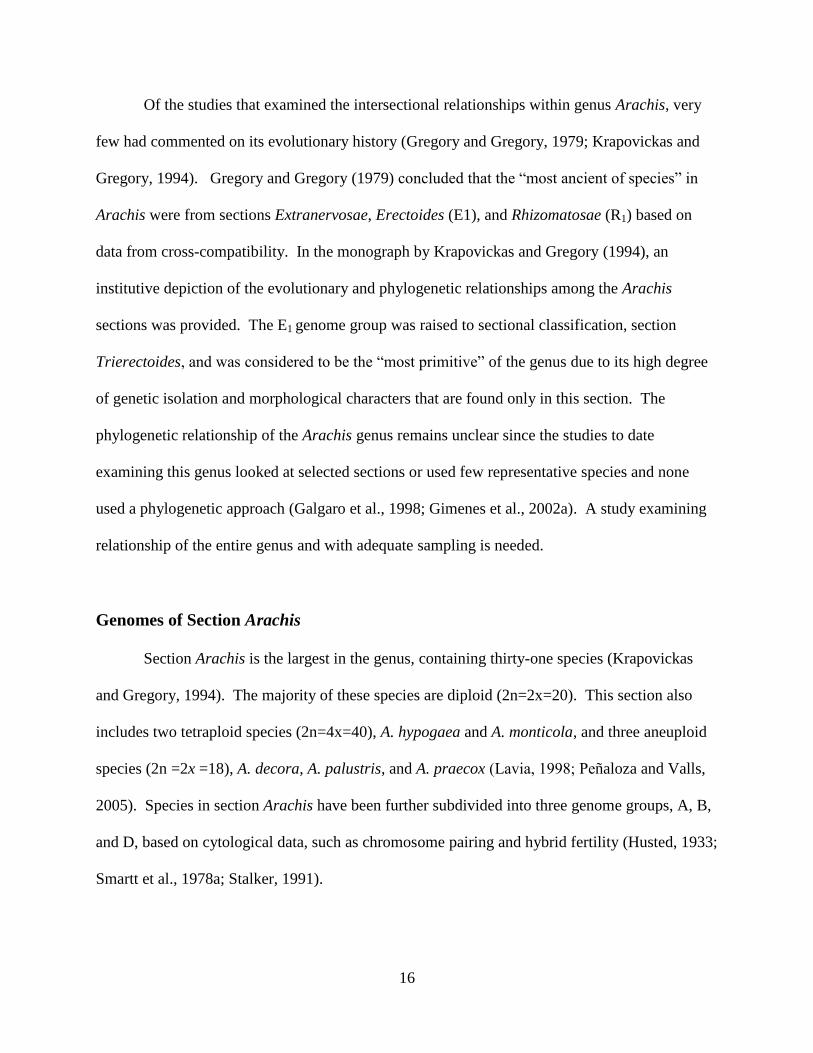
Genomes of Section Arachis
Section Arachis is the largest in the genus, containing thirty-one species (Krapovickas
and Gregory, 1994). The majority of these species are diploid (2n=2x=20). This section also
includes two tetraploid species (2n=4x=40), A. hypogaea and A. monticola, and three aneuploid
species (2n =2x =18), A. decora, A. palustris, and A. praecox Lavia, 998 Pe ñaloza and Valls,
2005). Species in section Arachis have been further subdivided into three genome groups, A, B,
and D, based on cytological data, such as chromosome pairing and hybrid fertility (Husted, 1933;
Smartt et al., 1978a; Stalker, 1991).

17
Husted (1933; 1936) was the first to describe two distinct chromosomes (A and B) in A.
hypogaea based on observations of chromosome pairing during meiosis. The A chromosomes
were noticeably smaller than the rest, while the B chromosome pair contains a second
constriction with satellites. The difference between the two unique chromosomes indicated that
A. hypogaea contained two genomes (Smartt, 1965). Species of section Arachis in which the
small A chromosome is present have been designated as A genome species, while those lacking
the A chromosome are B genome species (Smartt et al., 1978). The third genome in section
Arachis, D genome, is found only in A. glandulifera (Stalker, 1991). The D genome lacks the
chromosomes distinct to the A and B genomes, and has a karyotype that is only seen in
accessions of A. glandulifera.
The majority of species of section Arachis contain the A genome. Arachis batizocoi was
the first species of section Arachis described to contain the B genome (Smartt et al., 1978a).
Artificial hybrids among species of section Arachis were fertile with the exception of hybrids
from crosses with A. batizocoi (Smartt et al., 1978a). Hybrids produced using species with the A
genome had moderate to high pollen stability, while hybrids produced with A. batizocoi (B
genome) had no pollen stability. While stable pollen production was not present in hybrids with
A. batizocoi, the ability to produce a hybrid with species from section Arachis suggests that the
evolutionary divergence of the A and B genomes occurred recently. Species with this genome
designation appear to be fairly diverse. While the genome of A. ipaensis was not confirmed
cytogenetically until 1994 by Fernández and Krapovickas, it has an RFLP banding pattern that is
similar to the B genome species A. batizocoi, when compared to the A genome species (Kochert
et al., 1991). Seijo et al. (2004) examined banding patterns in section Arachis species using
fluorescent in situ hybridization (FISH) and noted that A. batizocoi has a distinct profile when

18
compared to profiles from other B genome species; Arachis ipaensis and A. williamsii, can be
clustered into their own subgroup. Based on information from FISH data, Burow et al. (2009)
suggested that the B genome species in section Arachis should be divided into two groups, the
batizocoi group and the ipaensis group. Section Arachis species A. cruziana was grouped with
A. batizocoi, while A. ipaensis formed a group with A. magna. The separate grouping of the B
genome species suggests that the B genome group might need to be split into two groups.
However, more data will be needed to taxonomically divide the B genome species into the
batizocoi and ipaensis groups.
Morphologically, the A and B genome species are similar based on leaf size, pod shape
and length, flower shape and width, and meristem lengths (Stalker, 1990). In a phenogram
depicting species relationship based on morphology alone, A. ipaensis (B genome) was
considered to be most morphologically distinct from other species of section Arachis (Stalker,
1991). Species that had the unique D genome karyotype did not cluster with the rest of the
groups from section Arachis. Within a morphology-based dendrogram, species with the A and B
genomes were mixed rather than forming separate clusters. This means that the A and B
genomes are morphologically closer to each other than either of them to the D genome.
In addition to the diploid species containing the A, B, or D genomes, section Arachis also
contains aneuploid species. The aneuploid species have a base chromosome number of x=9
(2n=18) (Lavia, 1998). These species lack the small chromosomes characteristic of the A
genome species. The basic chromosome number of x=9 of these species could have been
derived from an Arachis species with x=10. If this is the case, then the aneuploid species are of a
more recent species evolution.

19
Our recent study based on plastid sequence information found that the B and D genomes were
more closely related to each other than to the A genome (Tallury et al., 2005). The aneuploid
species, A. palustris and A. praecox, did not group with the A genome group, nor to the B and D
genome group. This suggests that they could represent an intermediate between the A genome
and the other two genomes. Further study examining the relationship among the section Arachis
genomes and aneuploids would contribute in a better understanding of these relationships.
Origin of the tetraploid crop peanut, A. hypogaea
Only a handful of species in genus Arachis are tetraploids; the most noted of these is the
cultivated crop, A. hypogaea. The crop is an allotetraploid because it a hybrid containing both
the A and B genomes present in section Arachis species (Husted, 1933; Stebbins, 1957). The
origin of the peanut crop could have occurred by amphidiploidization of a hybrid of A and B
genome wild species (Singh, 1988; Singh and Moss, 1984). Section Arachis species have long
been considered to be potential progenitors since crosses with these species and with the
tetraploid crop have resulted in successful hybrids (Krapovickas and Gregory, 1994; Smartt and
Stalker, 1982; Stalker, 1990; Stalker and Moss, 1987). Understanding of species relationships in
section Arachis is important because these are considered to be genetic resources for the crop
(Smartt et al., 1978b). These are important because A. hypogaea has a narrow genetic
background.
Various diploid species in section Arachis have been suggested to be the progenitors of
the crop. Initially based on cytogenetic evidence, potential progenitors with the A genome
included A. cardenasii, A. duranensis, and A. villosa (Seetharam et al., 1973; Smartt et al.,
1978a; Varisai Muhammad, 1973). Seed storage protein profiles have also provided evidence, in
addition to cytogenetics, for A. cardenasii as a potential progenitor (Krishna and Mitra, 1988).

20
In addition to the cytogenetic evidence, FISH studies have provided support for A. villosa as a
potential progenitor (Raina and Mukai, 1999; Raina et al., 2001). Recently, Milla et al. (2005)
suggested A. helodes and A. simpsonii as potential A genome donors based on AFLP data.
However, the majority of studies examining potential progenitors have focused on A. duranensis
as the A genome progenitor of A. hypogaea based on data from seed storage protein profiles,
isozyme (Lu and Pickersgill, 1993), RFLP (Kochert et al., 1991; Kochert et al., 1996), RAPD
(Hilu and Stalker, 1995), DNA sequence information (Jung et al., 2003), and FISH (Seijo et al.,
2004).
For the B genome, A. batizocoi had long been assumed as the B genome donor for the
crop (Krapovickas, 1969). However, this assumption was due to the lack of other identified B
genome species. Based on evidence from RFLP, Kochert et al. (1991) found A. batizocoi not to
be as closely related to A. hypogaea as previously thought. Other studies have also supported the
exclusion of A. batizocoi as the B genome donor based on RAPD (Hilu and Stalker, 1995), RFLP
(Burow et al., 2009; Kochert et al., 1996), isozymes (Lu and Pickersgill, 1993), and FISH (Seijo
et al., 2004). Kochert et al. (1991) was the first to suggest A. ipaensis, a recently identified
species, to be the B genome donor. At the time, A. ipaensis was considered to be an A genome
species. However, Kochert et al. (1991) was the first to show that A. ipaensis was a B genome
species using RFLP markers. This finding was later confirmed by Fernández and Krapovickas
(1994) based on karyotpying and Tallury et al. (2005) using plastid DNA sequences.
In the case of the other tetraploid classified species in section Arachis, A. monticola
has been proposed to be a wild progenitor of the crop (Smartt et al., 1978a). The two
allotetraploid species are very similar morphologically, hybridize successfully producing fertile
hybrids, and have overlapping areas of geographic distribution (Simpson et al., 2001). Some

21
researchers believe that A. monticola is a weedy species that evolved from the cultivated crop
(Gregory and Gregory, 1976; Halward et al., 1991). Data from RAPD, RFLP, and AFLP have
shown that markers from the two allotetraploid species were nearly identical (Halward et al.,
1991; Hilu and Stalker, 1995; Kochert et al., 1991; Milla et al., 2005), which does not support
the hypothesis that A. monticola was a progenitor to A. hypogaea, as the two tetraploids could be
considered a single species genetically.
The consensus is now that A. duranensis and A. ipaensis are the A and B genome donors,
respectively, for the crop A. hypogaea (Jung et al., 2003; Kochert et al., 1991; Kochert et al.,
1996; Seijo et al., 2004). Burow et al. (2009) attempted to reconstitute the RFLP markers
identified in A. hypogaea. Of the crosses attempted, the combinations that gave the greatest
match to the crop were ones that crossed A. duranensis and A. ipaensis. However, the best
hybrid generated only 51% of the RFLP markers found in A. hypogaea. Other hybrids that were
able to produce a smaller portion of the RFLP bands similar to the crop were generated with A.
ipaensis as one of the parent species. The A. duranensis x A. ipaensis hybrids only produced
about half of the RFLP markers as compared to the crop. The lack of bands could be explained
by the rapid genomic restructuring after a polyploidy speciation event has occurred; however,
Burow et al. (2009) also suggested that additional Arachis species that contained genomes more
similar to the crop could still be identified in the future.
Identification of additional species as potential progenitors for A. hypogaea would
provide a better understanding of its origin (Burow et al., 2009). In addition, a clearer
understanding of tetraploid evolution would allow for the production of hybrids that are able to
cross with the crop and the introduction of alleles that could benefit farmers and consumers of
peanuts.

22
Peanut allergy
Peanut is one of the eight foods that cause 90% of the immunoglobulin E (IgE)-
associated food allergies (Lehrere et al., 2002). Consequently, these foods have been termed the
“Big Eight.” The other foods that make up the “Big Eight” tree nuts, cow’s milk, soy, wheat,
hen’s egg, fish, and crustaceans. Branum and Lukas (2008) concluded that food allergies as a
whole increased by 18% between 1997 and 2007. The cause of the rise in food allergies,
particularly those to peanut, has not been well studied (Burks, 2008). Currently, 4% of children
are predicted to have food allergies (Sampson, 1999; Sicherer et al., 2003). Peanut allergies are
among the most severe food allergies because they have the ability to induce anaphylaxis. In
2002, allergies to peanuts affected approximately 0.8% of children and 0.6% of adults in the U.S.
(Sicherer et al., 2003). The percent of children with allergies to peanut doubled from 0.4% in
1997 to 0.8% in 2002 (Sicherer et al., 2003). Accidental consumption of peanuts is considered to
be the cause of two hundred anaphylaxis deaths annually (Bock et al., 2001). Other than
emergency treatments with antihistamine and epinephrine pins, preventative treatments for
allergies include avoidance, pharmacological treatment, and allergy-specific immunotherapy.
For peanut allergies, the only preventative treatment currently available for peanut allergies is
avoidance (Burks, 2008).
Peanut allergens
In the peanut cotyledon, ten proteins have been identified as allergens (Asero et al., 2002;
Burks et al., 1992; Burks et al., 1991; Kleber-Janke et al., 1999; Krause et al., 2009; Pons et al.,
2002; Rabjohn et al., 1999). Like most plant food allergens, the majority of the peanut allergens
fall into one of a few protein families or superfamilies (Table 1.2).

23
Cupin superfamily is considered to be a large superfamily of proteins that are very
diverse functionally (Dunwell et al., 2004). The superfamily is named for the β-barrel core
domain and can be divided into two groups; the single-domain cupins (monocupins) and two-
domain cupins (bicupins). The 7/8S and 11S seed storage proteins that have also been classified
as allergens are considered to be one of the largest groups within bicupins. The major peanut
protein Ara h 1 is a 7S globulin while the allergen Ara h 3/4 is an 11S globulin (Mills et al.,
2004).
The prolamin superfamily includes proteins that are both water- and alcohol-soluble and
tend to be proline- and glutamine-rich (Breiteneder and Mills, 2005). Members of this protein
superfamily tend to be low in molecular weight, with the secondary structure being primarily α-
helical in nature and the tertiary structure stabilized by six to eight conserved cysteines that form
three or four disulfide bonds within the protein. Despite the conserved nature of the structure
and cystine motifs, members of this superfamily are very diverse, and have a variety of
functions. These include 2S seed storage albumins, non-specific lipid transfer proteins, and
protease inhibitors. In peanut, the major allergens Ara h 2 and Ara h 6, and minor allergen Ara h
7 are members of this protein superfamily. The recently identified Ara h 9, considered to be a
minor allergen has been classified as a non-specific lipid transfer protein and appears to be an
important allergen in Mediterranean regions (Krause et al., 2009).
The profilin family, another protein family whose members include food allergens,
consists of cytosolic proteins of small molecular weight (12-15 kDa). They generally are
involved with cellular processes such as signaling cytokinesis and cellular movement (Witke,
2004). Allergens that are from this protein are highly allergenic and are known to elicit allergic
response from 10-20% patients who are allergic to pollen (Valenta et al., 1992). In peanuts, the

24
only identified allergen classified as part of the profilin superfamily is Ara h 5 (Kleber-Janke et
al., 1999).
The allergen Ara h 8 has similarities to the major birch pollen allergen Bet v1 (Mittag et
al., 2004), which belongs to the subfamily of pathogenesis-related protein PR10 (Raudauer and
Breiteneder, 2007). Like other Bet v 1-like allergens, Ara h 8 was not stable when heated or
digested with gastric juices (Mittag et al., 2004), which could explain the low association of
peanut IgE to this allergen.
Peanut allergens Ara h 1-9 are members of the protein superfamilies typical for plant
food allergens (Table 1.2). However, the recently-recognized Ara h 10 and Ara h 11 have been
classified in a protein family more noted for the formation of oil bodies (Pons et al., 2002). These
allergens are hypothesized to contribute to the cross-reactivity observed between peanut and
soybean. Further research needs to be conducted to fully understand the role of Ara h 10 and 11
in peanut allergies (Pons et al., 2002).

25
Table 1.2 Identified peanut allergens, their function and protein classification.
Allergen Common Name Family/Superfamily Function Size (kDa) Identified
Ara h 1 Arachin Cupin 7S Vicilin-like Globulins,
seed storage
71 Burks et al.,1991
Ara h 2 2S albumin/
Conglutin
Prolamin 2S seed storage, trypsin
inhibitor
17 Burks et al., 1992
Ara h 3/4 11S Globulin Cupin 11 S Globulin seed storage 60/53 Kleber-Janke et al.,1999
Ara h 5 Profilin Profilin Actin-binding protein 14 Kleber-Janke et al., 1999
Ara h 6 2S albumin,
Conglutin
Prolamin 2S albumin 15 Kleber-Janke et al.,1999
Ara h 7** Conglutin Prolamin Conglutin -- Kleber-Janke et al., 1999
Ara h 8** Bet v-1 homolog PR-10 Pathogen-resistance
protein
-- Mittag et al., 2004
Ara h 9 Lipid Transfer
Protein
Prolamin Lipid Transfer Protein 9.8 Krause et al., 2009
Ara h 10 Oleosin Oil-body formation 16 Pons et al., 2002
Ara h 11 Oleosin Oil-body formation 14 Pons et al., 2002
** Protein information, including molecular weight, currently not known.
26
Conglutin Allergen: Ara h 2
The conglutin protein Ara h 2 was identified as a peanut allergen using sera from patients
who were known to be allergic to peanuts (Burks et al., 1992). Ara h 2 was recognized to be
present as a doublet consisting of a 16 kDa and 18 kDa isoforms. The pI of the allergen was
determined to be 5.2 using a two-dimensional gel. Two isoforms of Ara h 2 have been identified
in peanut cotyledons; Ara h 2.01 and Ara h 2.02 (Chatel et al., 2003). The larger isoform, Ara h
2.02, has a twelve amino acid insertion, which contains an additional DPYSPS IgE-binding
epitope. Chatel et al. (2003) proposed the additional DPYSPS motif could make Ara h 2.02 a
more potent isoform than Ara h 2.01, although this has yet to be confirmed. Stanley et al. (1997)
used synthetic peptides corresponding to the amino acid sequence of Ara h 2 and deduced the 10
IgE binding epitopes (Table 1.3). Sera from ten peanut-sensitive patients consistently recognized
three epitopes, 3, 6, and 7, which were determined to be immunodominant. Alanine mutations to
certain residues within these epitopes reduced or eliminated IgE-binding (King et al., 2005).
Examining Ara h 2 orthologs in proposed progenitors, Ramos et al. (2008) identified an
accession of A. duranensis that contained a single nucleotide polymorphism (SNP), which
caused an amino acid change within the same class, S73T. The amino acid mutation resulted in
a 56-99% reduction in IgE-binding when probed by individual sera and quantified by
densitometry.
Sequence analysis of a peanut genomic library revealed a 624 base pair open reading
frame (ORF) for Ara h 2 gene (Viquez et al., 2001). The gene Ara h 2 appears to lack introns
based on comparison between Ara h 2 cDNA and genomic clone sequences. The genomic
sequence from the Viquez et al. (2003) study was later referred to as the Ara h 2.01 isoform,
which corresponds to some published cDNA sequences of Ara h 2 in GenBank. Chatel et al.

27
(2003) reported another sequence of the Ara h 2 gene that contained a 36 base pair (12 amino
acids) insertion that was named Ara h 2.02, which corresponds to the larger Ara h 2 protein
isoform. Based on a Southern blot comparing the Ara h 2 isoforms, Ramos et al. (2006)
concluded the progenitors, A. duranensis and A. ipaensis, contributed an isoform to the
allotetraploid crop. The orthologs of Ara h 2 from the wild progenitors migrated identically to
isoforms from the cultivated peanut. Ara h 2.01 migrated the same distance as the ortholog from
A. duranensis (A genome) and Ara h 2.02 migrated the same distance as the ortholog from A.
ipaensis (B genome). Sequences of Ara h 2 orthologs from the proposed progenitors, A.
duranensis and A. ipaensis were 99.7-100% identical to Ara h 2.01 and 99.4%-99.9% identical
Ara h 2.02.
In addition, Ramos et al. (2006) elucidated the expression pattern of the two Ara h 2
isoforms was examined by random sequencing of cDNA clones. The expression ratios were
determined by RT-PCR to be 2.7:1 A:B genome. The expression ratios were similar to another
study that found the expression of two conglutin isoforms to be 2:1 A:B genome from
sequencing 400 cDNA clones from A. hypogaea (Yan et al., 2005).
Ara h 2 has been shown to function as trypsin inhibitor (Maleki et al., 2003). The
function of Ara h 2 as a trypsin inhibitor increases when the peanut undergoes certain methods of
thermo-processing. Roasting increases the inhibition of trypsin 3.5 times compared to unroasted
peanuts. In addition to resisting degradation by trypsin, Ara h 2 also protects the allergen Ara h
1 from that protease (Maleki et al., 2003).

28
Table 1.3 IgE binding epitopes present in Ara h 2 represented by single-letter amino acid code initially
identified by Stanley et al. (1997). Chatel et al. (2003) identified the second isoform, Ara h 2.02, which
contains an additional epitope 6. Positions of epitopes for each isoform as found in the peptide sequence
alignment are noted.
Epitope Amino Acid Sequence Ara h 2.01 Position Ara h 2.02 Position
1 HASARQQWEL 18-27 18-27
2 QWELQGDR 24-31 24-31
3 DRRCQSQLER 30-39 30-39
4 LRPCEQHLMQ 42-51 42-51
5 KIQRDEDS 52-58 52-58
6 RDPYSPS 62-68 62-68/81-87
7 SQDPYSPS 68-75 68-75
8 LQGRQQ 120-125 132-137
9 KRELRN 130-135 142-147
10 QRCDLDVE 146-153 158-165
29
The Maillard reaction, which roasts food products while adding sugars, increases the Ara
h 2 binding to IgE (Maleki et al., 2000). When Ara h 2 protein was roasted in the presence of
glucose, there was a 2.7-fold increase in IgE binding, while roasting Ara h 2 in the presence of
xylose increased IgE binding by 5.6-fold. Recombinant Ara h 2 showed similar effects when
roasted in the presence of sugars (Gruber et al., 2005). Boiling peanut does not change the
binding of IgE to Ara h 2, even though immunoreactivity of allergens from boiled peanut
decreased two-fold. The decreases allergenicity of whole peanut is speculated to be due to the
loss of low molecular weight proteins by being transferred to water during boiling (Mondoulet et
al., 2005).
Homology Modeling
The three-dimensional structure of a protein can provide information about its biological
function. Tertiary structures are determined experimentally through X-ray crystallography or
nuclear magnetic resonance (NMR; Sali and Kuriyan, 1999). To date, more than 60,000 protein
structures are available on the Protein Data Base (PDB) server. Advances in experimental
techniques have speeded the process of elucidating a protein’s tertiary structure. However,
experimentally determining a protein structure is still a time-consuming and costly process.
Thus, the number of coding DNA sequences, and thus deduced amino acid sequences, available
on databases like GenBank demonstrates that there is a large gap between protein sequence and
structure information (Daga, 2010). This gap in sequence-structural knowledge can be reduced
through the use of protein models. Predicted protein structures can be identified using either de
novo (threading) methods or template-based (homology) modeling (Baker and Sali, 2001).
Threading examines the sequences for predicted areas of tertiary structures that would have the
30
lowest energies for those structures. In comparison to homology modeling, theoretical models
generated using de novo methods are not considered to be very reliable.
Hypothetical tertiary structures generated using homology modeling are based on
experimentally derived template structures (Baker and Sali, 2001). This approach is possible
because tertiary structures of related proteins are more evolutionarily conserved than the amino
acid sequence (Marti-Renom et al., 2000). Also, structural similarity can be found in sequences
that are more divergent in protein families and superfamilies. The accuracy of the model is
influenced by the sequence homology between the target (the protein in which the structure will
be predicted) and the template (the known structure). Predicted models that have over 50%
sequence identity to the template are considered to be highly accurate, with approximately 1 Å
root mean square (RMS) error for the backbone atoms (Baker and Sali, 2001). Target structures
with 30-50% sequence identity to the template structures are considered to have medium
accuracy, with the large majority of the model considered to be accurate with about 1.5 Å RMS
errors. The majority of errors detected in models with 30-50% sequence identity to the template
structure can be attributed to errors in alignment. Models built using templates with less than
30% sequence identity have low accuracy and these models tend to have larger amounts of gaps
and errors within the alignment (Marti-Renom et al., 2000). Models with less than 30%
sequence identity to their template are not thought to be an accurate depiction of the target’s
tertiary conformation.
Within a protein family, the majority of changes in the form of substitution, insertion, and
deletion of residues are found within areas of the sequence that correspond to loop regions
connecting secondary structures (Fiser et al., 2000). Due to the location of these changes, loops
tend to determine the functional aspects of a protein. In the case of plant allergens belonging to

31
the prolamin superfamily, IgE-binding epitopes have been found within extended loop regions
(Monsalve et al., 1993; Robotham et al., 2005). Two approaches are generally used when
determining the loop structure, database and conformational searches. The former approach
relies on a database of known loops that are from proteins from experimentally derived tertiary
structures classified based on conserved features, such as length and presence of particular
residues (Burke et al., 2000; Espadaler et al., 2006; Li et al., 1999). The database approach can
be an accurate and efficient method as long as the target loop is in the same class of loops (Fiser
et al., 2000). This method is limited due to the lack of known loop structures available and the
length of loops being modeled. Generally, loop conformation databases search for loops less
than ten residues in length. However, attempts have been made to recognize larger loops
(Schlessinger et al., 2007; Vucetic et al., 2005). Conformational searches can employ a variety
of search algorithms to elucidate the structure of a loop. Examples of these algorithms could
include global energy minimization (Dudek et al., 1998), local energy minimization (Mattos et
al., 1994), molecular dynamics simulations (Nakajima et al., 2000), and optimization-based
approaches (Fiser et al., 2000).
Homology models of the Ara h 2 allergen from the peanut crop
Determination of the protein structure of Ara h 2 would yield better understanding of the
allergen’s interaction with IgE antibodies and how it elicits an immunological response. The
structure of the peanut Ara h 2 protein was first modeled using Ric c 3, a 2S albumin from castor
bean (Ricinus communis; Figure 1.4A), which shares approximately 37% sequence identity with
Ara h 2 (Barre et al., 2005). The molecular model of Ara h 2 shows that it is a right-handed
alpha helical superstructure and has been confirmed by a homology model generated from the

32
recently released structure of the minor allergen Ara h 6 (Figure 1.4B; (Lehmann et al., 2006).
The two peanut conglutin proteins share a 63% overall sequence identity. Considering only the
alpha-helical regions, the sequence identity increases to 75%. Comparing Ara h 2 to the
determined structures of Ric c 3 and Ara h 6, Ara h 2 contains five alpha-helices (Barre et al.,
2005; Lehmann et al., 2006). Four disulfide bridges stabilize the structure of the protein. These
disulfide bridges have been associated with the allergen’s ability to be digested by gastric
enzymes chymotrypsin, pepsin, and trypsin (Sen et al., 2002).
Structural information would provide more insight into how the plant protein functions as
an allergen and lend insight on the mechanism that allows for some proteins to cross-react with
each other (Jenkins et al., 2005). Information on allergen structure could provide a clearer
picture of what contributes to the classification of Ara h 2 as an allergen. The current
understanding of the presence of this allergen in related wild Arachis species is limited.
Examining other wild species for this allergen could reveal natural mutants. It would also
provide information that could be used to develop therapeutic approaches to allergy treatment
(Radauer et al., 2008).

33
Figure 1.5 NMR-determined structures of (A) Ric C 2 (PDB ID 1PSY) from castor bean (Ricinus communis; Pantoja-Uceda et al. 2003and (B)
Ara h 6 (PDB ID 1W2Q) from peanut (Arachis hypogaea; Lehmann et al., 2006), which have been used as template structures for homology
models of Ara h 2 from A. hypogaea. Coordinates for the structures were obtained from the RCSB Protein Databank and rendered in Swiss-
PdbViewer v4.0.1

34
Project Objectives
The peanut crop comes from a genus that contains numerous species, many of which are
potential genetic resources. However, the evolutionary relationships among species, genomes,
and sections of the genus Arachis are not well understood. The first objective in this dissertation
is to present phylogenies examining relationships within genus Arachis based on DNA sequence
information from plastid and nuclear genomic regions. This will be the first phylogenetic study
examining species, genomes and sectional relationships for the whole genus since the publication
of the Krapovickas and Gregory (1994) monograph. The phylogenies produced here can be used
as a guide for improving the peanut crop not only from the agricultural perspective but also from
medical one. The second objective is to examine molecular changes within a protein that is a
major allergen, Ara h 2, from wild Arachis species. The species chosen were representatives of
the major lineages present in the phylogenies for the genus. In this dissertation, I have examined
the mutations among the Ara h 2 orthologs from Arachis wild species and their effects on the
secondary and tertiary structure of the protein. The mutations observed in Ara h 2 orthologs
were evaluated for changes in potential antibody binding particularly in a loop region that
contains immunodominant IgE-binding epitopes. Differential antibody binding to orthologs with
significant mutations in these IgE-binding sites was assessed using dot immunoblots. The results
presented here will be the first to examine the major allergen outside of the peanut crop and its
progenitors and has the potential to identify wild Arachis species that could be utilized for
treatment of peanut allergies.

35
Literature Cited
Asero, R., Mistrello, G., Roncarolo, D., Amato, S., Caldironi, G., Barocci, F., and van Ree, R.
(2002). Immunological cross-reactivity between lipid transfer proteins from botanically
unrelated plant-derived foods: a clinical study. Allergy 57, 900-906.
Baker, D., and Sali, A. (2001). Protein structure prediction and structural genomics. Science 294,
93-96.
Barkley, N.A., Dean, R.E., Pittman, R.N., Wang, M.L., Holbrook, C.C., and Pederson, G.A.
(2007). Genetic diversity of cultivated and wild-type peanuts evaluated with M13-tailed
SSR markers and sequencing. Genetical Research 89, 93-106.
Barre, A., Borges, J.P., Culerrier, R., and Rouge, P. (2005). Homology modelling of the major
peanut allergen Ara h 2 and surface mapping of IgE-binding epitopes. Immunology
Letters 100, 153-158.
Bentham (1841). On the structure and affinities of Arachis and Voandzeria. Transactions of the
Linnean Society of London 18, 155-162.
Bock, S.A., Munoz-Furlong, A., and Sampson, H.A. (2001). Fatalities due to anaphylactic
reactions to foods. J Allergy Clin Immunol 107, 191-193.
Boldt, A., Fortunanto, D., Conti, A., Petersen, A., Ballmer-Weber, B.K., Lepp, U., and Becker,
W.M. (2005). Analysis of the composition of an immunoglobulin I reactive high
molecular weight protein complex of peanut extrat containing Ara h 1 and Ara h 3/4.
Proteomics 5, 675-686.
Branum, A.M., and Lukacs, S.L. (2008). Food Allergy Among U.S. Children: Trends in
Prevalence and Hospitalizations, N.C.f.H. Statistics, ed. (Hyattsville, MD, NCHS data
brief).
Breiteneder, H., and Mills, E.N.C. (2005). Molecular properties of food allergens. J Allergy Clin
Immunol 115, 14-23.
Buckler, E.S., IV , and Holtsford, T.P. (1996). Zea Systematics: Ribotomal ITS evidence.
Molecular Biology and Evolution 13, 612-622.
Burke, D.F., Deane, C.M., and Blundell, T.L. (2000). Bowsing the SLoop database of
structurally classified loops connecting elements of protein secondary structure.
Bioinformatics 16, 513-519.
Burks, A.W. (2008). Peanut allergy. Lancet 371, 1538-1546.
Burks, A.W., Williams, L.W., Connaughton, C., Cockrell, G., O'Brien, T.J., and Helm, R.M.
(1992). Identification and characterization of a second major peanut allergen, Ara h II,
with use of the sera of patients with atopic dermatitis and positive peanut challenge. J
Allergy Clin Immunol 90, 962-969.
Burks, A.W., Williams, L.W., Helm, R.M., Connaughton, C., Cockrell, G., and O'Brien, T.
(1991). Identification of major allergen, Ara h 1, in patients with atopic dermatitish and
postive peanut challenges. J Allergy Clin Immunol 88, 172-179.
Burow, M., Simpson, C., Faries, M., Starr, J., and Paterson, A. (2009). Molecular biogeographic
study of recently described B-and A-genome Arachis species, also providing new insights
into the origins of cultivated peanut. Genome 52, 107-119.
Chacón, J., Madriñána, S., Debouck, D., Rodriguez, F., and Tohme, J. (2008). Phylogenetic
patterns in the genus Manihot (Euphorbiaceae) inferred from analyses of nuclear and
chloroplast DNA regions Molecular Phylogenetics and Evolution 49, 260-267.

36
Chatel, J.M., Bernard, H., and Orson, F.M. (2003). Isolation and characterization of two
complete Ara h 2 isoforms cDNA. International Archives of Allergy and Immunology
131, 14-18.
Chevalier, A. (1933). Monographie de l'Arachide. Revue de Boatique Appliquée et d'Agriculture
Troplicale 13, 689-789.
Chevalier, A. (1934). Monographie de l'Arachide. Revue de Boatique Appliquée et d'Agriculture
Troplicale 14, 565-632, 709-755, 833-864.
Chevalier, A. (1936). Monographie de l'Arachide. Revue de Boatique Appliquée et d'Agriculture
Troplicale 15, 637-871.
Creste, S., Tsai, S., Valls, J., Gimenes, M., and Lopes, C. (2005). Genetic characterization of
Brazilian annual Arachis species from sections Arachis and Heteranthae using RAPD
markers. Genetic Resources and Crop Evolution 52, 1079-1086.
Daga, P.R. (2010). Template-based protein modeling: recent methodological advances. Current
Topics in Medical Chemistry 10, 84-94.
Dudek, M.J., Ramnarayan, K., and Ponder, J.W. (1998). Protein structure prediction using a
combination of sequence homology and global energy minimization: II. Energy
functions. Journal of Computational Chemistry 19, 548-473.
Dunwell, J.M., Purvis, A., and Khuri, S. (2004). Cupins: the most functionally diverse protein
superfamily? Phytochemistry 65, 7-17.
Espadaler, J., Querol, E., Aviles, F.X., and Oliva, B. (2006). Identification of fuctional-
associated loop motifs and application to protein function prediction. Bioinformatics 22,
2237-2243.
Fernández, A., and Krapovickas, A. (1994). Cromosomas y evolucion en Arachis
(Leguminosae). Bonplandia 8, 187-220.
Fiser, A., Do, R.K., and Sali, A. (2000). Modeling of loops in protien structures. Protein Science
9, 1752-1773.
Galgaro, L., Lopes, C.R., Gimenes, M., Valls, J.F.M., and Kochert, G. (1998). Genetic variation
between several species of section Extranervosae, Caulorrhizae, Heteranthae, and
Triseminatae (genus Arachis) estimated by DNA polymorphism. Genome 41, 445-454.
Galgaro, L., Montenegro Valls, J.F., and Lopes, C.R. (1997). Study of the genetic variability and
similarity among and within Arachis villosulicarpa, A. pietrarellii and A. hypogaea
through isoenzyme analysis. Genetic Resources and Crop Evolution 44, 9-15.
Gimenes, M.A., Lopes, C.R., Galgaro, L., Valls, J.F.M., and Kochert, G. (2002a). RFLP analysis
of genetic variation in species of section Arachis, genus Arachis (Leguminosae).
Euphytica 123, 421-429.
Gimenes, M.A., Lopes, C.R., Galgaro, M., Valls, J.M., and Kochert, G. (2000). Genetic variation
and phylogenetic relationships based on RAPD analysis in section Caulorrhizae, genus
Arachis (Leguminosae). Euphytica 116, 187-195.
Gimenes, M.A., Lopes, C.R., and Valls, J.F.M. (2002b). Genetic relationships among Arachis
species based on AFLP. Genetics and Molecular Biology 25, 349-353.
Golovnina, K.A., Glushkov, S.A., Blinov, A.G., Mayorov, V.I., Adkison, L.R., and Goncharov,
N.P. (2007). Molecular phylogeny of the genus Triticum L. Plant Systematics and
Evolution 264, 195-216.
Gregory, W.C., and Gregory, M.P. (1976). Groundnut Arachis hypogaea (Leguminosae-
Papilionatae). In Evolution of Crop Plants, N.W. Simmons, ed. (London, Longman), pp.
151-154.

37
Gregory, W.C., and Gregory, M.P. (1979). Exotic germ plasm of Arachis L. interspecific
hybrids. Journal of Heredity 70, 185-193.
Gregory, W.C., Gregory, M.P., Krapovicaks, A., Smith, B.W., and Yarbrough, J.A. (1973).
Structure and Genetic Resources of Peanuts. In Peanuts - Culture and Uses (Stillwater,
OK, American Peanut Research and Education Association, Inc. ), pp. 47-133.
Gregory, W.C., Krapovicaks, A., and Gregory, M.P. (1980). Structure, Variation, Evolution and
Classification in Arachis. In Advances in Legume Sciences, R.J. Summerfield, and A.H.
Bunting, eds. (Kew, Royal Botanical Gardens), pp. 469-481.
Gruber, P., Becker, W.M., and Hofmann, T. (2005). Influence of the Maillard Reaction on the
Allergenicity of rAra h 2, a Recombinant Major Allergen from Peanut (Arachis
hypogaea), Its Major Epitopes, and Peanut Agglutinin. J Agric Food Chem 53, 2289-
2296.
Grundy, J., Matthews, S., Bateman, B., Dean, T., and Arshad, S.H. (2002). Rising prevalence of
allergy to peanut in children: Data from 2 sequential cohorts. J Allergy Clin Immunol
110.
Halward, T.M., Stalker, H.T., LaRue, E.A., and Kochert, G. (1991). Genetic variation detectable
with molecular markers among unadapted germ-plasm resources of cultivated peanut and
related wild species. Genome 34, 1013-1020.
Hammer, K., Arrowsmith, N., and Gladis, T. (2003). Agrobiodiversity with emphasis on plant
genomics reserach Naturwissenschaften 90, 241-250.
Harlan, J.R. (1992). Crops & Man, Vol Second Edition (Madison, WI, American Society of
Agronomy-Crop Science Society).
Hilu, K.W., and Stalker, H.T. (1995). Genetic relationships between peanut and wild species of
Arachis sect. Arachis (Fabaceae): Evidence from RAPDs. Plant Systematics and
Evolution 198, 167-178.
Hoehne, F.C. (1940). Leguminosas-Papilionadas. Genero Arachis. Flora Brasilica 25, 1-20.
Hopkins, M.S., Casa, A.M., Wang, T., Mitchell, S.E., Dean, R.E., Kochert, G.D., and Kresovich,
S. (1999). Discovery and Characterization of Polymorphic Simple Sequence Repeats
(SSRs) in Peanut. Crop Sci 39, 1243-1247.
Hoshino, A.A., Bravo, J.P., Angelici, C.M.L.C.D., Barbosa, A.V.G., Lopes, C.R., and Gimenes,
M.A. (2006). Heterologous microsatellite primer pairs informative for the whole genus
Arachis. Genetics and Molecular Biology 29, 665-675.
Hourihane, J.O.B., Dean, T.O., and Warner, J.O. (1996). Peanut allergy in relations to heredity
maternal diet, and other atopic diseases: results of questionnaire survey, skin prick
testing, and food challenges, . British Medical Journal 313.
Husted, L. (1933). Cytological studies of peanut 1. Chromosome number and morphology.
Cytologia 4, 109-117.
Husted, L. (1936). Cytological studies of the peanut Arachis II. Chromosome number,
morphology and behaviour and their application to the origin of cultivated form.
Cytologia 7, 396-423.
Jarvis, A., Ferguson, M.E., Williams, D.E., Guarino, L., Jones, P.G., Stalker, H.T., Valls, J.F.M.,
Pittman, R.N., Simpson, C.E., and Bramel, P. (2003). Biogeography of Wild Arachis:
Assessing Conservation Status and Setting Future Priorities. Crop Sci 43, 1100-1108.
Jenkins, J.A., Griffith-Jones, S., Shewry, P.R., Breiteneder, H., and Mills, E.N.C. (2005).
Structural relatedness of plant food allergens with specific reference to cross-reactive
allergens: An in silico analysis. J Allergy Clin Immunol 115, 163-170.

38
Jung, S., Tate, P.L., Horn, R., Kochert, G., Moore, K., and Abbott, A.G. (2003). The
phylogenetic relationship of possible progenitors of the cultivated peanut. Journal of
Heredity 94, 334-340.
Kellogg, E.A., and Appels, R. (1995). Intraspecific and interspecific variation in 5S RNA genes
are decoupled in diploid wheat relatives. Genetics 140, 325-343.
King, N., Helm, R., Stanley, J.S., Vieths, S., Luttkopf, D., Hatahet, L., Sampson, H., Pons, L.,
Burks, W., and Bannon, G.A. (2005). Allergenic characteristics of a modified peanut
allergen. Mol Nutr Food Res 49, 963-971.
Kleber-Janke, T., Crameri, R., Appenzeller, U., Schlaak, M., and Becker, W.M. (1999). Selective
cloning of peanut allergens, including profilin and 2S albumins, by phage display
technology. International Archives of Allergy and Immunology 119, 265-274.
Kochert, G., Halward, T., Branch, W.D., and Simpson, C.E. (1991). RFLP variability in peanut
(Arachis hypogaea L) cultivars and wild species. Theoretical and Applied Genetics 81,
565-570.
Kochert, G., Stalker, H.T., Gimenes, M.A., Galgaro, L., Lopes, C.R., and Moore, K. (1996).
RFLP and cytogenetic evidence on the origin and evolution of allotetraploid
domesticated peanut, Arachis hypogaea (Leguminosae). American Journal of Botany 83,
1282-1291.
Koppelman, S.J., Wensing, M., Ertmann, M., Knulst, A.C., and Knol, E.F. (2004). Relevance of
Ara h1, Ara h2 and Ara h3 in peanut-allergic patients, as determined by immunoglobulin
E Western blotting, basophil-histamine release and intracutaneous testing: Ara h2 is the
most important peanut allergen. Clin Exp Allergy 34, 583-590.
Krapovickas, A. (1969). The origin, variability and spread of the groundnut (Arachis hypogaea).
In The Domestication and Exploitation of Plants and Animals, P.J. Ucko, and I.S. Falk,
eds. (London, Gerald Duckworth), pp. 427-441.
Krapovickas, A., and Gregory, W.C. (1994). Taxonomía del género Arachis (Leguminosae).
Bonplandia 8, 1-186.
Krause, S., Reese, G., Randow, S., Zennaro, D., Quaratino, D., Palazzo, P., Ciardiello, M.A.,
Becker, W.M., and Mari, A. (2009). Lipid transfer protein (Ara h 9) as a new peanut
allergen relevant for a Metiterranean allergic population. J Allergy Clin Immunol 124,
771-778.
Krishna, T.G., and Mitra, R. (1988). The probable genome donors to Arachis hypogaea L. based
on arachin seed storage protein. Euphytica 37, 47-52.
Lavia, G.I. (1998). Karyotypes of Arachis palustris and A. praecox (Section Arachis), two
species with basic chromosome number x=9. Cytologia 63, 177-181.
Lavin, M., Pennington, R.T., Klitgaard, B.B., Sprent, J.I., de Lima, H.C., and Gasson, P.E.
(2001). The dalbergioid legumes (Fabaceae): Delimitation of a pantropical monophyletic
clade. American Journal of Botany 88, 503-533.
Lehmann, K., Schweimer, K., Reese, G., Randow, S., Suhr, M., Becker, W.M., Vieths, S., and
Rosch, P. (2006). Structure and stability of 2S albumin-type peanut allergens:
implications for the severity of peanut allergic reactions. Biochem J 395, 463-472.
Lehrere, S.B., Ayuso, R., and Reese, G. (2002). Current Understanding of Food Allergens.
Annals of the New York Academy of Sciences 964, 69-85.
Li, W., Lui, Z., and Lai, L. (1999). Protein loops on structurally similar scaffolds: database and
conformational analysis. Biopolymers 49, 481-495.
Linn , C.v. (1753). Species plantarum (Holmiae : Impensis Laurentii Salvii).

39
Lu, J., and Pickersgill, B. (1993). Isozyme variation and species relationships in peanut and its
wild relatives (Arachis L.- Leguminosae). Theoretical and Applied Genetics 85, 550-560.
Maleki, S.J., Kopper, R.A., Shin, D.S., Park, C.W., Compadre, C.M., Sampson, H., Burks, A.W.,
and Bannon, G.A. (2000). Structure of the major peanut allergen Ara h 1 may protect
IgE-binding epitopes from degradation. J Immunol 164, 5844-5849.
Maleki, S.J., Viquez, O., Jacks, T., Dodo, H., Champagne, E.T., Chung, S.Y., and Landry, S.J.
(2003). The major peanut allergen, Ara h 2, functions as a trypsin inhibitor, and roasting
enhances this function. The Journal of Allergy and Clinical Immunology 112, 190-195.
Marti-Renom, M.A., Stuart, A.C., Fiser, A., Sanchez, R., Melo, F., and Sali, A. (2000).
Comparative protein structure modeling of genes and genomes. Annual Review in
Biophysics and Biomolecular Structure 29, 291-325.
Mattos, C., Ramussen, B., Ding, X.C., Pestko, G.A., and Ringe, D. (1994). Analogous inhibitors
of elastae do not always beind analogously. Nature Structural Biology 1, 55-58.
Milla, S.R., Isleib, T.G., and Stalker, H.T. (2005). Taxonomic relationships among Arachis sect.
Arachis species as revealed by AFLP markers. Genome 48, 1-11.
Mills, E.N., Jenkins, J.A., Alcocer, M.J.C., and Shewry, P.R. (2004). Structural, biological, and
evolutionary relationships of plant food allergens sensitizing via gastrointestinal tract.
Food Science and Nutrition 44, 379-407.
Mittag, D., Akkerdaas, J., Ballmer-Weber, B.K., Vogel, L., Wensing, M., Becker, W.M.,
Koppelman, S.J., Knulst, A.C., Helbling, A., Hefle, S.L., et al. (2004). Ara h 8, a Bet v 1-
homologous allergen from peanut, is a major allergen in patients with combined birch
pollen and peanut allergy. J Allergy Clin Immunol 114, 1410-1417.
Mondoulet, L., Paty, E., Drumare, M.F., Ah-Leung, S., Scheinmann, P., Willemot, R.M., Wal,
J.M., and Bernard, H. (2005). Influence of Thermal Processing on the Allergenicity of
Peanut Proteins. J Agric Food Chem 53, 4547-4553.
Monsalve, R.I., Gonzalez de la Peña, M.A., Menendez-Arias, L., Lopez-Otin, C., Villalba, M.,
and Rodriguez, R. (1993). Characterization of a new oriental-mustard (Brassica juncea)
allergen, Bra j IE: detection of an allergenic epitope. 1993 293, 625-632.
Mottern, H.H. (1973). Peanuts and human nutrition. In Peanuts - Culture and Uses (Stillwater,
OK, American Peanut Research and Education Association, Inc. ), pp. 593-602.
Nakajima, N., Higo, J., and Kidera, A. (2000). Free energy landscapes of peptides by enhanced
conformational sampling. Journal of Molecular Biology 296, 197-216.
Pe ñaloza, A.P.S., and Valls, J.F.M. (1997). Contagen do número cromossômico en assos de
Arachis decora (Legumonsae) In Simpósio Latino Slericanno de Recursos Genéticos
Vegetais, R.F.A. Vega, M.L.A. Bovi, J.A. Betti, and R.B.Q. Voltan, eds. (Campanias,
Brazil, IAC/Embrapa-Cenargen), p. 21.
Pe ñaloza, A.P.S., and Valls, J.F.M. (2005). Chormosome number and satellited chromosome
morphology of eleven species of Arachis (Leguminosae). Bonpladia 15, 65-72.
Pohill, R.M. (1981). Papilonoideae. In Advances in legume systematics, R.M. Pohill, and P.H.
Raven, eds. (Kew, U.K., Royal Botanic Garden).
Pons, L., Chery, C., Romano, A., Namour, F., Artesani, M.C., and Gueant, J.L. (2002). The 18
kDa peanut oleosin is a candidate allergen for IgE-mediated reactions to peanuts. Allergy
57, 88-93.
Rabjohn, P., Helm, E.M., Stanley, J.S., West, C.M., Sampson, H.A., Burks, A.W., and Bannon,
G.A. (1999). Molecular cloning and epitope analysis of the peanut allergen Ara h 3. J
Clin Invest 103, 535-542.

40
Radauer, C., Bublin, M., Wagner, S., Mari, A., and Breiteneder, H. (2008). Allergen are
distrubuted into few proteins families and possess a restricted number of biochemical
functions. J Allergy Clin Immunol 121, 847-852.
Raina, S.N., and Mukai, Y. (1999). Genomic in situ hybridization in Arachis (Fabacaeae)
identfies the diploid wild progenitors of cultivated (A. hypogaea) and related wild (A.
monticola) peanut species. Plant Systematics and Evolution 214, 215-262.
Raina, S.N., Rani, V., Kojima, T., Ogihara, Y., Singh, K.P., and Devarumath, R.M. (2001).
RAPD and ISSR fingerprints as useful genetic markers for analysis of genetic diversity,
varietal identification, and phylogenetic relationships in peanut (Arachis hypogaea)
cultivars and wild species. Genome 44, 763-772.
Ramos, M.L., Fleming, G., Chu, Y., Akiyama, Y., Gallo, M., and Ozias-Akins, P. (2006).
Chromosomal and phylogenetic context for conglutin genes in Arachis based on genomic
sequence. Mol Genet Genomics 275, 578-592.
Ramos, M.L., Huntley, J.J., Maleki, S.J., and Ozias-Akins, P. (2008). Identification and
characterization of a hypoallergenic ortholog of Ara h 2.01. Plant Mol Biol 69, 325-355.
Rao, V.R., and Murty, U.R. (1994). Botany - morphology and anatomy. In The Groundnit Crop:
A scientific basis for improvement J. Smartt, ed. (London, Chapman & Hall), pp. 24-42.
Raudauer, C., and Breiteneder, H. (2007). Evolutionary biology of plant food allergens. J Allergy
Clin Immunol 120, 518-525.
Ressler, P.M. (1980). A review of nomenclature of the genus Arachis L. . Euphytica 29, 813-
817.
Robotham, J.M., Wang, F., Seamon, V., Teuber, S.S., Sathe, S.K., Sampson, H.A., Beyer, K.,
Seavy, M., and Roux, K.H. (2005). Ana o 3, an important cashew nugt (Anacardium
occidentale L.) allergen of the 2S albumin family. J Allergy Clin Immunol 115, 1284-
1290.
Saavedra-Delgado, A.M. (1989). The many faces of the peanut. Allergy Proceedings 10, 291-
994.
Sali, A., and Kuriyan, J. (1999). Challenges at the frontiers of structural biology. Trends in Cell
Biology 9, M20-M24.
Sampson, H.A. (1996). Epidemology of food allergy Pediatric Allergy and Immunology 7
(supplement 9) 42-50.
Sampson, H.A. (1999). Food Allergy - part 1: immunopathogensis and clinical disorders. J
Allergy Clin Immunol 103, 717-728.
Santos , V.S.E.D., Gimenes, M.A., Valls , J.F.M., and Lopes, C.R. (2003). Genetic variation
within and among species of five sections of the genus Arachis L.(Leguminosae) using
RAPDs. Genetic Resources and Crop Evolution 50, 841-848.
Schlessinger, A., Lui, J., and Rost, B. (2007). Natively unstructured loops differ from other
loops. PLoS Computationsal Biology 3, e140.
Seetharam, A., Nayar, K.M.D., Sreekantaradhya, R., and Achar, D.K.T. (1973). Cytolotical
studies on the interspecific hybrid of Arachis hypogaea X Arachis duranensis Cytologia
38, 277-280.
Seijo, J.G., Lavia, G.I., Fernandez, A., Krapovickas, A., Ducasse, D., and Moscone, E.A. (2004).
Physical mapping of the 5S and 18S-25S rRNA genes by FISH as evidence that Arachis
duranensis and A. ipaensis are the wild diploid progenitors of A. hypogaea
(Leguminosae). American Journal of Botany 91, 1294-1303.
41
Sen, M., Kopper, R., Pons, L., Abraham, E.C., Burks, A.W., and Bannon, G.A. (2002). Protein
Structure Plays a Critical Role in Peanut Allergen Stability and May Determine
Immunodominant IgE-Binding Epitopes. J Immunol 169, 882-887.
Sicherer, S.H., Munoz-Furlong, A., and Sampson, H.A. (2003). Prevalence of peanut and tree nut
allergy in the United States determined by means of a random digit dial telephone survey:
A 5-year follow-up study. J Allergy Clin Immunol 112, 1203-1207.
Simpson, C.E., Krapovickas, A., and Valls, J.F.M. (2001). History of Arachis including evidence
of A. hypogaea L. progenitors Peanut Science 28, 78-79.
Singh, A.K. (1988). Putative genome donors of Arachis hypogaea (Fabaceae), evidence from
crosses with synthetic amphidiploids. Plant Systematics and Evolution 160, 143-151.
Singh, A.K., and Moss, J.P. (1984). Utilization of wild relatives in genetic improvement of
Arachis hypogaeaL. V. Genome anaylsis in section Arachis and its implication in gene
transfer. Theoretical and Applied Genetics 68, 355-364.
Singh, A.K., and Simpson, C.E. (1994). Biosystematics and genetic resources. In The Groundnut
Crop: A Scientific Basis for Improvement, J. Smartt, ed. (London, Chapman & Hall), pp.
96-137.
Smartt, J. (1965). Cross-compatibily relationships between the cultivated peanut Arachis
hypogaea L. and other species of the genus Arachis (Raleigh, NC, North Carolina State
University ).
Smartt, J., Gregory, W.C., and Gregory, M.P. (1978a). The genomes of Arachis hypogaea L. 1.
Cytogenetic studies of putative genome donors. Euphytica 27, 665-675.
Smartt, J., Gregory, W.C., and Gregory, M.P. (1978b). The genomes of Arachis hypogaea. 2.
Implication interspecific breeding. Euphytica 27, 677-680.
Smartt, J., and Stalker, H.T. (1982). Speciation and cytogenetics in Arachis In Peanut Science
and Technology H.E. Pattee, and C.T. Young, eds. (Yoakum, TX, American Peanut
Research and Education Society ), pp. 21-49.
Stalker, H.T. (1990). A morphological appraisal of wild species insection Arachis of peanuts
Peanut Science 17, 117-122.
Stalker, H.T. (1991). A new species in section Arachis of peanuts with a D genome American
Journal of Botany 78, 630-637.
Stalker, H.T., and Moss, J.P. (1987). Speciation, cytogenetics, and utilization of Arachis species.
Advances in Agronomy 41, 1-40.
Stanley, J.S., King, N., Burks, A.W., Huang, S.K., Sampson, H., Cockrell, G., Helm, R.M.,
West, C.M., and Bannon, G.A. (1997). Identification and mutational analysis of the
immunodominant IgE binding epitopes of the major peanut allergen Ara h 2. Arch
Biochem Biophys 342, 244-253.
Stebbins, G.L. (1957). Genetics, evolution and plant breeding. Indian Journal of Genetics and
Plant Breed 17, 129-141.
Strachan, D.P. (1989) Hay fever, hygiene, and household size. BMJ. 299: 1259-1260
Tallury, S.P., Hilu, K.W., Milla, S.R., Friend, S.A., Alsaghir, M., Stalker, H.T., and Quandt, D.
(2005). Genomic affinities in Arachis section Arachis (Fabaceae): Molecular and
cytogenetic evidence. Theoretical and Applied Genetics 111, 1229-1237.
Valenta, R., Duchene, M., Ebner, C., Valent, P., Sillaber, C., Deviller, P., Ferreira, F., Tejkl, M.,
Edelmann, H., Kraft, D., et al. (1992). Profilins constitute a novel family of fucntional
plant pan-allergens. Journal of Exprtimental Medicine 175, 377-385.

42
Valls, J.F.M., and Simpson, C.E. (2005). New species of Arachis (Leguminosae) from Brazil,
Paraguay and Bolivia. Bonplandia 14, 35-63.
Varisai Muhammad, S. (1973). Cytogenetical investigations in the genus Arachis L. I.
Interspecific hybrids between diploids. Madras Agricultural Journal 60, 323-327.
Viquez, O.M., Konan, K.N., and Dodo, H.W. (2003). Structure and organization of the genomic
clone of a major peanut allergen gene, Ara h 1. Mol Immunol 40, 565-571.
Viquez, O.M., Summer, C.G., and Dodo, H.W. (2001). Isolation and molecular characterization
of the first genomic clone of a major peanut allergen, Ara h 2. The Journal of Allergy and
Clinical Immunology 107, 713-717.
Vucetic, S., Orbradovic, Z., Vacic, V., Radivojac, P., Peng, K., Iakoucheva, L.M., Cortese, M.S.,
Lawson, J.D., Brown, C.J., Sikes, J.G., et al. (2005). DisProt: a database of protein
disorder. Bioinformatics 21, 137-140.
Warner, J.O. (1999). Peanut allergy: A major public health issue. Pediatric Allergy and
Immunology 10, 14-20.
Warwick, S.I., and Sauder, C.A. (2005). Phylogeny of tribe Brassiceae (Brassicaceae) based on
chloroplast restriction site polymorphisms and nuclear ribosomal internal transcribed
spacer and chloroplast trnL intron sequences. Canadian Journal of Botany 83, 467-583.
Witke, W. (2004). The role of profilin complexes in cell motility and other cellular processes.
Trends in Cell Biology 14, 461-469.
Wojciechowski, M.F., Lavin, M., and Sanderson, M.J. (2004). A phylogeny of legumes
(Leguminosae) based on analysis of the plastid matK gene resolves many well-supported
subclades within the family. American Journal of Botany 91, 1846-1862.
Wynne, J.C., and Halward, T. (1989). Cytogenetics and genetics of Arachis. In Critical Reviews
in Plant Science, B.V. Conger, ed., pp. 189-220.
Yan, Y.-S., Lin, X.-D., Zhang, Y.-S., Wang, L., Wu, K., and Huang, S.-Z. (2005). Isolation of
peanut genes encoding arachins and conglutins by expressed sequence tags. Plant Science
169, 439-445.

43
CHAPTER 2: Species, genomes and section relationships in genus
Arachis (Fabaceae): A molecular phylogeny

44
Abstract
The economically important genus Arachis (Fabaceae) is comprised of 80 species restricted to
South America. There is only one monograph for the genus that divided it into nine sections and
provided an intuitive assessment of evolutionary relationships. However, a comprehensive
phylogenetic study for the genus does not exist. To evaluate the current systematic treatment of
the genus, we reconstructed a phylogeny for Arachis using nuclear ITS and plastid trnT-trnF
sequences from a total of 48 species representing all nine sections. ITS cloning of the
allotetraploid species of section Arachis indicated the presence of A and B genome alleles and
chimeric sequences. Our study showed species from section Extranervosae as the first emerging
lineage in the genus, followed by sections Triseminatae and Caulorrhizae, with two major
terminal lineages, which we will refer to as erectoides and arachis. Lineage erectoides comprises
members of sections Erectoides, Heteranthae, Procumbentes, Rhizomatosae, and Trierectoides.
Species in the arachis lineage formed two major clades, arachis I (B and D genomes species, and
the aneuploids) and arachis II (A genome species). Our results substantiated the sectional
treatment of Caulorrhizae, Extranervosae and Triseminatae, but demonstrated that five sections
(Arachis, Erectoides, Procumbentes, and Trierectoides) are not monophyletic. A detailed study
of the genus Arachis with denser taxon sampling, additional genomic regions, plus information
from morphology and cytogenetics is needed for a comprehensive assessment of its systematics.
Keywords: Arachis peanut molecular phylogeny concerted evolution evolution
systematics

45
Introduction
The genus Arachis (Fabaceae, subfamily Papilionoideae, tribe Dalbergieae) contains
approximately 80 species including the economically important cultivated peanut, A. hypogaea
(Krapovickas and Gregory 1994; Lavin et al. 2001; Valls and Simpson 2005; Wojciechowski et
al. 2004). Krapovickas and Gregory (1994) indicated that the most defining morphological
features of the genus are the underground structures, including the fruits, rhizomatous structures,
root systems, and hypocotyls. Species of Arachis are distributed east of the Andes Mountains
and south of the Amazon River, with the highest diversity around the eastern border of Bolivia
and western Brazil (Krapovickas and Gregory 1994). Gregory et al. (1980) cited central Brazil
as the center of origin for Arachis and northern Argentina or southern Bolivia as the center of
origin of the domesticated peanut. Peanut is among the most important 30 crops that feed the
world (Hammer et al. 2003) and is cultivated in more than 100 countries with 37.1 million metric
tons produced globally. Other species of Arachis have also been cultivated, such as A.
villosulicarpa, as an indigenous food crop (Galgaro et al. 1997) and A. glabrata, A. pintoi, and A.
repens which are grown as forage crops (Galgaro et al. 1998).
A comprehensive molecular systematic study of the genus is lacking. The latest
monograph of Arachis was based on morphology, geographic distribution, cytogenetics, and
hybridization (Krapovickas and Gregory 1994). It recognized 69 species, dividing them into
nine sections: Arachis, Caulorrhizae, Erectoides, Extranervosae, Heteranthae, Procumbentes,
Rhizomatosae, Trierectoides, and Triseminatae. Recently, 11 additional species were recognized
in Arachis (Valls and Simpson 2005). The boundaries and phylogenetic relationships of the
sections are poorly understood. Section (sec.) Arachis is the largest, containing 31 species, or
45% of all currently recognized species (Krapovickas and Gregory 1994; Valls and Simpson
46
2005). It is the most studied of the nine sections because it contains the cultivated peanut and its
gene pools (Singh and Simpson 1994). The section is further divided into three groups of
species based on their genome type: A, B or D (Smartt et al. 1978; Stalker 1991), with the
cultivated A. hypogaea and wild A. monticola containing AB genomes. The phylogenetic
relationships among these species are not fully understood.
A majority of the Arachis species are diploid based on x = 10 (Krapovickas and Gregory
1994). However, there are five tetraploid species (2n = 4x = 40) and four aneuploid species (x =
9, 2n = 2x = 18) Krapovickas and Gregory 994 Lavia 998 Pe ñaloza and Valls 1997). Two
of the tetraploids (A. hypogaea and A. monticola) are in sec. Arachis, and the remaining three are
in section Rhizomatosae (A. glabrata, A. pseudovillosa, and A. nitida) (Krapovickas and Gregory
1994; Valls and Simpson 2005). Three of the aneuploids, A. decora, A. palustris, and A.
praecox, belong to section Arachis Lavia 998 Pe ñaloza and Valls 1997), but their genomic
identity and phylogenetic position has not yet been established. The fourth aneuploid, A.
porphyrocalyx is placed in sec. Erectoides Pe ñaloza and Valls 2005).
Krapovickas and Gregory (1994) presented an illustration of intuitive “evolutionary and
phylogenetic relationships” among the nine sections of Arachis based on information from
crossability, morphology and geography. They concluded that Erectoides, Extranervosae,
Heteranthae, Trierectoides and Triseminatae are “older” sections, while Arachis, Caulorrhizae,
Procumbentes, and Rhizomatosae are more “recent” in origin. They indicated that species from
section Erectoides produce hybrids with members of sections Arachis, Caulorrhizae,
Procumbentes, Rhizomatosae, and Trierectoides. Although most intersectional hybrids are
sterile, Krapovickas and Gregory (1994) considered section Erectoides to be less isolated than
the other sections. Other studies provided cytogenetic evidence for closer genomic relations

47
between Erectoides and the majority of the remaining sections (Gregory and Gregory 1979;
Stalker 1981; Valls and Simpson 1994). However, Krapovickas and Gregory (1994) maintained
that the use of cytogenetic studies to elucidate the phylogenetic relationships among the sections
and species is insufficient because of the genetic barriers that have developed in Arachis species
from geographic isolation and an autogamous reproductive system.
Relationships among species and some sections of Arachis have been evaluated using
molecular markers such as restriction fragment length polymorphism (RFLP) and random
amplification of polymorphic DNAs (RAPD) (Barkley et al. 2007; Creste et al. 2005; Galgaro et
al. 1998; Galgaro et al. 1997; Gimenes et al. 2002b). All of these studies were based on phenetic
analyses using the Unweighted Pair Group Methods (UPGMA). Some of these studies supported
the Krapovickas and Gregory (1994) classification, while others raised questions concerning the
validity of some sections, such as sections Heteranthae and Rhizomatosae. Hoshino et al. (2006)
were the first to represent all nine sections of Arachis using microsatellites but, the data were
analyzed phenetically with UPGMA. The majority of the species grouped into their respective
sections as defined by Krapovickas and Gregory (1994). However, some of sec. Procumbentes
species grouped with species from section Erectoides, while a few grouped with sections
Trierectoides and Heteranthae. Their study also showed that members of sec. Heteranthae
failed to group together, which is in agreement with the findings of Galgaro et al. (1998).
Two studies used DNA sequence information to examine the relationships among
Arachis species, but the focus was on section Arachis and the likely progenitors of A. hypogaea
(Jung et al. 2003; Tallury et al. 2005). Jung et al. (2003) used sequences of stearoyl-ACP and
oleoyl-PC desaturases from seven species of section Arachis and analyzed the data using
Maximum Parsimony (MP). Their unrooted tree provided further support for the origin of the A

48
and B genomes of A. hypogaea from A. duranensis and A. ipaensis, respectively. Tallury et al.
(2005) used plastid trnT-trnF sequences to examine the evolutionary relationships among the
genomes in section Arachis and the affinities of the aneuploid species to these genomes. Using
maximum likelihood (ML), the unrooted tree showed that the B and D genomes are more closely
related to each other than to the A genome, and that the aneuploids are closer to the B and D
genome species.
We present here a molecular phylogenetic study representing all nine sections and
recognized genomes of genus Arachis using sequence information from two intergenic spacers
(IGS) as well as one intron of the plastid trnT-trnF region and both nuclear ribosomal internal
transcribed spacers (ITS1 & 2). DNA sequence information from these regions has been
successfully used to depict the phylogenetic relationships among species within genera of
Fabaceae (e.g. Tun and Yamaguchi 2007; Vander Stappen et al. 2002). The data were analyzed
phylogenetically using maximum parsimony and Bayesian inference. We also applied TCS
network analysis to assess relationships among genomes and alleles within the ITS region due to
the presence of diverse sets of haplotypes, including potential chimeras.
Materials and methods
Taxon sampling
We analyzed a total of 48 accessions representing 46 species from all nine sections of
Arachis recognized by Krapovickas and Gregory (1994). Stylosanthes humilis and S. fruticosa
were chosen as outgroup species based on their sister group relationship to Arachis (Lavin et al.
2001). We generated new ITS and trnT-trnF sequences for 34 accessions and supplemented the
ITS datasets with 14 GenBank sequences. These GenBank sequences did not have

49
corresponding trnT-trnF sequences and genomic DNA was not available for them.
Consequently, we generated two data sets, one that included the 34 ITS accessions plus four
clones we sequenced representing the ITS alleles for the sec. Arachis tetraploids, A. hypogaea
and A. monticola. This data set overlaps completely with the trnT-trnF data set except for the
clones. The second data set included the above dataset plus the 14 GenBank sequences for a
total of 48 accessions, which we will refer to as the “extended data set.” Species examined,
sectional affiliation, and sources of material are noted in Table 2.1.
DNA extraction, amplification, cloning, and sequencing
Genomic DNA extraction followed Milla et al. (2005) using fresh leaf material. The ITS
region, including ITS1, 5.8S, and ITS2, was amplified using primers ITS4 and ITS5 (White et al.
1990) in a 25 μl reaction mixture containing x ThermoPol Buffer New England Biolabs,
Ipswich, MA), 200 M dNTPs, 20 pmol each primer and 1.5 U Taq DNA polymerase (New
England Biolabs, Ipswich, MA). The amplifications were carried out in a PTC-100 thermocycler
(MJ Research, Waltham, MA) with 2 min initial denaturing at 94° C, 35 cycles of 2 min
denaturing at 94° C, 1 min of primer annealing at 52°C, and 1.5 min extension at 72° C, followed
by a final extension of 5 min at 72°C.
Amplifications of the trnT-trnF region were carried out using universal primers (Taberlet
et al. 1991) as described in Tallury et al. (2005). Primers rps4-166F and trnL-P6/7 (Quandt et al.
2004) were used to generate amplified products when the universal primers failed to amply the
trnT-trnL region. PCR-amplified products for the ITS and trnT-trnF regions were resolved on
1% TAE-agarose gels containing 0.03 mg of ethidium bromide and were cleaned using
QIAquick PCR purification or QIAquick Gel Extraction kits (Qiagen, Valencia, CA). Cycle
sequencing reactions were carried out using ABI Big Dye Terminator Ready Reaction kits
50
(Applied Biosystems Inc., Foster City, CA) following standard protocols and then
electrophoresed on an Applied Biosystems 3730 automated sequencer at the Core Sequencing
Facility at VBI, Virginia Tech, or at the DNA Analysis Facility of Duke University.
Cloning and sequencing of sec. Arachis tetraploid ITS alleles
The amplified ITS region from allotetraploid species A. hypogaea and A. monticola were
ligated into the pGEM-T Easy vector (Promega, Madison, WI) to separate multiple alleles
suspected from double peaks in pherograms from direct sequencing of PCR amplifications of
genomic DNA. Ligated plasmids were heat shocked into JM109 E. coli cells (Promega).
Colonies were screened using the blue-white screening method for detecting the insert. Positive
clones were grown and DNA was isolated by the plasmid miniprep procedure (Birnboim and
Dolye 1979). Inserts were sequenced directly using vector specific primers. When direct
sequencing failed, the ITS insert was amplified from the clones using the ITS primers, and the
amplified inserts were cleaned and sequenced as detailed above.
Sequence alignment and phylogenetic analyses
Sequences were manually aligned using PhyDE (Müller et al. 2005) following the alignment
rules in Kelchner (2000). One identified inversion in the trnT-trnL spacer was positionally
separated in the alignments, and later included as a reverse complement in the phylogenetic
analyses, as discussed in Quandt et al. (2003) and Borsch and Quandt (2009). Indels were coded
using SeqState (Müller 2005) following the simple indel coding method (Simmons and
Ochoterena 2000).

51
Table 2.1 Arachis and outgroup species included in this study.
Genus & Section Species
Genome
Collector no.
Plant
Introduction # GenBank accession number
Arachis ITS trnT-trnF
Sec. Arachis A. batizocoi Krapov. & W.C. Gregory B K 9484 298639 this study this study
A. benensis Krapov., W.C. Gregory & C.E.
Simpson
A KGSPSc 35005 475877 this study this study
A. correntina (Burkart) Krapov. & W.C.
Gregory
A GKP 9530 262808 this study this study
A. cruziana Krapov., W.C. Gregory & C.E.
Simpson
B KSSc 36024 476003 this study this study
A. decora Krapov., W.C. Gregory, & Valls -- -- AY615237 --
A. diogoi Hoehne A GK 10602 -- this study this study
A. duranensis Krapov. & W.C. Gregory A K 7988 219823 this study this study
A. glandulifera Stalker D KGSSc 30091 468336 this study this study
A. helodes Martius ex Krapov. & Rigoni A KG 30029 468144 this study this study
A. herzogii Krapov., W.C. Gregory & C.E.
Simpson
A KSSc 36029 476008 this study this study
A. hoehnei Krapov. & W.C. Gregory A KG 30006 468150 AJ320395 this study
A. hypogaea L. AB -- 262090 this study this study
52
A. ipaensis Krapov. & W.C. Gregory B KGBSPSc
30076
468322 this study this study
A. kempff-mercadoi Krapov., W.C. Gregory &
C.E. Simpson
A KGSSc 30088 468333 this study this study
A. kuhlmannii Krapov. & W.C. Gregory A VKSSv 8888 -- this study this study
A. linearifolia Valls, Krapov. & C.E. Simpson A -- -- AY615242 --
A. magna Krapov., W.C. Gregory & C.E.
Simpson
B KGSSc 30093 468338 AF203555 this study
A. monticola Krapov. & Rigoni AB BaRiK 7264 this study this study
A. palustris Krapov., W.C. Gregory, & Valls VPmSv 13023 this study this study
A. praecox Krapov., W.C. Gregory, & Valls VSGr 6416 476128 this study this study
A. schininii Krapov. Valls & C.E. Simpson A -- -- AY615248 --
A. simpsonii Krapov. & W.C. Gregory A -- -- AY615247 --
A. stenosperma Krapov. & W.C. Gregory A -- -- AY615252 --
A. trinitensis Krapov. & W.C. Gregory A WiCla 1117 Grif 14278 this study this study
A. valida Krapov. & W.C. Gregory B VPoBi9157 Grif 7689 this study this study
A. williamsii Krapov. & W.C. Gregory B WiCla1118 Grif 14229 this study this study
Sec. Caulorrhizae A. pintoi Krapov. & W.C. Gregory C 18748 604858 this study this study
A. repens Handro C HLK 467 338277 this study this study
Sec. Erectoides A. brevipetiolata Krapov. & W.C. Gregory E2 -- -- AY615251 --

53
A. major Krapov. & W.C. Gregory E2 HLKHe 559 338294 this study this study
GK 10588 this study this study
A. paraguariensis Chodat & Hassl. E2 GKP 9646 262842 this study this study
Sec. Extranervosae A. burchellii Krapov. & W.C. Gregory Ex -- -- AY615262 --
A. lutescens Krapov. & Rigoni Ex -- -- AY615246 --
A. macedoi Krapov. & W.C. Gregory Ex GKP 10127 276203 this study this study
A. villosulicarpa Hoehne Ex -- -- AY615265 --
Sec. Heteranthae A. dardani Krapov. & W.C. Gregory Am GK 12943 -- this study this study
Sec. Procumbentes A. appressipilia Krapov. & W.C. Gregory E3 GKP 9990 261877 this study this study
A. kretschmeri Krapov. & W.C. Gregory E3 -- --- AY615220 --
A. matiensis Krapov., W.C. Gregory & C.E.
Simpson
E3 -- -- AY615249 --
A. pflugeae C.E. Simpson, Krapov. & Valls E3 -- -- AY615233 --
A. rigonii Krapov. & W.C. Gregory E3 GKP 10034 262142 this study this study
Sec. Rhizomatosae A. burkartii Handro R1 -- -- AY615245 --
A. glabrata Benth. R2 -- -- AY615250 --
Sec. Trierectoides A. guaranitica Chodat & Hassl. E1 -- 276194 this study this study
A. tuberosa Bong. ex Benth. E1 -- 476142 this study this study
Sec. Triseminatae A. triseminata Krapov. & W.C. Gregory T GK12881 -- this study this study
GK 12922 -- this study this study
54
Stylosanthes S. fruticosa (Retz.) Alston -- 321413 this study this study
Stylosanthes S. humilis Kunth -- 275764 this study this study

55
The data sets were analyzed with indels coded (IC) as binary characters and without the use of
indels (IN). Aligned datasets for the nuclear ITS (excluding the 26S exon) and plastid trnT-trnF
were analyzed separately and in combination.
Since in Arachis the plastid genome follows a maternal inheritance (Tallury et al. 2005),
only the maternal ITS region as identified by the TCS analysis was used for the allotetraploid
species in the combined analysis. Phylogenetic analyses of the three data sets were conducted
using maximum parsimony in PAUP* version 4.0b10 (Swofford 2003) and Bayesian inference
(BI) in MrBayes (Huelsenbeck and Ronquist 2001). Maximum Parsimony (MP) analyses were
performed as heuristic tree searches using tree bisection-reconnection (TBR) branch-swapping
with 100 random addition sequence replicates, and incorporating the parsimony ratchet algorithm
(Nixon 1999) via PRAP2 (Müller 2007). A strict consensus tree was generated for each data set.
Support for the clades was obtained by performing bootstrap (BS; Felsenstein 1985) searches
with 100 replicates and 10 random sequence replicates. Bayesian analyses were performed using
the GTR+Γ+I models, with 2,000,000 generations and 0 runs with 4 chains. Trees were
compiled using TreeGraph2 (Müller and Müller 2004; Stöver and Müller 2009).
A partition homogeneity test (PHT; Farris et al. 1995) was performed in PAUP*
(Swofford 2003) prior to the combined analyses to determine if the ITS and trnT-trnF regions
were congruent in their mode of evolution. The PHT was conducted using 100 replicate
partitions. For each replicate partition, no more than 500 trees were saved with a score greater
than 1. The resulting P-value (0.01) indicate the two regions are incongruent, which implied that
the ITS and trnT-trnF regions should not be combined. However, PHT has been found to be
sensitive to noise and different mutation rates between genomic regions, and might not be an
accurate measure of congruence between regions (Baker and Lutzoni 2002; Darlu and Lecointre

56
2002; Dolphin et al. 2000). To assess the potential sources of conflict, the matrices for the two
genomic regions were analyzed separately and in combination. Comparison of trees derived
from the partitioned analyses showed that support for conflicting nodes was low, implying soft
incongruence (Johnson and Soltis 1998).
Haplotype networks were constructed using TCS (Clement et al. 2000; Clement et al.
2002). Because only singleton gaps were observed in the data, the probability of parsimony was
set to 95% cut off. The TCS analysis allowed for the identification of chimeric ITS sequences
that were subsequently excluded from phylogenetic analyses.
Results
ITS alleles and sequence statistics
Amplification and sequencing of the ITS region generated a single homogenous sequence
in each case with the exception of the two allotetraploid species A. hypogaea and A. monticola.
In these allotetraploids, although the initial reading of the chromatograms depicted a prominent
signal for the putative A genome allele, re-examination revealed the presence of secondary peaks
and what appeared as possible background noise (Figure 2.1). Consequently, the genomic ITS
PCR products of the tetraploids were cloned and sequenced. A total of 14 clones each from A.
hypogaea and A. monticola were obtained. For A. hypogaea, the majority of the clones
corresponded to the ITS sequence of the A genome species (10 clones; 71.4%) while two clones
matched the B genome species (14.3%). The remaining two clones were chimeric as noted
below. In case of A. monticola, six clones (42.9%) represented the A genome, whereas two
clones (14.3%) represented the B genome. The remaining six clones were chimeric as noted
below. The majority of the clones with the A genome clustered with the A. duranensis

57
haplotype, while those with the B genome grouped with the A. ipaensis haplotype in the TCS
analysis (Figure 2.2). There were a few clones in which the haplotype differed from either A.
duranensis or A. ipaensis due to mutations in a few positions (Figure 2.2). When the alignment
of the A and B genome clones was examined, the positions where mutational differences were
observed corresponded exactly to the position in the alignment of the genomic sequences where
double peaks were detected. The two alleles differed by eight substitutions and a single-base
indel. The lower frequency of the B allele in the allotetraploids may have caused the lower
signal (smaller peaks) in the chromatograms, whereas the one-base gap resulted in a
chromatogram shift that appeared as background noise (Figure 2.1).
Alleles with chimeric sequences (total of 7 clones, 24%) were also observed in both
allotetraploids. These included three types of chimera that differ in the genomic identity of ITS1
and ITS2 regions: 1) ITS1 represents the A allele, while ITS2 represents the B allele (2 clones,
14.3%), 2) ITS1 represents the B allele, while ITS2 represents the A allele (1 clone, 7.1%), and
3) one of the ITS regions is a hybrid of the A and B genomes, whereas the other represents one
of the two genomes (5 clones; 35.7%). The positions of the chimeric clones in relation to the A
and B genome haplotypes are illustrated in the TCS network (Figure 2.2).
ITS based phylogeny
The complete ITS region sequences for the genus varied in length from 599 in A.
brevipetiolata to 657 bp in A. hypogaea. The sequences were trimmed at the 26S rDNA subunit,
63 bp, as these sequences were incomplete for this exon. Twelve indels of 1-9 bp were required
for the alignment of all the species including the outgroup taxa, resulting in a total alignment of
614 characters. The ITS dataset consisted of 38 taxa, 36 of which were included in the ingroup.
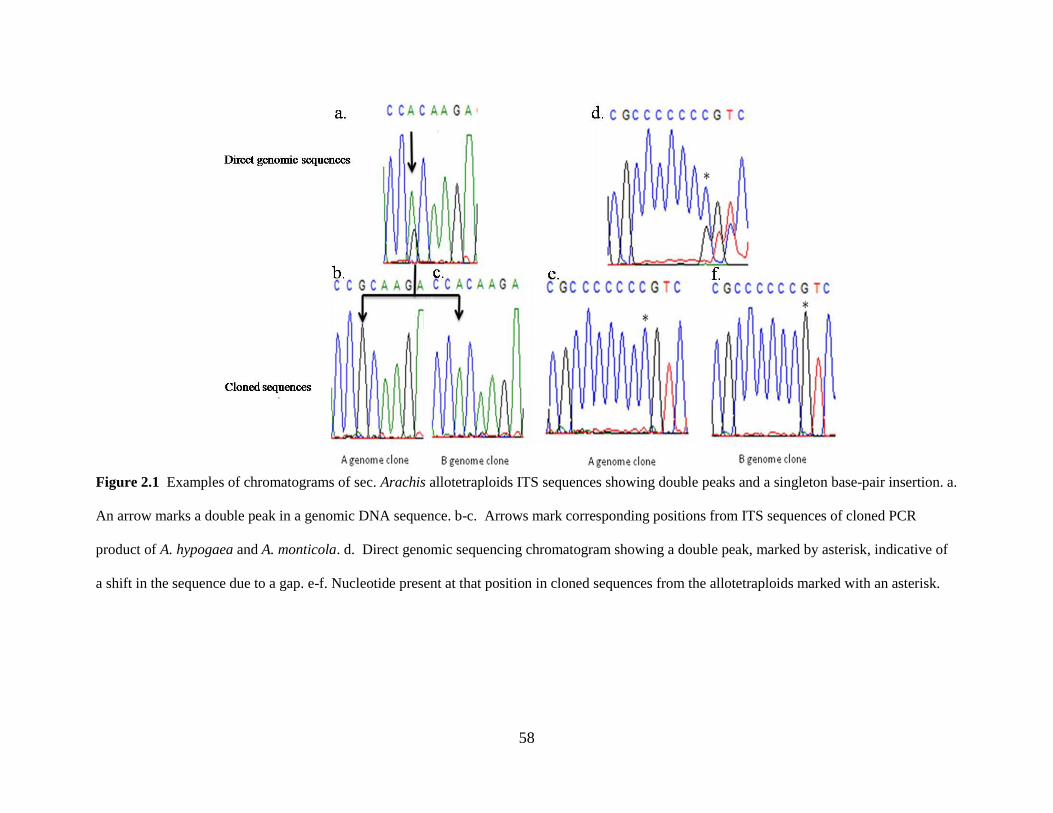
58
Figure 2.1 Examples of chromatograms of sec. Arachis allotetraploids ITS sequences showing double peaks and a singleton base-pair insertion. a.
An arrow marks a double peak in a genomic DNA sequence. b-c. Arrows mark corresponding positions from ITS sequences of cloned PCR
product of A. hypogaea and A. monticola. d. Direct genomic sequencing chromatogram showing a double peak, marked by asterisk, indicative of
a shift in the sequence due to a gap. e-f. Nucleotide present at that position in cloned sequences from the allotetraploids marked with an asterisk.

59

60
Figure 2.2 Haplotype networks for sec. Arachis diploid species and clones for the allotetraploids A. hypogaea (H) and A. monticola (M):
a. ITS1 and b. ITS2 regions. Clones that contained chimeric haplotypes are shaded in gray.

61
For the MP analyses of the non-indel-coded dataset, of the 614total characters analyzed 153
(25%) were variable and 97 (63.4%) were parsimony informative. Based on this dataset, six
trees were generated with a length of 196 steps. The consistency index (CI) was 0.913 and
retention index (RI) was 0.938. For the indel-coded dataset, 174 (27.4%) of the total 634
characters were variable, and of those, 108 (62.1%) were parsimony informative. Analysis of the
indel-coded ITS dataset generated seven trees with a length of 221 steps. The CI and RI for this
dataset were 0.905 and 0.932, respectively. The Bayesian analyses with and without indels coded
generated 50% majority trees that were congruent in topology and identical to the MP consensus
trees, differing only in degrees of support for some of the nodes (Figure 2.3). Since topology was
the same for the MP and BI trees, the BI tree is presented here with bootstrap (BS) and posterior
probability (PP) support values noted on the branches.
The monophyly of the genus received full BS and PP supported with (IC) and without
(IN) indels coded as characters (Figure 2.3). The first deriving lineage was sec. Extranervosae
represented by A. macedoi, excluded from the rest of the genus with low BS support (62% IN,
54% IC). When analyzed using BI, A. macedoi was excluded from the remaining Arachis
species with significant posterior probability (PP) without indels coded as characters (0.95), but
the exclusion of this species lost significant support when indels were included as characters
(0.89). Accessions of the monotypic sec. Triseminatae were the next to diverge and received full
support in all analyses. Section Triseminatae was excluded from the remaining Arachis species
by strong to full support in all analyses (99% BS-IN, 100% BS-IC, 1.00 PP-IN, 1.00 PP-IC).
The next diverging lineage comprised of species of sec. Caulorrhizae (A. pintoi and A. repens),
receiving strong support (95% BS-IN, 99% BS-IC, 1.00 PP-IN, 1.00 PP-IC). Section

62
Caulorrhizae was excluded from the remaining two lineages with moderate BS support (76% IN,
68% IC) in the MP analyses and full PP support in the BI analyses.
The other terminal lineage consisted of sec. Arachis species divided into two clades
(Figure 2.3), which we will refer to as arachis I and arachis II. The monophyly of this lineage
received moderate support (68% BS-IN, 71% BS-IC), but significant PP support (0.97 IN, 0.96
IC). Group arachis I comprised of B genome, D genome, and aneuploid species, and received
strong BS support (98% BS-IN, 98% BS-IC) and full PP support. Two subclades were resolved
within group arachis I. The first consisted of the aneuploid species A. praecox and A. palustris,
receiving full support in all analyses. The second subclade included B and D genome species,
receiving 86% BS-IN and 87% BS-IC and strong PP (0.99 IN, 0.99 IC). Species within this
subclade appeared in two polytomies, one included A. batizocoi + A. cruziana (100% BS-IN,
100% BS-IC, 1.00 PP-IN, 1.00 PP-IC), A. benensis, A. glandulifera (D genome), A. trinitensis
(B genome), and the other (65% BS-IN, 63% BS-IC) comprised of A. ipaensis, A. magna, A.
williamsii, A. valida, and the tetraploid B genome clones. Group arachis II (66% BS-IN, 67%
BS-IC, 0.65 PP-IN, 0.86 PP-IC) comprised of a polytomy of A. major 10588 (sec. Erectoides),
A. hoehnei and A. diogoi plus a subclade of yet another polytomy (61% BS-IC, 0.92 PP-IC) of
Section Arachis A genome species A. correntina, A. duranensis, A. herzogii, A. kempff-mercadoi,
A. kuhlmannii, and clones representing the A genome from the tetraploid species. When indels
were excluded from analyses, a total polytomy was evident.
In the extended ITS dataset, a total of 619 characters were analyzed using MP and BI, of
these 171 (27.6%) were variable and 117 (68.4%) parsimony informative. Fifteen trees most
parsimonious were obtained with a length of 238 steps, CI of 0.861, and RI of 0.929.

63

64
Figure 2.3 Bayesian inference 50% phylogeny majority rule consensus trees for Arachis rooted with Stylosanthes humilis and S. fruticosa and
used GTR+Γ+I model based on sequences from nuclear ribosomal ITS region (left) and trnT-trnF region (right). Arrows indicate branches that
collapsed when the IUPAC characters were included for the allotetraploid ITS sequences in the dataset. ∆ = branches were not recovered in MP
analyses. + = branches not recovered in MP analyses with indel coding = branches not recovered in MP analyses without indel coding. =
branches not recovered in the BI analysis when indel characters were included. Posterior probabilities are above the branches and bootstrap
support values are below. Supports with indels coded are on the left while those obtained without indel coding are on the right.

65
When indels were included, the total of 652 characters contained 204 (31.3%) that were variable,
of which 133 (65.2%) were parsimony informative. The MP analyses generated 58 trees with a
length of 277 steps. The CI and RI were 0.859 and 0.925, respectively. The topology of the
consensus trees was the same with and without indel coding, differing in resolution within group
arachis I and arachis II (Figure 2.4).
As in the trees based on the non-extended ITS dataset, the monophyly of the genus was
fully supported (Figure 2.4). The first deriving lineage consisted of species from sec.
Extranervosae and was fully supported in all analyses. This lineage formed two clades, one
clade included the species A. macedoi and A. lutescens (94% BS-IN, 98% BS-IC, 1.00 PP-IN,
1.00 PP-IC) and the other A. burchellii and A. villosulicarpa (92% BS-IN, 99% BS-IC, 1.00 PP-
IN, 1.00 PP-IC). The exclusion of sec. Extranervosae from the remaining species of Arachis
received moderate BS support (79% IN, 68% IC) and significant PP support (1.00 IN, 0.99 IC).
Accessions of the monotypic sec. Triseminatae were the next to diverge and received full
support in all analyses (Figure 2.4). The two basal lineages were excluded from the rest of the
genus with very strong BS support (99% IN, 99% IC) and full PP support. The monophyly of
sec. Caulorrhizae was also strongly supported (93% IN, 99% IC, full PP support; however, their
exclusion from the remaining Arachis lineages receive <50% BS support and lacked significant
PP support (0.74 IN, 0.75 IC). The diploid species of sec. Rhizomatosae, A. burkartii diverged
next. The exclusion of A. burkartii from remaining Arachis was less than 50% BS with or
without indels coded as characters and received slightly less than significant PP support (0.94);
however, the exclusion of this species did receive significant support (0.96) when indels were not
coded as characters in the BI analysis.

66

67
Figure 2.4 Arachis phylogeny generated using Bayesian inference based on ITS expanded dataset, indels coded as characters, and GTR+Γ+I
model. Phylogenies generated using MP were nearly identical to the Bayesian tree in topology. + = branches not recovered in MP analyses with
indel coding = branches not recovered in MP analyses without indel coding. = branches not recovered in the BI analysis when indel
characters were included. Posterior probabilities are above the branches and bootstrap support values are below. Supports with indels coded are
on the left while those obtained without indel coding are on the right.

68
The sections represented in each of the terminal lineages had similar composition when
compared to trees based on the nonextended ITS (Figure 2.4), with the exception of the inclusion
of the sec. Rhizomatosae tetraploid species A. glabrata with group erectoides. Within group
erectoides (79% BS-IN, 72% BS-IC, 1.00 PP-IN, 1.00 PP-IC), two clades were once again
resolved. The first clade included sec. Trierectoides and two species of sec. Erectoides, A. major
559 and A. brevipetiolata, in a polytomy that received low BS support (59% IN, 65% IC) but
significant to full PP support (1.00 IN, 0.99 IC). The second clade was more resolved with A.
paraguariensis (sec. Erectoides) and A. pflugeae (sec. Procumbentes) sister to two subclades. In
the first subclade (63% BS-IN, 68% IC, 0.96 PPP-IN, 0.95 PP-IC), A. kretschmeri appeared
sister to A. glabrata (sec. Rhizomatosae) plus A. appressipilia (sec. Procumbentes; 88% BS-IN,
87% BS-IC, 1.00 PP-IN, 1.00 PP-IC). The second subclade comprised of A. rigonii, A. dardani,
and A. matiensis in a polytomy that received good BS support (87% IN, 86% IC) and full PP
support (1.00 IN, 1.00 IC).
In the other terminal lineage in the tree based on the extended ITS, sec. Arachis species
were resolved into groups, arachis I and arachis II (Figure 2.4). The whole lineage received low
BS support (52% IN, 58% IC), but significant PP support (0.96 IN, 0.95 IC). As in the
nonextended dataset, group arachis I received strong BS (94% BS-IN, 95% BS-IC) and full PP
support. Similar to the nonextended dataset, the aneuploids subclade received full support in all
analyses, and included the aneuploid species A. decora, which was not represented in the
nonextended dataset. The structure of the other subclade containing the B and D genome species
was the same as in the tree based on the nonextednded dataset (86% BS-IN, 87% BS-IC, 0.99
PP-IN, 1.00 PP-IC). The polytomy that contained A. ipaensis, A. magna, A. williamsii, A. valida,
and the tetraploid clones had low BS support (61% IN, 67% IC) and significant PP support (0.97

69
IN, 0.97 IC). While A. batizocoi and A. cruziana had full support in all analyses (100% BS-IN,
100% BS-IC, 1.00 PP-IN, 1.00 PP-IC), the sister relationship of A. glandulifera to these two B
genome species was identified only in analyses using indels as characters. However, it lacked
significant PP support (0.59 PP-IC) and had low BS support (65% IC). Support for analyses in
which indels were not used as characters, had less than 50% support values for BS and PP. The
other clade, group arachis II (within the sec. Arachis lineage) contained the A genome species
and clone sequences as previously identified. Group arachis II included A. linearifolia, A.
stenosperma, A. schininii, and A. simpsonii in a polytomy (67% BS-IN, 74% BS-IC, 0.93 PP-IN,
0.97 PP-IC) with the other A genome species as in the phylogenies based on the initial ITS
dataset.
trnT-trnF based phylogeny
The sequences of the trnT-trnF region varied from 1789 to 1960 bp in length. Seventeen
indels of 1-22 bp were coded in the alignment, resulting in a matrix of 2052 characters. From the
5’ trnL exon, 117 characters were excluded from the analyses due to the presence of a large
amount of missing data. Consequently, 1935 characters were analyzed, of which 202 (10.4%)
were variable and 114 (56.4%) parsimony informative. The trnT-trnF dataset generated 31 most
parsimonious trees with a length of 241 steps with CI and RI values of 0.892 and 0.912,
respectively. When indels were coded as characters for the reduced data set, the total number of
characters increased to 1995, with 261 (13.1%) characters being variable and 152 (58.2%)
parsimony informative. From the indel-coded dataset, 391 most parsimonious trees were
produced of 336 steps with CI and RI values of 0.815 and 0.854, respectively. The phylogenetic
trees obtained from the MP analyses without indels coded and BI analyses with and without
70
indel coded produced congruent trees, differing only in degrees of support for the nodes (Figure
2.3). The phylogeny produced in MP analyses with indel coding was more resolved at the base,
but had low BS support and lacked PP support. The phylogenetic structure of the terminal
lineages was consistent with that resulting from the MP without indels coded and all BI analyses.
The monophyly of the genus received full support in all analyses. Based on the plastid
sequence data, two major lineages were recovered in the Bayesian analyses (Figure 2.3), with
and without indel coding, and the MP analysis without indel coding. The phylogeny generated
using MP analysis with indels coded as characters did not recover the first lineage and had a
backbone topology that was more like the ITS based phylogenies, but lacked support (data not
shown). Thus, the trnT-trnF based phylogeny recovered from the BI analyses and MP analysis
with indels as characters is shown and discussed here (Figure 2.3). The first lineage comprised of
three sections corresponding to the first three diverging lineages in the ITS based phylogenies,
Caulorrhizae, Extranervosae, and Triseminatae. However, this lineage did not receive BS
support above 50% nor did it receive significant PP support (0.71 IN, 0.56 IC). The three
sections resolved in a grade corresponding to accessions of the monotypic sec. Triseminatae
(100% BS-IN, 100% BS-IC, 1.00 PP-IN, 1.00 PP-IC), followed by A. macedoi (sec.
Extranervosae), and then sec. Caulorrhizae (100% BS-IN, 100% BS-IC, 1.00 PP-IN, 1.00-
PPIC). The exclusion of sec. Triseminatae from remaining species within this lineage lacked
significant support (53% BS-IN, <50% BS-IC0.61 PP-IN, 0.63 PP-IC).
The second lineage comprised of species in groups arachis I, arachis II, and erectoides,
and received strong BS (89% IN, 95 IC) and full PP support (1.00 IN, 1.00 IC; Figure 2.3).
Group arachis II resolved sister to groups arachis I plus erectoides; however, the sister
relationship between the latter two clades lacked significant PP support and received <50% BS

71
regardless of indel coding. Group arachis II received moderate BS support (73% IN, 77%IC)
and full PP support (1.00 IN, 1.00 IC). The aneuploid species A. praecox was sister to the
remaining species of this group, though its exclusion received less than 50% BS support (IN and
IC) and lacked PP support (0.63 IN, 0.68 IC). Following A. praecox, the species were divided
into two subclades. The first subclade (80% BS-IN, 58% BS-IC, 1.00 PP-IN, 1.00 PP-IC)
consisted of a grade of the aneuploid A. palustris, followed by A. ipaensis (77% BS-IN, 75% BS-
IC, 0.99 PP-IN, 0.99 PP-IC), and A. cruziana plus A. batizocoi (94% BS-IN, 97% BS-IC, 1.00
PP-IN, 1.00 PP-IC). In the second group, which represents the arachis I subclade (63% BS-IN,
73% BS-IC, 1.00 PP-IN, 1.00 PP-IC), A. magna came sister to a polytomy (59% BS-IN, 60%
BS-IC, 1.00 PP-IN, 1.00 PP-IC) that was comprised of A. benensis plus A. trinitensis (63% BS-
IN, 65% BS-IC, 1.00 PP-IN, 1.00 PP-IC), A. glandulifera plus A. valida (59% BS-IN, 73% BS-
IC, 0.99 PP-IN, 1.00 PP-IC), and A. williamsii. Group erectoides was the second clade resolved
here (71%BS-IN, 55% BS-IC, 1.00 PP-IN, 1.00 PP-IC) and reflects the same sections and
species composition as the ITS based phylogeny. The two species of sec. Trierectoides formed a
polytomy and were sister to another polytomy comprising the remaining species (87% BS-IN,
58% BS-IC, 1.00 PP-IN, 1.00 PP-IC). Arachis appressipilia and A. dardani resolved together
with good BS support (85% IN, 90% IC) and full PP support. Group arachis II was comprised of
a polytomy of A. major (10588), A. kuhlmannii, A. monticola, A. hypogaea, A. duranensis (98%
IN, 99% IC, full PP support) plus two subclades of A. correntina/A. diogoi/A. hoehnei (64% BS-
IN, <50% BS-IC, 1.00 PP-IN, 1.00 PP-IC), and A. herzogii/A. helodes/A. kempff-mercadoi (0.66
PP-IN) were resolved in polytomies.

72
Phylogenies based on combined ITS and trnT-trnF data
The MP analyses of the combined dataset included 2547 total characters, of which 355
(13.9%) were variable and included 211 (59.4%) parsimony informative characters. This
analysis resulted in 167 most parsimonious trees of 446 steps. The CI was 0.883 and RI was
0.909. When indels were coded, the dataset expanded to 2628 characters. The combined indel-
coded dataset had 260 (60%) parsimony informative characters from the 435 (16.6%) variable
characters. The MP analyses of the indel-coded dataset generated 540 most parsimonious trees
of 568 steps. The CI and RI were 0.835 and 0.872, respectively. Strict consensus trees from both
MP and BI analyses were identical in topology (Figure 2.5), but differed in PP and BS support
values.
The monophyly of the genus based on combined ITS and trnT-trnF sequence data was
fully supported in all analyses (Figure 2.5). At the base of the Arachis phylogeny, a grade
emerged representing Arachis macedoi (sec. Extranervosae), followed by sec. Triseminatae, then
sec. Caulorrhizae, then a clade of group erectoides, and groups arachis I and arachis II. The
exclusion of A. macedoi from the remaining Arachis species received moderate BS support (73%
IN, 79% IC) and significant PP support (0.97 IN, 0.98 IC), while the exclusion of A. macedoi
and sec. Triseminatae received strong BS support (98% IN, 98% IC) and full PP support.

73
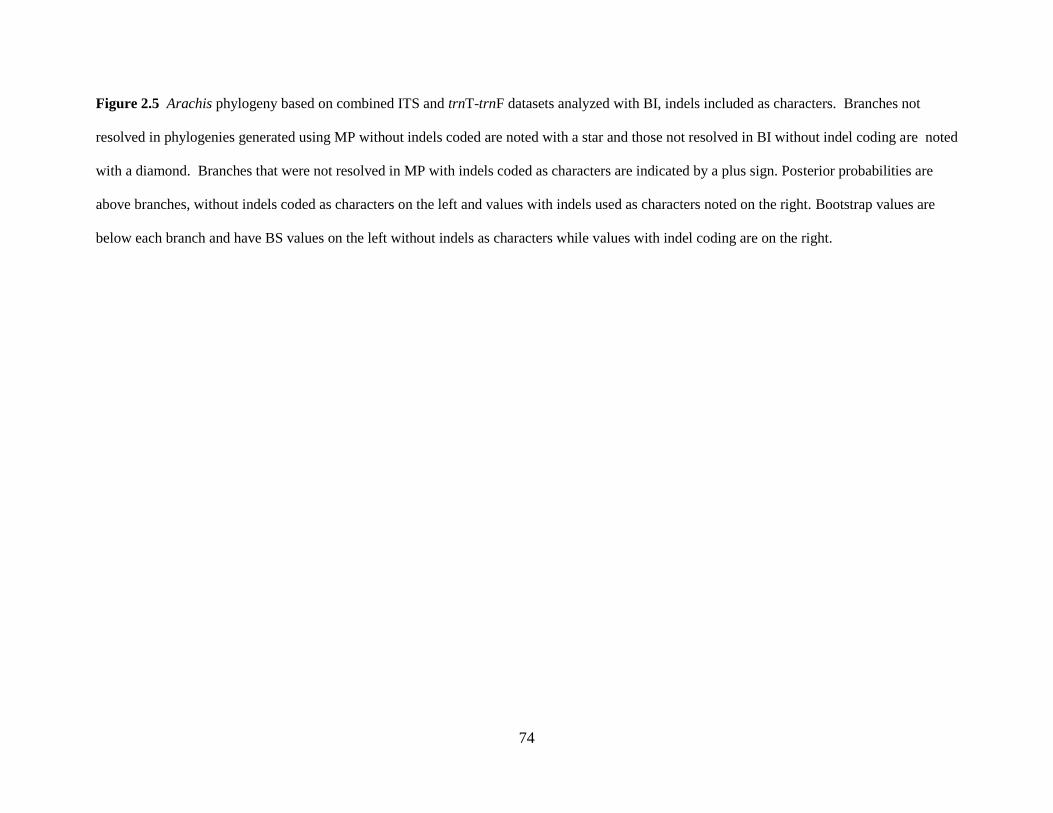
74
Figure 2.5 Arachis phylogeny based on combined ITS and trnT-trnF datasets analyzed with BI, indels included as characters. Branches not
resolved in phylogenies generated using MP without indels coded are noted with a star and those not resolved in BI without indel coding are noted
with a diamond. Branches that were not resolved in MP with indels coded as characters are indicated by a plus sign. Posterior probabilities are
above branches, without indels coded as characters on the left and values with indels used as characters noted on the right. Bootstrap values are
below each branch and have BS values on the left without indels as characters while values with indel coding are on the right.
75
Exclusion of sec. Caulorrhizae from the three latter groups received strong to full support (100%
BS-IN, 99% BS-IC, 1.00 PP-IN, 1.00 PP-IC). Species topology within the strongly supported
group erectoides (96% BS-IN, 95% BS-IC, 1.00 PP-IN, 1.00 PP-IC) was similar to the trnT-trnF
based tree. Group arachis I comprised of two subclades similar in topology to the ITS tree. The
exceptions were the placement of A. ipaensis and A. glandulifera within this subclade (Figure
2.5). Species composition and topology for group arachis II was consistent with phylogenies
based on the partitioned ITS and trnT-trnF dataset and received full support in all analyses.
Discussion
Molecular Evolution
Considering the average length of 629 bp for the ITS region, the number of variable
characters was 153, or 24.3%. In contrast, the trnT-trnF region was 1914 bp in average length
with 202 variable characters or 10.4%. Therefore, it appears that the ITS region has a higher rate
of substitution than the trnT-trnF in Arachis. In other words, for sequencing three-fold the
length of the ITS region, we obtained only 24.2% more variable sites from the trnT-trnF. Of
these variable sites, the number of potentially parsimony informative sites from the two regions
were similar, 97 PI for ITS vs. 114 for the trnT-trnF. The CI and RI values calculated on the
trees based on the ITS region were slightly higher than those based on the trnT-trnF, implying
higher proportion of homoplasy in the latter (p <0.05). When the robustness of the phylogenetic
trees obtained from these two genomic regions is compared, it appears that the two regions
produced comparable number of resolved nodes and overall PP and BS support. Therefore,
despite the low proportion of variable and PI sites in the trnT-trnF compared with the ITS and

76
the slightly higher homoplasy, the two regions provided comparable phylogenetic information in
Arachis phylogenetic reconstruction.
Generally, the ITS region is thought to evolve towards one of the parental progenitors in
hybrids and allopolyploids because it undergoes rapid homogenization (Álverez and Wendel,
2003; Soltis et al., 2008). Considering the signal in the chromatogram obtained from the direct
genomic sequencing of the allotetraploids species A. hypogaea and A. monticola, the A genome
ITS allele appeared to be the more dominant in positions where double peaks representing the
two alleles were found. This may be explained by the presence of the A allele clones at much
higher frequency than the B allele clones (71.4% vs. 14.3% for A. hypogaea and 42.9% vs.
14.3% for A. monticola). This implies that the ongoing process of concerted evolution is
favoring the A allele over the B allele. Although the occurrence of multiple alleles has been
frequently documented (e.g. Kovarik et al., 2004; Soltis et al., 2008; Vander Stappen et al.,
1998), their detection can sometimes go unnoticed since the region contains few polymorphic
sites indicative of each genome (Soltis et al., 2008), or low signal exists for one of them as
shown in this study. This study has also shown the presence of chimeric alleles in six of the 14
(42.8%) A. monticola clones, and 2 of the 14 A. hypogaea clones (14%), implying the
occurrence of infra-allelic recombination events in the ITS of both tetraploid genomes. The
presence of chimeric alleles was confirmed in our TCS analysis of the ITS1 and ITS2 alleles
from diploid species in sec. Arachis and the cloned alleles from the tetraploid species (Figure
2.2). These chimeric alleles were closely linked with their respective ITS regions of their
parental alleles as demonstrated by the TCS haplotype network (Figure 2.2). This evolutionary
dynamic in the Arachis ITS region as illustrated by the chimeric ITS may represent a fluid state

77
that will subsequently undergo fixation by concerted evolution towards one of the ancestral
genotypes.
Without cloning, nucleotide sites showing multiple peaks in the direct genomic sequences
of taxa with multiallelic ITS regions are usually assigned IUPAC ambiguity codes. Soltis et al.
(2008) have deomnstrated that phylogenetic reconstruction will be negatively impacted when
IUPAC ambiguity codes are used as molecular characters. This point received further support
from this study. The inclusion of the nine IUPAC coded characters for the allotetraploid species
in a dataset that has a total of 153 variable characters and 97 PI characters resulted in
considerable collapse of nodes in the clades containing the tetraploids (arachis I and arachis II
clades; Figure 2.3). However, when cloned sequences representing the A and B alleles were
used alone to represent the tetraploid species in the MP analyses, resolution improved
significantly and the clones grouped with the sequences of the respective putative diploid
progenitors (Figure 2.3). The collapse of nodes illustrates the impact of ambiguous sequences
due to multiple copies not previously recognized in the genome and stresses the point of how
carefully ITS data should be treated in general. Once ambiguous sites are detected then cloning
of this region is highly recommended.
Phylogeny of the genus Arachis
Analyses of the partitioned ITS and trnT-trnF regions produced alternative topologies
(Figures 2.4, 2.5). The most notable was the resolution at the base and the placement of group
erectoides. The three basal lineages in the ITS based phylogenies (Figure 2.4) appeared in a
single clade in most analyses of the trnT-trnF data (Fig 2.5). However, the monophyly of this
lineage was <50% BS and lacked significant PP support. The difference in topology at the base
78
of the phylogeny can thus be regarded as soft incongruence. The structure of the terminal
lineages and clades in the phylogeny varied depending on the dataset used (Figures 2.4, 2.5). The
sister relationship of group erectoides to group arachis II received less than 50% BS support and
did not have significant PP support, and could also be attributed to soft incongruence.
Phylogenies based on the combined datasets resolved all major lineages and clades with strong to
moderate support (Figure 2.7). Thus, discussion of phylogenetic relationship and systematic
implication for Arachis species will focus on the phylogenies based on the combined dataset.
Basal Grade. Phylogenetic analyses of the combined ITS and trnT-trnF datasets produced trees
that resolved A. macedoi of sec. Extranervosae as sister to remaining Arachis (Figure 2.5). The
extended ITS dataset included three additional species of sec. Extranervosae, A. burchellii, A.
lutescens, and A. villosulicarpa, which were resolved in one clade at the base. Galgaro et al.
(1998) showed A. burchellii and A. macedoi appearing in one cluster in a RAPD based
dendrogram. Gimenes et al. (2000) included these species in their UPGMA analyses of RFLP
data and found that they formed a cluster with 81% BS support. These two studies support the
placement of A. burchellii and A. macedoi in one lineage in this study. The grouping of A.
macedoi with A. lutescens (94% BS-IN, 98% BS-IC, 1.00 PP-IN, 1.00 PP-IC) and A. burchellii
with A. villosulicarpa (92% BS-IN, 98% BS-IC, 1.00 PP-IN, 1.00 PP-IC) in strongly-supported
clades can be further bolstered with morphological characters (Krapovickas and Gregory, 1994).
Both A. macedoi and A. lutescens possess leaflets that are smooth on the upper surface, while the
leaflets of A. burchellii and A. villosulicarpa are covered in soft fine hairs. The phylogenetic
position for sec. Extranervosae does not completely agree with the phylogenetic notions of
Krapovickas and Gregory (1994) who considered sec. Extranervosae to be a “presumably older

79
section”, sec. Trierectoides is “probably the most primitive [section] of the genus.” They based
their conclusion on the assumption that sec. Trierectoides is “genetically very isolated” from the
remaining sections of the genus. In this study, the two species in sec. Trierectoides were nested
deeper in the tree within group erectoides lineage (Figure 2.5).
The second diverging lineage, sec. Triseminatae (Figure 2.5), received 79% BS-IN, 68%
BS-IC, and full PP support for their exclusion from remaining Arachis species. Krapovickas and
Gregory 994) considered this section to be one of the “older” sections in the genus because it is
genetically isolated based on unsuccessful attempts to generate hybrids in crosses between sec.
Triseminatae and representative species from other sections of the genus. The UPGMA analysis
of microsatellite markers showed the accessions of A. triseminata forming a cluster distinct from
the remaining species of the genus (Hoshino et al., 2006). The placement of the third diverging
lineage, sec. Caulorrhizae (A. pintoi and A. repens) received full PP and BS support. The
affinities between sections Triseminatae and Caulorrhizae have been previously demonstrated in
the UPGMA analysis of RAPD and RFLP data (Galgaro et al., 1998). These two species of sec.
Caulorrhizae are very closely related based on data from hybridization and pollen fertility,
microsatellite data, RFLP, and isozymes (Gimenes et al., 2000; Gregory and Gregory, 1979;
Hoshino et al., 2006; Palmieri et al., 2005). Morphologically, A. pintoi and A. repens are easily
distinguishable on the basis of leaf shape and leaflet size (Gimenes et al., 2000; Krapovickas and
Gregory, 1994) from other species of the genus.
Group erectoides. The next diverging lineage in the phylogeny based on the combined dataset is
a heterogeneous lineage comprised of sections Erectoides, Heteranthae, Procumbentes, and
Trierectoides (Figure 2.5). The structure of group erectoides in the analyses of the extended and

80
nonextended dataset were similar with the exception that the extended ITS dataset included A.
glabrata from sec. Rhizomatosae (Figure 2.4). A similar grouping was recovered in UPGMA
analysis of AFLP data (Gimenes et al., 2002b), with the exception that the Trierectoides species
were not used in that study. However, their cluster received <50% BS support and its subgroups
also tended to have low BS support. The exception was the sister relationship between A.
dardani and A. rigonii, which was strongly supported (99% BS support) in the Gimenes et al.
(2002) study. The Arachis phylogenies produced using combined ITS and trnT-trnF data
resolved A. rigonii as sister to A. dardani and A. appressipilia (the latter was not included in the
Gimenes study) with full PP and good BS support (78%) when indels were included as
characters. Using microsatellite data, Hoshino et al. (2006) recovered a cluster of species from
sections Erectoides and Procumbentes only. The emergence of erectoides in this study as a
strongly supported lineage (1.00 PP-IN, PP-IC, 97% BS-IN, 99%BS-IC) can be explained in a
historic perspective. Section Trierectoides was previously treated as part of sec. Erectoides, but
was later segregated from this section based on the presence of three leaflets instead of the four
leaflets found in all other sections (Krapovickas and Gregory, 1994). Species currently
recognized as sec. Procumbentes were also historically included in sec. Erectoides, but were
removed by Krapovickas and Gregory (1994) based on their decumbent habit and flower
development along the length of the branches. Therefore, except for sec. Heteranthae, it is not
surprising to see the other members converge into one lineage with such strong support.
Group arachis I. Members of sec. Arachis have appeared in one cluster in phenetic analyses
(Gimenes et al., 2002b; Milla et al., 2005) and in a well supported lineage in phylogenetic
analyses (Tallury et al., 2005), with compositions different from the arachis I and arachis II
81
recovered here. The species resolved in group arachis I included aneuploids, B genome, D
genome, and one A genome species from sec. Arachis, in two subclades.
The fully supported aneuploids subclade was comprised of A. palustris and A. praecox
(Figure 2.5). Inclusion of the ITS sequence from the third aneuploid, A. decora, in the extended
dataset resolved all three aneuploids in the same subclade with full support from all analyses
(Figure 2.4). These three aneuploid species were classified within sec. Arachis based on
morphological features (Krapovickas and Gregory, 1994). Only a few studies focusing on sec.
Arachis have included these aneuploid species (Bravo et al., 2006; Creste et al., 2005; Gimenes
et al., 2007; Milla et al., 2005; Tallury et al., 2005). Microsatellite data placed accessions of
these species together in a cluster with the A genome species A. diogoi, A. kuhlmannii, and A.
simpsonii (Bravo et al., 2006). In AFLP based dendrograms, the aneuploids formed a separate
cluster (Milla et al., 2005; Tallury et al., 2005). However, in the trnT-trnF study of Tallury et al.
(2005) and here, the aneuploid species appeared within the B and D genome clade and were
excluded from the A genome species with strong BS and PP support, implying higher genetic
affinities to the B and D genomes than the A genome (Figures 2.3-2.5). The phylogenetic
placement of the aneuploids points to chromosomal rearrangement following the split of arachis
I and arachis II from a common ancestor. This event resulted in two sister lineages representing
the aneuploids (2n=18) and the mostly B genome species that maintained the common
chromosome complement of 2n=20. This interpretation is more parsimonious than a loss of a
pair of chromosomes in the aneuploids and their reappearance in the mostly B genome lineage.
The B genome species formed the second subclade of group arachis I along with the lone
D genome species A. glandulifera. The B genome is identified by the lack of the small “A”
chromosome characteristic of the A genome (Smartt et al. 1978; Fernández and Krapovickas,

82
1994; Krapovickas and Gregory, 1994). Within this subclade, B genome species resolved into
two groupings based on the combined dataset (Figure 2.5). The first included A. ipaensis, A.
batizocoi, and A. cruziana, while the second was comprised of A. benensis, A. trinitensis, A.
williamsii, A. magna, A. valida, and the D genome species A. glandulifera. The emergence of A.
ipaensis with A. batizocoi and A. cruziana in the phylogeny based on combined plastid and
nuclear data was not expected. Arachis ipaensis has previously been considered more closely
related to A. magna than to either A. batizocoi or A. cruziana based on data from crossability and
RFLP (Burow et al., 2009), RAPD and RFLP (Gimenes et al., 2002a), AFLP (Milla et al., 2005),
sequence of nuclear hypervariable regions (Moretzsohn et al., 2004), and microsatellite markers
(Bravo et al., 2006). These studies suggests that species lacking the A chromosome, and thus
identified as B genome species, or non-A genome species as suggested by Seijo et al. (2004), are
a fairly heterogeneous group. Burow et al. (2009) had proposed the B genome be split into an A.
batizocoi group and A. ipaensis group based on RFLP data. These proposed relationships are
supported here only with the ITS data (Figure 2.3, 2.4)
Recently, Robledo and Seijo (2010) suggested that B genome, or non-A genome species,
be separated into three genome groups based on heterochromatin detection and mapping of
rDNA loci using FISH. The genome groups proposed were B (A. ipaensis, A. gregoryi, A.
magna, A. valida, and A. williamsii), F (A. benensis and A. trinitensis), and K (A. batizocoi, A.
cruziana, and A. kropovickasii). The proposed F genome species appear nested within arachis I
with moderate BS (64% IN, 69% IC) and full PP support (Figure 2.5). The proposed K genome
group (A. batizocoi and A. cruziana) formed a clade with full support in all analyses. The
species in the proposed B genome group were not recovered as a single grouping in the
combined and trnT-trnF data analyses but did so in the ITS data analyses (Figure 2.3, 2.5). This
83
may reflect the impact of the maternally inherited trnT-trnF on the evolutionary history of the
group. In the trnT-trnF phylogeny, A. ipaensis resolves sister to the proposed K genome species.
The placement of A. ipaensis was inconsistent depending on the genomic region used (Figure
2.3, 2.5). Tallury et al. (2005) recovered A. ipaensis as sister to A. batizocoi and A. cruziana in
an ML network based on trnT-trnF sequence data, albeit with weak BS support. In the ITS
based trees (Figures 2.3 and 2.4), species belonging to the proposed K group resolved in one
group with moderate-to-low BS (61% IN, 67% IC) and significant PP support (0.97 IN, 0.97 IC).
The F genome species appeared as a polytomy in the tree based on the ITS dataset.
Only one species in Arachis, A. glandulifera, has been designated to have the D genome
(Stalker, 1991). The placement of this species in arachis I received strong support in the
analyses of partitioned and combined data sets (Figures 2.3-2.5). However, its position within
the clade differed based on the genomic region used. The ITS data showed low support for its
placement as sister to A. batizocoi and A. cruziana, whereas the trnT-trnF data included it in the
grouping of A. magna, A. williamsii, A. benensis, A. trinitensis, and A. valida with moderate BS
and significant PP support (Fig. 2.4). It is to be noted that both the trnT-trnF and combined data
showed A. glandulifera grouping with A. valida, but support varied (Figures 2.4, 2.5). Tallury et
al. (2005) resolved a moderately supported lineage that included A. glandulifera with A.
williamsii and A. benensis; A. magna, A. valida, and A. trinitensis were not included in that
study. Therefore, although a common ancestry for the B and D genome species is evident, there
seems to be disagreement in the placement of A. glandulifera, possibly caused by the mode of
inheritance of the genomic regions or amount of phylogenetic signal.

84
Group arachis II. This group was comprised of species that have been identified mostly as A
genome species, but also included one species from section Erectoides, A. major (Figures. 2.3-
2.5). In the first study that covered representatives of several sections of Arachis (Gimenes et al.,
2002b), sec. Arachis formed a distinct cluster in a UPGMA tree based on AFLP data that
received less than 50% support. Lack of resolution is quite evident in arachis II clade in this
study (Figures 2.3-2.5), as well as in previous studies (Gimenes et al., 2002b; Tallury et al.,
2005). The low resolution and support among members of arachis II may imply recent origin or
low rate of substitution.
Origin of the allotetraploids in sec. Arachis. The differential inheritance of the ITS and trnT-
trnF regions provided insight into the evolutionary history of the allotetraploids, A. hypogaea
and A. monticola. The trnT-trnF analysis confirmed the maternal origin of the A genome since
the allotetraploids appeared as part of the A genome lineage but in a polytomy (Figures 2.3, 2.5).
The ITS clones further substantiated the results of the trnT-trnF data and provided evidence for
the paternal origin of the B genome (Figs. 2.2-2.4) as previously noted by Kochert et al. (1991),
Jung et al. (2003), and Seijo et al. (2004). Although the presence of polytomies prevented us
from pinpointing the exact species donors, the putative donor species, A. duranensis and A.
ipaensis, were recovered in those polytomies (Figures 2.3-2.5). Therefore, better resolution and
support using more genomic regions with higher substitution rate is needed before molecular
phylogenetics can provide support for the ancestry of the A and B genomes.

85
Systematic implication
At the present, the systematic monograph of Krapovickas and Gregory (1994) for the
genus Arachis represents the only comprehensive treatment. In their intuitive treatment, they
recognized nine sections based on morphological features from the leaf, hypocotyl, fruit, flower,
and branching habit. The size of these sections varied from being monotypic, such as sec.
Triseminatae, to considerably large ones, such as sec. Arachis. Krapovickas and Gregory
(1994) also provided information on geographic distribution and polyploidy levels for these
sections. This study is among the first molecular phylogenetic treatment for the genus using
nuclear and plastid genomic sequences to examine the evolutionary history of species within all
nine sections. Based on the phylogenetic trees generated, only two sections appear monophyletic,
sec. Extranervosae and sec. Caulorrhizae, besides the monotypic sec. Triseminatae (Figure 2.3-
2.5).
Krapovickas and Gregory (1994) recognized sec. Extranervosae on the basis of perennial
habit, expanded corolla, and orange standard with red veins on its lower surface. The present
study included one species for each of the partitioned and combined ITS and trnT-trnF datasets,
while four of the nine species were used in the extended ITS dataset. It is evident from our
extended ITS analyses that the section is monophyletic (Figure 2.4). Our results were consistent
with those of Gimenes et al. (2002b), which placed A. macedoi and A. burchellii (the only two
species used of sec. Extranervosae) in one cluster with high BS support, and with Galgaro et al.
(1998) study where five of the species appeared in one cluster in their UPGMA analyses of
RAPD and RFLP data. Thus based on the extended ITS data, we support the monophyly and
thus taxonomic treatment of sec. Extranervosae.

86
Section Triseminatae is monotypic and it is characterized morphologically by the
apomorphy of cotyledons with veins deeply sunken on the upper surface (Krapovickas and
Gregory, 1994). In an attempt to generate intersectional hybrids, Gregory and Gregory (1979)
did not succeed in obtaining hybrids between A. triseminata and members of other sections.
Further, very few hybrids were obtained when crosses were made among various accessions of
A. triseminata, indicating the presence of an intraspecific barrier within this species. The two
accessions of A. triseminata (GK 12881 and GK 12922) used in this study appeared in one clade
with full PP and BS support (Figures. 2.3-2.5), providing support for the monophyly of the
species. Therefore, our study confirms the sectional status of Triseminatae and its isolated
position.
Similarly, this study also confirmed the monophyletic nature of sec. Caulorrhizae with
both A. pintoi and A. repens appearing in one clade in all analyses with high BS and full PP
supports (Figs. 2.3-2.5). Crosses between A. repens and A. pintoi produced hybrids that had high
pollen stainability (86.8%; Gregory and Gregory, 1979), implying very close genetic
relationship. Similar conclusions have emerged from studies based on AFLP, microsatellite, and
RAPD data (Gimenes et al., 2000; Hoshino et al., 2006; Palmieri et al., 2005). Section
Caulorrhizae is characterized by procumbent branching habit, standard of the petals with red
lines on its upper face, flowers and fruit that develop along the length of the branch, and stems
that form roots at the nodes (Krapovickas and Gregory, 1994). Its two species can be separated
morphologically on the basis of leaf shape and leaflet size (Gimenes et al., 2000; Krapovickas
and Gregory, 1994). However, despite the differences in leaf morphology, the trnT-trnF and ITS
sequences were identical. Similarly, protein profiles in the Bertozo and Valls (2001) study could
not discriminate between these two species.

87
Since sec. Heteranthae (Am genome) is represented by one species, A. dardani, in this
study; its taxonomic status cannot be assessed at this time. However, it appears to show
phylogenetic affinities to sections Erectoides (E2), Procumbentes (E3), Rhizomatosae (R2) and
Trierectoides (E1) as evident in the analyses of partitioned and combined datasets (Figures 2.3-
2.5). Gimenes et al. (2002b) showed A. dardani and A. rigonii of sec. Procumbentes forming a
cluster in their AFLP based UPGMA phenogram, in partial agreement with this study.
The majority of the species representing sections Erectoides, Trierectoides, and
Procumbentes in our study were formerly placed in sec. Erectoides as series Tetrafoliolatae,
Trifoliolatae, and Procumbensae (Gregory et al., 1973). However, Krapovickas and Gregory
(1994) raised series Procumbensae and Trifoliolatae to sectional level, whereas series
Tetrafoliolatae retained the sectional name Erectoides. Taxonomic treatment for these sections
was based on plant habit, leaflet number, flower color, and hypocotyl characters (Krapovickas
and Gregory, 1994). Sections Erectoides and Procumbentes, containing 14 and nine species,
respectively, and are characterized by the tetrafoliate leaves, cylindrical hypocotyl and standard
with red lines on the upper face. The two sections differ in their branching habit (erect for sec.
Erectoides vs. procumbent for sec. Procumbentes) and flower position where they are distributed
along the branches in sec. Procumbentes and found closer to the base (collar) in sec. Erectoides.
Section Trierectoides, encompassing A. guarantica and A. tuberosa, is characterized by the
trifoliate leaf and tuberiform hypocotyl. Our study resolved the three sections in a highly
supported lineage in all analyses (Figures 2.4-2.5), implying a potential nucleus for a new
taxonomic unit.
In a study examining intersectional relationships using crossability data, Gregory and
Gregory (1979) produced hybrids among species from the three sections (Erectoides,

88
Procumbentes, and Trierectoides); however, most of these hybrids were highly or completely
sterile as indicated by pollen stainability. Krapovickas and Gregory (1994) used these
cytogenetic results to support the establishment of sections Erectoides, Procumbentes and
Trierectoides. Hoshino et al. (2006) generated a dendrogram based on microsatellite data that
showed species of sec. Erectoides and Procumbentes intermixed in a cluster separate from
another cluster containing species of sec. Trierectoides, implying a close genetic relationship
between sec. Erectoides and Procumbentes. Raina and Mukai (1999) have noted in their FISH
study of ribosomal DNA that species of sec. Erectoides and Procumbentes possess the same
genome but belong to different sub-genomes as identified by Gregory and Gregory (1979).
The placement of one A. major accession within erectoides, while the other accession is
in arachis II, was not unexpected (Figures 2.3-2.5). Krapovickas and Gregory (1994) had noted
that crosses among A. major accessions from the furthest points of its distribution did not
produce fertile hybrids. Thus, they suggested that although the accessions appear to be
morphologically similar, it was possible that they belong to different biological species.
Therefore, A. major is in need of a detailed study at the population level to determine species
boundaries and its phylogenetic placement in the genus.
Section Arachis is defined morphologically on the basis of the vertical peg and lack of
rhizomes (Krapovickas and Gregory, 1994). However, their monograph for the genus did not
further subdivide the section into the currently recognized genome groups A, B and D. Studies
using molecular markers have shown that species with the A and B genomes form distinct
groups (Burow et al., 2009; Gimenes et al., 2002a; Halward et al., 1991; Hilu and Stalker, 1995;
Tallury et al., 2005). The sole D genome species A. glandulifera was shown to be more closely
related to the B genome than to the A genome species (Tallury et al., 2005), a relationship
89
supported in this study (Figures 2.3-2.5). However, sec. Arachis as a whole was not consistently
recovered as a single lineage and its monophyly lacked strong support in all analyses. Although,
trnT-trnF did not recover sec. Arachis as a single lineage, the monophyly of it is well supported
with the ITS and combined datasets. Further, we tentatively consider its two components groups
arachis I and arachis II as two separate but closely related clades.
Literature Cited
Álverez I, Wendel JF (2003) Ribosomal ITS sequence and plant phylogenetic inference. Mol
Phylogenet Evol 29, 417-434.
Angelici C, Hoshino AA, Nobile PM, Palmieri DA, Valls JFM, Gimenes MA, Lopes CR (2008)
Genetic diversity in section Rhizomatosae of the genus Arachis (Fabaceae) based on
microsatellite markers. Genet Mol Biol 31, 79-88.
Baker FK, Lutzoni FM (2002) The utility of the incongruence length difference test. Syst Biol
51, 625-637.
Barkley NA, Dean RE, Pittman RN, Wang ML, Holbrook CC,Pederson GA (2007) Genetic
diversity of cultivated and wild-type peanuts evaluated with M13-tailed SSR markers and
sequencing. Genet Res 89, 93-106.
Bertozo M.R, Valls JFM (2001) Seed storage protein electrophoresis in Arachis pintoi and A.
repens (Leguminosae) for evaluating genetic diversity. Genet Resour Crop Evol 48, 121-
130.
Birnboim HC, Dolye J (1979) A rapid alkaline extraction procedure for screening recombinant
plasmid DNA. Nucl Acids Res 7, 1513-1523.
Borsch T, Quandt D (2009) Mutational dynamics and phylogenetic utility of non-coding plastid
DNA. Plant Syst Evol- Special Issue on non-coding DNA Evolution 282, 169-199.
Bravo JP, Hoshino AA, Angelici C, Lopes CR, Gimenes MA (2006) Transferability and use of
microsatellite markers for the genetic analysis of the germplasm of some Arachis section
species of the genus Arachis. Genet Mol Biol 29, 516-524.

90
Burow M, Simpson C, Faries M, Starr J, Paterson A (2009) Molecular biogeographic study of
recently described B-and A-genome Arachis species, also providing new insights into the
origins of cultivated peanut. Genome 52, 107-119.
Clement M, Posada D, Crandall KA (2000) TCS: A comupter program to estimate gene
genealogies. Molecular Ecology 9, 1657-1659.
Clement M, Snell Q, Walke P, Posada D, Crandall KA (2002) TCS: Estimating gene
genealologies. In Parallel Distributed Processing Symposium (Proceedings International
IPDPS. Abstracts and CD-Rom), pp. 184-190.
Creste S, Tsai S, Valls J, Gimenes M,Lopes C (2005) Genetic characterization of Brazilian
annual Arachis species from sections Arachis and Heteranthae using RAPD markers.
Genet Resour Crop Evol 52, 1079-1086.
Darlu P, Lecointre G (2002) When does the incongruence length difference test fail? MBE 19,
432-437.
Dolphin K, Belshaw R, Orme CDL, Quicke DLJ (2000) Noise and incongruence: Interpreting
results of incongruence length difference test. Mol Phylogenet Evol 17, 401-406.
Farris JS, Kallersjo M, Kluge AG, Bult C (1995) Testing significance of incongruence.
Cladistics 10, 315-319.
Felsenstein J (1985) Confidence limits on phylogenies: An approach using the bootstrap.
Evolution 39, 783-791.
Fernández A, Krapovickas A (1994) Cromosomas y evolucion en Arachis (Leguminosae).
Bonplandia 8, 187-220.
Galgaro L, Lopes CR, Gimenes M, Valls JFM, Kochert G (1998) Genetic variation between
several species of section Extranervosae, Caulorrhizae, Heteranthae, and Triseminatae
(genus Arachis) estimated by DNA polymorphism. Genome 41, 445-454.
Galgaro L, Valls JFM, Lopes CR (1997) Study of the genetic variability and similarity among
and within Arachis villosulicarpa, A. pietrarellii and A. hypogaea through isoenzyme
analysis. Genet Resour Crop Evol 44, 9-15.
Gimenes MA, Hoshino AA, Barbosa AV, Palmieri DA, Lopes CR (2007) Characterization and
transferability of microsatellite markers of the cultivated peanut (Arachis hypogaea). BMC Plant
Biol 7, 9.

91
Gimenes MA, Lopes CR, Galgaro L, Valls JFM, Kochert G (2002a) RFLP analysis of genetic
variation in species of section Arachis, genus Arachis (Leguminosae). Euphytica 123,
421-429.
Gimenes MA, Lopes CR, Valls JFM (2002b) Genetic relationships among Arachis species based
on AFLP. Genet. Mol. Biol. 25, 349-353.
Gregory WC, Gregory MP (1979) Exotic germ plasm of Arachis L. interspecific hybrids. J
Hered 70, 185-193.
Gregory WC, Gregory MP, Krapovicaks A, Smith BW, Yarbrough JA (1973) Structure and
Genetic Resources of Peanuts. In Peanuts - Culture and Uses (Stillwater, OK, American
Peanut Research and Education Association, Inc), pp. 47-133.
Gregory WC, Krapovicaks A, Gregory MP (1980) Structure, variation, evolution and
classification in Arachis. In Advances in Legume Sciences, R.J. Summerfield, and A.H.
Bunting, eds. (Kew, Royal Botanical Gardens), pp. 469-481.
Halward TM, Stalker HT, LaRue EA, Kochert G (1991) Genetic variation detectable with
molecular markers among unadapted germ-plasm resources of cultivated peanut and
related wild species. Genome 34, 1013-1020.
Hammer K, Arrowsmith N, Gladis T (2003) Agrobiodiversity with emphasis on plant genomics
research. Naturwissenschaften 90, 241-250.
Hilu KW, Stalker HT (1995) Genetic relationships between peanut and wild species of Arachis
sect. Arachis (Fabaceae): Evidence from RAPDs. Plant Syst Evol 198, 167-178.
Hoshino AA, Bravo JP, Angelici CM, Barbosa AVG, Lopes CR, Gimenes MA (2006)
Heterologous microsatellite primer pairs informative for the whole genus Arachis. Genet
Mol Biol 29, 665-675.
Huelsenbeck JP,Ronquist F (2001) MRBAYES: Bayesian inference of phylogenetic trees.
Bioinformatics 17, 754-755.
Johnson LA, Soltis DE (1998) Assessing ocngruence: Empirical examples from molecular data.
In Molecular Systematics of Plants II: DNA Sequencing, Soltis DE, Soltis PS, Doyle JJ,
eds. (Boston, Kluwer Academic), pp. 297-348.
Jung S, Tate PL, Horn R, Kochert G, Moore K, Abbott AG (2003) The phylogenetic relationship
of possible progenitors of the cultivated peanut. J Hered 94, 334-340.

92
Kelchner SA (2000). The evolution of non-coding chloroplast DNA and its application in plant
systematics. Ann Mo Bot Gard 87, 482-498
Kochert G, Halward T, Branch WD, Simpson CE (1991) RFLP variability in peanut (Arachis
hypogaea L) cultivars and wild species. Theor Appl Genet 81, 565-570.
Kovarik A, Matyasek R, Lim K, Skalicka K, Koukalova B, Knapp S, Chase M, Leitch A (2004)
Concerted evolution of 18-5.8-26S rDNA repeats in Nicotiana allotetraploids. Biological
Journal of the Linnean Society 82, 615-625.
Krapovickas A, Gregory WC (1994) Taxonomía del género Arachis (Leguminosae). Bonplandia
8, 1-186.
Lavia GI (1998) Karyotypes of Arachis palustris and A. praecox (Section Arachis), two species
with basic chromosome number x=9. Cytologia 63, 177-181.
Lavin M, Pennington RT, Klitgaard BB, Sprent JI, de Lima HC, Gasson PE (2001) The
dalbergioid legumes (Fabaceae): Delimitation of a pantropical monophyletic clade. Am J
Bot 88, 503-533.
Milla SR, Isleib TG, Stalker HT (2005) Taxonomic relationships among Arachis sect. Arachis
species as revealed by AFLP markers. Genome 48, 1-11.
Moretzsohn MDC, Hopkins MS, Mitchell SE, Kretovich S, Valls JFM, Ferreira E M (2004)
Genetic diversity of peanut (Arachis hypogaea L.) and its wild relateives based on the
analysis of hypervariable regions of the genome. BMC Plant Biol 4, 11.
Müller J, Müller K (2004) TreeGraph: Automated drawing of complex tree figures using an
extensible tree description format. Molecular Ecology Notes 4, 786-788.
Müller K (2005) SeqState: Primer design and sequence statistics for phylogenetic DNA data sets.
Applied Bioinformatics 4, 65-69.
Müller K (2007) PRAP2- likelihood and parsimony rachet analysis. v.09.
Müller K, Quandt D, Müller J, Neinhuis C (2005) PhyDE, version 0.92: phylogenetic data editor.
Nixon K (1999) The parsimony ratchet, a new method for rapid parsimony analysis. Cladistics
15, 407-414.
Nóbile PM, Gimenes MA, Valls JFM, Lopes CR (2004) Genetic variation within and among
species of genus Arachis, section Rhizomatosae. Genet Resour Crop Evol 51, 299-307.

93
Palmieri DA, Bechara MD, Curi RA, Gimenes MA, Lopes CR (2005) Novel polymorphic
microsatellite markers in section Caulorrhizae (Arachis, Favaceae). Molecular Ecology
Notes 5, 77-79.
Peñaloza APS, Valls JFM (1997) Contagen do número cromossômico en assos de Arachis
decora (Legumonsae). In Simpósio Latino Slericanno de Recursos Genéticos Vegetais,
R.F.A. Vega, M.L.A. Bovi, J.A. Betti, and R.B.Q. Voltan, eds. (Campanias, Brazil,
IAC/Embrapa-Cenargen). pp. 21
Peñaloza APS, Valls JFM (2005) Chormosome number and satellited chromosome morphology
of eleven species of Arachis (Leguminosae). Bonpladia 15, 65-72.
Quandt D, Müller K, Huttenen S (2003) Characterisation of the chloroplast DNA psbT-H region
and the influence of dvad symmestrical elements on phylogentic reconstructions. Plant
Biology 5, 400-410.
Quandt D, Müller K, Stech, M, Frahm J-P, Frey W, Hilu KW, Borsch, T (2004) Molecular
evolution of the chloroplast trnL-F region in land plants. Monogr Syst Bot Missouri Bot
Gard 98, 13-37.
Raina S, Mukai Y (1999) Detection of a variable number of 18S-5.8 S-26S and 5S ribosomal
DNA loci by fluorescent in situ hybridization in diploid and tetraploid Arachis species.
Genome 42, 52-59.
Seijo JG, Lavia GI, Fernandez A, Krapovickas A, Ducasse D, Moscone EA (2004) Physical
mapping of the 5S and 18S-25S rRNA genes by FISH as evidence that Arachis
duranensis and A. ipaensis are the wild diploid progenitors of A. hypogaea
(Leguminosae). Am. J. Bot. 91, 1294-1303.
Simmons MP, Ochoterena H (2000) Gaps as characters in sequence-based phylogenetic analysis.
Syst Biol 49, 369-381.
Singh AK, Simpson CE (1994) Biosystematics and genetic resources. In The Groundnut Crop: A
Scientific Basis for Improvement, J. Smartt, ed. (London, Chapman & Hall), pp. 96-137.
Smartt J, Gregory WC, Gregory MP (1978) The genomes of Arachis hypogaea L. 1. Cytogenetic
studies of putative genome donors. Euphytica 27, 665-675.
Smartt J, Stalker HT (1982) Speciation and cytogenetics in Arachis. In Peanut Science and
Technology Pattee HE, Young CT, eds. (Yoakum, TX, American Peanut Research and
Education Society ), pp. 21-49.

94
Soltis DE, Mavrodiev EV, Doyle JJ, Rauscher J, Soltis PS (2008) ITS and ETS sequence data
and phylogeny reconstruction in allopolyploids and hybrids. Systematic Botany 33, 7-20.
Stalker HT (1981) Hybrids in the genus Arachis between sections Erectoides and Arachis. Crop
Sci. 21, 359-362.
Stalker HT (1991) A new species in section Arachis of peanuts with a D genome. Am J Bot 78,
630-637.
Stalker HT, Moss JP (1987) Speciation, cytogenetics, and utilization of Arachis species. Adv
Agron 41, 1-40.
Stöver B Müller K (2010) TreeGraph2: Combining and visuallizing eviduence from different
phylogenetic analyses. BMC Bioinformatics 11, 7
Swofford DL (2003). PAUP*: Phylogenetic Analysis Using Parsimony (* and other methods),
version 4.0, β Sunderland, MA Sinauer Associates).
Taberlet P, Gilley L, Pautou G, Bouvet J (1991) Unversal primers for amplification of three non-
coding regions of the chloroplast DNA. Plant Mol Biol 17, 1105-1109.
Tallury SP, Hilu KW, Milla SR, Friend SA, Alsaghir M, Stalker HT, Quandt D (2005) Genomic
affinities in Arachis section Arachis (Fabaceae): Molecular and cytogenetic evidence.
Theor Appl Genet 111, 1229-1237.
Tun YT, Yamaguchi H (2007) Phylogenetic relationship of wild and cultivated Vigna (Subgenus
Ceratotropis, Fabaceae) from Myanmar based on sequence variations in non-coding
regions of trnT-F. Breeding Science 57, 271-280.
Valls JFM, Simpson CE (1994) Taxonomy, natrual distribution and attributes of Arachis. In
Biology and Agronomy of Forage Arachis Kerridge PC, Hardy B, eds. (Californina,
CIAT), pp. 1-18.
Valls JFM, Simpson CE (2005). New species of Arachis (Leguminosae) from Brazil, Paraguay
and Bolivia. Bonplandia 14, 35-63.
Vander Stappen J, De Laet J, Gama-López S, Van Campenhout S, Volckaert G (2002)
Phylogenetic analysis of Stylosanthes (Fabaceae) based on the internal transcribed spacer
region (ITS) of nuclear ribosomal DNA. Plant Syst Evol 234, 27-51.
Vander Stappen J, Van Campenhout S, Gama Lopez S, Volckaert G (1998) Sequencing of the
internal transcribed spacer region ITS1 as a molecular tool detecting variation in the
Stylosanthes guianensis species complex. Theor Appl Genet 96, 869-877.

95
White TJ, Bruns T, Lee S, Tyalor J (1990) Amplification and direct sequencing of fungal
ribosomal RNA genes for phylogenetics. In PCR Protocols: A Guide to Methods and
Applications, Innis MA, Gelfand DH, Sninsky JJ, White TJ, eds. (San Diego, Academic
Press), pp. 315–322.
Wojciechowski MF, Lavin M, Sanderson MJ (2004) A phylogeny of legumes (Leguminosae)
based on analysis of the plastid matK gene resolves many well-supported subclades
within the family. Am J Bot 91, 1846-1862.

96
CHAPTER 3: In search of a hypoallergenic peanut among wild
relatives

97
Abstract
The peanut (Arachis hypogaea) is an economical and nutritious food, but it also has the ability to
cause severe allergic reactions. Peanut allergies affect 1.2% of US population, whose only
treatment for this immunological disease is strict avoidance. The majority of research on peanut
allergens has focused on the crop. Only a few studies have been conducted on the putative
progenitors of the crop, A. duranensis and A. ipaensis. The peanut genus Arachis is comprised
of 80 wild species, many of which are considered valuable genetic resources for the crop.
Twelve Arachis species were examined to identify potentially hypoallergenic orthologs of the
peanut allergen Ara h 2. The major allergen Ara h 2 is a seed storage protein that is recognized
by 90% of peanut-allergic individuals. Deduced protein sequences and homology models of Ara
h 2 ortholog revealed that mutations were concentrated in a loop that connected α-helices H2 and
H3. The differences in the H2-H3 loop included polymorphisms in immunodominant epitopes #6
and 7, as well as deletions to the epitopes’ shared DPYSPS hexamer motif. B-cell epitope
prediction programs ElliPro and DiscoTope were utilized to detect potential IgE-binding regions
among the epitopes. Dot immunoblots of peptides representing H2-H3 demonstrated that
variations among orthologs did have reduced antibody binding. The natural variations in Ara h 2
orthologs from the wild species demonstrate that wild Arachis species could be genetic resources
in the development of a safer peanut crop.
Keywords: Arachis, Peanut allergy, Ara h 2 orthologs, homology modeling, wild species

98
Introduction
Peanuts (Arachis hypogaea) are an economical source of protein, vitamins and minerals.
The peanut itself and its products are widely used throughout the food industry. In 2009, the US
production of shelled peanuts was approximately 2.45 billion pounds (USDA-NASS, 2009).
Despite their economic importance and nutritional value, allergies to peanuts have become a
growing concern because of their wide use in the food industry and the severe reactions that it
can elicit immunological reaction (Burks, 2003).
Food allergies are severe immune responses mediated by IgE to specific foods, usually
proteins, and affect roughly 4% of the US population, or 12 million people (Sicherer and
Sampson, 2006). The number of reported cases of children with food allergies increased 18%
from 1997 to 2007 (Branum and Lukacs, 2008). A majority of food allergies (90%) are caused
by proteins in a handful of foods, including cow’s milk, shellfish, peanuts, tree nuts, hen’s eggs,
fish, wheat, and soybeans (Lehrere et al., 2002). Allergies to these food products have the
potential to cause serious reactions, including anaphylaxis. The only treatment for food allergies
is avoidance. Some children who have allergies to milk, eggs, soybean, and wheat can outgrow
their allergies by the time they are old enough to go to elementary school (Wood, 2003).
However, allergies to shellfish, tree nuts, fish, and peanuts are rarely, if ever, outgrown. In the
US, allergies to peanut affect 1.2% of the population and the number of children with peanut
allergies is growing (Sicherer et al., 2003).
To date, ten peanut allergens have been identified (Asero et al., 2002; Burks et al., 1992;
Burks et al., 1991; Kleber-Janke et al., 1999; Mittag et al., 2004; Pons et al., 2002; Rabjohn et
al., 1999). The majority of the peanut allergens are seed storage proteins, belonging to the two
protein superfamilies to which most plant food allergens are classified (Breiteneder and Radauer,

99
2004), specifically, the cupin superfamily (vicilin - Ara h 1 and legumin - Ara h 3/4) and the
prolamin superfamily (2S albumins - Ara h 2, Ara h 6, and Ara h 7).
The major allergen Ara h 2 is recognized by over 90% of patients who are peanut-
sensitive (Koppelman et al., 2004). It comprises 6-9% of the total protein content in the seed
(Koppelman et al., 2001). This allergen is present in two isoforms (Ara h 2.01 and Ara h 2.02),
with an average mass of 17 kDa (Chatel et al., 2003). There are 10 IgE binding epitopes
(Stanley et al., 1997), three of which are considered to be immunodominant. Ara h 2 has been
predicted to be composed of two bundles of helices connected by a loop, which contains two of
the three immunodominant epitopes (Barre et al., 2005; Lehmann et al., 2006). The tertiary
structure is similar to 2S albumin proteins Ric c 3 (castor bean) and Ara h 6 (peanuts), both of
which have been determined using NMR (Lehmann et al., 2006; Pantoja-Uceda et al., 2003).
Like other 2S albumins, it was predicted that Ara h 2 is comprised of five α-helices
(Barre et al., 2005; Lehmann et al., 2006). Ara h 2 also has eight cysteine residues that are
common to other proteins in the prolamin superfamily (Lehmann et al., 2006; Shewry et al.,
2002): C-Xn-C-X-n-CC-Xn-CXC-X-C-Xn-C. The α-helical structure and multiple disulfide
bonds allow the allergen to maintain stability in high temperatures and resist digestion by
proteases, allowing it to reach the gut immune system relatively intact (Moreno and Clemente,
2008). Another common feature of most 2S albumin proteins is the presence of a “hypervariable
region” between helices 3 and 4 that contains the majority of the epitopes. Two of the three
immunodominant IgE binding sites for Ara h 2, however, are located on the loop region
connecting helices 2 and 3 (Lehmann et al., 2006).
The loop portions of proteins are important to protein function because they are exposed
to the surface and can determine the functional specificity of a protein (Fiser et al., 2000). The

100
majority of variations, such as substitutions, insertions, and deletions, between members of a
protein family are generally within loop regions. More information about these loops in
allergens and how changes can affect them, in particular their ability to bind to IgE antibodies,
could be useful for food allergy diagnosis and treatment (Moreno and Clemente, 2008).
Beyond the peanut crop species A. hypogaea, the allergen Ara h 2 has been examined
only in the progenitors of this tetraploid species A. duranensis and A. ipaensis (Ramos et al.,
2006; Ramos et al., 2008). The peanut genus contains 80 wild and cultivated species
(Krapovickas and Gregory, 1994; Valls and Simpson, 2005). These species have been grouped
into nine sections, and the largest section Arachis, containing the crop and its progenitors
species, has been divided into three genome groups: A, B, and D (Smartt et al., 1978; Stalker,
1991). The wild species of genus Arachis are considered to be important genetic resources for
improving the crop (Rao et al., 2003).
In this paper, we examine the nucleotide, amino acid and structural differences of the Ara
h 2 ortholog from wild species of Arachis. We show that the allergen orthologs from the various
wild species Arachis contain significant changes in the loops that possess the epitopes with the
DPYSPS motif. Also, species from sections Caulorrhizae, Extranervosae, and Triseminatae
contain orthologs with mutations that could render them hypoallergenic. This is the first time
that this serious allergen has been explored outside of the peanut crop and its progenitors.
Materials and Methods
Amplification of Ara h 2 orthologs
Genomic DNA was isolated from fresh leaf material of Arachis species (Table 3.1)
following Milla et al. (2005). The allergen gene for Ara h 2 was amplified by PCR using primers
designed in our lab based on a sequence from A. hypogaea (GenBank accession AY007229).
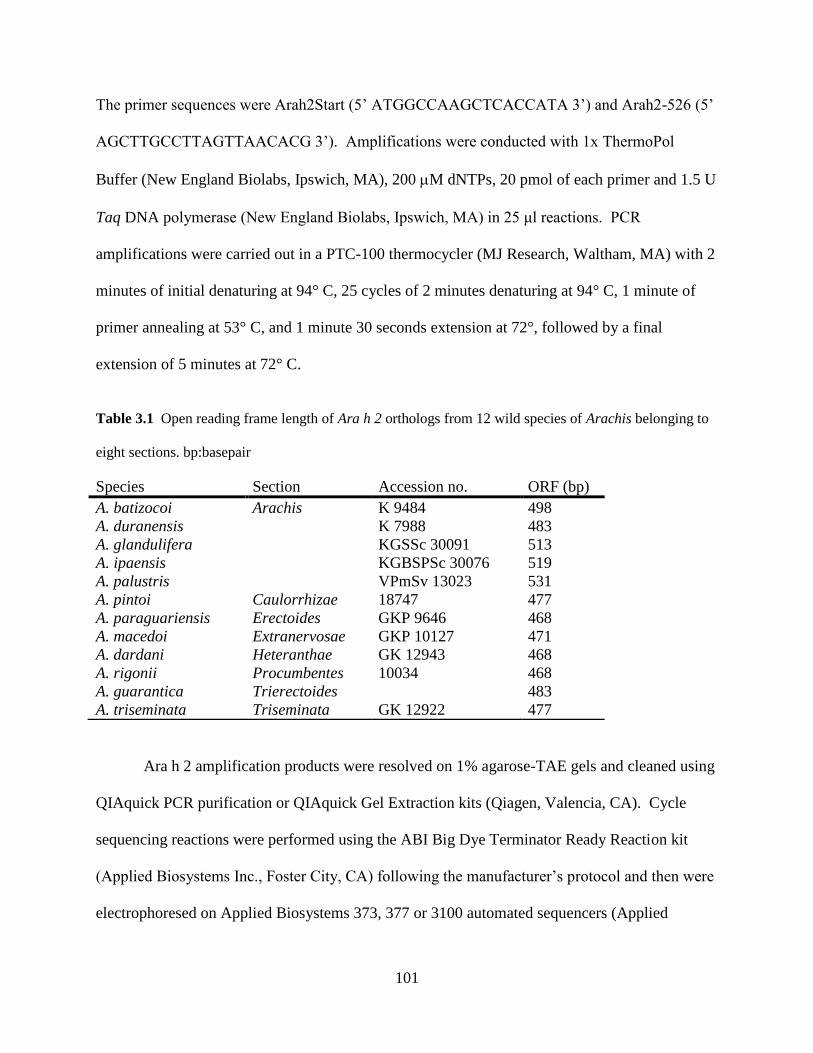
101
The primer sequences were Arah2Start 5’ ATGGCCAAGCTCACCATA 3’) and Arah2-526 5’
AGCTTGCCTTAGTTAACACG 3’). Amplifications were conducted with x ThermoPol
Buffer (New England Biolabs, Ipswich, MA), 200 M dNTPs, 20 pmol of each primer and 1.5 U
Taq DNA polymerase New England Biolabs, Ipswich, MA) in 25 μl reactions. PCR
amplifications were carried out in a PTC-100 thermocycler (MJ Research, Waltham, MA) with 2
minutes of initial denaturing at 94° C, 25 cycles of 2 minutes denaturing at 94° C, 1 minute of
primer annealing at 53° C, and 1 minute 30 seconds extension at 72°, followed by a final
extension of 5 minutes at 72° C.
Table 3.1 Open reading frame length of Ara h 2 orthologs from 12 wild species of Arachis belonging to
eight sections. bp:basepair
Species Section Accession no. ORF (bp)
A. batizocoi Arachis K 9484 498
A. duranensis K 7988 483
A. glandulifera KGSSc 30091 513
A. ipaensis KGBSPSc 30076 519
A. palustris VPmSv 13023 531
A. pintoi Caulorrhizae 18747 477
A. paraguariensis Erectoides GKP 9646 468
A. macedoi Extranervosae GKP 10127 471
A. dardani Heteranthae GK 12943 468
A. rigonii Procumbentes 10034 468
A. guarantica Trierectoides 483
A. triseminata Triseminata GK 12922 477
Ara h 2 amplification products were resolved on 1% agarose-TAE gels and cleaned using
QIAquick PCR purification or QIAquick Gel Extraction kits (Qiagen, Valencia, CA). Cycle
sequencing reactions were performed using the ABI Big Dye Terminator Ready Reaction kit
Applied Biosystems Inc., Foster City, CA) following the manufacturer’s protocol and then were
electrophoresed on Applied Biosystems 373, 377 or 3100 automated sequencers (Applied

102
Biosystems Inc., Foster City, CA) at Virginia Bioinformatics Institute at Virginia Tech or at the
DNA Analysis Facility at Duke University.
Sequence alignment and phylogenetic analysis
Amino acid sequences were translated directly from nucleotide sequences in PhyDE
0.995 (Müller et al., 2005). Both nucleotide and amino acid sequences were aligned manually
using PhyDE 0.995. Phylogenetic analyses of Ara h 2 orthologs for the nucleotide and amino
acid datasets were analyzed using maximum parsimony in PAUP*(Swofford, 2003),
incorporating the parsimony ratchet algorithm (Nixon, 1999) via PRAP2 (Müller, 2007).
Maximum Parsimony (MP) analyses were conducted using heuristic tree searches with TBR
branch swapping with 1000 random addition sequence replicates. Strict consensus trees were
generated for each data set. Supports for the clades were obtained by performing bootstrap (BS)
(Felsenstein, 1985) searches with 1000 replicates and 10 random sequence replicates.
In silico protein structure characterization: secondary structure prediction and
solvent accessibility
The Jpred 3 and PredictProtein servers were used for secondary structure prediction (Cole
et al., 2008; Rost et al., 2004). Homologous sequence searches performed using the Jpred 3
server utilized BLAST and PSI-BLAST, and predictions of secondary structures were performed
by Jnet (Cole et al., 2008). PredictProtein identified and aligned homologous results using the
algorithms of BLAST, PSI-BLAST and MaxHom (Sander and Schneider, 1991). The MaxHom
algorithm examines the database of homology-derived secondary structures of proteins (HSSP);
(Schneider et al., 1997). The Jpred 3 server predicts secondary structure elements with 81.5%

103
accuracy (Cole et al., 2008). Two additional secondary structure predictors are available on the
PredictProtein server, PROFsec and PHDsec. PROFsec has a 76% accuracy rate, while PHDsec
has a 71% accuracy rate (Rost et al., 2004). Since PROFsec prediction software is more accurate
in secondary structure, this study focused on prediction from this software in addition to those
produced by Jpred 3.
PROFsec also predicted percent of residues that are accessible to the solvent (Rost et al.,
2004). Residue accessibility to the solvent is one property that influences the propensity for a
protein to be recognized as an allergenic protein (Kulkarni-Kale et al., 2005; Pomés, 2010).
Homology models of Ara h 2 orthologs
Homology models of Ara h 2 orthologs were generated in MODELLER (Sali and
Blundell, 1993) using the allergen Ara h 6 structure (PDBID: 1q2wA) as a template. In
MODELLER, five models were generated. The best model was chosen based on the lowest
Modeller Objective Function score. Since the loop region of Ara h 2 orthologs is larger than that
of the Ara h 6 protein, these loop regions were refined using the Modloop server (Fiser et al.,
2000), which predicts the conformation of the loop regions independent of known structures,
satisfies spatial restraints, and the conformation for the loop region is optimized to possess the
lowest pseudo-energy score. The majority of loop conformation predictions have been
performed on loops with lengths of 14 residues or less. However, predictions of medium-sized
loops by ModLoop were as good as combinatorial methods (Jamroz and Kolinski, 2010).
Assessments of models after loop refinement were conducted using ANOLEA (Melo and
Feytmans, 1997), and Procheck (Morris et al., 1992) on the SWISSMODEL server (Arnold et al.,
2005) and ProSA (Wiederstein and Sippl, 2007).

104
Epitope prediction
B-cell prediction programs have allowed for identification of areas that could potentially
contain Immunoglobulin E (IgE)-binding epitopes (Pomés, 2010). The majority of the epitope
prediction methods look for linear epitopes, which can be identified from the protein sequence.
Discontinuous or conformational epitopes are those that are present in the tertiary structure of the
protein by residues that are spatially close to each other. Barlow et al. (1986) and Van
Regenmortel (1992) have estimated that >90% of B-cell epitopes are conformational epitopes.
In absence of an X-ray or NMR crystal structure for allergens, computational methods have been
developed to predict potential B-cell epitopes.
Two programs, DiscoTope and ElliPro, were used in this study to predict linear and
conformational epitopes (Andersen et al., 2006; Ponomarenko et al., 2008). DiscoTope
predictions combine computational methods proposed by Nishikawa and Ooi (1980) to measure
the amino acids located at the protein surface. Additionally, the NACCESS program (Prescott et
al., 2003) has been incorporated with DiscoTope to determine the residues that are accessible to
the solvent. ElliPro predicts epitopes through the use of three algorithms. First, it determines the
approximate ellipsoid shape of the protein (Taylor et al., 1983), second identifies residues that
protrude beyond the protein ellipsoid and the protrusion index (PI), and, lastly, it clusters
neighboring protruding residues based on the PI. The ElliPro method was modified from
Thornton et al. (1986), which focused on identifying linear epitopes based on the PI for residues
that were beyond the approximate ellipsoid shape. The score reported are the averaged PI values
for the residues identified (Taylor et al., 1983).

105
Human sera
Seven peanut-allergic subjects (18-34 years old) and four non-allergic subjects (19-26)
were recruited for this study. Each subject donated 10 ml of whole blood, from which sera were
isolated by centrifugation at 3000 rpm for 10 min. Sera samples were stored at -80° C until use.
This study was approved by the Institutional Review Board at Virginia Tech (IRB# 08-377) and
informed written consent was obtained from each subject.
Dot immunoblots of epitope orthologs from wild Arachis conglutin proteins
Ten IgE-binding epitopes were identified on the Ara h 2 by Stanley et al. (1997); two of
which contain a DYPSPS motif. From the derived amino acid sequences, 15-18 oligomer
peptides were generated by GenScript (Piscataway, NJ) to represent the portions of the orthologs
with this motif or variations of it (Table 3.2). Hydrated peptides were spotted directly onto
Protan nitrocellulose membrane in a dilution series ranging from eight nanograms to one
microgram, and allowed to dry. Dot immunoblots were incubated in 5% non-fat milk in Tris-
buffered saline with 0.5% Tween-20 (TBS-T; pH 7.5) for one hour at room temperature with
shaking. Nitrocellulose containing blots were incubated overnight at 4°C in either 1:6000
diluted chicken α-Ara h 2 antibody or in 1:20 diluted sera from peanut allergic (PA) individuals.
Dotblots were washed three times with TBS-T for 10 min after antibody incubation. The dot
immunoblots probed with chicken α-Ara h 2 antibody were subsequently incubated with rabbit
anti-chicken IgG horseradish peroxidase (HRP)-conjugated antibodies (1:2500; Bethyl
Laboratories Inc., Montgomery, TX) for one hour at room temperature. The immunoblots
incubated with human sera were incubated with rabbit anti-human IgE HRP-conjugated
antibodies (1:1000; Bethyl Laboratories Inc.). ECL Plus detection reagents were used for the

106
HRP-conjugated secondary antibodies for chemiluminescent detection with a Fuji LAS-300
camera. Differences in signal were determined by densitometry using the FUJIFILM Multi
Gauge ver3.X.
Table 3.2 Peptide sequences in cultivated peanut and species and five wild species representing portion
of the loop containing the immunodominant epitope motif DPYSPS and variations of that motif.
Species Length (AA) Sequence
A. hypogaea 15 RDPYSPSQDPYSPSP
A. batizocoi 15 RDPYSPSQDPYKQDP
A. glandulifera 15 DPDRQDPYSPSQDPD
A. guarantica 16 EQDPYRQDPYGPSPYG
A. rigonii 15 EQDPYGPSPYGPSPY
A. triseminata 15 QSPYSQDPYRQEPYE
Results
Nucleic acid and peptide sequences of orthologs from Ara h 2
The Ara h 2 orthologs across the genus Arachis were 471 - 531 bp in length. Species
from section Arachis tended to have larger coding regions for Ara h 2 orthologs, ranging from
483 – 531 bp (Table 3.1), with the largest from the aneuploid species A. palustris (531 bp) and
the shortest from the A genome species A. duranensis. Outside section Arachis, the nucleotide
sequence length ranges from 468-477 bp in orthologs from A. dardani (sec. Heteranthae), A.
paraguariensis (sec. Erectoides), and A. rigonii (sec. Procumbentes).
A total of ten gaps, ranging from 3-30 bp in length, were included in the matrix and
resulted in an alignment that was 558 characters in length. When aligned, the mutations present
in the first 177 and 319-558 characters nucleotides were substitutions. Both length mutations

107
and substitutions were present in positions 178-316. This variable region ranged from 47-100
nucleotides in the Arachis orthologs. In the Ara h 2 orthologs, 40-100% of the mutations present
were located in the variable region.
Peptide sequences of the Ara h 2 orthologs were deduced directly from the genomic
sequences and ranged from 155-176 residues (Table 3.2). Substitutions in nucleic acid sequence
of Ara h 2 orthologs that were outside of the variable region resulted in no more than two
missense amino acid changes in the peptide sequence. The length mutations observed in the
nucleotide sequences did not result in any premature truncation of the proteins (Figure 3.1).
Ortholog sequences from section Arachis species had 90-94% sequence identity to the
published conglutin sequences from the crop and its proposed progenitors (A. duranensis and A.
ipaensis). Species outside of section Arachis had 81-91% sequence identity. When compared to
the other peanut allergens from the prolamin superfamily, Ara h 6 and Ara h 7, sequence identity
ranged from 49-60% and 46-50%, respectively (Table 3.2).
Phylogenetic relationships among Ara h 2 orthologs
We previously examined phylogenetic relationships among species and sections within
genus Arachis using plastid and nuclear genomic sequences (Chapter 2), to which the
phylogenies produced based on aligned Ara h 2 sequences will be compared. Nucleotide
sequences of orthologous Ara h 2 ORF from cultivated and wild Arachis species were aligned
into a matrix that included a total of 558 characters. Three most parsimonious trees of 109 steps
resulted from the MP analysis. Strict consensus tree that is comparable to the phylogenies based
on ITS and trnT-trnF data (Figure 3.2A). Ara h 2 orthologs from A. macedoi and A. triseminata
(100% BS) emerged at the base in one lineage with 100% BS support and were sister to the

108
remaining taxa. Following the two basal species, A. rigonii, A. guarantica, A. paraguariensis,
and A. dardani were resolved. This group received strong BS support (92%) and is comparable
to the group erectoides lineage resolved in the phylogenies based on sequence data from nuclear
and plastid regions presented in Chapter 2. Unlike the phylogenies produced with ITS and trnT-
trnF data, the ortholog from A. pintoi was the next to diverge and resolved sister to those from
section Arachis. However, the sister relationship between A. pintoi and section Arachis
orthologs was weakly supported (53% BS). The orthologs from section Arachis resolved
together with good support (89% BS). Despite the high sequence identity between Ara h 2
ortholog from A. duranensis and Ara h 2.01 (Ramos et al., 2006), the sister relationship between
these two species received moderate 65% BS support (Figure 3.2A). The sister relationship
between A. ipaensis and Ara h 2.02 received good support (80% BS).
Orthologs from Ara h 2 peptide sequences resulted in an alignment that included a total
of 185 characters. MP analysis resulted in 51 trees with lengths of 45 steps. The strict consensus
tree displayed a major polytomy (Figure 3.2B). Ara h 2 orthologs from group erectoides species,
A. dardani, A.guarantica, A. paraguariensis, and A. rigonii appeared together in a polytomy with
moderate (79%) BS support. Orthologs from A. macedoi and A. triseminata were also resolved
together in one clade, but with low (60%) BS support.

109
Table 3.3 Characterization of Ara h 2 orthologs from wild species based on in silico methods. α-helical regions and disulfide bonds were
identified in tertiary structures produced by the homology modeling program MODELLER. Percent of residues forming α-helical elements and
accessible to solvent were predicted using the PROFsec program.
Species
Peptide % Sequence
Identity Helical regions Disulfide bonds
%
residues
forming α-
helices
%
residues
accessible
to solvent
Ara h
6
Ara
h 7
A. batizocoi 165 54 45 H1:34-39, H2:44-53, H3:91-102,
H4a:110-119, H4b:123-126, H5:130-
145
[33,109], [45, 96],
[97,145], [111,153]
53.99 72.12
A. duranensis 160 59 50 H1:34-39, H2:43-52, H3:85-97,
H4a:105-114, H4b:118-121, H5:126-
140
[33, 104], [45, 91],
[92, 140], [106, 148]
51.92 71.15
A. glandulifera 170 52 43 H1:34-39, H2:44-53, H3:92-107,
H4a:115-124, H4b:128-129, H5:136-
150
[33, 114], [45, 101],
[102, 150], [116,
158]
55.29 71.18
A. ipaensis 172 51 44 H1:34-38, H2:43-53, H3:97-109, H4a:
117-126, H4b:130-134, H5:138-152
[33, 116], [45, 103],
[104, 152],
[118,160]
51.92 71.15
A. palustris 176 49 43 H1:34-40, H2:44-53, H3:100-113,
H4a:121-130, H4b:134-138, H5:142-
156
[33,120], [45, 107],
[108-120],[122, 164]
56.82 73.30
A. pintoi 158 57 50 H1:34-40, H2:44-53, H3:83-95,
H4a:103-112, H4b:116-120, H5:124-
138
[33, 102], [45, 89],
[90, 138], [104, 146]
56.33 71.52
A.
paraguariensis
155 57 49 H1:34-40, H2:44-52, H3:81-92,
H4a:100-109, H4b:113-116, H5:120-
135
[33, 99], [45, 86],
[87, 135], [101, 143]
58.06 71.61
A. macedoi 156 60 48 H1:34-40, H2:44-54, H3:82-93,
H4a:100-110, H4b:114-117, H5:122-
[33, 100], [45, 87],
[88, 136], [102, 144]
56.41 71.15
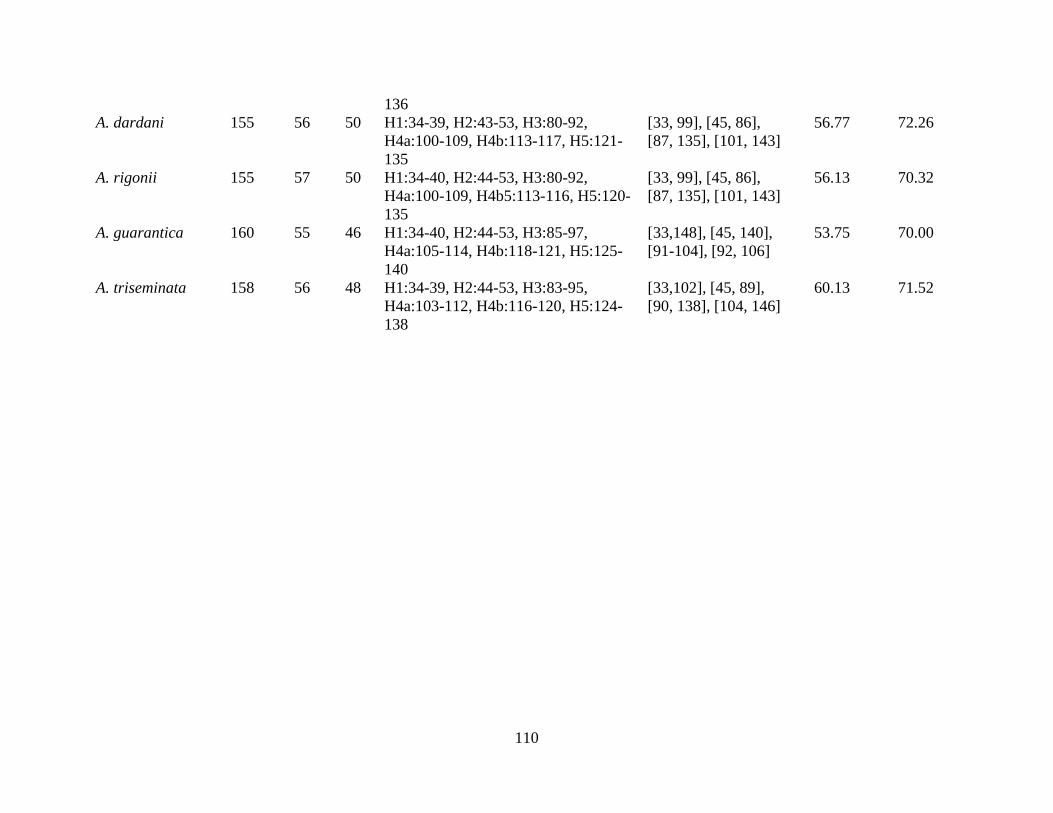
110
136
A. dardani 155 56 50 H1:34-39, H2:43-53, H3:80-92,
H4a:100-109, H4b:113-117, H5:121-
135
[33, 99], [45, 86],
[87, 135], [101, 143]
56.77 72.26
A. rigonii 155 57 50 H1:34-40, H2:44-53, H3:80-92,
H4a:100-109, H4b5:113-116, H5:120-
135
[33, 99], [45, 86],
[87, 135], [101, 143]
56.13 70.32
A. guarantica 160 55 46 H1:34-40, H2:44-53, H3:85-97,
H4a:105-114, H4b:118-121, H5:125-
140
[33,148], [45, 140],
[91-104], [92, 106]
53.75 70.00
A. triseminata 158 56 48 H1:34-39, H2:44-53, H3:83-95,
H4a:103-112, H4b:116-120, H5:124-
138
[33,102], [45, 89],
[90, 138], [104, 146]
60.13 71.52

111

112
Figure 3.1 Amino acid sequences of Ara h 2 orthologs from twelve wild Arachis species aligned with the two isoforms from the peanut crop (Ara
h 2.01 and Ara h 2.02). Helical elements predicted by JPRED3 are highlighted in red. Jpred 3 predicts five helices. The secondary structural
elements of conglutin protein were not affected by the length mutations within the protein. Helices identified in homology models of orthologs are
also identified as H1-H5.
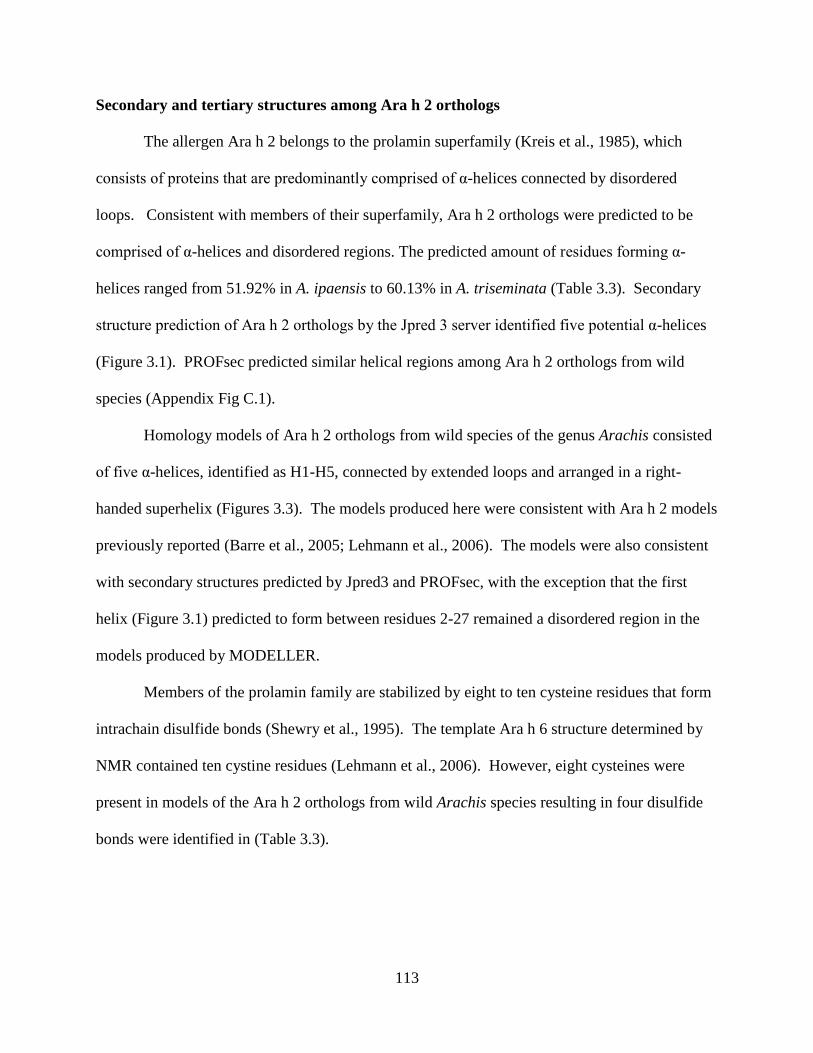
113
Secondary and tertiary structures among Ara h 2 orthologs
The allergen Ara h 2 belongs to the prolamin superfamily (Kreis et al., 1985), which
consists of proteins that are predominantly comprised of α-helices connected by disordered
loops. Consistent with members of their superfamily, Ara h 2 orthologs were predicted to be
comprised of α-helices and disordered regions. The predicted amount of residues forming α-
helices ranged from 51.92% in A. ipaensis to 60.13% in A. triseminata (Table 3.3). Secondary
structure prediction of Ara h 2 orthologs by the Jpred 3 server identified five potential α-helices
(Figure 3.1). PROFsec predicted similar helical regions among Ara h 2 orthologs from wild
species (Appendix Fig C.1).
Homology models of Ara h 2 orthologs from wild species of the genus Arachis consisted
of five α-helices, identified as H1-H5, connected by extended loops and arranged in a right-
handed superhelix (Figures 3.3). The models produced here were consistent with Ara h 2 models
previously reported (Barre et al., 2005; Lehmann et al., 2006). The models were also consistent
with secondary structures predicted by Jpred3 and PROFsec, with the exception that the first
helix (Figure 3.1) predicted to form between residues 2-27 remained a disordered region in the
models produced by MODELLER.
Members of the prolamin family are stabilized by eight to ten cysteine residues that form
intrachain disulfide bonds (Shewry et al., 1995). The template Ara h 6 structure determined by
NMR contained ten cystine residues (Lehmann et al., 2006). However, eight cysteines were
present in models of the Ara h 2 orthologs from wild Arachis species resulting in four disulfide
bonds were identified in (Table 3.3).

114
Figure 3.2 Strict consensus trees based on (A) nucleotide and (B) peptide sequences analyzed using MP. A. For the aligned Ara h 2nucleotide
sequences, 81 of the total 558 characters were variable (14.5%), of which 41 were parsimony informative (50.6%). Three most parsimonious trees
of 109 steps resulted from the MP analysis with the CI and RI values of 0.798 and 0.796, respectively. B. The peptide sequences consisted of 185
characters when aligned, of which 31 were variable (16.8%) and 15 were parsimony informative (48.4%). MP analyses resulted in 51 most
parsimonious trees with lengths of 45 steps. The CI and RI were 0.800 and 0.763, respectively.

115
The majority of variations observed in the alignment corresponded to a loop spanning
helices H2 and H3, mostly as length variations. In the template structure, Ara h 6, the loop
between H2 and H3 was 17 residues in length (Lehmann et al., 2006). Though the H2-H3 loops
in Ara h 2 ortholog structures were 1.59-2.76 times the size of the one found in Ara h 6. The
shorter loops among the orthologs were predicted in group erectoides species A. dardani, A.
rigonii, and A. paraguariensis, spanning 27-29 residues. Longer loops were predicted in A.
batizocoi, A. glandulifera, A. ipaensis and A. palustris, with lengths spanning 38-47 residues.
The conformation of the loops varied among the orthologs. The H2-H3 loop in the allergen Ara
h 2.01, which is also identical to the A. duranensis ortholog, was extended (Figure 3.3, 3.4). The
loops from the remaining orthologs appeared to be folded in towards the helices of the protein
(Figure 3.4). The folded H2-H3 loop was more prevalent in A. batizocoi, A. glandulifera, A.
ipaensis, and A. palustris.
Variations in amino acid composition of the H2-H3 loop were also present in Ara h 2
orthologs from wild Arachis species. Comparison of models to NMR and X-ray determined
structures of 2S albumins in PDB showed that loops between helices H2-H3 were unique to
these orthologs. Also, this loop possesses the immunodominant Ara h 2 epitopes 6 and 7. These
two epitopes possess a hexapeptide DPYSPS motif (Stanley et al., 1997). Ara h 2 orthologs
from section Arachis species tended to maintain the DPYSPS motif. An S-to-T variation at
position 78 was present in the ortholog from A. batizocoi (Figure 3.4). The Ara h 2 ortholog
from D genome species A. glandulifera lacked epitope 6; however, it contained an additional
copy of epitope 7. The aneuploid species contained an R to E variation in a modified epitope
very similar to epitope 6 and is identified here as epitope “6.” Arachis pintoi, which resolved

116
sister to section Arachis species, contained an H2-H3 loop that possessed the epitope 7 and a part
of the hexapeptide motif (PYGPS) that included an S to G variation at position 71.
Like A. pintoi, the same variations for the epitopes were also identified in A. rigonii. Wild
species A. dardani and A. paraguariensis both possessed a variation of epitope 7 that contained
an S-to-G variation at position 66, which is named here as epitope “7.” Arachis guarantica
ortholog loop included an epitope “7” and also two partial hexapeptide motifs QDPY and
PYGPS). The two orthologs from A. macedoi and A. triseminata, which grouped together at the
base MP nucleotide-based tree, contained only the QDPY partial motif in the H2-H3 loop.
Arachis macedoi possessed two QDPY portions of the hexapeptide motif. Assessments of Ara h
2 ortholog models were conducted on the SWISS-MODEL (Arnold et al., 2005) and ProSA
servers (Wiederstein and Sippl, 2007). Ramachandran plots generated by PROCHECK showed
that phi-psi angle combinations for residues of Ara h 2 orthologs were >90% favorable to
generously allowed (Supplemental Table B.1). Energy profiles generated by ANOELA tended
to identify residues located within the N terminus, H2, H4, and the C-terminus as high energy
zones (Supplemental Figures A.1-12). Some residues within the H2-H3 loop also were
identified as high energy zones. ProSA overall model quality z-scores for the Ara h 2 were
similar to those obtained by NMR-determined structures, and its local model quality tended to
have negative knowledge-based energy with the exception of the unstructured N- and C-terminal
regions (Supplemental Table A. 2 and Figures A.13-24). Predictions in the C-terminus the
majority of the Ara h 2 orthologs tended to receive the lowest scores, ranging from 0.516-0.675.
The orthologs from A. hypogaea and A. batizocoi were not predicted to contain an epitope in the
C-terminus.
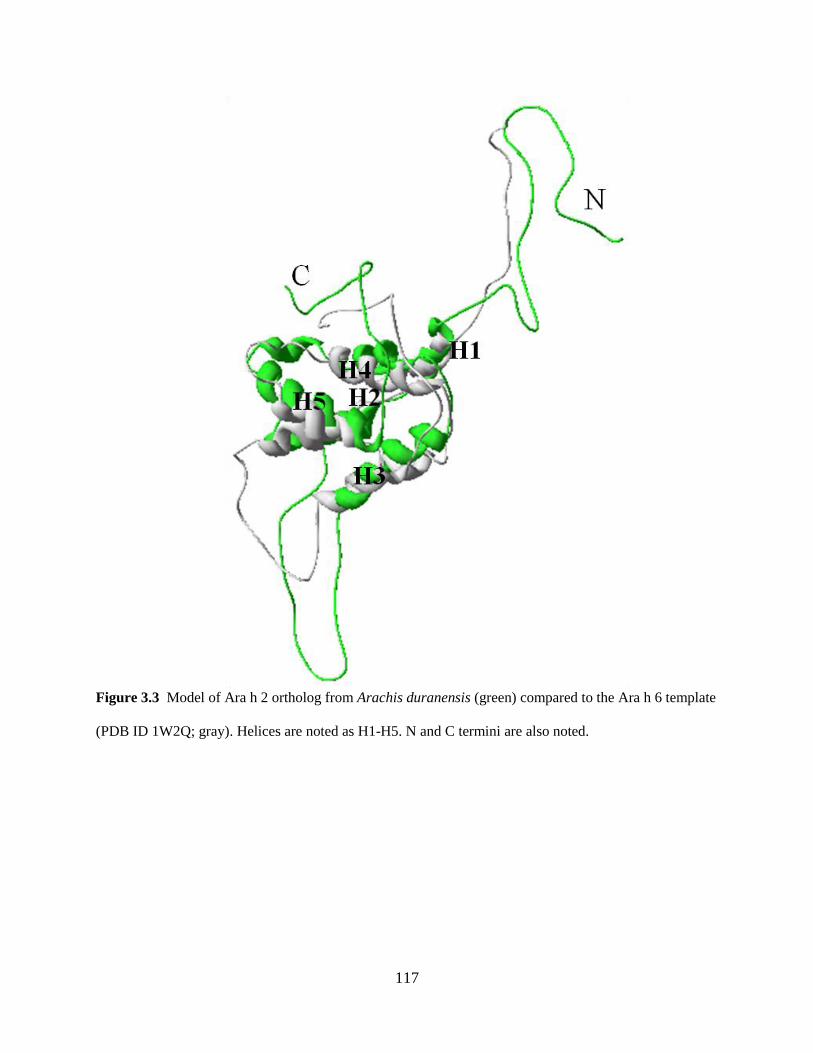
117
Figure 3.3 Model of Ara h 2 ortholog from Arachis duranensis (green) compared to the Ara h 6 template
(PDB ID 1W2Q; gray). Helices are noted as H1-H5. N and C termini are also noted.

118
Antibody binding to peptides representing part of loop region within Ara h 2
orthologs
Peptides representing portions of the H2-H3 loop that contained variations at the
nucleotide and amino acid levels were generated and antibody binding to these regions was
assessed using dot immunoblots that were probed with sera from self-reported peanut-allergic
individuals. The dot immunoblot probed with sera from PA-5 is shown (Figure 3.6A).
Immunoblots probed with other sera showed similar results (not shown). Differences in antibody
binding to the peptides representing loop portions from wild Arachis species orthologs were
noticeable, and decreasing recognition corresponded with the lower amounts of peptides and
protein applied. Variation in signal was most noticeable in the 40 ng row, which was analyzed
semi-quantitatively using densitometry. When the background was subtracted from the
densitometry reading, three categories of antibody recognition, high, moderate, and low, were
apparent when comparing signal intensities to the peptide representing the loop from A.
hypogaea. Peptides with binding of 50% or less compared to the peptide representing the H2-H3
loop A. hypogaea were considered to possess low antibody binding affinity (Figure 3.6B).
Peptides with binding affinity of 50-75% were considered to have intermediate and 75% and
above had high binding affinity.

119
Species Orthologs Structure Potential Epitopes
A. duranensis/ Ara h 2.01 (Arachis)
A. batizocoi (Arachis)
A. glandulifera (Arachis)

120
A. ipaensis (Arachis)
A. palustris (Arachis)
A. macedoi (Extranervosae)

121
A. dardani (Heteranthae)
A. rigonii (Procumbentes)
A. guarantica (Trierectoides)
A. triseminata
(Triseminatae)

122
Figure 3.4 Homology models of Ara h 2 orthologs from section Arachis species generated by Modeller
9v6. The NMR structure of the peanut conglutin protein Ara h 6 (PDB 1w2q; (Pantoja-Uceda et al., 2003)
served as a template from which the models were generated. Epitopes 6 and 7 initially identified in the
Ara h 2 allergen from the crop are noted on the models and their conformations are also noted. Amino
acid substitutions present in the epitopes among the orthologs are highlighted in yellow.
Figure 3.5 Predicted epitopes for Ara h 2 ortholog from A. batizocoi. A. Residues predicted to be
potential IgE binding sites by the program DiscoTope on the surface of the allergen ortholog are shaded
in yellow. B. Residues predicted to potential conformational epitopes by the program ElliPro are shaded
in orange. C. Residues that were predicted as potential epitopes by both programs are shaded in red. Both
programs predict the N-terminus and H2-H3 loop to be sites of potential antibody binding.

123
As expected, crude protein extract (CPE) from A. hypogaea, isolated Ara h 2, and the
peptide representing the part of the loop from the A. hypogaea ortholog were highly recognized
and signal was highest (Figure 3.6B). The peptides from A. batizocoi and A. rigonii orthologs
were also highly recognized when compared to the one from A. hypogaea. The peptide
representing the part of the loop ortholog from A. glandulifera was moderately recognized when
compared to the one representing the crop. The lowest signals were produced by peptides
representing portion of the loop from A. guarantica and A. triseminata. The signal from the A.
guarantica peptide was 50.9% less than the one representing A. hypogaea. The peptide from A.
triseminata had the lowest signal overall, 69.6% less when compared to the one from the crop.

124
Figure 3.6 A. Dot Immunoblot of Ara h 2 ortholog peptides. Sera from peanut-allergic individual PA-5 was used to test the peptides representing
portions of the loop region belong to orthologs from five wild species. Peptides were applied to the nitrocellulose membrane, with amounts
decreasing by five-fold, then probed with sera. Densitometry measurements showed overall reduction in antibody binding to 40 ng of peptides
from wild species, with signal from background subtracted. Greatest reduction in antibody binding was observed in peptides representing the
orthologs from A. guarantica (50.6%) and A. triseminata (69.6%).

125
Discussion
Until now, the allergen Ara h 2 had been studied within the crop species and its putative
progenitors (Ramos et al., 2006; Ramos et al., 2008; Stanley et al., 1997). Here we expanded the
number of species used to include more species from Arachis genomes and additional other
sections in the search for hypoallergenic proteins among members of genus Arachis.
Generally, Ara h 2 orthologs that were from species classified within section Arachis
tended to be larger in length (Figure 3.3). When plotted on the phylogenetic tree from chapter
one, the open reading frames and their subsequent products shows in size moving up the
evolutionary tree. The Ara h 2 ortholog gene tree was very similar to the Arachis phylogenies
based ITS and combined ITS and trnT-trnF datasets (Figure 3.2). The notable deviation from
the phylogeny is the placement of A. pintoi from sec. Caulorrhizae, which appeared in between
the section Arachis orthologs and those from section Erectoides.
The structure of 2S albumins consists of five α-helices, which form two subunits,
connected by disordered loops (Shewry et al., 2002; Shewry et al., 1995). The α-helices H1 and
H2 appear to correspond to the light chain while H3 to H5 correspond to the heavy chain. The
overall structure Ara h 2 from the crop was consistent with previous models (Barre et al., 2005;
Lehmann et al., 2006). Homology models of the Ara h 2 orthologs from wild species were
similar in structure to each other and to the model from the crop (Figure 3.4). The main
difference between the homology modeling and the secondary structure predictions from Jpred 3
and PROFsec was the lack of structure at the N terminus. However, this lack in structure was
due to the lack of structured regions along the N terminus in the template structure, Ara h 6
(PDB ID: 1W2Q). Additionally, the template also lacked a corresponding loop between H2-H3.
Energy minimization refinement by MODLOOP allowed for residues within H2-H3 to possess
126
mostly favorable energy scores in ANOLEA and the local model quality plot in ProSA
(Supplemental Figures A.1-A.12). The conformation of the H2-H3 loop for Ara h 2 orthologs
varied from being fully extended (e.g. A. hypogaea/A. duranensis), kinked (e.g. A. guarantica),
and being folded in towards the heavy and light chains (e.g. A. batizocoi; Figure 3.4).
Unfavorable energy scores were apparent for residue located in the N-terminus α-helices H2,
H4, and H5; and portions of the C-terminus. Residues that received a high energy score in
ANOLEA have been generally thought to have errors or interact with other regions (Melo et al.,
1997).
Members of the prolamin superfamily contain a backbone structure of C -Xn-C-X-n-CC-
Xn-CXC-X-C-Xn-C (Shewry et al., 2002). While the number of cysteines varies from eight to
ten within the protein sequence, these residues form four to five disulfide bonds that stabilize the
protein and connect the heavy and light chains. The template structure, Ara h 6, possessed ten
cysteines within its amino acid sequence. In the Ara h 2 orthologs from wild species, eight
cysteines were present in the amino acid sequence, which were predicted to form four disulfide
bonds in the homology models. Lehmann et al. (2006) speculated that the lack of the fifth
disulfide bond allowed the C-terminus to lack a secondary structure and remain flexible.
The majority of the variations were located within the loop that connected helices H2 and
H3. Typically, the hypervariable region in 2S albumin lies in the loop connecting H3 and H4
(Monero and Clemente, 2008). Variations in the H2-H3 loop appear to be specific to the Ara h 2
orthologs when compared to other 2S albums. The evolutionary trend appeared to be that the
larger H2-H3 loops were present in the more derived species.
The changes located within the H2-H3 loop would affect two of the ten IgE-binding
regions present in Ara h 2, epitopes 6 and 7. These two epitopes have been recognized as

127
immunodominant as they were consistently recognized by patient sera (Stanley et al., 1997).
Both epitopes 6 and 7 share a hexapeptide motif, DPYSPS. The differences within the H2-H3
loop among Ara h 2 orthologs included additional residues between the epitopes and amino acid
variations within the hexapeptide motif, and partial or complete deletions of either epitope
(Figure 3. 4). Chatel et al. (2003) identified that the Ara h 2.02 isoform contains an H2-H3 loop
that is 12 amino acids longer than Ara h 2.01, which was hypothesized could elicit a stronger
reaction. The Ara h 2.02 isoform is an identical sequence to the Ara h 2 ortholog from A.
ipaensis (Figure 3.1), its putative B genome progenitor. Based on the prediction by Chatel et al.
(2003), one could reason that the ortholog from A. palustris could also elicit a stronger reaction
because its H2-H3 loop is 16 amino acids longer than the Ara h 2.01 isoform and contains
potential IgE-binding regions that resemble epitope 6. The difference between epitope 6
DPYSPS) and the epitope “6” EDPYSPS; underlined identifies the substitution) is the missense
variation in which there is a slightly bulkier side chain. The ortholog from A. batizocoi contains
a variation in epitope 7 that was also identified by Ramos et al. (2008) in an accession of A.
duranensis (DPYSPS/DPYTPS). The S to T mutation had significant decrease in antibody
binding. In addition to an epitope that contains a similar variation identified by Ramos et al.
(2008), the loop was five residues longer than the one for Ara h 2.01. The Ara h 2 ortholog from
A. batizocoi has the potential to be less allergenic than the orthologs from A. palustris, A.
duranensis, and A. glandulifera as it contains a similar variation that was present in the A.
duranensis ortholog identified by Ramos et al. (2008).
In the majority of the orthologs from species outside section Arachis, the H2-H3 loop
tended to be shorter in length and have variations within a full or truncated epitope (QDPYGPS,
PYGPS, PYSPS, or QDPY). Arachis paraguariensis, A. guarantica, A. rigonii, and A. pintoi

128
contained an S to G variation in potential epitopes, a polar charged residue to a hydrophobic
residue (Figure 3.4). King et al. (2005) induced a similar variation by site directed mutagenesis
(S to A), which resulted in a reduction in antibody binding to the recombinant protein product.
Orthologs with a similar variation could potentially have reduced antibody-binding affinity. In
the orthologs from A. triseminata and A. macedoi, a truncated version of the epitope (QDPY)
was present (Figure 3.4). In combination with the shorter H2-H3 loop, these two species have
the potential to be hypoallergenic.
The theoretical structure of the Ara h 2 orthologs allowed for linear and conformational B
cell epitopes to be predicted by the programs ElliPro and DiscoTope. Predictions of epitopes
would allow for better understanding of which residues would interact with an antibody and
could aid in the design of an altered protein that could be used for immunotherapy (Pomés,
2010). Generally, epitopes are determined experimentally using overlapping peptides or protein
fragments. For the peanut allergen Ara h 2, Stanley et al. (1997) determined 10 linear epitopes to
be present among 61 residues (38.13%) using overlapping peptides. The linear epitopes
predicted by ElliPro and conformational DiscoTope epitope predictions tended to identify a
larger portion of the Ara h 2.01 to be potential epitopes, 48.5 and 58.8% respectively.
DiscoTope predictions were set at a threshold score of -7.7, which allowed for 25% of the
predicted residues to be false-positively considered to be epitopes (Andersen et al., 2006).
Conformational ElliPro predictions predicted fewer residues as potential epitopes than the
number determined experimentally (28.8%). Though the number of residues in the
conformational epitopes as predicted by ElliPro was fewer than the other methods, these residues
tended to receive higher protrusion index scores the further away they were spatial to the heavy
and light chains. While these programs tended to predict more residues as epitopes than those

129
determined experimentally, they could aid in identifying which regions of a protein should be
focused on for development of hypoallergenic or immunothearpy targets.
Predicted epitopes were influenced by the conformation of ortholog models based on the
Ara h 6 template. The H2-H3 loop conformation varied from being extended, as seen in the A.
hypogaea Ara h 2.01/A. duranensis model, or folded in towards the α-helices, as seen in the Ara
h 2 orthologs from wild species (Figure 3.4). The linear epitope prediction for A. hypogaea
2.01/A. duranensis model by ElliPro gave H2-H3 residues 54-59 a lower protrusion score (0.605)
than residues 64-83 (0.77), as residues 54-59 were closer to the helical core of the modeled
protein. The ElliPro conformation epitope prediction gave the highest protrusion index score
(0.975) to five residues that were furthest away from the light and heavy chains. The remaining
residues that comprised the H2-H3 loop were also recognized as conformational epitopes, but
with lower protrusion index scores (0.506-0.781). Both programs did include the residues of
immunodominant epitopes as part of their predictions in A. hypogaea 2.01/A. duranensis
ortholog.
For the Ara h 2 orthologs from wild Arachis species, the H2-H3 loop was consistently
predicted as a conformational epitope by DiscoTope in all of the Ara h 2 orthologs
(Supplemental Table C.2), even when the loop was folded in towards the α-helices (Figure 3.4).
Amino acid residues received higher protrusion index scores from ElliPro the further away it was
located from the heavy and light chains (Supplemental Table C.1). Overall, residues that were
identified as potential epitopes received scores that ranged as low as 0.545 to 0.934. Amino acid
variations seen in the peptide sequence or the H2-H3 loop were not reflected in the epitopes
predicted in orthologs from wild species.

130
Interestingly, conformational epitopes that included the residues of the H2-H3 loop and
those of helices H4 through H5 were identified here (Figure 3.5 and Supplemental Table B2).
These potential conformational epitopes have not been previously identified. ElliPro
conformational predictions did recognize these residues as part of an epitope in the orthologs
from A. ipaensis (R55, D56, E57, Y60, G61, R62, D63, P64, Y65, R135, Q137), A. guarantica
(D56, E57, R119), and A. triseminata (R55, D56, S58, P59, Y60, R117, G120, R121).
Molecular dynamic simulations for the Ara h 2 models were conducted by W.J. Allen in the
Bevan lab (Department of Biochemistry, Virginia Tech). The MD simulations showed that the
residues located between helices H4 through H5 were determined to be very flexible based on
root mean square fluctuation (RMSF) measurements. The RMSF measurements suggest that
residues between H4 and H5 could be a functional area and in combination of the data from
DiscoTope and ElliPro, this region with the H2-H3 loop could serve as a conformational epitope
in Ara h 2 orthologs.
In addition to the computational predictions of epitopes, peptides representing the first
15-16 residues of the H2-H3 loop from A. hypogaea and five wild Arachis species were
synthesized and assessed for antibody binding using dot immunoblots. The peptide representing
the loop from A. hypogaea produced higher signal than the isolated Ara h 2 protein (Figure 3.6).
Of the linear epitopes identified by Stanley et al. (1997), epitopes 6 and 7 were consistently
recognized by patient sera. In comparison to isolated Ara h 2 protein, epitope 6 was more
prevalent in the A. hypogaea peptide spots than the isolated Ara h 2 spots (Figure 3.6). Peptides
representing the H2-H3 loop from A. batizocoi (section Arachis) and A. rigonii (section
Procumbentes) had the next highest antibody affinity, as indicated by the densitometry reading.
Even though there were variations in the peptides representing these two species, each peptide
131
contained the DPYSPS motif (Table 3.2). Despite a complete hexamer present in the sequence
for the peptide representing the A. glandulifera (section Arachis) H2-H3 loop, this peptide had
lower antibody binding affinity as shown in the densitometry measurement (Figure 3.6), which
was 32.6% less than the measurement of the peptide from the H2-H3 loop from A. hypogaea.
While the A. glandulifera peptide contains a DPYSPS motif, it also appears to possess fewer
residues with bulky side chains (Table 3.2). The peptide from A. guarantica had next to the
lowest antibody binding affinity, with densitometry measurements that were 50.6% less than the
peptide from A. hypogaea (Figure 3.6). The peptide representing the H2-H3 loop from A.
guarantica possessed a variation within the hexameric motif (DPYSYS/DPYGPS). The peptide
from A. triseminata (section Triseminatae) had the lowest antibody affinity. Densitometry
measurement for peptide was 69.4% less than the peptide from A. hypogaea. It also lacked the
whole DPYSPS motif within the peptide sequence. Only the DPY portion of the motif was
present in the peptide sequence for A. triseminata, suggesting the lack of a full DPYSPS motif
played a role in reduced antibody binding affinity.
In addition to the completeness of the DPYSPS motif, the number of prolines and
glutamines appears to have some correlation to antibody binding and subsequent intensity. The
amount of proline residues appeared to have a positive correlation and higher densitometry
measurements (0.51). The reverse appears to be the same for glutamine residues (-0.51). These
data suggests that available loop regions with more prolines or less glutamines could have some
affect on antibody recognition. Further study comparing the composition for the entire loop
would be needed to determine if a causal relationship exists between the type of residue and the
propensity it will be recognized by IgE antibodies.

132
Arachis species that contain Ara h 2 orthologs with significant changes in the IgE-
binding epitopes could be targets for crop improvement or the development of immunotherapy.
Variations among the Ara h 2 orthologs were concentrated on the loop connecting α-helices H2
and H3, and could alter the IgE-binding affinity towards epitopes 6 and epitope 7 (Figure 3.4).
IgE-binding epitopes were predicted to be present on the surface of Ara h 2 orthologs, including
the H2-H3 loop. However, dot immunoblots demonstrated that species outside of section
Arachis possessed variations in the H2-H3 loop that had substantial reduction in antibody
binding (Figure 3.6). Though finding Ara h 2 variants with reduced IgE-binding affinity is one
objective towards the goal of the development of a hypoallergenic peanut, further tests would be
needed to identify other regions that interact with immune cells, specifically antigen presenting
cells and regulatory T-cells (Vickery and Burks, 2009). As shown here, wild species could
possess variations to the major allergen Ara h 2 that could be less allergenic. Species with
hypoallergenic proteins would be important towards the development of a safer peanut crop.
Literature Cited
Andersen, P.H., Nielsen, M., and Lund, O. (2006). Prediction of residues in discontinuous B cell
epitopes using protein 3D structures. Protein Science 15, 2558-2567.
Arnold, K., Bordoli, L., Kopp, J., and Schwede, T. (2005). The SWISS-MODEL workspace: a
web-based environment for protein structure homology modelling. Bioinformatics 22,
195-201.
Asero, R., Mistrello, G., Roncarolo, D., Amato, S., Caldironi, G., Barocci, F., and van Ree, R.
(2002). Immunological cross-reactivity between lipid transfer proteins from botanically
unrelated plant-derived foods: a clinical study. Allergy 57, 900-906.
Barlow, D.J., Edwards, M.S., and Thornton, J.M. (1986). Continuous and discontinuous protien
antigenic determinants. Nature 322, 747-748.
Barre, A., Borges, J.P., Culerrier, R., and Rouge, P. (2005). Homology modelling of the major
peanut allergen Ara h 2 and surface mapping of IgE-binding epitopes. Immunology
Letters 100, 153-158.
Branum, A.M., and Lukacs, S.L. (2008). Food Allergy Among U.S. Children: Trends in
Prevalence and Hospitalizations, N.C.f.H. Statistics, ed. (Hyattsville, MD, NCHS data
brief).

133
Breiteneder, H., and Radauer, C. (2004). A classification of plant food allergens. J Allergy Clin
Immunol 113, 821-830.
Burks, A.W., Williams, L.W., Connaughton, C., Cockrell, G., O'Brien, T.J., and Helm, R.M.
(1992). Identification and characterization of a second major peanut allergen, Ara h II,
with use of the sera of patients with atopic dermatitis and positive peanut challenge. J
Allergy Clin Immunol 90, 962-969.
Burks, A.W., Williams, L.W., Helm, R.M., Connaughton, C., Cockrell, G., and O'Brien, T.
(1991). Identification of major allergen, Ara h 1, in patients with atopic dermatitish and
postive peanut challenges. J Allergy Clin Immunol 88, 172-179.
Burks, W. (2003). Peanut allergy: a growing phenomenon. The Journal of Clinical Investigation
111, 950-952.
Chatel, J.M., Bernard, H., and Orson, F.M. (2003). Isolation and characterization of two
complete Ara h 2 isoforms cDNA. International Archives of Allergy and Immunology
131, 14-18.
Cole, C., Barber, J.D., and Barton, G.J. (2008). The Jpred 3 secondary structure prediction
server. Nucleic Acids Research 36, W197-W201.
Felsenstein, J. (1985). Confidence Limits on Phylogenies: An Approach Using the Bootstrap.
Evolution 39, 783-791.
Fiser, A., Do, R.K., and Sali, A. (2000). Modeling of loops in protien structures. Protein Science
9, 1752-1773.
Jamroz, M., and Kolinski, A. (2010). Modeling of loops in proteins: a multi-method approach.
BMC Structural Biology 10, 9.
King, N., Helm, R., Stanley, J.S., Vieths, S., Luttkopf, D., Hatahet, L., Sampson, H., Pons, L.,
Burks, W., and Bannon, G.A. (2005). Allergenic characteristics of a modified peanut
allergen. Mol Nutr Food Res 49, 963-971.
Kleber-Janke, T., Crameri, R., Appenzeller, U., Schlaak, M., and Becker, W.M. (1999). Selective
cloning of peanut allergens, including profilin and 2S albumins, by phage display
technology. International Archives of Allergy and Immunology 119, 265-274.
Koppelman, S.J., Vlooswijk, R.A.A., Knippels, L.M.J., Hessing, M., Knol, E.F., van Reijsen,
F.C., and Bruijnzeel-Koomen, C. (2001). Quantification of major peanut allergens Ara h
1 and Ara h 2 in the peanut varieties Runner, Spanish, Virginia, and Valencia, bred in
different parts of the world. Allergy 56, 132-137.
Koppelman, S.J., Wensing, M., Ertmann, M., Knulst, A.C., and Knol, E.F. (2004). Relevance of
Ara h1, Ara h2 and Ara h3 in peanut-allergic patients, as determined by immunoglobulin
E Western blotting, basophil-histamine release and intracutaneous testing: Ara h2 is the
most important peanut allergen. Clin Exp Allergy 34, 583-590.
Krapovickas, A., and Gregory, W.C. (1994). Taxonomía del género Arachis (Leguminosae).
Bonplandia 8, 1-186.
Kreis, M., Forde, B.G., Rahman, S., Miflin, B.J., and Shewry, P.R. (1985). Molecular evolution
of the seed strocate proteins of barley, rye and wheat. Journal of Molecular Biology 183,
499-502.
Kulkarni-Kale, U., Bhosle, S., and Kiolaskar, A.S. (2005). CEP: a conformational epitope
prediction server. Nucleic Acids Research 33, W168-W171.
Lehmann, K., Schweimer, K., Reese, G., Randow, S., Suhr, M., Becker, W.M., Vieths, S., and
Rosch, P. (2006). Structure and stability of 2S albumin-type peanut allergens:
implications for the severity of peanut allergic reactions. Biochem J 395, 463-472.

134
Lehrere, S.B., Ayuso, R., and Reese, G. (2002). Current Understanding of Food Allergens.
Annals of the New York Academy of Sciences 964, 69-85.
Melo, F., Devos, D., Depiereux, E., and Feytmans, E. (1997). ANOLEA: a www server to assess
protein structures. Paper presented at: Inernational Concerence on Intellegen Ssytems for
Molecular Biology
Melo, F., and Feytmans, E. (1997). Novel knowledge-based mean force potential at atomic level.
Journal of Molecular Biology 267, 207-222.
Milla, S.R., Isleib, T.G., and Stalker, H.T. (2005). Taxonomic relationships among Arachis sect.
Arachis species as revealed by AFLP markers. Genome 48, 1-11.
Mittag, D., Akkerdaas, J., Ballmer-Weber, B.K., Vogel, L., Wensing, M., Becker, W.M.,
Koppelman, S.J., Knulst, A.C., Helbling, A., Hefle, S.L., et al. (2004). Ara h 8, a Bet v 1-
homologous allergen from peanut, is a major allergen in patients with combined birch
pollen and peanut allergy. J Allergy Clin Immunol 114, 1410-1417.
Monero, F.J., and Clemente, A. (2008). 2S albumin storage proteins: What makes them food
allergen? The Open Biochemistry Journal 2, 16-28.
Moreno, F.J., and Clemente, A. (2008). 2S Albumin Storage Proteins: What Makes them Food
Allergens? The Open Biochemistry Journal 2, 16-28.
Morris, A.L., MacArthur, M.W., Hutchinson, E.G., and Thorton, J.M. (1992). Sterechemical
quality of protein structural coordinates. Proteins 12, 345-264.
Müller, K., D, Q., Müller, J., and Neinhuis, C. (2005). PhyDE, version 0.92: phylogenetic data
editor.
Müller, K.F. (2007). PRAP2- liklihood and parsimony rachet analysis. v.09.
Nishikawa, K., and Ooi, T. (1980). Prediction of the surface-interior diagram of globular proteins
by an empreical method International Journal of Peptide and Protein Research 161, 19-
32.
Nixon, K. (1999). The parsimony ratchet, a new method for rapid parsimony analysis. Cladistics
15, 407-414.
Pantoja-Uceda, D., Bruix, M., Gimenez-Gallego, G., Rico, M., and Santoro, J. (2003). Solution
Structure of RicC3, a 2S Albumin Storage Protein from Ricinus communis. Biochemistry
42, 13839-13847.
Pomés, A. (2010). Relevant B cell epitopes in allergic disease. International Archives of Allergy
and Immunology 152, 1-11.
Ponomarenko, J., Bui, H.-H., Li, W., Fusseder, N., Bourne, P.E., Sette, A., and Peters, B. (2008).
ElliPro: a new structure-based tool for the prediction of antibody epitopes. Bmc
Bioinformatics 9, 514.
Pons, L., Chery, C., Romano, A., Namour, F., Artesani, M.C., and Gueant, J.L. (2002). The 18
kDa peanut oleosin is a candidate allergen for IgE-mediated reactions to peanuts. Allergy
57, 88-93.
Prescott, S.L., Taylor, A., King, B., Dunstan, J., Upham, J.W., Thornton, C.A., and Holt, P.G.
(2003). Neonatal interleukin-12 capacity is associated with variations in allergen-specific
immune responses in the neonatal and postnatal periods. Clin Exp Allergy 33, 566-572.
Rabjohn, P., Helm, E.M., Stanley, J.S., West, C.M., Sampson, H.A., Burks, A.W., and Bannon,
G.A. (1999). Molecular cloning and epitope analysis of the peanut allergen Ara h 3. J
Clin Invest 103, 535-542.

135
Ramos, M.L., Fleming, G., Chu, Y., Akiyama, Y., Gallo, M., and Ozias-Akins, P. (2006).
Chromosomal and phylogenetic context for conglutin genes in Arachis based on genomic
sequence. Mol Genet Genomics 275, 578-592.
Ramos, M.L., Huntley, J.J., Maleki, S.J., and Ozias-Akins, P. (2008). Identification and
characterization of a hypoallergenic ortholog of Ara h 2.01. Plant Mol Biol 69, 325-355.
Rao, N.K., Reddy, L.J., and Bramel, P.J. (2003). Potential of wild species for genetic
enhancement of some semi-arid food crops. Genetic Resource and Crop Evolution 50,
707-721.
Rost, B., Yachdav, G., and Liu, J.F. (2004). The PredictProtein server. Nucleic Acids Research
32, W321-W326.
Sali, A., and Blundell, T.L. (1993). Comparative protein modelling by satisfaction of spacial
restraints. Journal of Molecular Biology 234, 779-815.
Sander, C., and Schneider, R. (1991). Database of homology-derived structures and the structural
meaning of sequence alignment. Proteins 9, 56-68.
Schneider, R., de Daruvar, A., and Sander, C. (1997). The HSSP database of protein structure-
seqeunce alignment. Nucleic Acids Research 25, 226-230.
Shewry, P.R., Beaudoin, F., Jenkins, J., Griffith-Jones, S., and Mills, E.N. (2002). Plant proteins
and their relationship to food allergy Biochemical Society Transactions 30, 906-910.
Shewry, P.R., Napier, J.A., and Tatham, A.S. (1995). Seed storage proteins: structures and
biosynthesis. The Plant Cell 7, 945-956.
Sicherer, S.H., Munoz-Furlong, A., and Sampson, H.A. (2003). Prevalence of peanut and tree nut
allergy in the United States determined by means of a random digit dial telephone survey:
A 5-year follow-up study. J Allergy Clin Immunol 112, 1203-1207.
Sicherer, S.H., and Sampson, H.A. (2006). 9. Food allergy. J Allergy Clin Immunol 117, S470-
S475.
Smartt, J., Gregory, W.C., and Gregory, M.P. (1978). The genomes of Arachis hypogaea L. 1.
Cytogenetic studies of putative genome donors. Euphytica 27, 665-675.
Stalker, H.T. (1991). A new species in section Arachis of peanuts with a D genome American
Journal of Botany 78, 630-637.
Stanley, J.S., King, N., Burks, A.W., Huang, S.K., Sampson, H., Cockrell, G., Helm, R.M.,
West, C.M., and Bannon, G.A. (1997). Identification and mutational analysis of the
immunodominant IgE binding epitopes of the major peanut allergen Ara h 2. Arch
Biochem Biophys 342, 244-253.
Swofford, D.L. (2003). PAUP*: Phylogenetic Analysis Using Parsimony (* and other methods),
version 4.0, β Sunderland, MA Sinauer Associates).
Taylor, W.R., Thornton, J.M., and Turnell, W.G. (1983). An ellipsoidal approximation of protein
shape. Journal of Molecular Graphics 1, 30-38.
Thornton, J.M., Edwards, M.S., Taylor, W.R., and Barlow, D.J. (1986). Location of 'continuous'
antigenic determinants in the protruding regions of proteins. EMBO Journal 5, 409-413.
USDA-NASS (2009). Peanut Stocks and Processing.
Valls, J.F.M., and Simpson, C.E. (2005). New species of Arachis (Leguminosae) from Brazil,
Paraguay and Bolivia. Bonplandia 14, 35-63.
van Regenmortel, M.V.H. (1992). Molecular dissection of protein antigens. In Structure of
antigens, M.V.H.v. Regenmortel, ed. (Boca Raton, Fla, CRC Press), pp. 1-29.
Vickery, B.P., and Burks, A.W. (2009). Immunotherapy in the treatment of food allergy: focus
on oral tolerance. Current Opinion in Allergy and Clinical Immunology 9, 364-370.

136
Wiederstein, M., and Sippl, M.J. (2007). ProSA-web: interactive web service for the recognition
of errors in three-dimensional structures of proteins. Nucleic Acids Reseach 35, W407-
410.
Wood, R.A. (2003). The Natural History of Food Allergy. Pediatrics 111, 1631-1637.

137
CHAPTER 4: General Conclusions

138
The legume genus Arachis contains 80 species including the economically important
peanut crop, A. hypogaea (Krapovickas and Gregory, 1994; Valls and Simpson, 2005). The
monograph for this South American genus taxonomically classified Arachis species into nine
sections based on data from morphology, crossability, and geographic distribution (Krapovickas
and Gregory, 1994). Cytogenetic evidence has indicated that section Arachis, the largest section,
can be further divided into genome groups, A, B, and D, based on chromosome morphology
(Husted, 1933; Smartt et al., 1978; Stalker, 1991). While the majority of species are diploid with
a base chromosome number of x=10, tetraploid and aneuploid species have also been identified
Krapovickas and Gregory, 994 Lavia, 998 Pe ñaloza and Valls, 1997). The most well known
tetraploid is the peanut crop and wild members of the genus Arachis have been considered to be
potential genetic resources (Rao et al., 2003). Thus, a clear depiction of species relationships
would benefit efforts to improve the crop, which has a narrow genetic background. The
monograph depicted an intuitive illustration of the evolutionary and phylogenetic relationships
among the Arachis sections (Krapovickas and Gregory, 1994). The species relationships
proposed by Krapovickas and Gregory (1994) were used as a hypothesis. The relationships
described in the monograph were compared to those reflected in the trees that resulted from
phylogenetic analyses of partitioned and combined plastid and nuclear genomic regions.
The phylogenies presented in the second chapter partially agree with Krapovickas and
Gregory (1994) in regards to the validity of sections Caulorrhizae, Extranervosae, and
Triseminatae. The phylogenetic trees based on ITS and combined trnT-trnF data also
demonstrated that the most basal section of genus Arachis is section Extranervosae. It is
followed by the monotypic section Triseminatae and section Caulorrhizae. The species
relationships in and among sections Arachis, Erectoides, Heteranthae, Procumbentes,

139
Rhizomatosae and Trierectoides need further investigation, as species from these sections did not
resolve as monophyletic clades. Sections Erectoides, Heteranthae, Procumbentes, and
Trierectoides formed a heterogeneous lineage and sublineages did not group according to their
taxonomic classification. Sections Erectoides, Procumbentes, Rhizomatosae, and Trierectoides
were previously recognized as a single unit (Gregory and Gregory, 1979). Among species in
section Arachis, this study showed it as a lineage that divided into two clades, groups arachis II
(A genome clade) and arachis I (non-A genome clade).
Further study is needed to resolve the polytomies found within the terminal lineages to
gain a full understanding of relationships within group arachis I and arachis II. DNA sequence
information from genomic regions that evolve at high rates from both nuclear and chloroplast
genomic regions would be beneficial. Examples of potential chloroplast markers that could be
utilized include the trnS-trnG spacer and the rpl16 intron (Shaw et al 2003), while nuclear
regions utilized should be low-copy nuclear genes (Hughes et al., 2006). As a whole,
phylogenies are useful in providing information on the diversity within the genus and the
relationships among species. The molecular phylogenies produced in the second chapter are
among the first generated for the genus and provides a clearer illustration of the relationships
among sections and genomes. Thus, the phylogenies from Chapter Two can be utilized for
conservation of germplasm and genetic resources for breeding to improve the crop (Koppolu et
al., 2010).
The use of wild relatives as a source of genetic material has normally focused on the
introgression of genes that can be utilized to resist abiotic stress and diseases (Burow et al., 2001;
Foncéka et al., 2009; Stalker, 1980). These types of improvements can benefit farmers in terms

140
of yield and crop quality. However the benefits of crop improvement should not be limited to
producers; it can benefit end consumers as well (e.g. Mou, 2005; Oritz et al., 2007).
The third chapter of this dissertation examines wild species of genus Arachis for
variations among orthologs of the major peanut allergen Ara h 2. Peanut allergies are a serious
health issue, as they can cause severe reactions, such as anaphylaxis. These allergies affect 1.2%
of the US population, with the number of children diagnosed with this food allergy on the rise
(Sicherer et al., 2003). Ten allergy-causing agents have been identified in the peanut seed, with
Ara h 2 being one of two major allergens that are recognized in the majority of peanut-sensitive
persons. Most of the studies on Ara h 2 have focused on the crop and its two putative
progenitors, A. duranensis and A. ipaensis (Koppelman et al., 2001; Ramos et al., 2006; Ramos
et al., 2008). The third chapter examined variations in Ara h 2 orthologs from 12 wild species
across the genus. The size of the Ara h 2 orthologs tended to be larger within section Arachis,
than those from other sections. The majority of mutations were identified in the H2-H3 loop
region, which also contains the immunodominant epitopes #6 and #7 (Stanley et al., 1997). The
two epitopes share a common hexapeptide motif, DPYSPS. The presence of the two or more
DPYSPS motifs within the H2-H3 loop was more prevalent in species from section Arachis.
Orthologs from the species that were resolved in the group erectoides lineages in the second
chapter contained hexapeptide motifs that contained an S to G variation (DPYGPS) or were
truncated (DPY). Species from two of the three lineages identified at the base of the Arachis
phylogeny, A. macedoi and A. triseminata, possessed orthologs with loops that lacked a complete
hexapeptide motif. While linear and conformational epitope programs consistently predicted the
H2-H3 loop to contain IgE-binding epitopes, dot immunoblots showed reduced antibody binding
to A. guarantica and A. macedoi peptides when compared to the peptide from A. hypogaea.

141
Thus, wild species of genus Arachis are not only genetic resources that can be used to improve
the crop by providing genes for resistance to disease and abiotic stress (Rao et al., 2003); they
could also be used to improve the crop to benefit the consumer.
Further study of the proteins would be needed to understand the allergy-causing potential,
or lack thereof, for Ara h 2 orthologs from wild species. The dot immunoblot assay examined
differential antibody binding to peptides that represented the first 15-16 residues of the H2-H3
loop. However, the remaining epitopes of Ara h 2 are distributed along the length of the protein.
Experimental data for the whole protein would be needed to examine the effects of the variations
and to supplement the bioinformatics approaches used here. Ara h 2 protein could be isolated
from seed or expressed recombinantly (Koppelman et al., 2001; Lehmann et al., 2003). Both
methods were attempted for this dissertation; however, sufficient amounts of purified protein
were not obtained. Of the two methods, recombinant protein expression would produce larger
amounts of protein. The seeds from wild species of Arachis tend to be substantially smaller
when compared to the crop, and as a consequence, protein isolation would require more seeds
and would not be as efficient.
In addition to the understanding the effect variations to the Ara h 2 orthologs have on
their allergenic potential, further study is also needed to understand the allergens interaction with
other macromolecules that could lead to the development of a hypoallergenic crop. Currently,
there is little information on the factors that influence the immune system to develop IgE
antibodies against specific food proteins (Bredehorst and David, 2001). The majority of food
proteins recognized as allergens have often been glycoproteins, including Ara h 2 (Burks et al.,
1991). Even though the IgE-binding regions of Ara h 2 have been found to reside within the
protein portion of this glycoprotein (Stanley et al., 1997), carbohydrates that maybe present with

142
Ara h 2 may increase its recognition as an allergen. Lipids may also play an important role the
identification of Aar h 2, in addition to other plant proteins, as food allergens (Thomas et al.,
2005). The variations observed in the Ara h 2 orthologs work in concert with these
macromolecules, and could affect the recognition of it as an allergen. The role of carbohydrates’
and lipids’ influence on the recognition of plant proteins, such as Ara h 2, by the innate immune
system and subsequent development of IgE-producing B-cells needs to be further studied.
Results from such studies would be valuable not only in the treatment of food allergies in
general, but also in its prevention.
Orthologs of Ara h 2 that are found to be hypoallergenic could be utilized for crop
improvement (Ramos et al., 2008). Using genes from wild relatives to produce a safer peanut
cultivar would be preferred over the use of RNA interference (Dodo et al., 2005; Dodo et al.,
2008), which would require the development of a transgenic peanut. Wild species that are
identified to have hypoallergenic variations of Ara h 2 could be used in breeding programs,
which would be most efficient to species closely related to the crop (Foncéka et al., 2009). Gene
introgression of distantly related species would require more time and effort on the part of the
breeder (Rommens et al., 2007); however, this method would still be preferred to the
development of a transgenic crop. Alternatively, these species could be developed specifically
for the treatment of peanut allergies.
Research Influence on my Teaching Philosophy
As a student, I felt that science was often taught as a set of facts. However, science is
not a set of facts that have to be learned. It is a process of discovery. During my graduate
education, I have gained a greater appreciation for that process and have learned more through
143
participating in research. I have also had the opportunity to share my enjoyment of science
though teaching laboratory classes and mentoring undergraduates in Dr. Hilu’s lab.
As a teacher, I would like to foster the same appreciation for science in my students by
showing them that it is more than just a set of facts that has to be learned. By allowing them to
also learn science through experimentation, I think they will be able to see that it is process of
discovery and a dynamic subject. Additionally, I would hope that my students would be able to
see that conducting research is not limited to the stereotypical Caucasian male in a lab wearing a
white lab coat. I hope that I could lead by example that anyone can be a scientist, regardless of
gender, ethnicity, and background. My hope is my students not only appreciate the subject, but
would also see it as something they can do as well.
Literature Cited
Bredehorst, R. and David, R. (2001) What establishes a protein as an allergen? Journal of
Chromatography B. 756:33-40
Burow, M.D., Simpson, C.E., Starr, J.L., and Paterson, A.H. (2001). Transmission Genetics of
Chromatin From a Synthetic Amphidiploid to Cultivated Peanut (Arachis hypogaea L.):
Broadening the Gene Pool of a Monophyletic Polyploid Species. Genetics 159, 823-837.
Dodo, H., Konan, K., and Viquez, O. (2005). A genetic engineering strategy to eliminate peanut
allergy. Curr Allergy Asthma Rep 5, 67-73.
Dodo, H.W., Konan, K.N., Chen, F.C., Egnin, M., and Viquez, O.M. (2008). Alleviating peanut
allergy using genetic engineering: the silencing of the immunodominant allergen Ara h 2
leads to its significant reduction and a decrease in peanut allergenicity. Plant
Biotechnolology Journal 6, 135-145.
Foncéka, D., Hodo-Abalo, T., Rivallan, R., Faye, I., Sall, M.N., Ndoye, O., Fávero, A.P.,
Bertioli, D.J., Glaszmann, J.-C., Courtois, B., et al. (2009). Genomic mapping of wild
introgressions into cultivated peanut: a way towards enlarting the genetic basis of a recent
allotetraploid. BMC Plant Biology 9, 103.
Gregory, W.C., and Gregory, M.P. (1979). Exotic germ plasm of Arachis L. interspecific
hybrids. Journal of Heredity 70, 185-193.
Hughes, C.E., Eastwood, R.J., and Bailey, C.D. (2006). From famine to feast? Selecting nuclear
DNA sequencing loci for plant species-level phylogeny reconstruction. Philosophical
Transactions of the Royal Society B 361, 211-225.
Husted, L. (1933). Cytological studies of peanut 1. Chromosome number and morphology.
Cytologia 4, 109-117.

144
Koppelman, S.J., Vlooswijk, R.A.A., Knippels, L.M.J., Hessing, M., Knol, E.F., van Reijsen,
F.C., and Bruijnzeel-Koomen, C. (2001). Quantification of major peanut allergens Ara h
1 and Ara h 2 in the peanut varieties Runner, Spanish, Virginia, and Valencia, bred in
different parts of the world. Allergy 56, 132-137.
Koppolu, R., Upadhyaya, H.D., Dwivedi, S.L., Hoisington, D.A., and Varshney, R.K. (2010).
Genetic relationships among seven sections of genus Arachis studied by using SSR
markers. BMC Plant Biology 10, 15.
Krapovickas, A., and Gregory, W.C. (1994). Taxonomía del género Arachis (Leguminosae).
Bonplandia 8, 1-186.
Lavia, G.I. (1998). Karyotypes of Arachis palustris and A. praecox (Section Arachis), two
species with basic chromosome number x=9. Cytologia 63, 177-181.
Lehmann, K., Hoffmann, S., Neudecker, P., Suhr, M., Becker, W.M., and Rosch, P. (2003).
High-yield expression in Escherichia coli, purification, and characterization of properly
folded major peanut allergen Ara h 2. Protein Expr Purif 31, 250-259.
Mou, B.Q. (2005). Genetic cariation of beta-carotene and tuin contents in lettuce. Journal of the
American Society for Horticultural Science 130, 870-876.
Oritz, R., Trethowan, R., Ferrara, G.O., Iwanaga, M., Dodds, J.H., Crouch, J.H., Crossa, J., and
Braun, H.-J. (2007). High yield potential, shuttle breeding, genetic diversity, and a new
international wheat improvement strategy. Euphytica 157, 365-384.
Pe ñaloza, A.P.S., and Valls, J.F.M. (1997). Contagen do número cromossômico en assos de
Arachis decora (Legumonsae) In Simpósio Latino Slericanno de Recursos Genéticos
Vegetais, R.F.A. Vega, M.L.A. Bovi, J.A. Betti, and R.B.Q. Voltan, eds. (Campanias,
Brazil, IAC/Embrapa-Cenargen), p. 21.
Ramos, M.L., Fleming, G., Chu, Y., Akiyama, Y., Gallo, M., and Ozias-Akins, P. (2006).
Chromosomal and phylogenetic context for conglutin genes in Arachis based on genomic
sequence. Mol Genet Genomics 275, 578-592.
Ramos, M.L., Huntley, J.J., Maleki, S.J., and Ozias-Akins, P. (2008). Identification and
characterization of a hypoallergenic ortholog of Ara h 2.01. Plant Mol Biol 69, 325-355.
Rao, N.K., Reddy, L.J., and Bramel, P.J. (2003). Potential of wild species for genetic
enhancement of some semi-arid food crops. Genetic Resource and Crop Evolution 50,
707-721.
Rommens, C.M., Hariung, M.A., Swords, K., Davies, H.V., and Belknap, W.R. (2007). The
intrgenic approach as a new extrension to traditional plant breeding. Trends Plant Sci 9,
397-403.
Sicherer, S.H., Munoz-Furlong, A., and Sampson, H.A. (2003). Prevalence of peanut and tree nut
allergy in the United States determined by means of a random digit dial telephone survey:
A 5-year follow-up study. J Allergy Clin Immunol 112, 1203-1207.
Smartt, J., Gregory, W.C., and Gregory, M.P. (1978). The genomes of Arachis hypogaea. 2.
Implication interspecific breeding. Euphytica 27, 677-680.
Stalker, H.T. (1980). Utilization of wild species for crop improvement Advances in agronomy
33, 111-146.
Stalker, H.T. (1991). A new species in section Arachis of peanuts with a D genome American
Journal of Botany 78, 630-637.
Stanley, J.S., King, N., Burks, A.W., Huang, S.K., Sampson, H., Cockrell, G., Helm, R.M.,
West, C.M., and Bannon, G.A. (1997). Identification and mutational analysis of the

145
immunodominant IgE binding epitopes of the major peanut allergen Ara h 2. Arch
Biochem Biophys 342, 244-253.
Thomas, W.R., Hales, B.J. and Smith, W.-A. (2005) Structural biology of allergens. Current
Allergy and Asthma Reports. 5:388-393
Valls, J.F.M., and Simpson, C.E. (2005). New species of Arachis (Leguminosae) from Brazil,
Paraguay and Bolivia. Bonplandia 14, 35-63.
146
APPENDIX A: Acknowledgements

147
I would like to thank my co-authors on Species, genomes and section relationships in
genus Arachis (Fabaceae): A molecular phylogeny (Chapter 2), which was recently submitted
for publication in Plant Systematics and Evolution. Drs. H. Tom Stalker and Shyam P. Tallury
from North Carolina State University provided DNA and leaf material from Arachis species. Dr.
Dietmar Quandt from Rheinische Friedrich-Wilhelms-Universität provided assistance and
guidance on sequence alignment phylogenetic analyses.
I would like to also thank Dr. Roy Pittman from the USDA Southern Regions PI station
for providing DNA and seed material from Arachis species, specifically section Trierectoides
species, Deborah Wiley for growing and maintaining plant samples, Chelsea Black and Daniel
Serrano Vople for their assistance in laboratory work.
The work towards Species, genomes and section relationships in genus Arachis
(Fabaceae): A molecular phylogeny (Chapter 2) was partially funded by the Virginia Academy
of Science, the American Society of Plant Taxonomist, and the Virginia Tech Graduate Research
Development Program.
I would like to thank William Joseph Allen, graduate student in the Department
Biochemistry at Virginia Tech, for Molecular Dynamics work on the Ara h 2 ortholog homology
models from wild Arachis species.

148
APPENDIX B: Homology Model Assessment

149
Table B.1 Summary of Ramachandran plots for Ara h 2 orthologs models assessed by PROCHECK.
Species Length Percent of Residues in
Favored Additionally
Allowed
Generously
Allowed Disallowed
A. batizocoi 165 84.4 12.2 3.4 0.0
A. dardani 155 86.4 11.6 1.4 0.7
A. duranensis/
Ara h 2.01
160 88.1 9.8 2.1 0.0
A. glandulifera 170 86.0 12.0 1.3 0.7
A. guarantica 160 84.5 12.7 2.8 0.0
A. ipaensis/
Ara h 2.02
172 85.4 10.6 3.3 0.7
A. macedoi 156 84.6 11.9 2.8 0.7
A. palustris 176 79.9 16.9 3.2 0.0
A. paraguariensis 155 87.7 11.6 0.7 0.0
A. pintoi 158 85.8 11.3 2.1 0.7
A. rigonii 155 86.3 10.8 2.9 0.0
A. triseminata 158 84.7 12.5 0.7 2.1
.
Table B.2 Overall Model Quality z-score for Ara h 2 ortholog models assessed by ProSA, with scores
from species within section Arachis on the left and those from other sections of Arachis on the right. For
Ara h 2 orthologs from species outside section Arachis, the section is noted within parentheses
Species z-score Species z-score
Ara h 6 (1W2Q) -5.84
A. batizocoi (Arachis) -3.41 A. pintoi
(Caulorrhizae)
-3.63
A. duranensis/Ara h 2.01
(Arachis)
-3.89 A. paraguariensis
(Erectoides)
- 3.92
A. glandulifera (Arachis) -3.53 A. macedoi
(Extranervosae)
-3.15
A. ipaensis/ Ara h 2.02
(Arachis)
-3.53 A. dardani
(Heteranthae)
-3.50
A. palustris (Arachis) -3.17 A. rigonii
(Procumbentes)
-3.31
A. guarantica
(Trierectoides)
-3.68
A. triseminata
(Triseminatae)
-3.21

150
ANOLEA energy plots for Ara h 6 (PDB ID 1W2Q) and Ara h 2 orthologs
Figure B.1 ANOLEA energy plot for Ara h 6 (PDB ID 1W2Q) template from the crop, A. hypogaea.
Negative (favorable) energies are in green, while positive (unfavorable) energies are in red.
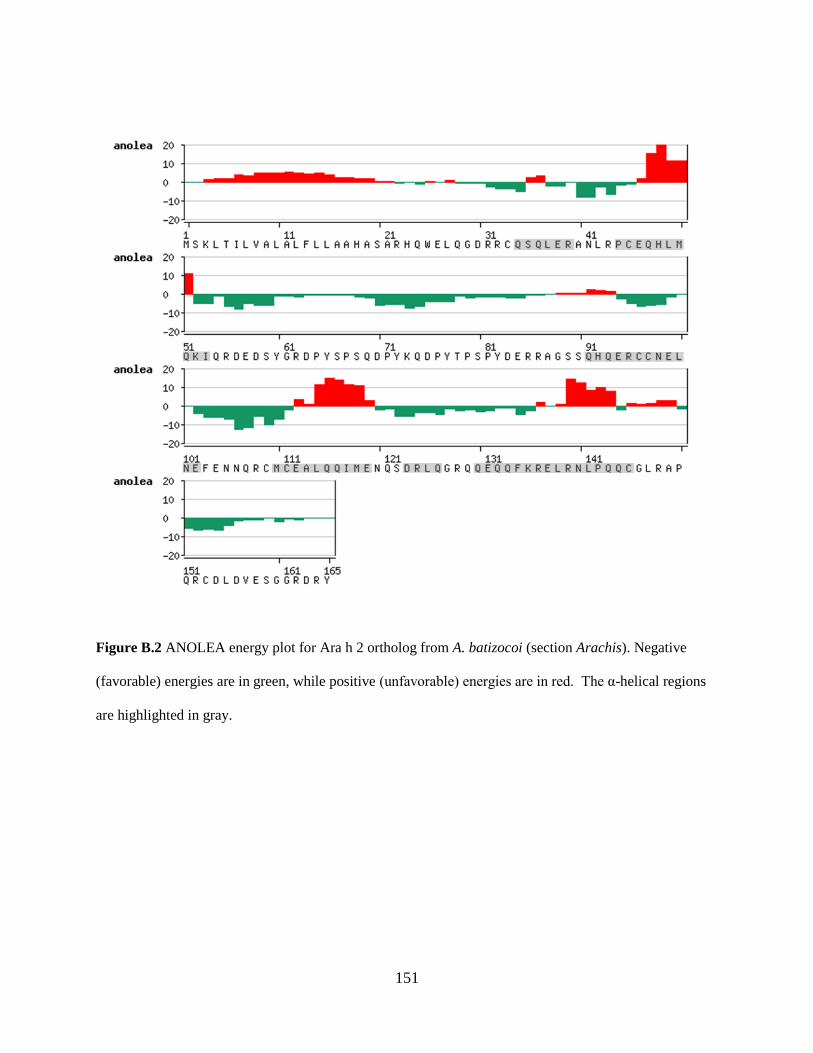
151
Figure B.2 ANOLEA energy plot for Ara h 2 ortholog from A. batizocoi (section Arachis). Negative
(favorable) energies are in green, while positive unfavorable) energies are in red. The α-helical regions
are highlighted in gray.

152
Figure B.3 ANOLEA energy plot for Ara h 2 ortholog from A. duranensis/A. hypogaea Ara h 2.01
(section Arachis). Negative (favorable) energies are in green, while positive (unfavorable) energies are in
red. The α-helical regions are highlighted in gray. For the H2-H3 loop, there were some residues with
positive energies that could be related to its extended conformation.
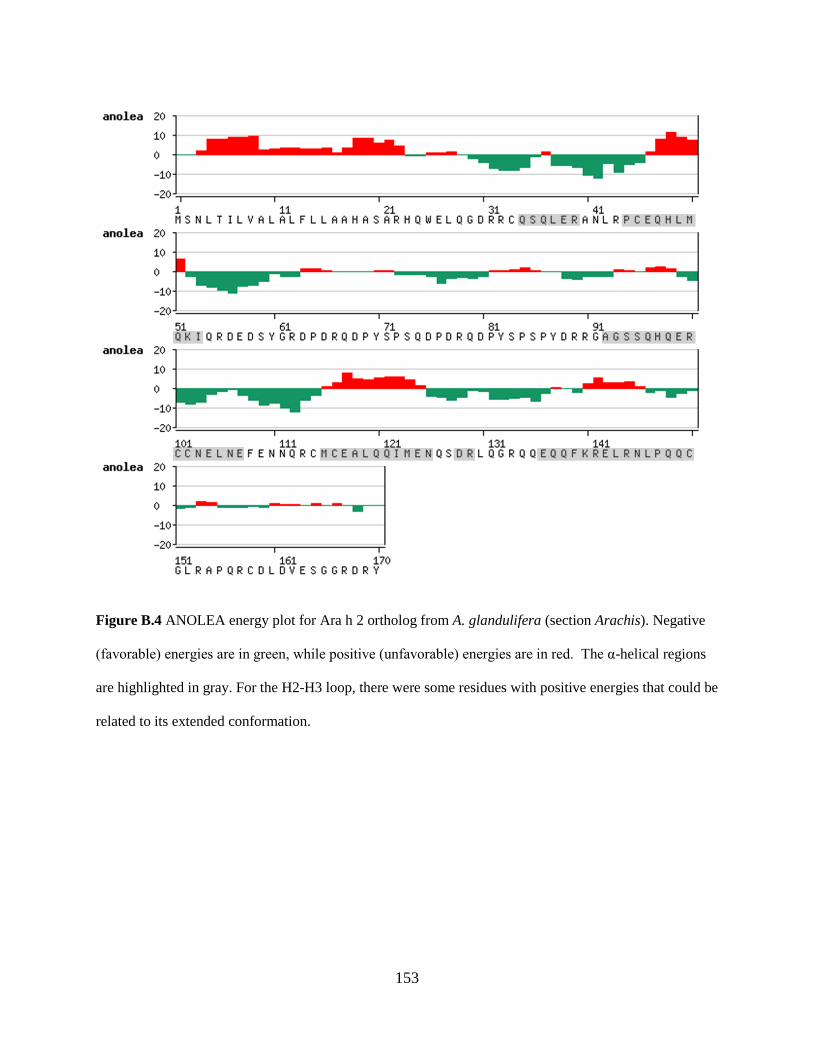
153
Figure B.4 ANOLEA energy plot for Ara h 2 ortholog from A. glandulifera (section Arachis). Negative
favorable) energies are in green, while positive unfavorable) energies are in red. The α-helical regions
are highlighted in gray. For the H2-H3 loop, there were some residues with positive energies that could be
related to its extended conformation.

154
Figure B. 5 ANOLEA energy plot for Ara h 2 ortholog from A. ipaensis/A. hypogaea Ara h 2.02 (section
Arachis). Negative (favorable) energies are in green, while positive (unfavorable) energies are in red.
The α-helical regions are highlighted in gray. For the H2-H3 loop, there were some residues with positive
energies that could be related to extended portions.

155
Figure B.6 ANOLEA energy plot for Ara h 2 ortholog from A. palustris (section Arachis). Negative
favorable) energies are in green, while positive unfavorable) energies are in red. The α-helical regions
are highlighted in gray. For the H2-H3 loop, there were some residues with positive energies that could be
related to extended portions.

156
Figure B.7 ANOLEA energy plot for Ara h 2 ortholog from A. pintoi (section Caulorrhizae). Negative
favorable) energies are in green, while positive unfavorable) energies are in red. The α-helical regions
are highlighted in gray. For the H2-H3 loop, there were some residues with positive energies that could be
related to extended portions.

157
Figure B.8 ANOLEA energy plot for Ara h 2 ortholog from A. paraguariensis (sec. Erectoides).
Negative (favorable) energies are in green, while positive unfavorable) energies are in red. The α-helical
regions are highlighted in gray. For the H2-H3 loop, there were some residues with positive energies that
could be related to extended portions.

158
Figure B.9 ANOLEA energy plot for Ara h 2 ortholog from A. macedoi (section Extranervosae).
Negative favorable) energies are in green, while positive unfavorable) energies are in red. The α-helical
regions are highlighted in gray. For the H2-H3 loop, there were some residues with positive energies that
could be related to extended portions.

159
Figure B.10 ANOLEA energy plot for Ara h 2 ortholog from A. dardani (sec. Heteranthae). Negative
favorable) energies are in green, while positive unfavorable) energies are in red. The α-helical regions
are highlighted in gray. For the H2-H3 loop, there were some residues with positive energies that could be
related to extended portions.

160
Figure B.11 ANOLEA energy plot for Ara h 2 ortholog from A. rigonii (section Procumbentes).
Negative favorable) energies are in green, while positive unfavorable) energies are in red. The α-helical
regions are highlighted in gray. For the H2-H3 loop, there were some residues with positive energies that
could be related to extended portions.

161
Figure B.12 ANOLEA energy plot for Ara h 2 ortholog from A. guarantica (section Trierectoides).
Negative (favorable) energies are in green, while positive unfavorable) energies are in red. The α-helical
regions are highlighted in gray. For the H2-H3 loop, there were some residues with positive energies that
could be related to extended portions.
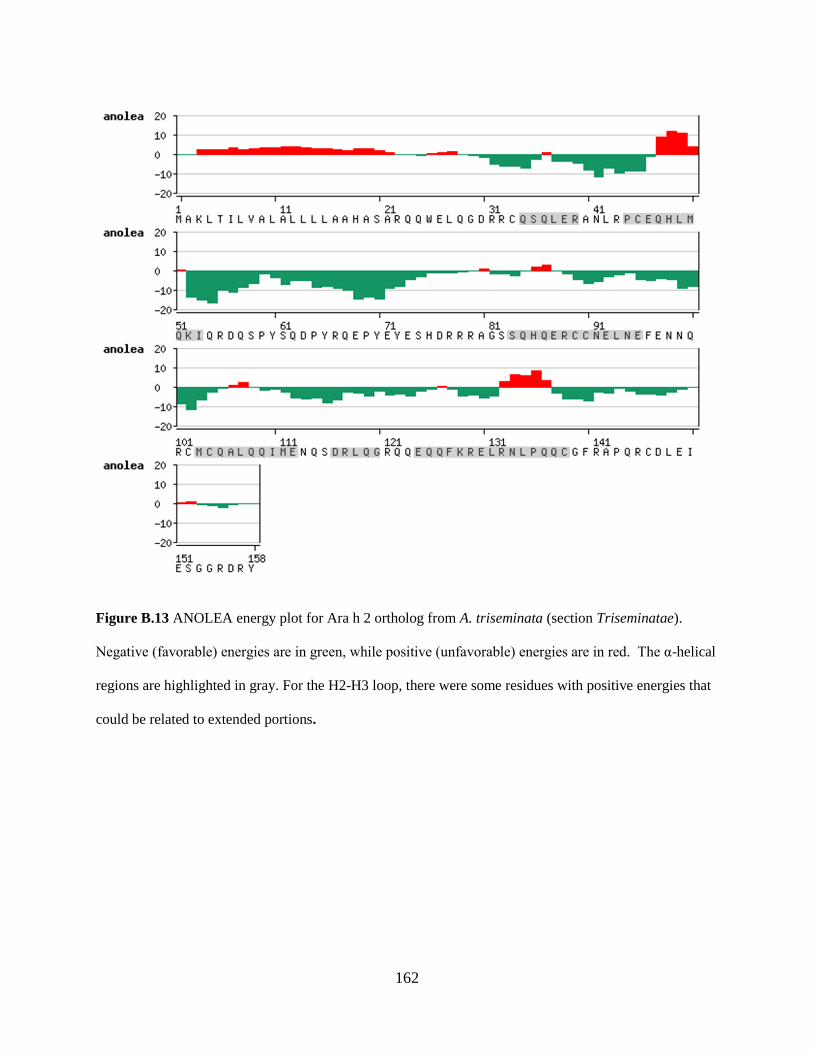
162
Figure B.13 ANOLEA energy plot for Ara h 2 ortholog from A. triseminata (section Triseminatae).
Negative favorable) energies are in green, while positive unfavorable) energies are in red. The α-helical
regions are highlighted in gray. For the H2-H3 loop, there were some residues with positive energies that
could be related to extended portions.
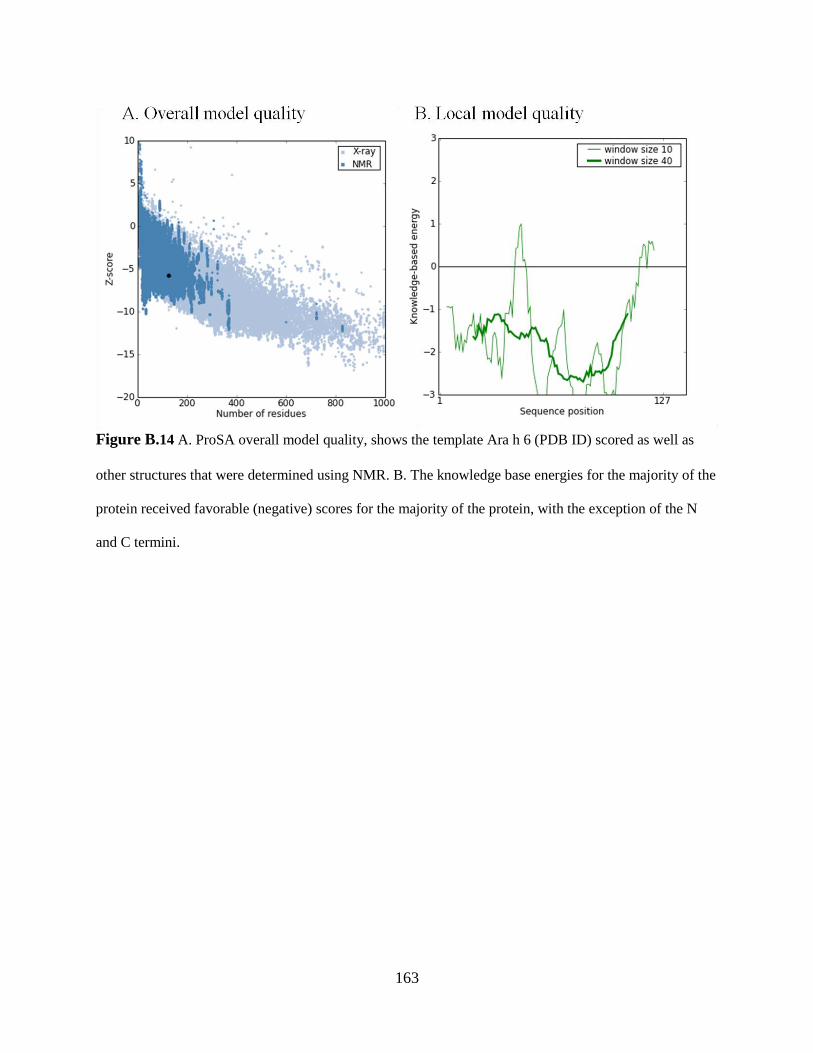
163
Figure B.14 A. ProSA overall model quality, shows the template Ara h 6 (PDB ID) scored as well as
other structures that were determined using NMR. B. The knowledge base energies for the majority of the
protein received favorable (negative) scores for the majority of the protein, with the exception of the N
and C termini.

164
Figure B.15 A. ProSA overall model quality, shows the model of the A. batizocoi Ara h 2 ortholog
scored as well as an NMR-determined structure. B. The knowledge base energies for the majority of the
protein received favorable (negative) scores for the majority of the protein, with the exception of the N
and C termini.

165
Figure B.16 A. ProSA overall model quality, shows the model of the A. dardani (section Heteranthae)
Ara h 2 ortholog scored as well as an NMR-determined structure. B. The knowledge base energies for the
majority of the protein received favorable (negative) scores for the majority of the protein, with the
exception of the N and C termini.

166
Figure B.17 A. ProSA overall model quality, shows the model of the A. duranensis/ Ara h 2.01scored as
well as an NMR-determined structure. B. The knowledge base energies for the majority of the protein
received favorable (negative) scores for the majority of the protein, with the exception of the N and C
termini.

167
Figure B.18 A. ProSA overall model quality, shows the model of the A. glandulifera Ara h 2 ortholog
scored as well as an NMR-determined structure. B. The knowledge base energies for the majority of the
protein received favorable (negative) scores for the majority of the protein, with the exception of the N
and C termini.
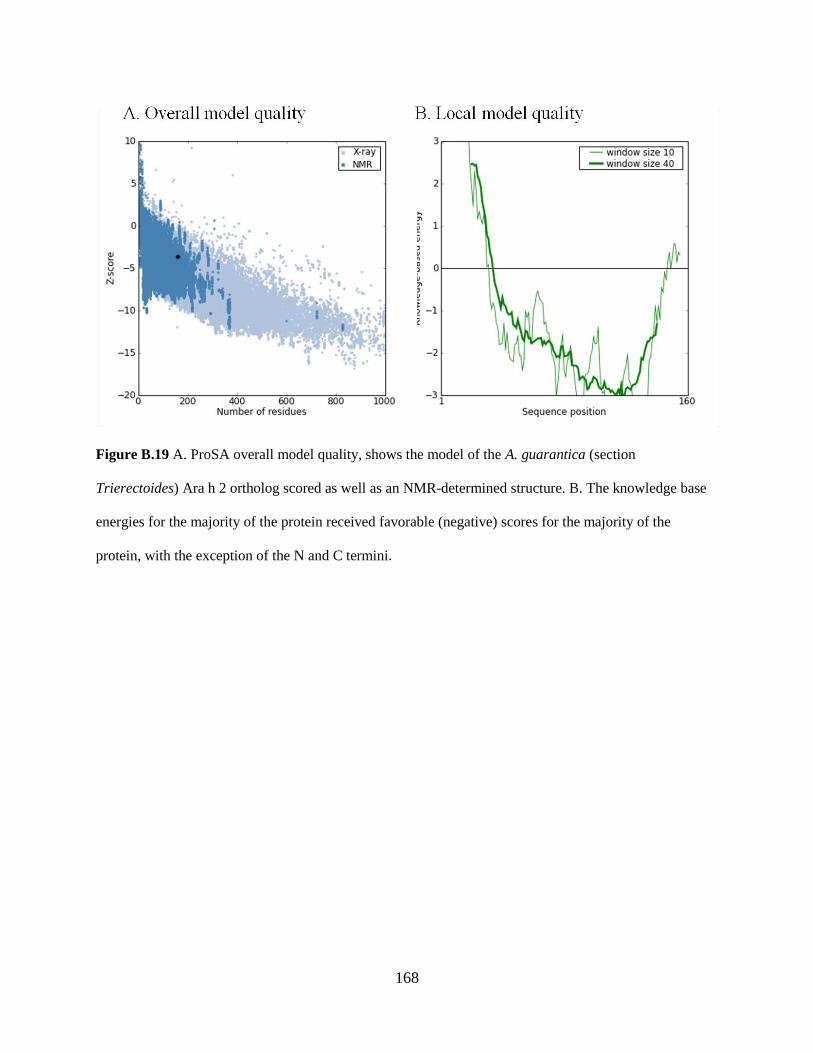
168
Figure B.19 A. ProSA overall model quality, shows the model of the A. guarantica (section
Trierectoides) Ara h 2 ortholog scored as well as an NMR-determined structure. B. The knowledge base
energies for the majority of the protein received favorable (negative) scores for the majority of the
protein, with the exception of the N and C termini.

169
Figure B.20 A. ProSA overall model quality, shows the model of the A. ipaensis/Ara h 2.02
ortholog scored as well as an NMR-determined structure. B. The knowledge base energies for
the majority of the protein received favorable (negative) scores for the majority of the protein,
with the exception of the N and C termini.

170
Figure B.21. A. ProSA overall model quality, shows the model of the A. macedoi (section
Extranervosae) Ara h 2 ortholog scored as well as an NMR-determined structure. B. The knowledge base
energies for the majority of the protein received favorable (negative) scores for the majority of the
protein, with the exception of the N and C termini.
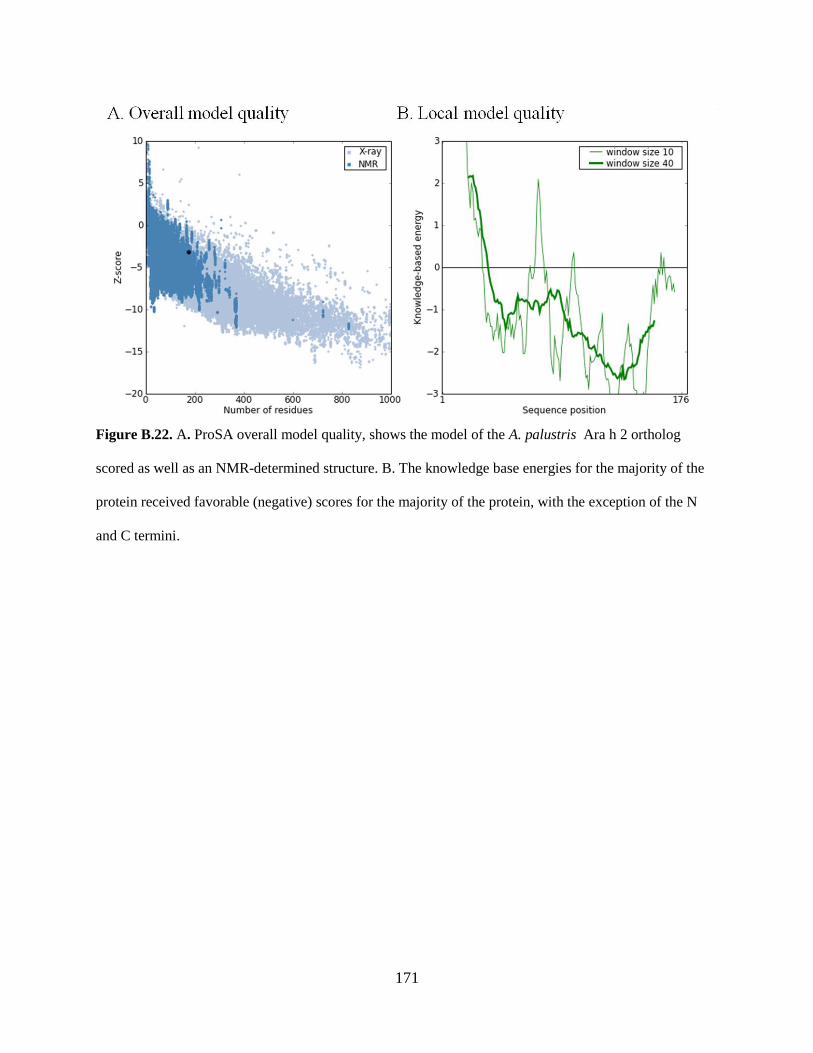
171
Figure B.22. A. ProSA overall model quality, shows the model of the A. palustris Ara h 2 ortholog
scored as well as an NMR-determined structure. B. The knowledge base energies for the majority of the
protein received favorable (negative) scores for the majority of the protein, with the exception of the N
and C termini.

172
Figure B.23 A. ProSA overall model quality, shows the model of the A. paraguariensis (section
Erectoides) Ara h 2 ortholog scored as well as an NMR-determined structure. B. The knowledge base
energies for the majority of the protein received favorable (negative) scores for the majority of the
protein, with the exception of the N and C termini

173
Figure B.24 A. ProSA overall model quality, shows the model of the A. pintoi (section Caulorrhizae) Ara
h 2 ortholog scored as well as an NMR-determined structure. B. The knowledge base energies for the
majority of the protein received favorable (negative) scores for the majority of the protein, with the
exception of the N and C termini.

174
Figure B.25 A. ProSA overall model quality, shows the model of the A. rigonii (section Procumbentes)
Ara h 2 ortholog scored as well as an NMR-determined structure. B. The knowledge base energies for the
majority of the protein received favorable (negative) scores for the majority of the protein, with the
exception of the N and C termini

175
Figure B.26 A. ProSA overall model quality, shows the model of the A. triseminata (section
Triseminatae) Ara h 2 ortholog scored as well as an NMR-determined structure. B. The knowledge base
energies for the majority of the protein received favorable (negative) scores for the majority of the
protein, with the exception of the N and C termini.

176
APPENDIX C: Predicted Secondary Structure and Epitopes among
Ara h 2 Orthologs from Arachis Species

177
Figure C.1 Secondary structure prediction using PROFsec. Predicted α-helical regions are highlighted in red. Five helices were predicted to be
present throughout the protein.

178
Table C.1 Linear and conformational epitopes predicted by ElliPro server. Residues that were predicted to be potential IgE binding regions are
reported for both linear (left) and conformational (right) epitopes.
Species
Residues predicted as
epitopes Linear Epitopes
Conformational Scores Number Percent Positions Sequence Score
Ara h 2.01 (A. duranensis)
86/48 53.8/28.8 1-29 MAKLTILVALALFLL
AAHASARQQWELQG 0.794 S73, P74, S75, P76, Y77 0.975
64-83 PYSPSQDPYSPSPYDR
RGAG 0.77 M1, A2, K3, T5, I6, L7, V8, A9,
L10, A11, L12, L14 0.903
118-128 DRLQGRQQEQQ 0.666 S66, P67, S68, Q69, D70, P71,
D78, R79, R80 0.781
54-59 QRDEDS 0.605 L15, A16, A17, H18, A19, S20,
A210.770 0.770
140-148 CGLRAPQRC 0.603 Q124, E126, Q127 0.712 G122, R123, Q125 0.702
Q54, E57, D58 0.642
R55, D56, E61 0.554
G81, A82, G83 0.506
A. batizocoi 91/54 55.1/32.7
1-31 MSKLTILVALALFLL
AAHASARHQWELQG
DR
0.805 A11, L12, F13 0.982
101-104 NEFE 0.680 T5, I6, L7, V8, A9, L10 0.889 122-130 DRLQGRQQ 0.647 D83, E84, R86 0.842
62-75 RDPYSPSQDPYKQD 0.611 L14, L15, A16, A17, H18, A19,
S20, A21, R22 0.789
77-95 YTPSPYDERRAGSSQ
HQER 0.604 Q28, G29, D30 0.717
145-153 CGLRAPQRC 0.589 G127, R128, Q129, Q130 0.689 A87, G88, S89, Q91, H92 0.623
R55, D56, D58, S59 0.597

179
A. glandulifera 95/61 55.9/35.9 1-28 MSNLTILVALALFLL
AAHASARHQWELQ 0.814 T5, I6, L7, V8, A9, L10, A11,
L12 0.941
78-97 RQDPYSPSPYDRRGA
GSSQH 0.701 S83, P84, S85, P86 0.934
57-76 EDSYGRDPDRQDPYS
PSQDP 0.642 M1, S2, N3, L15, A16, A17,
H18, W25, E26, L27 0.791
153-170 RAPQRCDLDVESGGR
DRY 0.598 D161, V162, E163 0.788
127-135 SDRLQGRQQ 0.592 A19, S20, A21, R22 0.707 D58, S59, G61, R62, D63, P64,
D65, R66, Q67, D68, P69, Y70 0.694
Q79, D80, P81 0.688
G91, A92, G93, S94, Q96 0.678
S71, P72, S73, D75, P76 0.636
Y87, D88, R90 0.537
S164, G165, G166, D168 0.512
A. ipaensis 96/68 55.8/39.5 1-29 MAKLTILVALALFLL
AAHASARQQWELQG 0.827 M1, A2, K3, L4, T5, I6, L7, V8,
A9, L10, A11, L12, F13, L14,
L15, A16, A17, H18, A19, S20,
A21, R22
0.898
55-68 RDEDSYGRDPYSPS 0.719 S73, P74, S75, Q76, D77, P78,
D79, R80, Y84, D90, R92 0.718
85-98 SPSPYDRRGAGSSQ 0.660 R91, G93, A94, G95, S96, Q98 0.686 71-82 PYSPSQDPDRRD 0.629 R55, D56, E57, Y60, G61, R62,
D63, P64, Y65, R135, Q137 0.682
130-137 DRLQGRQQ 0.612 S66, P67, S68 0.618 154-172 LRAPQRCDLEVESGG
RDRY 0.602 Q23, E26, L27, Q28, G29 0.597
S85, P86, S87, P88 0.576
L162, E165, S166, G167, G168,
R171 0.567

180
A. palustris 91/50 55.1/28.4 1-31 MAKLTILVALALFLL
AAHASARQQWELQG
DR
0.812 L4, T5, I6, L7, V8, A9, L10,
A11, L12 0.941
85-99 PSPYGPSPYARRRAG 0.729 G89, P90, S91, P92, Y93, R97 0.882 54-67 QRDEDSSYGRDPDR 0.651 A16, A17, H18 0.877
156-164 CGLRAPQRC 0.623 Q24, E26, Q28 0.816 136-143 LQGRQQEQ 0.574 M1, A2, K3 0.807 112-119 NEFENNQR 0.550 P85, S86, P87, Y88 0.690
71-82 YSPSQDPDREDP 0.538 R55, D56, E57, Y61, G62, R63,
D64, P65, D66 0.684
R79, E80, D81, P82 0.609
A19, S20, A21, R22 0.554
N109, N112, C156, G157, L158 0.516
A. pintoi
(Caulorrhizae) 86/33 54.4/20.9 1-29 MSKLTILVALALFLL
AAHASARQQWELRG 0.785 M1, S2, K3 0.945
63-82 DPYSPSPYGPSPYDR
RHAGS 0.755 L7, V8, A9, L10, A11, L12 0.936
116-125 DRLQGRQQEQ 0.771 L4, T5, I6 0.865 153-158 GGRDRY 0.635 A16, A17, H18 0.783 138-151 CGLRSPQRCDLDVE 0.564 Y65, S66, P67, S68, P69, G71,
P72, S73, P74, Y75, H79, A80,
G81, S82, S83
0.735
54-60 QREEDQY 0.502 A19, S20, A21, R22 0.722 G153, G154, R155, R157 0.593
D147, L148, D149, V150, E151
0.558

181
A. paraguariensis
(Erectoides) 85/33 54.8/21.3 1-32 MSKFTILVALALFLL
AAHASARQQWELQG
DRR
0.805 F4, T5, I6 0.951
54-61 QRDEDSYE 0.698 L7, V8, A9, L10, A11, L12, F13
0.941
113-123 DRLQGRQQEQQ 0.687 G71, P72, S73, P74 0.827 64-77 PYGPSPYGPSPRRA 0.623 H18, A19, S20, A21, R22, Q23 0.819 91-98 NEFENDQR 0.560 L15, A16, A17 0.705
132-143 PQQCDLRAPQRC 0.509 A139, P140, Q141 0.699 Q54, R55, D56, E57 0.698
P67, S68, P69 0.555
A. macedoi
(Extranervosae) 92/54 59/34.6 1-29 MSKLTILVALALFLL
AAHASARQQWELQG 0.799 L7, V8, A9, L10, A11, L12, F13 0.950
59-86 QYEQDPYRQDPYDS
YDRRHTGSSQHQER 0.683 K3, T5, I6 0.878
134-156 QQCGLRAPQRCDLDI
ESGGRDRY 0.590 Q67, D68, P69, Y70, D71, S72,
D74,R75, R76 0.811
92-95 NEFE 0.556 L15, A16, A17, H18, A19, S20,
A21, R22 0.808
114-121 DRLQGRQQ 0.535 Q59, E61, D63, P64, Y65, R66 0.657 T78, G79, S80, S81, Q82, H83 0.634
E26, L27, Q28 0.630
G118, R119, Q120 0.630
A. dardani
(Heteranthae) 83/78 51.9/46.3 1-29 MSKLTILVALALFLL
AAHASARQQWELQG 0.832 M1, S2, K3, L4, T5, I6, L7, V8,
A9, L10, A11, L12, F13, L14,
L15, A16, A17, H18, A19, S20,
A21, R22, Q23, Q24, W25, E26,
L27, Q28, G29, D30
0.818
115-122 LQGRQQEQ 0.658 A139, P140, Q141, R142 0.782 55-81 RDEDSYEQDPYGPSP
YGPSPRRAGSSQ 0.638 Q54, R55, D56, E57, D58, S59,
E61, Q62, D63, P64, Y65, G66,
P67, S68, P69, Y70, G71, P72,
0.638

182
S73, P74, R75, R76, A77, G78,
S79, S80, Q81 151-155 GRDRY 0.592 L115, Q116, G117, R118, Q120,
E121, Q122, D153 0.619
135-148 CDLRAPQRCDLDVE 0.59 D144, L145, D146, V147, E148 0.603
A. rigonii
(Procumbentes) 91/53 58.7/34.2 1-30 MAKLTILVALALFLL
AAHASARQQWELQG
D
0.811 M1, A2, K3, L4, T5, I6, L7, V8,
A9, L10, A11, L12, F13, L14,
L15, A16, A17, H18, A19, S20,
A21, R22
0.868
54-82 QRDEDSYEQDPYSPS
PYGPSPRRAGSSQH 0.658 D58, S59, Y60 0.744
113-120 DRLQGRQQ 0.594 G71, P72, S73, P74 0.735 135-149 CDLRAPQRCDLDVES 0.594 R55, D56, E57 0.695
91-94 NEFE 0.537 D146, V147, E148 0.680 151-155 GRDRY 0.512 R75, R76, A77, G78, S79, S80,
Q81 0.658
G117, R118, Q120 0.647
S66, P67, S68, P69 0.545
L27, Q28, G29, D30 0.542
A. guarantica
(Trierectoides) 89/56 55.6/35 1-25 MAKLTILVALALFLL
AAHASARQQW 0.818 V8, A9, L10, A11, L12, F13 0.975
54-86 QRDEDSYEQDPYRQ
DPYGPSPYGPSPRRA
GSSQ
0.674 M1, A2, K3 0.927
118-127 DRLQGRQQEQ 0.659 L4, T5, I6, L7 0.881 140-160 CDLRAPQRCDLDVES
GGRDRY 0.590 G76, P77, S78, P79, R80 0.871
R66, Q67, D68, P69, Y70, G71,
P72, S73, P74, Y75 0.812
G122, R123, Q124 0.746
L150, D151, V152, E153 0.675
A19, S20, A21 0.673
D56, E57, R119 0.642
R55, D58, S59, E61 0.625
L120, Q121, Q125 0.575

183
S154, G155, G156 0.575
R81, A82, G83, S84, Q86 0.568
A. triseminata
(Triseminatae) 92/42 58.3/26.6 1-31 MAKLTILVALALLLL
AAHASARQQWELQG
DR
0.794 V8, A9, L10, A11, L12, L13 0.964
72-85 YESHDRRRAGSSQH 0.706 A16, A17, H18, A19, S20, A21,
R22 0.838
54-70 QRDQSPYSQDPYRQE
PY 0.628 R55, D56, S58, P59, Y60, R117,
G120, R121 0.754
115-126 SDRLQGRQQEQQ 0.597 E73, S74, H75 0.736 138-146 CGFRAPQRC 0.523 R78, R79, A80, G81, S82, S83,
Q84 0.687
148-151 LEIE 0.522 K3, L4, T5 0.624 154-158 GRDRY 0.518 S61, Q62, D63, P64, Y65 0.619
G29, D30, R31 0.549 Table C.2 Conformational epitopes predicted by the DiscoTope server based on the Ara h 2 models. Predictions were made with a threshold
value of -7.7.
Species Residues Included
Conformational Epitopes Number Percent
A. hypogaea (Ara h 2.01)/
A. duranensis
95 59.4% 1M, 21A-32R, 43R, 47Q, 49L-87H,
97-98F, 102Q, 113M-135N, 138Q,
144A-147R, 150L-160Y
A. batizocoi
103 62.4% 1M-2S, 22R-32R, 35S, 39R, 43R,
47Q, 49L-92H, 102E-103F, 107Q,
118M-140N, 143Q, 149A-152R,
155L-165Y

184
A. glandulifera
102 60% 22R-25W, 28Q-32R, 35S, 39R, 43R,
47Q, 49L-97H, 108F, 110N, 112Q,
124E-145N, 148N, 154A-157R,
160L-170Y
A. ipaensis
109 63.4% 1M, 22R-32R, 35S, 39R, 43R, 47Q,
49L-99H, 109E-110F, 113N-114Q,
125M-147N, 150Q, 156A-159R,
163E-172Y
A. palustris
102 58% 1M-2A, 21A-33C, 35S, 39R, 43R,
47Q, 49L-103H, 114F, 117N, 129M-
151N, 154Q, 160A-162Q, 166L-
176Y
A. pintoi
(Caulorrhizae)
95 60.1% 1M-2S, 24Q-32R, 35S, 49L-85H,
95E-96F, 100Q, 111M-130E, 132R-
133N, 136Q, 139G, 142S-145R,
148L-158Y

185
A. paraguariensis
(Erectoides)
93 60% 1M-2S, 22R-33C, 35S, 39R, 43R,
47Q, 49L-87H, 98F, 101N, 114E-
135N, 138N, 144N-147R, 150L-160Y
A. macedoi
(Extranervosae)
90 57.7% 1M, 21A-33C, 35S, 39R, 43R, 47Q,
49L-83H, 93E-94F, 109M-131N,
134Q, 140A-142Q, 146L-156Y
A. dardani
(Heteranthae)
93 60% 1M-2S, 22R-33C, 35S, 39R, 35S,
39R, 43R, 47Q, 49L-82H, 93F, 96D,
108M-130D, 133Q, 139A-142R,
145L-155Y
A. rigonii
(Procumbentes)
91 57.4% 1M, 22R-32R, 35S, 39R, 43R, 47Q,
49L-82H, 92E-93F, 109E-130N,
133E, 139A-142R, 145L-155Y
A. guarantica
(Trierectoides)
94 58.8% 1M, 21A-32R, 35S, 39R, 43R, 47Q,
49L-87H, 97E-98F, 102N, 114E-
135N, 138Q, 141D, 144A-147R,
150L-160Y
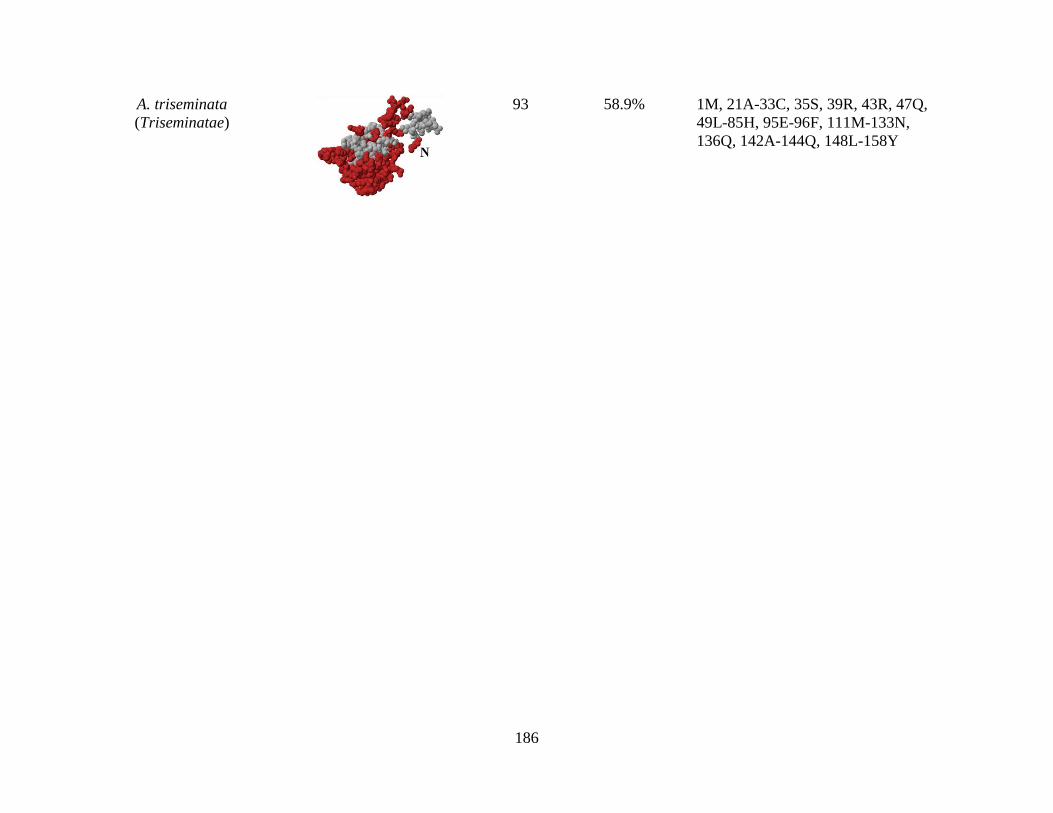
186
A. triseminata
(Triseminatae)
93 58.9% 1M, 21A-33C, 35S, 39R, 43R, 47Q,
49L-85H, 95E-96F, 111M-133N,
136Q, 142A-144Q, 148L-158Y