Embed Size (px)
Citation preview

Additional Webinar Information
1 | P a g e
Using Work-Sample Physical Ability Tests to Maintain Fitness Standards of Incumbent Firefighters
Daniel A. Biddle, Ph.D; CEO, Fire & Police Selection, Inc.
Stacy L. Bell, M.S.; Vice President, Fire & Police Selection, Inc.
In 2000, the National Fire Protection Agency made a bold but profound
statement: “Overweight, out-of-shape fire fighters are an accident waiting to happen”
(NFPA, 2000). While the statement can be supported by common sense alone, research
data shows just how true this statement really is. For example, a 2005 study revealed that
nearly 50% of all injuries to civilian firefighters in that year were a result of sprains,
strains, and muscular pain—whereby overexertion is considered the primary causative
factor (NIST, 2005). Additionally, over 59% of all on-duty firefighter fatalities in the
United States in 2011 were caused by stress and/or overexertion which resulted in a heart
attack (FEMA, 2011).
Firefighters are charged with the serious responsibility of ensuring the safety of
their crew and the public. Fire departments are motivated to reduce worker compensation
claims, thereby reducing employment costs, which only constitutes some of the costs
related to firefighter injuries. After tallying all of the costs related to firefighter injuries in
2002, NIST estimates the annual price to fall between $2.8 and $7.8 billion (NIST, 2005).
This background shows why many fire department executives are passionate
about ensuring the high fitness levels of their active fire suppression personnel. While
this may be the case, a national research survey of 185 chief-level fire officers1 revealed
that only 25% of fire departments use physical ability tests (PATs) as annual
maintenance standards for ensuring the fitness levels of their incumbent fire suppression
personnel. This survey revealed that a much higher percentage (88%) use PATs for pre-
screening firefighters. So, while fire departments seem intent on screening fit candidates
into their departments, maintenance testing programs are not typically put into place to
continually ensure the fitness level of incumbent fire personnel.
1 The study was conducted by the authors in 2011. The survey sample included 151 Fire Chiefs, 12
Assistant Fire Chiefs, 8 Battalion Chiefs, 6 Deputy Chiefs, 4 Deputy Fire Chiefs, 4 Division Chiefs (185
total). The average department size was 123, with an average of 109 active fire suppression personnel. The
smallest department included had 9 full-time employees; the largest had 1,790.
Additional Webinar Information
2 | P a g e
This is not because fire departments do not believe in the importance of ongoing
testing. Indeed, this same survey revealed that 93% of the fire chiefs believed that,
“Active Fire Suppression Personnel should be tested annually to ensure that they possess
the minimum physical abilities necessary to successfully perform the job.” This shows
overwhelming support for using PATs as a maintenance standard. So, why is there such a
gap between this 93% endorsement and the fact that only 25% of fire departments
actually use PATs for maintenance standards? Is it the union? Fear of employment
lawsuits from personnel who cannot pass the PAT test standard? The answers likely
differ from department to department.
Regardless of the reasons behind why the majority (75%) of fire departments do
not use a maintenance standard, the reasons for installing a PAT as a maintenance
standard are worth serious consideration. In addition to the injuries, the costs from
injuries, and the importance of protecting and preserving life and property, there is the
fact that firefighters simply age after they start the job, and aging has a direct impact on
fitness levels. For example, one study2 involving 256 incumbent fire suppression
personnel (with an average age of 34.83 years) revealed a very high correlation (r = .397)
between age and test scores (in seconds) on a work sample PAT. This correlation
translates to roughly five seconds slower per year.
To put this into perspective, a 25 year-old firefighter has a predicted score on the
work sample PAT of about eight minutes, whereas a 50 year-old firefighter has a
predicted score of ten minutes. This two-minute score difference is attributable to age
alone. This trend clearly indicates that age, if left to its natural process without fitness
training interventions, will gradually move a minimally-qualified firefighter who (at age
25) barely passed the job-related minimum cutoff score (9 minutes and 34 seconds on this
particular PAT), to a score that is one full minute slower in just 12 years.
This phenomenon presents fire departments with three options: (1) do nothing and
cope with a workforce with naturally declining physical abilities, (2) install a wellness
program and hope that job-related standards associated with important fire suppression
tasks are positively impacted, or (3) install a wellness program coupled with an annual
maintenance standard using a work sample PAT. The latter option actually ensures that
active fire suppression personnel will maintain job performance standards.
Departments that adopt work sample PATs as an annual maintenance standard
must address three controversial issues: (1) selecting an appropriate cutoff time for the
test (the same time used for entry level or slower/faster), (2) choosing which positions
will be selected for the annual testing requirement, and (3) identifying the steps that will
2 Study conducted by FPSI (2011) involving firefighter incumbents from over 40 fire departments on a
single PAT.
Additional Webinar Information
3 | P a g e
be taken with incumbents who cannot pass the annual test, even after repeated retest
opportunities. These issues are addressed next.
Selecting a Cutoff Time for an Applicant or Incumbent Work Sample PAT
Taking the proper steps to develop validated cutoff scores for continuously-timed
“work sample style” PATs, for both applicant (pre-hire) and incumbent (post-hire)
populations, will help insure both fairness and defensibility in court. Part of this process
should specifically address the criteria in the Uniform Guidelines regarding the normal
expectations of acceptable proficiency in the workforce (Section 5H) and other relevant
criteria from federal and professional testing standards.
When it comes to setting cutoff scores that represent the normal expectations of
acceptable proficiency in the workforce, it might seem natural to simply run a sample of
incumbents through the PAT and set the cutoff score at the average time that it took
incumbents to complete the test. There are several problems with this approach, the first
being that such an approach would assume that about one-half of the workforce (i.e.,
those that scored below the average) are inadequate performers.1 In addition, there are
four additional challenges:
1. Possible skill advantage of the incumbent workforce.
2. Influential outliers.
3. Sampling error.
4. Test unreliability.
Each of these will be discussed below.
Possible Skill Advantage of the Incumbent Workforce
The goal of a PAT used for screening entry-level applicants is to measure their
ability to perform the requirements of the job at a level required on the first day of
employment (i.e., before training or on-the-job experience) (see Section 14C1 of the
Guidelines). Measuring the performance levels of the current workforce can provide
useful information on setting cutoff scores for untrained applicants, but not without some
complications that first need to be addressed:
1. The incumbent workforce with less than one year of experience can sometimes
have higher ability levels on the work sample tasks included on the test. This is
due to their recent completion of the training academy (where some of the
training is targeted at improving their underlying ability and fitness levels, as well
as their job-specific skills). In many circumstances, this advantage is short-lived
and is not continued through job tenure (unless it is sustained through on-going
physical training).
Additional Webinar Information
4 | P a g e
2. The incumbent workforce may possess skill levels that are higher than entry-level
applicants, even if the applicants possess identical levels of the underlying
abilities measured by the PAT. This may result from post-academy time on the
job to practice the work behaviors that may be represented on the PAT. Although
(valid) work-sample style PATs should exclude test content that is “learned in a
brief orientation” or “trained on the job” (these are two typical ratings in PAT
content validation studies designed to address Section 14C1 of the Guidelines), it
may not be possible to remove all skills and techniques that may give incumbents
an advantage when completing the PAT. Even if the test is completely free of
such content, there is still a possibility that incumbents, through their regular
practice and application of the work behaviors that are similar to those
represented on the test, may have an advantage. This “incumbent advantage” may
be 1%, 5%, 10%, or higher, but is likely present in most PATs.
Influential Outliers
Most groups of incumbents selected to complete a PAT (especially when the
purpose is to set a cutoff that will be used for setting a maintenance or “return-to-duty”
standard that will be applied to the same group) will typically include one or more
“exceptionally high” and “exceptionally low” incumbent scores. These “outlier” scores
have more influence on the mean and the variability of the sample because of how the
underlying math works for computing both of these statistics. These outliers are
sometimes referred to by statisticians as “influential data points” because they are outside
of the normal range of the score distribution. For this reason, these outliers be identified
and removed from the data set using the process described below.
Sampling Error
The average score that is derived from running the incumbent workforce through
the PAT is subject to sampling error. Unless the entire workforce runs through the PAT,
the average obtained from running the sample of incumbents through the test will be
subject to natural variability that occurs around the central parts of the distribution. This
sampling error (called the Standard Error of the Mean, or SE Mean) is 0 when the entire
workforce runs through the PAT, and increases in value when the sample selected is
small (in an absolute sense) and the sample selected is small relative to the population
from which it was chosen.
By definition, the SE Mean is the confidence interval that surrounds the average
derived from the sample. For example, an average incumbent time of 300 seconds
obtained from a sample of 30 incumbents (who were selected from a population of 200)
with a Standard Deviation (SD) of 30 seconds will have a SE Mean of 5.06 seconds
(using the computations discussed below). This means that 68% of the additional samples

Additional Webinar Information
5 | P a g e
of 30 incumbents that are drawn from this population of 200 incumbents will likely
produce average scores between 295 seconds and 305 seconds (5 seconds above/below
the 300-second average obtained from the first draw of 30 incumbents). This variability
produces uncertainty about the average obtained from the first sample draw, but can be
accounted for by simply adding 1 SE Mean to the average.
Test Unreliability
Every assessment device used in personnel testing produces scores that are less-
than-perfect estimates of the examinee’s true ability level measured by the test.
Applicants who take a PAT are not exempt from this phenomenon, as they will achieve a
different score almost every time they take the PAT. The best way to estimate this
variability on a continuously-timed work sample PAT and develop a fixed confidence
interval around such hypothetical “repeat test scores” is to administer the test twice to a
group of incumbents (e.g., n > 50) and compute an ICC2 (a type of reliability estimate for
test-retest conditions) which can be combined with the Standard Deviation of scores to
produce a Standard Error of Measurement (SEM) using the formula:
SEM = ICCx 1
Where x is the Standard Deviation of test scores (from the first administration, where
examinees are less “practiced”) and ICC is test-retest reliability coefficient of the test. For
example, a test with an ICC value of .70 and a Standard Deviation of 50 would result in
an SEM of 27.39 ( 70.150 ).
Much like the Standard Deviation of test scores, the SEM can be used to estimate
boundaries around test scores. However, in the case of the SEM, the boundaries pertain to
an individual examinee’s true score, given their observed score. Observed scores are
simply that—the score that a researcher observes a certain examinee achieves. True
scores, however, represent the score that most accurately represents the examinee’s true,
actual ability level (as represented by the test). The true score can also be regarded as the
average score an examinee would achieve if they (hypothetically) completed the test
1,000 times.
For example, an examinee who scores 500 seconds on a first administration of the
test (i.e., the observed score) likely has a true score between 473 seconds and 527
seconds (1 SEM seconds below and above the observed score). This 1-SEM boundary
around the examinee’s observed score encapsulates their true score with 68% certainty.
Using 2 SEMs to establish this boundary sets the true score boundary with 95% certainty.
Additional Webinar Information
6 | P a g e
Because each examinee’s true score has a 50% likelihood of existing at or below
their observed score, and a 50% likelihood of existing at or above their observed score, a
researcher can determine the probability of an examinee’s true score existing at a certain
score or higher. This means that this examinee’s true score is 84% likely to exist at or
below a score of 527 seconds (the 500 second observed score plus 1 SEM (27) = 527
seconds). The 84% is determined by adding 34% (half of the 68% bi-directional
boundary obtained using 1 SEM) to the 50% likelihood that their true score is lower than
their observed score. Thus, the odds are about 6-to-1 (1 ÷ 16%) that this examinee’s true
score is at or below 527 seconds.
The SEM can be multiplied by the square root of two (2) to compute a Standard
Error of Difference (SED), which is a metric that is useful for establishing a confidence
interval between two scores. So, the SED is concerned with differentiating between the
true scores of examinees given their observed scores, whereas the SEM identifies the
range surrounding one examinee’s true score given their observed score. Using the
example above, the SED can be computed as: 2*SEM or 27.39 * 1.41421 = 38.73.
After computing the SED, the SED can be multiplied by a confidence interval
(e.g., 90%) to establish a specified degree of confidence regarding the distance (i.e.,
number of scores) above or below before reaching a score that represents a meaningfully
different ability level. In other words, the SED can be used to identify two true scores that
are reliably isolated in the score distributions so that the hypothetical “repeat test scores”
of two examinees would not likely overlap. For example, multiplying the SED by 1.645
and adding this product to the average score sets the 95% limit for scores that are reliably
within the “normal” upper range as marked by the average score. Using our example
above, we arrive at this “outside boundary score” as: 500 second (average) + SED (38.73)
* 95% Confidence Interval (1.645) = 63.71 = 564 seconds (rounded up). Thus, applicants
who score 564 seconds or faster are within the “normal range” (or faster), and applicants
who score slower than 564 seconds are outside of this “normal” range, and exist within
an ability range that is meaningfully outside of the “normal.”
Putting the Factors Together and Setting Cutoff Scores for Applicants and Incumbents
The discussion above demonstrates that setting cutoff scores that represent the
“normal expectations of acceptable proficiency of the workforce” is not as easy as testing
the incumbent workforce and using the average. Further, even using a simple descriptive
statistic (such as adding one standard deviation to the average), would not address the
four factors discussed above (the possible skill advantage of the incumbent workforce,
possible influential outliers, sampling error, and the unreliability that is inherent with the
test).

Additional Webinar Information
7 | P a g e
The process described below shows how each of these factors can be integrated
into a process for setting applicant and incumbent cutoff scores for a firefighter PAT.
This discussion assumes that a content validated, continuously-timed work sample PAT
is being used. At a minimum, such a test should include events that are (as much as
possible) net of techniques that are trained on the job (by either removing such
techniques, teaching them to the applicants beforehand, or setting up the events so that
the techniques are built into the testing process), and includes only events where speed
(rapid, yet safe, movement) is important both within and between the events.
Step 1: Adjusting for the Possible Gap between the Incumbent Workforce
and the Applicant Population. One way of completing this step is to run active fire
suppression incumbents (typically captain and lower ranks) through the test, then having
them complete a brief survey that asks their opinion regarding the time in which a
minimally-qualified applicant (i.e., with no academy or job training) should be able to
complete the test (see the Angoff method described in Biddle, 2010).
After tabulating the incumbent actual times and opinion times, two results are
very likely. First, their average actual times and opinion time will be different, with
slightly more time being afforded to the applicants. Second, a negative correlation will
emerge between these two values and the time in which the incumbents completed the
test. In other words, the fastest incumbents will likely extend more time (than their own
time) to applicants, and the slowest incumbents will likely extend less time to the
applicants. This phenomenon has occurred in every one (of numerous) datasets the
authors have evaluated, and likely occurs because the exceptionally fit incumbents
recognize that typical applicants may have less ability, and less fit incumbents may desire
stronger ability levels of incoming applicants. Figure 1 demonstrates this graphically
using data from a study that involved 214 firefighters from 41 departments in a
consortium study.

Additional Webinar Information
8 | P a g e
Figure 1. Difference between Firefighter Actual Time and Recommended Applicant Time
Given the fact that this strong negative correlation exists between actual and
recommended times (r = -0.462 in this study, and even stronger in other studies3),
regression can be used to identify adjustments that can be made at various score levels to
account for the skill advantage that incumbents may possess. For example, Figure 1
shows that the predicted recommended applicant time is about 12% slower (506 seconds)
for “fast” incumbents who score 443 seconds (1 SD below the mean), about 5% slower
(541 seconds) for incumbents who score at the mean (516 seconds), and 2% faster (576
seconds) for “slower” incumbents who score 589 seconds (1 SD above the mean).
This data is useful because it can be used in a regression formula to predict the
additional amount of time that should be given to applicants at various score levels in the
incumbent population. For example, in one study4 conducted by the authors the
“applicant advantage” score was computed to be 5.56% at the average score. Because this
value represents the predicted opinion at the normal (i.e., average) point of the score
distribution, it can be simply added to the incumbent average score to arrive at a starting
place for computing the cutoff score for applicants (see additional steps required below).
Step 2: Remove the Outliers
-40%
-20%
0%
20%
40%
60%338
403
423
431
439
443
447
450
455
460
467
471
478
485
489
497
503
506
513
516
520
528
537
544
549
555
561
565
567
570
581
592
606
623
662
695
% D
iffe
ren
ce B
etw
een
FF
Tim
e an
d R
ec. A
pp
. T
ime
Firefighter Incumbent Test Time
Additional Webinar Information
9 | P a g e
This step is important because nearly every incumbent score distribution will have
outliers, and these outliers can have a significant influence on cutoff scores due to their
“extra” influence on the average score used in the process of cutoff-score setting. There
are a number of different methods available for “trimming” outliers, ranging from manual
to automatic methods. While most methods will return similar results, one decision must
be made surrounding the percentage of data points to trim, with the minimum being a
“5% trim” (where the lowest and highest 5% are removed, or 10% total) to a “20% trim.”
(Wilcox & Keselman, 2003)
Trimming the data can be done in several ways. The method we recommend for
PAT scores is to remove the outliers from both the mean and SD because, if they are truly
viewed as “outliers” (i.e., not representative of the “normal score ranges” that will be
used for determining the cutoff score), they should be completely removed from the
cutoff determination process. However, while trimming the outer regions of a distribution
can lead to more accurate estimations of the true population mean, doing so can also
suppress the variability (the SD) because the extreme data points contribute the most
variance to such formulae.
For this reason, and because the SD is being used in this process to set boundaries
regarding the normal expectations of acceptable proficiency, we suggest trimming the SD
using 1.645 SD trimming rule, which only excludes 10% of the data (5% on each side).
This is done by computing the mean and SD of the entire distribution, multiplying the SD
by 1.645, and excluding the values that exceed this range (on both the high and low side).
For example, given a mean of 500 seconds and a SD of 100 seconds, all scores below 335
seconds (500-(1.645*100) and above 665 (500+(1.645*100) would be removed from the
dataset.
While a variety of procedures and methods may be useful for trimming outliers,
the authors have found the process described above especially effective because the vast
majority of incumbent datasets from incumbents have been significantly skewed (with a
disproportionally high number of slower incumbents than faster incumbents in the
dataset).5
Step 3: Correct for Sampling Error
The SE Mean can be computed using the following formula:
where SD is the SD of the untrimmed scores and N is the sample size. This value should
be reduced by multiplying it by the Finite Population Correction (FPC)6 value, computed
by:
1
N
nN
where N is the total fire suppression population and n is the sample included in the study.
NSD /
Additional Webinar Information
10 | P a g e
Step 4: Account for Test Reliability
Use the process described above to compute the test-retest reliability (as an ICC
statistic), then the SEM, and finally the SED. Then multiply the SED by a Confidence
Interval of 1.96 to identify the score that represents a 95% confidence level (one-tail)
surrounding the outside boundary of the average score.
If possible, the test-retest reliability (ICC) for the entry-level PAT should be
computed using untrained applicants or new recruits, and the ICC for the incumbent PAT
should be computed using fire suppression personnel. This is because their reliability is
likely to be lower than trained and experienced incumbents due to their having less on-
the-job experience with the same or similar activities. For our example, the authors
conducted a test-retest study with 59 new fire recruits that resulted in ICC = 0.6979 (for a
work-sample PAT that had an average time of about nine minutes) and a test-retest study
for incumbents for a similar PAT that resulted with a higher ICC (ICC = 0.7927). Use the
ICC from the untrained applicants in the cutoff process described below for the entry-
level PAT (see below), and the ICC from the fire suppression personnel for the incumbent
PAT.
Step 5: Combine the Computation Values to Set Cutoff Scores for Entry-Level
Applicants and Incumbents (as a Maintenance Standard)
Given the discussion of the factors and computations above, the following
formulas can be used for computing passing scores (cutoffs) for entry-level applicants
and incumbents (as a maintenance or return-to-duty standard) as shown below.
Formula for Setting Cutoff Scores for Entry-Level Applicants:
Trimmed Mean + (Trimmed Mean * 5.56%) + (SE Mean * FPC) + (SED * 1.96)
Process for Setting Cutoff Scores for Incumbents (for a Maintenance or Return-to-
Duty Standard):
Trimmed Mean + (SE Mean * FPC) + (SED * 1.96)
The final cutoff for either process above should be set by rounding the calculated value
up to a whole second (e.g., 500.1 seconds should be rounded up to 501 seconds) because
it is easier to monitor pass/fail determinations in whole seconds.
While the results of the process above will vary, the cutoffs will typically be set so
that >90% of the incumbents would pass the applicant standard and 80% to 90% of the
incumbents would pass the maintenance/return-to-duty standard.
Additional Webinar Information
11 | P a g e
Finally, one additional point should be discussed regarding these cutoff-score-
setting processes and related concepts. This has to do with the use of test scores. While
these concepts and steps are useful for setting minimum standards, a criterion-related
validity study may generate evidence that scores above minimum levels differentiate job
performance. In such circumstances, using a cutoff score (or banding) may be justified,
however, the level of adverse impact should also be considered.
Should Age and Gender be Considered When Setting the Cutoff for an
Incumbent Maintenance Standard?
There is a growing concern that the age and gender of the incumbent will affect
performance on the PAT and that adjustments should be made to address these factors.
However, Section 106 of the Civil Rights Act (CRA) of 1991 prohibits the use of gender-
based standards stating:
It shall be unlawful employment practice for a respondent, in the connection with
the selection or referral of applicants or candidates for employment or promotion,
to adjust the scores of, use different cutoff scores for, or otherwise alter the results
of, employment related tests on the basis of race, color, religion, sex or national
origin.
Additionally, the American’s with Disabilities Act (ADA) of 1990 states that employee
standards must be job related. Specifically, Section 103 of the ADA states:
(a) In general. It may be a defense to a charge of discrimination under this chapter
that an alleged application of qualification standards, tests, or selection criteria
that screen out or tend to screen out or otherwise deny a job or benefit to an
individual with a disability has been shown to be job-related and consistent with
business necessity, and such performance cannot be accomplished by reasonable
accommodation, as required under this subchapter.
(b) Qualification standards. The term “qualification standards” may include a
requirement that an individual shall not pose a direct threat to the health or safety
of other individuals in the workplace.
Given the nature of the firefighter job and the consequence of error associated
with an applicant or incumbent who is unable to perform the critical duties, adjusting a
PAT cutoff score based on age or gender, for either applicants or incumbents, not only
violates the CRA of 1991 and the ADA of 1990, but could very likely put the health and
safety of fire suppression personnel in danger.
Which Positions Should be Included in an Annual Maintenance Testing
Program?
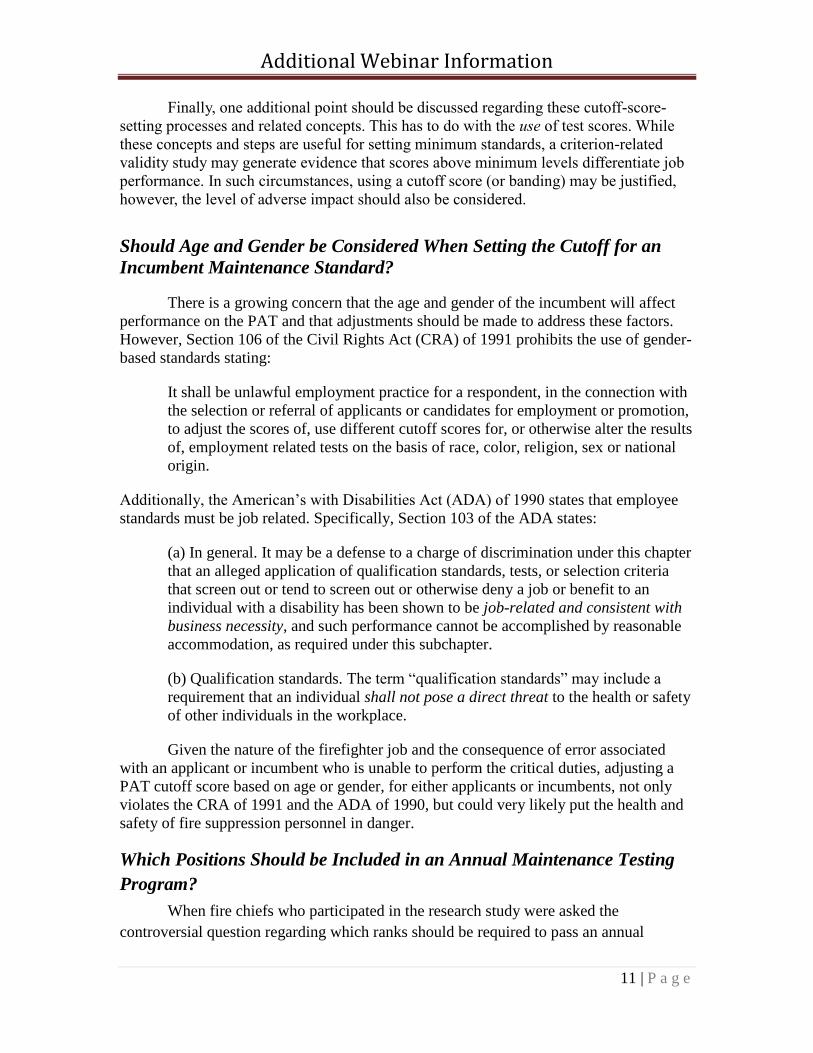
When fire chiefs who participated in the research study were asked the
controversial question regarding which ranks should be required to pass an annual
Additional Webinar Information
12 | P a g e
maintenance PAT, the results showed a clear cluster that included four ranks: Firefighter,
Fire Engineer, Fire Lieutenant, and Fire Captain. Over 70% of the survey respondents
were in clear agreement that maintenance PATs would be appropriately required for these
positions. The next cluster included the Training Officer and Battalion Chief positions,
which were both tied at about 60% agreement. The higher-level ranks (which included
Fire Marshall, Division Chief, Assistant Chief, and Chief) fell between 30% and 40%,
indicating that being able to pass an annual maintenance PAT was clearly less important
for these ranks. Figure 1 shows these results graphically.
Figure 1. Fire Personnel Required to Pass Annual Maintenance PATs
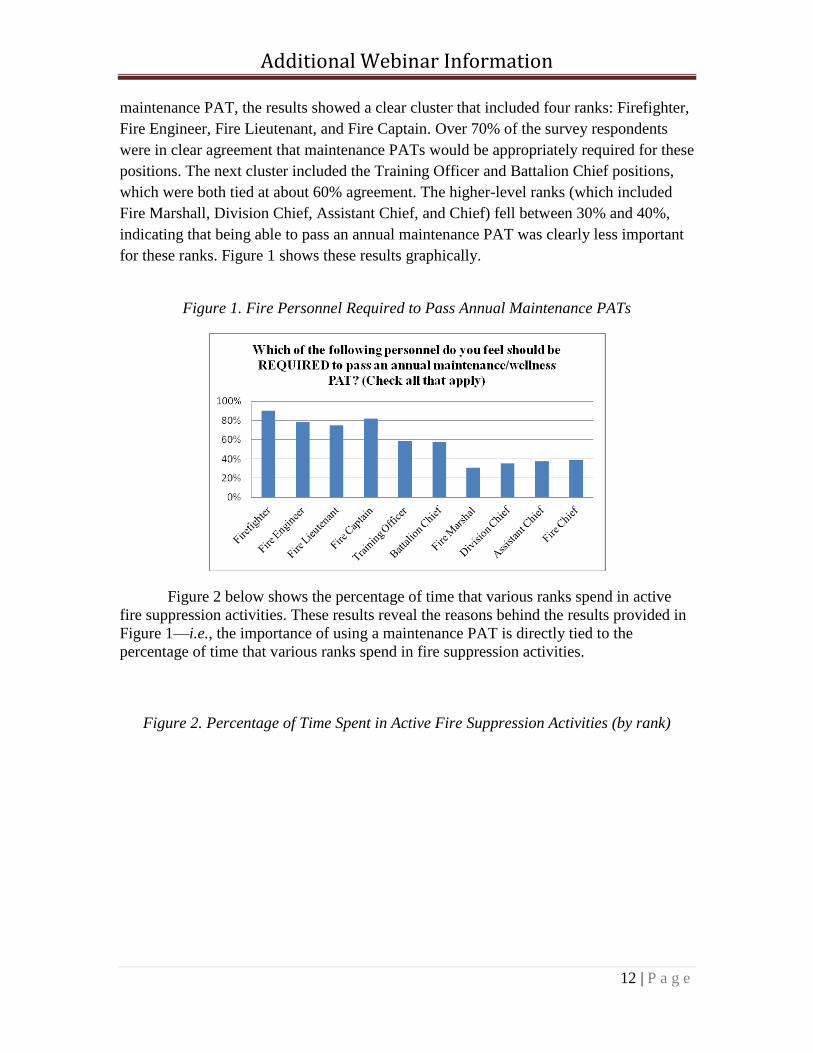
Figure 2 below shows the percentage of time that various ranks spend in active
fire suppression activities. These results reveal the reasons behind the results provided in
Figure 1—i.e., the importance of using a maintenance PAT is directly tied to the
percentage of time that various ranks spend in fire suppression activities.
Figure 2. Percentage of Time Spent in Active Fire Suppression Activities (by rank)

Additional Webinar Information
13 | P a g e
The study revealed that the average percentage of calls that were fire suppression
calls was 21%, with a standard deviation of 13.5%. The percentage of calls that were
EMS was 71%, with a standard deviation of 14.8%. There was no correlation between
department size and type of calls, which reveals that the ratio of fire to EMS calls is not
dependent on department size.
Choosing which positions to include in an annual maintenance testing program
should clearly be a department-by-department decision. With that said, the data reveal
that the four positions that are traditionally “hands on” when it comes to fire scene
management should certainly be included in most situations. This includes the ranks of
Firefighter, Fire Engineer, Fire Lieutenant, and Fire Captain. In most departments, the
Training Officer is not directly involved in responding to fire emergencies. The Battalion
Chief position, however, is different because field deployment levels of this position is
sometimes high, and will vary by assignment (e.g., training, administrative, etc.) as well
as department size. The higher-level ranks (e.g., Fire Marshall, Division Chief, Assistant
Chief, and Chief) will typically be exempt from maintenance programs.
What Steps Should Departments Take with Incumbents who Fail Annual
Maintenance Standards?
The research conducted surrounding this issue included a question that asked
respondents: “Which of the following consequences do you feel are acceptable for
ACTIVE FIRE SUPPRESSION who cannot pass a maintenance/wellness PAT?” The
four response options that were provided to respondents were:
Conditioning program—The incumbent is placed on a program that includes
dietary modification and physical training.
Leave of absence—The department may elect to place the incumbent on a leave
of absence until which time the incumbent is able to pass the test.

Additional Webinar Information
14 | P a g e
Disability leave—The department may elect to place the incumbent on disability
leave until which time the incumbent is able to pass the test.
Retirement with pension—The department may elect to terminate employment
with the incumbent following continued attempts to improve test performance
without success.
The results from this survey question are provided in Figure 3.
Additional Webinar Information
15 | P a g e
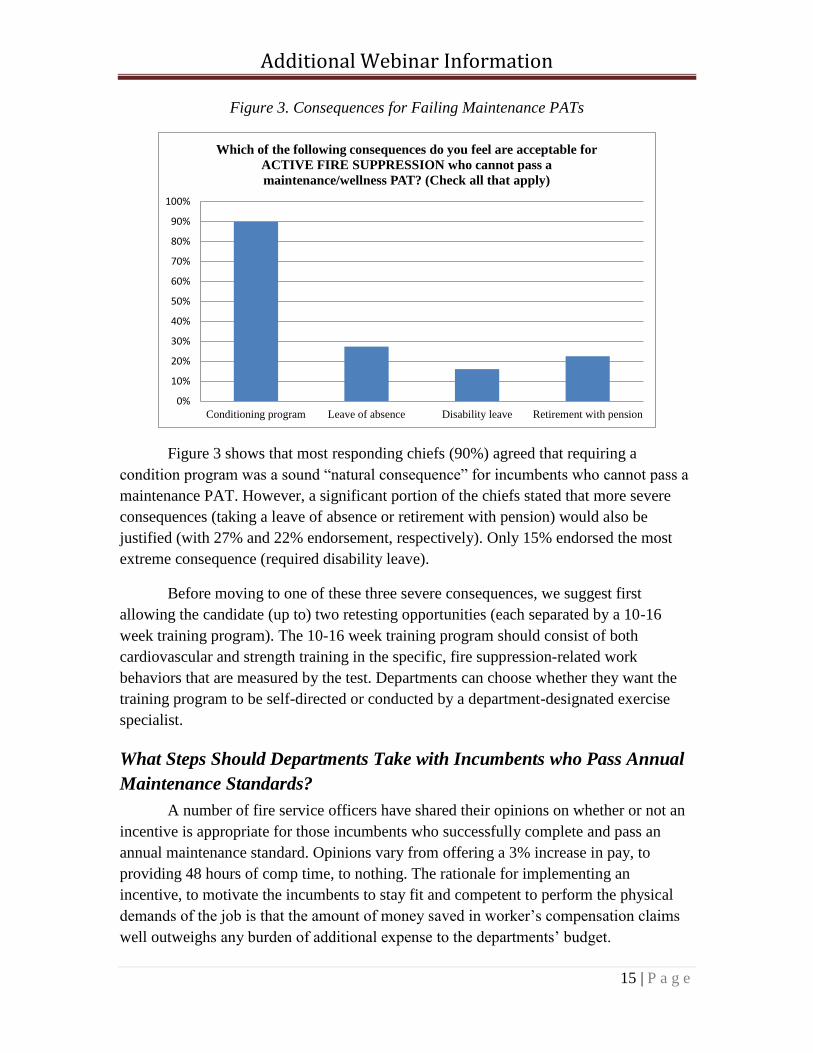
Figure 3. Consequences for Failing Maintenance PATs
Figure 3 shows that most responding chiefs (90%) agreed that requiring a
condition program was a sound “natural consequence” for incumbents who cannot pass a
maintenance PAT. However, a significant portion of the chiefs stated that more severe
consequences (taking a leave of absence or retirement with pension) would also be
justified (with 27% and 22% endorsement, respectively). Only 15% endorsed the most
extreme consequence (required disability leave).
Before moving to one of these three severe consequences, we suggest first
allowing the candidate (up to) two retesting opportunities (each separated by a 10-16
week training program). The 10-16 week training program should consist of both
cardiovascular and strength training in the specific, fire suppression-related work
behaviors that are measured by the test. Departments can choose whether they want the
training program to be self-directed or conducted by a department-designated exercise
specialist.
What Steps Should Departments Take with Incumbents who Pass Annual
Maintenance Standards?
A number of fire service officers have shared their opinions on whether or not an
incentive is appropriate for those incumbents who successfully complete and pass an
annual maintenance standard. Opinions vary from offering a 3% increase in pay, to
providing 48 hours of comp time, to nothing. The rationale for implementing an
incentive, to motivate the incumbents to stay fit and competent to perform the physical
demands of the job is that the amount of money saved in worker’s compensation claims
well outweighs any burden of additional expense to the departments’ budget.
0%
10%
20%
30%
40%
50%
60%
70%
80%
90%
100%
Conditioning program Leave of absence Disability leave Retirement with pension
Which of the following consequences do you feel are acceptable for
ACTIVE FIRE SUPPRESSION who cannot pass a
maintenance/wellness PAT? (Check all that apply)

Additional Webinar Information
16 | P a g e
Conclusion
The incumbents surveyed in the 2011 national research study were asked which
fire suppression personnel should be required to pass an annual PAT. Some of the more
common responses ranged from: “Everyone issued turnout gear should pass a physical
every year,” (Anonymous, 2012) to “…there needs to be a mandatory annual physical
assessment for anyone that performs suppression duties - be that an A/C or a Training
Chief or even the Chief if he does that - plus that would be a great way to show everyone
that the playing field is level…No one wants to put good people out of a job, but how long
do you let the good guys slide - and create a hazard for themselves and the rest of the
department?” (Anonymous, 2012).
While there may be differing opinions on exactly who should be required to pass
an annual maintenance PAT and what the consequences should be for those who cannot
pass the test, one thing is certain, fire departments should implement a maintenance test
into their incumbent workforce for the safety of both the public and the department.
In 2012, the United States Fire Administration published firefighter health and
wellness Resolutions for the New Year and encouraged fire departments to: “provide
physical exams to each firefighter and responder in the department in accordance with the
National Fire Protection Association (NFPA) 1582 – Standard on Comprehensive
Occupational Medical Program for Fire Departments” (USFA, 2012). Additionally,
USFA encourages fire departments to implement a comprehensive fitness program per
NFPA 1583 – Standard on Health-Related Fitness Programs for Fire Department
Members.
Many chief officers may prefer to implement a wellness program over instituting
a maintenance standard on their incumbent workforce. There is little doubt that a
wellness program could be helpful in identifying specific health concerns that may
require intervention (e.g., cholesterol, diabetes, skin cancer, etc.). However, these
wellness programs will not identify those incumbents who are physically unable to
perform a variety of simulated fire suppression activities as easily as an annual
maintenance test can. For example, it is possible for an incumbent to participate in a
wellness program that identifies the incumbent as a “fit” firefighter (e.g., a healthy body-
mass index, a healthy resting pulse rate, good blood pressure, etc.), but this “fit”
firefighter may not be able to successively drag a charged 1 ¾” hoseline for 70 feet, drag
a 175-pound dummy for 20 feet, and then climb four flights of stairs while carrying a 40-
pound hose bundle. The clear distinction between the wellness program and the
maintenance test is this: The wellness program will identify incumbents who should be
able to successfully perform fire suppression duties, but the maintenance test will identify
incumbents who can successfully perform fire suppression duties.

Additional Webinar Information
17 | P a g e
Additional Webinar Information
18 | P a g e
References
1991 Civil Rights Act (42 U.S.C. §2000).
Americans with Disabilities Act of 1990 (ADA), 42 U.S.C. §§ 12101-12213
2000).
Biddle, D. (2011). Adverse Impact and Test Validation (3rd Ed.). West
Conshohocken, PN: Infinity Publishing.
National Fire Protection Association. (2000). NFPA 1583: Standard on Health-
Related Fitness Programs for Fire Fighters
National Institute of Standards and Technology (NIST) (March, 2005).
The Economic Consequences of Firefighter Injuries and Their Prevention. Final
Report. Arlington, VA: Author.
Uniform Guidelines – Equal Employment Opportunity Commission, Civil Service
Commission, Department of Labor, and Department of Justice (August 25, 1978),
Adoption of Four Agencies of Uniform Guidelines on Employee Tests, 43 Federal
Register, 38,290-38,315; Adoption of Questions and Answers to Clarify and Provide a
Common Interpretation of the Uniform Guidelines on Employee Tests, 44 Federal
Register 11,996-12,009.
United States Fire Administration (USFA) (January, 2012). Resolutions for the
New Year: Firefighter Health and Wellness. http://www.usfa.fema.gov/about/chiefs-
corner/010912.shtm.
1 It should be noted that some situations may include job incumbents who are performing inadequately as
an overall group. In this circumstances, deviations from the steps described herein may be made. 2 This can be computed in SPSS by inserting Time 1 scores and Time 2 scores in their respective columns
and analyzing the scale reliability using Intraclass Correlation Coefficient, Two-Way Mixed (with
“Absolute” type), and using the “Average Measures” value from the resulting output. See, for example:
Weir, J.P. (2005). Quantifying test-retest reliability using the intraclass correlation coefficient and the
SEM. Journal of Strength Conditioning Research, 19 (1), 231-240; Wang, C.Y. & Chen, L.Y. (2010). Grip
strength in older adults: Test-retest reliability and cutoff for subjective weakness of using the hands in
heavy tasks. Archives of Physical Medicine for Rehabilitation, 91, pp. 1747-1751; Gross D.P. & Battie,
M.C. (April, 2002). Reliability of Safe Maximum Lifting Determinations of a Functional Capacity
Evaluation. Physical Therapy, Vol 82, No 4; Isernhagen S.J., Hart D.L. & Matheson L.M. (1990).
Reliability of Independent Observer Judgments of Level of Lift Effort in a Kinesiophysical Functional
Capacity Evaluation. Work 12, 145-150; Reneman, M.F. & Brouwer, S., Meinema, A. Dijkstra, P.U.,
Geertzen, J.H.B., Groothoff, J.W. (December 2004). Test-Retest Reliability of the Isernhagen Work
Systems Functional Capacity Evaluation in Healthy Adults. Journal of Occupational Rehabilitation, 14, No
4, pp. 295-305; Reneman, M.F., Dijkstra, P.U. Westmaas, M., Göeken, L.N.H. (December 2002). Test-
Retest Reliability of Lifting and Carrying in a 2-day Functional Capacity Evaluation. Journal of
Occupational Rehabilitation, 12, No 4, pp. 269-275; Wang, C.Y. & Chen, L.Y. (2010). Grip strength in

Additional Webinar Information
19 | P a g e
older adults: Test-retest reliability and cutoff for subjective weakness of using the hands in heavy tasks.
Archives of Physical Medicine for Rehabilitation, 91, pp. 1747-1751. 3 This trend is typical is most studies conducted. For example, three other studies revealed negative
correlations of r = - .65, r = - 60, and r = - .77 for department sizes of n = 61, n = 60, and n = 37,
respectively. The authors acknowledge that some degree of this correlation is due to the auto-correlation
that occurs with less time being available to correct with faster times, and more time with slower times
(e.g., a 30-second adjustment on a 300-second score is 10%, whereas the same 30-second adjustment on a
600-second score is only 5%). However, each of the distributions studied revealed negative corrections
almost always being made in the slower score ranges (where less time than the firefighter’s time is
recommended for the applicant). 4 This study involved four independent studies representing 44 total departments and 372 firefighters. The
5.56% was computed using a sample-size weighted applicant advantage across all four studies. 5 For example, studies conducted by the authors revealed the PAT incumbent score data from 4 out of 5 fire
departments (representing a combined sample size of 430 incumbents) to be significantly skewed, with
skewness test results of 4.12, 3.24, 4.47, 1.86, and 2.77 (skewness test values are computed by dividing the
skew value by the standard error of the skew, with values exceeding 2.0 indicate “significant” skew). 6 Isserlis, L. (1918). On the value of a mean as calculated from a sample. Journal of the Royal Statistical
Society (Blackwell Publishing) 81 (1): 75–81. (Equation 1)