Embed Size (px)
Citation preview
University of New MexicoUNM Digital Repository
Civil Engineering ETDs Engineering ETDs
Spring 3-2-2018
Physical and Chemical Interactions Affecting Uand V Transport from Mine WastesSumant Avasarala
Follow this and additional works at: https://digitalrepository.unm.edu/ce_etds
Part of the Environmental Engineering Commons
This Dissertation is brought to you for free and open access by the Engineering ETDs at UNM Digital Repository. It has been accepted for inclusion inCivil Engineering ETDs by an authorized administrator of UNM Digital Repository. For more information, please contact [email protected].
Recommended CitationAvasarala, Sumant. "Physical and Chemical Interactions Affecting U and V Transport from Mine Wastes." (2018).https://digitalrepository.unm.edu/ce_etds/205
i
Sumant Avasarala Candidate Civil Engineering Department This dissertation is approved, and it is acceptable in quality and form for publication: Approved by the Dissertation Committee: Dr. Jose M. Cerrato , Chairperson Dr. Ricardo Gonzalez Pinzon Dr. Bruce Thomson Dr. Adrian Brearley Dr. Mehdi Ali

ii
Sumant Avasarala
B.S., Chemical Engineering, Anna University 2009, India
M.S., Chemical Engineering, Wayne State University, 2012, U.S.
DISSERTATION
Submitted in Partial Fulfillment of the Requirements for the Degree of
Doctor of Philosophy
Engineering
The University of New Mexico
Albuquerque, New Mexico
May 2018

iii
Dedication I would like to dedicate my PhD to my parents (Seshargiri Rao and Radha), my brother
(Ashwin Avsasarala), my friends, and my grandfathers (V.V. Rao and Late Chalapathi
Rao) without whose blessings, prayers, and support this journey would have never been
possible. Special dedication to my best friend, Dr. Sriraam Ramanathan Chandrasekaran,
who guided me and supported me through my rough times. I couldn’t think of a better
way to indicate your role in my life than dedicating my biggest achievement to you!
Thank you for always being there!
iv
Acknowledgement
I never will have enough words to express my gratitude and gratefulness towards my advisor, Dr. José Cerrato, who offered me a PhD position despite many red flags on the way. His exceptional support, advisement, and love for his students (in this case, me) has always kept me driven and motivated—so motivated that it has finally allowed me to see light towards the end of a long, cheerful, fun, and challenging PhD tunnel. Thank you very much, José, for transforming me from a naïve graduate student to an eligible independent researcher. I really appreciate it! I am forever in your debt! Of course next on my list is Dr. Mehdi Ali for his continuous “It’s working, it’s not.” There is not a day when I have not felt I could talk to you about any challenge that I ran into. You have always comforted, guided, and supported me in both on a professional and personal level. I have relished all moments spent with you from the weekend brunches (green Chile cheese omelets) to all the laughs we shared. Thank you very much, Dr. Ali, for making my journey a lot more memorable and fun. I am also very thankful to my committee members Dr. Ricardo Gonzalez, Dr. Adrian Brearley, and Dr. Bruce Thomson for all their help, guidance, and support during my PhD research. I am also very thankful to all my co-authors without whose efforts reaching this point would have been extremely difficult. Special thanks to Dr. Brearley for his patience towards my constant harassment for data. Finally, my acknowledgement would be incomplete without my friends and lab mates. I consider myself extremely lucky to have had the opportunity to pursue a PhD alongside such smart, supportive, and loving friends. You have always been there to cheer, hold, and encourage me during my difficult times. I have learned so much from all of you, and I wish the best for you all. Thank you. I have learned so much from each and every one of you that I am forever in your debt. I hope someday I can return the favor.

v
Sumant Avasarala
B.S., Chemical Engineering, Anna University 2009, India M.S., Chemical Engineering, Wayne State University, U.S.
Abstract.
This research investigates the physical and chemical interactions that affect the transport
of uranium (U) and vanadium (V) from uranium mine waste sites by integrating
laboratory experiments and reactive transport modelling with various spectroscopy,
microscopy, and diffraction techniques. The document consists of results from three
related studies. In the first study (Chapter 3), the reactive transport of U and V was
investigated by sequentially reacting mine wastes collected from Blue Gap/Tachee
Claim-28 mine site, AZ with 10mM NaHCO3 (7.9) and 10mM CH3COOH (3.4) during
continuous flow through column experiments. Under both of these conditions (pH 3.4
and 7.9), dissolution of U-V bearing minerals predominant at the site were identified as a
key mechanism affecting the reactive transport of U and V. The equilibrium (Keq) and
reaction rate constants (km) for U-V bearing mineral dissolution were estimated to be Keq
= 10-44.81 and km = 4.8x10⁻¹³ mol cm-2 sec-1 at circumneutral conditions, and Keq = 10-38.65
and km = 3.2x10⁻¹³ mol cm-2 sec-1 under acidic conditions. These results, coupled with
electron microscopy data, suggest that the release of U and V is affected by difference in
vi
solution pH and crystalline structure of U-V bearing minerals. Identifying the crystal
chemistry of these U-V bearing minerals was the task in the second study (Chapter 4) of
the dissertation. Using various diffraction and microscopy tools, the U-V bearing
minerals were identified as hydrated carnotite.
Finally, the mobility of U from co-occurring submicron U(IV) and U(VI) mineral
phases in mine wastes from the Jackpile mine in Laguna Pueblo, NM was investigated
under oxidizing conditions. Co-occurrence of U(VI) and U(IV) at a 19:1 ratio mostly as
coffinite (USiO4) and U-phosphate was observed in these mine waste solids. The highest
U release from these mine wastes was observed during batch reactions with 10 mM
NaHCO3 solution containing ambient dissolved oxygen concentrations. Results from
these investigations provide an improved understanding on the role of thermodynamics,
crystallinity, stoichiometry, and solution chemistry in the reactive transport of U and V
from mine wastes that affect the water quality of surface and ground water resources.
vii
Physical and Chemical Interactions Affecting U and V Transport from Mine Wastes ....... i
Physical and Chemical Interactions Affecting U and V Transport from Mine Wastes .......v
1 Table of Contents....................................................................................................... vii
2 List of Figures ...............................................................................................................x 3 List of Tables ........................................................................................................... xvii
1 Introduction ..................................................................................................................1
2 Literature Review .........................................................................................................4
Background and Significance................................................................................4 Study Areas: Blue Gap Tachee Claim-28, AZ and Jackpile-Paguate Mine, NM .6
State of the Knowledge about Processes Affecting U and V Transport from Mine Wastes .....................................................................................................................8
2.3.1 PFLOTRAN and Its Applications. ...............................................................10
2.3.2 Effect of Crystallinity on Metal Mobility. ...................................................11
Research Gap and Objectives ..............................................................................12 3 Reactive Transport of U and V from Abandoned Uranium Mine Wastes .................14
Abstract ...............................................................................................................14
Introduction .........................................................................................................15
Materials and Methods ........................................................................................18 3.3.1 Materials. .....................................................................................................19
3.3.2 Batch Experiments. ......................................................................................19
3.3.3 Continuous Flow Through Column Experiments. .......................................20
3.3.4 Aqueous Chemical Analyses. ......................................................................21 3.3.5 Reactive Transport Modelling. ....................................................................21
3.3.6 Solids Characterization. ...............................................................................23
Results and Discussion ........................................................................................24
3.4.1 Mine Waste Reactivity in Columns Using 18 MΩ Water (pH 5.4). ............24 3.4.2 Reactive Transport of U and V at Circumneutral pH. .................................25
3.4.3 Reactive transport of U and V at Acidic pH. ...............................................28
Environmental Implications. ...............................................................................32
4 Crystal chemistry of Uranyl Vanadates (Carnotite) in Mine Wastes .........................39
viii
Abstract ...............................................................................................................39
Introduction .........................................................................................................41
Materials and Methods ........................................................................................44 4.3.1 Materials. .....................................................................................................44
4.3.2 Electron Microprobe Analysis. ....................................................................45
4.3.3 X-Ray Diffraction (XRD). ...........................................................................46
4.3.4 Focused Ion Beam Sample Preparation (FIB). ............................................47 4.3.5 Transmission Electron Microscopy (TEM). ................................................47
Results and Discussion ........................................................................................48
4.4.1 X-ray Diffraction (XRD). ............................................................................48
4.4.2 Electron Microprobe Analysis (Imaging, Qualitative and Quantitative X-ray mapping). ....................................................................................................................50 4.4.3 Scanning Transmission Electron Microscopy (STEM). ..............................52
Implications .........................................................................................................57
5 Effect of Oxidizing Conditions on Submicron U(IV) and U(VI) phases in Mine Wastes ................................................................................................................................68
Abstract. ..............................................................................................................68
Introduction. ........................................................................................................69 Experimental. ......................................................................................................72
5.3.1 Materials. .....................................................................................................72
5.3.2 Procedure for Batch Experiments. ...............................................................73
5.3.3 Aqueous Analyses. .......................................................................................74 5.3.4 Solid Characterization. .................................................................................75
Results and Discussion. .......................................................................................75
5.4.1 Bulk and Surface Oxidation States of U in Unreacted Mine Waste. ...........75
5.4.2 Mineralogy of Unreacted Mine Waste. ........................................................76 5.4.3 Results of Batch Expeirments. .....................................................................79
Conclusions. ........................................................................................................85
6 Overall Conclusion .....................................................................................................92
Conclusion. ..........................................................................................................92
Contribution of this Dissertation to the Body of Knowledge. ............................94 7 Appendix A (Chapter 2) .............................................................................................95
Additional Materials and Methods. .....................................................................95
ix
7.1.1 Acid Extractable Procedure. ........................................................................95
7.1.2 Inductively Coupled Plasma (ICP). .............................................................95
7.1.3 Transmission Electron Microscope (TEM). ................................................95 7.1.4 Synchrotron Micro- X-ray Fluorescence Mapping (µ-SXRF). ...................96
7.1.5 Reactive Transport Modelling (PFLOTRAN). ............................................96
8 Appendix B (Chapter 4) ...........................................................................................119
Additional Materials and Methods. ...................................................................119 8.1.1 Acid Extractable Procedure. ......................................................................119
8.1.2 X-ray Fluorescence (XRF). ........................................................................119
8.1.3 X-ray Diffraction (XRD). ..........................................................................119
8.1.4 Scanning Transmission Electron Microscopy (STEM). ............................120 8.1.5 Electron Microprobe Analysis (EPMA). ...................................................121
8.1.6 X-Ray Photoelectron Spectroscopy (XPS). ...............................................123
8.1.7 Micro Synchrotron X-ray Fluorescence Mapping (µ-SXRF). ...................123
8.1.8 Zeta Potential. ............................................................................................124 8.1.9 Chemical Equilibrium Modelling. ...............................................................75
9 References. ...............................................................................................................138
x
Figure 3.1 TOC art: Conceptual model indicating the geochemical processes acting in
various experiments conducted in this chapter. .........................................................35
Figure 3.2 Measured effluent concentrations and reactive transport model (PFLOTRAN)
of U and V, from mine waste (circle) and background soil (squares) during batch
and continuous flow-through column experiments at circumneutral pH (using 10
mM NaHCO3). A) U concentrations from batch experiments versus time; B) V
concentration from batch experiments versus time; C) U concentrations from
column experiments versus pore volumes; D) V concentration from column
experiments versus pore volumes. The curve fitting resulting from the reactive
transport model are presented with dashed lines. ......................................................36
Figure 3.3 Measured effluent concentrations and reactive transport model (PFLOTRAN)
of U and V, from mine waste (circle) and background soil (squares) during batch
and continuous flow-through column experiments at acidic pH (using 10 mM
C6H8O6 and CH3COOH). A) U concentrations from batch experiments versus time;
B) V concentration from batch experiments versus time; C) U concentrations from
column experiments versus pore volumes; D) V concentration from column
experiments versus pore volumes. The curve fittings resulting from the reactive
transport model are presented with dashed lines. ......................................................37
Figure 3.4 Transmission electron microscopy (TEM) images, Energy Dispersive
Spectroscopy (EDS) spectra and Selected Area Electron Diffraction (SAED)
patterns for unreacted mine waste samples indicating the co-occurrence of
amorphous and crystalline U-V bearing minerals. A, D) TEM images of U-V
bearing mineral phases. B, E) EDS spectra identifying the presence of U-V bearing
minerals. C, F) SAED patterns confirming the co-occurrence of amorphous and
crystalline U-V bearing mineral phase. .....................................................................38
Figure 4.1 Powder X-ray Diffraction of Blue Gap Tachee mine waste. The green curve
represents the diffractogram of the powdered mine waste without any separation.
The blue curve represents diffractogram of an oriented mine waste sample obtained
from suspended fraction of a water separation technique with an overnight settling
xi
time. The red curve represents diffractogram of a randomly oriented mine waste
sample obtained from the suspended fraction of a water separation technique with a
settling time of <30s. .................................................................................................61
Figure 4.2 Qualitative electron microprobe X-ray maps of elemental distributions in an
ore sample from mine waste from the Blue Gap Tachee site, showing complex
correlation of U with V, K, Ca and O. A) Back-scattered electron image of the
mapped area, B) U Mα map, C) V Kα map, D) K Kα map E) O Kα map and F) Ca
Kα Map.......................................................................................................................62
Figure 4.3 A) Back-scattered electron image of complex intergrowth of U-V bearing
mineral phase occurring in the Blue Gap/Tachee mine waste. B) Energy Dispersive
Spectrum (EDS) of the yellow circled area in image A showing presence of low Z
inclusions. C) Higher magnification BSE image showing occurrence of submicron,
low-Z inclusions (yellow circles) in the uranyl vanadate which EDS indicates are
carbon rich. ................................................................................................................63
Figure 4.4 Scanning Transmission Electron Microscopy (STEM) image and STEM EDS
X-ray maps obtained from a FIB section of the Blue Gap Tachee mine waste. A)
HAADF image of the FIB section, B-F) X-ray lines of B) U Mα, C) V Kα D) K Kα,
E) C Kα and F) O Kα, were used for the analysis. The X-ray map of carbon shows
the presence of low nanometric Z inclusions within the grain and also the presence
of epoxy in which the grains were embedded that are not indigenous to the
sample. .......................................................................................................................64
Figure 4.5 A-D) A) Dark Field HAADF images in Scanning Transmission Electron
Microscopy (STEM) mode showing the co-occurrence of C with in the U-V mineral
of the Blue Gap Tachee Claim-28 mine waste. B) and C) Energy Filtered
Transmission Electron Microscopy (EFTEM) images confirming the C co-
occurrence to be an inclusion in the uranyl vanadate. The area in red is the distinct
form of a C inclusion and the area in yellow indicates the carbon incorporated into
the organic platinum structure that is used to coat the FIB section. ..........................65
Figure 4.6 Electron Energy Loss Spectroscopy (EELS) analysis of the carbon inclusions
and epoxy. A) HAADF Scanning Transmission Electron Microscopy (DF-STEM)
image of the inclusions and epoxy (yellow arrows) in the Focused Ion Beam (FIB)
xii
section of the uranyl vanadate. B) BF-TEM image of an inclusion that was analyzed
using EELS. C) EELS spectrum of the C inclusion showing the presence of C and
K-edge. D) EELS spectrum of the epoxy showing the presence of C-edge. E) EELS
spectra of the uranyl vanadate away from the inclusion showing the presence of only
K-edge. The C L edge at 284 eV is missing demonstrating that the carbon is present
only in the inclusions. ................................................................................................66
Figure 4.7 Bright-field TEM images and electron diffraction patterns of clusters of
uranyl vanadate crystal from the Blue Gap/Tachee ore. A-C): Bright-field TEM
images showing the morphology and grain size of different uranyl vanadate clusters.
The crystallites consist of plates with anhedral to subhedral outlines that are
overlapping one another, parallel to the plane of the supporting holey carbon film.
D-G): sequence of ring electron diffraction patterns taken at time intervals of ~20
secs, showing the rapid amorphization of the uranyl vanadate due to electron beam
irradiation. Discrete diffraction maxima disappear and are replaced by diffuse
intensity consistent with an amorphous phase. ..........................................................67
Figure 5.1 TOC art used in the paper showing the presence of submicron U(IV) and
U(VI) phases whose mobility is goverened by few processes explained in the
conceptual model. ......................................................................................................87
Figure 5.2 Oxidation states (bulk and surface) and co-ordination of U in unreacted
Jackpile-Paguate mine waste samples. A) Reference XPS spectra for U(IV) using
uraninite [UO2] B) Reference XPS spectra for U(VI) using becquerelite
[Ca(UO2)6O4(OH)6·8(H2O)] C) High resolution X-ray Photoelectron Spectroscopy
(XPS) spectra of U in unreacted waste. .....................................................................88
Figure 5.3 Electron Microprobe (EM) analysis of the Jackpile-Paguate mine waste
sediments. A) BSE image (leftmost) showing the presence of submicron U-phases
encapsulated by carbon where, the mapping was performed. B) Electron Microprobe
(EM) BSE image of a polished sample showing rock fragments with surface
aggregates of U-P-K (red arrow). C) Energy Dispersive Spectrum (EDS) confirming
the presence of a U-P-K phase showing distinct U, P and K peaks (red circle). D)
Calcium map E) Uranium map F) Phosphorous map G) pottasium map H) Carbon
xiii
map. Green, yellow, pink and white represent high concentrations of elements and
dark blue represents lower concentrations of elements. ............................................89
Figure 5.4 Scanning Transmission Electron Microscopy (STEM) imaging of U phases
within the mine waste sample. A) STEM image of U-K-Si-P phases in black. B)
Energy Dispersive Spectrum (EDS) on grain 1, confirming the presence of a U-K-
Si-P phase. C) High Resolution Selected Area Electron Diffraction (HR-SAED)
analysis on grain 1 (U-K-Si-P phase) showing patterned fringes (in yellow)
suggesting the phase to be crystalline. The lack of patterned fringes around the U-K-
Si-P phase suggests the presence of an amorphous phase possible organic matter in
the mine waste sample. ..............................................................................................90
Figure 5.5 Uranium trends for batch experiments on Laguna ore samples reacted with A)
18MΩ water pH 5.4 B) 10mm bicarbonate (NaHCO3) solution pH 7.5 C) 5.6-6%
NaOCl solution, pH 7.5 D) 5mM NaHCO3 + 2.8-3% NaOCl solution, pH 7.5 and E)
10mM NaHCO3 + 5.6-6% NaOCl solution, pH 7.5. The pH of the reagents used in
B-E were adjusted using 0.5N NaOH, 0.1N HCl and 35.6N HNO3. ........................91
Figure 7.1. Experimental setup of sequential flow through column experiments ..........111
Figure 7.2. Effluent concentrations of U and V obtained after reaction of mine waste
(circle) and background soil (squares) with 18MΩ water (pH 5.4), during continuous
flow-through column experiments, as a function of pore volumes and time. A) U
concentration versus pore volume; B) V concentration versus pore volume; C) U
concentration versus time; D) V concentration versus time. ...................................112
Figure 7.3. Molar correlation between U and V experimental release from mine waste
(hollow circles) after reaction with A) 10 mM NaHCO3.and B) 10 mM CH3COOH
during continuous flow through column experiments. The ideal slope should be 1:1
from the reaction (K2(UO2)2(VO4)2)* = 2K++2UO22+ VO4-3. The point in the
dashed circle represents an outlier due to equilibration of the column with the
influent solution on the early stages of the experiment (first 30 minutes). ..............113
Figure 7.4. Measured effluent concentrations and reactive transport model (PFLOTRAN)
of U and V, from mine waste (circle) and background soil (squares) during
continuous flow-through column experiments at pH 7.9 (using 10 mM NaHCO3), as
xiv
a function of time. A) U concentration versus time; B) V concentration versus time.
The curve fitting using PFLOTRAN are presented with dashed lines. ...................114
Figure 7.5. Measured effluent concentrations and reactive transport model (PFLOTRAN)
of U and V from mine waste (circle) as a function of pore volumes after considering
the effect of grain size during continuous flow-through column experiments at pH
7.9 (using 10 mM NaHCO3). A) U concentrations versus pore volumes B) V
concentrations versus pore volumes. The curve fitting using PFLOTRAN are
presented with dashed lines. ....................................................................................115
Figure 7.6. Microprobe identification of a V-Fe-K phase in the mine waste samples. A)
Back Scatter Electron Imaging (BSE) of a V-Fe-K phase. B) EDS spectrum of the
identified V-Fe-K phase. ..........................................................................................116
Figure 7.7. Synchrotron Micro- X-ray Fluorescence mapping for mine waste samples
identifying the co-occurrence of U with other metals. A) Uranium map; B)
Vanadium map; C) Selenium map ; D) Strontium map ; E) Overlay map of U- red,
Se – green and V – blue; F) Overlay map of U- red, Sr – green and V – blue.
Gradient yellow colors in E and F suggest potential co-occurrence of U and Se, and
U and Sr respectively. Similarly cyan gradient colors in E and F suggest co-
occurrence of U and V, possibly as a U-V mineral. ................................................117
Figure 7.8. Measured effluent concentrations and reactive transport model (PFLOTRAN)
of U and V, from mine waste (circle) and background soil (squares) during
continuous flow-through column experiments at pH 3.4 (using 10 mM CH3COOH)
as a function of time. A) U concentration versus time; B) V concentration versus
time. The curved fitting using PFLOTRAN are presented with solid lines.............118
Figure 8.1 Micro X-Ray Fluorescence (µXRF) mapping on unreacted Laguna mine
waste showing co-occurrence of U, Si and P. A, B, D and E) Mapping images
showing distribution of U, Si, P and V in the elemental grains of the mine waste. C)
Overlaid image of U (red), P (green) and V (blue), showing correlation between U
and P in orange which is due to dominance of U over P. F) Overlaid image of U
(red), Si (green) and V (blue), showing correlation between U and Si in yellow. G)
Overlaid image of U (red), Si (green) and P (blue), showing correlation between U
and Si in yellow and correlation between U and P in magenta. H and I) Correlations

xv
plots between U-P and U-Si maps, where the mapping intensities of U are plotted
against those of Si and P, clearly indicating correlation between U, P and Si. .......130
Figure 8.2 X-Ray Diffraction patterns of unreacted Laguna mine waste indicating
presence of Kaolinite (K), Quartz (Q), Coffinite (C, U(IV) phase) and Microcline
(M). Normalized weight percentages of each of these identified phases were
indicated in the table on the right .............................................................................131
Figure 8.3 Scanning Transmission Electron Microscopy (STEM) mapping of the U-K-P
phase in the unreacted mine waste sample. A) STEM image of the waste sample B)
C (carbon) map C) U map D) P map E) K map and F) Si map G) O map H) Overlay
map of P in red, U in green and K in Blue suggests co-occurrence of U, K and P,
cyan shows co-occurrence of U and K. I) Overlay map of P in red, Si in green and U
in Blue. Magenta areas show co-occurrence of U and P, cyan shows co-occurrence
of U and Si. ..............................................................................................................132
Figure 8.4 Scanning Transmission Electron Microscopy (STEM) image of an area in the
waste sample where the predominance of carbon encapsulated U-P-K phases are
observed (Table) Shows atomic composition of the U-K-P phase in spectrums 1, 2
and 4 highlighted in red boxes in the figure. Spectrum 3 shows the composition of
the carbon that encapsulates the micro crystalline U-P-K phase in the waste
sample. .....................................................................................................................133
Figure 8.5 The average pH change during batch reactions of Laguna mine wastes with
A) 18MΩ water pH 5.4 B) 10 mM NaHCO3 pH 7.5 C) 6% NaOCl pH 7.5 D) 6%
NaOCl + 10 mM NaHCO3 pH 7.5, conducted in triplicates. ..................................134
Figure 8.6 Zeta Potential of unreacted and reacted Laguna mine waste. A) unreacted
mine wastes B) mine wastes reacted with 18MΩ water pH 5.4 C) mine wastes
reacted with 10 mM NaHCO3 pH 7.5 D) mine wastes reacted with 6% NaOCl pH
7.5 E) mine wastes reacted with 6% NaOCl + 10 mM NaHCO3 pH 7.5. ...............135
Figure 8.7 Calcium trends for batch experiments on Laguna mine waste reacted with A)
18MΩ water pH 5.4 B) 10 mM sodium bicarbonate (NaHCO3) solution pH 7.5 C)
6% NaOCl solution, pH 7.5 D) 10 mM NaHCO3 + 6% NaOCl solution, pH 7.5. The
pH of the reagents used in B-D were adjusted using 0.5N NaOH, 0.1N HCl and
35.6N HNO3. ...........................................................................................................136
xvi
Figure 8.8 High resolution X-ray Photoelectron Spectroscopy (XPS) spectra of reacted
mine wastes to identify the surface oxidation states of U. A) Mine waste reacted
with 10 mM NaHCO3. B) Mine waste reacted with 6% NaOCl. C) Mine waste
reacted with 6% NaOCl +10 mM NaHCO3. Black line represents the experimental
spectra obtained while the green line represents the curve fitting by cumulating the
individual peaks under the curve. Percentage of different U oxidation states
observed in the top 5nm of the mine waste surface through these high resolution
spectra are reported in table 8.2. ..............................................................................137
xvii
Table 3.1 Parameters of U-V bearing minerals estimated by modelling the reactive
transport of U and V during mine waste reaction at circumneutral and acidic pH.
The surface area of U-V bearing minerals was estimated using the average U-V
bearing mineral diameter (Appendix A: Table 7.2) and equation [13]. The effective
reaction rate constant (keffective = k*𝒂𝒂𝒂𝒂𝟎𝟎) accounts for the effect of grain surface
area on the reactive transport of U and V, where k is the reaction rate constant and
𝒂𝒂𝒂𝒂𝟎𝟎 is the surface are of U-V bearing minerals. ......................................................34
Table 4.1 Electron microprobe data for carnotite from the Blue Gap Tachee mine
waste.182 .....................................................................................................................59
Table 4.2 Electron diffraction data of measured d-spacings (in Å) for the uranyl vanadate
occurring in the Blue Gap/Tachee mine waste compared to the calculated d-spacing
for synthetic anhydrous carnotite (K2UO2VO4) 188. Lattice spacing data <2.5 Å has
been omitted.188 ..........................................................................................................60
Table 7.1 Thermodynamic equilibrium constants (at T = 25oC) for aqueous and solid
phase U(VI) used in the reactive transport model (PFLOTRAN). ..........................101
Table 7.2. Other parameters used in the reactive transport model to simulate the
experimental release of U and V from mine waste. .................................................107
Table 7.3. Reaction rate constants of metaschoepite and rutherfordine estimated by
modelling the reactive transport of U and V during mine waste reaction at
circumneutral and acidic conditions. .......................................................................108
Table 7.4. Parameters used to consider the effect of grain size on the reactive transport of
U and V during flow through column experiment with 10 mM NaHCO3. The
surface area of U-V bearing minerals was estimated using equation 13. The effective
reaction rate constant (keffective = k*𝒂𝒂𝒂𝒂𝟎𝟎) accounts for the effect of grain surface area
on the reactive transport of U and V, where k is the reaction rate constant and 𝒂𝒂𝒂𝒂𝟎𝟎
is the surface are of U-V bearing minerals. .............................................................109
Table 7.5. Elemental content of solid samples determined by acid extractions (measured
using ICP-OES/MS) of unreacted mine waste and mine waste after sequential

xviii
reaction with 10 mM NaHCO3 and CH3COOH solution during flow through column
experiments. .............................................................................................................110
Table 8.1 Elemental percentage concentrations of metals at the surface of the unreacted
and reacted Laguna mine wastes determined using X-ray Photoelectron
Spectroscopy (XPS) survey scan. ............................................................................125
Table 8.2 Percentage distribution of U(IV) and U(VI) oxidation states at the surface (top
5 nm) of the unreacted and reacted Laguna mine wastes determined using XPS
narrow scans (figure 8.8). ........................................................................................126
Table 8.3 Chemical equilibrium simulations conducted using MINEQL 4.6 to observe
the dominant aqueous complexes and mineral precipitates formed at a certain pH
and reactivity conditions. The saturation indices (SI) for schoepite during reaction
with 18MΩ water and 6% NaOCl are estimated to be, SI = 0.................................127
Table 8.4 Dissolved Organic Carbon (DOC) content dissolved from Laguna mine wastes
after reaction with 1) 18MΩ water pH 5.4 2) 10 mM NaHCO3 pH 7.5 3) 6% NaOCl
pH 7.5 and 4) 6% NaOCl + 10mM NaHCO3 pH 7.5. .............................................128
Table 8.5 Atomic content of elements in acid extracts obtained through acid digestion of
unreacted and reacted Laguna mine wastes used during batch experiments. ..........129
1
Following the Second World War (WWII), many Federal and Native American
lands were intensively mined for uranium (U) to meet the increasing demands for nuclear
weapons. Between 1944 and 1986, nearly 30 million tons of uranium ore were extracted
from land that was part of the Navajo Nation,1, 8-9 leaving significant quantities of post-
extraction waste materials. Improper disposal and handling of these wastes have resulted
in many sites across the United States (US) that have contaminated the surrounding land,
the water (groundwater and surface water), and the air resources. Therefore, there is an
increased need to understand the mechanisms that affect the transport of U and other co-
occurring metals from mine wastes under relevant environmental conditions to propose
appropriate remediation strategies.
The research described in this dissertation was intended to improve the current
understanding about the reactive transport of U, vanadium (V), and other co-occurring
metals in two mines on Native American Land: 1) Blue Gap/Tachee Claim-28 mine
waste site, NE Arizona and 2) Jackpile-Paguate mine, Laguna Pueblo, NM. This
dissertation is divided into six chapters and two appendices.
Chapter 1 provides an overview of the pivotal research issues and of the
dissertation as a whole. Chapter 2 is a summary of the scientific knowledge on 1) mining
and its impacts, 2) the physical and chemical processes that affect U mobility, and 3) the
existing research gaps. Chapters 3, 4, and 5 form the main body of work for this
dissertation are formatted as research papers.
2
Chapter 3, published in the journal Environmental Science &Technology (ES&T),
describes the investigation of the reactive transport of U and V from the Blue Gap/Tachee
Claim-28 mine waste site using laboratory experiments, reactive transport modelling, and
electron microscopy. In this chapter, we estimated the thermodynamic and kinetic
constants for dissolution of U-V bearing minerals (which have been detected in the mine
waste1) at circumneutral and acidic pH by modelling the batch and column experiments
using the multicomponent-multiphase model, PFLOTRAN. Appendix A presents
supplementary data obtained for this study.
The main objective of Chapter 4 (unpublished) is to determine the crystal
chemistry of the U-V bearing minerals that were previously identified in the Blue
Gap/Tachee Claim-28 mine wastes using spectroscopy, electron microscopy and X-ray
diffraction. In this chapter, we provide insights on the physiochemical characteristics of
U and V (i.e., structure, chemistry, morphology, and presence of inclusions) that are
fundamental to understanding their material behavior when subjected to weathering
processes in mine waste piles. Results from this chapter improve our understanding of the
fate and transport of U and V from such sites under environmentally relevant conditions.
The objective of Chapter 5 (unpublished) study was to investigate the effect of
oxidizing conditions on the co-occurring submicron U(IV) and U(VI) phases in Jackpile-
Paguate mine wastes, AZ, using laboratory experiments, spectroscopy, and electron
microscopy techniques. This chapter provides insights on the reactivity of these
submicron U(IV) and U(VI) minerals and the relevant mechanism that affects U mobility
after reaction with bicarbonate under ambient dissolved oxygen concentrations, and

3
strong oxidizing conditions. Appendix B for this chapter summarizes supplementary data
obtained for this study.
This dissertation improves our understanding of physical and chemical
mechanisms that affect the dynamic release and accumulation of U and V from
abandoned mine wastes sites by integrating knowledge from geochemistry,
thermodynamics, kinetics, mineralogy and hydrology.
4
Background and Significance
Uranium mining operations occurred during the 1900s to meet the federal government’s
demand for nuclear weapons after the Manhattan is project 2, 3 and, to a more limited
extent, for nuclear energy generation.4, 5 These mining activities left a legacy of
thousands of abandoned mines all over the United States. For example, just in the western
US, approximately 15,000 abandoned uranium mine waste sites have been identified, the
majority of which are located in Colorado, Utah, New Mexico, Arizona, and Wyoming.6-7
Seventy five percent of these sites are on federal and tribal lands.6-7 To exemplify the
national problem, about 1100 abandoned uranium mine waste sites located on the Navajo
Nation have been overlooked for decades.1, 8-9
Mining operations generate two types of waste: mine waste and mill tailings.
Mine wastes are unregulated higher concentration U ores that have been abandoned after
the mining operations ceased, while the mill tailings are the federally regulated low
concentration wastes left after processing the ore for U.1, 10 Since this dissertation focuses
on mine wastes which are generated during mining operations; limited focus has been
directed towards discussing mill tailings. Mine wastes contain mixtures of uranium (U),
vanadium (V), and other co-occurring metals.11-13 These wastes pose environmental and
health risks to nearby communities. However, before effective remedies can be proposed,
we need to know relevant details about the sites and the distribution means for the waste.
In an attempt to remediate such sites after the mine closures, these wastes were
regulated based on the Surface Mining Control and Reclamation Act of 1977 (SMCRA).
The SMCRA mandated burying the wastes under clean soil covers as an approach to

5
naturally eliminate potential health hazards.12 This method was adopted to naturally
attenuate the threat metals, especially carcinogenic metals like U. 14-18 However, natural
erosion of these soil covers has caused metal migration to the surface and into the
groundwater resources where these toxic metals have contaminated the water and
negatively impacted those who consume it. 18-19 For example, elevated metals
concentrations (with respect to their respective maximum contamination limits (MCL),
for e.g. U MCL = 30µg L-1) in the water resources surrounding such contaminated
abandoned uranium mine waste sites in southwestern United States have been reported.1,
20 These dissolved metals have the ability to act as Lewis acids, complexing with the
hydroxyl group (OH-) and causing a drop in pH. Acidic conditions in these sites can also
be caused due to acid mine drainage; that is, the outflow of acidic water from a mining
site that primarily comes from oxidation of iron sulfide (FeS2) or pyrite. 21-22 An acidic
environment is generally toxic to biota and less favorable for many other organisms than
is an environment at circumneutral pH conditions.23
Elevated concentrations of U and V in water resources pose a concern for health
risks to individuals in the surrounding communities. 14-16 For example, the adverse toxic
effects of U and V are well documented in human exposures by inhalation and by
ingestion. 24-29 Uranium exposure has long been known to cause cancer (e.g., bone,
reproductive, and gastric), kidney toxicity, miscarriages, birth defects, and heart diseases.
14, 27, 30-33 Uranium has also been linked to adverse developmental outcomes in animals.34-
35 Additionally, recent studies in Navajo communities have linked exposures to mine
wastes with an increased likelihood for developing one or more chronic diseases
including hypertension, kidney disease, and diabetes.36 Therefore there is an increased

6
need to understand the mobility and transport of U and V to develop informed and
appropriate strategies to remediate abandoned sites.
Adequate management and cleanup of abandoned mine waste sites are
challenging due to complex regulatory, social, and political factors. For instance, the
Comprehensive Environmental Response, Compensation, and Liability Act, commonly
known as the Superfund program, was created to provide assistance to clean these sites.37
However, despite the known elevated metal concentrations identified in many abandoned
mine wastes sites, limited or no action has been taken to remediate thousands of these
sites due to financial and political constraints.6-7 Providing necessary scientific data to
guide federal, state, and local governments on developing appropriate remediation
strategies for such sites is an ongoing challenge.38
Study Areas: Blue Gap Tachee Claim-28, AZ and Jackpile-Paguate Mine, NM
Mine waste sites located on Native American lands have been overlooked due to low
population densities and site remoteness. The Blue Gap/Tachee Claim-28 mine site in
northeastern Arizona and the Jackpile-Paguate mine waste site in Laguna Pueblo, New
Mexico, are two such sites that represent the study areas for this dissertation.
The Blue Gap/Tachee Chapter of the central Navajo Nation, located approximately
40 miles west of Chinle, AZ, started operating during the early 1950s. On the mesa tops
and steep slopes of this location, 13 different mines operated from 1954-1968.1 In the
early 1990s, initial reclamation efforts agglomerated the wastes in the Claim 28 site under
a layer of uncontaminated soil (SMCRA).13, 39 At Blue Gap/Tachee, the uranium ores
occur in tabular and lenticular sandstone units of the Rough Rock Sandstone member in
the Toreva formation. A recent study conducted by our research group in the Claim 28
7
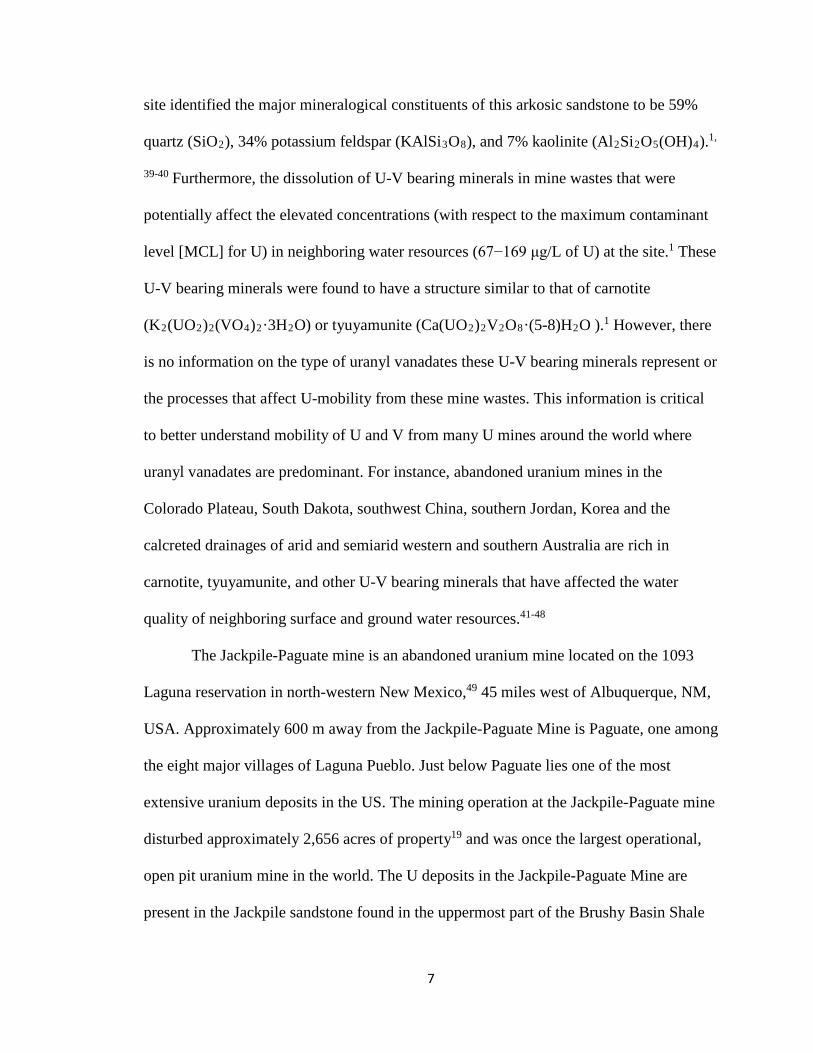
site identified the major mineralogical constituents of this arkosic sandstone to be 59%
quartz (SiO2), 34% potassium feldspar (KAlSi3O8), and 7% kaolinite (Al2Si2O5(OH)4).1,
39-40 Furthermore, the dissolution of U-V bearing minerals in mine wastes that were
potentially affect the elevated concentrations (with respect to the maximum contaminant
level [MCL] for U) in neighboring water resources (67−169 μg/L of U) at the site.1 These
U-V bearing minerals were found to have a structure similar to that of carnotite
(K2(UO2)2(VO4)2·3H2O) or tyuyamunite (Ca(UO2)2V2O8·(5-8)H2O ).1 However, there
is no information on the type of uranyl vanadates these U-V bearing minerals represent or
the processes that affect U-mobility from these mine wastes. This information is critical
to better understand mobility of U and V from many U mines around the world where
uranyl vanadates are predominant. For instance, abandoned uranium mines in the
Colorado Plateau, South Dakota, southwest China, southern Jordan, Korea and the
calcreted drainages of arid and semiarid western and southern Australia are rich in
carnotite, tyuyamunite, and other U-V bearing minerals that have affected the water
quality of neighboring surface and ground water resources.41-48
The Jackpile-Paguate mine is an abandoned uranium mine located on the 1093
Laguna reservation in north-western New Mexico,49 45 miles west of Albuquerque, NM,
USA. Approximately 600 m away from the Jackpile-Paguate Mine is Paguate, one among
the eight major villages of Laguna Pueblo. Just below Paguate lies one of the most
extensive uranium deposits in the US. The mining operation at the Jackpile-Paguate mine
disturbed approximately 2,656 acres of property19 and was once the largest operational,
open pit uranium mine in the world. The U deposits in the Jackpile-Paguate Mine are
present in the Jackpile sandstone found in the uppermost part of the Brushy Basin Shale

8
Member of the Jurassic and Cretaceous strata.50-52 Although the combined ores in the
Jackpile-Paguate mine are 2 km long and 600 m wide, the semi-tabular U deposits in the
Jackpile sandstone are only about ~5 m thick.50-52
The Rio Paguate flows from Miocene basalt and andesite flows of Mount Taylor,
southeast towards the village of Paguate through the Jurassic Morrison Formation and the
abandoned Jackpile-Paguate Mine.53 Reactions between these surface waters and U mine
wastes could affect the water quality and pose a potential human risk. For instance, a
recent study by our research group reported seasonal variations in elevated concentrations
of U and other co-occurring metals in Rio Paguate (35.3 to 772 mg L-1) that were later
identified as a consequence of dissolution of U-bearing minerals from these U-ore
deposits.54 However, the geochemical processes that affect U mobility from these mine
wastes is still not well understood.
State of the Knowledge about Processes Affecting U and V Transport from
Mine Wastes
The mobility of U and V are affected by a variety of biogeochemical and physical
processes. Uranium is an actinide abundantly found in various parts of the southwestern
US with alternating valence states among IV, V, and VI depending on the surface and
subsurface conditions in which it is present.55-58 The +6 oxidation state (U(VI)) is the
most mobile and toxic form of U. 24-26 The processes that affect U mobility are driven by
physicochemical parameters, including pH, Eh, temperature, reaction kinetics, and
elemental composition of the system.59-63 Uranium mobility is enhanced by the presence
of complexants like carbonate and bicarbonate that form aqueous complexes like U-Ca-
CO3-2 and U-CO3
-2.22, 64 Combined use of these natural complexants has been reported to
9
be effective for U mobility in systems with high calcium (Ca), sulfur (S), manganese
(Mn), and aluminum (Al) concentrations.21 Mining industries use these complexants in
alkaline leaching for targeted U extraction.65
The aqueous complexes formed from such complexation reactions adsorb onto the
oppositely charged surfaces of SiO2, hydrous ferric oxide, ferrihydrite, aluminum
hydroxides, clays, and organic matter.66-72 Uranyl complexes bind strongly onto organic
matter through either ion-exchange, coordination/complexation, donor-receptor
interactions, or Van der Waal forces at circum-neutral conditions, substantially enhancing
U mobility.71, 73-77 The degree to which the U mobility is enhanced depends on 1) the
electrostatic potential between aqueous complexes and organic matter surfaces, 2)
hydrophobicity of organic matter, and 3) the ability of U(VI)-organic matter colloids to
stay suspended.73, 78-79 Like aqueous U(VI), monomeric U(IV), which represents non-
crystalline U(IV) species, also adsorb onto organic matter aggregates and organic-carbon
coated clays that possess higher mobility and toxicity considering their susceptibility to
desorb and reoxidize.72, 80 Only recently were monomeric biogenic U(IV) species found
to be present at undisturbed roll front ore deposits.81 In addition to adsorption, the
tetravalent and hexavalent U also form bidentate aqueous complexes with organic
matter.82
Formation of sparingly soluble, biogenic, and chemogenic U(IV) through reduction
reactions has been used as techniques to immobilize aqueous U.83-85 The reduction of
aqueous U(VI) can result in the formation of crystalline, submicron, biogenic, and
chemogenic U(IV) phases whose dissolution rates and energetics are very similar to those
of coarser U(IV) phases.86-88 Submicron U particles and U adsorbed onto colloids of
10
organic matter and oxides form about 30-40% of the total naturally occurring mobile
U.89-90 In addition to sorption, U mobility can also be affected by dissolution/precipitation
of U minerals. For instance, U occurs in the environment as vanadate, silicate, phosphate,
carbonate and oxide minerals.91-98
Similarly, V is a redox active, transition metal that co-occurs with U at oxidation
states from II to V.5, 99-102 Vanadium is most soluble as V(IV), and V(V) 99-102, among
which V(V) is considered most mobile and toxic. 24-26 Like U, V is also mobilized by
carbonate reagents.1 However, unlike U, it does not complex with dissolved carbonate.
Instead, its oxyanionic behavior causes the formation of aqueous anionic
[V10O26(OH)24−, V10O27(OH)5−, V10O28
6− ,VO2(OH)2−, VO3(OH)2−, VO43−,
V2O6(OH)3−, V2O74−, V3O9
3− and V4O124−], cationic [VO2+] and neutral [VO(OH)3]
species.60, 62, 103-104 These aqueous complexes of U and V adsorb onto ferrihydrite,
aluminum hydroxides, and clays through electrostatic interactions62, 104-106 44, 48, 50-52, 86-91,
depending on the pHpzc of the solids. Uranium and V could also be immobilized through
precipitation of secondary mineral phases such as carnotite (K2(UO2)2(VO4)2·3H2O and
vanadinite (Pb5(VO4)3Cl)63, 41, 98 These geochemical processes are key to the aqueous
and solid speciation of U and V.
In addition to solid and aqueous chemistry of U and V, other factors such as
kinetics, thermodynamics, and crystal chemistry of minerals are also critical to
understand their reactive transport under relevant environmental conditions. The reactive
transport of metals can be described using reactive transport models, e.g., PFLOTRAN,
which is the reactive transport model used in this dissertation.
11
PFLOTRAN is a multicomponent-multiphase model that couples thermodynamics,
kinetics, hydrology, and aqueous chemistry to simulate the interfacial mechanisms that
affect the mobilization of U and other metals in surface and subsurface environments.
Previous studies have used reactive transport modelling to investigate the adsorption
behavior of U(VI) complexes onto alluvial aquifer sediments.107, 108 The subsurface
desorption kinetics of U(VI) species suggest a non-equilibrium sorption behavior with
Fe-oxides, Mn-oxides, and phyllosilicates.109-111 Uranium transport can also be attributed
to dissolution of mineral phases. For example, U transport from contaminated, subsurface
sediments from the Hanford site, WA, was affected by the dissolution of metatorbernite
[Cu(UO2)2(PO4)2·8H2O], cuprosklodowskite (Cu[(UO2)(SiO2OH)]2·6H2O), and Na-
boltwoodite [NaUO2(SiO3OH)·1.5H2O].95, 110, 112 The development of reactive transport
models that represent environmentally relevant oxidizing conditions in abandoned mine
waste sites is necessary to better understand the mobility of U and other metals.
The mobility of U and other metals is also affected by the crystal chemistry of the
naturally-occurring U-minerals in the mine waste. Crystal chemistry is the study of
chemistry principles behind the assembly of crystals and their use in describing structure-
property relations in solids. An example about the importance of crystal chemistry is
presented in recent studies, which tried to observe the effect of crystallinity on dissolution
of glass and natural silicate minerals. These studies reported that dissolution rates
increase with increasing Si:O ratio, which is higher in glass than in natural silicate
minerals. For example, ultra-mafic glasses (Si:O ≤0.28) dissolve at similar rates as
correspondingly compositioned minerals, but Si-rich glasses such as rhyolite (Si:O ~
12
0.40) dissolves ≥1.6 orders of magnitude faster than corresponding minerals.113-114, 115
Therefore, in order to better understand the transport of U and V from abandoned mine
wastes, the effect of crystal chemistry should be considered as these affect
biogeochemical and physical processes. For instance, the general formula used to
represent several uranyl vanadates is Mn+1/nUO2AO4.xH2O where, M is a cation that can
be either mono-, di- or tri-valent elements of groups I and II in the periodic table93, 116-119
that are comprised of [(UO2)2V2O8]n-2n layers and water.117,120-121 Understanding the
crystal chemistry is essential to understand the dissolution and reactivity of these U-V-
bearing minerals in mine waste sites.
Research Gap and Objectives
Previous studies have identified the factors that affect individual transport of U or V.
However, the specific mechanisms affecting the transport of U and other co-occurring
metals in abandoned mine waste sites remains poorly understood. For instance, in a
recent study the mobility of both U and arsenic (As) from a U mill tailing site in South
Dakota were observed.122 Yet the specific processes affecting the transport of these
metals are unknown.93 In addition, previous investigations have provided limited
information on 1) the release of metal mixtures from uranium mine wastes; and 2) the
interactions, co-occurrence, and behavior of these metal mixtures in the environment
under relevant field conditions. Scientific knowledge obtained from this study can be
applied to other abandoned uranium mines in U.S. that bear a similar mineralogy or
geology as the two study sites of focus in this dissertation.123-124
The goal of this research was to provide essential insights on the mechanisms that
13
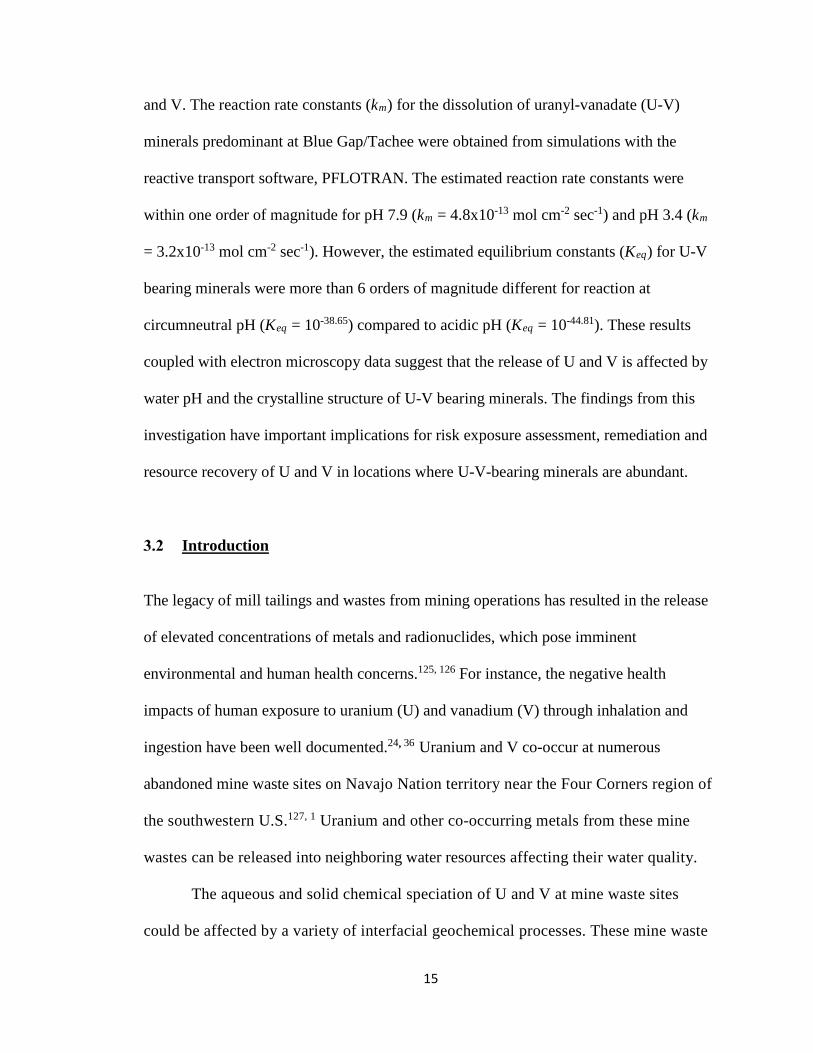
affect the reactive transport of U and V from abandoned uranium mine wastes. This
information on the reactivity and mobility of U and V can be key to understanding the
potential metal exposure pathways in abandoned uranium mine waste sites. The approach
and the methods used to in this research involve contributions from different disciplines
that include inorganic chemistry, geochemistry, minerology, analytical chemistry, and
environmental science; the interdisciplinary nature of the project is relevant to any
remediation proposals arising from the study.
The three specific research objectives of this research include:
1. Investigate the reactive transport of U and V from the Blue Gap/Tachee Claim-
28 mine waste site through laboratory experiments, reactive transport modelling,
and electron microscopy techniques.
2. Investigate the crystal chemistry of U-V bearing minerals occurring in the Blue
Gap/Tachee Clim-28 mine waste using the properties of synthesized primary ores
as a reference.
3. Investigate the effect of oxidizing conditions on the co-occurring nano-particulate
U(IV) and U(VI) phases in Jackpile mine wastes using laboratory experiments,
spectroscopy, and electron microscopy techniques.
Addressing these research objectives in the following order will help to explain the role
of thermodynamics, crystallinity, stoichiometry, and solution chemistry on the reactive
transport of U and V from such mine wastes that pose as a threat to neighboring surface
and ground water quality.
14
(Published in Environmental Science & Technology)
Sumant Avasarala1, Peter C. Lichtner 2, Abdul-Mehdi S. Ali3, Ricardo González-Pinzón1,
Johanna M. Blake4a and José M. Cerrato1*
*Corresponding email address: [email protected]
Telephone: (001) (505) 277-0870
Fax: (001) (505) 277-1918
1 Department of Civil Engineering, MSC01 1070, University of New Mexico, Albuquerque, New Mexico 87131, USA. 2 OFM Research-Southwest, Santa Fe, New Mexico 87507, USA.
3Department of Earth and Planetary Sciences, MSC03 2040, University of New Mexico, Albuquerque, New Mexico 87131, USA. 4Department of Chemistry, MSC03 2060, University of New Mexico, Albuquerque, New Mexico 87131, USA. a Current address: U.S. Geological Survey, New Mexico Water Science Center, 6700 Edith Blvd NE., Albuquerque, New Mexico, USA.
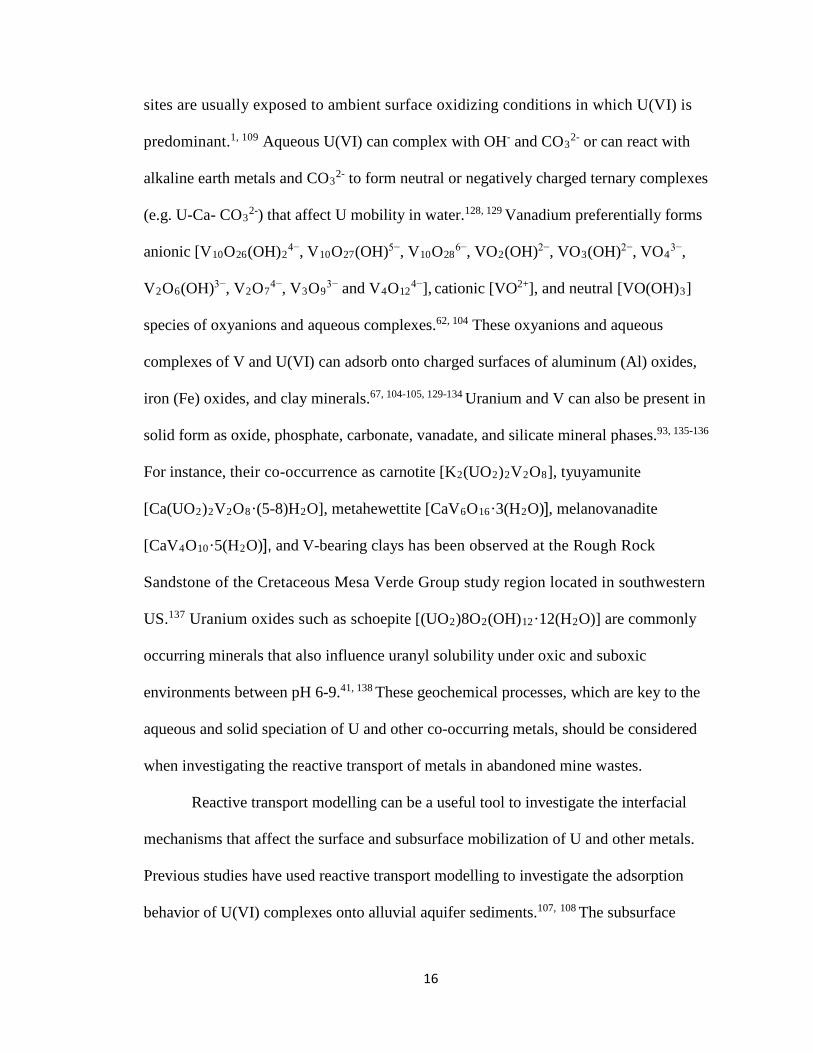
Abstract
The reactive transport of uranium (U) and vanadium (V) from abandoned mine wastes
collected from the Blue Gap/Tachee Claim-28 mine site, AZ, was investigated by
integrating flow-through column experiments with reactive transport modelling, and
electron microscopy. The mine wastes were sequentially reacted in flow-through columns
at pH 7.9 (10 mM NaHCO3) and pH 3.4 (10 mM CH3COOH) to evaluate the effect of
environmentally relevant conditions encountered at Blue Gap/Tachee on the release of U
15
and V. The reaction rate constants (km) for the dissolution of uranyl-vanadate (U-V)
minerals predominant at Blue Gap/Tachee were obtained from simulations with the
reactive transport software, PFLOTRAN. The estimated reaction rate constants were
within one order of magnitude for pH 7.9 (km = 4.8x10⁻¹³ mol cm-2 sec-1) and pH 3.4 (km
= 3.2x10⁻¹³ mol cm-2 sec-1). However, the estimated equilibrium constants (Keq) for U-V
bearing minerals were more than 6 orders of magnitude different for reaction at
circumneutral pH (Keq = 10-38.65) compared to acidic pH (Keq = 10-44.81). These results
coupled with electron microscopy data suggest that the release of U and V is affected by
water pH and the crystalline structure of U-V bearing minerals. The findings from this
investigation have important implications for risk exposure assessment, remediation and
resource recovery of U and V in locations where U-V-bearing minerals are abundant.
Introduction
The legacy of mill tailings and wastes from mining operations has resulted in the release
of elevated concentrations of metals and radionuclides, which pose imminent
environmental and human health concerns.125, 126 For instance, the negative health
impacts of human exposure to uranium (U) and vanadium (V) through inhalation and
ingestion have been well documented.24, 36 Uranium and V co-occur at numerous
abandoned mine waste sites on Navajo Nation territory near the Four Corners region of
the southwestern U.S.127, 1 Uranium and other co-occurring metals from these mine
wastes can be released into neighboring water resources affecting their water quality.
The aqueous and solid chemical speciation of U and V at mine waste sites
could be affected by a variety of interfacial geochemical processes. These mine waste
16
sites are usually exposed to ambient surface oxidizing conditions in which U(VI) is
predominant.1, 109 Aqueous U(VI) can complex with OH- and CO32- or can react with
alkaline earth metals and CO32- to form neutral or negatively charged ternary complexes
(e.g. U-Ca- CO32-) that affect U mobility in water.128, 129 Vanadium preferentially forms
anionic [V10O26(OH)24−, V10O27(OH)5−, V10O28
6−, VO2(OH)2−, VO3(OH)2−, VO43−,
V2O6(OH)3−, V2O74−, V3O9
3− and V4O124−], cationic [VO2+], and neutral [VO(OH)3]
species of oxyanions and aqueous complexes.62, 104 These oxyanions and aqueous
complexes of V and U(VI) can adsorb onto charged surfaces of aluminum (Al) oxides,
iron (Fe) oxides, and clay minerals.67, 104-105, 129-134 Uranium and V can also be present in
solid form as oxide, phosphate, carbonate, vanadate, and silicate mineral phases.93, 135-136
For instance, their co-occurrence as carnotite [K2(UO2)2V2O8], tyuyamunite
[Ca(UO2)2V2O8·(5-8)H2O], metahewettite [CaV6O16·3(H2O)], melanovanadite
[CaV4O10·5(H2O)], and V-bearing clays has been observed at the Rough Rock
Sandstone of the Cretaceous Mesa Verde Group study region located in southwestern
US.137 Uranium oxides such as schoepite [(UO2)8O2(OH)12·12(H2O)] are commonly
occurring minerals that also influence uranyl solubility under oxic and suboxic
environments between pH 6-9.41, 138 These geochemical processes, which are key to the
aqueous and solid speciation of U and other co-occurring metals, should be considered
when investigating the reactive transport of metals in abandoned mine wastes.
Reactive transport modelling can be a useful tool to investigate the interfacial
mechanisms that affect the surface and subsurface mobilization of U and other metals.
Previous studies have used reactive transport modelling to investigate the adsorption
behavior of U(VI) complexes onto alluvial aquifer sediments.107, 108 The subsurface
17
desorption kinetics of U(VI) species suggest a non-equilibrium sorption behavior with
Fe-oxides, manganese (Mn) oxides, and phyllosilicates.109-111 Uranium transport can also
be attributed to dissolution of mineral phases. For example, U transport from
contaminated subsurface Hanford Sediments was affected by the dissolution of
metatorbernite [Cu(UO2)2(PO4)2·8H2O], cuprosklodowskite
(Cu[(UO2)(SiO2OH)]2·6H2O), and Na-boltwoodite [NaUO2(SiO3OH)·1.5H2O].95, 110, 112
The development of similar reactive transport models that represent environmentally
relevant oxidizing conditions in abandoned mine waste sites is necessary to better
understand the mobility of U, V, and other metals.
Previous laboratory-based studies have shown that U and V can interact through
precipitation reactions forming uranyl vanadate minerals with potassium and calcium
(e.g., carnotite [K2(UO2)2(VO4)2·3H2O] and tyuyamunite [Ca(UO2)2V2O8·5-
8(H2O)]).93, 139 These studies used batch experiments and thermodynamic predictions to
identify precipitation of uranyl vanadates as an effective method to immobilize U and V
below the U-maximum contaminant level (MCL, 30 µg L-1) between pH 5.5-7. 93, 139 The
thermodynamic estimations calculated in these studies were in agreement with those
previously calculated by Langmuir.140 However, these theoretically estimated
thermodynamic constants are limited to synthetic minerals that have been subjected to
specific reactivity conditions that could differ from those of U-V bearing minerals
occurring in the environment.
A recent study conducted by our research group at the Blue Gap/Tachee Claim-
28 mine site located in Northeastern Arizona reported that the dissolution of U-V
bearing minerals affects the mobility of U and V at pH conditions observed in the field,

18
which range from 3.8 to 7.4.1 Results showed that U and V co-occur in mine wastes
predominantly as U(VI) and V(V). The Extended X-Ray Absorption Fine Structure
(EXAFS) fittings suggest that U and V coordination in these mine waste samples is
similar to that of minerals such as carnotite [K2(UO2)2(VO4)2·3H2O] or tyuyamunite
[Ca(UO2)2V2O8.5-8(H2O)]. Additionally, results from this study suggest dissolution of
these U-V bearing minerals are a potential source to the elevated metal concentrations in
neighboring surface water resources.1 Although this study represents a valuable first
attempt to identify the co-occurrence of U and other metals at this abandoned mine waste
site, the mechanisms affecting the reactive transport of U, V, and other metals remain
unknown.
The objective of this study is to investigate the reactive transport of U and V from
the Blue Gap/Tachee Claim-28 mine waste site through laboratory experiments, reactive
transport modelling, and electron microscopy. In the current investigation we seek to
determine the equilibrium and reaction rate constants for dissolution of these U-V bearing
minerals at circumneutral and acidic pH by modelling the batch and column experiments
performed in this study with PFLOTRAN.27-28, 33 This study was developed based on our
prior evidence that suggested U-V bearing mineral phases as the potential source to U
and V release from Blue Gap/Tachee mine wastes.1 Our integrated approach of using
microscopy and reactive transport modelling serves as a foundation to better understand
the mechanisms affecting the reactivity of mine wastes and the transport of U and V
under environmentally relevant conditions.
Materials and Methods
19
Mine waste and background sediments were collected from the Blue Gap/Tachee Claim-
28 mine site in January, 2014, to identify the processes and phases that affect the U and V
transport into neighboring surface and ground water resources. Sediment samples from
the site included mine waste and Baseline Reference Soil (background soil) previously
characterized by Blake et al., 2015.1 The Blake et al. study used powder X-ray diffraction
to identify quartz (SiO2; 59%), potassium feldspar (KAlSi3O8; 34%), and kaolinite
(Al2Si2O5(OH)4; 7%) as the major mineralogical constituents. Additionally the co-
occurrence of U and V and predominance of U(VI) and V(V) were identified using
microscopy, X-Ray Photoelectron Spectroscopy (XPS), and X-Ray Absorption Near
Edge Spectroscopy (XANES) techniques. Furthermore, the coordination numbers
obtained from EXAFS fits suggested the structure of the U-V bearing mineral to be
similar to that of carnotite or tyuyamunite.1
We conducted batch experiments to model the U and V release at circumneutral (8.3) and
acidic (3.4) pH and determined the equilibrium and reaction rate constants for dissolution
of U-V bearing mineral phases. The determined equilibrium constant was then used to
obtain the reaction rate constants for U-V bearing mineral dissolution during column
experiments. Briefly in the batch experiments, we reacted 0.1 g of mine wastes and
background soil samples that were sieved to <63 μm size (using U.S. standard sieve
series number 230), with 50 mL 10 mM NaHCO3 (pH 8.3) and 10 mM C6H8O6 (pH 3.8)
through gentle shaking in 50 mL centrifuge tubes for 264 hours, as described in Blake et
al.1 During the experiments we collected 2 mL aliquots 0.5, 1, 2, 6, 24, 48, 96, and 264 h

20
after the experiment began. We diluted these aliquots and analyzed for elemental
concentrations using Inductively Coupled Plasma Optical Emission Spectroscopy and
Mass Spectroscopy (ICP-OES/MS). All batch experiments were conducted in triplicates.
A column experiment was conducted to investigate the transport of U and V from Blue
Gap/Tachee Claim-28 sediments. An initial set of experiments consisted of reacting mine
waste and background soil with 18MΩ water at pH 5.4 to evaluate the release of water-
soluble U and V. Another set of experiments were performed in parallel where the mine
waste and background soil were sequentially reacted at pH 7.9 (using 10 mM NaHCO3)
and pH 3.4 (using 10 mM CH3COOH). These pH values and concentrations represent
environmentally relevant conditions observed at the study site.1 We prepared samples by
crushing and homogenizing sediments with a Spex shatter box and sieving through U.S.
standard sieve with series 120-45 to obtain particle sizes between 125-355 µm. The
homogenized sieved fractions were then packed into cylindrical Pyrex glass columns
with an inner diameter of 1 cm and a height of 10 cm using vacuum filter pumps.
Solutions of 10 mM NaHCO3 and 10 mM CH3COOH were prepared using 18MΩ
deionized water, NaHCO3, and 17.4N CH3COOH. The prepared solutions were pumped
against gravity through the packed columns at 0.9 mL min-1 using a Masterflex L/S
series 8-channel peristaltic pump. The column experiments were conducted on eight
columns in parallel (Appendix A: Figure 7.1). We chose 0.9 mL min-1 based on existing
literature109-110, 141 as a typical groundwater rate to evaluate how solutions at
circumneutral and acidic conditions would react with mine wastes. Columns 1, 2, 5, and 6
were packed with mine waste and columns 3, 4, 7, and 8 were packed with background

21
soil. Columns 1-4 were reacted with 18MΩ water for 90 minutes with a total of 23
(columns 1-2) and 31 (columns 3-4) pore volumes (PV) at the rate of 3.53, and 2.65 cm3
PV-1, respectively. Columns 5-8 were sequentially reacted for one week each (10,080
min) with 10 mM NaHCO3 and 10 mM CH3COOH (Appendix A: Figure 7.1). The one
week reaction time resulted in 2570 PV for columns 5 and 6 and 3450 PV for columns 7
and 8. Samples were collected at 10, 20, 30, 40, 50, 60, 70, 80, and 90 min of reaction
time from the outlets of columns 1, 2, 3, and 4. Samples were collected columns 5–8, at
30, 180, 540, 1440, 2880, 4320, 5760, 7,200, and 10,080 min after sequential reaction
with 10 mM NaHCO3 and 10 mM CH3COOH solutions. The sample aliquots were
filtered using a 0.45 μm syringe filter and diluted accordingly for analyses. All
experiments were performed at room temperature (25° C) and, consequently, that
temperature was set for the reactive transport of modelling.
We used a PerkinElmer Optima 5300DV inductively coupled plasma-optical emission
spectrometer (ICP-OES) and a PerkinElmer NexION 300D (Dynamic Reaction Cell)
inductively coupled plasma-mass spectrometer (ICP-MS) to obtain the trace metal
concentrations in experimental aliquots and total acid extracts of mine waste and
background soil. The solution pH was measured using a Thermo Scientific Orion
Versastar Advanced Electrochemistry pH meter. Additional technical details of these
methods are described in the Supporting Information (SI).
We used PFLOTRAN a surface-subsurface multiphase, multicomponent reactive flow
and transport model 110-111, 142 to determine the equilibrium constants for U-V bearing
22
mineral dissolution at circumneutral and acidic pH (batch experiments) and to identify
the processes controlling the reactive transport of U and V from mine waste (column
experiments).
In order to model the batch and column experiments, we used various U and V
bearing aqueous species and mineral, their associated thermodynamic equilibrium
constants (Keq), and stoichiometric reaction coefficients (Tables 7.1 and 7.2) as inputs for
PFLOTRAN. Most of the listed parameters were fixed except for the equilibrium
constant of carnotite and reaction rate constants of the U-V bearing minerals,
metaschoepite [(UO2)8O2(OH)12·12(H2O)], and rutherfordine [(UO2)CO3] that were
varied to fit the experimental data and to obtain the equilibrium and reaction rate
constants for dissolution of U-V bearing minerals. At circumneutral pH, minerals such as
metaschoepite and rutherfordine were considered in the model as they are commonly
occurring oxides and carbonates of U that affect U transport. 41, 143-145 In addition to
metaschoepite and rutherfordine, surface complexation reactions for >SOUO2OH and
>SOHUO2CO3 were also considered in order to understand the effect of sorption on the
reactive transport of U.146 The equilibrium constants estimated for U-V bearing minerals
by modelling the batch experiments at circumneutral and acidic pH were used to estimate
their reaction rate constants during column experiments.
Some key assumptions made in the model include: 1) U-V bearing minerals are
the dominant U phase in the mine waste sample, 2) the U-V bearing minerals have
similar properties to those of carnotite [K2(UO2)2(VO4)2·3H2O], and 3) the U-V bearing
mineral particles are spherical in shape. These assumptions were made based on our
previously published information on the Blue Gap/Tachee mine site, where the EXAFS
23
fits of U-V bearing minerals, which were dominant in the mine waste, suggested similar
coordination as carnotite or tyuyamunite.1 The spherical shape of the U-V bearing
minerals was assumed for calculation simplifications.
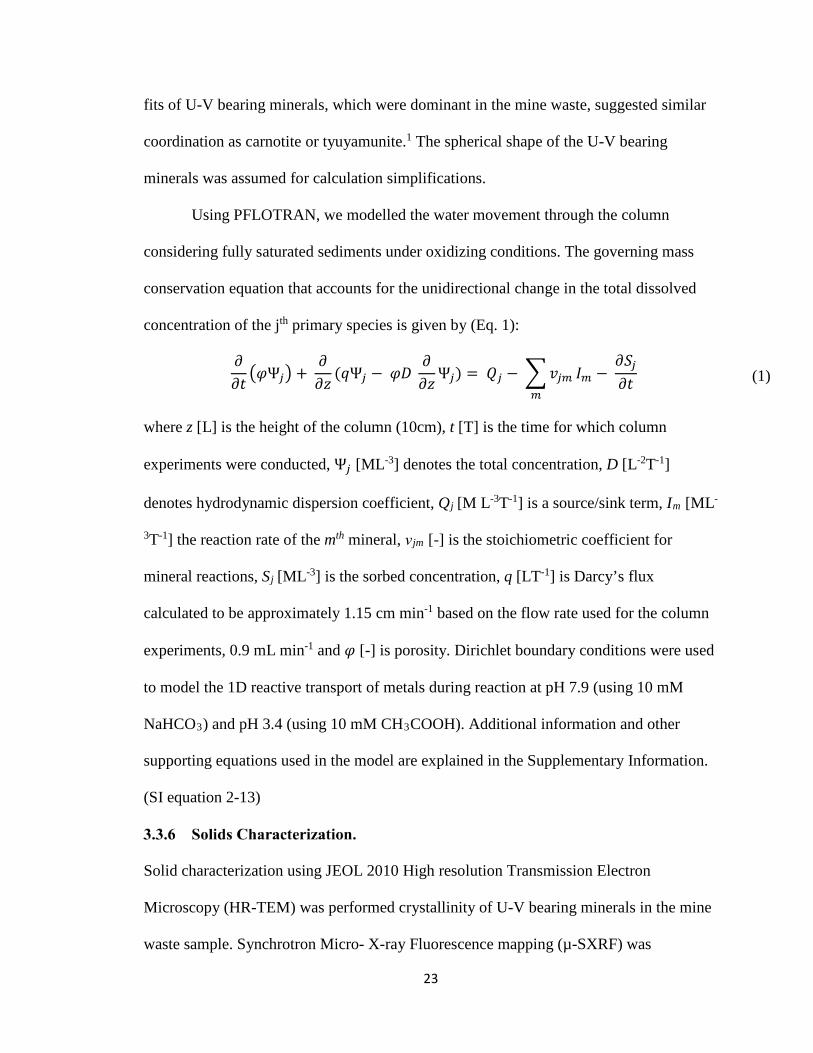
Using PFLOTRAN, we modelled the water movement through the column
considering fully saturated sediments under oxidizing conditions. The governing mass
conservation equation that accounts for the unidirectional change in the total dissolved
concentration of the jth primary species is given by (Eq. 1):
𝜕𝜕𝜕𝜕𝜕𝜕𝜑𝜑Ѱ𝑗𝑗 +
𝜕𝜕𝜕𝜕𝜕𝜕
(𝑞𝑞Ѱ𝑗𝑗 − 𝜑𝜑𝜑𝜑 𝜕𝜕𝜕𝜕𝜕𝜕Ѱ𝑗𝑗) = 𝑄𝑄𝑗𝑗 − 𝑣𝑣𝑗𝑗𝑗𝑗
𝑗𝑗
𝐼𝐼𝑗𝑗 − 𝜕𝜕𝑆𝑆𝑗𝑗𝜕𝜕𝜕𝜕
(1)
where z [L] is the height of the column (10cm), t [T] is the time for which column
experiments were conducted, Ѱ𝑗𝑗 [ML-3] denotes the total concentration, D [L-2T-1]
denotes hydrodynamic dispersion coefficient, Qj [M L-3T-1] is a source/sink term, Im [ML-
3T-1] the reaction rate of the mth mineral, νjm [-] is the stoichiometric coefficient for
mineral reactions, Sj [ML-3] is the sorbed concentration, q [LT-1] is Darcy’s flux
calculated to be approximately 1.15 cm min-1 based on the flow rate used for the column
experiments, 0.9 mL min-1 and 𝜑𝜑 [-] is porosity. Dirichlet boundary conditions were used
to model the 1D reactive transport of metals during reaction at pH 7.9 (using 10 mM
NaHCO3) and pH 3.4 (using 10 mM CH3COOH). Additional information and other
supporting equations used in the model are explained in the Supplementary Information.
(SI equation 2-13)
Solid characterization using JEOL 2010 High resolution Transmission Electron
Microscopy (HR-TEM) was performed crystallinity of U-V bearing minerals in the mine
waste sample. Synchrotron Micro- X-ray Fluorescence mapping (µ-SXRF) was
24
conducted in beamline (BL) 10-2 in Stanford Synchrotron Radiation Lightsource (SSRL).
Additional technical details of these methods are described in the Supporting Information
(SI).
Results and Discussion
We investigated the potential release of water-soluble U and V from mine waste solids by
reacting columns with 18MΩ water as a function of pore volumes and time (Appendix A:
Figure 7.2). Aqueous concentrations as high as 2.3x10⁻⁷ M U and 74x10-6 M V were
measured. For reference, the concentrations of U released from this reaction (~2.3x10⁻⁷
M) were similar to the concentrations observed in one of the water sources proximate to
the site (spring concentrations equal to 2.8x10⁻⁷ M), as was shown in a previous study
conducted by our group.1 These mobilized concentrations were almost two times higher
than the regulated U.S. Environmental Protection Agency Maximum Contaminant Level
(MCL) of U, i.e., 1.3x10⁻⁷ M (30 µg L-1).8 The U and V concentrations released after
reaction of background soil (control) with 18MΩ water were either below the MCL for U
or below the detection limit of the ICP-OES/MS instruments. The presence of U and V in
the effluent solution can be attributed to possible contributions from electrostatically
bound chemical species in the diffused layer or dissolution of soluble oxide phases, such
as schoepite [(UO2)8O2(OH)12·12(H2O)] and V oxides as observed in other
investigations.147-149 The mobility of such labile aqueous species from mine waste is
environmentally relevant. Further investigation of the reactive transport of U and V based
on co-occurring U-V bearing mineral phases was conducted by sequentially reacting
mine waste and background soil with circumneutral and acidic reagents.
25
The reactive transport model developed for batch experiments reacting mine waste with
10 mM NaHCO3 identified dissolution of U-V bearing minerals as the key process
affecting the dissolved concentrations of U and V (Figure 3.2A, B). The equilibrium
constant (Keq) for U-V bearing mineral dissolution was estimated to be 10-44.81 (Table
3.1), which was almost 12 orders of magnitude lower than that reported in literature for
carnotite (Keq = 10-56.38).150 The difference between the Keq for dissolution of U-V
bearing minerals and carnotite can be attributed to a difference in reactivity conditions
and crystallinity between U-V bearing minerals in the mine wastes and carnotite. In
addition, the estimated reaction rate constant (km) for U-V mineral dissolution was
2.13x10⁻¹⁴ mol cm-2 sec-1 (Table 3.1). Similarly, the estimated km values for precipitation
of metaschoepite and rutherfordine were approximately 1x10-15 and 2x10-16 mol cm-2 sec-
1, respectively (Table 7.3). The nature of a reaction (i.e., dissolution or precipitation) can
be identified from the sign convention of the reaction rate (Im) appearing in PFLOTRAN;
that is, negative for dissolution and positive for precipitation. These results are in
agreement with observations previously made at the nearby Colorado Plateau deposits
where precipitation of metaschoepite from aqueous U concentrations between pH 6-10
was reported.41 The equilibrium constants estimated by modelling these batch
experiments at circumneutral conditions were then used as a foundation for identifying
the reaction rate constants for U-V bearing mineral dissolution in the column
experiments.
26
A linear correlation with a slope of 1.45 and a R2 of 0.993, observed between molar
concentrations of U and V (Appendix A: Figure 7.3A) that were mobilized during mine
waste reaction with 10 mM NaHCO3, suggested dissolution of U-V bearing mineral
phases as a potential source. These results agree with a previous study from our research
group where a linear correlation between U and V was observed (slope= 0.636 and R2 =
0.95) in batch experiments reacting mine wastes with 10 mM NaHCO3 at pH 8.3.1 The U
and V release patterns obtained from these experiments were then simulated using
PFLOTRAN to further understand the processes affecting the reactive transport of U and
V.
Similar to modelling results from the batch experiments, the reactive transport
model for flow-through column experiments on reaction with 10 mM NaHCO3 suggested
dissolution of U-V bearing minerals as the primary mechanism affecting U and V
transport. The effluent concentrations of U and V, reported as a function of pore volumes
(Figure 3.2C, D) and time (Appendix A: Figure 7.4), were compared to those obtained
from the reactive transport model (PFLOTRAN). PFLOTRAN used the estimated Keq =
10-44.811 for U-V bearing mineral dissolution from batch experiments to adequately fit the
flow-through column experiments data and to estimate the km and fitting parameter (nm)
for U-V bearing mineral phase dissolution. The fitting parameter nm, to which the non-
linear water-rock reactions are sensitive (SI equations 5, 8), and km were estimated to be
5.2 and 4.8x10⁻¹³ mol cm-2 sec-1, respectively. In addition, the negative reaction rate (Im)
suggested the dissolution of U-V bearing minerals. The km estimated for the dissolution
of U-V bearing minerals (4.8x10⁻¹³ mol cm-2 sec-1) during column experiments was
different from that estimated for the batch experiments i.e., km = 2.13x10⁻¹⁴ mol cm-2 sec-
27
1 (Table 3.1). The increase in km cannot specifically be attributed to a single process.
However, the difference in the effective reaction rate constant (keffective = km*𝑎𝑎𝑗𝑗0 ),
estimated using the average surface area, can be attributed to differences in grain size and
reactivity conditions, which include flow and heterogeneity in sample composition (Table
3.1). Observing the effect of grain size on the reactive transport of U and V is also
important151, 48 as the sieved samples may contain nanocrystals of U-V and other co-
occurring U and V minerals that were bound electrostatically to the surface of coarser
particles.78 After the effect of grain size was introduced into PFLOTRAN, by adding U-V
bearing minerals of variable sizes and surface areas, their effective reaction rate constants
(keffective) were estimated (Table 7.4). The change in the estimated keffective for various U-V
bearing mineral phases was negligible (Table 7.4), leading to the inference that the effect
of grain size on the reactive transport of U and V is minimal (Appendix A: Figure 7.5).
Other secondary mineral phases of U like oxides, phosphates, silicates, and
vanadates soluble at circumneutral pH that have not been considered in this model could
also contribute to the release of U and V from mine waste.139, 147, 152-153 For instance, a
Back Scatter Electron- Scanning Electron (BSE-SEM) micrograph that shows the
association of V with Fe and K was collected (Appendix A: Figure 7.6). The co-
occurrence of U with other elements (e.g., Se and Sr) was also observed using
synchrotron µ-XRF mapping (Appendix A: Figure 7.7). The contribution of these
secondary mineral phases can be expected especially considering 1) the heterogeneity of
mine waste, 2) the discrepancies between experimental and model U concentrations, and
3) the initial experimental V concentrations are much higher than the model.149 However,
after 3-4 hours of reaction, the experimental V concentrations agree well with the model
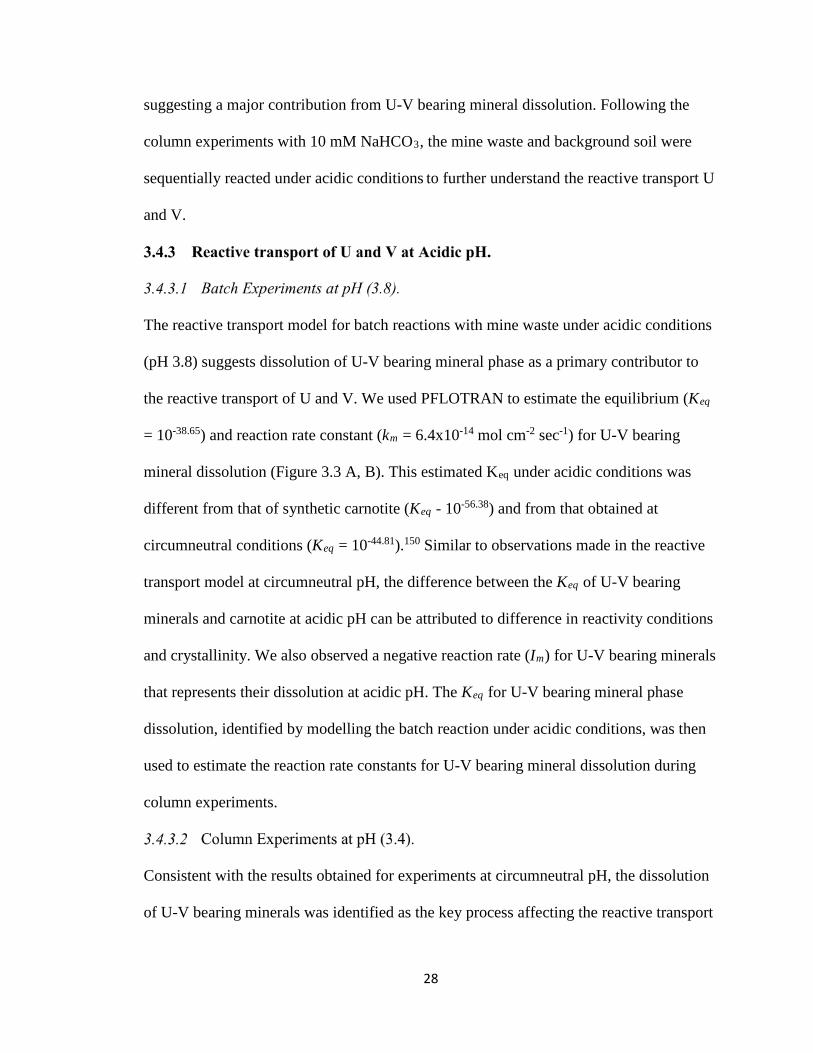
28
suggesting a major contribution from U-V bearing mineral dissolution. Following the
column experiments with 10 mM NaHCO3, the mine waste and background soil were
sequentially reacted under acidic conditions to further understand the reactive transport U
and V.
The reactive transport model for batch reactions with mine waste under acidic conditions
(pH 3.8) suggests dissolution of U-V bearing mineral phase as a primary contributor to
the reactive transport of U and V. We used PFLOTRAN to estimate the equilibrium (Keq
= 10-38.65) and reaction rate constant (km = 6.4x10⁻¹⁴ mol cm-2 sec-1) for U-V bearing
mineral dissolution (Figure 3.3 A, B). This estimated Keq under acidic conditions was
different from that of synthetic carnotite (Keq - 10-56.38) and from that obtained at
circumneutral conditions (Keq = 10-44.81).150 Similar to observations made in the reactive
transport model at circumneutral pH, the difference between the Keq of U-V bearing
minerals and carnotite at acidic pH can be attributed to difference in reactivity conditions
and crystallinity. We also observed a negative reaction rate (Im) for U-V bearing minerals
that represents their dissolution at acidic pH. The Keq for U-V bearing mineral phase
dissolution, identified by modelling the batch reaction under acidic conditions, was then
used to estimate the reaction rate constants for U-V bearing mineral dissolution during
column experiments.
Consistent with the results obtained for experiments at circumneutral pH, the dissolution
of U-V bearing minerals was identified as the key process affecting the reactive transport

29
of U and V during column experiments under acidic conditions. A linear correlation
(slope of 0.862 and a R2 of 0.983) between effluent molar concentrations of U and V was
also observed in column experiments under acidic conditions (Appendix A: Figure 7.3B).
However, the rates of dissolution obtained for column experiments at acidic conditions
are higher compared to those at circumneutral conditions (Table 3.1). Given that the pKa
of CH3COOH is 4.74, >90% of CH3COOH remains protonated. Therefore, more
contribution from dissolution by acetic acid (protonated form) over complexation or
reduction reactions caused by acetate (non-protonated form) at pH 3.4 is expected.154
These results agree with observations made in our previous study at Blue Gap/Tachee
where linear correlations with a slope of 1.08 and a R2 of 0.996 between molar
concentrations of U and V were observed.1 Additionally, 99.1% U and 92.8% V of the
total elemental content present in the mine waste were extracted through the sequential
reaction of solids in column experiments with 10 mM NaHCO3 and CH3COOH. Note
that the acid extractable content of unreacted mine wastes was 1912.12 mg Kg-1 U and
858.01 mg Kg-1 V (Table 7.5). The U and V concentrations released during these
continuous sequential reactions showed strong agreement with the modelled U and V
concentrations, suggesting dissolution of U-V bearing minerals as a primary contributor
to the reactive transport of U and V.
Different Keq and km values for dissolution of U-V bearing minerals were
obtained for mine waste reaction under circumneutral and acidic conditions during flow-
through column experiments (Figure 3.3 C, D and Appendix A: Figure 7.8). The reactive
transport model constructed, with a known Keq for metaschoepite (-105.26)148 and Keq for
U-V bearing mineral phase (-10-38.651) estimated from batch reaction under acidic
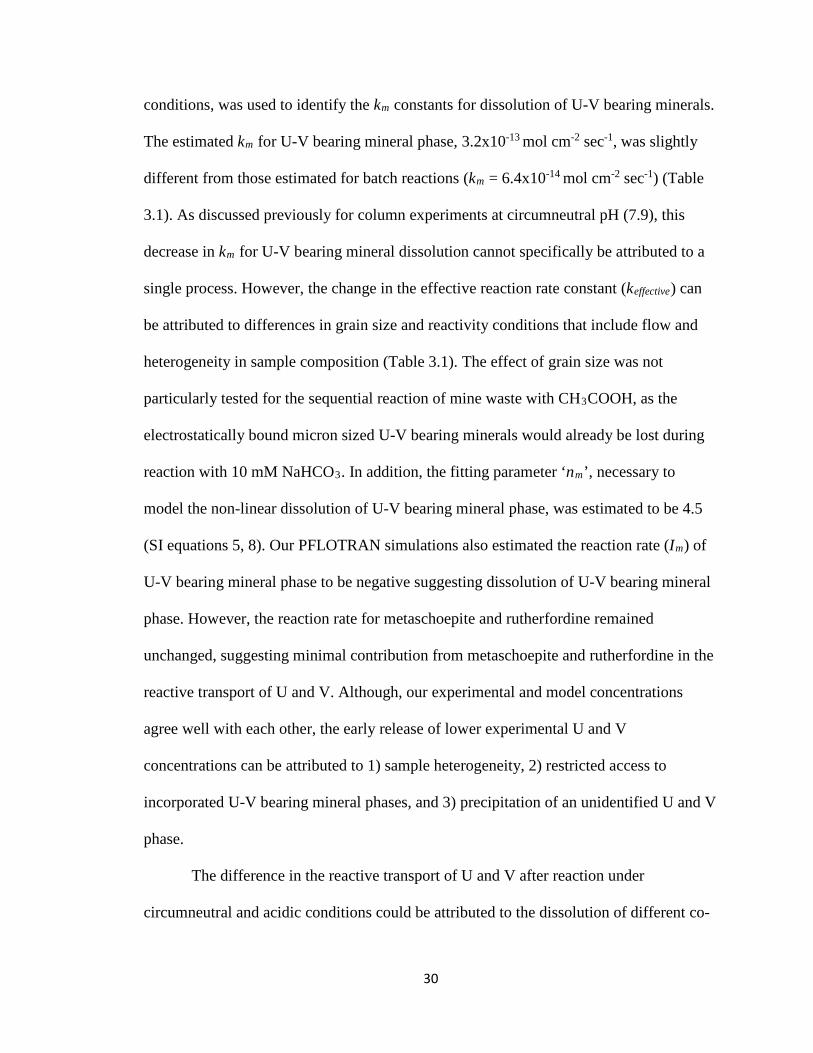
30
conditions, was used to identify the km constants for dissolution of U-V bearing minerals.
The estimated km for U-V bearing mineral phase, 3.2x10⁻¹³ mol cm-2 sec-1, was slightly
different from those estimated for batch reactions (km = 6.4x10⁻¹⁴ mol cm-2 sec-1) (Table
3.1). As discussed previously for column experiments at circumneutral pH (7.9), this
decrease in km for U-V bearing mineral dissolution cannot specifically be attributed to a
single process. However, the change in the effective reaction rate constant (keffective) can
be attributed to differences in grain size and reactivity conditions that include flow and
heterogeneity in sample composition (Table 3.1). The effect of grain size was not
particularly tested for the sequential reaction of mine waste with CH3COOH, as the
electrostatically bound micron sized U-V bearing minerals would already be lost during
reaction with 10 mM NaHCO3. In addition, the fitting parameter ‘nm’, necessary to
model the non-linear dissolution of U-V bearing mineral phase, was estimated to be 4.5
(SI equations 5, 8). Our PFLOTRAN simulations also estimated the reaction rate (Im) of
U-V bearing mineral phase to be negative suggesting dissolution of U-V bearing mineral
phase. However, the reaction rate for metaschoepite and rutherfordine remained
unchanged, suggesting minimal contribution from metaschoepite and rutherfordine in the
reactive transport of U and V. Although, our experimental and model concentrations
agree well with each other, the early release of lower experimental U and V
concentrations can be attributed to 1) sample heterogeneity, 2) restricted access to
incorporated U-V bearing mineral phases, and 3) precipitation of an unidentified U and V
phase.
The difference in the reactive transport of U and V after reaction under
circumneutral and acidic conditions could be attributed to the dissolution of different co-
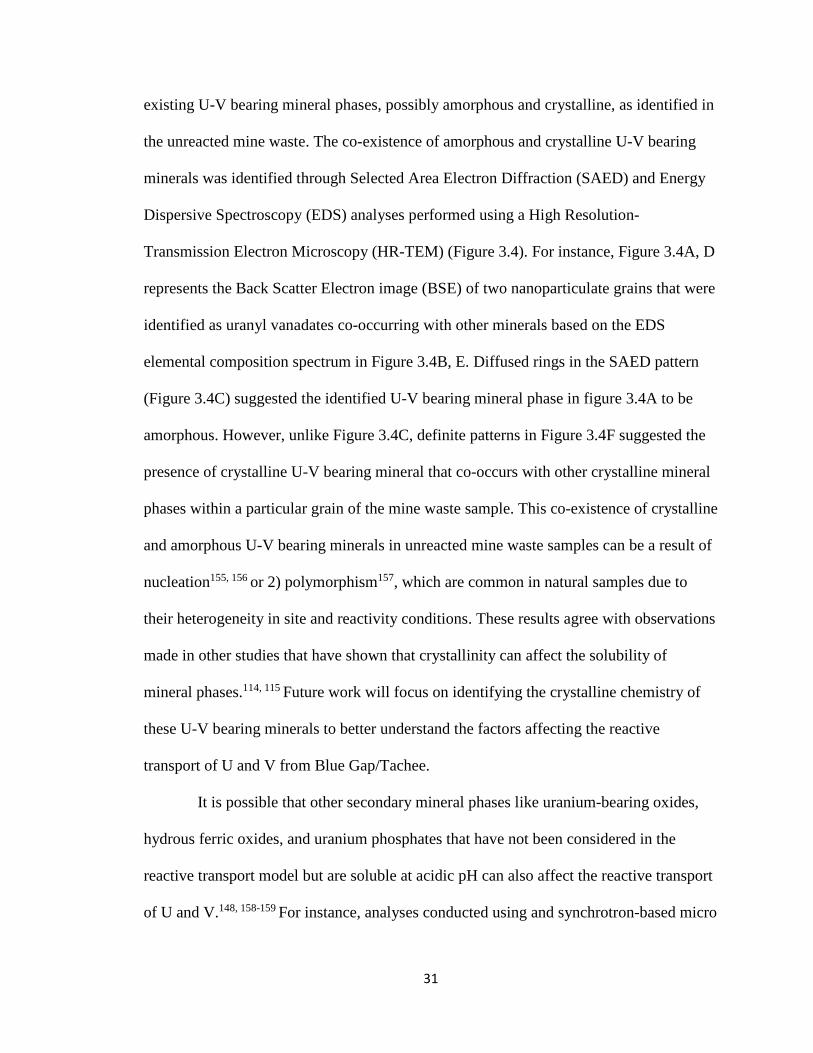
31
existing U-V bearing mineral phases, possibly amorphous and crystalline, as identified in
the unreacted mine waste. The co-existence of amorphous and crystalline U-V bearing
minerals was identified through Selected Area Electron Diffraction (SAED) and Energy
Dispersive Spectroscopy (EDS) analyses performed using a High Resolution-
Transmission Electron Microscopy (HR-TEM) (Figure 3.4). For instance, Figure 3.4A, D
represents the Back Scatter Electron image (BSE) of two nanoparticulate grains that were
identified as uranyl vanadates co-occurring with other minerals based on the EDS
elemental composition spectrum in Figure 3.4B, E. Diffused rings in the SAED pattern
(Figure 3.4C) suggested the identified U-V bearing mineral phase in figure 3.4A to be
amorphous. However, unlike Figure 3.4C, definite patterns in Figure 3.4F suggested the
presence of crystalline U-V bearing mineral that co-occurs with other crystalline mineral
phases within a particular grain of the mine waste sample. This co-existence of crystalline
and amorphous U-V bearing minerals in unreacted mine waste samples can be a result of
nucleation155, 156 or 2) polymorphism157, which are common in natural samples due to
their heterogeneity in site and reactivity conditions. These results agree with observations
made in other studies that have shown that crystallinity can affect the solubility of
mineral phases.114, 115 Future work will focus on identifying the crystalline chemistry of
these U-V bearing minerals to better understand the factors affecting the reactive
transport of U and V from Blue Gap/Tachee.
It is possible that other secondary mineral phases like uranium-bearing oxides,
hydrous ferric oxides, and uranium phosphates that have not been considered in the
reactive transport model but are soluble at acidic pH can also affect the reactive transport
of U and V.148, 158-159 For instance, analyses conducted using and synchrotron-based micro

32
XRF mapping on the mine waste sample indicate that U co-occurs with other elements
(Appendix A: Figure 7.7). Despite the chemical complexity of these samples, our reactive
transport model can reasonably represent the release of U and V by considering the
dissolution of U-V bearing minerals as the key contributing process. However, we
acknowledge that contributions from other mineral phases, heterogeneity, and other
aqueous processes were not accounted in the reactive transport for U and V, which
represent a limitation of this study. Therefore, future research should focus on trying to
understand the role of other reaction processes such as the contribution of other
secondary mineral/nanoparticulate phases of U and V and the influence of mineral
structure of the U-V bearing minerals on the reactive transport U and V from such mine
waste sites.
Environmental Implications.
This work integrates reactive transport modeling, electron microscopy, and aqueous
chemistry methods to evaluate the mechanisms affecting the transport of U and V from
mine wastes from a site in northeastern Arizona. One outcome from this investigation
includes the determination of solubility and reaction rate constants for the dissolution of
U-V bearing mineral phases at circumneutral and acidic pH that can serve as a foundation
to better understand their reactivity at relevant field conditions. This information can be
useful to better understand the mobility of U and V in neighboring community water
sources to assess risks for human exposure. Additionally, the identification of factors
affecting the dissolution of U-V bearing minerals under environmentally relevant
conditions evaluated in this study is relevant to inform remediation and resource recovery

33
initiatives in sites where these U-V bearing minerals are abundant. For instance, the
results from this study have implications for other abandoned uranium mines in the
Colorado Plateau, South Dakota (Black Hills), southwest China, southern Jordan, Korea,
and the calcreted drainages of arid and semiarid western and southern Australia where
carnotite (K2(UO2)2(VO4)2·3H2O), tyuyamunite (Ca(UO2)2V2O8·(5-8)H2O ), and other
U-V bearing minerals are commonly found.41-48
Spectroscopy and microscopy analyses suggest that U is associated to different
elements, which is indicative of the complex mineralogy of these solids. These results are
consistent with those reported in the previous study from our research group.1 Despite the
chemical and mineralogical complexity of these mine wastes, dissolution of U-V bearing
minerals was identified as the key mechanism controlling the reactive transport of U and
V under the environmentally relevant conditions selected for this study. In addition, the
integrated methodology used for this study is transferable to other mining and milling
sites and to abandoned U mine waste sites where a better understanding of the reactive
transport of U and its co-occurring elements is necessary.

34
Table 3.1 Parameters of U-V bearing minerals estimated by modelling the reactive transport of U and V during mine waste reaction at circumneutral and acidic pH. The surface area of U-V bearing minerals was estimated using the average U-V bearing mineral diameter (Appendix A: Table 7.2) and equation [13]. The effective reaction rate constant (keffective = k*𝑎𝑎𝑗𝑗0 ) accounts for the effect of grain surface area on the reactive transport of U and V, where k is the reaction rate constant and 𝑎𝑎𝑗𝑗0 is the surface are of U-V bearing minerals.
Experiments Equilibrium
constant (Keq)
Average U-V bearing mineral surface
area(𝒂𝒂𝒂𝒂𝟎𝟎 ) (cm2 cm-3)
Reaction rate
constants (km)
(mol cm-2-sec-1)
Effective reaction rate
constant (keffective = (km*𝒂𝒂𝒂𝒂𝟎𝟎 )
(mol cm-3-sec-1)
Batch circumneutral
(pH 8.3)(<63 µm) 10-44.811 468.8 2.13x10⁻¹⁴ 9.99x10⁻¹²
Batch acidic
(pH 3.8)(<63 µm) 10-38.651 468.8 6.4x10⁻¹⁴ 3x10-11
Column circumneutral
(pH 7.9) (120-355 µm)
10-44.811 62.5 4.8x10⁻¹³ 3x10-11
Column acidic (pH 3.4)
(120-355 µm) 10-38.651 62.5 3.2x10⁻¹³ 2x10-11

35
Figure 3.1 TOC art: Conceptual model indicating the geochemical processes acting in various experiments conducted in this chapter.
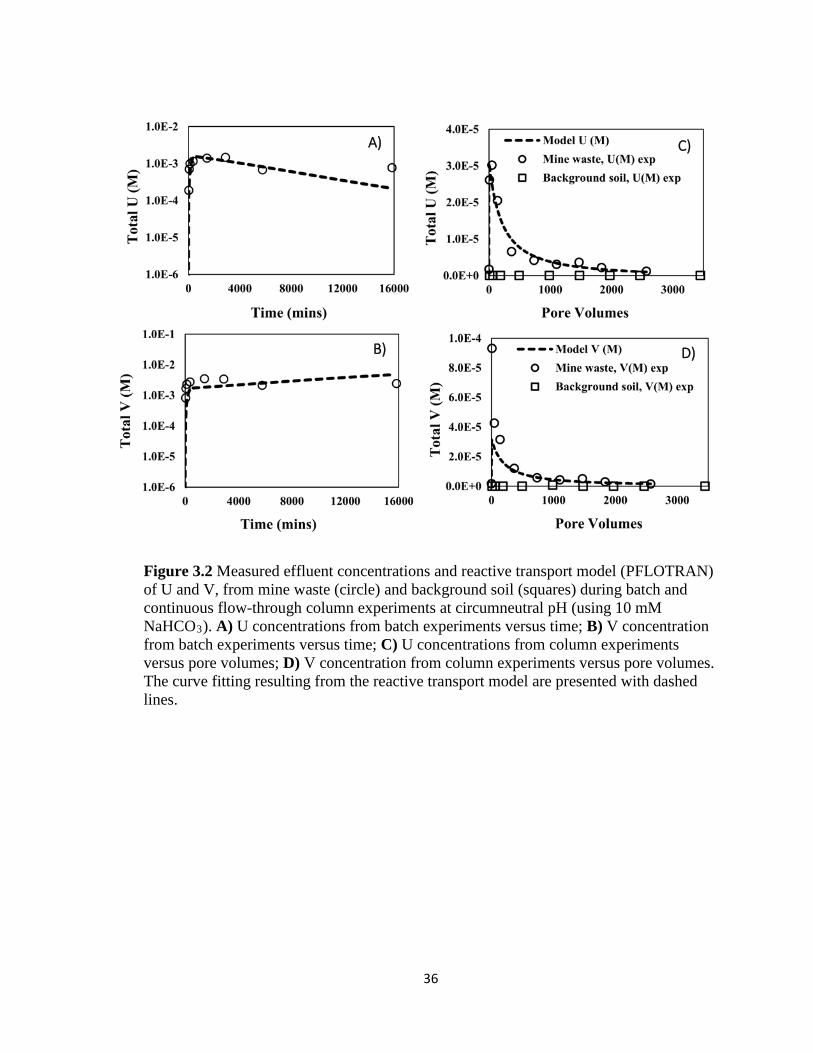
36
Figure 3.2 Measured effluent concentrations and reactive transport model (PFLOTRAN) of U and V, from mine waste (circle) and background soil (squares) during batch and continuous flow-through column experiments at circumneutral pH (using 10 mM NaHCO3). A) U concentrations from batch experiments versus time; B) V concentration from batch experiments versus time; C) U concentrations from column experiments versus pore volumes; D) V concentration from column experiments versus pore volumes. The curve fitting resulting from the reactive transport model are presented with dashed lines.
A)
B)
C)
D)
A) C)
B) D)
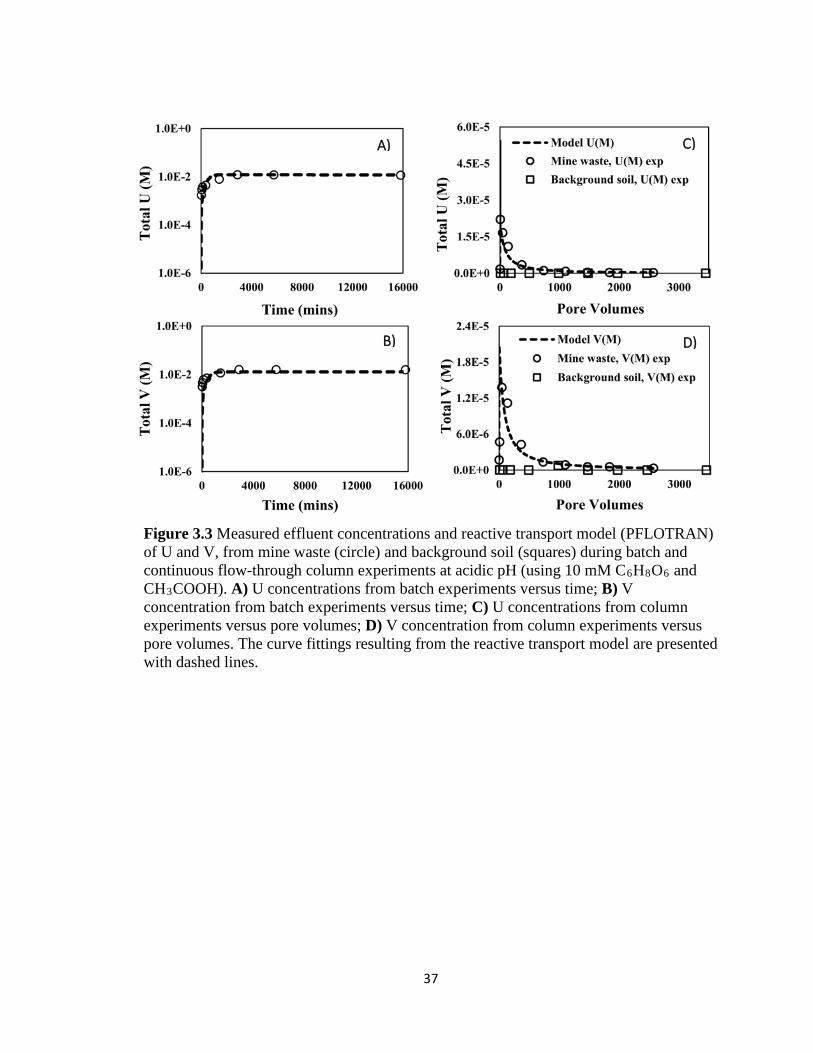
37
Figure 3.3 Measured effluent concentrations and reactive transport model (PFLOTRAN) of U and V, from mine waste (circle) and background soil (squares) during batch and continuous flow-through column experiments at acidic pH (using 10 mM C6H8O6 and CH3COOH). A) U concentrations from batch experiments versus time; B) V concentration from batch experiments versus time; C) U concentrations from column experiments versus pore volumes; D) V concentration from column experiments versus pore volumes. The curve fittings resulting from the reactive transport model are presented with dashed lines.
A)
B)
C)
D)
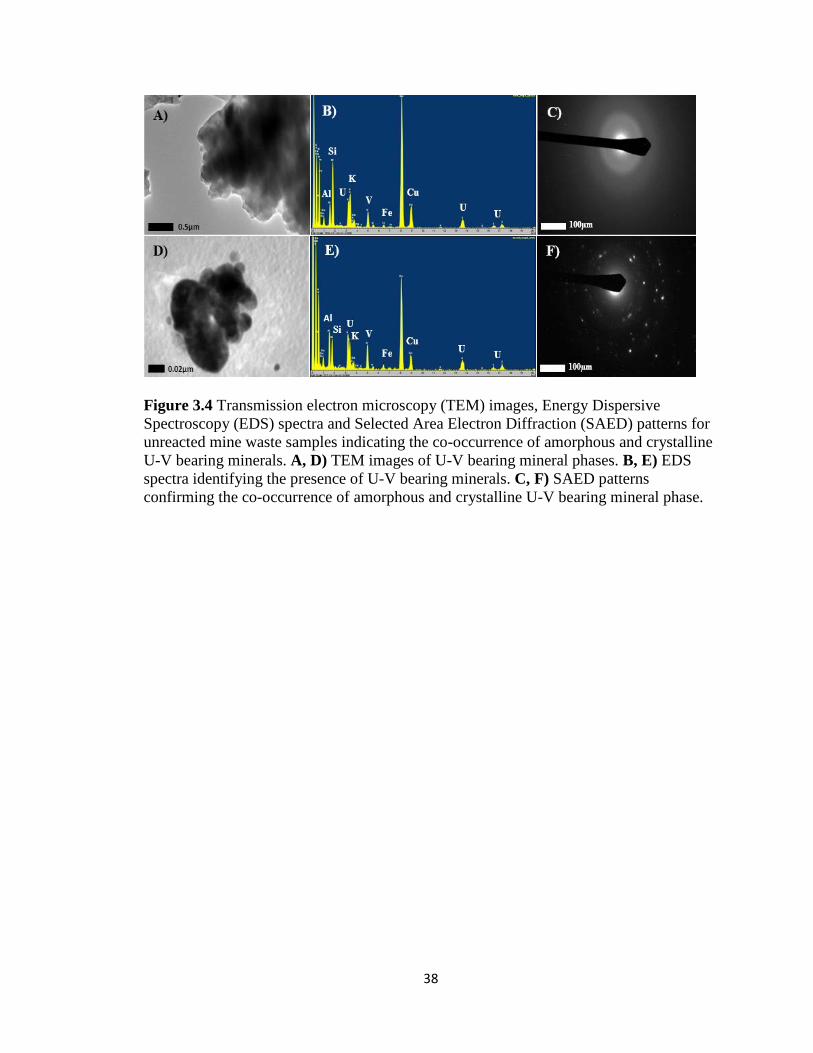
38
Figure 3.4 Transmission electron microscopy (TEM) images, Energy Dispersive Spectroscopy (EDS) spectra and Selected Area Electron Diffraction (SAED) patterns for unreacted mine waste samples indicating the co-occurrence of amorphous and crystalline U-V bearing minerals. A, D) TEM images of U-V bearing mineral phases. B, E) EDS spectra identifying the presence of U-V bearing minerals. C, F) SAED patterns confirming the co-occurrence of amorphous and crystalline U-V bearing mineral phase.
39
(To be submitted to American Mineralogist Journal)
Sumant Avasarala1, Michael Spilde2, Adrian Brearley2, Eric Peterson3, Ying Bing Jiang2,
4, and José M. Cerrato1
*Corresponding email address: [email protected],
Telephone: (001) (248) 978-8264
Fax: (001) (505) 277-1918
1 Department of Civil Engineering, MSC01 1070, Center for Water and the Environment, University of New Mexico, Albuquerque, New Mexico 87131, USA. 2 Department of Earth and Planetary Sciences, MSC03 2040, University of New Mexico, Albuquerque, New Mexico 87131, USA. 3Department of Chemical and Biological Engineering and Center for Micro-Engineered Materials, University of New Mexico, MSC 01 1120, Albuquerque, New Mexico 87131, USA. 4 Center for Micro-Engineered Materials University of New Mexico, Albuquerque, New Mexico, 87131, USA
Abstract
The objective of this chapter is to determine the crystal chemistry of uranyl vanadate
minerals that naturally occur on ore samples from the Blue Gap/Tachee Claim-28 mine in
Northeastern, AZ. Previous investigations on these uranyl vanadate rich ores identified
dissolution of uranyl vanadate as the key mechanism affecting reactive transport of U and
V. However, the specific crystal chemistry of these naturally occurring uranyl vanadate
mineral is unknown. Therefore, to address this research gap we conducted various
40
spectroscopy, electron microscopy and diffraction analyses on solid chunks of the Blue
Gap/Tachee ore samples. Most diffraction lines in the X-ray diffractogram of the uranyl
vanadate are in agreement with those of synthetic carnotite data from the literature.
Carbon detected by electron microprobe analyses in the uranyl vanadate was found to
occur as organic carbon inclusions as suggested by the bright-field transmission electron
microscopy (BF-TEM) imaging, energy-filter transmission electron microscopy
(EFTEM), and electron energy loss spectroscopy (EELS). Therefore, after excluding
carbon (C) from the quantitative electron microprobe analysis, we found that the
elemental composition of the uranyl vanadate was 4.45% K2O, 0.53% CaO, 62.72%
UO2, 0.04% Na2O, 20.65% V2O5, 0.56 Fe2O3, 0.09% TiO2, and 8.65 H2O at a K:U:V
ratio of 1:2:2.1 with an empirical formula of (K0.87, Na0.012, Ca0.088)((Ti0.005,
U0.99)O2)2((Fe0.033, V1.05)O4). This empirical stoichiometry is similar to that of the
anhydrous carnotite. The d-spacing information of the uranyl vanadate was estimated
using the electron diffraction capability in a transmission electron microscope (TEM) that
indicated: 1) complete amorphization of uranyl vanadates on short-term exposure to the
electron beam (<120s); and 2) minor differences between measured d-spacings of uranyl
vanadates and calculated d-spacing of anhydrous carnotite. Minor discrepancies in d-
spacing may be attributable to differences in their degree of hydration. Results from this
investigation provide an improved understanding on the crystal chemistry of a naturally-
occurring uranyl vanadate in abandoned mine wastes. Naturally-occurring carnotites form
an important ore mineral in many uranium mines. Characterizing such naturally-
occurring uranyl vanadates is also crucial to better understand and predict the long term
transport of U in abandoned mine waste sites.
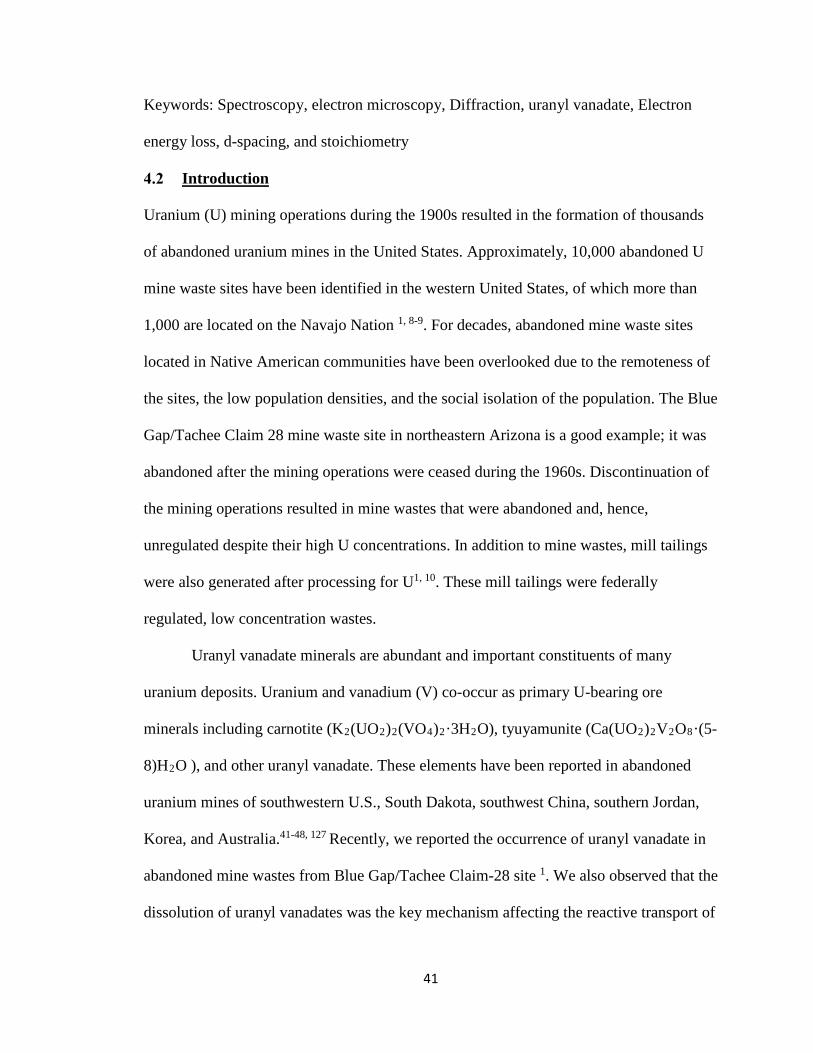
41
Keywords: Spectroscopy, electron microscopy, Diffraction, uranyl vanadate, Electron
energy loss, d-spacing, and stoichiometry
Introduction
Uranium (U) mining operations during the 1900s resulted in the formation of thousands
of abandoned uranium mines in the United States. Approximately, 10,000 abandoned U
mine waste sites have been identified in the western United States, of which more than
1,000 are located on the Navajo Nation 1, 8-9. For decades, abandoned mine waste sites
located in Native American communities have been overlooked due to the remoteness of
the sites, the low population densities, and the social isolation of the population. The Blue
Gap/Tachee Claim 28 mine waste site in northeastern Arizona is a good example; it was
abandoned after the mining operations were ceased during the 1960s. Discontinuation of
the mining operations resulted in mine wastes that were abandoned and, hence,
unregulated despite their high U concentrations. In addition to mine wastes, mill tailings
were also generated after processing for U1, 10. These mill tailings were federally
regulated, low concentration wastes.
Uranyl vanadate minerals are abundant and important constituents of many
uranium deposits. Uranium and vanadium (V) co-occur as primary U-bearing ore
minerals including carnotite (K2(UO2)2(VO4)2·3H2O), tyuyamunite (Ca(UO2)2V2O8·(5-
8)H2O ), and other uranyl vanadate. These elements have been reported in abandoned
uranium mines of southwestern U.S., South Dakota, southwest China, southern Jordan,
Korea, and Australia.41-48, 127 Recently, we reported the occurrence of uranyl vanadate in
abandoned mine wastes from Blue Gap/Tachee Claim-28 site 1. We also observed that the
dissolution of uranyl vanadates was the key mechanism affecting the reactive transport of
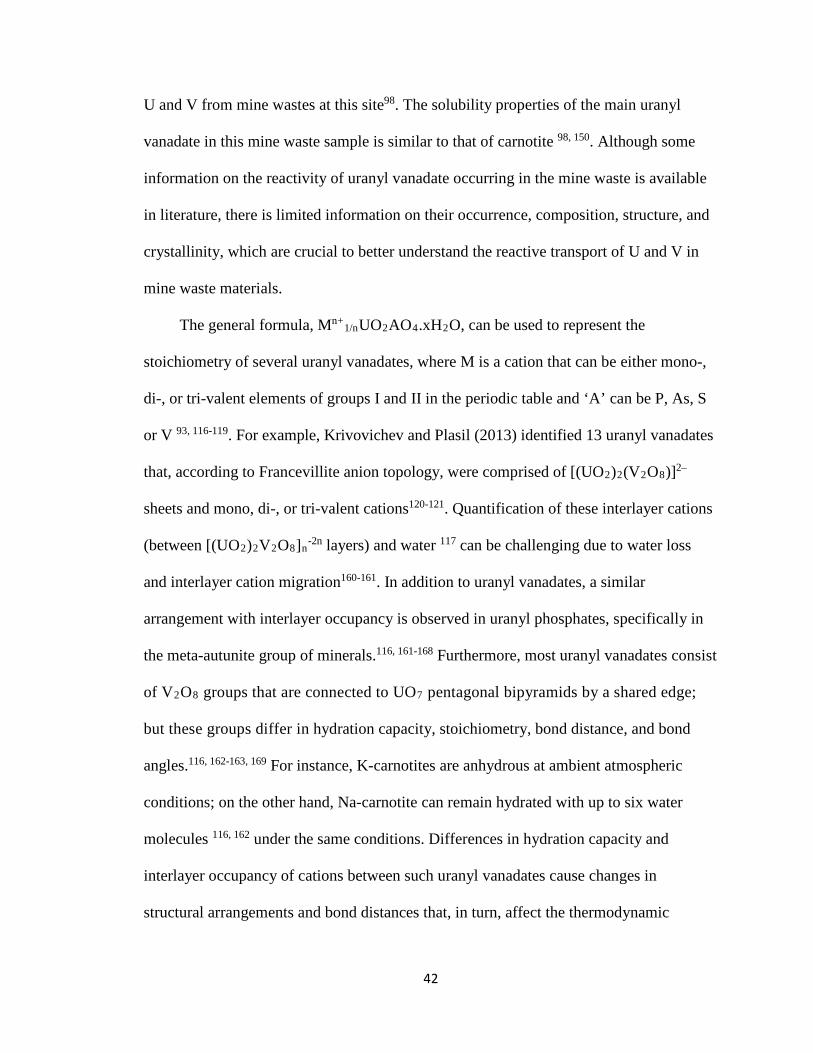
42
U and V from mine wastes at this site98. The solubility properties of the main uranyl
vanadate in this mine waste sample is similar to that of carnotite 98, 150. Although some
information on the reactivity of uranyl vanadate occurring in the mine waste is available
in literature, there is limited information on their occurrence, composition, structure, and
crystallinity, which are crucial to better understand the reactive transport of U and V in
mine waste materials.
The general formula, Mn+1/nUO2AO4.xH2O, can be used to represent the
stoichiometry of several uranyl vanadates, where M is a cation that can be either mono-,
di-, or tri-valent elements of groups I and II in the periodic table and ‘A’ can be P, As, S
or V 93, 116-119. For example, Krivovichev and Plasil (2013) identified 13 uranyl vanadates
that, according to Francevillite anion topology, were comprised of [(UO2)2(V2O8)]2–
sheets and mono, di-, or tri-valent cations120-121. Quantification of these interlayer cations
(between [(UO2)2V2O8]n-2n layers) and water 117 can be challenging due to water loss
and interlayer cation migration160-161. In addition to uranyl vanadates, a similar
arrangement with interlayer occupancy is observed in uranyl phosphates, specifically in
the meta-autunite group of minerals.116, 161-168 Furthermore, most uranyl vanadates consist
of V2O8 groups that are connected to UO7 pentagonal bipyramids by a shared edge;
but these groups differ in hydration capacity, stoichiometry, bond distance, and bond
angles.116, 162-163, 169 For instance, K-carnotites are anhydrous at ambient atmospheric
conditions; on the other hand, Na-carnotite can remain hydrated with up to six water
molecules 116, 162 under the same conditions. Differences in hydration capacity and
interlayer occupancy of cations between such uranyl vanadates cause changes in
structural arrangements and bond distances that, in turn, affect the thermodynamic
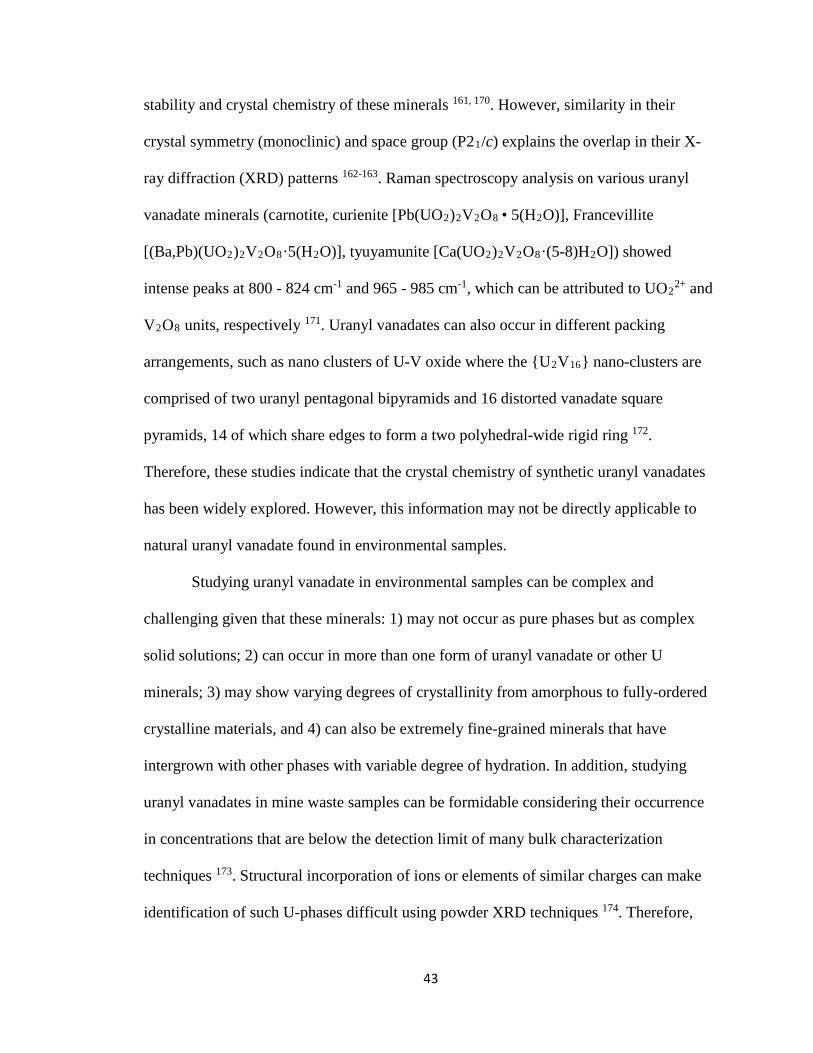
43
stability and crystal chemistry of these minerals 161, 170. However, similarity in their
crystal symmetry (monoclinic) and space group (P21/c) explains the overlap in their X-
ray diffraction (XRD) patterns 162-163. Raman spectroscopy analysis on various uranyl
vanadate minerals (carnotite, curienite [Pb(UO2)2V2O8 • 5(H2O)], Francevillite
[(Ba,Pb)(UO2)2V2O8·5(H2O)], tyuyamunite [Ca(UO2)2V2O8·(5-8)H2O]) showed
intense peaks at 800 - 824 cm-1 and 965 - 985 cm-1, which can be attributed to UO22+ and
V2O8 units, respectively 171. Uranyl vanadates can also occur in different packing
arrangements, such as nano clusters of U-V oxide where the U2V16 nano-clusters are
comprised of two uranyl pentagonal bipyramids and 16 distorted vanadate square
pyramids, 14 of which share edges to form a two polyhedral-wide rigid ring 172.
Therefore, these studies indicate that the crystal chemistry of synthetic uranyl vanadates
has been widely explored. However, this information may not be directly applicable to
natural uranyl vanadate found in environmental samples.
Studying uranyl vanadate in environmental samples can be complex and
challenging given that these minerals: 1) may not occur as pure phases but as complex
solid solutions; 2) can occur in more than one form of uranyl vanadate or other U
minerals; 3) may show varying degrees of crystallinity from amorphous to fully-ordered
crystalline materials, and 4) can also be extremely fine-grained minerals that have
intergrown with other phases with variable degree of hydration. In addition, studying
uranyl vanadates in mine waste samples can be formidable considering their occurrence
in concentrations that are below the detection limit of many bulk characterization
techniques 173. Structural incorporation of ions or elements of similar charges can make
identification of such U-phases difficult using powder XRD techniques 174. Therefore,
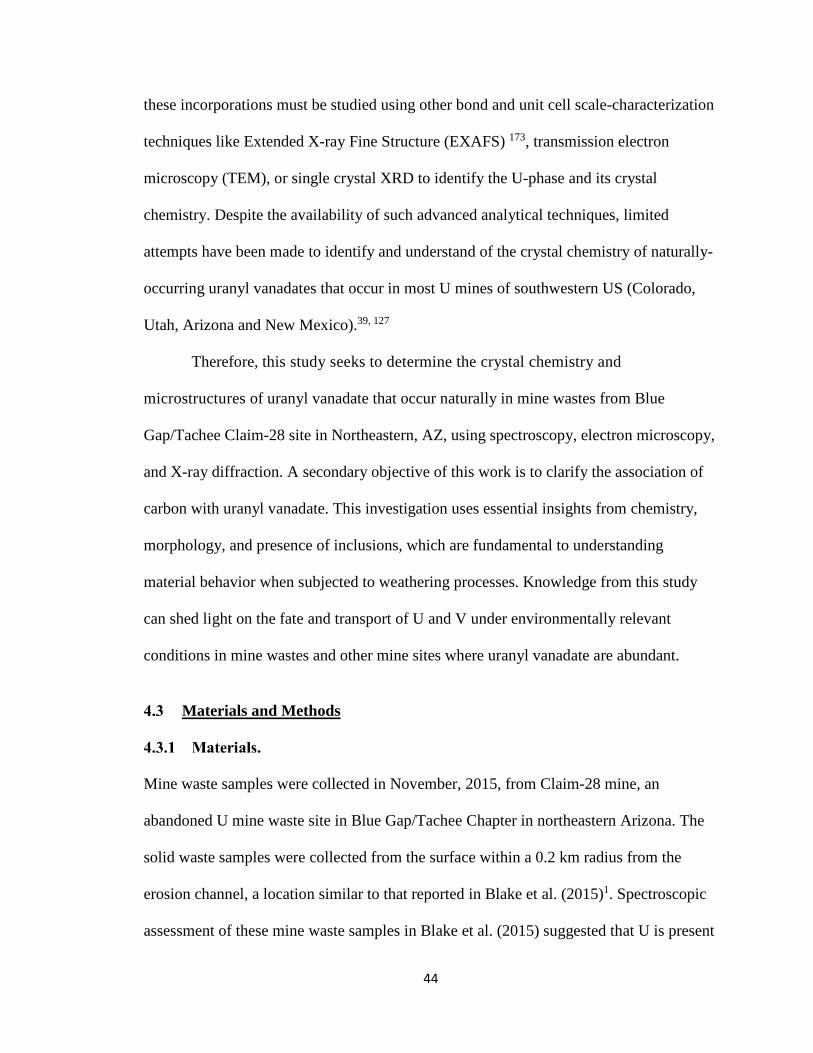
44
these incorporations must be studied using other bond and unit cell scale-characterization
techniques like Extended X-ray Fine Structure (EXAFS) 173, transmission electron
microscopy (TEM), or single crystal XRD to identify the U-phase and its crystal
chemistry. Despite the availability of such advanced analytical techniques, limited
attempts have been made to identify and understand of the crystal chemistry of naturally-
occurring uranyl vanadates that occur in most U mines of southwestern US (Colorado,
Utah, Arizona and New Mexico).39, 127
Therefore, this study seeks to determine the crystal chemistry and
microstructures of uranyl vanadate that occur naturally in mine wastes from Blue
Gap/Tachee Claim-28 site in Northeastern, AZ, using spectroscopy, electron microscopy,
and X-ray diffraction. A secondary objective of this work is to clarify the association of
carbon with uranyl vanadate. This investigation uses essential insights from chemistry,
morphology, and presence of inclusions, which are fundamental to understanding
material behavior when subjected to weathering processes. Knowledge from this study
can shed light on the fate and transport of U and V under environmentally relevant
conditions in mine wastes and other mine sites where uranyl vanadate are abundant.
Materials and Methods
Mine waste samples were collected in November, 2015, from Claim-28 mine, an
abandoned U mine waste site in Blue Gap/Tachee Chapter in northeastern Arizona. The
solid waste samples were collected from the surface within a 0.2 km radius from the
erosion channel, a location similar to that reported in Blake et al. (2015)1. Spectroscopic
assessment of these mine waste samples in Blake et al. (2015) suggested that U is present
45
at concentrations less than 1% weight of the total sample. 1 Mine wastes samples used in
this investigation were present as rocks emitting very high gamma radiations (>10mRad)
almost as high as ore samples. These radiation measurements were made using a Ludlum
Model 19 MicroR Geiger counter. Fragments from these mine waste rock samples were
used for various spectroscopic, microscopic, and diffractions analyses throughout this
study.
Uranium ores in the Blue Gap/Tachee region occur in tabular and lenticular
sandstone units of the Rough Rock Sandstone member in the Toreva formation. This
arkosic sandstone is a much younger deposit formed by a less extensive transgression of
the cretaceous sea in the northern Black Mesa that forms the uppermost unit of the
Torreva formation 40. The major mineralogical components of these deposits include
quartz, potassium feldspar, clays, and uranyl vanadates1, 39-40.
Small fragments of the mine waste rock samples were embedded in epoxy; the surface
was ground flat and polished using successive grits of silicon carbide and alumina to a
surface smoothness of 0.05µm, suitable for electron microprobe analyses. Samples and
standards were coated with approximately 150 nm of gold rather than carbon in order to
measure carbon quantitatively. Scanning electron microscopy (SEM) imaging was also
conducted on the surface of the epoxy embedded mine waste fragments to register the
physical characteristics of the uranyl vanadates in the mine wastes.
X-ray quantitative mapping analyses were acquired on a JEOL 8200 electron
microprobe equipped with five wavelength spectrometers; automation of the microprobe
46
and data reduction was carried out using Probe for EPMA(TM) (Probe Software, Inc.).
Operating conditions were 15 kV accelerating voltage, 10 nA beam current, and a beam
diameter of 5-10 µm. Natural mineral standards were used for calibration. Kaersutite and
hematite from the Harvard Mineralogical Museum175 were used for O, Na, Al, K, Ca, Ti,
and Fe; dolomite and olivine mineral standards from the Smithsonian Institution176 were
used for C, Mg and Si; SRM 663 Cr-V steel for V; and a natural sample of uraninite for
U. Counting times were 60 seconds on peak for C and O, 40 seconds for V, and 20 for all
other elements; total background counting times were the same as on-peak times.
Interference corrections were applied to V by Ti, to C for interference by U, and O for
interference by V177. A blank correction was utilized for Au N5-N6 overlap with C178.
Area Peak Factors179 were utilized to correct x-ray intensities of C for wavelength peak
shift and shape changes. The resulting detection limit for C was 0.016 wt%.
Mine waste collected from Blue Gap/Tachee Claim-28 site was analyzed using a Rigaku
SmartLab powder X-ray diffractometer. The Rigaku SmartLab XRD is fitted with a Cu
Kα X-ray source with 1D silicon strip detector (D/teX™) and a Ni filter Bragg Brentano
geometry with a 2/3° incident slit. Mineral phases were identified using Rietveld
refinements that were performed using the Jade™ (MDI) software package. Because of
the beam divergence resulting from the 2/3° S6 incident slit, beam spillover during data
collection occurred at angles below 20˚ 2θ and caused clay fractions to be somewhat
underestimated. The analysis was conducted on a mine waste rock sample that was
prepared by grounding together some of its smaller fragments using an alumina
47
mortar/pestle. The ground sample was processed through three different sample
preparation techniques to concentrate the nano-crystalline uranyl vanadate for improved
diffractograms. The first pattern was collected on randomly oriented mine waste powder
sample prepared using standard procedures. The second pattern was measured on the
suspended fraction of the ground powder, which was obtained by mixing the powder with
deionized water and allowing the solution to settle overnight180. However, due to a
preferred orientation of this sample, the analysis was repeated using a more randomly
oriented suspended fraction that was obtained by reducing the settling time to <30s.
We prepared an ultrathin section of the uranyl vanadate for transmission electron
microscope (TEM) analysis using the focused ion beam (FIB) in situ lift out technique
described in Abreu et al., 2010.181 The FIB samples was prepared using a FEI Quanta 3D
Dualbeam® FEGSEM/FIB instrument equipped with an EDAX Apollo 40 SDD EDS
system. A Ga ion beam voltage of 30 kV and beam currents ranging from 3 nA to 10 pA
were used to perform sample extraction and final ion milling. During the sample
preparation, a protective layer of Pt, 2 µm in thickness was deposited on the surface of
the sample prior to minimize ion beam damage. After the initial cutting stage, the FIB
section was lifted out using an Omniprobe 200 micromanipulator and transferred onto a
Cu TEM half grid for ion milling to a final thickness of about 100 nm.
The TEM analysis was conducted on the FIB section and handpicked grains of the uranyl
vanadate from the mine waste to reveal the microstructure and composition at the
submicron scale. The handpicked uranyl vanadate (yellow) grains were taken from
48
minute fragments of the mine waste rock sample and gently disaggregated under acetone
using an agate pestle and mortar. A droplet of the disaggregated sample suspension in
acetone was deposited on a holey carbon TEM grid and allowed to dry prior to TEM
analysis. Both types of sample uranyl vanadate were studied using Bright-Field TEM
imaging (BFTEM), Selected Area Electron Diffraction (SAED) and Energy Dispersive
Spectroscopy (EDS) using a high JEOL 2010F Field Emission Gun scanning
transmission electron microscope (STEM) (FEG/STEM) instrument. This instrument is
equipped with a GATAN GIF 2000 and an Oxford AZTec EDS system with an ultrathin
window XMaxN 80 mm2 SDD EDS detector. In addition, the FIB section was also
studied using High-Angle Annular Dark-Field Scanning Transmission Electron
Microscopy (HAADF STEM), full spectral STEM X-ray mapping, Energy Filtered TEM
imaging (EFTEM), and Electron Energy Loss Spectroscopy (EELS). The JEOL 2010F
was operated at 200 kV for all analyses except for EFTEM imaging, which was
performed at197 kV. The EELS analysis was operated at an accelerating voltage of 200
kV and energy resolution of 0.7ev.
Results and Discussion
Diffraction analysis on the Blue Gap/Tachee Claim-28 mine waste samples identified
most diffraction peaks of the uranyl vanadate to agree with that of the carnotite reported
in literature. However, due to <1% weight of U in the mine waste samples as reported in
a previous study by our research group 1, the occurrence of uranyl vanadate could not be
detected in the diffractogram of the powdered mine waste (Figure 4.1, green). The
absence of identifiable diffraction peaks for uranyl vanadate could also be attributable to
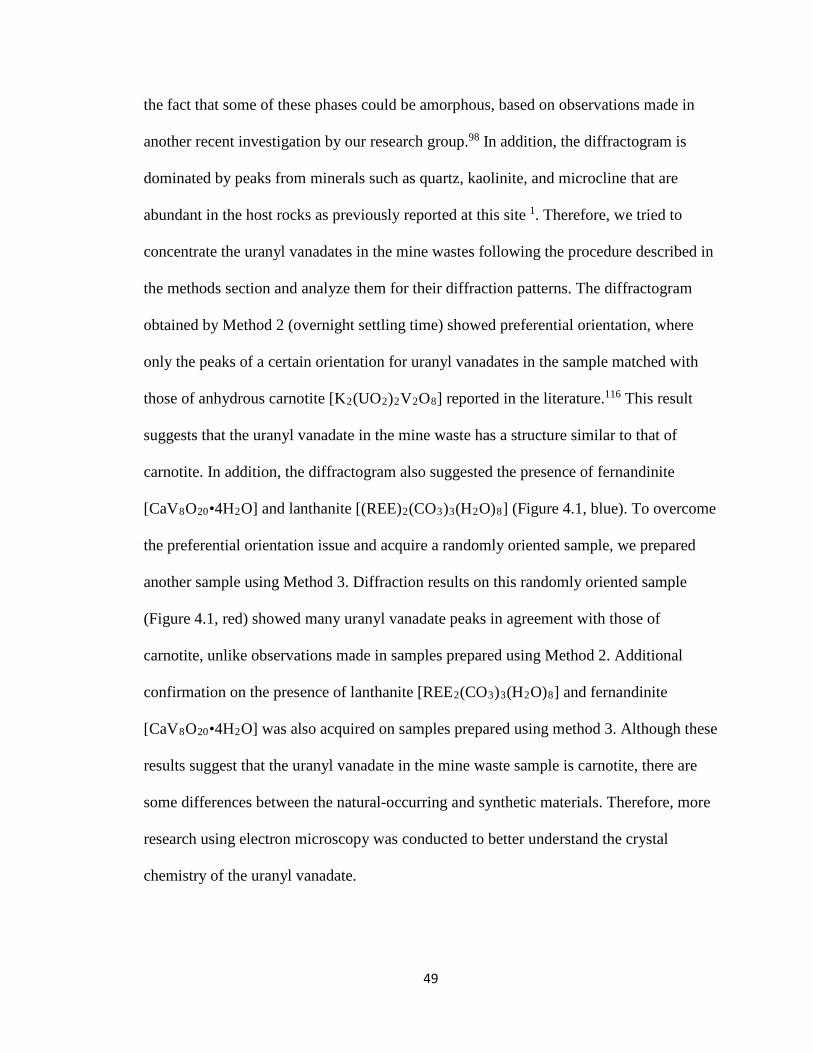
49
the fact that some of these phases could be amorphous, based on observations made in
another recent investigation by our research group.98 In addition, the diffractogram is
dominated by peaks from minerals such as quartz, kaolinite, and microcline that are
abundant in the host rocks as previously reported at this site 1. Therefore, we tried to
concentrate the uranyl vanadates in the mine wastes following the procedure described in
the methods section and analyze them for their diffraction patterns. The diffractogram
obtained by Method 2 (overnight settling time) showed preferential orientation, where
only the peaks of a certain orientation for uranyl vanadates in the sample matched with
those of anhydrous carnotite [K2(UO2)2V2O8] reported in the literature.116 This result
suggests that the uranyl vanadate in the mine waste has a structure similar to that of
carnotite. In addition, the diffractogram also suggested the presence of fernandinite
[CaV8O20•4H2O] and lanthanite [(REE)2(CO3)3(H2O)8] (Figure 4.1, blue). To overcome
the preferential orientation issue and acquire a randomly oriented sample, we prepared
another sample using Method 3. Diffraction results on this randomly oriented sample
(Figure 4.1, red) showed many uranyl vanadate peaks in agreement with those of
carnotite, unlike observations made in samples prepared using Method 2. Additional
confirmation on the presence of lanthanite [REE2(CO3)3(H2O)8] and fernandinite
[CaV8O20•4H2O] was also acquired on samples prepared using method 3. Although these
results suggest that the uranyl vanadate in the mine waste sample is carnotite, there are
some differences between the natural-occurring and synthetic materials. Therefore, more
research using electron microscopy was conducted to better understand the crystal
chemistry of the uranyl vanadate.
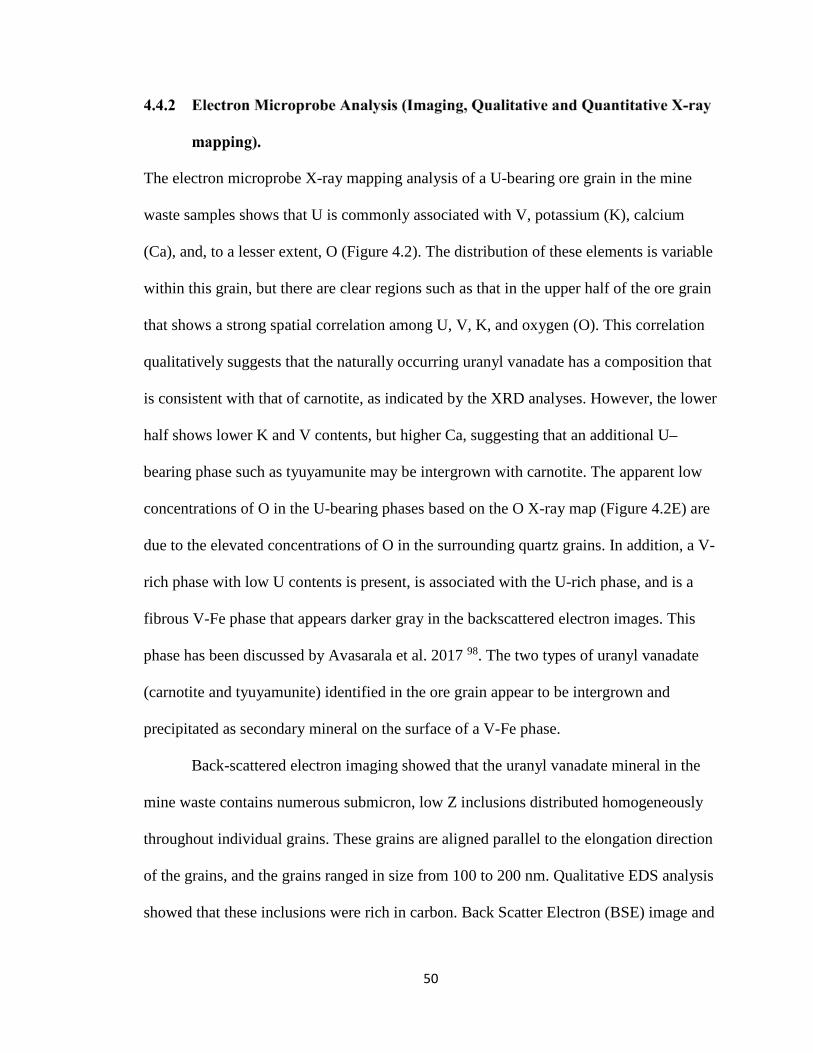
50
The electron microprobe X-ray mapping analysis of a U-bearing ore grain in the mine
waste samples shows that U is commonly associated with V, potassium (K), calcium
(Ca), and, to a lesser extent, O (Figure 4.2). The distribution of these elements is variable
within this grain, but there are clear regions such as that in the upper half of the ore grain
that shows a strong spatial correlation among U, V, K, and oxygen (O). This correlation
qualitatively suggests that the naturally occurring uranyl vanadate has a composition that
is consistent with that of carnotite, as indicated by the XRD analyses. However, the lower
half shows lower K and V contents, but higher Ca, suggesting that an additional U–
bearing phase such as tyuyamunite may be intergrown with carnotite. The apparent low
concentrations of O in the U-bearing phases based on the O X-ray map (Figure 4.2E) are
due to the elevated concentrations of O in the surrounding quartz grains. In addition, a V-
rich phase with low U contents is present, is associated with the U-rich phase, and is a
fibrous V-Fe phase that appears darker gray in the backscattered electron images. This
phase has been discussed by Avasarala et al. 2017 98. The two types of uranyl vanadate
(carnotite and tyuyamunite) identified in the ore grain appear to be intergrown and
precipitated as secondary mineral on the surface of a V-Fe phase.
Back-scattered electron imaging showed that the uranyl vanadate mineral in the
mine waste contains numerous submicron, low Z inclusions distributed homogeneously
throughout individual grains. These grains are aligned parallel to the elongation direction
of the grains, and the grains ranged in size from 100 to 200 nm. Qualitative EDS analysis
showed that these inclusions were rich in carbon. Back Scatter Electron (BSE) image and
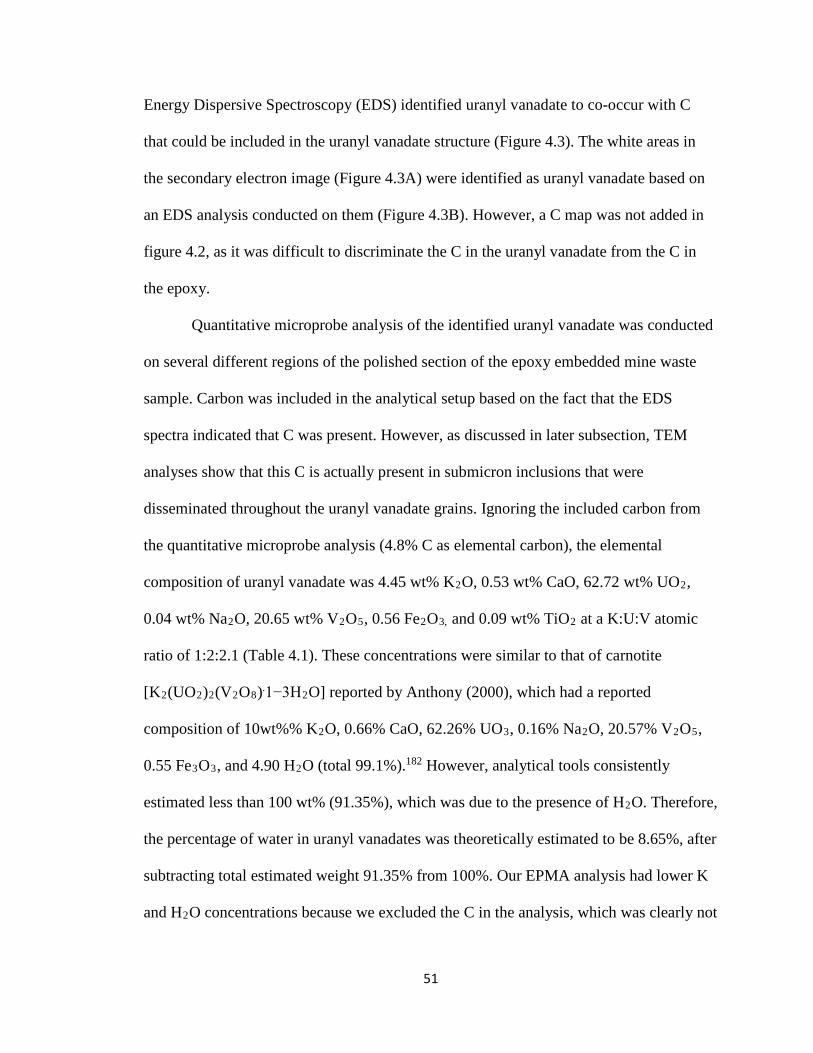
51
Energy Dispersive Spectroscopy (EDS) identified uranyl vanadate to co-occur with C
that could be included in the uranyl vanadate structure (Figure 4.3). The white areas in
the secondary electron image (Figure 4.3A) were identified as uranyl vanadate based on
an EDS analysis conducted on them (Figure 4.3B). However, a C map was not added in
figure 4.2, as it was difficult to discriminate the C in the uranyl vanadate from the C in
the epoxy.
Quantitative microprobe analysis of the identified uranyl vanadate was conducted
on several different regions of the polished section of the epoxy embedded mine waste
sample. Carbon was included in the analytical setup based on the fact that the EDS
spectra indicated that C was present. However, as discussed in later subsection, TEM
analyses show that this C is actually present in submicron inclusions that were
disseminated throughout the uranyl vanadate grains. Ignoring the included carbon from
the quantitative microprobe analysis (4.8% C as elemental carbon), the elemental
composition of uranyl vanadate was 4.45 wt% K2O, 0.53 wt% CaO, 62.72 wt% UO2,
0.04 wt% Na2O, 20.65 wt% V2O5, 0.56 Fe2O3, and 0.09 wt% TiO2 at a K:U:V atomic
ratio of 1:2:2.1 (Table 4.1). These concentrations were similar to that of carnotite
[K2(UO2)2(V2O8).1−3H2O] reported by Anthony (2000), which had a reported
composition of 10wt%% K2O, 0.66% CaO, 62.26% UO3, 0.16% Na2O, 20.57% V2O5,
0.55 Fe3O3, and 4.90 H2O (total 99.1%).182 However, analytical tools consistently
estimated less than 100 wt% (91.35%), which was due to the presence of H2O. Therefore,
the percentage of water in uranyl vanadates was theoretically estimated to be 8.65%, after
subtracting total estimated weight 91.35% from 100%. Our EPMA analysis had lower K
and H2O concentrations because we excluded the C in the analysis, which was clearly not
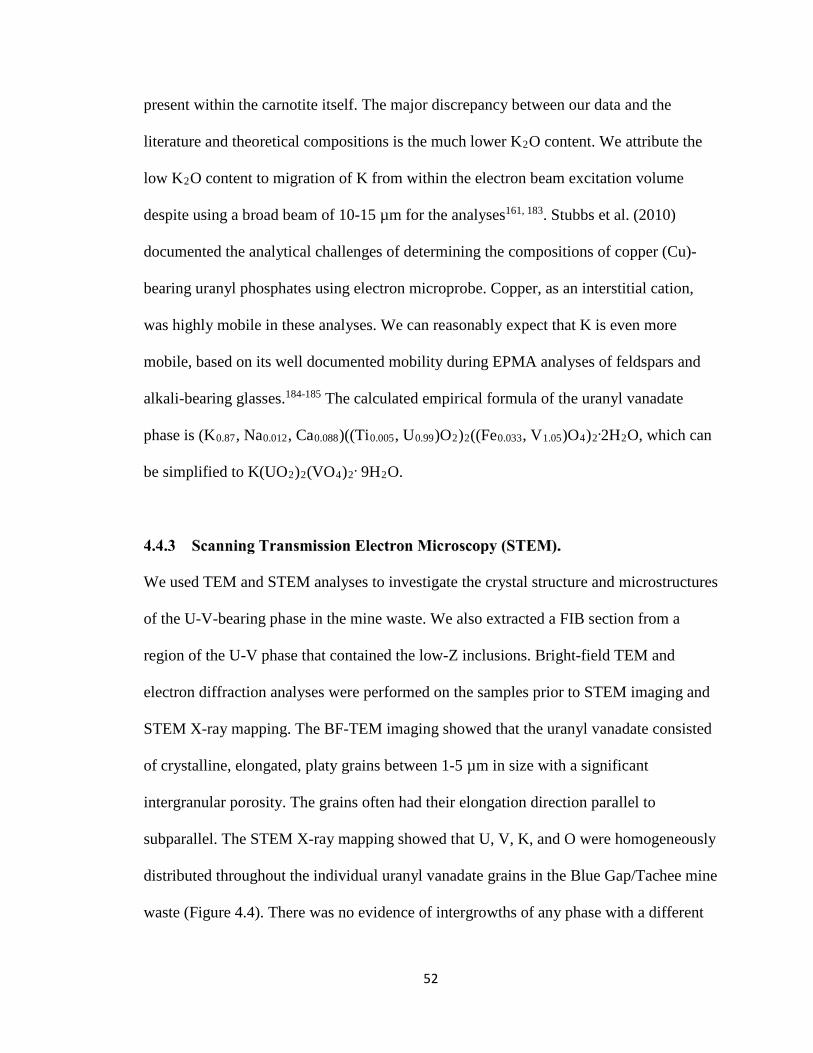
52
present within the carnotite itself. The major discrepancy between our data and the
literature and theoretical compositions is the much lower K2O content. We attribute the
low K2O content to migration of K from within the electron beam excitation volume
despite using a broad beam of 10-15 µm for the analyses161, 183. Stubbs et al. (2010)
documented the analytical challenges of determining the compositions of copper (Cu)-
bearing uranyl phosphates using electron microprobe. Copper, as an interstitial cation,
was highly mobile in these analyses. We can reasonably expect that K is even more
mobile, based on its well documented mobility during EPMA analyses of feldspars and
alkali-bearing glasses.184-185 The calculated empirical formula of the uranyl vanadate
phase is (K0.87, Na0.012, Ca0.088)((Ti0.005, U0.99)O2)2((Fe0.033, V1.05)O4)2.2H2O, which can
be simplified to K(UO2)2(VO4)2 . 9H2O.
We used TEM and STEM analyses to investigate the crystal structure and microstructures
of the U-V-bearing phase in the mine waste. We also extracted a FIB section from a
region of the U-V phase that contained the low-Z inclusions. Bright-field TEM and
electron diffraction analyses were performed on the samples prior to STEM imaging and
STEM X-ray mapping. The BF-TEM imaging showed that the uranyl vanadate consisted
of crystalline, elongated, platy grains between 1-5 µm in size with a significant
intergranular porosity. The grains often had their elongation direction parallel to
subparallel. The STEM X-ray mapping showed that U, V, K, and O were homogeneously
distributed throughout the individual uranyl vanadate grains in the Blue Gap/Tachee mine
waste (Figure 4.4). There was no evidence of intergrowths of any phase with a different
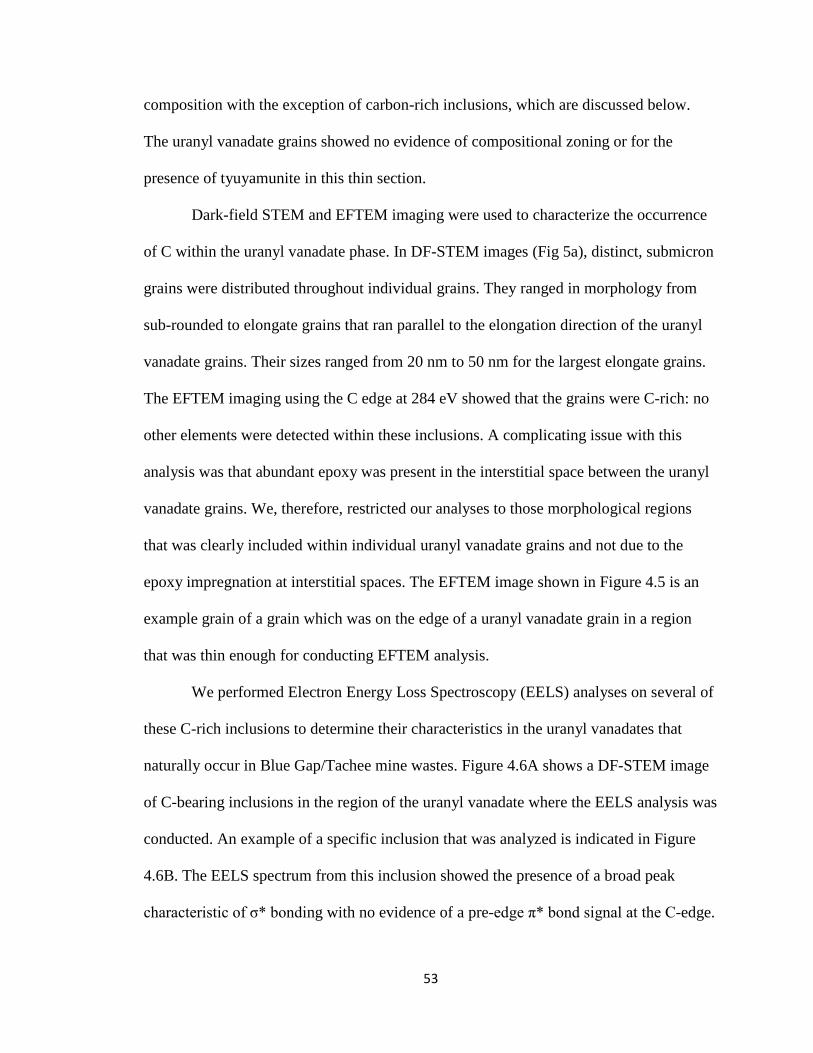
53
composition with the exception of carbon-rich inclusions, which are discussed below.
The uranyl vanadate grains showed no evidence of compositional zoning or for the
presence of tyuyamunite in this thin section.
Dark-field STEM and EFTEM imaging were used to characterize the occurrence
of C within the uranyl vanadate phase. In DF-STEM images (Fig 5a), distinct, submicron
grains were distributed throughout individual grains. They ranged in morphology from
sub-rounded to elongate grains that ran parallel to the elongation direction of the uranyl
vanadate grains. Their sizes ranged from 20 nm to 50 nm for the largest elongate grains.
The EFTEM imaging using the C edge at 284 eV showed that the grains were C-rich: no
other elements were detected within these inclusions. A complicating issue with this
analysis was that abundant epoxy was present in the interstitial space between the uranyl
vanadate grains. We, therefore, restricted our analyses to those morphological regions
that was clearly included within individual uranyl vanadate grains and not due to the
epoxy impregnation at interstitial spaces. The EFTEM image shown in Figure 4.5 is an
example grain of a grain which was on the edge of a uranyl vanadate grain in a region
that was thin enough for conducting EFTEM analysis.
We performed Electron Energy Loss Spectroscopy (EELS) analyses on several of
these C-rich inclusions to determine their characteristics in the uranyl vanadates that
naturally occur in Blue Gap/Tachee mine wastes. Figure 4.6A shows a DF-STEM image
of C-bearing inclusions in the region of the uranyl vanadate where the EELS analysis was
conducted. An example of a specific inclusion that was analyzed is indicated in Figure
4.6B. The EELS spectrum from this inclusion showed the presence of a broad peak
characteristic of σ* bonding with no evidence of a pre-edge π* bond signal at the C-edge.

54
These features of the C edge are consistent with amorphous carbon. The analysis was
complicated by the fact that the C K-edge at 284eV is overlapped by the potassium L
edge, which occurs at an energy of 294 eV (Figure 4.6C). Although the electron beam
was focused on the inclusion, to avoid beam damage we defocused the electron beam and
overlapped it with the uranyl vanadate, resulting in a contribution from K in the host
uranyl vanadate in the EELS spectrum. In EELS spectra of amorphous and graphitic
carbons, an increase in the π*/σ* ratio (i.e. more π* bonding), occurred with increasing
degree of graphitic character 186 as the transition from amorphous C to graphitized C
(turbostratic or poorly-graphitized carbon) and then to crystalline graphite. The strong sp2
bonding in graphite is indicated in EELS spectra by a distinct, sharp σ* peak 187, whereas
amorphous C, which did not contain sp2 bonding, did not show the σ*. We concluded
that 1) the broad and featureless shape of the σ* peak and 2) the small π*/σ* ratio showed
that the inclusion in the uranyl vanadate was amorphous C (Figure 4.6C). The presence of
amorphous C could be due to organic matter from carbonaceous plant material that was
found to co-occur with U in these deposits 39. For example, we also conducted the EELS
analysis on the epoxy (Figure 4.6A), that showed a high resolution EELS spectrum of the
C-edge with distinct σ* bond. This observation indicates that the inclusion was not epoxy
but was indigenous to the uranyl vanadate. Several EELS spectra were also conducted on
regions of the uranyl vanadate away from any obvious carbon inclusions (Figure 4.6E).
These spectra showed no evidence of a C-edge; thus, the C detected in the electron
microprobe analyses is present in carbonaceous inclusions and was not incorporated into
the structure of the uranyl vanadate in the mine waste.
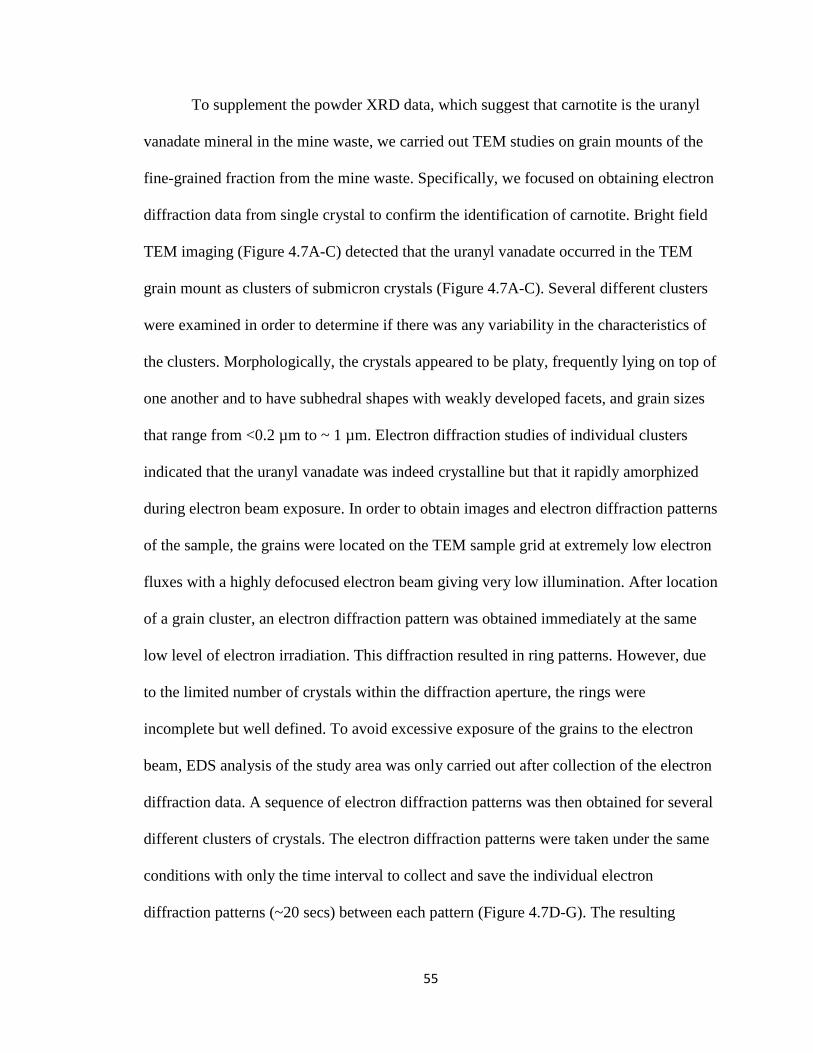
55
To supplement the powder XRD data, which suggest that carnotite is the uranyl
vanadate mineral in the mine waste, we carried out TEM studies on grain mounts of the
fine-grained fraction from the mine waste. Specifically, we focused on obtaining electron
diffraction data from single crystal to confirm the identification of carnotite. Bright field
TEM imaging (Figure 4.7A-C) detected that the uranyl vanadate occurred in the TEM
grain mount as clusters of submicron crystals (Figure 4.7A-C). Several different clusters
were examined in order to determine if there was any variability in the characteristics of
the clusters. Morphologically, the crystals appeared to be platy, frequently lying on top of
one another and to have subhedral shapes with weakly developed facets, and grain sizes
that range from <0.2 µm to ~ 1 µm. Electron diffraction studies of individual clusters
indicated that the uranyl vanadate was indeed crystalline but that it rapidly amorphized
during electron beam exposure. In order to obtain images and electron diffraction patterns
of the sample, the grains were located on the TEM sample grid at extremely low electron
fluxes with a highly defocused electron beam giving very low illumination. After location
of a grain cluster, an electron diffraction pattern was obtained immediately at the same
low level of electron irradiation. This diffraction resulted in ring patterns. However, due
to the limited number of crystals within the diffraction aperture, the rings were
incomplete but well defined. To avoid excessive exposure of the grains to the electron
beam, EDS analysis of the study area was only carried out after collection of the electron
diffraction data. A sequence of electron diffraction patterns was then obtained for several
different clusters of crystals. The electron diffraction patterns were taken under the same
conditions with only the time interval to collect and save the individual electron
diffraction patterns (~20 secs) between each pattern (Figure 4.7D-G). The resulting

56
patterns showed the progressive amorphization of the sample, indicated by disappearance
of diffraction maxima with high reciprocal lattice spacings and the development of
diffuse electron diffraction intensity as rings within the patterns.
From the first diffraction pattern obtained from each sequence of patterns, lattice
spacings were calculated for each of the diffraction rings (Table 4.2) and compared with
the calculated d-spacing data for anhydrous carnotite using Single Crystal software.
There is reasonable agreement between the measured data and the calculated data except
for the highest d-spacings. In addition, a significant number of diffraction maxima were
absent from the measured d-spacings compared to the calculated spacings. There are a
number of possibilities for these discrepancies. The only crystal structure determination
available for carnotite was for synthetic anhydrous carnotite reported by Sundberg and
Sillen (1950)188. Anhydrous, synthetic carnotite is monoclinic with space group P21/c;
however, the naturally occurring uranyl vanadate is hydrated and based on various
studies of the Ca analog of carnotite, tyuyamunite, is likely to have variable states of
hydration. Previous studies have shown that the progressive hydration of hydrated uranyl
vanadates results in the expansion of interlayer spacing, changing the dimensions of the
unit cell 161, 189. Stern et al. (1956) showed that complete dehydration of tyunamunite
results in the formation of metatyunamunite, a phase that Stern et al. (1956) suggested
was structurally distinct from tyuyamunite based on X-ray diffraction data 189. Donnay
and Donnay (1954) determined the structure of tyuyamunite and found that it is
orthorhombic with space group Pnan when compared with a monoclinic structure for
anhydrous carnotite 190. The expansion of the unit cell due to variable degrees of
hydration may account for the discrepancies between the calculated and measured values.
57
In addition, the absence of a number of diffraction maxima in the ring pattern of carnotite
can reasonably be attributed to the fact that there is a preferential orientation of the
clusters of particles of the TEM grid with the plates of carnotite lying with their (001)
planes parallel to holey carbon film. These patterns only represent a small volume of
reciprocal lattice space. Despite the discrepancies between the measured and calculated
patterns, which may be attributable to differences in the degree of hydration, the data for
the naturally-occurring uranyl vanadate in Blue Gap/Tachee mine waste appear to be
consistent with carnotite. Importantly, the data show conclusively that the carnotite is
crystalline but rapidly amorphizes under the electron beam.
Implications
Outcomes from this investigation suggest that the uranyl vanadate minerals in the Blue
Gap/Tachee mine waste site were crystalline, elongated and platy grains (1-5 µm) of
hydrated carnotites with significant intergranular porosity, rich in carbon inclusions (20-
50 nm). These hydrated carnotites were susceptible to rapid amorphization on short-term
exposure (<120s) to the electron beam, based on d-spacing information obtained using
the electron diffraction capability in a TEM. This information on the crystal chemistry of
naturally occurring uranyl vanadate is critical to improve our understanding on their
solubility that contribute to an improved understanding on the transport of U and V from
these mine wastes. For instance, results from this investigation are coherent with our
previous observations at Blue Gap/Tachee Claim-28 mine waste site, where the solubility
of this hydrated carnotite (equilibrium constant: Keq at circumneutral pH = 10-38.65 and
acidic pH Keq = 10-44.81) was similar to that of synthetic carnotite reported in literature
58
(Keq = 10-56.38).98 However, there were minor discrepancies in their solubility information
that could be attributed to differences in crystal chemistry, highlighting the importance of
crystal chemistry while understanding the reactive transport of metals. Knowledge
obtained from this manuscript and the integrated methodology used to obtain this
information can be transcribed to other mine waste sites where uranyl vanadates are
abundant.41-48, 127.

59
Table 4.1 Electron microprobe data for carnotite from the Blue Gap Tachee mine waste.182
Element
Average Element
Weight % (C as elemental
carbon)
Oxides Average Oxide
Weight % Reference
Reference Weight% Carnotite
C 4.81 C 4.81 - -
K 3.54 K2O 4.45 K2O 10.00
Ca 0.37 CaO 0.53 CaO 0.66
U 52.20 UO2 62.72 UO2 62.26
Si 0.22 SiO2 - SiO2 -
Na 0.03 Na2O 0.041 Na2O 0.16
Al 0.45 Al2O3 - Al2O3 -
Ti 0.05 TiO2 0.09 TiO2 -
V 11.5 V2O5 20.65 V2O5 20.57
Fe 0.41 Fe2O3 0.56 Fe2O3 0.55
H - H2O - H2O 4.90
O 17.8 O 0 O -
Total without C 91.35 Total 90.75 Total 99.1
Total with C
91.35 + 4.81 = 96.16
Total with C
90.75+4.81 = 95.56
Total with C 99.1

60
Table 4.2 Electron diffraction data of measured d-spacings (in Å) for the uranyl vanadate occurring in the Blue Gap/Tachee mine waste compared to the calculated d-spacing for synthetic anhydrous carnotite (K2UO2VO4) 188. Lattice spacing data <2.5 Å has been omitted.188
Calculated* h k l Measured1
6.4626 0 1 1 7.04 6.3886 1 0 0 6.09
5.75 5.0857 1 1 0 5.17 4.9478 1 1 1 4.87
4.68 4.5438 1 0 2 4.58 4.3320 0 1 2 4.2243 1 1 1 4.27 4.2015 0 2 0 3.9969 1 1 2 3.95 3.8799 0 2 1 3.79 3.5620 1 0 2 3.5104 1 2 0 3.4640 1 2 1 3.41 3.2795 1 1 2 3.2313 0 2 2 3.21 3.1943 2 0 0 3.1858 1 2 1 3.1282 0 1 3 3.1022 1 1 3 3.0848 1 2 2 3.0607 2 0 2 3.05 3.0606 2 1 1 2.9859 2 1 0 2.8759 2 1 2 2.90 2.7170 1 2 2 2.71 2.7004 2 1 1 2.6993 0 3 1 2.6290 0 2 3 2.6136 1 2 3 2.603 2.5885 2 2 1 2.596 2.5865 1 1 3 2.5767 1 0 4 2.5653 1 3 0 2.5470 1 3 1 2.53
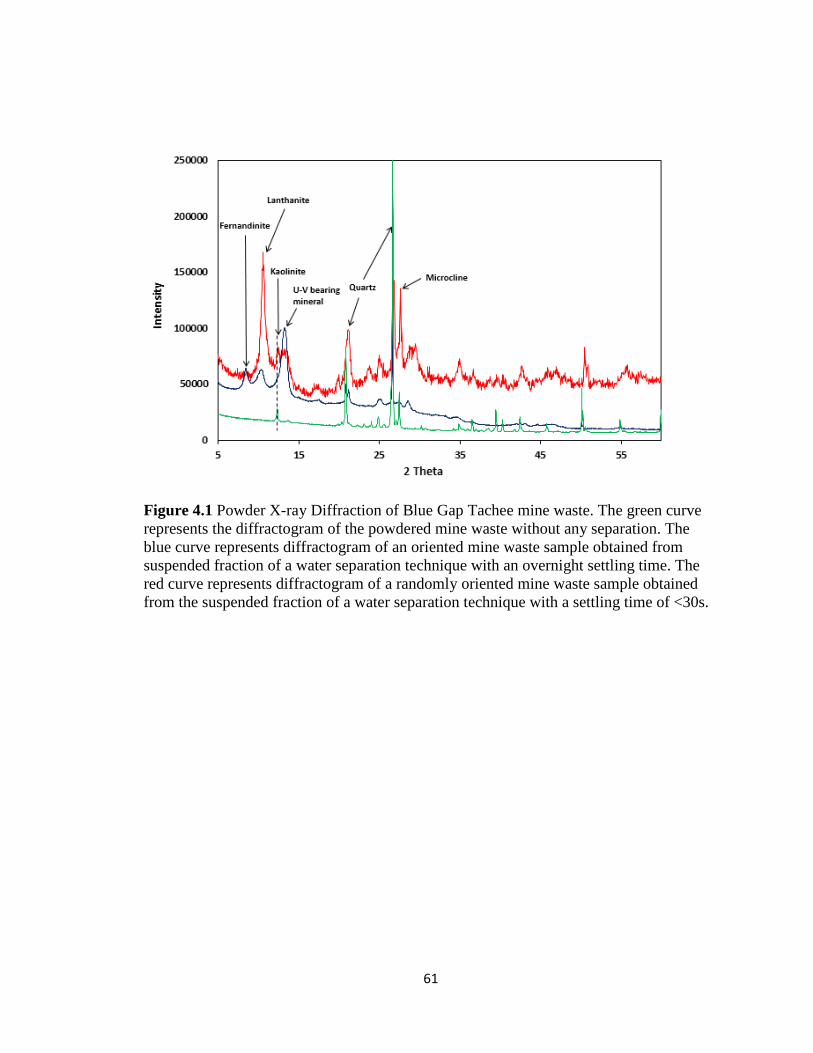
61
Figure 4.1 Powder X-ray Diffraction of Blue Gap Tachee mine waste. The green curve represents the diffractogram of the powdered mine waste without any separation. The blue curve represents diffractogram of an oriented mine waste sample obtained from suspended fraction of a water separation technique with an overnight settling time. The red curve represents diffractogram of a randomly oriented mine waste sample obtained from the suspended fraction of a water separation technique with a settling time of <30s.

62
Figure 4.2 Qualitative electron microprobe X-ray maps of elemental distributions in an ore sample from mine waste from the Blue Gap Tachee site, showing complex correlation of U with V, K, Ca and O. A) Back-scattered electron image of the mapped area, B) U Mα map, C) V Kα map, D) K Kα map E) O Kα map and F) Ca Kα Map.
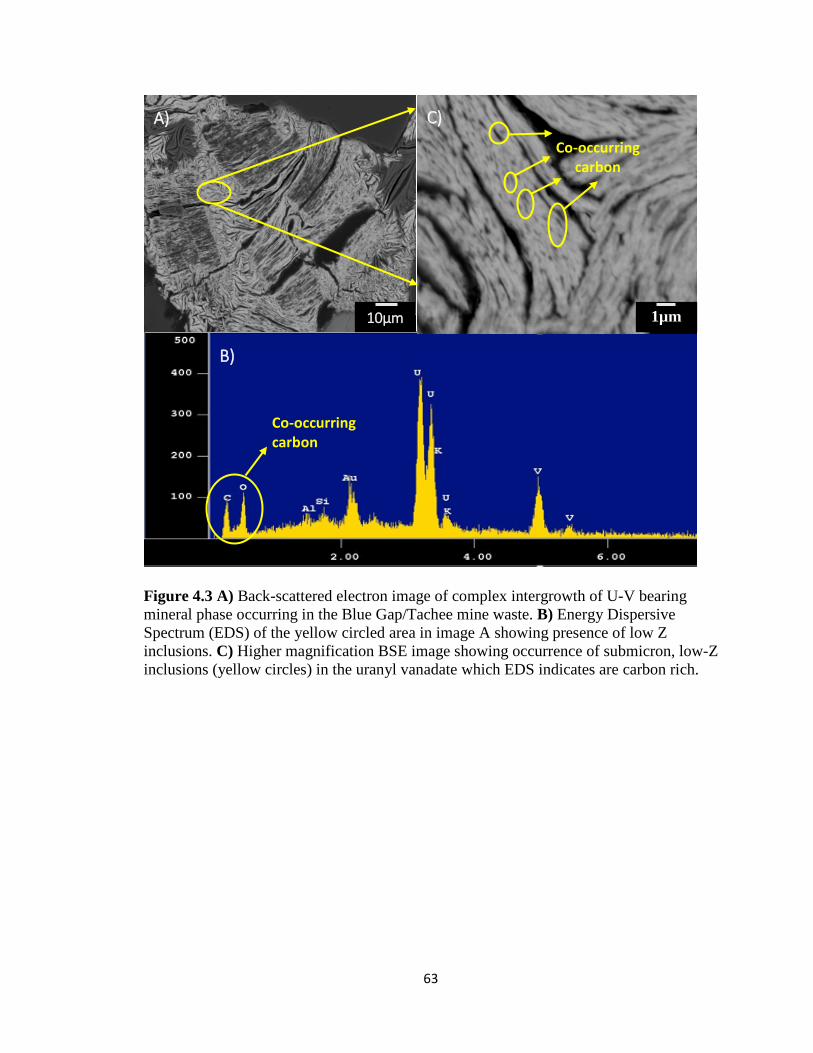
63
Figure 4.3 A) Back-scattered electron image of complex intergrowth of U-V bearing mineral phase occurring in the Blue Gap/Tachee mine waste. B) Energy Dispersive Spectrum (EDS) of the yellow circled area in image A showing presence of low Z inclusions. C) Higher magnification BSE image showing occurrence of submicron, low-Z inclusions (yellow circles) in the uranyl vanadate which EDS indicates are carbon rich.
Co-occurring carbon
Co-occurring carbon
10µm 1µm
A)
B)
C)
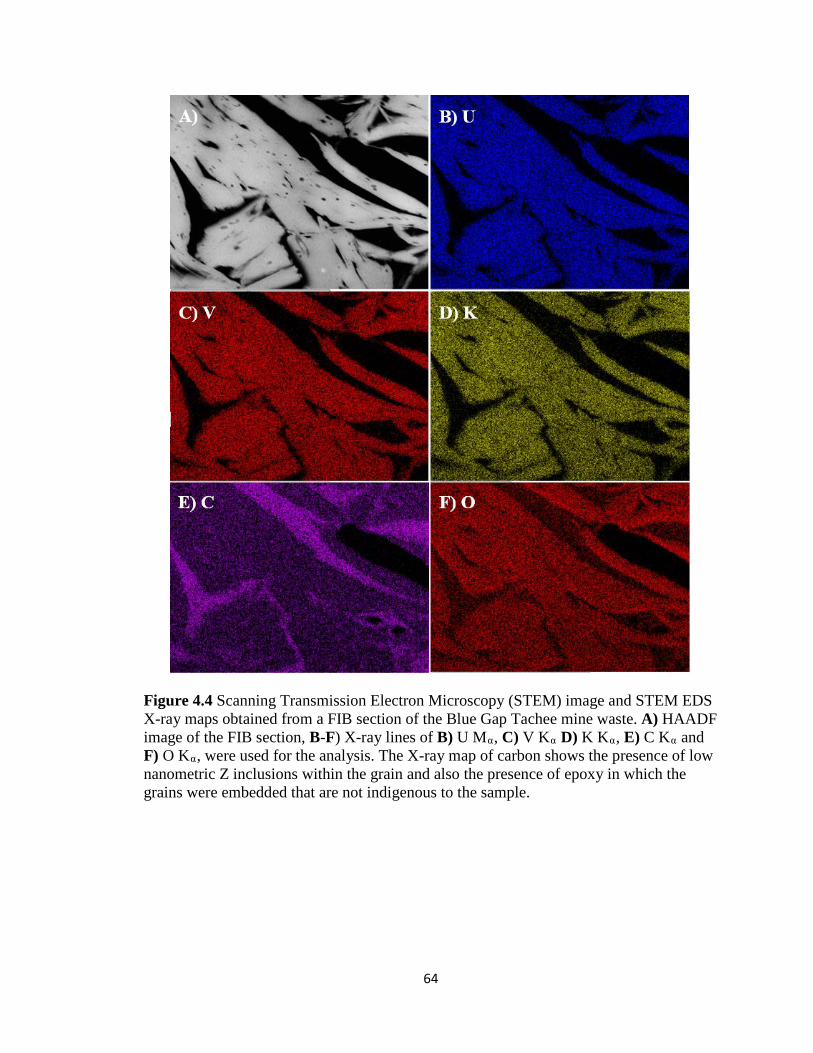
64
Figure 4.4 Scanning Transmission Electron Microscopy (STEM) image and STEM EDS X-ray maps obtained from a FIB section of the Blue Gap Tachee mine waste. A) HAADF image of the FIB section, B-F) X-ray lines of B) U Mα, C) V Kα D) K Kα, E) C Kα and F) O Kα, were used for the analysis. The X-ray map of carbon shows the presence of low nanometric Z inclusions within the grain and also the presence of epoxy in which the grains were embedded that are not indigenous to the sample.
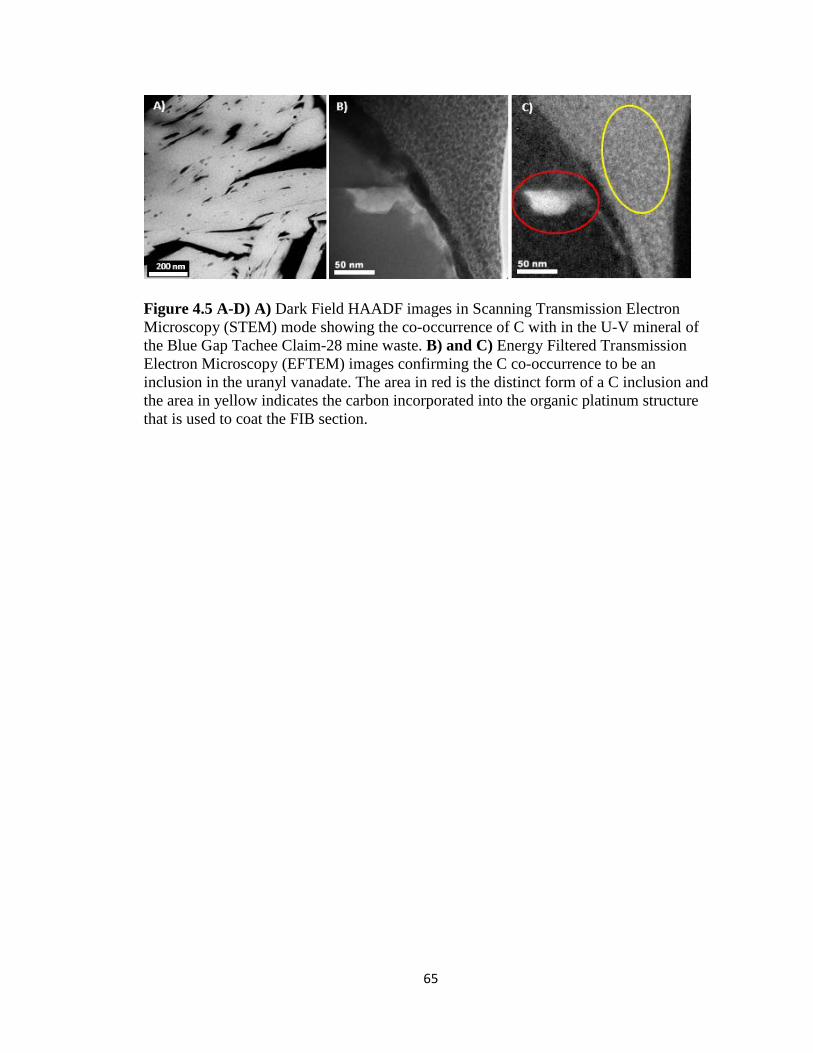
65
Figure 4.5 A-D) A) Dark Field HAADF images in Scanning Transmission Electron Microscopy (STEM) mode showing the co-occurrence of C with in the U-V mineral of the Blue Gap Tachee Claim-28 mine waste. B) and C) Energy Filtered Transmission Electron Microscopy (EFTEM) images confirming the C co-occurrence to be an inclusion in the uranyl vanadate. The area in red is the distinct form of a C inclusion and the area in yellow indicates the carbon incorporated into the organic platinum structure that is used to coat the FIB section.
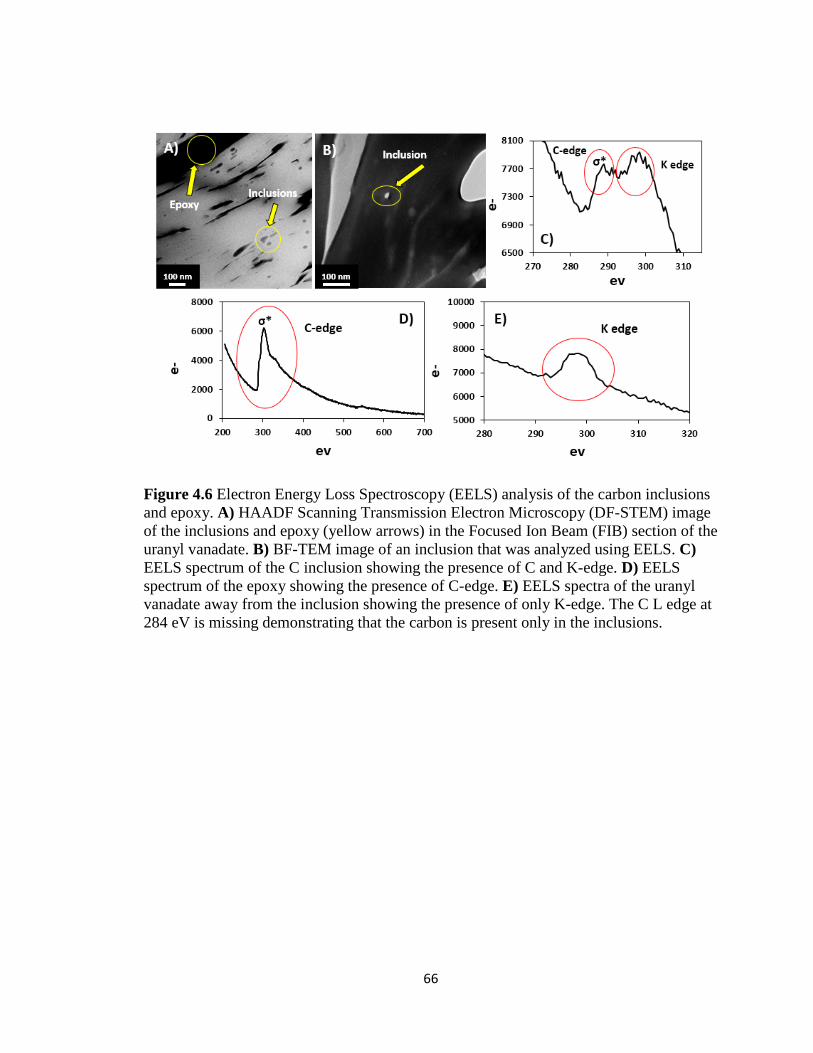
66
Figure 4.6 Electron Energy Loss Spectroscopy (EELS) analysis of the carbon inclusions and epoxy. A) HAADF Scanning Transmission Electron Microscopy (DF-STEM) image of the inclusions and epoxy (yellow arrows) in the Focused Ion Beam (FIB) section of the uranyl vanadate. B) BF-TEM image of an inclusion that was analyzed using EELS. C) EELS spectrum of the C inclusion showing the presence of C and K-edge. D) EELS spectrum of the epoxy showing the presence of C-edge. E) EELS spectra of the uranyl vanadate away from the inclusion showing the presence of only K-edge. The C L edge at 284 eV is missing demonstrating that the carbon is present only in the inclusions.
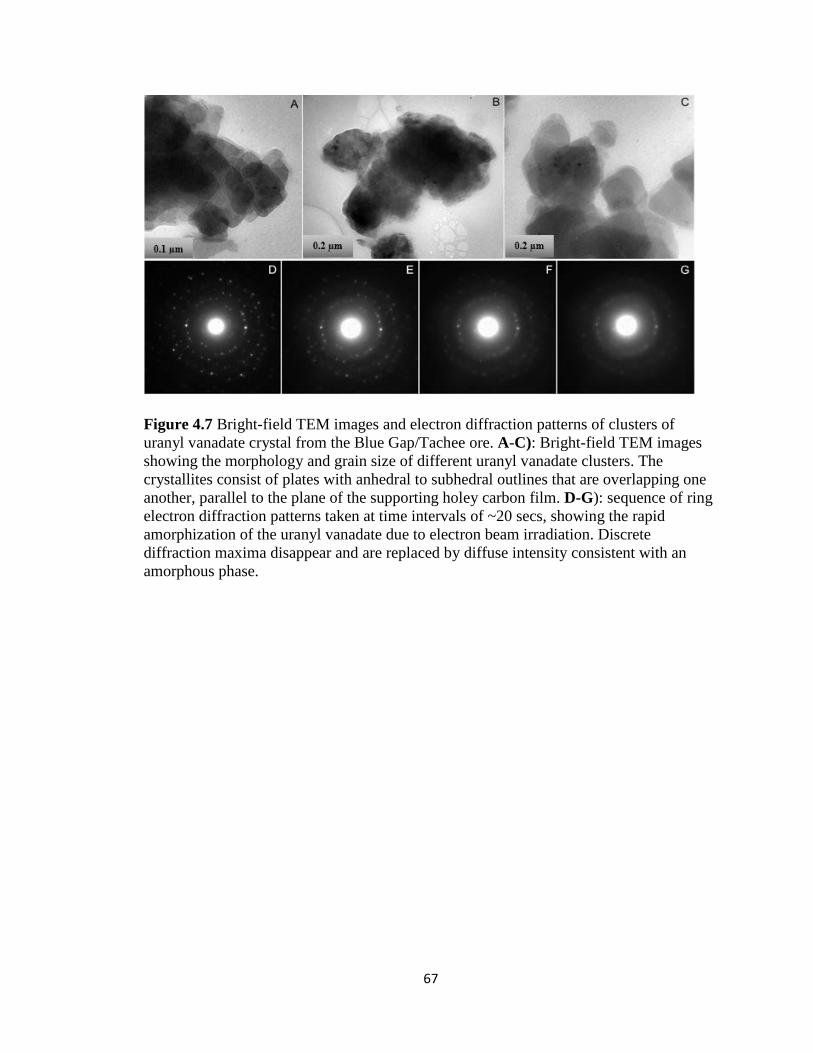
67
Figure 4.7 Bright-field TEM images and electron diffraction patterns of clusters of uranyl vanadate crystal from the Blue Gap/Tachee ore. A-C): Bright-field TEM images showing the morphology and grain size of different uranyl vanadate clusters. The crystallites consist of plates with anhedral to subhedral outlines that are overlapping one another, parallel to the plane of the supporting holey carbon film. D-G): sequence of ring electron diffraction patterns taken at time intervals of ~20 secs, showing the rapid amorphization of the uranyl vanadate due to electron beam irradiation. Discrete diffraction maxima disappear and are replaced by diffuse intensity consistent with an amorphous phase.
68
(To be submitted to Chemical Geology)
Sumant Avasarala1*, Chris Torres2, Abdul-Mehdi S. Ali3, Bruce M. Thomson1, Michael
N. Spilde3, Eric J. Peterson3, Kateryna Artyushkova2, Elena Dobrica3, Juan S. Lezama-
Pacheco5, and José M. Cerrato1
*Corresponding email address: [email protected], Telephone: (001) (248) 978-8264 Fax: (001) (505) 277-1918
1 Department of Civil Engineering, MSC01 1070, University of New Mexico, Albuquerque, New Mexico 87131, USA.
2 Department of Chemical and Biological Engineering, MSC01 1120, University of New Mexico, Albuquerque, New Mexico 87131, USA
3 Department of Earth and Planetary Sciences, MSC03 2040, University of New Mexico, Albuquerque, New Mexico 87131, USA
4 OFM Research-Southwest, Santa Fe, New Mexico 87507, USA.
5 Department of Environmental Earth System Science, Stanford University, California 94305
Abstract.
We investigated the effect of oxidizing conditions on the submicron U(IV) and U(VI)
mineral phases in mine wastes from Jackpile-Paguate mine, Laguna Pueblo, New
Mexico, by integrating laboratory experiments, spectroscopy, microscopy and diffraction
techniques. Concentrations exceeding 7000 mg Kg-1 U were measured in these sediments
69
using X-ray fluorescence. Results from X-ray Photoelectron Spectroscopy (XPS) analysis
suggested co-occurrence of U(VI) and U(IV) at a ratio of 19:1 at the surface. These
results agree with observations made using X-ray Diffraction (XRD) and electron
microprobe where coffinites (USiO4) and U-P-K phases were identified. The U-
phosphate phase (U-P-K phase) was the predominant submicron crystalline U-phase
encapsulated by carbon, based on results from scanning transmission electron microscopy
imaging (STEM), energy dispersive spectroscopy (EDS), and STEM mapping.
Laboratory experiments also measured the effect of bicarbonate and oxidizing agents
(e.g., dissolved oxygen (DO) and OCl-) on the submicron U(IV) and U(VI) minerals.
Despite exposing the mine wastes to strong oxidizing conditions, the highest aqueous U
concentrations were obtained from mine waste reaction with 10mM NaHCO3 at pH 7.5.
The reaction of these organic rich mine wastes with bicarbonate under ambient dissolved
oxygen concentrations can result in considerable mobilization of U in water, which has
relevance for environmental conditions observed at the Rio Paguate across Jackpile mine.
Results from this investigation provide a better understanding on the reactivity of carbon
encapsulated submicron U-phases under oxidizing conditions and has important
implications in uranium recovery, remediation, and risk exposure assessment.
Introduction.
The occurrence of uranium (U) in water and soils after mining operations has occurred at
thousands of uranium mines throughout the United States. This study is focused on the
Jackpile-Paguate on Laguna Pueblo, NM, which, at one time, was the largest open pit U
mine in the world. The Jackpile deposit was discovered in 1951 during an airborne
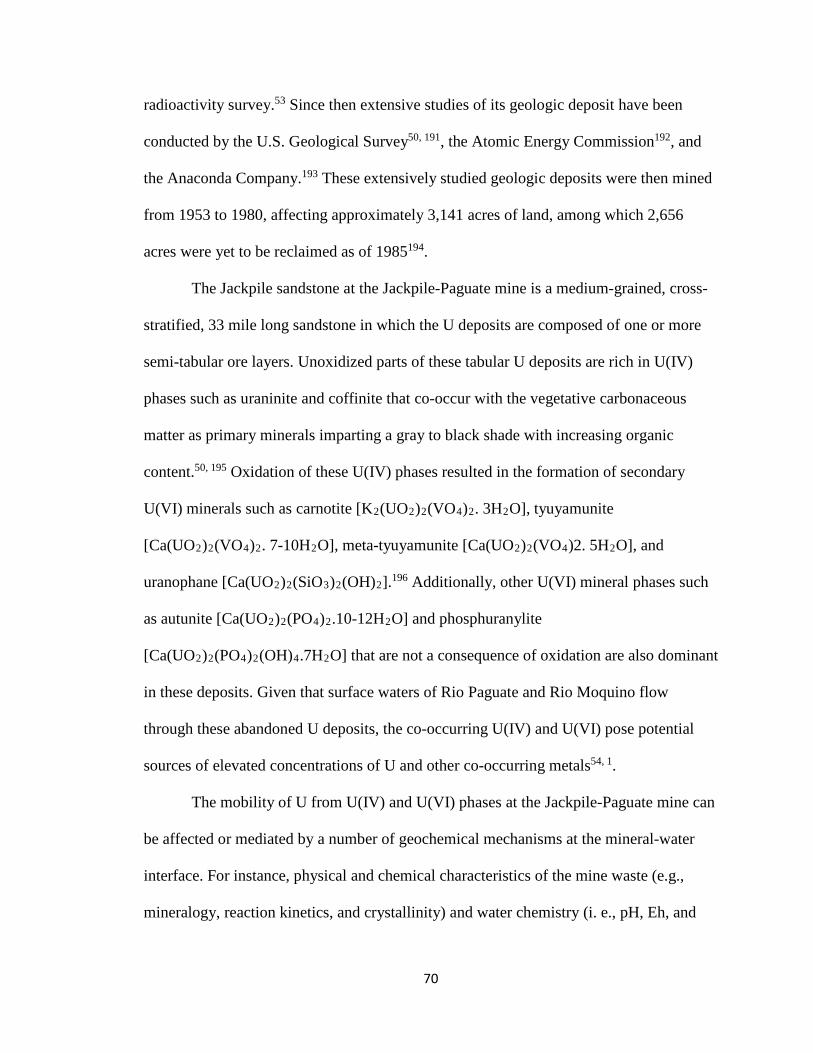
70
radioactivity survey.53 Since then extensive studies of its geologic deposit have been
conducted by the U.S. Geological Survey50, 191, the Atomic Energy Commission192, and
the Anaconda Company.193 These extensively studied geologic deposits were then mined
from 1953 to 1980, affecting approximately 3,141 acres of land, among which 2,656
acres were yet to be reclaimed as of 1985194.
The Jackpile sandstone at the Jackpile-Paguate mine is a medium-grained, cross-
stratified, 33 mile long sandstone in which the U deposits are composed of one or more
semi-tabular ore layers. Unoxidized parts of these tabular U deposits are rich in U(IV)
phases such as uraninite and coffinite that co-occur with the vegetative carbonaceous
matter as primary minerals imparting a gray to black shade with increasing organic
content.50, 195 Oxidation of these U(IV) phases resulted in the formation of secondary
U(VI) minerals such as carnotite [K2(UO2)2(VO4)2. 3H2O], tyuyamunite
[Ca(UO2)2(VO4)2. 7-10H2O], meta-tyuyamunite [Ca(UO2)2(VO4)2. 5H2O], and
uranophane [Ca(UO2)2(SiO3)2(OH)2].196 Additionally, other U(VI) mineral phases such
as autunite [Ca(UO2)2(PO4)2.10-12H2O] and phosphuranylite
[Ca(UO2)2(PO4)2(OH)4.7H2O] that are not a consequence of oxidation are also dominant
in these deposits. Given that surface waters of Rio Paguate and Rio Moquino flow
through these abandoned U deposits, the co-occurring U(IV) and U(VI) pose potential
sources of elevated concentrations of U and other co-occurring metals54, 1.
The mobility of U from U(IV) and U(VI) phases at the Jackpile-Paguate mine can
be affected or mediated by a number of geochemical mechanisms at the mineral-water
interface. For instance, physical and chemical characteristics of the mine waste (e.g.,
mineralogy, reaction kinetics, and crystallinity) and water chemistry (i. e., pH, Eh, and
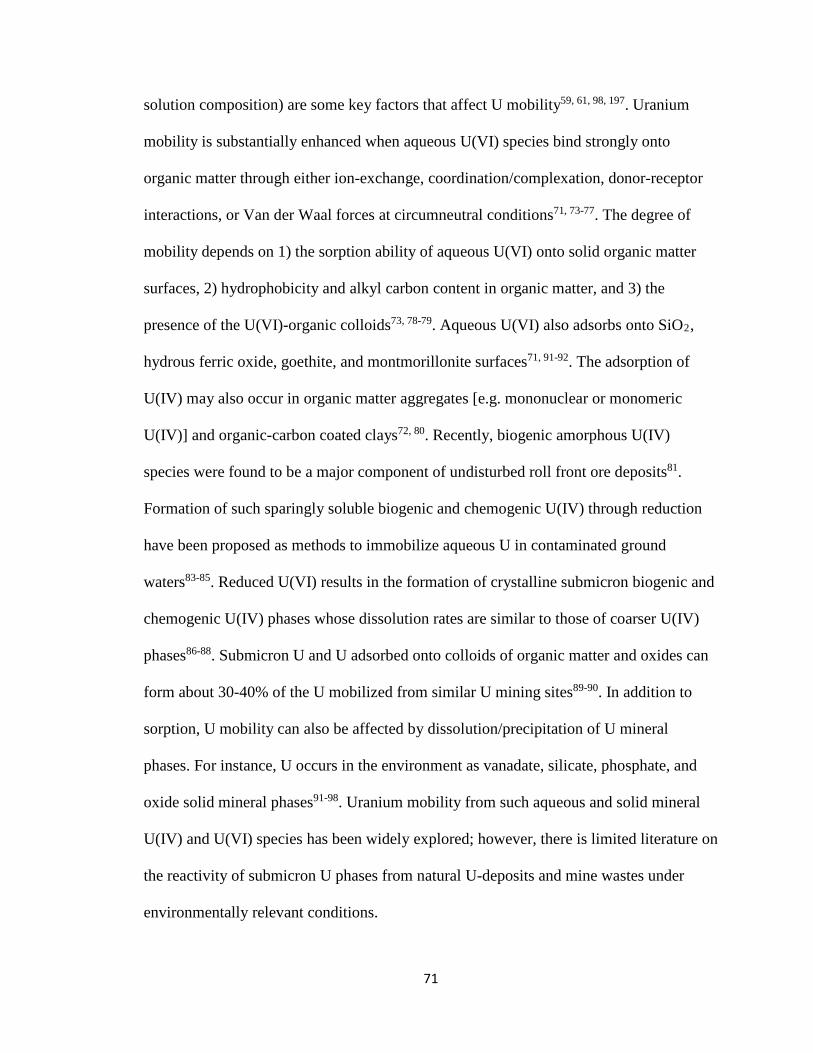
71
solution composition) are some key factors that affect U mobility59, 61, 98, 197. Uranium
mobility is substantially enhanced when aqueous U(VI) species bind strongly onto
organic matter through either ion-exchange, coordination/complexation, donor-receptor
interactions, or Van der Waal forces at circumneutral conditions71, 73-77. The degree of
mobility depends on 1) the sorption ability of aqueous U(VI) onto solid organic matter
surfaces, 2) hydrophobicity and alkyl carbon content in organic matter, and 3) the
presence of the U(VI)-organic colloids73, 78-79. Aqueous U(VI) also adsorbs onto SiO2,
hydrous ferric oxide, goethite, and montmorillonite surfaces71, 91-92. The adsorption of
U(IV) may also occur in organic matter aggregates [e.g. mononuclear or monomeric
U(IV)] and organic-carbon coated clays72, 80. Recently, biogenic amorphous U(IV)
species were found to be a major component of undisturbed roll front ore deposits81.
Formation of such sparingly soluble biogenic and chemogenic U(IV) through reduction
have been proposed as methods to immobilize aqueous U in contaminated ground
waters83-85. Reduced U(VI) results in the formation of crystalline submicron biogenic and
chemogenic U(IV) phases whose dissolution rates are similar to those of coarser U(IV)
phases86-88. Submicron U and U adsorbed onto colloids of organic matter and oxides can
form about 30-40% of the U mobilized from similar U mining sites89-90. In addition to
sorption, U mobility can also be affected by dissolution/precipitation of U mineral
phases. For instance, U occurs in the environment as vanadate, silicate, phosphate, and
oxide solid mineral phases91-98. Uranium mobility from such aqueous and solid mineral
U(IV) and U(VI) species has been widely explored; however, there is limited literature on
the reactivity of submicron U phases from natural U-deposits and mine wastes under
environmentally relevant conditions.
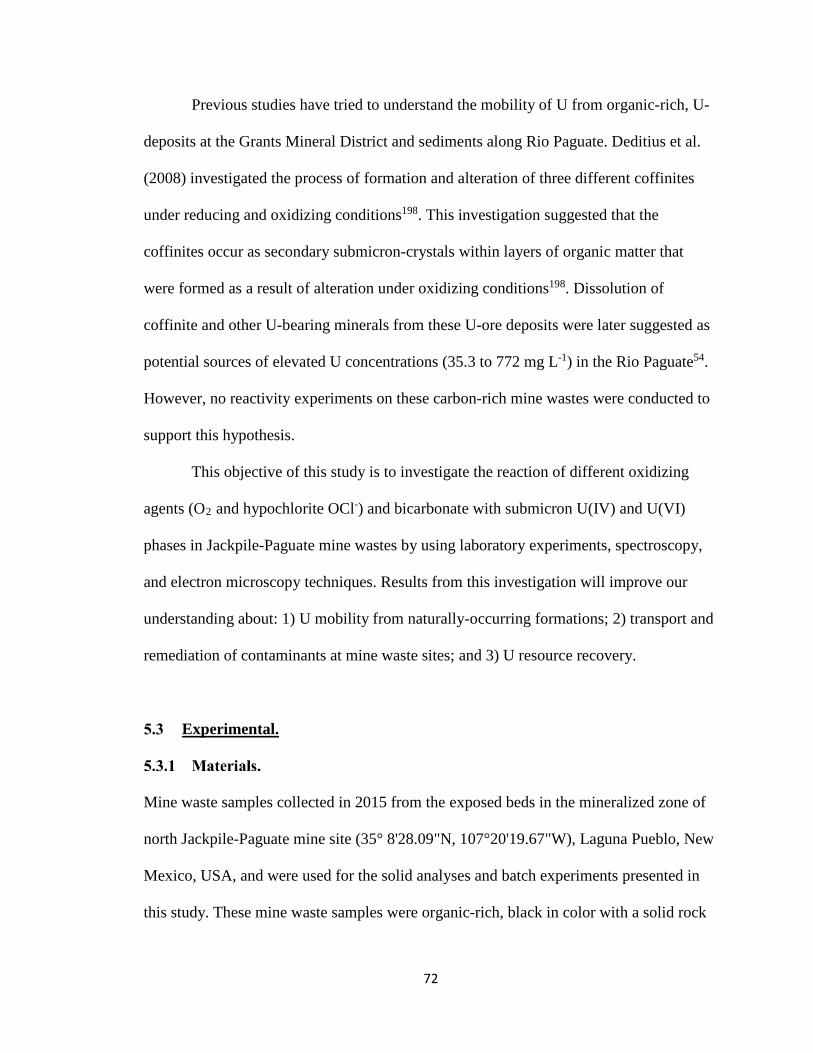
72
Previous studies have tried to understand the mobility of U from organic-rich, U-
deposits at the Grants Mineral District and sediments along Rio Paguate. Deditius et al.
(2008) investigated the process of formation and alteration of three different coffinites
under reducing and oxidizing conditions198. This investigation suggested that the
coffinites occur as secondary submicron-crystals within layers of organic matter that
were formed as a result of alteration under oxidizing conditions198. Dissolution of
coffinite and other U-bearing minerals from these U-ore deposits were later suggested as
potential sources of elevated U concentrations (35.3 to 772 mg L-1) in the Rio Paguate54.
However, no reactivity experiments on these carbon-rich mine wastes were conducted to
support this hypothesis.
This objective of this study is to investigate the reaction of different oxidizing
agents (O2 and hypochlorite OCl-) and bicarbonate with submicron U(IV) and U(VI)
phases in Jackpile-Paguate mine wastes by using laboratory experiments, spectroscopy,
and electron microscopy techniques. Results from this investigation will improve our
understanding about: 1) U mobility from naturally-occurring formations; 2) transport and
remediation of contaminants at mine waste sites; and 3) U resource recovery.
Experimental.
Mine waste samples collected in 2015 from the exposed beds in the mineralized zone of
north Jackpile-Paguate mine site (35° 8'28.09"N, 107°20'19.67"W), Laguna Pueblo, New
Mexico, USA, and were used for the solid analyses and batch experiments presented in
this study. These mine waste samples were organic-rich, black in color with a solid rock
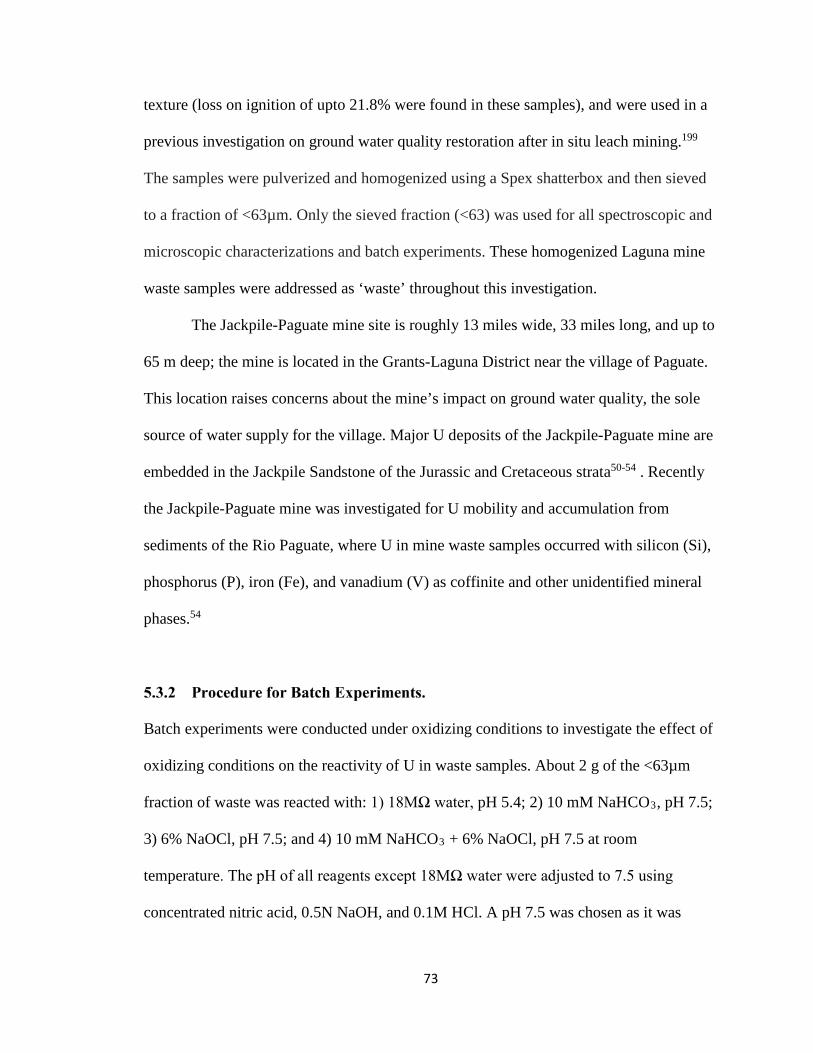
73
texture (loss on ignition of upto 21.8% were found in these samples), and were used in a
previous investigation on ground water quality restoration after in situ leach mining.199
The samples were pulverized and homogenized using a Spex shatterbox and then sieved
to a fraction of <63µm. Only the sieved fraction (<63) was used for all spectroscopic and
microscopic characterizations and batch experiments. These homogenized Laguna mine
waste samples were addressed as ‘waste’ throughout this investigation.
The Jackpile-Paguate mine site is roughly 13 miles wide, 33 miles long, and up to
65 m deep; the mine is located in the Grants-Laguna District near the village of Paguate.
This location raises concerns about the mine’s impact on ground water quality, the sole
source of water supply for the village. Major U deposits of the Jackpile-Paguate mine are
embedded in the Jackpile Sandstone of the Jurassic and Cretaceous strata50-54 . Recently
the Jackpile-Paguate mine was investigated for U mobility and accumulation from
sediments of the Rio Paguate, where U in mine waste samples occurred with silicon (Si),
phosphorus (P), iron (Fe), and vanadium (V) as coffinite and other unidentified mineral
phases.54
Batch experiments were conducted under oxidizing conditions to investigate the effect of
oxidizing conditions on the reactivity of U in waste samples. About 2 g of the <63µm
fraction of waste was reacted with: 1) 18MΩ water, pH 5.4; 2) 10 mM NaHCO3, pH 7.5;
3) 6% NaOCl, pH 7.5; and 4) 10 mM NaHCO3 + 6% NaOCl, pH 7.5 at room
temperature. The pH of all reagents except 18MΩ water were adjusted to 7.5 using
concentrated nitric acid, 0.5N NaOH, and 0.1M HCl. A pH 7.5 was chosen as it was

74
proximate to the pKa of NaOCl 200, represents the pH of surface water at the site54, and
was the recommended pH to effectively oxidize the organic matter201-202. Furthermore,
10mM NaHCO3 was selected to mimic the alkalinity and pH conditions measured in the
Rio Paguate that flows through the Jackpile-Paguate mine site54. The 18MΩ water
reaction with waste approximately represents the first flush of waste in the field where
the weakly bound U is easily mobilized. The 6% NaOCl solution, purchased
commercially from Fisher Scientific, was used as a strong oxidizing agent to increase the
release of U through oxidation of organic carbon (C) and reduced mineral phases. All
experiments were conducted in triplicate. The batch oxidation studies were conducted for
two weeks, and aliquots were collected periodically after 0.5, 2, 4, 8, 24, 72, 144, 218,
288, and 336 hours of reaction. The aliquots were then filtered through 0.45µm filters and
diluted to 10x or 100x depending on whether the elemental concentrations were measured
using Inductively Coupled Plasma – Optical Emission Spectroscopy (ICP-OES) or Mass
Spectroscopy (ICP-MS).
The concentrations of metals in the waste leachates were measured using a PerkinElmer
Optima 5300DV ICP-OES and a PerkinElmer Nexion 300D (Dynamic Reaction Cell)
ICP-MS. Trace metal concentrations below detection limit of ICP-OES were measured
using ICP-MS that has a 100-1000 times lower detection limit than ICP-OES. Both ICPs
were calibrated with a 5-point calibration curve, and QA/QC measures were taken to
ensure quality results. The solution pH was measured using a Thermo Scientific Orion
Versastar Advanced Electrochemistry pH meter. Additionally, at the end of the leaching
experiment the dissolved organic carbon (DOC) was measured using the UV persulfate

75
method in a Tekmar-Dohrmann Phoenix 8000 TOC analyzer. Additional information on
the DOC analysis and acid extractable procedure is provided in the supplementary
information (SI).
Characterization of waste samples was conducted using various spectroscopy,
microscopy, and diffraction techniques. Specifically, we used X-ray Fluorescence (XRF),
X-ray diffraction (XRD), and Electron microprobe analysis (EPMA), High resolution
Scanning Transmission Electron Microscopy (HR-STEM), X-ray photoelectron
spectroscopy (XPS), synchrotron micro X-ray Fluorescence spectroscopy (µ-SXRF), and
Zeta were used to obtain information on the occurrence of U-minerals in the mine waste
and their overall surface charge. Additional information on these methods is provided in
the supporting information (SI).
The aqueous complexes and solid phases of U formed during reactions with 18MΩ water,
6% NaOCl and 10 mM NaHCO3 were estimated using MINEQL+ v4.6203 to better
explain the U trends observed from our experiments. Inputs to these chemical equilibrium
simulations were provided based on alkalinity, pH and Ca and U concentrations
measured during the experiments. MINEQL database that was previously updated with
critical thermodynamic reactions such as aqueous cation-uranyl-carbonate complexes was
used instead of the default MINEQL database that is supplied with the software.128, 204-206
Results and Discussion.
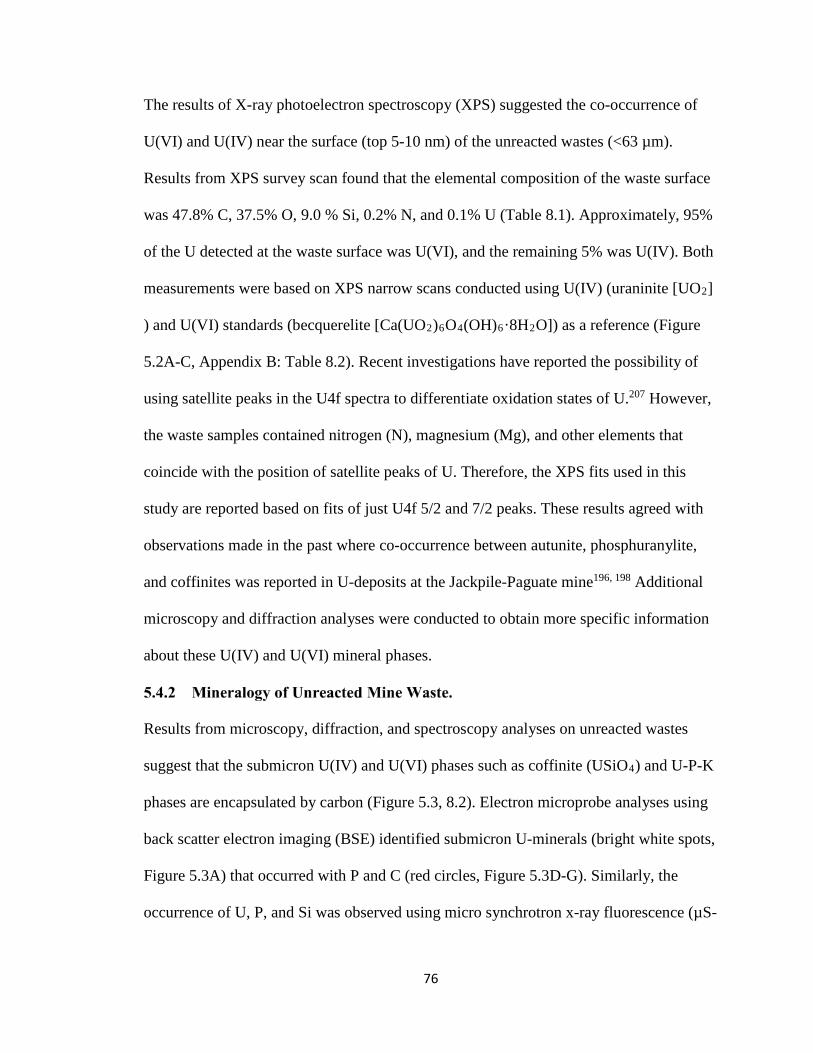
76
The results of X-ray photoelectron spectroscopy (XPS) suggested the co-occurrence of
U(VI) and U(IV) near the surface (top 5-10 nm) of the unreacted wastes (<63 µm).
Results from XPS survey scan found that the elemental composition of the waste surface
was 47.8% C, 37.5% O, 9.0 % Si, 0.2% N, and 0.1% U (Table 8.1). Approximately, 95%
of the U detected at the waste surface was U(VI), and the remaining 5% was U(IV). Both
measurements were based on XPS narrow scans conducted using U(IV) (uraninite [UO2]
) and U(VI) standards (becquerelite [Ca(UO2)6O4(OH)6·8H2O]) as a reference (Figure
5.2A-C, Appendix B: Table 8.2). Recent investigations have reported the possibility of
using satellite peaks in the U4f spectra to differentiate oxidation states of U.207 However,
the waste samples contained nitrogen (N), magnesium (Mg), and other elements that
coincide with the position of satellite peaks of U. Therefore, the XPS fits used in this
study are reported based on fits of just U4f 5/2 and 7/2 peaks. These results agreed with
observations made in the past where co-occurrence between autunite, phosphuranylite,
and coffinites was reported in U-deposits at the Jackpile-Paguate mine196, 198 Additional
microscopy and diffraction analyses were conducted to obtain more specific information
about these U(IV) and U(VI) mineral phases.
Results from microscopy, diffraction, and spectroscopy analyses on unreacted wastes
suggest that the submicron U(IV) and U(VI) phases such as coffinite (USiO4) and U-P-K
phases are encapsulated by carbon (Figure 5.3, 8.2). Electron microprobe analyses using
back scatter electron imaging (BSE) identified submicron U-minerals (bright white spots,
Figure 5.3A) that occurred with P and C (red circles, Figure 5.3D-G). Similarly, the
occurrence of U, P, and Si was observed using micro synchrotron x-ray fluorescence (µS-
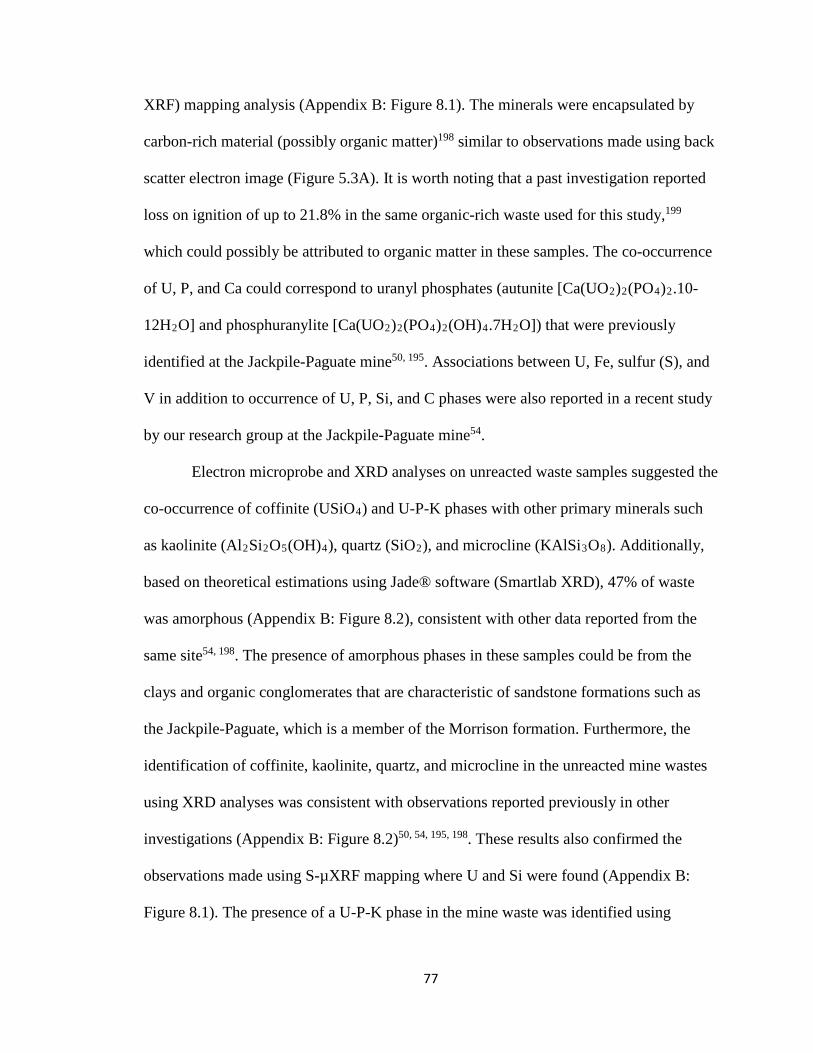
77
XRF) mapping analysis (Appendix B: Figure 8.1). The minerals were encapsulated by
carbon-rich material (possibly organic matter)198 similar to observations made using back
scatter electron image (Figure 5.3A). It is worth noting that a past investigation reported
loss on ignition of up to 21.8% in the same organic-rich waste used for this study,199
which could possibly be attributed to organic matter in these samples. The co-occurrence
of U, P, and Ca could correspond to uranyl phosphates (autunite [Ca(UO2)2(PO4)2.10-
12H2O] and phosphuranylite [Ca(UO2)2(PO4)2(OH)4.7H2O]) that were previously
identified at the Jackpile-Paguate mine50, 195. Associations between U, Fe, sulfur (S), and
V in addition to occurrence of U, P, Si, and C phases were also reported in a recent study
by our research group at the Jackpile-Paguate mine54.
Electron microprobe and XRD analyses on unreacted waste samples suggested the
co-occurrence of coffinite (USiO4) and U-P-K phases with other primary minerals such
as kaolinite (Al2Si2O5(OH)4), quartz (SiO2), and microcline (KAlSi3O8). Additionally,
based on theoretical estimations using Jade® software (Smartlab XRD), 47% of waste
was amorphous (Appendix B: Figure 8.2), consistent with other data reported from the
same site54, 198. The presence of amorphous phases in these samples could be from the
clays and organic conglomerates that are characteristic of sandstone formations such as
the Jackpile-Paguate, which is a member of the Morrison formation. Furthermore, the
identification of coffinite, kaolinite, quartz, and microcline in the unreacted mine wastes
using XRD analyses was consistent with observations reported previously in other
investigations (Appendix B: Figure 8.2)50, 54, 195, 198. These results also confirmed the
observations made using S-µXRF mapping where U and Si were found (Appendix B:
Figure 8.1). The presence of a U-P-K phase in the mine waste was identified using

78
electron microprobe BSE imaging and energy dispersive spectroscopy (EDS) analyses.
The U-P-K phases were similar to observations made using microprobe mapping and
previously reported (Figure 5.3B, C)50, 195. However, the specific U-minerals formed by
U, P, and K remain unknown.
The scanning transmission electron microscopy (STEM) analysis suggested the
presence of carbon encapsulated crystalline U-P-K phase in the waste samples (Figure
5.4). Specifically, bright field TEM imaging and EDS analyses were used to observe that
the U-P-K phase was both submicron and predominant (black features, Figure 5.4A, B).
In addition, the patterned fringes (in yellow) obtained using high resolution TEM
imaging suggested that these U-P-K phases were crystalline (Figure 5.4C). These
submicron U-P-K phases co-occurred with C and Ca (Figure 5.4A) and were consistent
with observations made by electron microprobe analysis (Figure 5.3). We prepared a
STEM map of these U-P-K grains (Appendix B: Figure 8.3) because the C map
suggested that the C occurs as an encapsulation, similar to the electron microprobe
mapping results (Appendix B: Figure 8.3B). This carbon layer, composed of 33.3% C
and 66.6% O (spectrum 3, Appendix B: Figure 8.4), could be from vegetative organic
matter that was reported to intricately co-occur with U-minerals in the mine waste50, 195,
198. The composition of the U-P-K phase was also estimated to be 10.7% U, 3.79% K,
9.15% P, 6.49 Si, and 69.86% O (Spectrum 1, 2 and 4, Appendix B: Figure 8.4). In
another study, the sustained presence of U(IV) minerals, such as coffinites in the
Jackpile-Paguate mine wastes, was reported as a consequence of reducing conditions
preserved by this vegetative organic matter198. However, the interaction of organic matter
with U is still not well understood. Future investigations could conduct a more detailed
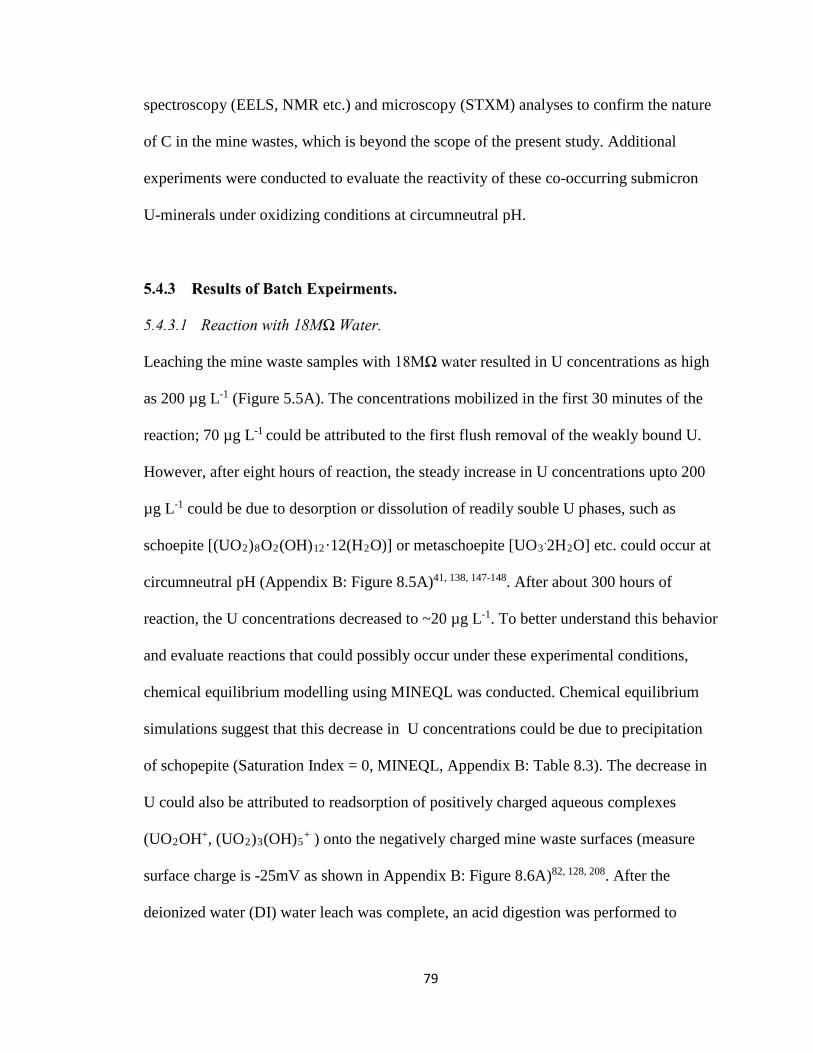
79
spectroscopy (EELS, NMR etc.) and microscopy (STXM) analyses to confirm the nature
of C in the mine wastes, which is beyond the scope of the present study. Additional
experiments were conducted to evaluate the reactivity of these co-occurring submicron
U-minerals under oxidizing conditions at circumneutral pH.
Leaching the mine waste samples with 18MΩ water resulted in U concentrations as high
as 200 µg L-1 (Figure 5.5A). The concentrations mobilized in the first 30 minutes of the
reaction; 70 µg L-1 could be attributed to the first flush removal of the weakly bound U.
However, after eight hours of reaction, the steady increase in U concentrations upto 200
µg L-1 could be due to desorption or dissolution of readily souble U phases, such as
schoepite [(UO2)8O2(OH)12·12(H2O)] or metaschoepite [UO3.2H2O] etc. could occur at
circumneutral pH (Appendix B: Figure 8.5A)41, 138, 147-148. After about 300 hours of
reaction, the U concentrations decreased to ~20 µg L-1. To better understand this behavior
and evaluate reactions that could possibly occur under these experimental conditions,
chemical equilibrium modelling using MINEQL was conducted. Chemical equilibrium
simulations suggest that this decrease in U concentrations could be due to precipitation
of schopepite (Saturation Index = 0, MINEQL, Appendix B: Table 8.3). The decrease in
U could also be attributed to readsorption of positively charged aqueous complexes
(UO2OH+, (UO2)3(OH)5+ ) onto the negatively charged mine waste surfaces (measure
surface charge is -25mV as shown in Appendix B: Figure 8.6A)82, 128, 208. After the
deionized water (DI) water leach was complete, an acid digestion was performed to
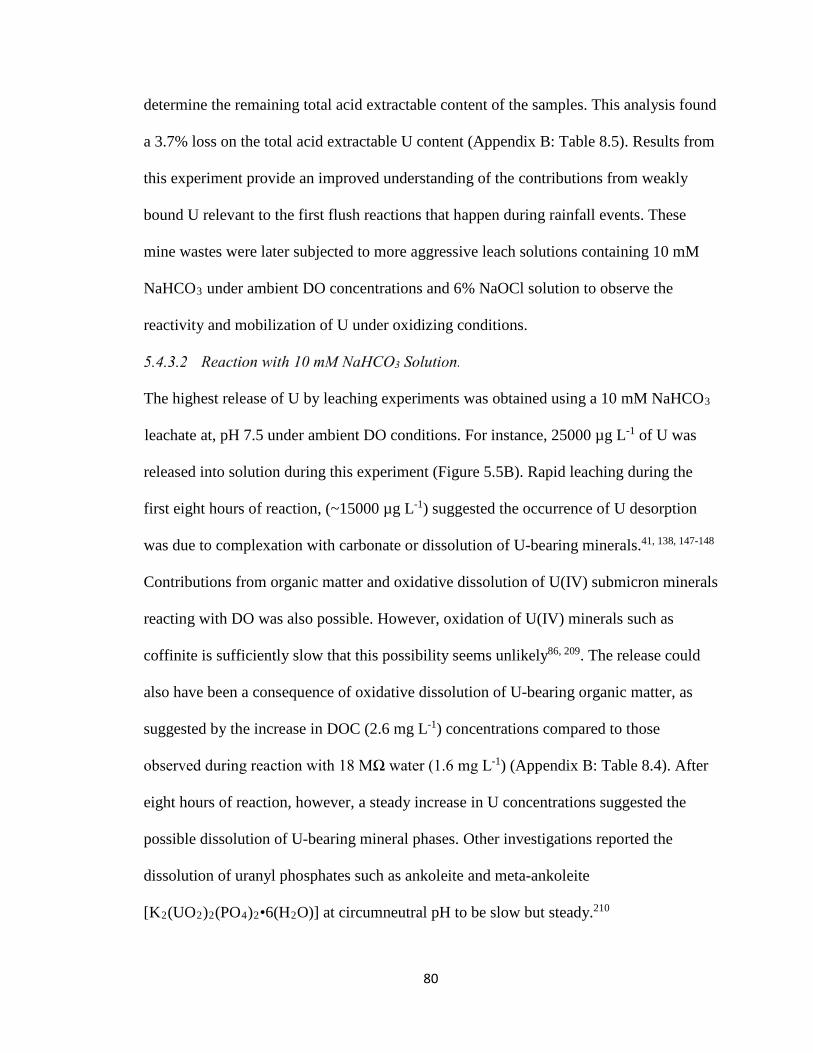
80
determine the remaining total acid extractable content of the samples. This analysis found
a 3.7% loss on the total acid extractable U content (Appendix B: Table 8.5). Results from
this experiment provide an improved understanding of the contributions from weakly
bound U relevant to the first flush reactions that happen during rainfall events. These
mine wastes were later subjected to more aggressive leach solutions containing 10 mM
NaHCO3 under ambient DO concentrations and 6% NaOCl solution to observe the
reactivity and mobilization of U under oxidizing conditions.
The highest release of U by leaching experiments was obtained using a 10 mM NaHCO3
leachate at, pH 7.5 under ambient DO conditions. For instance, 25000 µg L-1 of U was
released into solution during this experiment (Figure 5.5B). Rapid leaching during the
first eight hours of reaction, (~15000 µg L-1) suggested the occurrence of U desorption
was due to complexation with carbonate or dissolution of U-bearing minerals.41, 138, 147-148
Contributions from organic matter and oxidative dissolution of U(IV) submicron minerals
reacting with DO was also possible. However, oxidation of U(IV) minerals such as
coffinite is sufficiently slow that this possibility seems unlikely86, 209. The release could
also have been a consequence of oxidative dissolution of U-bearing organic matter, as
suggested by the increase in DOC (2.6 mg L-1) concentrations compared to those
observed during reaction with 18 MΩ water (1.6 mg L-1) (Appendix B: Table 8.4). After
eight hours of reaction, however, a steady increase in U concentrations suggested the
possible dissolution of U-bearing mineral phases. Other investigations reported the
dissolution of uranyl phosphates such as ankoleite and meta-ankoleite
[K2(UO2)2(PO4)2•6(H2O)] at circumneutral pH to be slow but steady.210
81
In order to futher identify the complexes that potentially affect U speciation
during this experiment and explain the U behavior under circumneutral conditions,
chemical equilibrium simulations using experimentally measured alkalinity, pH, and
concentrations of Ca and U were conducted. Results from these simulations suggested
that neutral or negativily-charged U-Ca-CO32- aqueous complexes such as UO2(CO3)3
4-,
CaUO2(CO3)32- and Ca2UO2(CO3)3
0 were predominant at pH 8 (Appendix B: Table 8.3,
Figure 8.7B). These neutral or negatively charged aqueous complexes potentially repelled
negative solid surfaces, which inhibited readsorption, unlike observations made with 18
MΩ water (Appendix B: Figure 8.5B, Figure 8.6B).128 After the experiment, the XPS
analysis on the reacted mine waste surfaces indicated an increase in U(VI)% from 95%
(unreacted) to 100% (reacted). This increased suggested oxidation of U(IV) phases due to
DO. However, the increase in U(VI)% could also be attributed to sample hetrogeneity.
Additionally, post leach acid digestions of the reacted mine waste samples found that
17% of the total acid extractable U was extracted by the 10 mM NaHCO3 leachate
(Appendix B: Table 8.5). This percentage loss in U was highest among all experiments
and was of greater environmental relevence as these conditions represent relevant
conditions observed at the site. Subsequent experiments were perfomed to understand the
reactivity of these co-occurring U(IV)-U(VI) phases under strong oxidizing conditions.
The concentrations of U released by leaching with 6% NaOCl was significantly less than
those obtained from leaching by NaHCO3 solution. Despite our using strong oxidizing
conditions, the concentrations of U (8000 µg L-1) released after leaching with 6% NaOCl
were less than one-third of those released during leach study with 10 mM NaHCO3, pH
82
7.5 (Figure 5.5C). These 8000 µg L-1 U concentrations were released within the first two
hours of reaction with 6% NaOCl. However, between the second and eighth hours of
reaction, the U concentrations dropped to ~2000 µg L-1. In order to better understand this
change in U behavior, chemical equilibrium simulations using experimentally measured
pH and Ca and U concentrations were conducted.
Attributing the decrease of U in solution over time to a single process in these
experiments is not possible given that the specific mineraology and organic matter
chemisry of the mine wastes remain unknown. There are a variety of scenarios that could
be considreed. For instance, chemical equilibrium simulations suggested that positively
charged aqueous complexes UO2OH+ were prevalant at pH 6-7 (Appendix B: Table 8.3,
Figure 8.5C). Given that the mine waste surfaces were negatively charged (Appendix B:
Figure 8.6C), the positively charged aqueous complexes UO2OH+ may readsorb to the
solids. The decrease in U concentrations may also be due to precipitation of schoepite as
indicated in results from chemical equilirbium calculations (Appendix B: Table 8.3).
Since U (~8000 µg L-1) and DOC (5.5 mg L-1) concentrations (Figure 5.5C, Appendix B:
Table 8.4) were measured in solution in these experiments, it is possible that the
readsorption process was affected by U-organic matter aqueous complexes. Uranium can
form stable U-organic matter complexes82. Since little is known about the chemistry and
characteristics of the organic matter type, the specific U(IV)/U(VI)-aqueous complexes
are also not known. Future investigations are necessary, to understand the chemistry of
organic matter in the mine wastes and idnetify relevant interfacial inoganic and organic
reactions between U and organic matter.
83
After eight hours of reaction, the steady increase in U concentrations to ~9000 µg
L-1 could be due to dissolution of U-bearing minerals that are soluble under acidic
conditions, pH <4 (Figure 5.5C, 8.6C). It is not possible to attribute this release to any
specific U phase such as coffinite, U-P-K, and other U-bearing minerals that were
identifed in the waste based on XRD and microprobe results discussed in the previous
sections. Other U-bearing minerals included uranyl sulfates, silicates - (Na, K)-
boltwoodite [(Na, K) (UO2SiO3OH. H2O)], and vanadates that were previously identified
as products of coffinite and uraninite oxidation196, 198. These secondary uranyl minerals—
such as Na-boltwoodite, meta-ankoleite, uranyl vanadates—were capable of dissolving
under acidic conditions at pH >4 based on results reported in other investigations98, 210-211.
However, more research is necessary to understand the specific U-phases and
mechanisms that affect the mobility of U from these mine wastes.
Finally after the experiment, the reacted wastes were subjected to XPS analysis
that found an increase in the U(VI)% from 95% to 100% possibly due to the oxidation of
U(IV) phases at the waste surface (Appendix B: Figure 8.8 and Table 8.2). The waste
solids were subjected to acid digestions after the NaOCl leaching that found a 12% loss
of the total acid extractable U from waste despite exposure to strong oxidizing conditions.
This result was less than that found by leaching with 10 mM NaHCO3 (Appendix B:
Table 8.5).
The solid samples were subjected to a combined reaction with 6% NaOCl and 10 mM
NaHCO3 to determine the combined effect of oxidation and complexation on U
leachability at pH 7.5. There was no noticeable increase in the U leachability obtained
84
from the combined reaction (oxidation + complexation) of 10 mM NaHCO3 + 6% NaOCl
with mine wastes compared to results from individual reactions with 10 mM NaHCO3 or
6% NaOCl. A leachate concentration of 8000 µg L-1 was mobilized in the first two hours,
which was similar to that observed during reactions with 6% NaOCl (Figure 5.5D).
However, the U release was unaffected by the presence of NaHCO3, possibly because the
buffering capacity of carbonate and bicarbonate was masked by HOCl and OCl- in these
experiments.
After two hours of reaction, the U concentrations decreased in a manner similar to
observations made during reaction with 6% NaOCl. This decrease in U concentrations
could not be attributed to a specific process. However, based on chemical equilibrium
modelling were conducted using measured alkalinity, pH, and Ca and U concentrations,
readsorption was unlikely due to similarity in charges of aqueous complexes (UO2CO3
(aq), UO2(CO3)2-2, Ca2UO2(CO3)3
0 and CaUO2(CO3)32-), and waste surfaces (Appendix
B: Table 8.3, Figure 8.5, 8.7 D,E) at pH 5.9. Readsorption of U as U-organic matter
aqueous complexes is also possible considering the presence of ~3.3 mg L-1 of DOC and
~8000 µg L-1 of U in the leachates (Appendix B: Table 8.4, Figure 5.5D). Aqueous U and
organic matter can associate to form stable U-organic matter aqueous complexes as
reported in a previous study82.
Unlike observations made during reaction with 6% NaOCl, we found that the U
concentrations during mine waste reaction with 10 mM NaHCO3 + 6% NaOCl did not
increase again after eight hours of reaction. This behavior could be attributed to the
improved buffering capacity of the system that prevented acidic conditions and
maintained the pH at ~6. Existing literature suggests that most uranyl minerals are
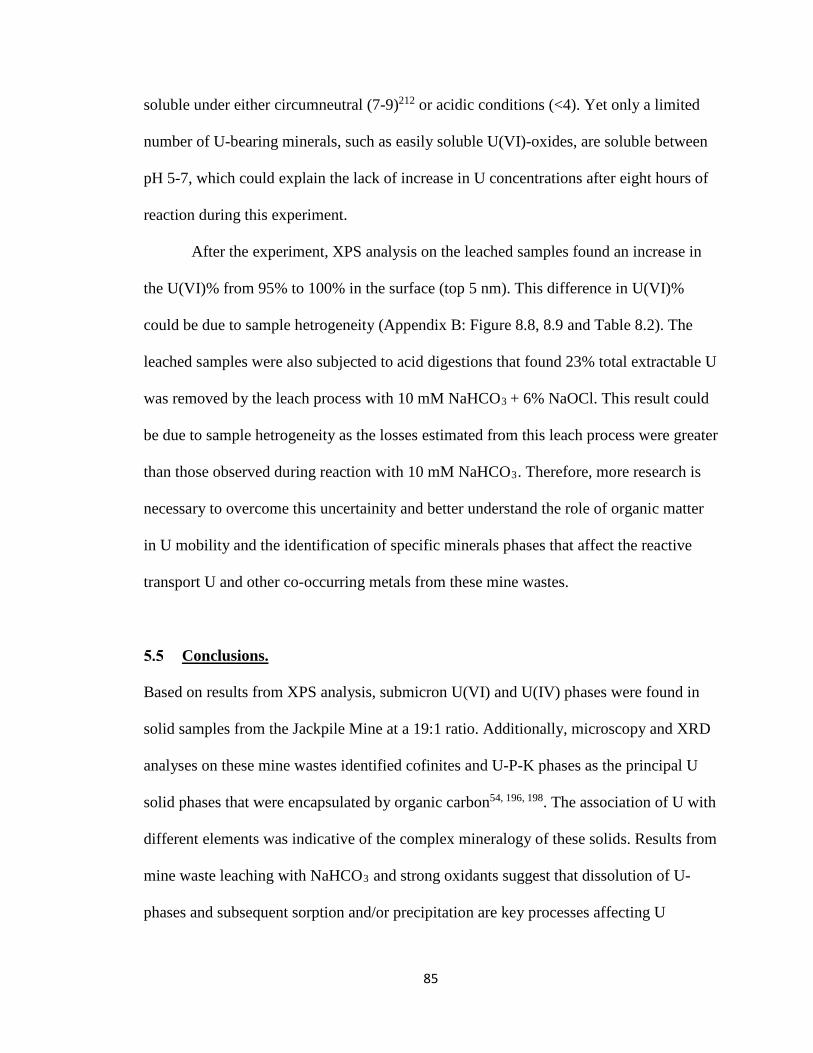
85
soluble under either circumneutral (7-9)212 or acidic conditions (<4). Yet only a limited
number of U-bearing minerals, such as easily soluble U(VI)-oxides, are soluble between
pH 5-7, which could explain the lack of increase in U concentrations after eight hours of
reaction during this experiment.
After the experiment, XPS analysis on the leached samples found an increase in
the U(VI)% from 95% to 100% in the surface (top 5 nm). This difference in U(VI)%
could be due to sample hetrogeneity (Appendix B: Figure 8.8, 8.9 and Table 8.2). The
leached samples were also subjected to acid digestions that found 23% total extractable U
was removed by the leach process with 10 mM NaHCO3 + 6% NaOCl. This result could
be due to sample hetrogeneity as the losses estimated from this leach process were greater
than those observed during reaction with 10 mM NaHCO3. Therefore, more research is
necessary to overcome this uncertainity and better understand the role of organic matter
in U mobility and the identification of specific minerals phases that affect the reactive
transport U and other co-occurring metals from these mine wastes.
Conclusions.
Based on results from XPS analysis, submicron U(VI) and U(IV) phases were found in
solid samples from the Jackpile Mine at a 19:1 ratio. Additionally, microscopy and XRD
analyses on these mine wastes identified cofinites and U-P-K phases as the principal U
solid phases that were encapsulated by organic carbon54, 196, 198. The association of U with
different elements was indicative of the complex mineralogy of these solids. Results from
mine waste leaching with NaHCO3 and strong oxidants suggest that dissolution of U-
phases and subsequent sorption and/or precipitation are key processes affecting U
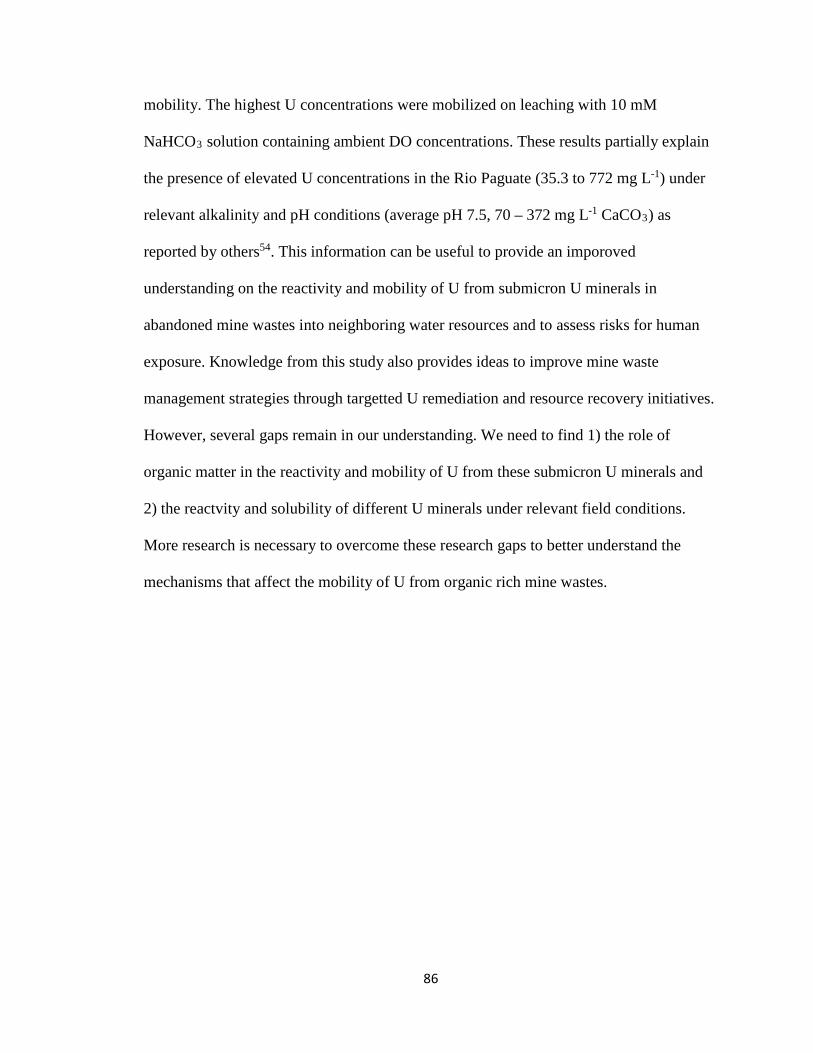
86
mobility. The highest U concentrations were mobilized on leaching with 10 mM
NaHCO3 solution containing ambient DO concentrations. These results partially explain
the presence of elevated U concentrations in the Rio Paguate (35.3 to 772 mg L-1) under
relevant alkalinity and pH conditions (average pH 7.5, 70 – 372 mg L-1 CaCO3) as
reported by others54. This information can be useful to provide an imporoved
understanding on the reactivity and mobility of U from submicron U minerals in
abandoned mine wastes into neighboring water resources and to assess risks for human
exposure. Knowledge from this study also provides ideas to improve mine waste
management strategies through targetted U remediation and resource recovery initiatives.
However, several gaps remain in our understanding. We need to find 1) the role of
organic matter in the reactivity and mobility of U from these submicron U minerals and
2) the reactvity and solubility of different U minerals under relevant field conditions.
More research is necessary to overcome these research gaps to better understand the
mechanisms that affect the mobility of U from organic rich mine wastes.
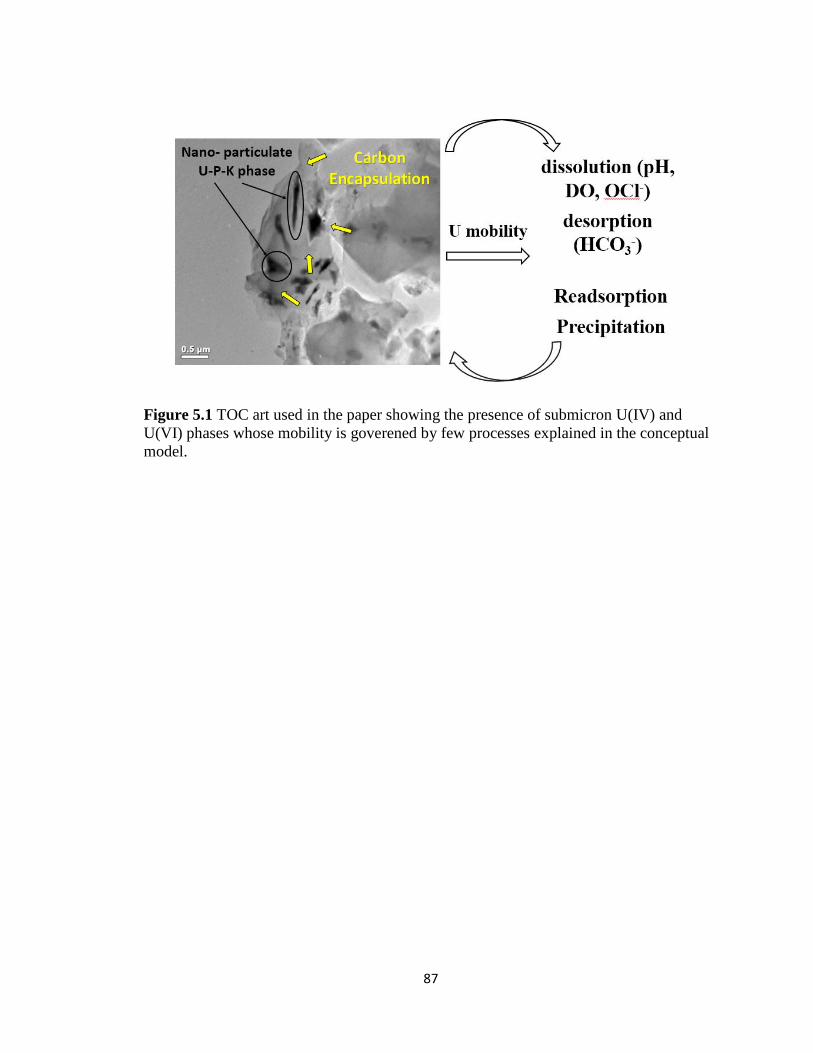
87
Figure 5.1 TOC art used in the paper showing the presence of submicron U(IV) and U(VI) phases whose mobility is goverened by few processes explained in the conceptual model.
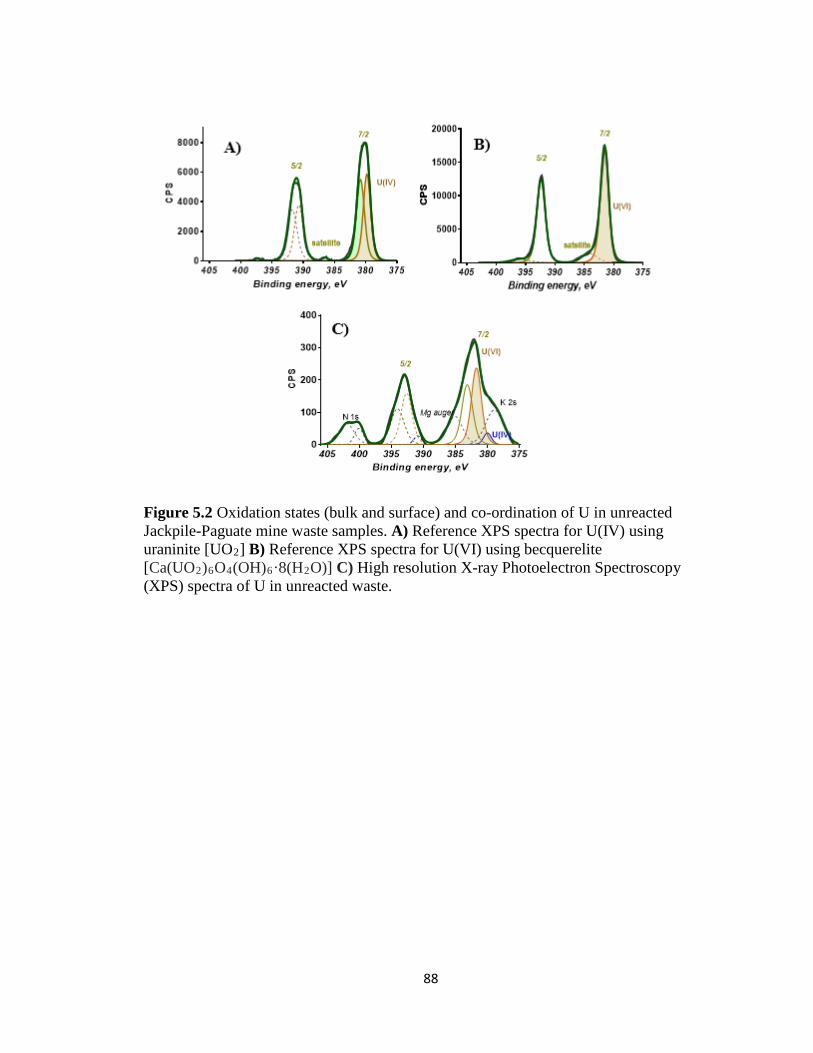
88
Figure 5.2 Oxidation states (bulk and surface) and co-ordination of U in unreacted Jackpile-Paguate mine waste samples. A) Reference XPS spectra for U(IV) using uraninite [UO2] B) Reference XPS spectra for U(VI) using becquerelite [Ca(UO2)6O4(OH)6·8(H2O)] C) High resolution X-ray Photoelectron Spectroscopy (XPS) spectra of U in unreacted waste.

89
Figure 5.3 Electron Microprobe (EM) analysis of the Jackpile-Paguate mine waste sediments. A) BSE image (leftmost) showing the presence of submicron U-phases encapsulated by carbon where, the mapping was performed. B) Electron Microprobe (EM) BSE image of a polished sample showing rock fragments with surface aggregates of U-P-K (red arrow). C) Energy Dispersive Spectrum (EDS) confirming the presence of a U-P-K phase showing distinct U, P and K peaks (red circle). D) Calcium map E) Uranium map F) Phosphorous map G) pottasium map H) Carbon map. Green, yellow, pink and white represent high concentrations of elements and dark blue represents lower concentrations of elements.
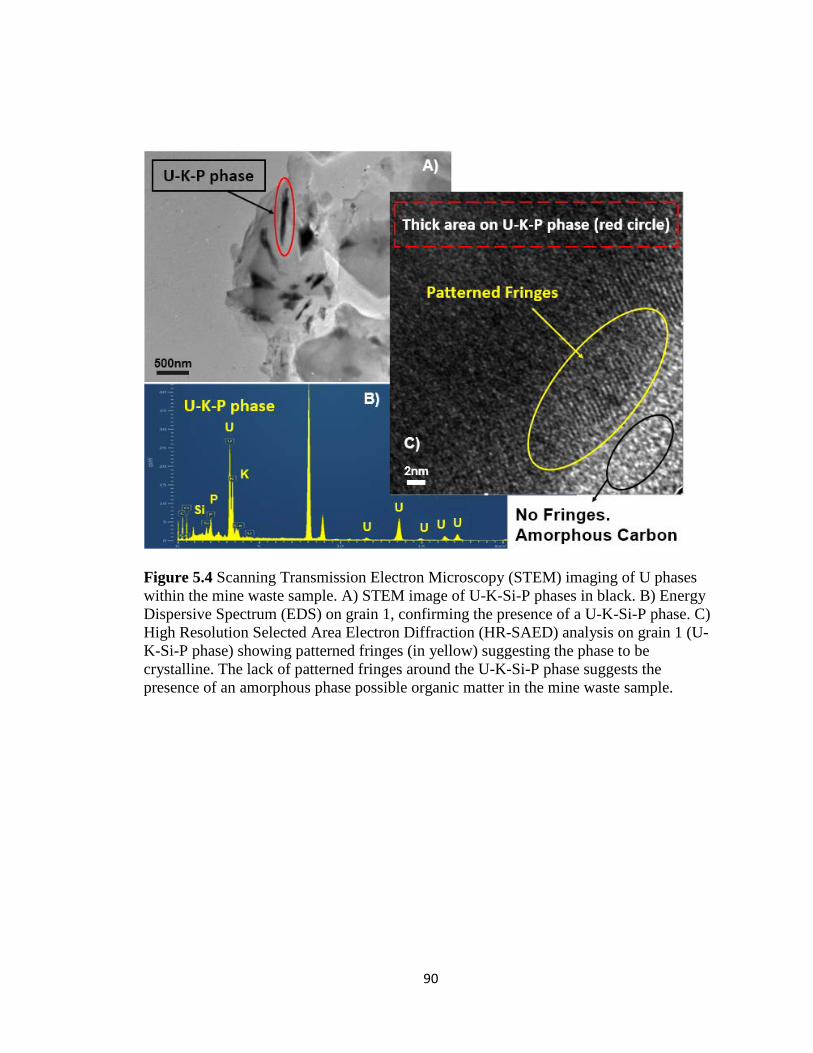
90
Figure 5.4 Scanning Transmission Electron Microscopy (STEM) imaging of U phases within the mine waste sample. A) STEM image of U-K-Si-P phases in black. B) Energy Dispersive Spectrum (EDS) on grain 1, confirming the presence of a U-K-Si-P phase. C) High Resolution Selected Area Electron Diffraction (HR-SAED) analysis on grain 1 (U-K-Si-P phase) showing patterned fringes (in yellow) suggesting the phase to be crystalline. The lack of patterned fringes around the U-K-Si-P phase suggests the presence of an amorphous phase possible organic matter in the mine waste sample.
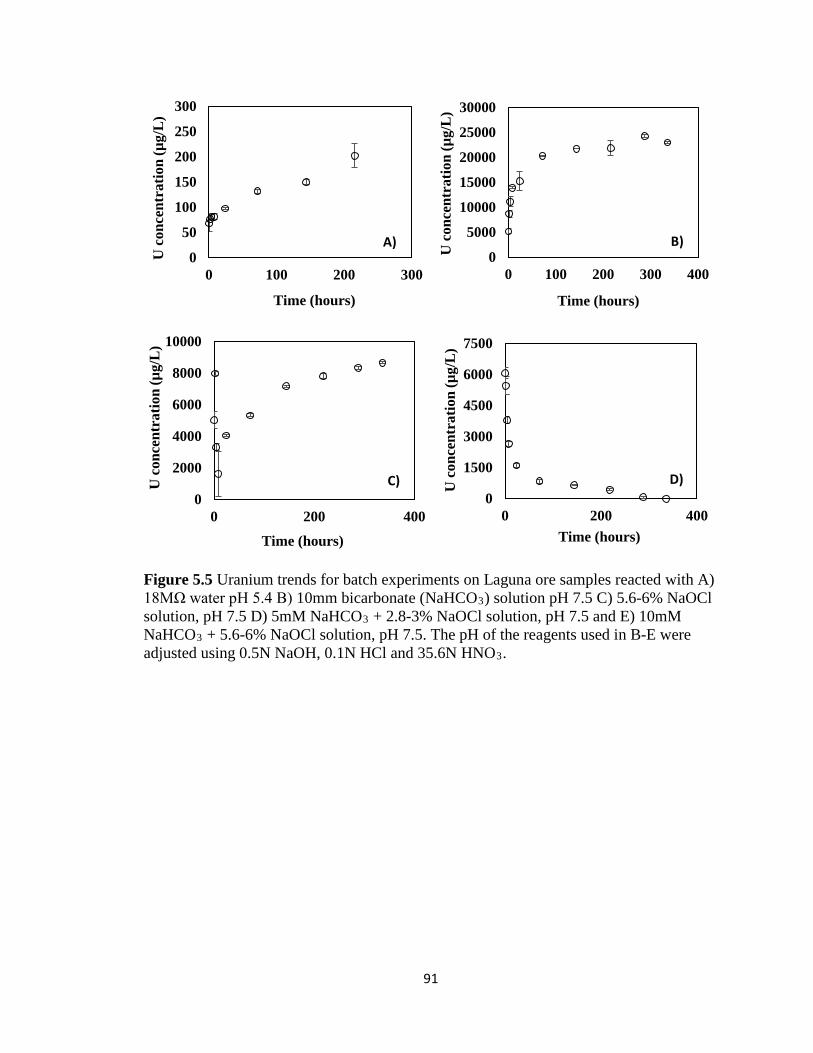
91
Figure 5.5 Uranium trends for batch experiments on Laguna ore samples reacted with A) 18MΩ water pH 5.4 B) 10mm bicarbonate (NaHCO3) solution pH 7.5 C) 5.6-6% NaOCl solution, pH 7.5 D) 5mM NaHCO3 + 2.8-3% NaOCl solution, pH 7.5 and E) 10mM NaHCO3 + 5.6-6% NaOCl solution, pH 7.5. The pH of the reagents used in B-E were adjusted using 0.5N NaOH, 0.1N HCl and 35.6N HNO3.
0
50
100
150
200
250
300
0 100 200 300
U c
once
ntra
tion
(µg/
L)
Time (hours)
A)0
5000
10000
15000
20000
25000
30000
0 100 200 300 400
U c
once
ntra
tion
(µg/
L)
Time (hours)
B)
0
2000
4000
6000
8000
10000
0 200 400
U c
once
ntra
tion
(µg/
L)
Time (hours)
C)0
1500
3000
4500
6000
7500
0 200 400
U c
once
ntra
tion
(µg/
L)
Time (hours)
D)
92
Conclusion.
This dissertation contributes a better understanding of processes affecting the transport of
U and V from abandoned mine wastes collected from the Blue Gap/Tachee Claim-28
mine, AZ and Jackpile-Paguate mine, Laguna, NM. Chapter 3 reports on how the Blue
Gap/Tachee Claim-28 mine wastes were sequentially reacted in flow-through columns at
pH 7.9 (10 mM NaHCO3) and pH 3.4 (10 mM CH3COOH) to evaluate the effect of
environmentally relevant conditions encountered at Blue Gap/Tachee on the release of U
and V. The reaction rate constants (km) for the dissolution of uranyl-vanadate (U-V)
minerals predominant at Blue Gap/Tachee were obtained from simulations with the
reactive transport software, PFLOTRAN. The estimated reaction rate constants were
within one order of magnitude for pH 7.9 (km = 4.8x10⁻¹³ mol cm-2 sec-1) and pH 3.4 (km
= 3.2x10⁻¹³ mol cm-2 sec-1). However, the estimated equilibrium constants (Keq) for U-V
bearing minerals were more than six orders of magnitude different for reaction at
circumneutral pH (Keq = 10-38.65) compared to acidic pH (Keq = 10-44.81). These results
coupled with electron microscopy data suggest that the release of U and V is affected by
water pH and the crystalline structure of U-V bearing minerals.
Chapter 4 describes the crystal chemistry of U-V bearing minerals occurring in
the Blue Gap/Tachee mine wastes that was investigated using various spectroscopy,
electron microscopy and diffraction techniques. The diffraction lines in the X-ray
diffractogram of these U-V bearing minerals showed agreement with most peaks of the
synthetic carnotite from literature. The C in the U-V bearing mineral phase was found to
co-occur as an organic carbon inclusion based on results from the bright field
93
transmission electron microscopy (BFTEM) imaging, energy filter transmission electron
microscopy (EFTEM), and electron energy loss spectroscopy (EELS). Quantitative
electron microprobe analysis suggested the elemental composition of U-V bearing
minerals was at a K:U:V ratio of 1:2:2.1 with an empirical stoichiometry similar to that of
the anhydrous carnotite that differ in d-spacing. Discrepancies between measured (U-V
bearing minerals) and calculated (anhydrous carnotite) diffraction ring patterns can be
attributed to differences in the degree of hydration, suggesting the U-V bearing minerals
were hydrated crystalline carnotite. Results from this investigation provide an improved
understanding on the crystal chemistry of naturally occurring U-V bearing minerals in
abandoned mine wastes.
Chapter 5 documents the mobility of U from submicron U(IV) and U(VI) mineral
phases in the Jackpile-Paguate mine wastes under oxidizing conditions that was
investigated by integrating laboratory experiments, spectroscopy, microscopy, and
diffraction techniques. Submicron U(VI) and U(IV) phases were found to co-occur at the
mine waste surfaces at a 19:1 ratio, based on results from XPS. Additionally, microscopy
and XRD analyses on these mine wastes identified these U-minerals to occur
predominantly as coffinites and U-P-K phases that were encapsulated by organic carbon.
Results from mine waste reactions with 10 mM NaHCO3 mobilized the highest U
concentrations under ambient DO concentrations. The results from this study provide
relevant information about how the reactivity of submicron U-bearing mine wastes in the
Jackpile-Paguate Mine can affect U mobility. For instance, elevated U concentrations
(35.3 to 772 mg L-1) have been measured at alkalinity and pH conditions (average pH
7.5, 70 – 372 mg L-1 CaCO3) in the Rio Paguate just across the Jackpile-Paguate Mine.20
94
The pH and alkalinity conditions selected for the experiments conducted in Chapter 5 are
relevant to the Rio Paguate. This information provides insights about the reactivity of U-
micro particles in abandoned mine wastes into neighboring water resources to assess risks
for human exposure.
Contribution of this Dissertation to the Body of Knowledge.
The work presented in this dissertation provides the following contributions to the body
of knowledge:
• Dissolution of the U-V bearing mineral is a relevant mechanism that affects the
reactive transport of U and V from the Blue Gap/Tachee Claim-28 abandoned U
mine. (Chapter 3).
• The U-V bearing minerals in the Blue Gap/Tachee mine wastes were identified as
hydrated carnotites that contain carbon inclusions. (Chapter 4).
• The presence of submicron U(VI) and U(VI) phases was identfied in the organic
rich sediments of the Jackpile-Paguate mine. The presence U-P-K bearing and
coffinite were also identified in these mine wastes. (Chapter 5).
• The highest U release was observed during batch reactions with 10 mM NaHCO3
solution containing ambient dissolved oxygen concentrations. (Chapter 5).
This dissertation offers an improved understanding on the role of thermodynamics,
crystallinity, stoichiometry, and solution chemistry on the reactive transport of U and V
from mine waste sites that pose as a threat to neighboring surface and ground water
quality. This knowledge is important for the development of risk assessment and
remediation strategies that benefit the communities proximate to such sites. Additionally,
outcomes this work have relevant implications for resource recovery.

95
Additional Materials and Methods.
Acid digestions were conducted to assess the total acid extractable metal concentrations
between unreacted and reacted mine wastes. For unreacted mine waste 3 mL of
hydrochloric acid (HCl), 3 mL of nitric acid (HNO3-) and 3 mL of hydrofluoric acid (HF)
were added into 50 mL Teflon digestion tubes containing 1 ± 0.002 g of mine waste
sample. Similarly for reacted mine waste (collected after reaction with CH3COOH) 1 mL
of each reagent (HCl, HF and HNO3-) was added to 50 mL Teflon digestion tubes
containing 0.1 ± 0.002 g of mine waste sample. All reagents are of Ultra High Purity
(UHP) grade. The digestion tubes were then heated using a Digi prep MS SCP Science
block digester at 95°C for 2 h, followed by dilution of acid extracts from reacted and
unreacted mine waste to 50 (unreacted) and 25 (reacted) mL using 2% HNO3. The
diluted samples are then filtered using 0.45 μm filters to remove any suspended or
undissolved solids before analysis.
Acid extracts and aliquots from column experiments were analyzed for elemental
concentrations using a PerkinElmer Optima 5300DV ICP-OES. Trace metals below the
detection limit of ICP-OES were measured using PerkinElmer NexION 300D (Dynamic
Reaction Cell) Inductively Coupled Plasma-Mass Spectrometer (ICP-MS). Both ICPs are
calibrated with calibration standards and QA/QC measures are taken to ensure quality
data.

96
A TEM analysis was conducted on mine waste samples to identify the crystallinity of
various U-V bearing minerals using a Selected Area Electron Diffraction technique
(SAED). A JEOL 2010 High Resolution Transmission Electron Microscope (HR-TEM)
fitted with a GATAN Orius high speed CCD camera and an Oxford INCA system with
an ultra-thin window Energy Dispersive Spectroscopy (EDS) detector was used in sample
analysis. Drops of unaltered sediments suspended in acetone were dropped onto standard
holey carbon film-covered Cu TEM grids using a pipette. Acetone was allowed to
evaporate in air and then the dry samples were loaded onto a Gatan cryotransfer holder to
observe frozen hydrated specimens for cryo-electron microscopy. Before loading the
grid, zeolite crystals inside the cryotransfer holders were allowed to dry overnight using a
vacuum pump to avoid cooling obstruction due to frozen water inside the holder. The dry
and loaded cryotransfer holders were then loaded into the HR-TEM and allowed to reach
a temperature of -180oC using liquid nitrogen before the analysis. The INCA EDS
detector was used to determine the elemental composition of the specific targeted crystal.
After identification, SAED analysis was performed on the identified crystals to observe
their crystallinity.
A polished section of the mine waste sample was mapped for elemental distribution using
the µ-SXRF beam line (BL) 10-2 at the Stanford Synchrotron Radiation Light Source
(SSRL). The maps were collected using a Si (111) phi, 90 double crystal monochromator
at a 50 µm resolution upto 17200 eV X-ray energies, just above the U LIII edge. All data
processing was conducted using the Microanalysis Toolkit software program.
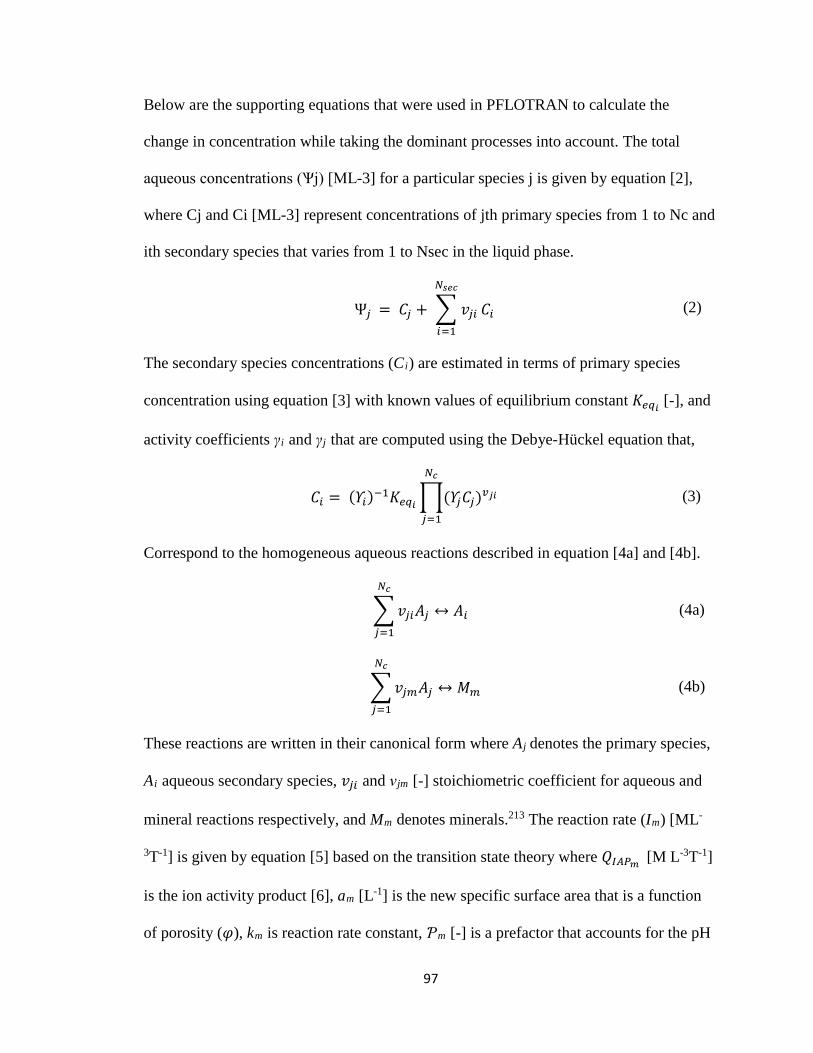
97
Below are the supporting equations that were used in PFLOTRAN to calculate the
change in concentration while taking the dominant processes into account. The total
aqueous concentrations (Ѱj) [ML-3] for a particular species j is given by equation [2],
where Cj and Ci [ML-3] represent concentrations of jth primary species from 1 to Nc and
ith secondary species that varies from 1 to Nsec in the liquid phase.
Ѱ𝑗𝑗 = 𝐶𝐶𝑗𝑗 + 𝑣𝑣𝑗𝑗𝑗𝑗
𝑁𝑁𝑠𝑠𝑠𝑠𝑠𝑠
𝑗𝑗=1
𝐶𝐶𝑗𝑗 (2)
The secondary species concentrations (Ci) are estimated in terms of primary species
concentration using equation [3] with known values of equilibrium constant 𝐾𝐾𝑒𝑒𝑒𝑒𝑖𝑖 [-], and
activity coefficients γi and γj that are computed using the Debye-Hückel equation that,
𝐶𝐶𝑗𝑗 = (𝛶𝛶𝑗𝑗)−1𝐾𝐾𝑒𝑒𝑒𝑒𝑖𝑖(𝛶𝛶𝑗𝑗𝐶𝐶𝑗𝑗)𝑣𝑣𝑗𝑗𝑖𝑖𝑁𝑁𝑠𝑠
𝑗𝑗=1
(3)
Correspond to the homogeneous aqueous reactions described in equation [4a] and [4b].
𝑣𝑣𝑗𝑗𝑗𝑗𝐴𝐴𝑗𝑗
𝑁𝑁𝑠𝑠
𝑗𝑗=1
↔ 𝐴𝐴𝑗𝑗 (4a)
𝑣𝑣𝑗𝑗𝑗𝑗𝐴𝐴𝑗𝑗
𝑁𝑁𝑠𝑠
𝑗𝑗=1
↔ 𝑀𝑀𝑗𝑗 (4b)
These reactions are written in their canonical form where Aj denotes the primary species,
Ai aqueous secondary species, 𝑣𝑣𝑗𝑗𝑗𝑗 and νjm [-] stoichiometric coefficient for aqueous and
mineral reactions respectively, and Mm denotes minerals.213 The reaction rate (Im) [ML-
3T-1] is given by equation [5] based on the transition state theory where 𝑄𝑄𝐼𝐼𝐼𝐼𝐼𝐼𝑚𝑚 [M L-3T-1]
is the ion activity product [6], am [L-1] is the new specific surface area that is a function
of porosity (𝜑𝜑), km is reaction rate constant, Ƥm [-] is a prefactor that accounts for the pH

98
dependence and ζm [-] is a factor whose value is 0 or 1 depending if 𝐾𝐾𝑒𝑒𝑒𝑒𝑚𝑚𝑄𝑄𝐼𝐼𝐼𝐼𝐼𝐼𝑚𝑚 ≤ 1and
𝜑𝜑Rm= 0 or 𝐾𝐾𝑒𝑒𝑒𝑒𝑚𝑚𝑄𝑄𝐼𝐼𝐼𝐼𝐼𝐼𝑚𝑚 > 1 and nm [-] is fitting parameter.214 Water-rock reactions typically
follow a non-linear rate law that is sensitive to this fitting parameter ‘nm’ in PFLOTRAN.
214, 215 216
𝐼𝐼𝑗𝑗 = −𝑘𝑘𝑗𝑗 𝑎𝑎𝑗𝑗 Ƥ𝑗𝑗 1 − (𝐾𝐾𝑒𝑒𝑒𝑒𝑚𝑚 𝑄𝑄𝐼𝐼𝐼𝐼𝐼𝐼𝑚𝑚 )𝑛𝑛𝑚𝑚𝜁𝜁𝑗𝑗 (5)
𝑄𝑄𝑗𝑗 = (𝛾𝛾𝑘𝑘𝑙𝑙𝐶𝐶𝑘𝑘𝑙𝑙 )𝑣𝑣𝑘𝑘𝑚𝑚
𝑁𝑁𝑠𝑠
𝑘𝑘=1
(6)
The sign convention used in PFLOTRAN is that if the rate is positive the mineral is
precipitating and if it is negative the mineral is dissolving. The change in the material
properties like porosity 𝜑𝜑 and surface area am due to mineral precipitation and dissolution
reactions are accounted through equations [7] and [8], where, 𝜑𝜑𝑗𝑗 [-], 𝜙𝜙𝑗𝑗 [-], 𝜙𝜙𝑗𝑗0 [-] and
amo [L-1] denote porosity of the mth mineral, volume fraction of the mth mineral, initial
volume fraction of the mth mineral and initial mineral specific surface area.
𝜑𝜑 = 1 − 𝜑𝜑𝑗𝑗𝑗𝑗
(7)
𝑎𝑎𝑗𝑗 = 𝑎𝑎𝑗𝑗0 (
𝜙𝜙𝑗𝑗𝜙𝜙𝑗𝑗0
)𝑛𝑛𝑚𝑚 (8)
The porosity, 𝜑𝜑 = 0.25, of the Blue Gap/Tachee mine waste sediments were estimated
using equation [9] where the bulk density (ρb = 1.65 gm cm-3 [ML-3]) and particle density
(ρp = 2.25 gm cm-3 [ML-3]) were acquired experimentally.
𝜑𝜑 = 1 −ρ𝑏𝑏ρ𝑝𝑝
(9)

99
However, other material properties like tortuosity (tau) and aqueous diffusion coefficient
[M2T-1] were assumed to be, tau = 1 and 10-9 m2 s-1 respectively. The assumption for
tortuosity was made for simplification purposes, while the assumption for aqueous
diffusion coefficient was made based on the diffusion coefficients of H+, CO32-, HCO3
2-,
Ca2UO2(CO3)30, CaUO2(CO3)3
2-, UO2(CO3)22- and Ca2+ that were all found to be
around 10-9 m2 s-1 at 25oC.217, 218 The dirichlet initial and boundary conditions were
imposed on the 1D reactive transport of metals over time during reaction with 10 mM
NaHCO3 and 10 mM CH3COOH. The initial surface area amo
(L-1) of U-V bearing
minerals in the mine waste sediments is calculated using equation [10] in cm2 cm-3. The
specific mineral surface area amo, [L-1] is defined as
𝑎𝑎𝑗𝑗0 =
𝐴𝐴𝑗𝑗𝑉𝑉
= 𝐴𝐴𝑗𝑗𝑉𝑉𝑗𝑗
𝑉𝑉𝑗𝑗𝑉𝑉
= 𝑎𝑎𝑗𝑗𝑣𝑣𝑗𝑗
𝜙𝜙𝑗𝑗 (10)
where 𝜙𝜙𝑗𝑗 = Vm/V and Vm are the volume fraction and volume of the mth mineral
contained in the REV of volume V, respectively, and am [L-1] and vm [L3] refer to the
area and volume of a single sphere of radius rm [L],
𝑎𝑎𝑗𝑗 = 4𝜋𝜋𝑟𝑟𝑗𝑗2 (11)
𝑣𝑣𝑗𝑗 =
43𝜋𝜋𝑟𝑟𝑗𝑗3
(12)
Thus the surface area 𝑎𝑎𝑗𝑗0 R [L-1] further simplifies to,
𝑎𝑎𝑗𝑗0 =
3𝑟𝑟𝑗𝑗
𝜙𝜙𝑗𝑗 (13)
The surface area of the U-V bearing mineral was estimated using equation [13] by
considering the average particle size of the mine waste used in batch (<63 µm) and
column (120-355 µm) based on the assumption that 1) all of the U-phases in the mine

100
waste are U-V bearing minerals and 2) the U-V bearing minerals area spherical in shape.
The assumptions were made based on prior knowledge on the Blue Gap/Tachee mine
site,1 where U-V bearing mineral was identified as the dominant U-phase in the mine
waste. The shape of the U-V bearing minerals was assumed to be spherical for
simplifying the calculations.
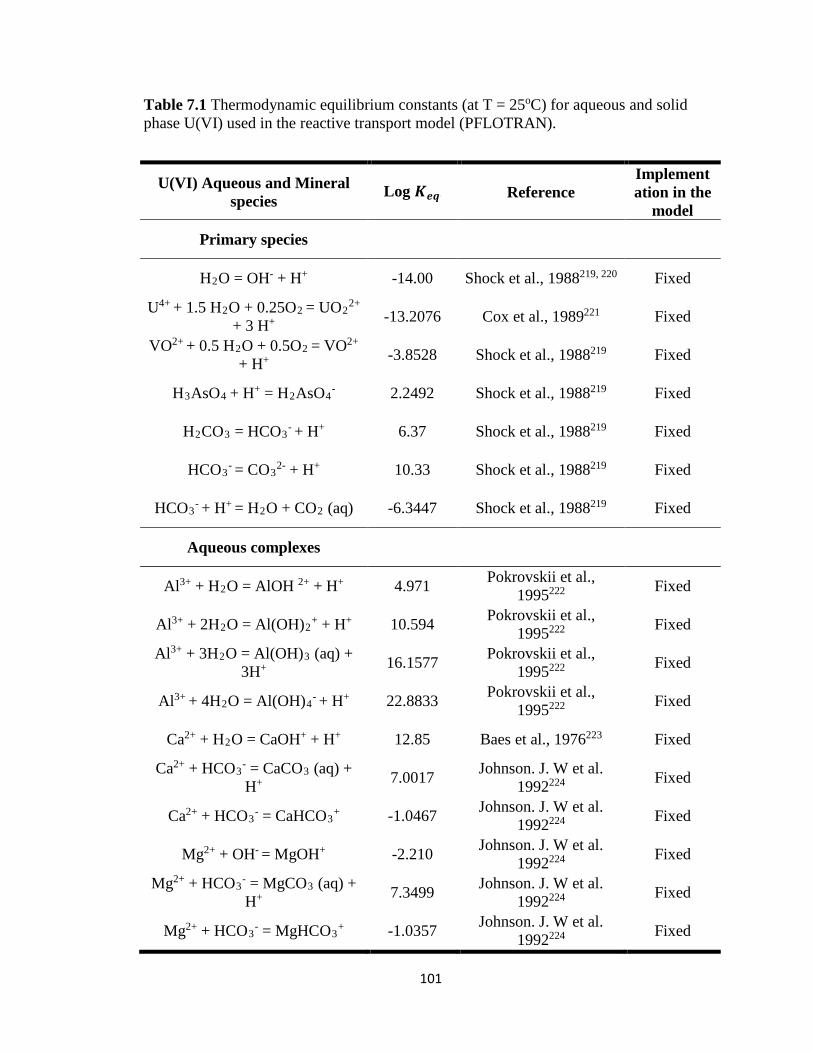
101
Table 7.1 Thermodynamic equilibrium constants (at T = 25oC) for aqueous and solid phase U(VI) used in the reactive transport model (PFLOTRAN).
U(VI) Aqueous and Mineral species Log 𝑲𝑲𝒆𝒆𝒆𝒆 R Reference
Implementation in the
model
Primary species
H2O = OH- + H+ -14.00 Shock et al., 1988219, 220 Fixed
U4+ + 1.5 H2O + 0.25O2 = UO2
2+ + 3 H+ -13.2076 Cox et al., 1989221 Fixed
VO2+ + 0.5 H2O + 0.5O2 = VO2+
+ H+ -3.8528 Shock et al., 1988219 Fixed
H3AsO4 + H+ = H2AsO4
- 2.2492 Shock et al., 1988219 Fixed
H2CO3 = HCO3- + H+ 6.37 Shock et al., 1988219 Fixed
HCO3- = CO3
2- + H+ 10.33 Shock et al., 1988219 Fixed
HCO3- + H+ = H2O + CO2 (aq) -6.3447 Shock et al., 1988219 Fixed
Aqueous complexes
Al3+ + H2O = AlOH 2+ + H+ 4.971 Pokrovskii et al., 1995222 Fixed
Al3+ + 2H2O = Al(OH)2+ + H+ 10.594 Pokrovskii et al.,
1995222 Fixed
Al3+ + 3H2O = Al(OH)3 (aq) + 3H+ 16.1577 Pokrovskii et al.,
1995222 Fixed
Al3+ + 4H2O = Al(OH)4- + H+ 22.8833 Pokrovskii et al.,
1995222 Fixed
Ca2+ + H2O = CaOH+ + H+ 12.85 Baes et al., 1976223 Fixed
Ca2+ + HCO3- = CaCO3 (aq) + H+ 7.0017 Johnson. J. W et al.
1992224 Fixed
Ca2+ + HCO3- = CaHCO3
+ -1.0467 Johnson. J. W et al. 1992224 Fixed
Mg2+ + OH- = MgOH+ -2.210 Johnson. J. W et al. 1992224 Fixed
Mg2+ + HCO3- = MgCO3 (aq) + H+ 7.3499 Johnson. J. W et al.
1992224 Fixed
Mg2+ + HCO3- = MgHCO3
+ -1.0357 Johnson. J. W et al. 1992224 Fixed
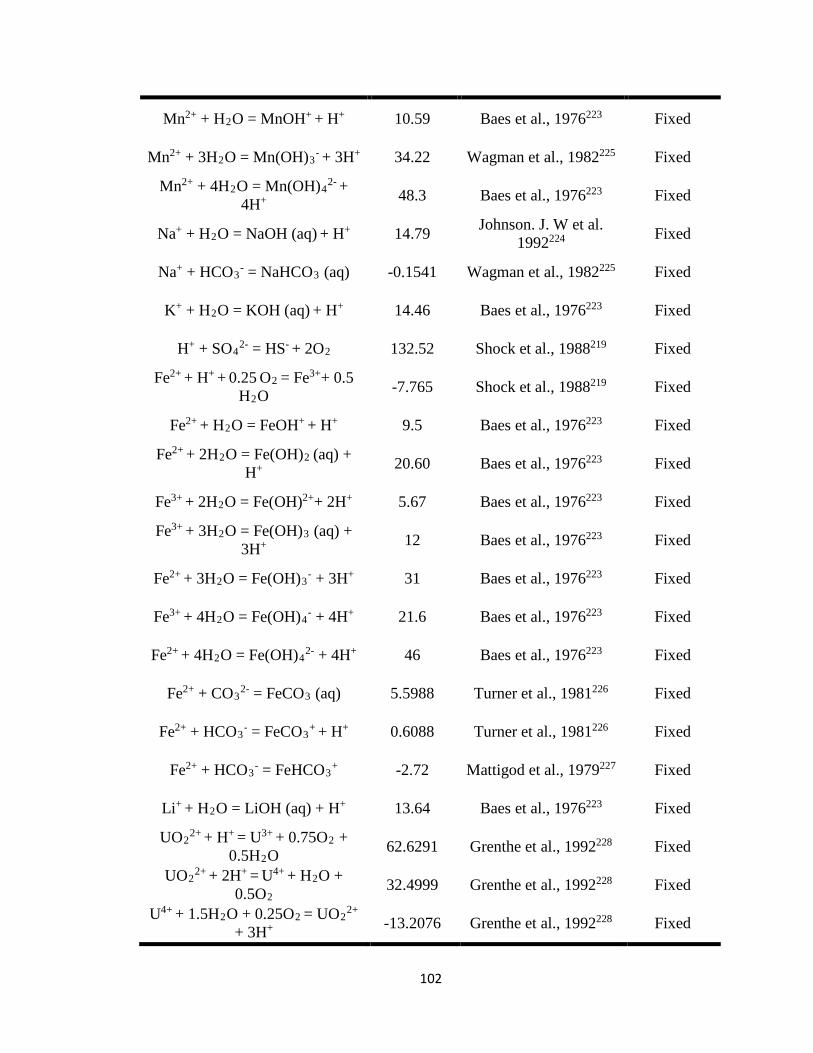
102
Mn2+ + H2O = MnOH+ + H+ 10.59 Baes et al., 1976223 Fixed
Mn2+ + 3H2O = Mn(OH)3- + 3H+ 34.22 Wagman et al., 1982225 Fixed
Mn2+ + 4H2O = Mn(OH)42- +
4H+ 48.3 Baes et al., 1976223 Fixed
Na+ + H2O = NaOH (aq) + H+ 14.79 Johnson. J. W et al. 1992224 Fixed
Na+ + HCO3- = NaHCO3 (aq) -0.1541 Wagman et al., 1982225 Fixed
K+ + H2O = KOH (aq) + H+ 14.46 Baes et al., 1976223 Fixed
H+ + SO42- = HS- + 2O2 132.52 Shock et al., 1988219 Fixed
Fe2+ + H+ + 0.25 O2 = Fe3++ 0.5 H2O -7.765 Shock et al., 1988219 Fixed
Fe2+ + H2O = FeOH+ + H+ 9.5 Baes et al., 1976223 Fixed
Fe2+ + 2H2O = Fe(OH)2 (aq) + H+ 20.60 Baes et al., 1976223 Fixed
Fe3+ + 2H2O = Fe(OH)2++ 2H+ 5.67 Baes et al., 1976223 Fixed
Fe3+ + 3H2O = Fe(OH)3 (aq) + 3H+ 12 Baes et al., 1976223 Fixed
Fe2+ + 3H2O = Fe(OH)3- + 3H+ 31 Baes et al., 1976223 Fixed
Fe3+ + 4H2O = Fe(OH)4- + 4H+ 21.6 Baes et al., 1976223 Fixed
Fe2+ + 4H2O = Fe(OH)42- + 4H+ 46 Baes et al., 1976223 Fixed
Fe2+ + CO32- = FeCO3 (aq) 5.5988 Turner et al., 1981226 Fixed
Fe2+ + HCO3- = FeCO3
+ + H+ 0.6088 Turner et al., 1981226 Fixed
Fe2+ + HCO3- = FeHCO3
+ -2.72 Mattigod et al., 1979227 Fixed
Li+ + H2O = LiOH (aq) + H+ 13.64 Baes et al., 1976223 Fixed
UO22+ + H+ = U3+ + 0.75O2 +
0.5H2O 62.6291 Grenthe et al., 1992228 Fixed
UO22+ + 2H+ = U4+ + H2O +
0.5O2 32.4999 Grenthe et al., 1992228 Fixed
U4+ + 1.5H2O + 0.25O2 = UO22+
+ 3H+ -13.2076 Grenthe et al., 1992228 Fixed
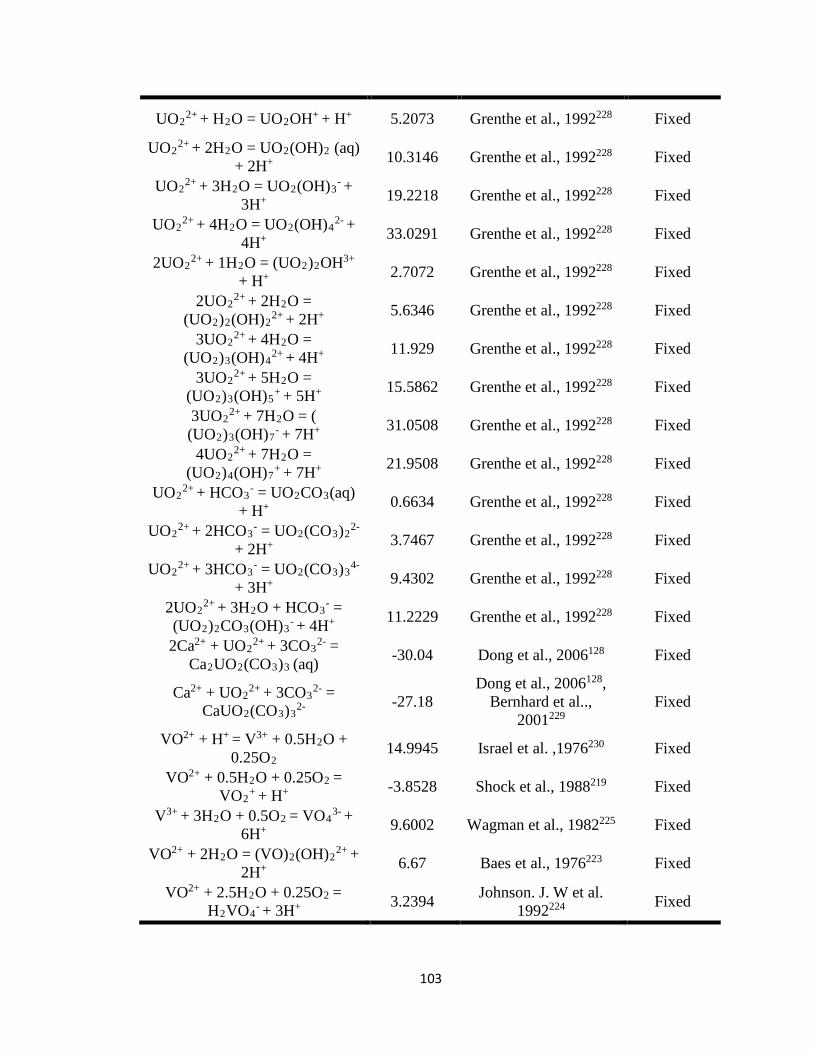
103
UO22+ + H2O = UO2OH+ + H+ 5.2073 Grenthe et al., 1992228 Fixed
UO22+ + 2H2O = UO2(OH)2 (aq)
+ 2H+ 10.3146 Grenthe et al., 1992228 Fixed
UO22+ + 3H2O = UO2(OH)3
- + 3H+ 19.2218 Grenthe et al., 1992228 Fixed
UO22+ + 4H2O = UO2(OH)4
2- + 4H+ 33.0291 Grenthe et al., 1992228 Fixed
2UO22+ + 1H2O = (UO2)2OH3+
+ H+ 2.7072 Grenthe et al., 1992228 Fixed
2UO22+ + 2H2O =
(UO2)2(OH)22+ + 2H+ 5.6346 Grenthe et al., 1992228 Fixed
3UO22+ + 4H2O =
(UO2)3(OH)42+ + 4H+ 11.929 Grenthe et al., 1992228 Fixed
3UO22+ + 5H2O =
(UO2)3(OH)5+ + 5H+ 15.5862 Grenthe et al., 1992228 Fixed
3UO22+ + 7H2O = (
(UO2)3(OH)7- + 7H+ 31.0508 Grenthe et al., 1992228 Fixed
4UO22+ + 7H2O =
(UO2)4(OH)7+ + 7H+ 21.9508 Grenthe et al., 1992228 Fixed
UO22+ + HCO3
- = UO2CO3(aq) + H+ 0.6634 Grenthe et al., 1992228 Fixed
UO22+ + 2HCO3
- = UO2(CO3)22-
+ 2H+ 3.7467 Grenthe et al., 1992228 Fixed
UO22+ + 3HCO3
- = UO2(CO3)34-
+ 3H+ 9.4302 Grenthe et al., 1992228 Fixed
2UO22+ + 3H2O + HCO3
- = (UO2)2CO3(OH)3
- + 4H+ 11.2229 Grenthe et al., 1992228 Fixed
2Ca2+ + UO22+ + 3CO3
2- = Ca2UO2(CO3)3 (aq) -30.04 Dong et al., 2006128 Fixed
Ca2+ + UO22+ + 3CO3
2- = CaUO2(CO3)3
2- -27.18 Dong et al., 2006128,
Bernhard et al.., 2001229
Fixed
VO2+ + H+ = V3+ + 0.5H2O + 0.25O2 14.9945 Israel et al. ,1976230 Fixed
VO2+ + 0.5H2O + 0.25O2 = VO2
+ + H+
-3.8528 Shock et al., 1988219 Fixed
V3+ + 3H2O + 0.5O2 = VO43- +
6H+ 9.6002 Wagman et al., 1982225 Fixed
VO2+ + 2H2O = (VO)2(OH)22+ +
2H+ 6.67 Baes et al., 1976223 Fixed
VO2+ + 2.5H2O + 0.25O2 = H2VO4
- + 3H+ 3.2394 Johnson. J. W et al. 1992224 Fixed

104
VO2+ + 2.5H2O + 0.25O2 = HVO4
2- + 4H+ 11.3024 Johnson. J. W et al. 1992224 Fixed
V3+ + H2O = VOH2+ + H+ 2.260 Baes et al., 1976223 Fixed
VO2+ + H2O = VOOH+ + H+ 5.67 Baes et al., 1976223 Fixed
VO43- + 2H+ = VO3OH2- -14.26 Baes et al., 1976223 Fixed
V3+ + 2H2O = V(OH)2+ + 2H+ 5.9193 Langmuir et al.,
1978150 Fixed
2V3+ + 2H2O = V2(OH)24+ + 2H+ 3.80 Baes et al., 1976223 Fixed
VO2+ + 2H2O = VO(OH)3 (aq) +
H+ 3.30 Baes et al., 1976223 Fixed
H2AsO4- + H+ = AsH3 (aq) +
2O2 149.3941 Sergeyeva et al., 1969231 Fixed
H2AsO4- = H2AsO3
- + 0.5O2 29.0857 Shock et al., 1988219 Fixed
H2AsO4- = AsO2
- + 3H2O + 0.5O2 29.0746 Grenthe et al., 1992228 Fixed
H2AsO3- + 4H+ = As(OH)3 (aq) -9.2048 Grenthe et al., 1992228 Fixed
Solid Mineral phases
Calcite CaCO3 + H+ = Ca2+ +HCO3
- 1.8487 Helgeson et al. 1978232 Fixed
Becquerelite Ca (UO2)6O4(OH)6. 8H2O +14H+ = 6UO2
2+ + Ca2+ + 18H2O
29.23 Casas et al., 1997233 Fixed
Quartz SiO2 = SiO2 (aq) -3.9993 Helgeson et al. 1978232 Fixed
Boehmite AlO2H + 3H+ = Al3+ + 2H2O 7.5642 Pokrovskii et al.,
1995222 Fixed
Diaspore AlHO2 + 3H+ = Al3+ + 2H2O 7.1603 Pokrovskii et al.,
1995222 Fixed
Gibbsite Al(OH)3 + 3H+ = Al3+ + 3H2O 7.756 Pokrovskii et al.,
1995222 Fixed
Hercynite FeAl2O4 + 8H+ = Fe2+ + 2Al3+ +
4H2O 28.8484 Robie et al. 1995234 Fixed
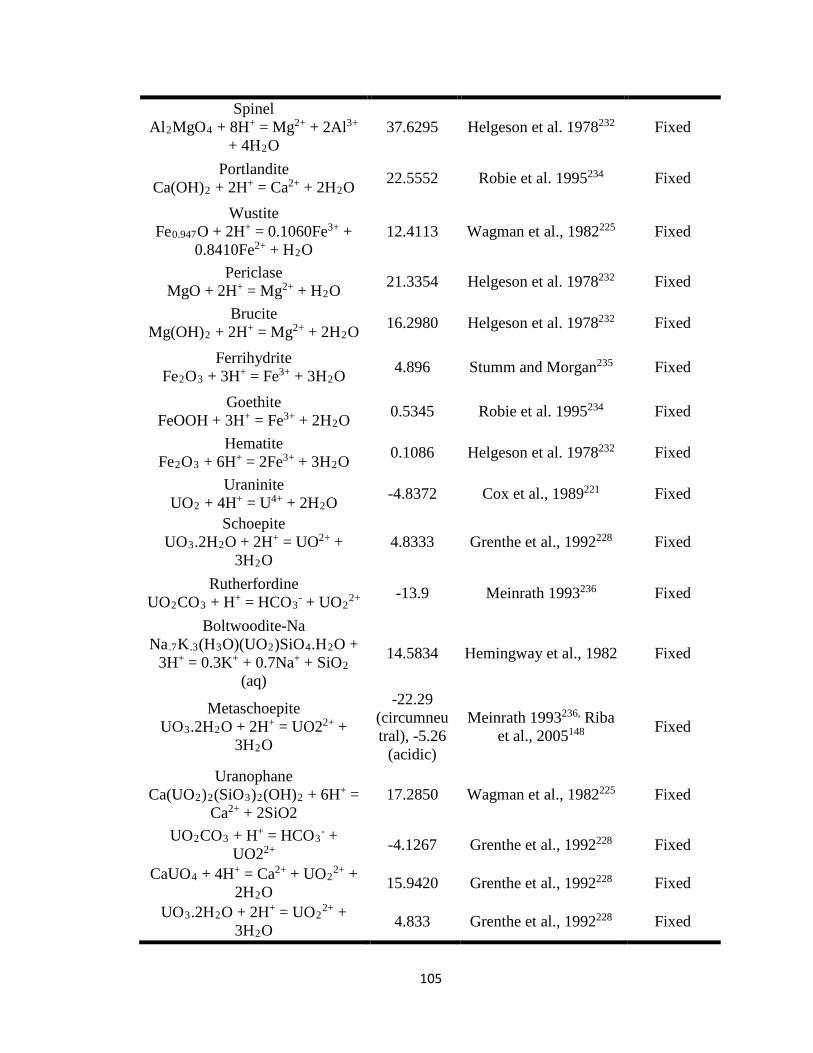
105
Spinel Al2MgO4 + 8H+ = Mg2+ + 2Al3+
+ 4H2O 37.6295 Helgeson et al. 1978232 Fixed
Portlandite Ca(OH)2 + 2H+ = Ca2+ + 2H2O 22.5552 Robie et al. 1995234 Fixed
Wustite Fe0.947O + 2H+ = 0.1060Fe3+ +
0.8410Fe2+ + H2O 12.4113 Wagman et al., 1982225 Fixed
Periclase MgO + 2H+ = Mg2+ + H2O 21.3354 Helgeson et al. 1978232 Fixed
Brucite Mg(OH)2 + 2H+ = Mg2+ + 2H2O 16.2980 Helgeson et al. 1978232 Fixed
Ferrihydrite Fe2O3 + 3H+ = Fe3+ + 3H2O 4.896 Stumm and Morgan235 Fixed
Goethite FeOOH + 3H+ = Fe3+ + 2H2O 0.5345 Robie et al. 1995234 Fixed
Hematite Fe2O3 + 6H+ = 2Fe3+ + 3H2O 0.1086 Helgeson et al. 1978232 Fixed
Uraninite UO2 + 4H+ = U4+ + 2H2O -4.8372 Cox et al., 1989221 Fixed
Schoepite UO3.2H2O + 2H+ = UO2+ +
3H2O 4.8333 Grenthe et al., 1992228 Fixed
Rutherfordine UO2CO3 + H+ = HCO3
- + UO22+ -13.9 Meinrath 1993236 Fixed
Boltwoodite-Na Na.7K.3(H3O)(UO2)SiO4.H2O +
3H+ = 0.3K+ + 0.7Na+ + SiO2 (aq)
14.5834 Hemingway et al., 1982 Fixed
Metaschoepite UO3.2H2O + 2H+ = UO22+ +
3H2O
-22.29 (circumneutral), -5.26
(acidic)
Meinrath 1993236, Riba et al., 2005148 Fixed
Uranophane Ca(UO2)2(SiO3)2(OH)2 + 6H+ =
Ca2+ + 2SiO2 17.2850 Wagman et al., 1982225 Fixed
UO2CO3 + H+ = HCO3- +
UO22+ -4.1267 Grenthe et al., 1992228 Fixed
CaUO4 + 4H+ = Ca2+ + UO22+ +
2H2O 15.9420 Grenthe et al., 1992228 Fixed
UO3.2H2O + 2H+ = UO22+ +
3H2O 4.833 Grenthe et al., 1992228 Fixed
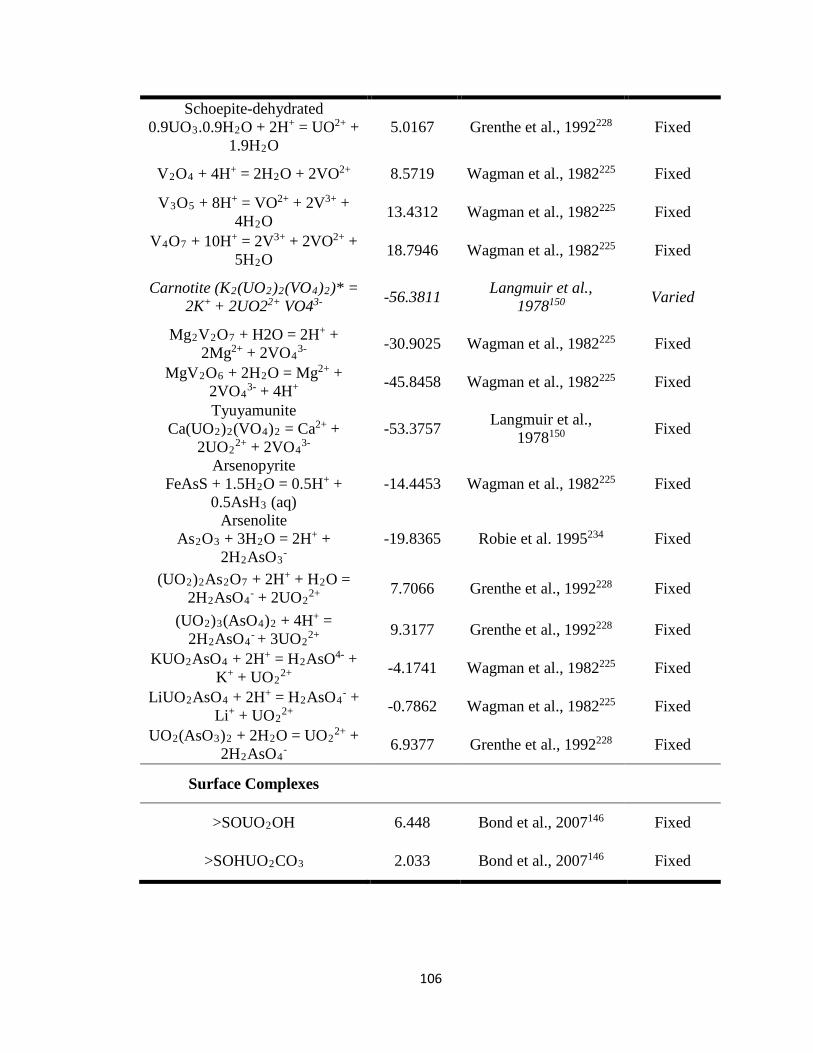
106
Schoepite-dehydrated 0.9UO3.0.9H2O + 2H+ = UO2+ +
1.9H2O 5.0167 Grenthe et al., 1992228 Fixed
V2O4 + 4H+ = 2H2O + 2VO2+ 8.5719 Wagman et al., 1982225 Fixed
V3O5 + 8H+ = VO2+ + 2V3+ + 4H2O 13.4312 Wagman et al., 1982225 Fixed
V4O7 + 10H+ = 2V3+ + 2VO2+ + 5H2O 18.7946 Wagman et al., 1982225 Fixed
Carnotite (K2(UO2)2(VO4)2)* = 2K+ + 2UO22+ VO43- -56.3811 Langmuir et al.,
1978150 Varied
Mg2V2O7 + H2O = 2H+ + 2Mg2+ + 2VO4
3- -30.9025 Wagman et al., 1982225 Fixed
MgV2O6 + 2H2O = Mg2+ + 2VO4
3- + 4H+ -45.8458 Wagman et al., 1982225 Fixed
Tyuyamunite Ca(UO2)2(VO4)2 = Ca2+ +
2UO22+ + 2VO4
3- -53.3757 Langmuir et al.,
1978150 Fixed
Arsenopyrite FeAsS + 1.5H2O = 0.5H+ +
0.5AsH3 (aq) -14.4453 Wagman et al., 1982225 Fixed
Arsenolite As2O3 + 3H2O = 2H+ +
2H2AsO3-
-19.8365 Robie et al. 1995234 Fixed
(UO2)2As2O7 + 2H+ + H2O = 2H2AsO4
- + 2UO22+ 7.7066 Grenthe et al., 1992228 Fixed
(UO2)3(AsO4)2 + 4H+ = 2H2AsO4
- + 3UO22+ 9.3177 Grenthe et al., 1992228 Fixed
KUO2AsO4 + 2H+ = H2AsO4- + K+ + UO2
2+
-4.1741 Wagman et al., 1982225 Fixed
LiUO2AsO4 + 2H+ = H2AsO4- +
Li+ + UO22+ -0.7862 Wagman et al., 1982225 Fixed
UO2(AsO3)2 + 2H2O = UO22+ +
2H2AsO4- 6.9377 Grenthe et al., 1992228 Fixed
Surface Complexes
>SOUO2OH 6.448 Bond et al., 2007146 Fixed
>SOHUO2CO3 2.033 Bond et al., 2007146 Fixed
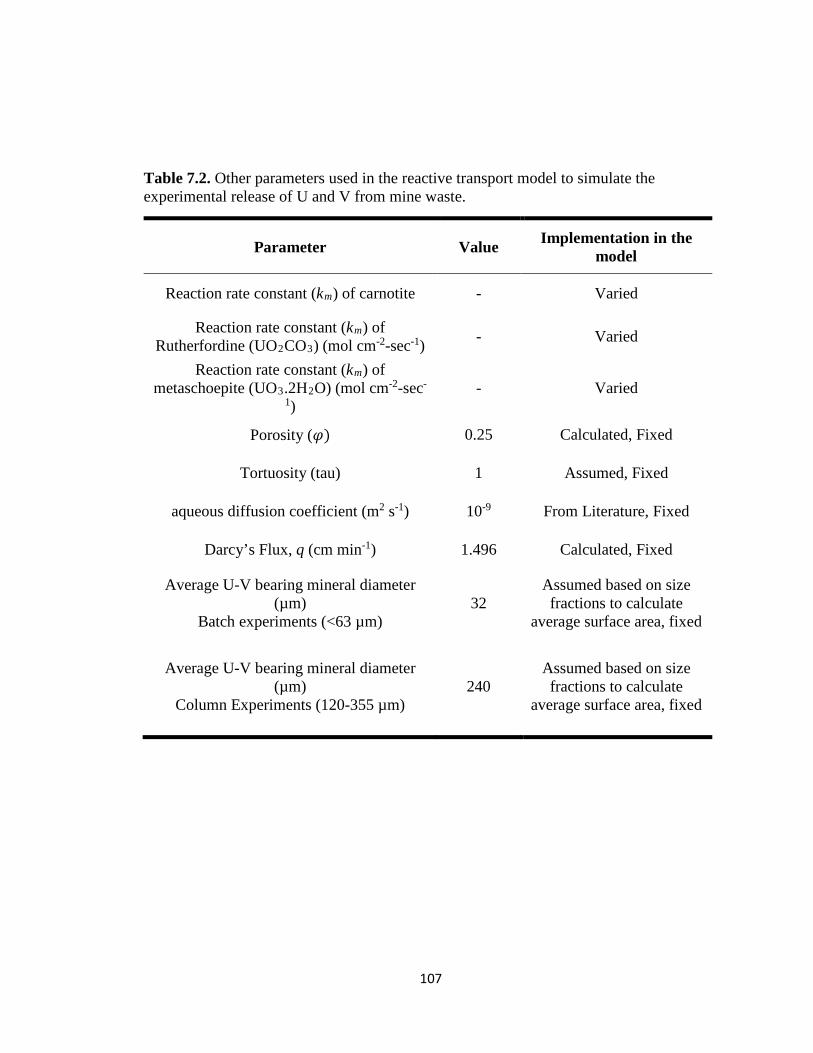
107
Table 7.2. Other parameters used in the reactive transport model to simulate the experimental release of U and V from mine waste.
Parameter Value Implementation in the model
Reaction rate constant (km) of carnotite - Varied
Reaction rate constant (km) of Rutherfordine (UO2CO3) (mol cm-2-sec-1) - Varied
Reaction rate constant (km) of metaschoepite (UO3.2H2O) (mol cm-2-sec-
1) - Varied
Porosity (𝜑𝜑) 0.25 Calculated, Fixed
Tortuosity (tau) 1 Assumed, Fixed
aqueous diffusion coefficient (m2 s-1) 10-9 From Literature, Fixed
Darcy’s Flux, q (cm min-1) 1.496 Calculated, Fixed
Average U-V bearing mineral diameter (µm)
Batch experiments (<63 µm) 32
Assumed based on size fractions to calculate
average surface area, fixed
Average U-V bearing mineral diameter (µm)
Column Experiments (120-355 µm) 240
Assumed based on size fractions to calculate
average surface area, fixed
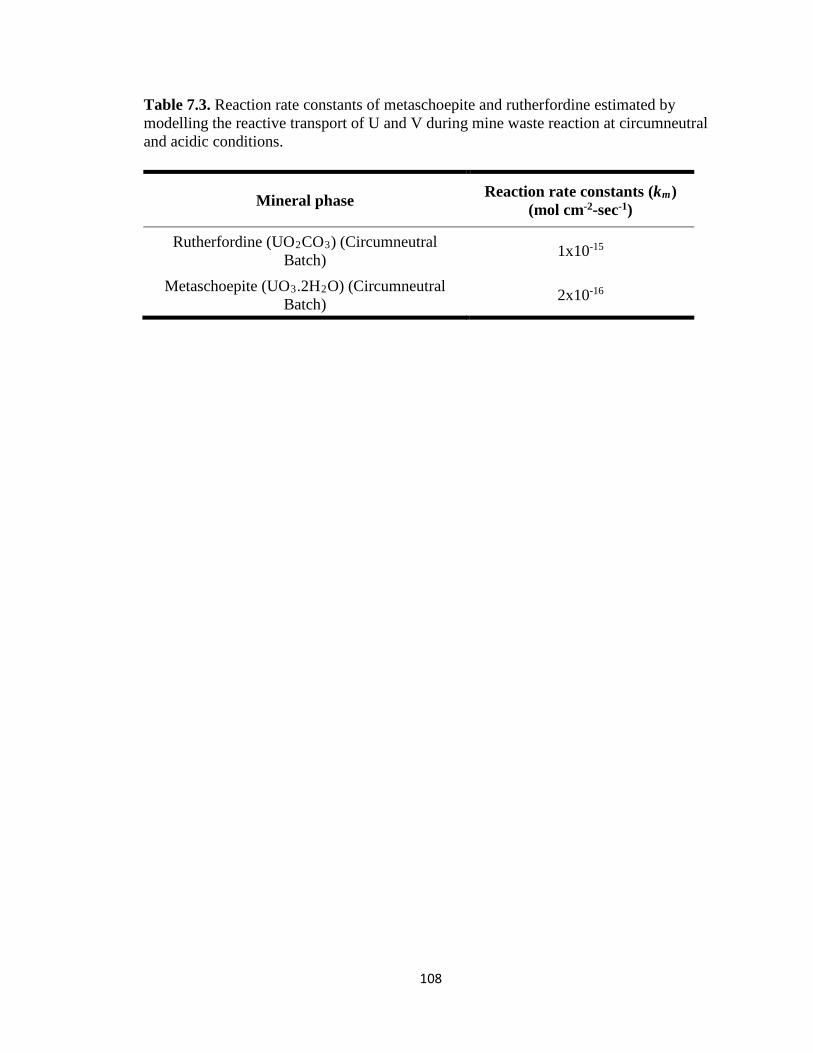
108
Table 7.3. Reaction rate constants of metaschoepite and rutherfordine estimated by modelling the reactive transport of U and V during mine waste reaction at circumneutral and acidic conditions.
Mineral phase Reaction rate constants (km) (mol cm-2-sec-1)
Rutherfordine (UO2CO3) (Circumneutral Batch) 1x10-15
Metaschoepite (UO3.2H2O) (Circumneutral Batch) 2x10-16
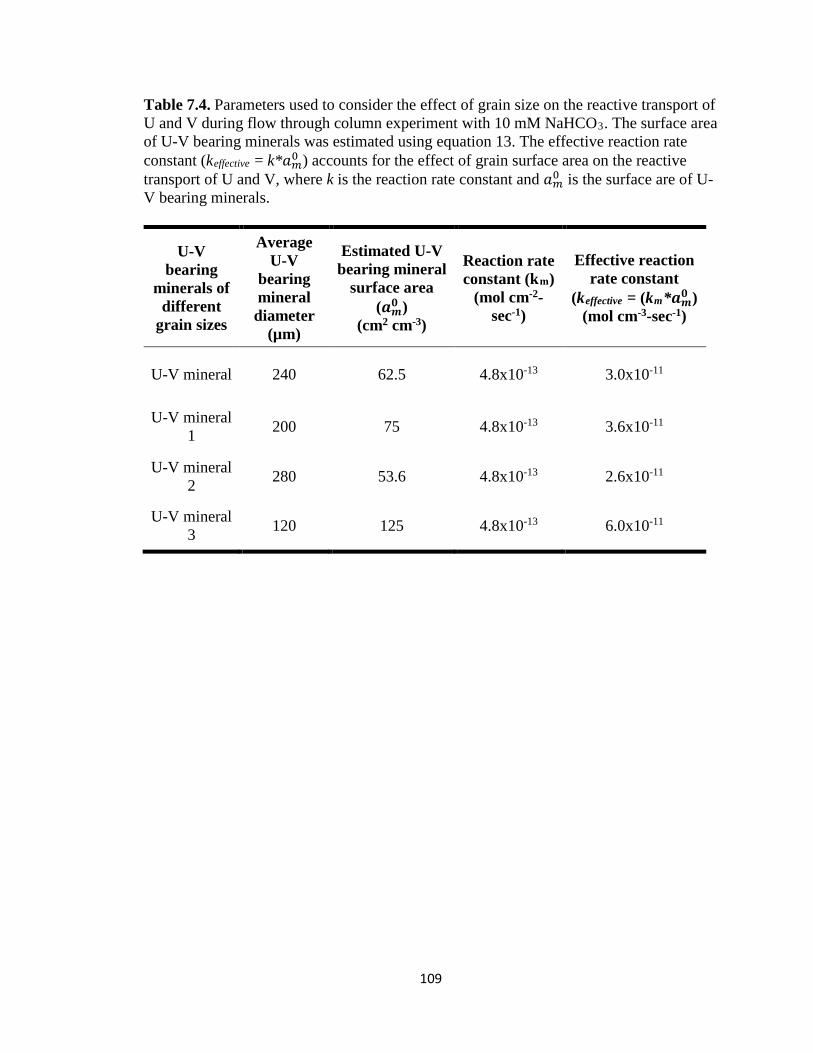
109
Table 7.4. Parameters used to consider the effect of grain size on the reactive transport of U and V during flow through column experiment with 10 mM NaHCO3. The surface area of U-V bearing minerals was estimated using equation 13. The effective reaction rate constant (keffective = k*𝑎𝑎𝑗𝑗0 ) accounts for the effect of grain surface area on the reactive transport of U and V, where k is the reaction rate constant and 𝑎𝑎𝑗𝑗0 is the surface are of U-V bearing minerals.
U-V bearing
minerals of different
grain sizes
Average U-V
bearing mineral diameter
(µm)
Estimated U-V bearing mineral
surface area (𝒂𝒂𝒂𝒂𝟎𝟎 )
(cm2 cm-3)
Reaction rate constant (km)
(mol cm-2-sec-1)
Effective reaction rate constant
(keffective = (km*𝒂𝒂𝒂𝒂𝟎𝟎 ) (mol cm-3-sec-1)
U-V mineral 240 62.5 4.8x10⁻¹³ 3.0x10⁻¹¹
U-V mineral 1 200 75 4.8x10⁻¹³ 3.6x10⁻¹¹
U-V mineral 2 280 53.6 4.8x10⁻¹³ 2.6x10⁻¹¹
U-V mineral 3 120 125 4.8x10⁻¹³ 6.0x10⁻¹¹
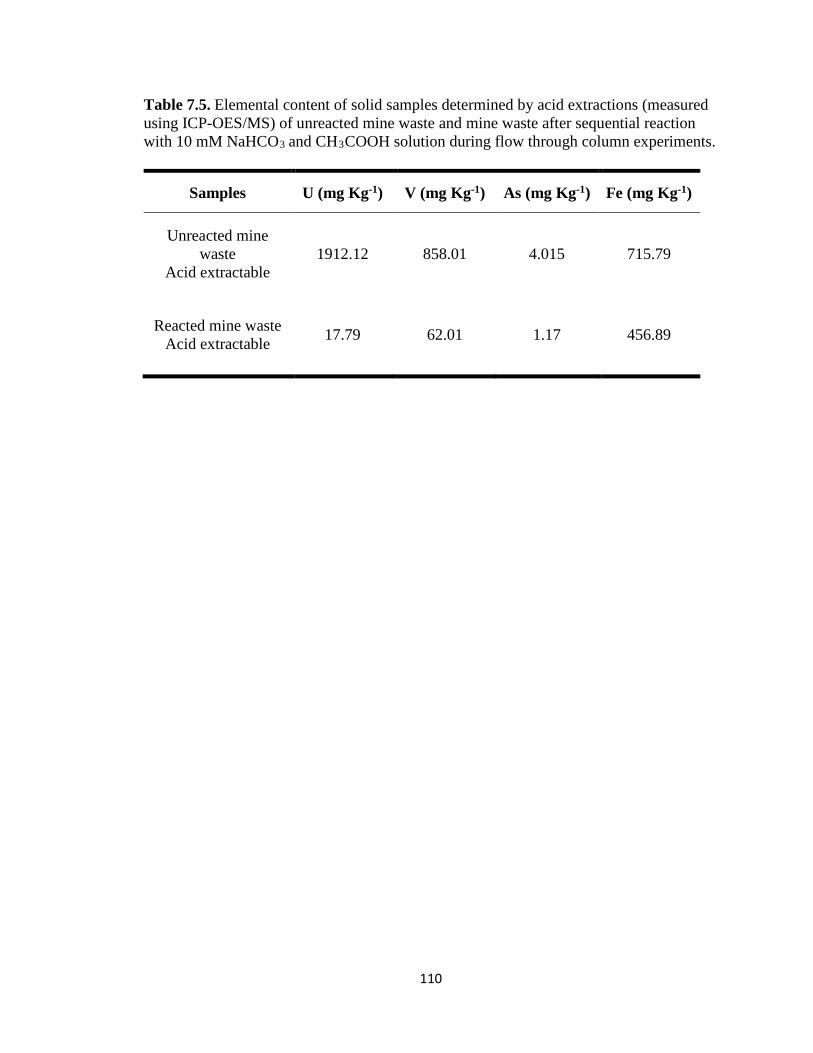
110
Table 7.5. Elemental content of solid samples determined by acid extractions (measured using ICP-OES/MS) of unreacted mine waste and mine waste after sequential reaction with 10 mM NaHCO3
and CH3COOH solution during flow through column experiments.
Samples U (mg Kg-1) V (mg Kg-1) As (mg Kg-1) Fe (mg Kg-1)
Unreacted mine waste
Acid extractable 1912.12 858.01 4.015 715.79
Reacted mine waste Acid extractable 17.79 62.01 1.17 456.89
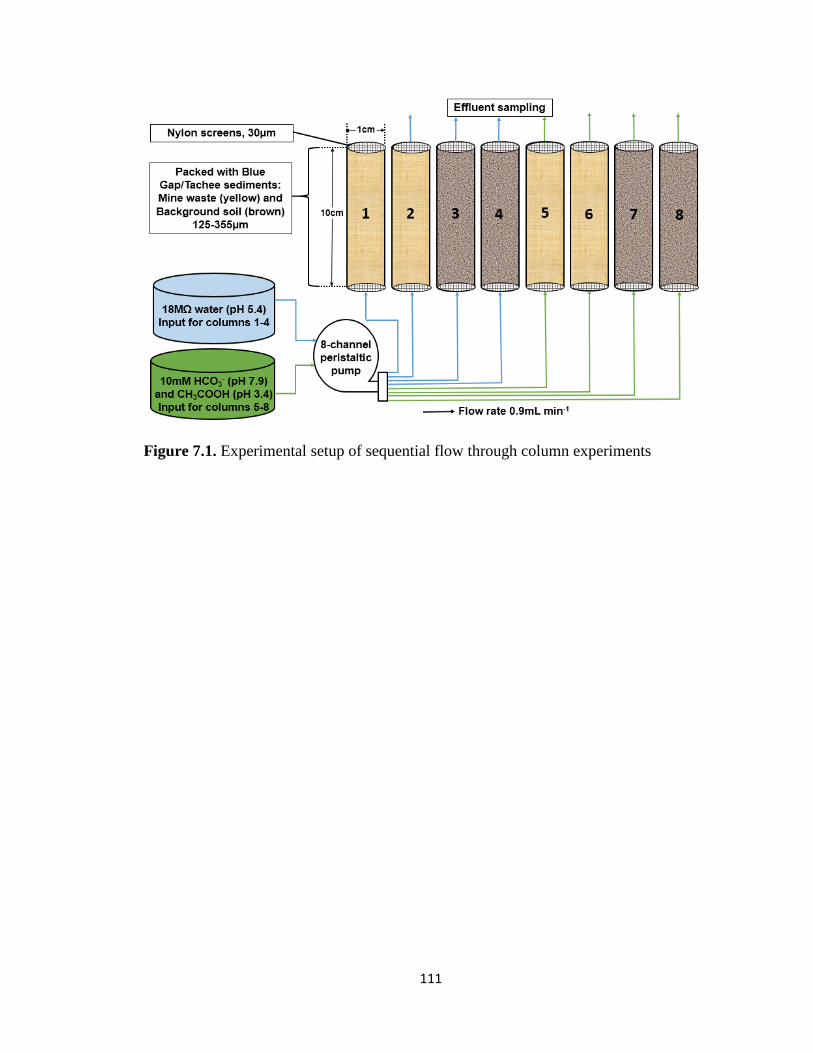
111
Figure 7.1. Experimental setup of sequential flow through column experiments
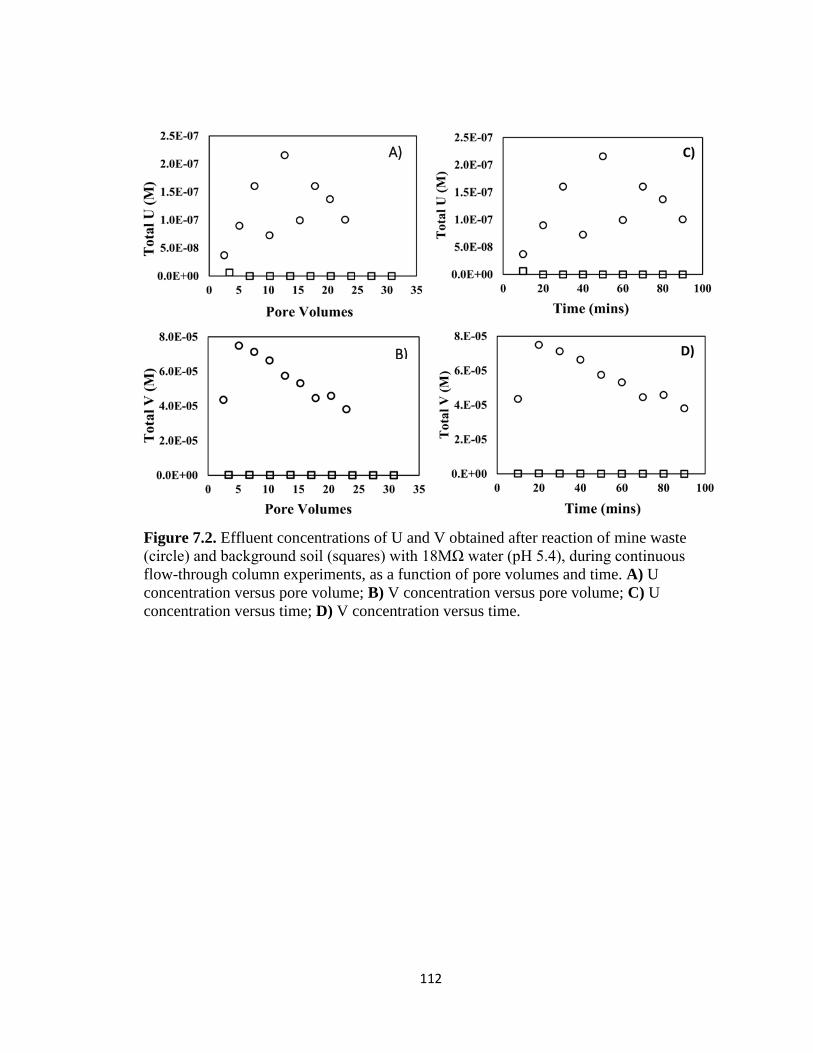
112
Figure 7.2. Effluent concentrations of U and V obtained after reaction of mine waste (circle) and background soil (squares) with 18MΩ water (pH 5.4), during continuous flow-through column experiments, as a function of pore volumes and time. A) U concentration versus pore volume; B) V concentration versus pore volume; C) U concentration versus time; D) V concentration versus time.
A)
B) D)
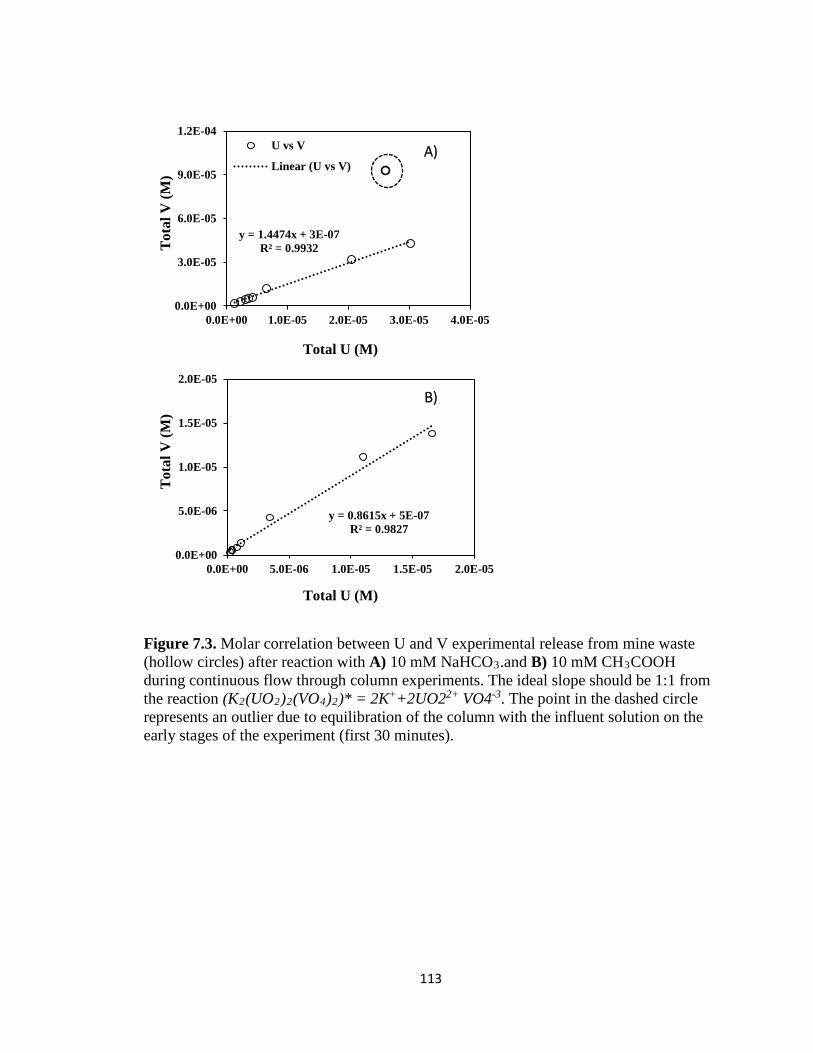
113
Figure 7.3. Molar correlation between U and V experimental release from mine waste (hollow circles) after reaction with A) 10 mM NaHCO3.and B) 10 mM CH3COOH during continuous flow through column experiments. The ideal slope should be 1:1 from the reaction (K2(UO2)2(VO4)2)* = 2K++2UO22+ VO4-3. The point in the dashed circle represents an outlier due to equilibration of the column with the influent solution on the early stages of the experiment (first 30 minutes).
y = 1.4474x + 3E-07R² = 0.9932
0.0E+00
3.0E-05
6.0E-05
9.0E-05
1.2E-04
0.0E+00 1.0E-05 2.0E-05 3.0E-05 4.0E-05
Tot
al V
(M)
Total U (M)
U vs V
Linear (U vs V)
y = 0.8615x + 5E-07R² = 0.9827
0.0E+00
5.0E-06
1.0E-05
1.5E-05
2.0E-05
0.0E+00 5.0E-06 1.0E-05 1.5E-05 2.0E-05
Tot
al V
(M)
Total U (M)
A)
B)
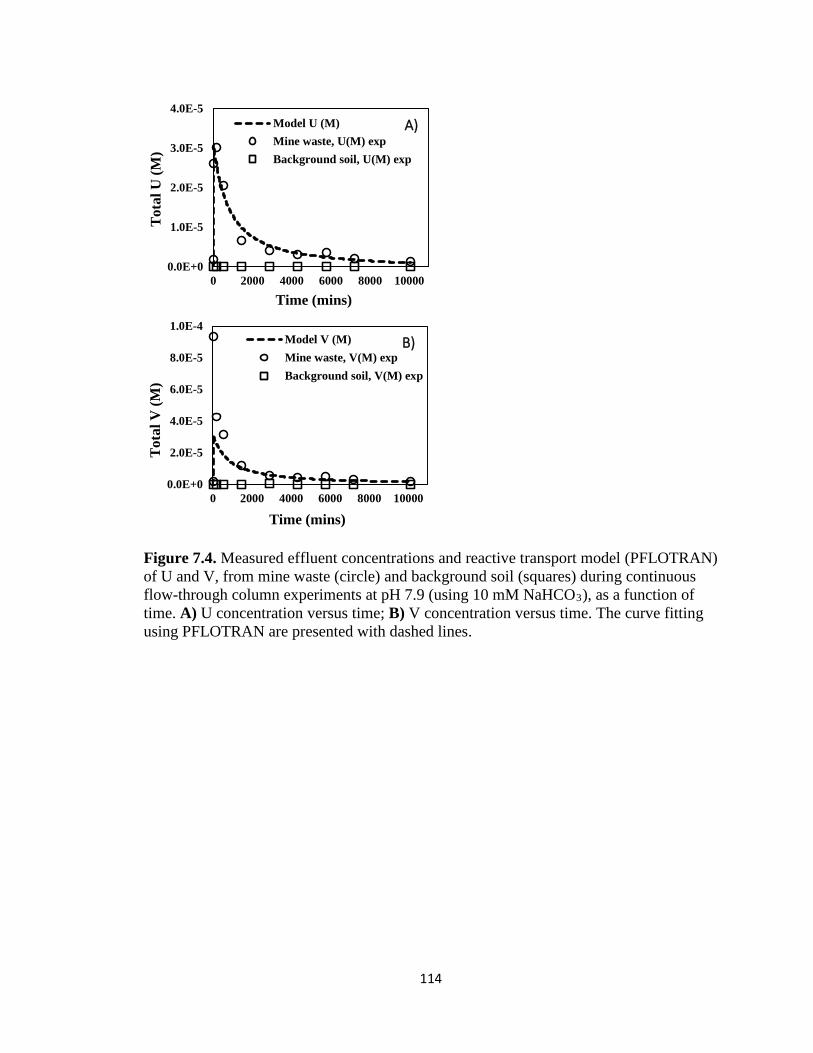
114
Figure 7.4. Measured effluent concentrations and reactive transport model (PFLOTRAN) of U and V, from mine waste (circle) and background soil (squares) during continuous flow-through column experiments at pH 7.9 (using 10 mM NaHCO3), as a function of time. A) U concentration versus time; B) V concentration versus time. The curve fitting using PFLOTRAN are presented with dashed lines.
0.0E+0
1.0E-5
2.0E-5
3.0E-5
4.0E-5
0 2000 4000 6000 8000 10000
Tot
al U
(M)
Time (mins)
Model U (M)Mine waste, U(M) expBackground soil, U(M) exp
0.0E+0
2.0E-5
4.0E-5
6.0E-5
8.0E-5
1.0E-4
0 2000 4000 6000 8000 10000
Tot
al V
(M)
Time (mins)
Model V (M)Mine waste, V(M) expBackground soil, V(M) exp
A)
B)

115
Figure 7.5. Measured effluent concentrations and reactive transport model (PFLOTRAN) of U and V from mine waste (circle) as a function of pore volumes after considering the effect of grain size during continuous flow-through column experiments at pH 7.9 (using 10 mM NaHCO3). A) U concentrations versus pore volumes B) V concentrations versus pore volumes. The curve fitting using PFLOTRAN are presented with dashed lines.
0.0E+0
1.0E-5
2.0E-5
3.0E-5
4.0E-5
0 1000 2000 3000
Tot
al U
(M)
Pore Volumes
Model U(M)
Mine waste, U(M) exp
A)
0.0E+0
2.0E-5
4.0E-5
6.0E-5
8.0E-5
1.0E-4
0 1000 2000 3000
Tot
al V
(M)
Pore Volumes
Model V(M)
Mine waste, V(M) expB))
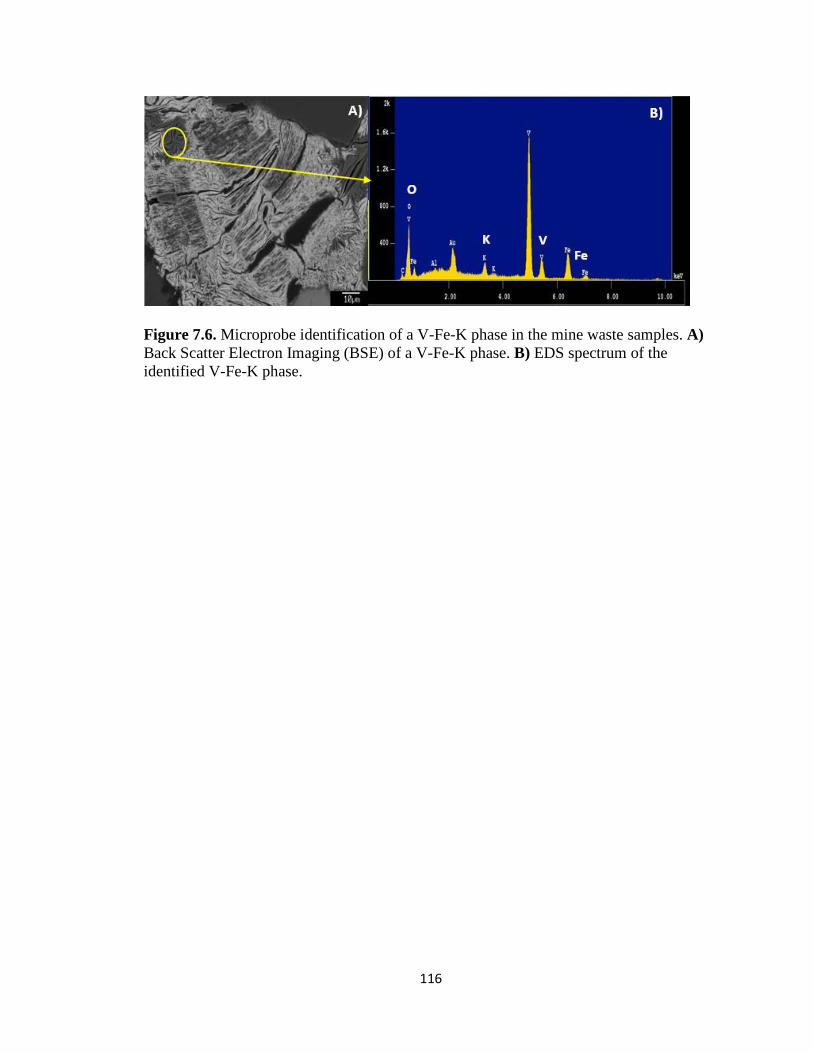
116
Figure 7.6. Microprobe identification of a V-Fe-K phase in the mine waste samples. A) Back Scatter Electron Imaging (BSE) of a V-Fe-K phase. B) EDS spectrum of the identified V-Fe-K phase.

117
Figure 7.7. Synchrotron Micro- X-ray Fluorescence mapping for mine waste samples identifying the co-occurrence of U with other metals. A) Uranium map; B) Vanadium map; C) Selenium map ; D) Strontium map ; E) Overlay map of U- red, Se – green and V – blue; F) Overlay map of U- red, Sr – green and V – blue. Gradient yellow colors in E and F suggest potential co-occurrence of U and Se, and U and Sr respectively. Similarly cyan gradient colors in E and F suggest co-occurrence of U and V, possibly as a U-V mineral.
U: Red Se: Green V: Blue
A)
C)
U: Red Sr: Green V:
D)
B)
E) F)
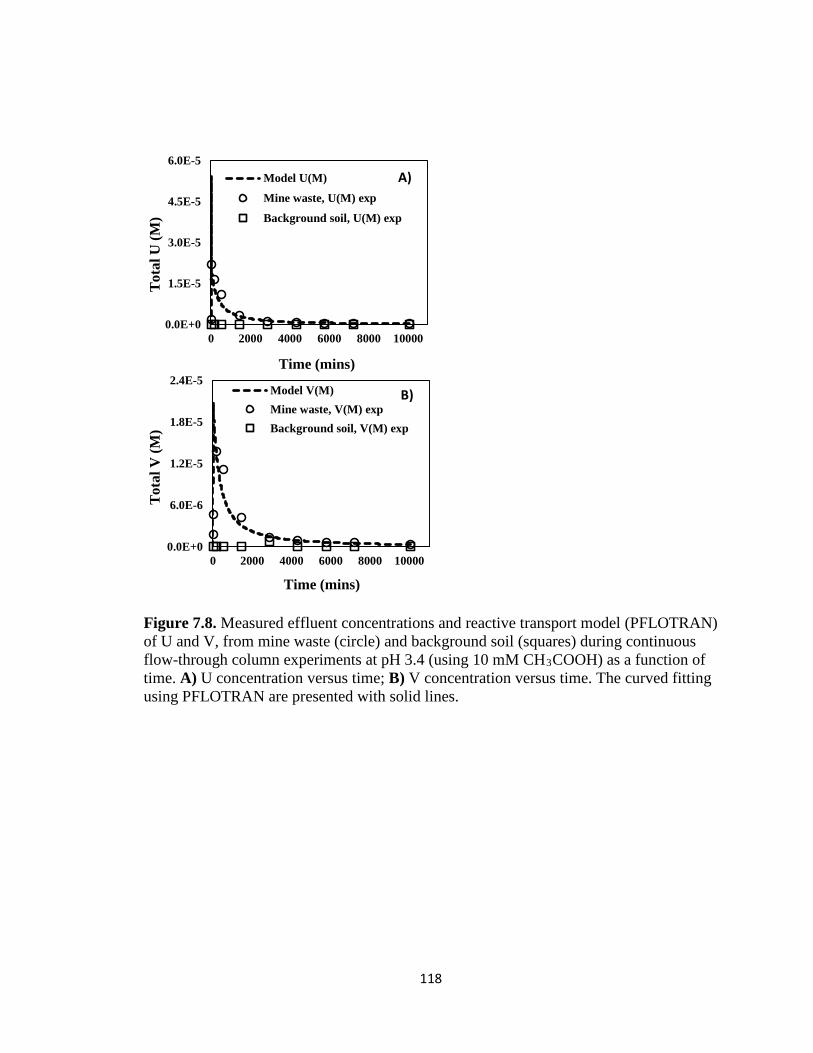
118
Figure 7.8. Measured effluent concentrations and reactive transport model (PFLOTRAN) of U and V, from mine waste (circle) and background soil (squares) during continuous flow-through column experiments at pH 3.4 (using 10 mM CH3COOH) as a function of time. A) U concentration versus time; B) V concentration versus time. The curved fitting using PFLOTRAN are presented with solid lines.
0.0E+0
1.5E-5
3.0E-5
4.5E-5
6.0E-5
0 2000 4000 6000 8000 10000
Tot
al U
(M)
Time (mins)
Model U(M)
Mine waste, U(M) exp
Background soil, U(M) exp
A)
0.0E+0
6.0E-6
1.2E-5
1.8E-5
2.4E-5
0 2000 4000 6000 8000 10000
Tot
al V
(M)
Time (mins)
Model V(M)Mine waste, V(M) expBackground soil, V(M) exp
B)
119
Additional Materials and Methods.
Acid digestions were conducted to assess and compare the total acid extractable trace
metal concentrations between unreacted and reacted mine wastes. Acid digestions for
unreacted sediments involved addition of 3ml of Hydrochloric acid (HCl), 3 ml of Nitric
acid (HNO3) and 3ml of Hydrofluoric acid (HF) into 50 ml Teflon digestion tubes to 2 ±
0.002g sediments. Similarly for reacted sediments 1 ml of HCl, HNO3 and HF was added
to 50 ml Teflon digestion tubes containing 0.5 ± 0.002g of sediments. All reagents are of
high purity. The digestion tubes were then heated using a Digi prep MS SCP Science
block digester at 95 °C for 2 h, followed by dilution of acid extracts from reacted and
unreacted sediments to 50 and 25 ml. The diluted samples are then filtered using 0.45 μm
filters to remove any suspended or undissolved solids before analysis.
Unreacted abandoned mine waste samples collected from the Jackpile-Paguate Mine,
Laguna Pueblo were characterized for their bulk elemental and oxide composition using
XRF with a detection limit around 0.1% of total elemental content. Sample preparation
involved mixing about 9g of mine waste sample with 1g of binder “spectroblend” and
homogenizing the mixture using a Spex mixer mill for 5 minutes in a plastic vial
containing plastic balls for mixing. The homogenized sample was then transferred into a
40mm pressing container “9x38 mm Spec-Cap” that was placed inside a press pellet dye
and pressed at 25 tons per square inch.

120
A Rigaku Smart Lab XRD was used to identify the U mineral phases that occur in the
waste samples collected from the Jackpile-Paguate mine. The instrument uses Cu Ka
radiation with a scintillation detector, a graphite monochromator and Jade® software to
obtain this information. The samples are prepared by using a water separation technique
with a settling time <30 s to concentrate the submicron U phases from the <63µm
homogenized waste sample.
A STEM analysis was conducted on waste samples to identify the submicron-crystalline
U phases and their composition which dominantly affect the reactivity and transport of U.
A JEOL 2010F Field Emission Gun Scanning Transmission Electron Microscope
(FEG/STEM) fitted with an Oxford ultrathin window Energy Dispersive Spectroscopy
(EDS) detector, an Oxford ISIS/INCA X-ray analysis system and a GATAN multiscan
CCD camera was used for the analysis. Apart from the traditional TEM techniques, this
TEM is capable of conducting 1) energy filtered imaging (EFTEM), 2) electron energy
loss spectroscopy (EELS), 3) X-ray microanalysis and X-ray mapping at the sub-nm
level, and 4) bright- and dark-field STEM imaging. For this study, we used the TEM and
STEM mode imaging, EDS analysis, high resolution selected area electron diffraction
(HR-SAED) and STEM mapping capabilities of the instrument. Drops of unaltered waste
sediment suspended in acetone were dropped onto standard holey carbon film-covered
Cu TEM grids using a disposable pipette. The sample was then allowed to sit for a
minute until all the acetone was vaporized. The dry samples were loaded onto the TEM
holder for performing the analysis. The INCA EDS detector was used to determine the
elemental composition of the specific targeted crystal. Later a HR-SAED analysis was
121
performed on the identified crystals to observe their crystallinity. A mapping analysis
was then conducted on these samples to identify the composition of these U-phases that
could be crucial to better understand their reactivity during waste reaction with various
reagents.
The samples were analyzed using a JEOL JXA-8200 (JEOL Ltd., Tokyo, Japan) electron
microprobe at the Department of Earth and Planetary Science/Institute of Meteoritics,
University of New Mexico. The microprobe is equipped with 5 wavelength dispersive x-
ray spectrometers (WDS) and an ultrathin-window energy dispersive spectrometer
(EDS). A Sun Microsystems computer, running Solaris OS 10, hosts the JEOL operating
software, which includes a qualitative X-ray mapping routine, the EDS analyzer, and
image acquisition facilities. A Dell PC running Windows 7 handles the quantitative
analysis and automation with third party software, Probe for EPMA (Probe Software,
Inc., Eugene, Oregon).
X-ray maps were acquired at 20 kV and 30 nA beam current, mapping the
following elements (see table below for analytical lines): Al, Si, P, S, K, Ca, V, Ti, Fe,
and U (Appendix B: Table 8.1). All elements were mapped using WDS spectrometers
except Al and Si which were mapped using the EDS spectrometer. The 10 elements
measured by WDS required 2 complete passes to be made on each map since each WDS
measures one element at a time. To accomplish this, the first 5 elemental lines on the
WDS, a backscattered electron image, and the EDS lines were collected simultaneously,
followed by a second pass on the map to acquire the remaining 5 lines measured by
WDS. Maps were acquired over areas as large as 177 x 223 pixels down to 98 x 137

122
pixels where each pixel was 2 µm square, moving the stage from pixel to pixel. Stage
movement is used over large areas to avoid defocusing the X-ray optics of the WDS
spectrometer. Dwell time on all maps was 100 msec per pixel. Thus, the longest map
stage map required 1 hour 17 minutes, including overhead for stage movement, while the
smallest map (98 x 37 pixels) required 27 minutes acquisition time. One map of 100 x
200 pixels was acquired over a small area of 56 by 112 µm using the beam scan mode
rather than stage movement since defocusing the WDS was not a problem. The
acquisition time on this map was 2 hours using 3 accumulations or frames added
together. The polished sections were analyzed at 20 kV and 30 nA beam current with a
spot size less than 1 µm. Quantitative analyses were accomplished with WDS; the
elements and their analytical lines with counting times and detection limits are provided
in the SI table 1 below. Standard metals and minerals from C.M. Taylor Corp.
(Sunnyvale, CA) and from the Smithsonian collection176 were used for calibration, and
Probe for EPMA software, utilizing a ZAF correction algorithm, was used to reduce the
raw data. The elements analyzed using Electron Microprobe, their analytical line, peak
counting time in seconds, counting time on each background (above and below peak, in
seconds), and Minimum Detection Limit (in element wt%) are presented in a table below.
Element Al Si P S K V Fe U
Line Ka Ka Ka Ka Ka Ka Ka Ma
Peak counting Time (s) 20 20 40 60 20 20 20 60
Background Time (s) 10 10 10 20 10 10 10 20
Minimum Detection Limit (MDL) (wt%)
0.014 0.013 0.012 0.006 0.014 0.016 0.017 0.034
123
A XPS analysis was conducted on unreacted and reacted waste sediments surface
oxidation states (top 5 nm) of the uranium (U). We used a Kratos AXIS-Ultra DLD XPS
was used to acquire the near surface (5-10 nm) elemental composition and oxidation
states. Monochromatic Al Kα source operating at 225W was used. Survey spectra were
acquired at 80 eV and high resolution at 20 eV pass energy. The data obtained for every
sample is an average of 3 different areas on the sample. Charge neutralization was
accomplished using low energy electron that operate at a -3.1 V bias voltage, -1.0 V
filament voltage and filament current of 2.1 A. Our spectra were calibrated using the 4f
spectra acquired from gold powder that was deposited on each sample. All spectra of U
were processed using CasaXPS software. Synthetic uraninite [UO2] and becquerelite
[Ca(UO2)6O4(OH)6·8(H2O)] procured from our collaborators in University of Notre
Dame were used as reference standards for U(IV) and U(VI). Atomic percentage content
for various elements was calculated using sensitivity factors provided by the
manufacturer. A 70% Gaussian / 30% Lorentzian (GL (30)) line shape was used to fit our
spectra. The full width at half maximum was kept between 1.6 and 1.9 eV for all peaks
used in fitting. The position and area of peaks in U 4f 5/2 component was constrained to
those in U4f 7/2 components by the values reported in database- 10.8 eV higher in
position and 75% of the area. Several peaks from other elements contribute to the same
binding energy range – K 2s at 378.9 eV, Mg auger peak at 385 eV and N 1s in the region
above 399 eV.
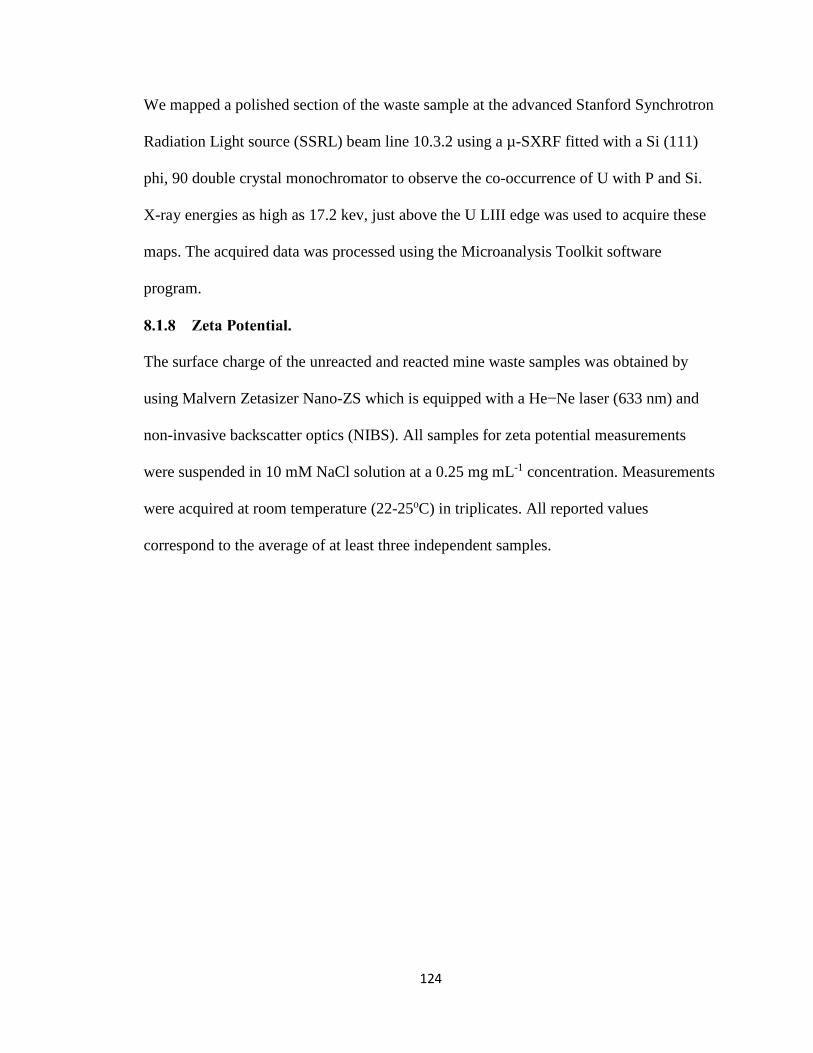
124
We mapped a polished section of the waste sample at the advanced Stanford Synchrotron
Radiation Light source (SSRL) beam line 10.3.2 using a µ-SXRF fitted with a Si (111)
phi, 90 double crystal monochromator to observe the co-occurrence of U with P and Si.
X-ray energies as high as 17.2 kev, just above the U LIII edge was used to acquire these
maps. The acquired data was processed using the Microanalysis Toolkit software
program.
The surface charge of the unreacted and reacted mine waste samples was obtained by
using Malvern Zetasizer Nano-ZS which is equipped with a He−Ne laser (633 nm) and
non-invasive backscatter optics (NIBS). All samples for zeta potential measurements
were suspended in 10 mM NaCl solution at a 0.25 mg mL-1 concentration. Measurements
were acquired at room temperature (22-25oC) in triplicates. All reported values
correspond to the average of at least three independent samples.
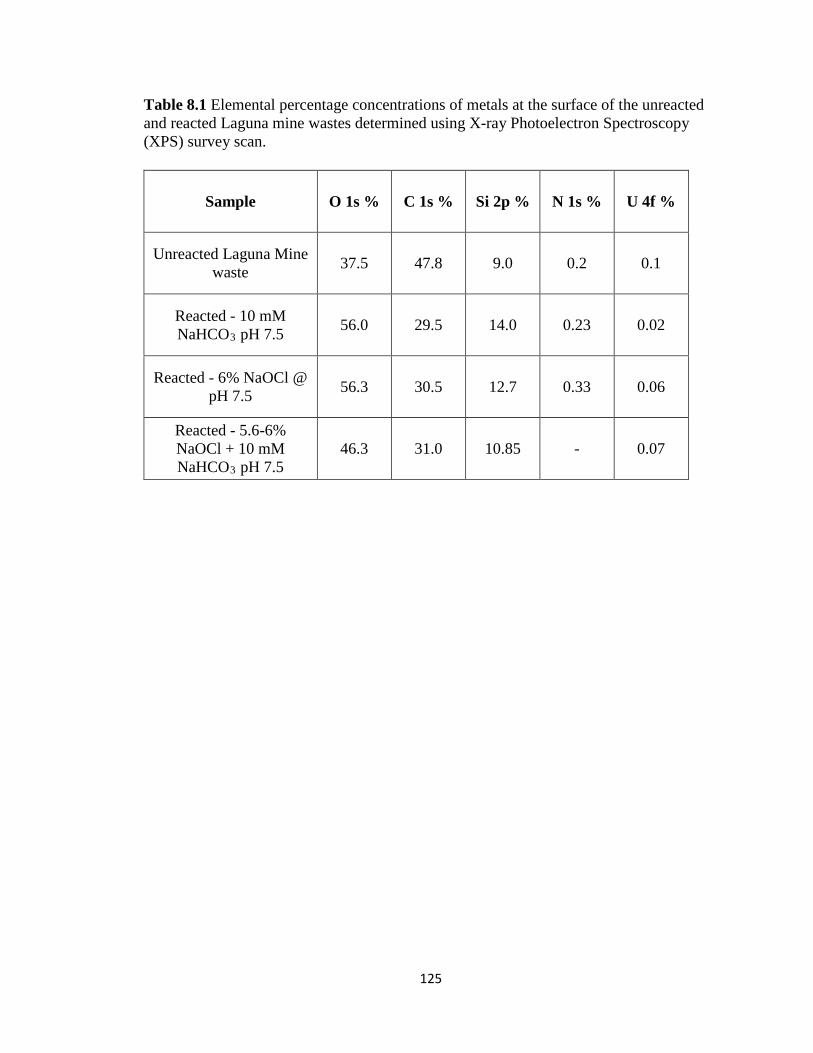
125
Table 8.1 Elemental percentage concentrations of metals at the surface of the unreacted and reacted Laguna mine wastes determined using X-ray Photoelectron Spectroscopy (XPS) survey scan.
Sample O 1s % C 1s % Si 2p % N 1s % U 4f %
Unreacted Laguna Mine waste 37.5 47.8 9.0 0.2 0.1
Reacted - 10 mM NaHCO3 pH 7.5 56.0 29.5 14.0 0.23 0.02
Reacted - 6% NaOCl @ pH 7.5 56.3 30.5 12.7 0.33 0.06
Reacted - 5.6-6% NaOCl + 10 mM NaHCO3 pH 7.5
46.3 31.0 10.85 - 0.07
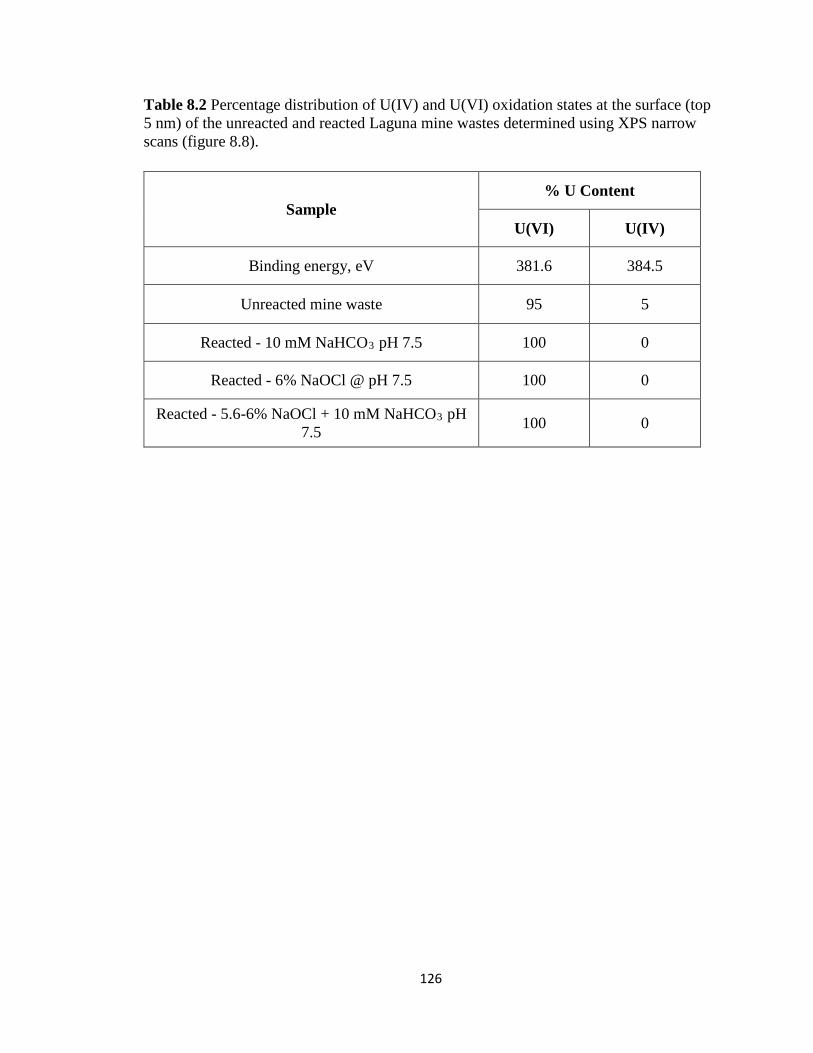
126
Table 8.2 Percentage distribution of U(IV) and U(VI) oxidation states at the surface (top 5 nm) of the unreacted and reacted Laguna mine wastes determined using XPS narrow scans (figure 8.8).
Sample % U Content
U(VI) U(IV)
Binding energy, eV 381.6 384.5
Unreacted mine waste 95 5
Reacted - 10 mM NaHCO3 pH 7.5 100 0
Reacted - 6% NaOCl @ pH 7.5 100 0
Reacted - 5.6-6% NaOCl + 10 mM NaHCO3 pH 7.5 100 0
127
Table 8.3 Chemical equilibrium simulations conducted using MINEQL 4.6 to observe the dominant aqueous complexes and mineral precipitates formed at a certain pH and reactivity conditions. The saturation indices (SI) for schoepite during reaction with 18MΩ water and 6% NaOCl are estimated to be, SI = 0.
Experiments Average pH Aqueous complexes
and mineral precipitates formed
Dominance of aqueous and solid
phases in concentration%
Reaction with 18MΩ water
6.5 (when
concentrations start dropping)
UO2OH+ 13.8
(UO2)3(OH)5+ 8.7
UO2(OH)2 (aq) 5.5
Schoepite 71.7
Reaction with 10 mM
NaHCO3 8
UO2(CO3)34- 4.6
Ca2UO2(CO3)30 18.9
Ca2UO2(CO3)32- 75.8
Reaction with 6% NaOCl
6.5 (when concentrations start dropping)
UO2OH+ 1.1
Schoepite 97.9
6% NaOCl + 10 mM
NaHCO3
5.9 (when concentrations start dropping)
UO2CO3 (aq) 5.4
UO2(CO3)2-2 2.4
Ca2UO2(CO3)30 77.8
Ca2UO2(CO3)32- 14.1

128
Table 8.4 Dissolved Organic Carbon (DOC) content dissolved from Laguna mine wastes after reaction with 1) 18MΩ water pH 5.4 2) 10 mM NaHCO3 pH 7.5 3) 6% NaOCl pH 7.5 and 4) 6% NaOCl + 10mM NaHCO3 pH 7.5.
Reagents Dissolved Organic Carbon (DOC)
(mg/L)
Reaction with 18MΩ water 1.6
Reaction with 10 mM NaHCO3 2.6
Reaction with 6% NaOCl 5.5
6% NaOCl + 10 mM NaHCO3 3.3
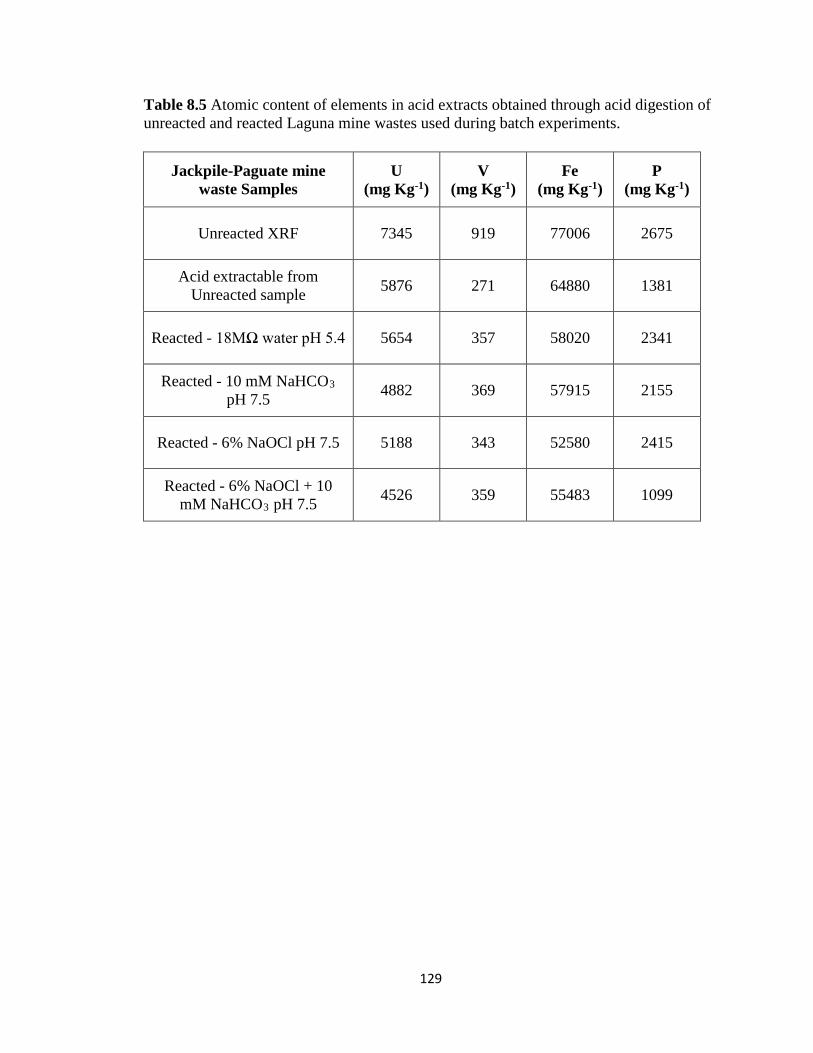
129
Table 8.5 Atomic content of elements in acid extracts obtained through acid digestion of unreacted and reacted Laguna mine wastes used during batch experiments.
Jackpile-Paguate mine waste Samples
U (mg Kg-1)
V (mg Kg-1)
Fe (mg Kg-1)
P (mg Kg-1)
Unreacted XRF 7345 919 77006 2675
Acid extractable from Unreacted sample 5876 271 64880 1381
Reacted - 18MΩ water pH 5.4 5654 357 58020 2341
Reacted - 10 mM NaHCO3 pH 7.5 4882 369 57915 2155
Reacted - 6% NaOCl pH 7.5 5188 343 52580 2415
Reacted - 6% NaOCl + 10 mM NaHCO3 pH 7.5 4526 359 55483 1099
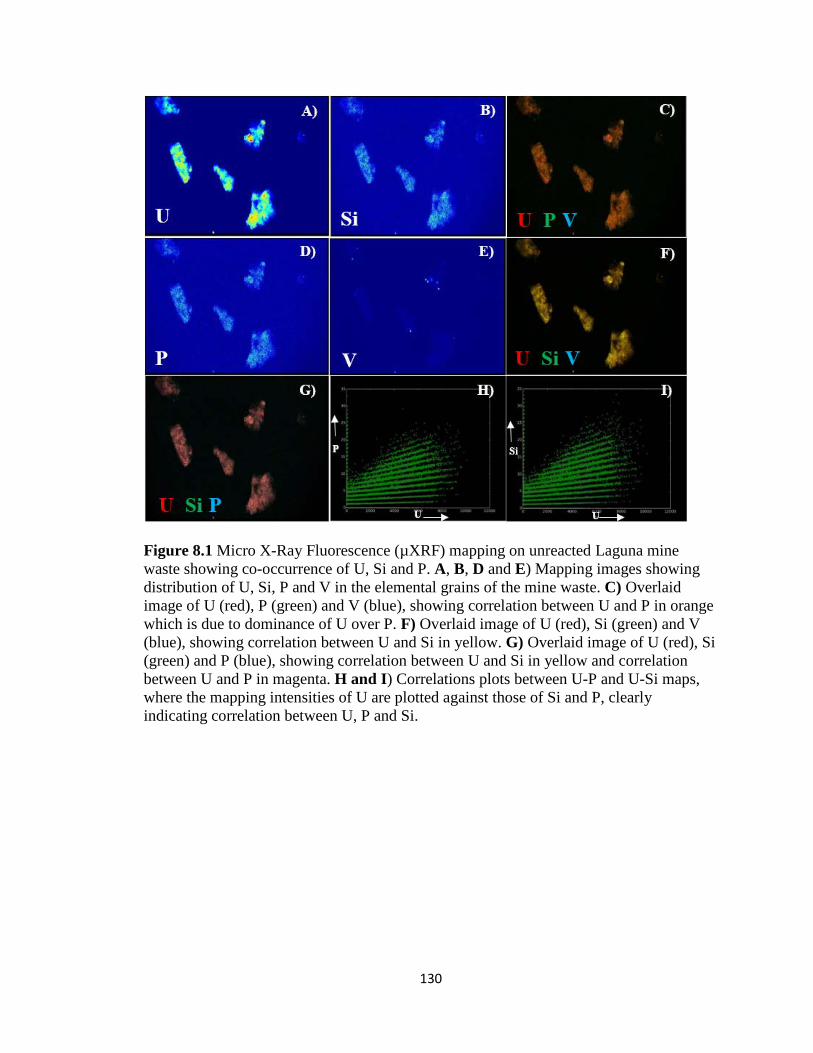
130
Figure 8.1 Micro X-Ray Fluorescence (µXRF) mapping on unreacted Laguna mine waste showing co-occurrence of U, Si and P. A, B, D and E) Mapping images showing distribution of U, Si, P and V in the elemental grains of the mine waste. C) Overlaid image of U (red), P (green) and V (blue), showing correlation between U and P in orange which is due to dominance of U over P. F) Overlaid image of U (red), Si (green) and V (blue), showing correlation between U and Si in yellow. G) Overlaid image of U (red), Si (green) and P (blue), showing correlation between U and Si in yellow and correlation between U and P in magenta. H and I) Correlations plots between U-P and U-Si maps, where the mapping intensities of U are plotted against those of Si and P, clearly indicating correlation between U, P and Si.
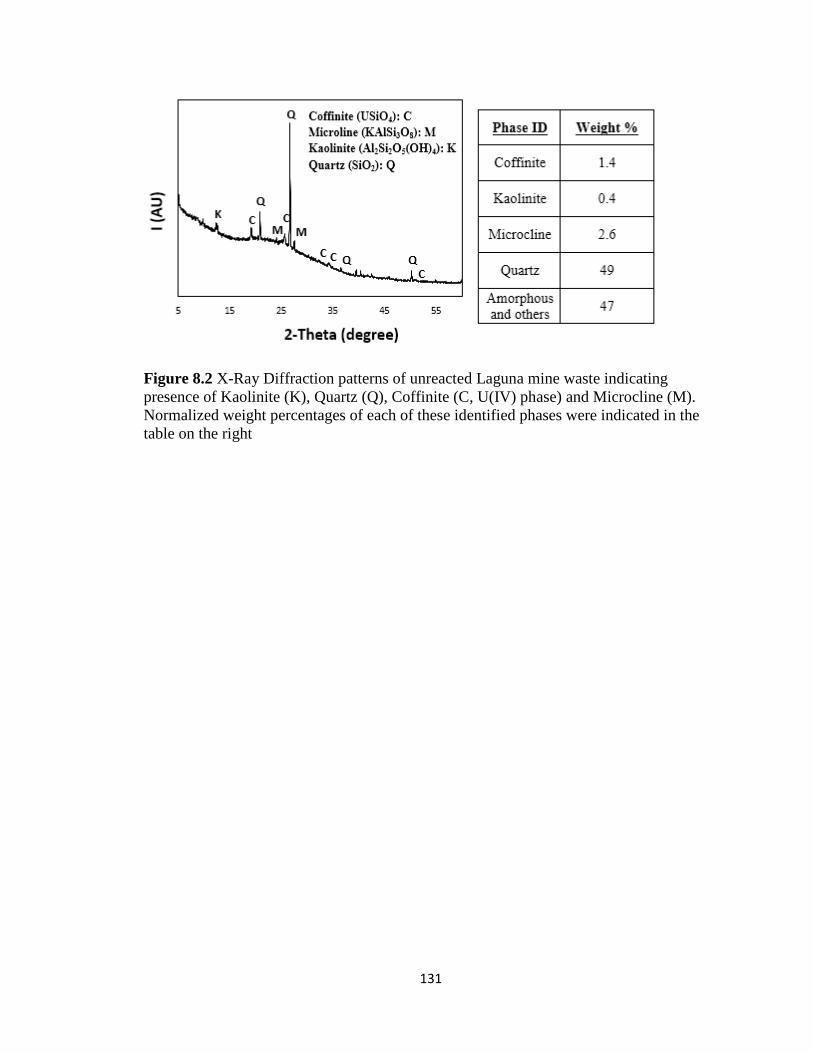
131
Figure 8.2 X-Ray Diffraction patterns of unreacted Laguna mine waste indicating presence of Kaolinite (K), Quartz (Q), Coffinite (C, U(IV) phase) and Microcline (M). Normalized weight percentages of each of these identified phases were indicated in the table on the right

132
Figure 8.3 Scanning Transmission Electron Microscopy (STEM) mapping of the U-K-P phase in the unreacted mine waste sample. A) STEM image of the waste sample B) C (carbon) map C) U map D) P map E) K map and F) Si map G) O map H) Overlay map of P in red, U in green and K in Blue suggests co-occurrence of U, K and P, cyan shows co-occurrence of U and K. I) Overlay map of P in red, Si in green and U in Blue. Magenta areas show co-occurrence of U and P, cyan shows co-occurrence of U and Si.
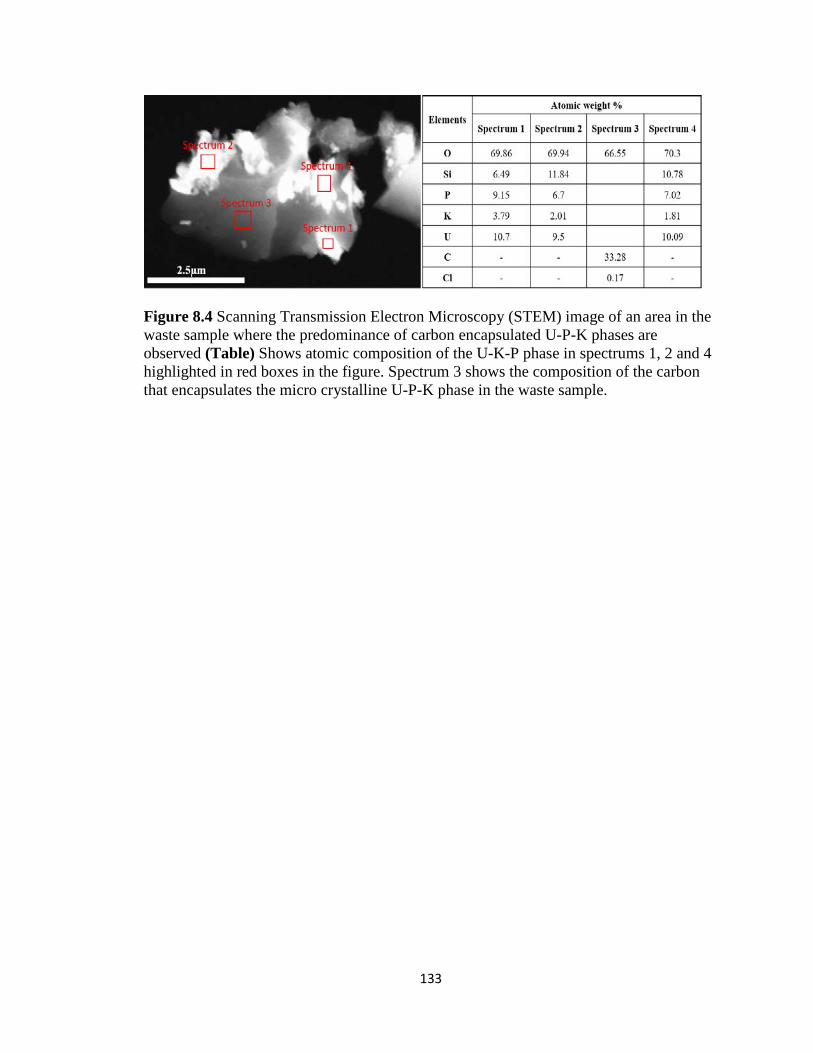
133
Figure 8.4 Scanning Transmission Electron Microscopy (STEM) image of an area in the waste sample where the predominance of carbon encapsulated U-P-K phases are observed (Table) Shows atomic composition of the U-K-P phase in spectrums 1, 2 and 4 highlighted in red boxes in the figure. Spectrum 3 shows the composition of the carbon that encapsulates the micro crystalline U-P-K phase in the waste sample.

134
Figure 8.5 The average pH change during batch reactions of Laguna mine wastes with A) 18MΩ water pH 5.4 B) 10 mM NaHCO3 pH 7.5 C) 6% NaOCl pH 7.5 D) 6% NaOCl + 10 mM NaHCO3 pH 7.5, conducted in triplicates.
4
5
6
7
8
0 100 200 300 400
pH
Time (hours)
A)
3
4
5
6
7
8
9
0 100 200 300 400
pH
Time (hours)
B)
3
4
5
6
7
8
0 200 400
pH
Time (hours)
C)
0
2
4
6
8
10
0 100 200 300 400
pH
Time (hours)
D)
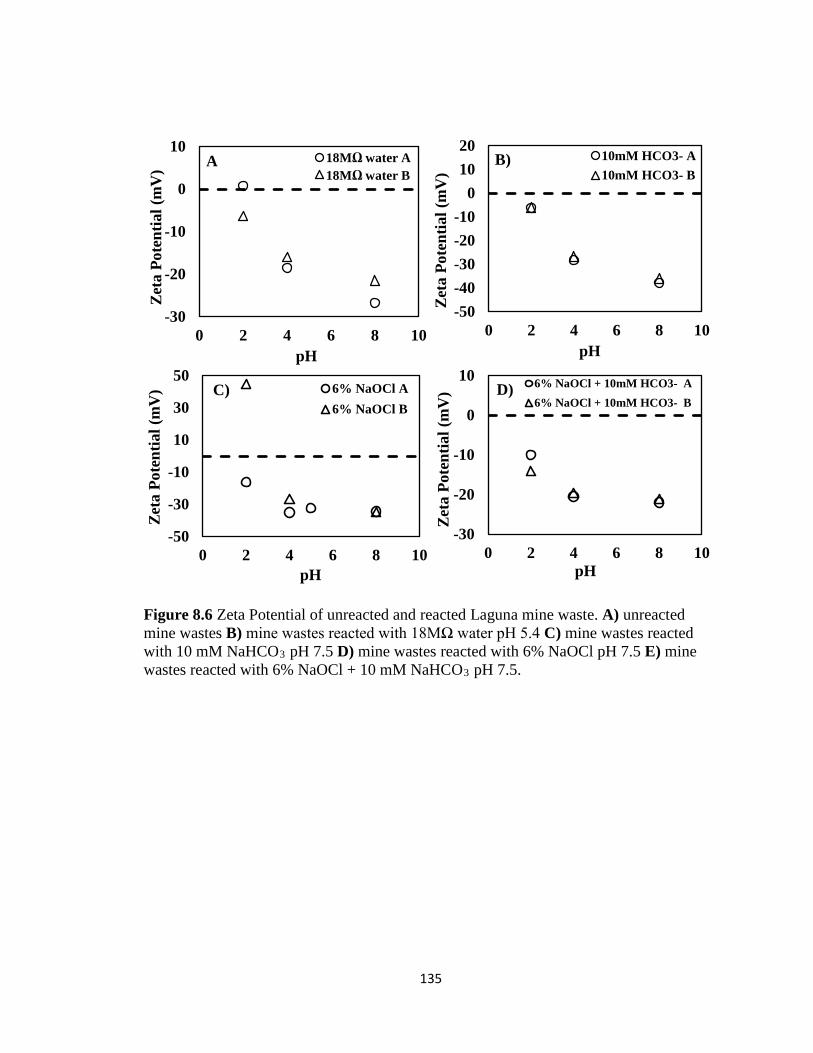
135
Figure 8.6 Zeta Potential of unreacted and reacted Laguna mine waste. A) unreacted mine wastes B) mine wastes reacted with 18MΩ water pH 5.4 C) mine wastes reacted with 10 mM NaHCO3 pH 7.5 D) mine wastes reacted with 6% NaOCl pH 7.5 E) mine wastes reacted with 6% NaOCl + 10 mM NaHCO3 pH 7.5.
-30
-20
-10
0
10
0 2 4 6 8 10
Zeta
Pot
entia
l (m
V)
pH
18MΩ water A18MΩ water B
A
-50-40-30-20-10
01020
0 2 4 6 8 10
Zeta
Pot
entia
l (m
V)
pH
10mM HCO3- A10mM HCO3- B
B)
-50
-30
-10
10
30
50
0 2 4 6 8 10
Zeta
Pot
entia
l (m
V)
pH
6% NaOCl A6% NaOCl B
C)
-30
-20
-10
0
10
0 2 4 6 8 10
Zeta
Pot
entia
l (m
V)
pH
6% NaOCl + 10mM HCO3- A6% NaOCl + 10mM HCO3- B
D)
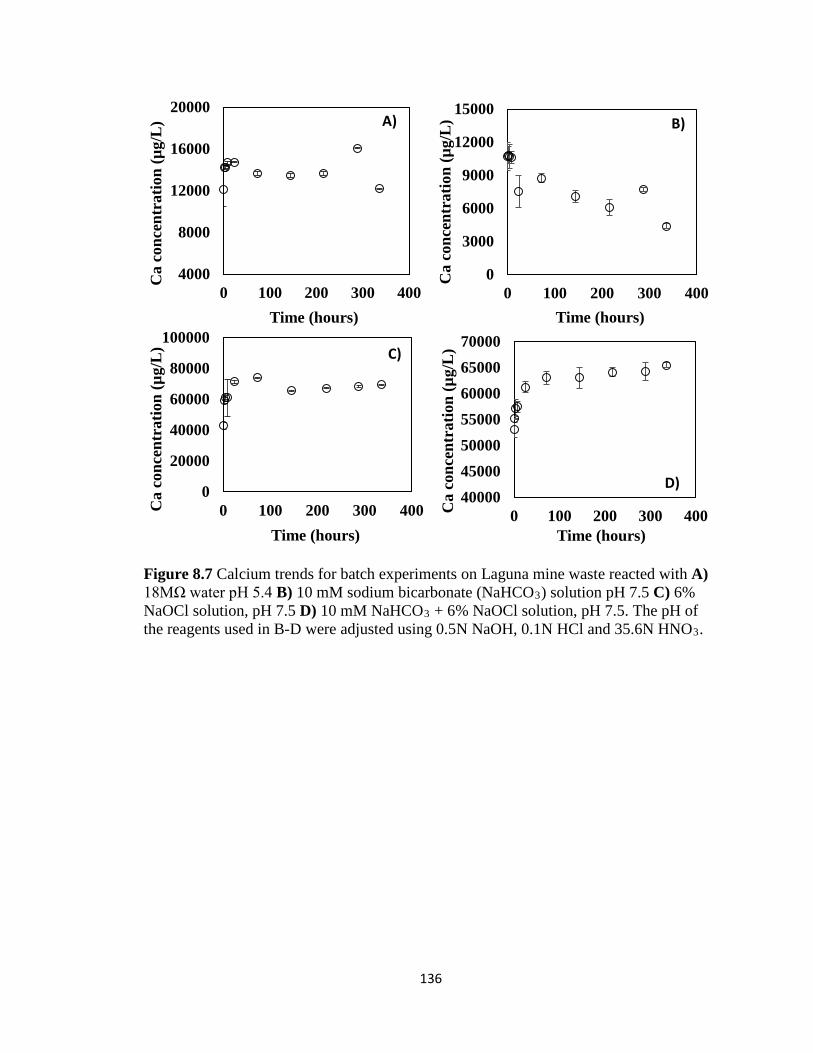
136
Figure 8.7 Calcium trends for batch experiments on Laguna mine waste reacted with A) 18MΩ water pH 5.4 B) 10 mM sodium bicarbonate (NaHCO3) solution pH 7.5 C) 6% NaOCl solution, pH 7.5 D) 10 mM NaHCO3 + 6% NaOCl solution, pH 7.5. The pH of the reagents used in B-D were adjusted using 0.5N NaOH, 0.1N HCl and 35.6N HNO3.
4000
8000
12000
16000
20000
0 100 200 300 400
Ca
conc
entr
atio
n (µ
g/L
)
Time (hours)
A)
0
3000
6000
9000
12000
15000
0 100 200 300 400
Ca
conc
entr
atio
n (µ
g/L
)
Time (hours)
B)
0
20000
40000
60000
80000
100000
0 100 200 300 400Ca
conc
entr
atio
n (µ
g/L
)
Time (hours)
C)
40000450005000055000600006500070000
0 100 200 300 400Ca
conc
entr
atio
n (µ
g/L
)
Time (hours)
D)
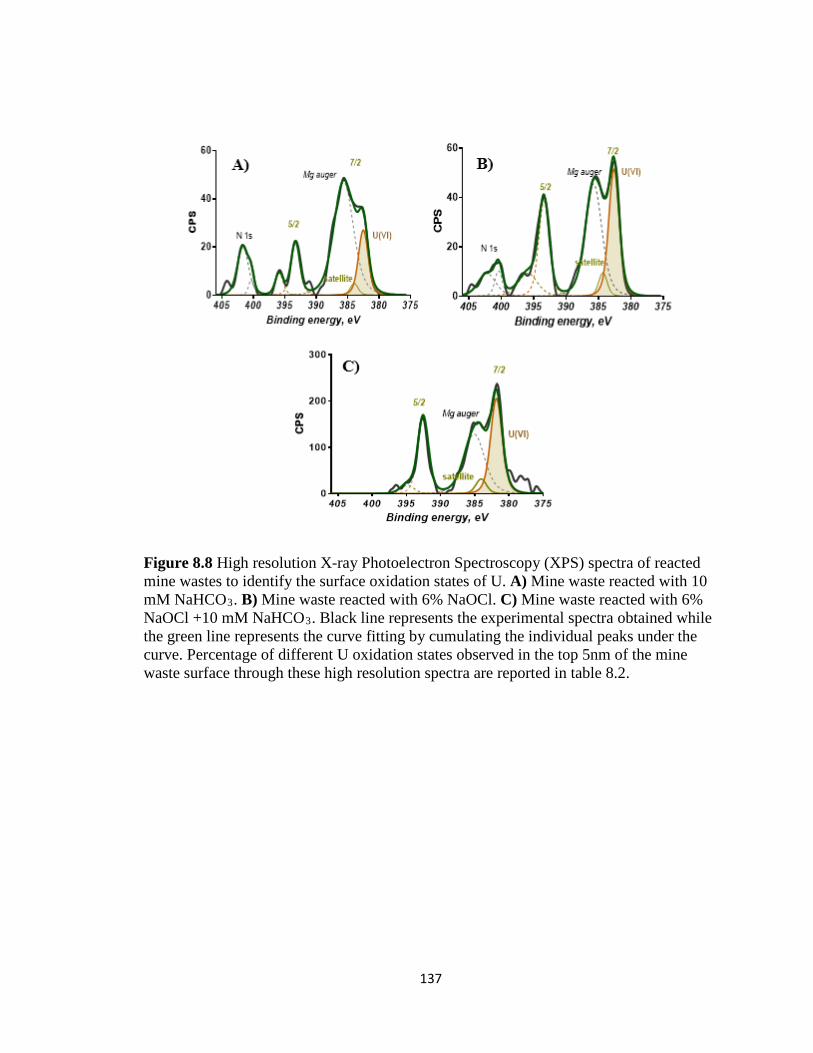
137
Figure 8.8 High resolution X-ray Photoelectron Spectroscopy (XPS) spectra of reacted mine wastes to identify the surface oxidation states of U. A) Mine waste reacted with 10 mM NaHCO3. B) Mine waste reacted with 6% NaOCl. C) Mine waste reacted with 6% NaOCl +10 mM NaHCO3. Black line represents the experimental spectra obtained while the green line represents the curve fitting by cumulating the individual peaks under the curve. Percentage of different U oxidation states observed in the top 5nm of the mine waste surface through these high resolution spectra are reported in table 8.2.

138
1. Blake, J. M.; Avasarala, S.; Artyushkova, K.; Ali, A.-M. S.; Brearley, A. J.; Shuey, C.; Robinson, W. P.; Nez, C.; Bill, S.; Lewis, J., Elevated concentrations of U and co-occurring metals in abandoned mine wastes in a northeastern Arizona Native American community. Environmental science & technology 2015, 49 (14), 8506-8514. 2. Riley, R. G.; Zachara, J. Chemical contaminants on DOE lands and selection of contaminant mixtures for subsurface science research; Pacific Northwest Lab., Richland, WA (United States): 1992. 3. Archer, V. E., Hazards to health in uranium mining and milling. Journal of Occupational and Environmental Medicine 1962, 4 (2), 55-60. 4. Byrne, J.; Hoffman, S. M., Governing the Atom: The Politics of Risk. North Atlantic Books: 1996; Vol. 7. 5. Sovacool, B. K., The costs of failure: a preliminary assessment of major energy accidents, 1907–2007. Energy Policy 2008, 36 (5), 1802-1820. 6. Moore-Nall, A., The legacy of uranium development on or near Indian reservations and health implications rekindling public awareness. Geosciences 2015, 5 (1), 15-29. 7. United States government, abandoned mines portal 2016. 8. USEPA, Addressing uranium contamination on the Navajo Nation. U.S. Environmental Protection Agency, Pacific Southwest, Region 9: San Francisco, CA. 2015. 9. USEPA, Technical Report on Technologically Enhanced Naturally Occurring Radioactive Materials from Uranium Mining Vol. 1: Mining and Reclamation Background. U.S. Environmental Protection Agency, Office of Radiation and Indoor Air April, 2008a, EPA 402-R-08-005 (Washington, D.C.). 10. Congress, U. S., Uranium Mill Tailings Radiation Control Act of 1978. Public Law 1978, 95−604. 11. USEPA, Technical Report on Technologically Enhanced Naturally Occurring Radioactive Materials from Uranium Mining Vol. 1: Mining and Reclamation Background; U.S. Environmental Protection Agency, Office of Radiation and Indoor Air, EPA 402-R-08-005:. Washington,D.C. 2008a. 12. USEPA, Addressing uranium contamination on the Navajo Nation. U.S. Environmental Protection Agency, Pacific Southwest, Region 9. San Francisco, CA 2015. 13. USEPA, Federal actions to address impacts of uranium contamination in the Navajo Nation: Five-year plan summary report. U.S. Environmental Protection Agency, Pacific Southwest, Region 9. San Francisco, CA 2013. 14. Dawson, S., Navajo uranium workers and the effects of occupational illnesses: A case study. Human Organization 1992, 51 (4), 389-397. 15. Hopenhayn, C., Arsenic in drinking water: Impact on human health. Elements 2006, 2, 103-107. 16. D'amore, J.; Al-Abed, S.; Scheckel, K.; Ryan, J., Methods for speciation of metals in soils. Journal of environmental quality 2005, 34 (5), 1707-1745.
139
17. Menzel, D. C., Implementation of the federal surface mining control and reclamation act of 1977. Public Administration Review 1981, 212-219. 18. Cothern, C. R.; Lappenbusch, W. L.; Cotruvo, J. A., Health effects guidance for uranium in drinking water. Health physics 1983, 44, 377-384. 19. Agency, U. S. E. P., Jackpile-Paguate Uranium Mine NPL Listing Support Document, U.S. Government Publishing Office. Washington, D.C. 2013. 20. Blake, J. M.; De Vore, C. L.; Avasarala, S.; Ali, A.-M.; Roldan, C.; Bowers, F.; Spilde, M. N.; Artyushkova, K.; Kirk, M. F.; Peterson, E., Uranium mobility and accumulation along the Rio Paguate, Jackpile Mine in Laguna Pueblo, NM. Environmental Science: Processes & Impacts 2017, 19 (4), 605-621. 21. Santos, E. n. A.; Ladeira, A. C., Recovery of uranium from mine waste by leaching with carbonate-based reagents. Environmental science & technology 2011, 45 (8), 3591-3597. 22. Benjamin, M. M., Water chemistry. Waveland Press: 2014. 23. Ledin, M.; Pedersen, K., The environmental impact of mine wastes—roles of microorganisms and their significance in treatment of mine wastes. Earth-Science Reviews 1996, 41 (1), 67-108. 24. Byczkowski, J. Z.; Kulkarni, A. P., Oxidative stress and pro-oxidant biological effects of vanadium. Advances in Environmental Science and Technology -New York- 1998, 31, 235-264. 25. Stohs, S.; Bagchi, D., Oxidative mechanisms in the toxicity of metal ions. Free radical biology and medicine 1995, 18 (2), 321-336. 26. Panichev, N.; Mandiwana, K.; Moema, D.; Molatlhegi, R.; Ngobeni, P., Distribution of vanadium (V) species between soil and plants in the vicinity of vanadium mine. Journal of hazardous materials 2006, 137 (2), 649-653. 27. Keith, S.; Faroon, O.; Roney, N.; Scinicariello, F.; Wilbur, S.; Ingerman, L.; Llados, F.; Plewak, D.; Wohlers, D.; Diamond, G., Toxicological profile for uranium. 2013. 28. Zota, A. R.; Willis, R.; Jim, R.; Norris, G. A.; Shine, J. P.; Duvall, R. M.; Schaider, L. A.; Spengler, J. D., Impact of mine waste on airborne respirable particulates in northeastern Oklahoma, United States. Journal of the Air & Waste Management Association 2009, 59 (11), 1347-1357. 29. Health, U. D. o.; Services, H., Toxicological profile for arsenic. 2000. 30. Extraction of values from ores. Google Patents: 1935. 31. McLeod, C., Uranium Mines and Mills May Have Caused Birth Defects among Navajo Indians. Energy Resources 1985, (12:49), 196-204. 32. Churchill, W., American Indian lands: The Native ethic amid resource development. Environment: Science and Policy for Sustainable Development 1986, 28 (6), 13-34. 33. Gofman, J. W., Radiation and human health. 1981. 34. Organization, W. H., Uranium in drinking-water. Background document for preparation of WHO Guidelines for drinking-water quality. Geneva. World Health Organization (WHO/SDE/WSH/03.04/118) 2003. 35. Domingo, J. L., Reproductive and developmental toxicity of natural and depleted uranium: a review. Reproductive Toxicology 2001, 15 (6), 603-609.
140
36. Hund, L.; Bedrick, E. J.; Miller, C.; Huerta, G.; Nez, T.; Ramone, S.; Shuey, C.; Cajero, M.; Lewis, J., A Bayesian framework for estimating disease risk due to exposure to uranium mine and mill waste on the Navajo Nation. Journal of the Royal Statistical Society: Series A (Statistics in Society) 2015, 178 (4), 1069-1091. 37. EPA, Navajo Nation: Cleaning Up Abandoned Uranium Mines. 2016. 38. Wuana, R.; Okieimen, F.; Imborvungu, J., Removal of heavy metals from a contaminated soil using organic chelating acids. International Journal of Environmental Science & Technology 2010, 7 (3), 485-496. 39. Chenoweth, W. L., The Geology and Production Histroy of the Uranium Deposits in the Toreve A formation, Black Mesa, Apache county, Arizona. 1990. 40. Franczyk, K. J., Stratigraphic revision and depositional environments of the Upper Cretaceous Toreva Formation in the northern Black Mesa area, Navajo and Apache Counties, Arizona. U.S. Geological Survey: Reston, VA 1988. 41. Hostetler, P.; Garrels, R., Transportation and precipitation of uranium and vanadium at low temperatures, with special reference to sandstone-type uranium deposits. Economic Geology 1962, 57 (2), 137-167. 42. Mann, A. Chemical ore genesis models for the precipitation of carnotite in calcrete; Commonwealth Scientific and Industrial Research Organisation: 1974. 43. Hillebrand, W., Carnotite and tyuyamunite and their ores in Colorado and Utah. American Journal of Science 1924, (45), 201-216. 44. Crook, T.; Blake, G., On Carnotite and an associated mineral complex from South Australia. Mineralogical Magazine 1910, 15 (71), 271-284. 45. Sharma, R. K.; Putirka, K. D.; Stone, J. J., Stream sediment geochemistry of the upper Cheyenne River watershed within the abandoned uranium mining region of the southern Black Hills, South Dakota, USA. Environmental Earth Sciences 2016, 75 (9), 1-12. 46. Xu, J.; Zhu, S.-Y.; Luo, T.-Y.; Zhou, W.; Li, Y.-L., Uranium mineralization and its radioactive decay-induced carbonization in a black shale-hosted polymetallic sulfide ore layer, southwest China. Economic Geology 2015, 110 (6), 1643-1652. 47. Abed, A. M.; Saffarini, G. A.; Sadaqah, R. M., Spatial distribution of uranium and vanadium in the upper phosphorite member in Eshidiyya basin, southern Jordan. Arabian Journal of Geosciences 2014, 7 (1), 253-271. 48. Kim, C.; Chi, C.; Miller, S.; Rosales, R.; Sugihara, E.; Akau, J.; Rytuba, J.; Webb, S., (Micro) spectroscopic analyses of particle size dependence on arsenic distribution and speciation in mine wastes. Environmental science & technology 2013, 47 (15), 8164-8171. 49. Nelkin, D., Native Americans and nuclear power. Science, Technology & Human Values 1981, 6 (2), 2-13. 50. Moench, R. H.; Schlee, J. S., Geology and uranium deposits of the Laguna district, New Mexico. US Government Printing Office: 1967. 51. Risser, D. W.; Davis, P. A.; Baldwin, J. A.; McAda, D. P., Aquifer tests at the Jackpile-Paguate uranium mine, Pueblo of Laguna, west-central New Mexico. US Geol. Surv. Water Resour. Invest. Rep 1984, 84 (4255), 26. 52. Maxwell, C. H. In Mesozoic stratigraphy of the Laguna-Grants region, Albuquerque Country II. NM Geol. Soc., 33rd Annual Field Conf, 1982; pp 261-266.
141
53. Nash, J. T., Uranium deposits in the Jackpile Sandstone, New Mexico. Economic Geology 1968, 63 (7), 737-750. 54. Blake, J.; DeVore, C.; Avasarala, S.; Ali, A.-M.; Roldan, C.; Bowers, F.; Spilde, M.; Artyushkova, K.; Kirk, M. F.; Peterson, E., Uranium Mobility and Accumulation along the Rio Paguate, Jackpile Mine in Laguna Pueblo, New Mexico. Environmental Science: Processes & Impacts 2017. 55. Alessi, D. S.; Uster, B.; Veeramani, H.; Suvorova, E. I.; Lezama-Pacheco, J. S.; Stubbs, J. E.; Bargar, J. R.; Bernier-Latmani, R., Quantitative separation of monomeric U (IV) from UO2 in products of U (VI) reduction. Environmental science & technology 2012, 46 (11), 6150-6157. 56. Ilton, E. S.; Boily, J.-F.; Buck, E. C.; Skomurski, F. N.; Rosso, K. M.; Cahill, C. L.; Bargar, J. R.; Felmy, A. R., Influence of dynamical conditions on the reduction of UVI at the magnetite− solution interface. Environmental science & technology 2009, 44 (1), 170-176. 57. Kohler, M.; Curtis, G.; Kent, D.; Davis, J., Experimental investigation and modeling of uranium (VI) transport under variable chemical conditions. Water Resources Research 1996, 32 (12), 3539-3551. 58. Morss, L. R.; Edelstein, N. M.; Fuger, J., The Chemistry of the Actinide and Transactinide Elements (Set Vol. 1-6): Volumes 1-6. Springer Science & Business Media: 2010; Vol. 1. 59. Stumm, W.; Morgan, J. J., Aquatic chemistry: chemical equilibria and rates in natural waters. John Wiley & Sons: 2012; Vol. 126. 60. Langmuir, D., Aqueous Environmental Geochemistry, Prentice Hall, Upper Saddle River, NJ,. 1997, 600. 61. Maurice, P. A., Environmental surfaces and interfaces from the nanoscale to the global scale. Wiley: 2009. 62. Naeem, A.; Westerhoff, P.; Mustafa, S., Vanadium removal by metal (hydr) oxide adsorbents. Water research 2007, 41 (7), 1596-1602. 63. Gerke, T. L.; Scheckel, K. G.; Schock, M. R., Identification and distribution of vanadinite (Pb5 (V5+ O4) 3Cl) in lead pipe corrosion by-products. Environmental science & technology 2009, 43 (12), 4412-4418. 64. Dong, W.; Ball, W. P.; Liu, C.; Wang, Z.; Stone, A. T.; Bai, J.; Zachara, J. M., Influence of calcite and dissolved calcium on uranium (VI) sorption to a Hanford subsurface sediment. Environmental science & technology 2005, 39 (20), 7949-7955. 65. Merritt, R. In The Extractive Metallurgy of Uranium, Colorado School of Mines Research Institute, Library of Congress Catalog Card, 1971. 66. Stewart, B. D.; Nico, P. S.; Fendorf, S., Stability of uranium incorporated into Fe (hydr) oxides under fluctuating redox conditions. Environmental Science & Technology 2009, 43 (13), 4922-4927. 67. Stewart, B. D.; Cismasu, A. C.; Williams, K. H.; Peyton, B. M.; Nico, P. S., Reactivity of uranium and ferrous iron with natural iron oxyhydroxides. Environmental science & technology 2015, 49 (17), 10357-10365. 68. Hsi, C.-k. D.; Langmuir, D., Adsorption of uranyl onto ferric oxyhydroxides: application of the surface complexation site-binding model. Geochimica et Cosmochimica Acta 1985, 49 (9), 1931-1941.

142
69. Hattori, T.; Saito, T.; Ishida, K.; Scheinost, A. C.; Tsuneda, T.; Nagasaki, S.; Tanaka, S., The structure of monomeric and dimeric uranyl adsorption complexes on gibbsite: A combined DFT and EXAFS study. Geochimica et Cosmochimica Acta 2009, 73 (20), 5975-5988. 70. Sachs, S.; Bernhard, G., Sorption of U (VI) onto an artificial humic substance-kaolinite-associate. Chemosphere 2008, 72 (10), 1441-1447. 71. Yang, Y.; Saiers, J. E.; Barnett, M. O., Impact of interactions between natural organic matter and metal oxides on the desorption kinetics of uranium from heterogeneous colloidal suspensions. Environmental science & technology 2013, 47 (6), 2661-2669. 72. Wang, Y.; Frutschi, M.; Suvorova, E.; Phrommavanh, V.; Descostes, M.; Osman, A. A.; Geipel, G.; Bernier-Latmani, R., Mobile uranium (IV)-bearing colloids in a mining-impacted wetland. Nature communications 2013, 4, 2942. 73. Yang, Y.; Saiers, J. E.; Xu, N.; Minasian, S. G.; Tyliszczak, T.; Kozimor, S. A.; Shuh, D. K.; Barnett, M. O., Impact of natural organic matter on uranium transport through saturated geologic materials: from molecular to column scale. Environmental science & technology 2012, 46 (11), 5931-5938. 74. Luo, W.; Gu, B., Dissolution and mobilization of uranium in a reduced sediment by natural humic substances under anaerobic conditions. Environmental science & technology 2008, 43 (1), 152-156. 75. Mibus, J.; Sachs, S.; Pfingsten, W.; Nebelung, C.; Bernhard, G., Migration of uranium (IV)/(VI) in the presence of humic acids in quartz sand: A laboratory column study. Journal of contaminant hydrology 2007, 89 (3), 199-217. 76. Steelink, C., Peer reviewed: investigating humic acids in soils. ACS Publications: 2002. 77. Keiluweit, M.; Kleber, M., Molecular-level interactions in soils and sediments: the role of aromatic π-systems. Environmental science & technology 2009, 43 (10), 3421-3429. 78. McCarthy, J. F.; Zachara, J. M., Subsurface transport of contaminants. Environmental science & technology 1989, 23 (5), 496-502. 79. Kretzschmar, R.; Borkovec, M.; Grolimund, D.; Elimelech, M., Mobile subsurface colloids and their role in contaminant transport. Advances in agronomy 1999, 66, 121-193. 80. Bone, S. E.; Dynes, J. J.; Cliff, J.; Bargar, J. R., Uranium (IV) adsorption by natural organic matter in anoxic sediments. Proceedings of the National Academy of Sciences 2017, 201611918. 81. Bhattacharyya, A.; Campbell, K. M.; Kelly, S. D.; Roebbert, Y.; Weyer, S.; Bernier-Latmani, R.; Borch, T., Biogenic non-crystalline U (IV) revealed as major component in uranium ore deposits. Nature Communications 2017, 8. 82. Mikutta, C.; Langner, P.; Bargar, J. R.; Kretzschmar, R., Tetra-and hexavalent uranium forms bidentate-mononuclear complexes with particulate organic matter in a naturally uranium-enriched peatland. Environmental science & technology 2016, 50 (19), 10465-10475. 83. Bargar, J. R.; Williams, K. H.; Campbell, K. M.; Long, P. E.; Stubbs, J. E.; Suvorova, E. I.; Lezama-Pacheco, J. S.; Alessi, D. S.; Stylo, M.; Webb, S. M., Uranium
143
redox transition pathways in acetate-amended sediments. Proceedings of the National Academy of Sciences 2013, 110 (12), 4506-4511. 84. Veeramani, H.; Alessi, D. S.; Suvorova, E. I.; Lezama-Pacheco, J. S.; Stubbs, J. E.; Sharp, J. O.; Dippon, U.; Kappler, A.; Bargar, J. R.; Bernier-Latmani, R., Products of abiotic U (VI) reduction by biogenic magnetite and vivianite. Geochimica et Cosmochimica Acta 2011, 75 (9), 2512-2528. 85. Lovley, D. R.; Phillips, E. J., Microbial reduction of uranium. Nature 1991, 350 (6317), 413. 86. Bargar, J. R.; Bernier-Latmani, R.; Giammar, D. E.; Tebo, B. M., Biogenic uraninite nanoparticles and their importance for uranium remediation. Elements 2008, 4 (6), 407-412. 87. O'Loughlin, E. J.; Kelly, S. D.; Cook, R. E.; Csencsits, R.; Kemner, K. M., Reduction of uranium (VI) by mixed iron (II)/iron (III) hydroxide (green rust): formation of UO2 nanoparticles. Environmental science & technology 2003, 37 (4), 721-727. 88. Nenoff, T. M.; Jacobs, B. W.; Robinson, D. B.; Provencio, P. P.; Huang, J.; Ferreira, S.; Hanson, D. J., Synthesis and low temperature in situ sintering of uranium oxide nanoparticles. Chemistry of Materials 2011, 23 (23), 5185-5190. 89. Mkandawire, M.; Dudel, E. G., Natural occurring uranium nanoparticles and the implication in bioremediation of surface mine waters. Uranium, Mining and Hydrogeology 2008, 487-496. 90. Schindler, M.; Lussier, A. J.; Bellrose, J.; Rouvimov, S.; Burns, P. C.; Kyser, T. K., Mobilization and agglomeration of uraninite nanoparticles: A nano-mineralogical study of samples from the Matoush Uranium ore deposit. American Mineralogist 2017, 102 (9), 1776-1787. 91. Singh, A.; Catalano, J. G.; Ulrich, K.-U.; Giammar, D. E., Molecular-scale structure of uranium (VI) immobilized with goethite and phosphate. Environmental science & technology 2012, 46 (12), 6594-6603. 92. Troyer, L. D.; Maillot, F.; Wang, Z.; Wang, Z.; Mehta, V. S.; Giammar, D. E.; Catalano, J. G., Effect of phosphate on U (VI) sorption to montmorillonite: Ternary complexation and precipitation barriers. Geochimica et Cosmochimica Acta 2016, 175, 86-99. 93. Tokunaga, T. K.; Kim, Y.; Wan, J., Potential remediation approach for uranium-contaminated groundwaters through potassium uranyl vanadate precipitation. Environmental science & technology 2009, 43 (14), 5467-5471. 94. Giammar, D. E.; Hering, J. G., Time scales for sorption− desorption and surface precipitation of uranyl on goethite. Environmental science & technology 2001, 35 (16), 3332-3337. 95. Singer, D. M.; Zachara, J. M.; Brown Jr, G. E., Uranium speciation as a function of depth in contaminated Hanford sediments-A micro-XRF, micro-XRD, and micro-and bulk-XAFS study. Environmental science & technology 2009, 43 (3), 630-636. 96. Buck, E. C.; Brown, N. R.; Dietz, N. L., Contaminant uranium phases and leaching at the Fernald site in Ohio. Environmental science & technology 1995, 30 (1), 81-88. 97. Kanematsu, M.; Perdrial, N.; Um, W.; Chorover, J.; O’Day, P. A., Influence of phosphate and silica on U (VI) precipitation from acidic and neutralized wastewaters. Environmental science & technology 2014, 48 (11), 6097-6106.
144
98. Avasarala, S.; Lichtner, P. C.; Ali, A.-M. S.; González-Pinzón, R.; Blake, J. M.; Cerrato, J. M., Reactive Transport of U and V from Abandoned Uranium Mine Wastes. Environmental Science & Technology 2017. 99. Minelli, L.; Veschetti, E.; Giammanco, S.; Mancini, G.; Ottaviani, M., Vanadium in Italian waters: monitoring and speciation of V (IV) and V (V). Microchemical journal 2000, 67 (1), 83-90. 100. Schock, M.; Kelly, K. In Vanadium chemistry essentials for treatment studies, USEPA Inorganics Workshop, 2002. 101. Veschetti, E.; Maresca, D.; Lucentini, L.; Ferretti, E.; Citti, G.; Ottaviani, M., Monitoring of V (IV) and V (V) in Etnean drinking-water distribution systems by solid phase extraction and electrothermal atomic absorption spectrometry. Microchemical journal 2007, 85 (1), 80-87. 102. Wehrli, B.; Stumm, W., Vanadyl in natural waters: adsorption and hydrolysis promote oxygenation. Geochimica et Cosmochimica Acta 1989, 53 (1), 69-77. 103. Baes Jr, C.; Mesmer, R., T he Hydrolysis of Cations. Wiley, New York: 1976. 104. Burke, I. T.; Mayes, W. M.; Peacock, C. L.; Brown, A. P.; Jarvis, A. P.; Gruiz, K., Speciation of arsenic, chromium, and vanadium in red mud samples from the Ajka spill site, Hungary. Environmental science & technology 2012, 46 (6), 3085-3092. 105. Catana, G.; Rao, R. R.; Weckhuysen, B. M.; Van Der Voort, P.; Vansant, E.; Schoonheydt, R. A., Supported vanadium oxide catalysts: Quantitative spectroscopy, preferential adsorption of V4+/5+, and Al2O3 coating of zeolite Y. The Journal of Physical Chemistry B 1998, 102 (41), 8005-8012. 106. Manohar, D.; Noeline, B.; Anirudhan, T., Removal of vanadium (IV) from aqueous solutions by adsorption process with aluminum-pillared bentonite. Industrial & engineering chemistry research 2005, 44 (17), 6676-6684. 107. Davis, J. A.; Meece, D. E.; Kohler, M.; Curtis, G. P., Approaches to surface complexation modeling of uranium (VI) adsorption on aquifer sediments. Geochim Cosmochim Ac 2004, 68 (18), 3621-3641. 108. Curtis, G. P.; Davis, J. A.; Naftz, D. L., Simulation of reactive transport of uranium (VI) in groundwater with variable chemical conditions. Water Resources Research 2006, 42 (4). 109. Qafoku, N. P.; Zachara, J. M.; Liu, C.; Gassman, P. L.; Qafoku, O. S.; Smith, S. C., Kinetic desorption and sorption of U (VI) during reactive transport in a contaminated Hanford sediment. Environmental science & technology 2005, 39 (9), 3157-3165. 110. Hammond, G. E.; Lichtner, P. C., Field‐scale model for the natural attenuation of uranium at the Hanford 300 Area using high‐performance computing. Water Resources Research 2010, 46 (9). 111. Zachara, J. M.; Chen, X.; Murray, C.; Hammond, G., River stage influences on uranium transport in a hydrologically dynamic groundwater‐surface water transition zone. Water Resources Research 2016. 112. Stubbs, J. E.; Veblen, L. A.; Elbert, D. C.; Zachara, J. M.; Davis, J. A.; Veblen, D. R., Newly recognized hosts for uranium in the Hanford Site vadose zone. Geochim Cosmochim Ac 2009, 73 (6), 1563-1576. 113. Wolff-Boenisch, D.; Gislason, S. R.; Oelkers, E. H., The effect of crystallinity on dissolution rates and CO2 consumption capacity of silicates. Geochimica et Cosmochimica Acta 2006, 70 (4), 858-870.
145
114. Stefánsson, A.; Gíslason, S. R., Chemical weathering of basalts, Southwest Iceland: effect of rock crystallinity and secondary minerals on chemical fluxes to the ocean. American Journal of Science 2001, 301 (6), 513-556. 115. Gorman-Lewis, D.; Burns, P. C.; Fein, J. B., Review of uranyl mineral solubility measurements. The Journal of Chemical Thermodynamics 2008, 40 (3), 335-352. 116. Abraham, F.; Dion, C.; Saadi, M., Carnotite analogues: synthesis, structure and properties of the Na1–x K xUO2VO4 solid solution (0⩽ x⩽ 1). Journal of Materials Chemistry 1993, 3 (5), 459-463. 117. Weigel, F.; Hoffmann, G., The phosphates and arsenates of hexavalent actinides. Part I. Uranium. Journal of the Less Common Metals 1976, 44, 99-123. 118. Plášil, J.; Veselovský, F.; Hloušek, J.; Škoda, R.; Novák, M.; Sejkora, J.; Čejka, J.; Škácha, P.; Kasatkin, A. V., Mathesiusite, K5(UO2)4(SO4)4(VO5)(H2O)4, a new uranyl vanadate-sulfate from Jachymov, Czech Republic. American Mineralogist 2014, 99 (4), 625-632. 119. Karyakin, N.; Chernorukov, N.; Suleimanov, E.; Alimzhanov, M., Chemical thermodynamics of alkaline-earth metal uranovanadates. Radiochemistry 2003, 45 (5), 457-468. 120. Burns, P. C., U6+ minerals and inorganic compounds: insights into an expanded structural hierarchy of crystal structures. The Canadian Mineralogist 2005, 43 (6), 1839-1894. 121. Krivovichev, S. V.; Plášil, J., Mineralogy and crystallography of uranium. Uranium: From Cradle to Grave. Mineralogical Association of Canada Short Courses 2013, 43, 15-119. 122. Troyer, L. D.; Stone, J. J.; Borch, T., Effect of biogeochemical redox processes on the fate and transport of As and U at an abandoned uranium mine site: an X-ray absorption spectroscopy study. Environmental Chemistry 2014, 11 (1), 18-27. 123. Stokes, W. L., Carnotite Deposits in the Carrizo Mountains Area, Navajo Indian Reservation, Apache County, Arizona and San Juan County, New Mexico. USGS Circular 1951, 111. 124. Dixon, E. The Legacy Uranium Mining and Milling Cleanup Plan: Evaluation of the EPA Five-Year Plan, Grants Mining District, New Mexico. 2015 125. Dawson, S. E., Navajo Uranium Workers and the Effects of Occupational Illnesses - a Case-Study. Hum Organ 1992, 51 (4), 389-397. 126. Hopenhayn, C., Arsenic in drinking water: Impact on human health. Elements 2006, 2 (2), 103-107. 127. Chenoweth, W., Vanadium mining in the Carrizo Mountains, 1942-1947. San Juan County, New Mexico and Apache County Arizona: New Mexico Bureau of Mines and Mineral Resources, Open-file Report 1991, 378, 33. 128. Dong, W.; Brooks, S. C., Determination of the Formation Constants of Ternary Complexes of Uranyl and Carbonate with Alkaline Earth Metals (Mg2+, Ca2+, Sr2+, and Ba2+) Using Anion Exchange Method. Environmental Science & Technology 2006, 40 (15), 4689-4695. 129. Bargar, J. R.; Reitmeyer, R.; Davis, J. A., Spectroscopic confirmation of uranium (VI)-carbonato adsorption complexes on hematite. Environmental Science & Technology 1999, 33 (14), 2481-2484.
146
130. Peacock, C. L.; Sherman, D. M., Vanadium (V) adsorption onto goethite (α-FeOOH) at pH 1.5 to 12: a surface complexation model based on ab initio molecular geometries and EXAFS spectroscopy. Geochim Cosmochim Ac 2004, 68 (8), 1723-1733. 131. Sylwester, E.; Hudson, E.; Allen, P., The structure of uranium (VI) sorption complexes on silica, alumina, and montmorillonite. Geochimica et Cosmochimica Acta 2000, 64 (14), 2431-2438. 132. Liu, C.; Shang, J.; Shan, H.; Zachara, J. M., Effect of subgrid heterogeneity on scaling geochemical and biogeochemical reactions: A case of U (VI) desorption. Environmental science & technology 2014, 48 (3), 1745-1752. 133. Kosmulski, M., pH-dependent surface charging and points of zero charge: III. Update. Journal of Colloid and Interface Science 2006, 298 (2), 730-741. 134. Schroth, B. K.; Sposito, G. In Surface charge properties of kaolinite, MRS Proceedings, Cambridge Univ Press: 1996; p 87. 135. Bernier-Latmani, R.; Veeramani, H.; Vecchia, E. D.; Junier, P.; Lezama-Pacheco, J. S.; Suvorova, E. I.; Sharp, J. O.; Wigginton, N. S.; Bargar, J. R., Non-uraninite products of microbial U (VI) reduction. Environmental science & technology 2010, 44 (24), 9456-9462. 136. Hansley, P. L.; Spirakis, C. S., Organic matter diagenesis as the key to a unifying theory for the genesis of tabular uranium-vanadium deposits in the Morrison Formation, Colorado Plateau. Economic Geology 1992, 87 (2), 352-365. 137. Franczyk, K. J., Stratigraphic revision and depositional environments of the Upper Cretaceous Toreva Formation in the northern Black Mesa area, Navajo and Apache Counties, Arizona. 1988. 138. Giammar, D. E.; Hering, J. G., Time scales for sorption-desorption and surface precipitation of uranyl on goethite. Environmental science & technology 2001, 35 (16), 3332-3337. 139. Tokunaga, T. K.; Kim, Y.; Wan, J.; Yang, L., Aqueous uranium (VI) concentrations controlled by calcium uranyl vanadate precipitates. Environmental science & technology 2012, 46 (14), 7471-7477. 140. Langmuir, D., Aqueous environmental geochemistry. 1997. 141. Liu, C.; Zachara, J. M.; Qafoku, N. P.; Wang, Z., Scale‐dependent desorption of uranium from contaminated subsurface sediments. Water Resources Research 2008, 44 (8). 142. Steefel, C. I.; DePaolo, D. J.; Lichtner, P. C., Reactive transport modeling: An essential tool and a new research approach for the Earth sciences. Earth and Planetary Science Letters 2005, 240 (3), 539-558. 143. Shabansefidan, F.; Reddy, M. A., Investigation of Uranium Solubility and its Transport Path in the Razgah Basin’s Groundwater in the Northwest of Iran, Using Saturation Indexes. 144. Puigdomenech, I.; Bruno, J., Modelling uranium solubilities in aqueous solutions: Validation of a thermodynamic data base for the EQ3/6 geochemical codes. Swedish Nuclear Fuel and Waste Management Company: 1988. 145. Kubatko, K.-A.; Helean, K. B.; Navrotsky, A.; Burns, P. C., Thermodynamics of uranyl minerals: Enthalpies of formation of rutherfordine, UO2CO3, andersonite, Na2CaUO2(CO3)3(H2O)5, and grimselite, K3NaUO2 (CO3) 3H2O. American Mineralogist 2005, 90 (8-9), 1284-1290.
147
146. Bond, D. L.; Davis, J. A.; Zachara, J. M., Uranium (VI) release from contaminated vadose zone sediments: Estimation of potential contributions from dissolution and desorption. Developments in Earth and Environmental Sciences 2007, 7, 375-416. 147. Lollar, B. S., Environmental geochemistry. Elsevier: 2005; Vol. 9. 148. Riba, O.; Walker, C.; Ragnarsdottir, K. V., Kinetic studies of synthetic metaschoepite under acidic conditions in batch and flow experiments. Environmental science & technology 2005, 39 (20), 7915-7920. 149. Yoshida, S.; Iguchi, T.; Ishida, S.; Tarama, K., Some physico-chemical properties of vanadium oxide supported on silica or γ-alumina. Bulletin of the Chemical Society of Japan 1972, 45 (2), 376-380. 150. Langmuir, D., Uranium solution-mineral equilibria at low temperatures with applications to sedimentary ore deposits. Geochim Cosmochim Ac 1978, 42 (6), 547-569. 151. Hochella, M. F.; Lower, S. K.; Maurice, P. A.; Penn, R. L.; Sahai, N.; Sparks, D. L.; Twining, B. S., Nanominerals, mineral nanoparticles, and earth systems. science 2008, 319 (5870), 1631-1635. 152. Um, W.; Wang, Z.; Serne, R. J.; Williams, B. D.; Brown, C. F.; Dodge, C. J.; Francis, A. J., Uranium phases in contaminated sediments below Hanford’s U tank farm. Environmental science & technology 2009, 43 (12), 4280-4286. 153. Delemos, J. L.; Bostick, B. C.; Quicksall, A. N.; Landis, J. D.; George, C. C.; Slagowski, N. L.; Rock, T.; Brugge, D.; Lewis, J.; Durant, J. L., Rapid dissolution of soluble uranyl phases in arid, mine-impacted catchments near Church Rock, NM. Environmental science & technology 2008, 42 (11), 3951-3957. 154. Goss, K.-U., The p K a values of PFOA and other highly fluorinated carboxylic acids. Environmental science & technology 2007, 42 (2), 456-458. 155. Kim, K.-W.; Hyun, J.-T.; Lee, K.-Y.; Lee, E.-H.; Lee, K.-W.; Song, K.-C.; Moon, J.-K., Effects of the different conditions of uranyl and hydrogen peroxide solutions on the behavior of the uranium peroxide precipitation. Journal of hazardous materials 2011, 193, 52-58. 156. Schoonen, M.; Barnes, H., Reactions forming pyrite and marcasite from solution: I. Nucleation of FeS 2 below 100 C. Geochim Cosmochim Ac 1991, 55 (6), 1495-1504. 157. Lippmann, F., Sedimentary carbonate minerals. Springer Science & Business Media: 2012; Vol. 6. 158. Smith, S. C.; Douglas, M.; Moore, D. A.; Kukkadapu, R. K.; Arey, B. W., Uranium extraction from laboratory-synthesized, uranium-doped hydrous ferric oxides. Environmental science & technology 2009, 43 (7), 2341-2347. 159. Ilton, E. S.; Zachara, J. M.; Moore, D. A.; Mckinley, J. P.; Eckberg, A. D.; Cahill, C. L.; Felmy, A. R., Dissolution study of metatorbernite: Thermodynamic properties and the effect of pH and phosphate. Environmental science & technology 2010, 44 (19), 7521-7526. 160. Graham, J.; Butt, C.; Vigers, R., Sub‐surface charging, a source of error in microprobe analysis. X‐Ray Spectrometry 1984, 13 (3), 126-133. 161. Stubbs, J. E.; Post, J. E.; Elbert, D. C.; Heaney, P. J.; Veblen, D. R., Uranyl phosphate sheet reconstruction during dehydration of metatorbernite [Cu(UO2)2(PO4)2·8H2O]. American Mineralogist 2010, 95 (8-9), 1132-1140.
148
162. Barton Jr, P. B. Synthesis and properties of carnotite and its alkali analogues; 1957. 163. Abraham, F.; Dion, C.; Tancret, N.; Saadi, M. In Ag2(UO2)2V2O8: a new compound with the carnotite structure. Synthesis, structure and properties, Advanced Materials Research, Trans Tech Publ: 1994; pp 511-520. 164. Obbade, S.; Dion, C.; Duvieubourg, L.; Saadi, M.; Abraham, F., Synthesis and crystal structure of α and β-Rb 6 U 5 V 2 O 23, a new layered compound. Journal of Solid State Chemistry 2003, 173 (1), 1-12. 165. Murata, K.; CISNEY, E.; Stieff, L.; Zworykin, E. In Hydration and Base-Exchange Properties of Carnotite, Tyuyamunite and Related Compounds, Geologican Society of America Bulltetin, Assoc Engineering Geologists Geological society Amer Texas A & M Univ, Dept Geology $ Geophysics, College Stn, TX77843-3115: 1950; pp 1489-1490. 166. Piret, P.; Declerq, J.; Wautersstoop, D., Crystal Structure of Sengierite, Bulletin De Mineralogie 1980, 103 (2), 176-178. 167. Ginderow, D.; Cesbron, F., Structure de la demesmaekerite, Pb2Cu5(SeO3)6(UO2)2(OH)6.2H2O. Acta Crystallographica Section C: Crystal Structure Communications 1983, 39 (7), 824-827. 168. Borene, J., Crystal Structure Of Nickel Uranyl Vanadate Tetrahydrate Ni(UO2)2(VO4) 2.4H2O. Bulletin De La Societe Franciase Mineralogie Et Dt Cristallographie 1970, 93 (4), 426. 169. Dickens, P. G.; Stuttard, G. P.; Ball, R. G.; Powell, A. V.; Hull, S.; Patat, S., Powder neutron diffraction study of the mixed uranium–vanadium oxides Cs2(UO2)2(V2O8) and UVO5. Journal of Materials Chemistry 1992, 2 (2), 161-166. 170. Spano, T. L.; Dzik, E. A.; Sharifironizi, M.; Dustin, M. K.; Turner, M.; Burns, P. C., Thermodynamic investigation of uranyl vanadate minerals: Implications for structural stability. American Mineralogist 2017, 102 (6), 1149-1153. 171. Frost, R. L.; Čejka, J.; Weier, M. L.; Martens, W.; Henry, D. A., Vibrational spectroscopy of selected natural uranyl vanadates. Vibrational spectroscopy 2005, 39 (2), 131-138. 172. Senchyk, G.; Wylie, E.; Prizio, S.; Szymanowski, J.; Sigmon, G.; Burns, P., Hybrid uranyl–vanadium nano-wheels. Chemical Communications 2015, 51 (50), 10134-10137. 173. Catalano, J. G.; Brown, G. E., Analysis of uranyl-bearing phases by EXAFS spectroscopy: Interferences, multiple scattering, accuracy of structural parameters, and spectral differences. American Mineralogist 2004, 89 (7), 1004-1021. 174. Burns, P. C.; Ewing, R. C.; Miller, M. L., Incorporation mechanisms of actinide elements into the structures of U6+ phases formed during the oxidation of spent nuclear fuel. Journal of Nuclear materials 1997, 245 (1), 1-9. 175. McGuire, A. V.; Francis, C. A.; Dyar, M. D., Mineral standards for electron microprobe analysis of oxygen. American Mineralogist 1992, 77, 1087-1087. 176. Jarosewich, E., Smithsonian microbeam standards. Journal of Research of the National Institute of Standards and Technology 2002, 107 (6), 681. 177. Donovan, J. J.; Snyder, D. A.; Rivers, M. L. In An improved interference correction for trace element analysis, Proceedings of the Annual Meeting-Electron Microscopy Society of America, San Francisco Press: 1992; pp 1646-1646.
149
178. Donovan, J. J.; Lowers, H. A.; Rusk, B. G., Improved electron probe microanalysis of trace elements in quartz. American Mineralogist 2011, 96 (2-3), 274-282. 179. Bastin, G.; Heijligers, H., Quantitative electron probe microanalysis of carbon in binary carbides. I—principles and procedures. X‐Ray Spectrometry 1986, 15 (2), 135-141. 180. Poppe, L.; Paskevich, V.; Hathaway, J.; Blackwood, D., A laboratory manual for X-ray powder diffraction. US Geological Survey Open-File Report 2001, 1 (041), 1-88. 181. Abreu, N. M.; Brearley, A. J., Early solar system processes recorded in the matrices of two highly pristine CR3 carbonaceous chondrites, MET 00426 and QUE 99177. Geochim. Cosmochim. Acta 2010, 74 (3), 1146-1171. 182. Anthony, J. W., Handbook of mineralogy: Arsenates, phosphates, vanadates. arsenates, phosphates, vanadates. Mineral Data Pub.: 2000; Vol. 4. 183. Nasdala, L.; Kronz, A.; Wirth, R.; Váczi, T.; Pérez-Soba, C.; Willner, A.; Kennedy, A. K., The phenomenon of deficient electron microprobe totals in radiation-damaged and altered zircon. Geochim Cosmochim Ac 2009, 73 (6), 1637-1650. 184. Jones, A.; Palmer, D.; Islam, M.; Mortimer, M., Alkali ion migration in albite and K-feldspar. Physics and Chemistry of Minerals 2004, 31 (5), 313-320. 185. Craw, D., Oxidation and microprobe-induced potassium mobility in iron-bearing phyllosilicates from the Otago schists, New Zealand. Lithos 1981, 14 (1), 49-57. 186. Katrinak, K.; Rez, P.; Buseck, P., Structural variations in individual carbonaceous particles from an urban aerosol. Environmental science & technology 1992, 26 (10), 1967-1976. 187. Comelli, G.; Stöhr, J.; Robinson, C.; Jark, W., Structural studies of argon-sputtered amorphous carbon films by means of extended x-ray-absorption fine structure. Physical Review B 1988, 38 (11), 7511. 188. Sundberg, I.; Sillén, L., On the Crystal Structure of KUO2VO4 (Synthetic Anhydrous Carnotite). Arkiv Kemi 1950, 1. 189. Stern, T.; Stieff, L.; Girhard, M.; Meyrowitz, R., The Occurrence And Properties of Metatyuyamunite, Ca(UO2)2(VO 4)2.3-5H2O. Am. Mineralogist 1956, 41. 190. Donnay, G.; Donnay, J. In Tyuyamunite, Carnotite, And Sengierite, American Mineralogist, Mineralogical Soc Amer 1015 Eighteenth ST, NW suite 601, Washington, DC 20036: 1954; pp 323-324. 191. Hilpert, L. S.; Moench, R. H., Uranium deposits of the southern part of the San Juan Basin, New Mexico. Economic Geology 1960, 55 (3), 429-464. 192. Laverty, R.; Ashwill, W.; Chenoweth, W.; Norton, D., Ore processes. Geology and technology of the Grants uranium region: New Mexico Bureau of Mines and Mineral Resources Memoir 1963, 15, 191-204. 193. Kittel, D. F., Geology of the Jackpile mine area. Geology and Technology of the Grants Uranium Region, Memoir 1963, 15. 194. Zehner, H. H., Hydrology and water-quality monitoring considerations, Jackpile uranium mine, northwestern New Mexico. 1985. 195. Adams, S.; Curtis, H.; Hafen, P.; Salek-Nejad, H., Interpretation of postdepositional processes related to the formation and destruction of the Jackpile-Paguate uranium deposit, northwest New Mexico. Economic Geology 1978, 73 (8), 1635-1654.

150
196. Kelley, V. C., Geology and technology of the Grants uranium region. State Bureau of Mines and Mineral Resources: Society of Economic Geologists, 1963. 197. Ginder-Vogel, M.; Criddle, C. S.; Fendorf, S., Thermodynamic constraints on the oxidation of biogenic UO2 by Fe (III)(hydr) oxides. Environmental science & technology 2006, 40 (11), 3544-3550. 198. Deditius, A. P.; Utsunomiya, S.; Ewing, R. C., The chemical stability of coffinite, USiO 4·nH2O; 0<n<2, associated with organic matter: A case study from Grants uranium region, New Mexico, USA. Chemical Geology 2008, 251 (1), 33-49. 199. Ruiz, O.; Thomson, B. M.; Cerrato, J. M., Investigation of in situ leach (ISL) mining of uranium in New Mexico and post-mining reclamation. New Mexico Geology 2016, 38 (4). 200. Learn, D.; Brestel, E.; Seetharama, S., Hypochlorite scavenging by Pseudomonas aeruginosa alginate. Infection and immunity 1987, 55 (8), 1813-1818. 201. Schultz, M. K.; Burnett, W. C.; Inn, K. G., Evaluation of a sequential extraction method for determining actinide fractionation in soils and sediments. Journal of Environmental Radioactivity 1998, 40 (2), 155-174. 202. Blanco, P.; Tome, F. V.; Lozano, J., Fractionation of natural radionuclides in soils from a uranium mineralized area in the south-west of Spain. Journal of environmental radioactivity 2005, 79 (3), 315-330. 203. Schecher, W.; MINEQL, D. M., A Chemical Equilibrium Modeling System, Version 4.6, 4.5. Environmental Research Software: Hallowell, ME 2007. 204. Grenthe, I.; Fuger, J.; Konings, R.; Lemire, R.; Muller, A.; Nguyen-Trung, C., Chemical Thermodynamics of Uranium, edited by H. Wanner and I. Forest (North Holland, Amsterdam, 1992) 1992. 205. Guillaumont, R.; Mompean, F. J., Update on the chemical thermodynamics of uranium, neptunium, plutonium, americium and technetium. 2003. 206. Dong, W.; Brooks, S. C., Formation of aqueous MgUO2(CO3)3
2− complex and uranium anion exchange mechanism onto an exchange resin. Environmental science & technology 2008, 42 (6), 1979-1983. 207. Ilton, E. S.; Bagus, P. S., XPS determination of uranium oxidation states. Surface and Interface Analysis 2011, 43 (13), 1549-1560. 208. Uyuşur, B.; Li, C.; Baveye, P. C.; Darnault, C. J., pH-dependent reactive transport of uranium (VI) in unsaturated sand. Journal of soils and sediments 2015, 15 (3), 634-647. 209. Bi, Y.; Hayes, K. F., Surface passivation limited UO2 oxidative dissolution in the presence of FeS. Environmental science & technology 2014, 48 (22), 13402-13411. 210. Wang, G.; Um, W.; Wang, Z.; Reinoso-Maset, E.; Washton, N. M.; Mueller, K. T.; Perdrial, N.; O'Day, P. A.; Chorover, J., Uranium Release from Acidic Weathered Hanford Sediments: Single-Pass Flow-Through and Column Experiments. Environmental Science & Technology 2017. 211. Gorman-Lewis, D.; Shvareva, T.; Kubatko, K.-A.; Burns, P. C.; Wellman, D. M.; McNamara, B.; Szymanowski, J. E.; Navrotsky, A.; Fein, J. B., Thermodynamic properties of autunite, uranyl hydrogen phosphate, and uranyl orthophosphate from solubility and calorimetric measurements. Environmental science & technology 2009, 43 (19), 7416-7422.
151
212. Liu, C.; Zachara, J. M.; Qafoku, O.; McKinley, J. P.; Heald, S. M.; Wang, Z., Dissolution of uranyl microprecipitates in subsurface sediments at Hanford Site, USA. Geochimica et Cosmochimica Acta 2004, 68 (22), 4519-4537. 213. Lichtner, P. C., Continuum model for simultaneous chemical reactions and mass transport in hydrothermal systems. Geochim Cosmochim Ac 1985, 49 (3), 779-800. 214. Lichtner, P. C., Kinetic rate laws invariant to scaling the mineral formula unit. American Journal of Science 2016, 316 (5), 437-469. 215. Lasaga, A. C., Chemical kinetics of water‐rock interactions. Journal of geophysical research: solid earth 1984, 89 (B6), 4009-4025. 216. Brantley, S. L., Kinetics of mineral dissolution. In Kinetics of water-rock interaction, Springer: 2008; pp 151-210. 217. Bai, J.; Liu, C.; Ball, W. P., Study of sorption-retarded U (VI) diffusion in Hanford silt/clay material. Environmental science & technology 2009, 43 (20), 7706-7711. 218. Appelo, C. A. J.; Postma, D., Geochemistry, groundwater and pollution. CRC press: 2004. 219. Shock, E. L.; Helgeson, H. C., Calculation of the thermodynamic and transport properties of aqueous species at high pressures and temperatures: Correlation algorithms for ionic species and equation of state predictions to 5 kb and 1000 C. Geochim Cosmochim Ac 1988, 52 (8), 2009-2036. 220. Ulrich, K.-U.; Singh, A.; Schofield, E. J.; Bargar, J. R.; Veeramani, H.; Sharp, J. O.; Bernier-Latmani, R.; Giammar, D. E., Dissolution of biogenic and synthetic UO2 under varied reducing conditions. Environmental science & technology 2008, 42 (15), 5600-5606. 221. Cox, J.; Wagman, D. D.; Medvedev, V. A., Codata key values for thermodynamics. Chem/Mats-Sci/E: 1989. 222. Pokrovskii, V. A.; Helgeson, H. C., Thermodynamic properties of aqueous species and the solubilities of minerals at high pressures and temperatures; the system Al2O3-H2O-NaCl. American Journal of Science 1995, 295 (10), 1255-1342. 223. Baes, C. F.; Mesmer, R. E., Hydrolysis of cations. Wiley: 1976. 224. Johnson, J. W.; Oelkers, E. H.; Helgeson, H. C., SUPCRT92: A software package for calculating the standard molal thermodynamic properties of minerals, gases, aqueous species, and reactions from 1 to 5000 bar and 0 to 1000 C. Computers & Geosciences 1992, 18 (7), 899-947. 225. Wagman, D. D.; Evans, W. H.; Parker, V. B.; Schumm, R. H.; Halow, I. The NBS tables of chemical thermodynamic properties. Selected values for inorganic and C1 and C2 organic substances in SI units; DTIC Document: 1982. 226. Turner, D.; Whitfield, M.; Dickson, A., The equilibrium speciation of dissolved components in freshwater and sea water at 25 C and 1 atm pressure. Geochim Cosmochim Ac 1981, 45 (6), 855-881. 227. Mattigod, S. V.; Sposito, G., Chemical modeling of trace metal equilibria in contaminated soil solutions using the computer program Geochem. ACS Publications: 1979. 228. Grenthe, I.; Fuger, J.; Konings, R. J.; Lemire, R. J.; Muller, A. B.; Nguyen-Trung, C.; Wanner, H., Chemical thermodynamics of uranium. North-Holland Amsterdam: 1992; Vol. 1.

152
229. Bernhard, G.; Geipel, G.; Reich, T.; Brendler, V.; Amayri, S.; Nitsche, H., Uranyl (VI) carbonate complex formation: Validation of the Ca2UO2 (CO3) 3 (aq.) species. Radiochimica Acta 2001, 89 (8), 511-518. 230. Israel, Y.; Meites, L.; Bard, A., Encyclopedia of Electrochemistry of the Elements. Vol. 7Dekker, New York 1976, 293. 231. Sergeyeva, E.; Khodakovskiy, I., Physicochemical conditions of formation of native arsenic in hydrothermal deposits. 1969. 232. Helgeson, H. C., Summary and critique of the thermodynamic properties of rock-forming minerals. American Journal of Science 1978, 278, 1-229. 233. Casas, I.; Bruno, J.; Cera, E.; Finch, R. J.; Ewing, R. C., Characterization and dissolution behavior of a becquerelite from Shinkolobwe, Zaire. Geochim Cosmochim Ac 1997, 61 (18), 3879-3884. 234. Robie, R. A.; Hemingway, B. S. Thermodynamic properties of minerals and related substances at 298.15 K and 1 bar (10^ 5 Pascals) pressure and at higher temperatures; USGPO; For sale by US Geological Survey, Information Services: 1995. 235. Stumm, W.; Morgan, J., Aquatic Chemistry. Interscience, New York: 1970. 236. Meinrath, G.; Kimura, T., Behaviour of U (VI) solids under conditions of natural aquatic systems. Inorganica chimica acta 1993, 204 (1), 79-85.