Embed Size (px)
Citation preview

1
Physical, Chemical, and In Vitro Toxicological Characterization of Nanoparticles in Chemical Mechanical Planarization Suspensions Used in the
Semiconductor Industry: Towards Environmental Health and Safety Assessments
David Speed 1, Paul Westerhoff 2*, Reyes Sierra-Alvarez 3, Rockford Draper 4, Paul Pantano 4,
Shyam Aravamudhan 5, Kai Loon Chen 6, Kiril Hristovski 2, Pierre Herckes 2, Xiangyu Bi 2, Yu Yang 2, Chao Zeng 3, Lila Otero-Gonzalez 3, Carole Mikoryak 4, Blake A. Wilson 4, Karshak Kosaraju 5, Mubin Tarannum 5, Steven Crawford 5, Peng Yi 6,9, Xitong Liu 6,
S.V. Babu 7, Mansour Moinpour 8, James Ranville 10, Manuel Montano 10, Charlie Corredor 11, Jonathan Posner 11, and Farhang Shadman 3
* Indicates corresponding author: Paul Westerhoff, Arizona State University, School of Sustainable Engineering & The Built Environment, PO Box 873005, Tempe, AZ 85287-3005; phone: 480-965-2885; email: [email protected] 1 IBM Microelectronics, Systems and Technology Group (Hopewell Jct., NY) 2 Arizona State University (Tempe, AZ) 3 University of Arizona (Tucson, AZ) 4 University of Texas at Dallas (Richardson, TX) 5 North Carolina A&T State University (Greensboro, North Carolina) 6 Johns Hopkins University (Baltimore, MD) 7 Clarkson University (Potsdam, NY) 8 Intel Corporation (Santa Clara, CA) 9 Current address: Department of Civil, Environmental and Geomatics Engineering, Florida Atlantic University, Boca Raton, Florida 33431 10 Colorado School of Mines (Golden, CO) 11 University of Washington (Seattle, WA)
Detailed Experimental Methods & Results for CMPs Catalytic Activity Analysis
Method Description. The catalytic activity of CMPs (c-SiO2 and f-SiO2) using our Colorimetric Assay to Detect Engineered nanoparticles (CADE) technique 1. CADE employs a dye, methylene blue (MB), and a reducing agent, sodium borohydride (BH4), to colorimetrically assess the catalytic activity of nanoparticles in an aqueous media. CADE leverages the surface catalytic redox properties of nanoparticles to provide a simple colorimetric detection assay for CMPs. Figure SI.1A inset shows a schematic representation of the catalytic electron transfer mechanism between MB and BH4 in presence of nanoparticles. When CMPs are introduced to MB-BH4 solution, nanoparticles serve as a catalyst for reducing the dye-reductant agent pair by promoting the electron transfer between the dye and reductant. Multiple studies report that nanoscale metals (but not their bulk counterparts) are catalytically active due to the reduction of their redox potential 2. Thus, to act as an effective catalyst, the redox potential of CMPs needs to be found between the redox potential of MB and BH4 since these reduction reactions are thermodynamically favorable but not kinetically 3, 4. CADE consists of final concentrations of
Electronic Supplementary Material (ESI) for Environmental Science: Nano.This journal is © The Royal Society of Chemistry 2015

2
40 μM Methylene blue (CAS: 7220-79-3, Sigma–Aldrich, St. Louis, MO), 10 mM Sodium Borohydrate (CAS: 16940-66-2, Sigma–Aldrich, St. Louis, MO), and 10 mM N-(2-hydroxy- ethyl) piperazine-N’-(2-ethanesulfonic acid) (HEPES, CAS: 7365–45-9 Sigma–Aldrich, St. Louis, MO) at pH = 7. We chose 10 mM HEPES as a buffering agent to maintain the pH constant during our experimental procedures and the buffer concentration has sufficient buffering capacity without inducing particles instability, i.e. aggregation due to reduction in electric double layer thickness or surface charge as a result of high ionic strength. We prepared all our working solution by dispersing CMPs in ultrapure water (18.3 MΩ-cm, Milli-Q Advantage A10® system, Millipore Corp., Billerica, MA). The resulting solution was placed on a rotary shaker (50 rpm) for 1 h at room temperature (23 °C) prior to each experiment. We begin each experiment by mixing with a micro magnetic stirring bar, driven by an external magnetic mixer (Cat: H370170, Scienceware, Wayne, NJ) for ~2 min. Our CMPs working solution is mixed with a small aliquot of concentrated BH4 and HEPES solution to reach a final concentration of 10 mM for both reagents. Then, we add a small volume of concentrated dye that provides a final concentration of 40 μM in a 2.5 mL working volume. We continuously monitoring CADE’s absorbance with a portable UV-Vis spectrometer (USB2000+XR1-ES Ocean Optics, Dundin, FL) at the maximum dye’s absorbance peak of max= 665 nm. CMP detection studies were preformed in 3 mL disposable methacrylate cuvette (Cat: 9014, Perfector Scientific, Atascadero, CA) with an optical path length of 1 cm.
Results. Figure SI.1A shows the optical density of dye-reductant solution at max=665 nm as a function of time. CADE solution in the absence of nanoparticles has a stable OD of ~2.8, showing that the color of the dye remains unaltered for ~25 s. This indicates that the dye reduction is insignificant when nanoparticles are not in solution. We measured the optical density of CADE for long experimental times, ~1 h, in absence of nanoparticles and show that OD decreases less than 0.09 over the duration of the experiment (data not shown here). To demonstrate the effectiveness of our catalytic detection assay, we use a commercial available Au nanoparticle with a nominal diameter of 100 nm (DAC1001, NanoCompsix, San Diego, CA). After 25 seconds, Au nanoparticles are added to the solution with a final concentration of 300 ppb which results in an exponentially decrease of OD from 2.8 to 2.2 over ~75 s. Then, the OD plateaus and remains steady for the duration of the experiment. We fit the absorbance as a function of time with an exponential curve, given as, OD OD0 exp t , (1)
where OD is the optical density of CADE solution, OD0 is the optical density at t=0, τ is the exponential decay rate constant, t is the time transpired from the addition of the nanoparticles, and β is a constant that represents the asymptotic OD value. OD data processing and analysis was performed by a custom code written in MATLAB (MathWorks Inc., Natick, MA). We fit and values (41.8 s and 2.2 for the data shown in Figure SI.1A), which respectively represent the decay time at which the dye absorbance is reduced to 1/e of its initial value and the steady state OD that is reached at long times. We explored the use of decay rate constant for quantifying the reduction reactions, but ultimately chose β to quantify the catalytic activity of CMPs since this asymptotic constant is unbiased from experimental artifacts (e.g., particle diffusion in the solution, formation of bubbles, etc). values have a dynamic range of 0.01 to 2.8 and potentially serve as a nanoparticle reactivity indicator.

3
Figure SI.1. Optical Density of CADE assay at pH 7.0 (40 μM of MB, 10 mM NaBH4 and 10mM HEPES) in the presence of gold nanoparticles at a fixed mass concentration of 300 ppb recorded at 665 nm. Dash line indicates a fit to an exponential decay model OD OD0 exp t (R2 = 0.978). β is the asymptotic value of the optical density.
Nanoparticles are added at t = 28 s causing CADE optical density to decrease (A) and schematic diagram of dye reduction electron transfer mechanism in presence of nanoparticles, inset. β-value as a function of CMPs type at a fixed mass concentration of 100 ppm. Control experiments correlate to absence of CMPs in the assay. β-values are an average over 5 experiments with error bars that denote 95% confidence intervals (B). ANOVA test and subsequent comparison of means test showed that all three samples differed significantly from each other (= 0.05, p-value < 0.0005). This test shows that the difference in the -value means are likely due to the presence of the different CMPs and not due to random error.
The reduction of MB by borohydride depends directly on the catalytic activity of nanoparticles in CMPs. Figure SI.1B shows β values as a function of CMPs composition (f-SiO2 and c-SiO2) at a constant concentration of 100 ppb. All β values are reported herein as the mean of at least five experimental measurements with error bars that denote the 95% confident intervals (α = 0.05). An analysis of variance (ANOVA) and subsequent comparison of means test showed that all three samples differed significantly from each other at an =0.05 level (p-value < 0.0005 for all comparisons). This test shows that the difference in the β value means are likely due to the presence of the different nanoparticles and not due to random error. In the absence of CMPs in the CADE solution, the β value is ~2.8, representing the highest absorbance of dye solution. The β values range from 2.6 for c-SiO2 to 2.4 for f-SiO2. Lower β values correspond to higher CMP catalytic activity. At fixed CMP mass concentration, the surface charge of nanoparticles may have an influence on the catalytic reactivity of CMPs. We believe negatively charged particles, c-SiO2 and f-SiO2, with a surface charge of -21 and -50 mV, may electrostatically repel BH4 molecules to the surface of the particle, which then inhibit the reduction of MB, resulting in high values. According to Azad et al. when BH4 absorbs to the surface of nanoparticles, it creates a negatively charged layer that attracts cationic organic dyes, such as CADE 5. This electrostatic attraction or repulsion between particle surfaces and the reducing agents increase or decrease the reduction rate of MB. Other factors that we also believe
0 50 100 150 200 2502
2.4
2.8
3.2
Time (s)
OD
(a
.u.)
t"[sec]&
OD&
N(CH3)2 (H3C)2N
N
S
H
N(CH3)2 (H3C)2N S
N
NP e-
BH4-
B2H4
e- +
Reductant Oxidizing NP Indicator
MB
LMB
2.2#
2.3#
2.4#
2.5#
2.6#
2.7#
2.8#
2.9#
Control f-SiO2 c-SiO2
f-SiO2 c-SiO2
A B

4
may play a roll in the reduction of CADE are hydrophobicity of the dye, complex formation of the dye with anionic surfactants, repulsion between the dye and charged surfactant—these factors are ongoing work in our labs.
Detailed Experimental Methods for In Vitro Assays
Assays were conducted using CMP slurries with marine bacterium Aliivibrio fischeri (MicroTox Bioasssay), adenocarcinomic human alveolar basal epithelial cells (A549 cell viability, ATCC® CCL-185™) with the dye 3-(4,5-dimethylthiazol-2-yl)-2,5-diphenyltetrazolium bromide (MTT) assay kit (Sigma Aldrich) to quantitatively evaluate the cell viability of A549 cells after exposure to the slurries and Lactate dehydrogenase (LDH) kit (Sigma Aldrich) to evaluate the membrane integrity of A549 cells, proliferation of A549 cells was measured by two methods: determination of cell numbers by staining nucleic acids with crystal violet dye (CV)6, or direct counting of cell numbers with a Coulter counter. Details of these methods are provided in Supplemental Information.
Microtox Bioassay. The Microtox® Model 500 analyzer (Strategic Diagnostics, Inc. SDIX, Newark, DE, USA) was used to measure changes in the bioluminescence produced by the marine bacterium Aliivibrio fischeri (lyophilized culture of A. fischeri NRRL-B-11177, AZUR Environmental, Carlsbad, CA, USA). Bioluminescence inhibition was measured at a 30-min exposure time to a dilution series of concentrations with three replicates per test concentration 7. All assays were performed at 25°C. The acute toxicity data were obtained and analyzed using the MicrotoxOmni software (Strategic Diagnostics, Inc. SDIX, Newark, DE, USA).
Viability Assay with A549 cells. A549 cells (adenocarcinomic human alveolar basal epithelial cells, ATCC® CCL-185™) were obtained from the American Type Culture Collection (Manassas, VA, USA) and were cultured in F-12K media supplemented with 10% (v/v) FBS in a 37°C incubator with 95% air and 5% CO2. The dye 3-(4,5-dimethylthiazol-2-yl)-2,5-diphenyltetrazolium bromide (MTT) was used to quantitatively evaluate the cell viability of A549 cells after exposure to the slurries. MTT is converted to purple formazan crystals by mitochondrial reductase enzymes that are present in viable cells. The amount of formazan produced is proportional to the number of cells and can be measured using a spectrophotometer.
The MTT assay kit was purchased from Sigma Aldrich. A549 cells were seeded in 96 well plates at a density 10,000 cells/cm2. After seeding, the cells were incubated for 24 h to allow time for attachment. The media were changed after 24 h of incubation and the slurries at respective concentrations (10, 1, 0.1 µL per well each of which had a final volume of 150 µL) were added. The final concentrations in media for each of the slurries in mg/mL were: l c-SiO2, 2.03, 0.203, and 0.0203; f-SiO2, 3.34, 0.334, and 0.0334; CeO2, 0.52, 0.052, and 0.0052; Al2O3, 2.01, 0.201, and 0.0201. After 48 hours of incubation followed by addition of slurries, the media was changed and then the cells were incubated for an additional 24 hours after which the cells were treated with MTT reagent and incubated for four hours. After 4 hours, purple formazan crystals were formed. The crystals were dissolved using the MTT solvent and the absorbance was measured at 570 nm. The absorbance was compared to the controls (positive-lysis buffer and negative-untreated cells) and one-way Anova test was performed to analyze the significance of the results with a confidence interval of 95%.
Membrane Integrity Assay with A549 cells. Cell culture conditions were as in the previous section. Lactate dehydrogenase (LDH) was used to evaluate the membrane integrity of A549 cells exposed to slurries. LDH is a stable cytoplasmic enzyme present in most cell types and

5
leaks out of cells into the media if there is damage to the plasma membrane. LDH catalyses the oxidation of lactate to pyruvate through the reduction of nicotinamide adenine dinucleotide (NAD) to NADH.
The LDH assay kit was purchased from Sigma Aldrich. A549 cells were seeded in 96 well plates at a density 10,000 cells/cm2. After seeding, the cells were incubated for 24 hours to allow time for attachment. The media was changed after 24 hours of incubation and slurries at respective concentrations were added as in the MTT assay. After 48 hours of incubation followed by addition of slurries to the cells, the assay was performed and the absorbance was collected at a wavelength of 490 nm. The absorbance was compared to the controls (positive-lysis buffer and negative-untreated cells) and one-way Anova test was performed to analyze the significance of the results with a confidence interval of 95%.
Cell Proliferation Assays with A549 cells. The effect of exposure to different concentrations of slurry on the proliferation of A549 cells was measured by two methods: determination of cell numbers by staining nucleic acids with crystal violet dye (CV) 6, or direct counting of cell numbers with a Coulter counter. These assays are sensitive to both cytotoxic materials that may kill cells and to cytostatic materials that may reduce cell growth but not be acutely toxic. A549 cells were cultured in F-12K media supplemented with 10 mM HEPES, pH 7.4 and 10% (v/v) FBS in a 37°C incubator with 90% air and 10% CO2. For the assay, A549 cells were plated at a density of 3x10⁴ cells/well in a 48-well plate. The next day, just prior to use, the pH of the slurries were adjusted to pH 7.4 by diluting in 20 mM HEPES buffer at pH 7.4 and further addition of small volumes of 1 M NaOH or 1 M HCl, for c-SiO2 or the f-SiO2, respectively. The slurries were diluted to 2x the final concentration in H2O from the pH adjusted stock solutions and mixed with an equal volume of 2x concentrated media containing 20% FBS plus antibiotics penicillin (200 U/mL) and streptomycin (0.2 mg/mL). After 24 hours of incubation, the medium was removed and the cells were extensively washed. For experiments with c-SiO2 and f-SiO2, the cell number was obtained either by CV staining or after trypsinization to detach the cells by direct cell counting and the cumulative data from 4 assays was averaged. For CeO2 and Al2O3, due to the large extent of aggregation of the slurries, only data from cell counting was used. The number of cells in samples that were not treated with slurries was set at 100% proliferation for comparison with cells exposed to slurries.
Life Cycle & Toxicity Implications
1.1. Tool Design & Occupational Exposure Evaluations CMP tools are typically designed to conform to Semiconductor Equipment and Materials International (SEMI) guidelines for health and safety. Conformance to these guidelines involves occupational exposure performance testing to demonstrate that the tool provides adequate isolation of the operator and maintenance personnel from the chemicals used in the tools. For operators, the guidelines require that the measured chemical concentration in the worst case personal breathing zone during normal operation of the tool must be less than 1% of the relevant occupational exposure limit 8. For maintenance operations, the guidelines require that the maximum chemical concentrations must be less than 25% of the relevant occupational exposure limit 8.
Although these well established and highly protective guidelines are widely employed for chemicals, their application to ENP is impeded by both metrology challenges and the absence of

6
occupational exposure threshold limits for ENP. Shepard and Brenner (2013) conducted occupational exposure monitoring in CMP areas and associated support areas in an operating development fab 9. Their work reported that airborne particle levels in an operating fab are generally low, and often below detectable levels; but also highlighted the need for more sensitive sample collection and analysis methods for occupational exposure monitoring of ENP. With this in mind, one of the principal goals of the present work has been to develop and distribute a set of characterized “model slurries” with the intent of facilitating method development for occupational exposure monitoring, and the developing toxicity data that applies to relevant occupational exposures. 1.2. Wafer Production & CMP Usage The quantity CMP slurries and of the individual types of particles that are used by a fab differ according to the design and the physical dimension of the integrated circuits being fabricated into a wafer, as well as the wafer size and production capacity of the fab. Many advanced semiconductor manufacturing facilities (fabs) are currently fabricating integrated circuits at the 32, 22 and 14 (nm) technology nodes, on wafers that are either 200 or 300 mm in diameter.
In 2011, the worldwide production capacity for semiconductor wafers was estimated to be on the order of 260,000 wafers per day, with roughly 68% produced as 300-mm wafers, 25% produced as 200-mm wafers, and 7% as wafers that are less than 200-mm in diameter (http://www.semiconductors.org/industry_statistics/semiconductor_capacity_utilization_sicas_reports/). The CMP process is used repetitively throughout the production of a single wafer, and typically involves the use of several different slurry formulations, as appropriate to the particular material being planarized. The number of CMP steps required to fabricate a wafer has trended upward with more advanced technology nodes. Whereas fewer than 20 CMP steps may typically have been involved in the production of wafers at the 250 (nm) technology node, it has been projected that a typical 16 (nm) technology node wafer may require more than 40 CMP individual CMP steps, involving 10 or more different slurry types 10. 1.3. Example Facility: Characterizing CMP Wastewater Effluents The composition and quantity of CMP wastewater produced by a given semiconductor fab varies according to the type and design of the integrated circuits that are produced, the particular slurries that are used, the size of the wafers and the production capacity of the fab, as well as facility dependent infrastructure. Characterization of the ENP life cycle and fate in a facility requires a consideration of the compositional changes along the particle flow path through the facility specific wastewater system, and how those changes influence particle behavior and fate.
Figure SI.2 illustrates the flow path of CMP slurry particles through a particular Fab. Slurry, rinse water, wafers and brush cleaner are fed into CMP tools (Node A). The polished wafer exits the tool and the effluent wastewater consists of the feed streams to the tool, and a combination of dissolved and particulate material removed from the wafer, and possibly residual pad material that may be dislodged (Node B). Materials balance estimates for this particular fab indicate that the average total SiO2, Al2O3, and CeO2 concentrations in the composite wastewater exiting the CMP tools would be on the order of 1,000 mg/l, 100 mg/l and 5 mg/l, respectively. These estimates are consistent with CMP effluent concentrations for silica and aluminum, as reported in the literature, as summarized here:

7
CeO2 concentrations were not reported in the CMP wastewater effluent concentrations that were available in the literatures sources that were reviewed. The concentrations of Al2O3, CeO2, and SiO2 that would be in downstream processes vary considerably, depending on fab specific wastewater system configuration, and the removal efficiency for the treatment processes that are in place. In the absence of an upstream treatment process that removes CMP particles, the influent concentrations to biotreatment at this particular fab would be on the order of 40, 4, and 0.2 (mg/l) for silica, alumina, and ceria. With the CMP wastewater treatment process, the alumina and silica concentrations are estimated to be on the order of 0.6 mg/L Al2O3 and 2 mg/L SiO2. The solids concentrate from a CMP wastewater treatment process may produce a sludge that is 77 % SiO2, 8 % Al2O3 and less than 0.5 % CeO2.
The wastewater effluent from the individual CMP tools flows to a collection and equalization tank which in turn is fed to physicochemical treatment process that uses lime (Node C) primarily to precipitate and coagulate dissolved metals and solids at a high pH. The precipitated and coagulated solids are removed via an overflow clarifier (Node D). The treated aqueous effluent exits the CMP wastewater treatment process (Node E), and mixes with treated and untreated effluents from other semiconductor manufacturing processes within the facility (Node F). Following equalization and the addition of acid or base (Node G) for neutralization the combined wastewater is routed to an activated sludge type process, where with the addition of sanitary waste (Node I) biological wastewater treatment occurs. The waste biosolids are collected as a sludge (Node K), and disposed as hazardous waste. The treated effluent from the biotreatment process (Node L) undergoes disinfection and is discharged to a stream (Node F). In some cases where local discharge permits can be met, following Node F or G composite fluids containing CMP NPs may be directly discharged to sewers without additional on-site treatment. This situation is more common where the flows from the fabs are small relative to regional sewer flow rates.
Total [Si] (mg/l) tot [Al] (mg/l) Description Reference
400 - 800 NA "Oxide" CMP WW effluent from Hsinchu Park (Taiwan) Den et al (2006)
810 tot; 362 after 0.45 um NA CMP WW effluent from Hsinchu Park (Taiwan). Huang et al (2004)
1580 tot, 398 passing 0.2 um NA CMP WW effluent from a 300 mm fab in southern Taiwan. Kuan and Hu (2009)
467 1.2 DRAM manufacturer in Hsin-chu Science park in Northern Taiwan. Liu and Lien (2006).
98 - 224 .01 - 11.8 Oxide and metal CMP waste from semiconductor fab in Taiwan Lo and Lo (2004)
4000 NA Downstream of ultrafilter at DRAM manufacturer in Hsinchu Park, Taiwan Tsai et al (2007)
609 as Si 4.8 "Oxide-CMP" WW from wafer fab in southern Taiwan Yang et al (2003,2004)

Figure stream.
A
paths, thmetrolothrough
Conprovide to the inother paprocessebased upof metal
Partthey dodigestedspecializFor cerattributaindicatoconstitu
SI.2 Flow
Although thhis particulgy challeng
h to the nodenventional m
a convenienndividual tyarticles are es at a partpon the addl hydroxide ticle count a not differe
d wastewatzed fraction
rium, whichable to the or of the tuents of was
path of CM
he ENP fromlar system ges in chare points by wmass concennt tool for trypes of ENlikely crea
ticular pointdition of lim
and other nand particleentiate the cter samplesnation methh is uncomCeO2 used
total mass stewater tre
MP slurry p
m CMP proserves as aracterizing which they lntration basracing the bPs (Al2O3,
ated and det in the flow
me slurry, whnew particlee size distribcompositions are likew
hods that cammon in soud in CMP, t
of CeO2. atment and
8
particles in
ocesses in oa useful poithe lifecyclleave the faed and part
behavior andCeO2, and stroyed depw path. Thehich both cos via precipbution provn of the parwise indiscn differentiurce watersthe total digHowever, other chem
a particular
other fabs wint of deparle of CMPcility. ticle count bd fate of ENSiO2) that
pending on e lime preciontains part
pitation. vide measurrticles. Thecriminate mate betweens or acids/bgested massboth alumi
mical feeds.
r semicondu
will follow rture for a ENP from
based analyNP in aqueou
are used inthe govern
ipitation proticles, and in
res of partice total elemmeasures un particles abases, and s concentrainum and Further, th
uctor fab w
facility speconsiderati
m their poin
ytical methous system. In the CMP pning physicoocess, for initiates the
cle concentrmental compunless coupand dissolvelikely pred
ation is likesilicon are ey are often
wastewater
ecific flow ion of the nt of use,
ods do not n addition processes, ochemical nstance is formation
ration, but position of pled with ed matter.
dominately ly a good
common n the very

9
materials being removed from wafer surfaces via CMP and other Fab manufacturing processes. The total aluminum and silicon concentrations do however provide bounding information regarding the maximum quantity of Al2O3 or SiO2 particles that could be present. For this fab, for instance, the final effluent concentration of aluminum is 0.2 mg/L and thus represents an upper bound on the total mass of Al2O3 particles that could be present.
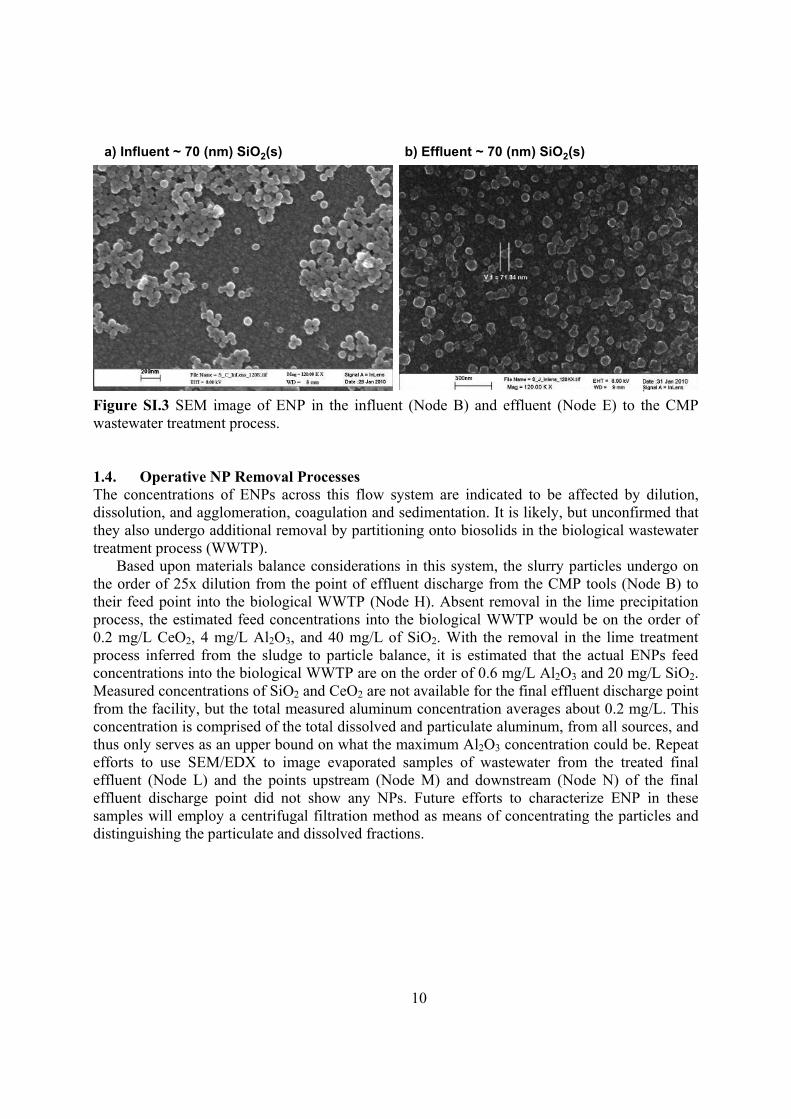
SEM and TEM imaging of the particles in aqueous samples provides useful qualitative information regarding the presence and form of particles. Figure SI.3 for instance was prepared by evaporating a drop of influent wastewater from Node B, and shows copious quantities of uniform round particles with an approximate diameter of 70 nm. Using EDX, these particles were identified to be SiO2. Figure SI.3 shows a SEM/EDX image of a similarly prepared effluent sample from Node E. These particles are likewise 70 nm SiO2 particles, but shown to be weathered. Figure SI.4 shows a corresponding SEM/EDX image of a sample collected from within the gravity clarifier, and clearly shows an agglomerate of SiO2 particles. The agglomerate is seen to be composed largely of the rounded 70-nm SiO2 particles in the influent, and therefore establish that the CMP SiO2 particles are undergoing removal via agglomeration and settling.
A compositional analysis of the lime sludge collected at Node D shows indicates that the sludge is approximately 77 % SiO2, 8 % Al2O3, and 10% CaO. The sludge CeO2 concentrations were not reported, and may have been below detectable limits. Correcting for the moisture content of the sludge the and comparing to slurry usage records indicates that on the order of 95% of the SiO2 and 85% of the Al2O3 NPs from the CMP slurries is removed in the lime precipitation process.
10
Figure SI.3 SEM image of ENP in the influent (Node B) and effluent (Node E) to the CMP wastewater treatment process.
1.4. Operative NP Removal Processes The concentrations of ENPs across this flow system are indicated to be affected by dilution, dissolution, and agglomeration, coagulation and sedimentation. It is likely, but unconfirmed that they also undergo additional removal by partitioning onto biosolids in the biological wastewater treatment process (WWTP).
Based upon materials balance considerations in this system, the slurry particles undergo on the order of 25x dilution from the point of effluent discharge from the CMP tools (Node B) to their feed point into the biological WWTP (Node H). Absent removal in the lime precipitation process, the estimated feed concentrations into the biological WWTP would be on the order of 0.2 mg/L CeO2, 4 mg/L Al2O3, and 40 mg/L of SiO2. With the removal in the lime treatment process inferred from the sludge to particle balance, it is estimated that the actual ENPs feed concentrations into the biological WWTP are on the order of 0.6 mg/L Al2O3 and 20 mg/L SiO2. Measured concentrations of SiO2 and CeO2 are not available for the final effluent discharge point from the facility, but the total measured aluminum concentration averages about 0.2 mg/L. This concentration is comprised of the total dissolved and particulate aluminum, from all sources, and thus only serves as an upper bound on what the maximum Al2O3 concentration could be. Repeat efforts to use SEM/EDX to image evaporated samples of wastewater from the treated final effluent (Node L) and the points upstream (Node M) and downstream (Node N) of the final effluent discharge point did not show any NPs. Future efforts to characterize ENP in these samples will employ a centrifugal filtration method as means of concentrating the particles and distinguishing the particulate and dissolved fractions.
D.E. Speed 10
b) Effluent ~ 70 (nm) SiO2(s)a) Influent ~ 70 (nm) SiO2(s)

Figure Refere1. Cof Catal2. LG.; DollNanopa2011, 113. Jparticles4. JSurfacta5. AnanoparJournal6. WDraper, RemovaPharma7. Hinsensitimetabol8. SManufaJose , C9. SNanopa
SI.4 SEM im
nces Corredor, Clytic ReactivLaoufi, I.; Sle, P.; Crugu
articles: An i15, (11), 46Jana, N. R.;s: A comparJana, N. R.;ant and elecAzad, U. P.rticles imprel of NanoparWang, R. HR. K., Cyto
al of Cytotoaceutics 201Hang, J. D.;ive munitionlites. J HazaSEMI SEMIcturing Equ
CA, 2014. Shepard, M
articles Used
mage of coa
C.; Borysiakvity of NanoSaint-Lager,uel, H.; Bailin Operando73-4679. Pal, T., Rerative study Wang, Z. Ltron donor-; Ganesan, Vegnated silicrticle Resea
H.; Mikoryakotoxicity Scrxic Contam
11, 8, (4), 13; Olivares, Cns compounardous Mate
MI S2-0712c uipment; Sem
M. N.; Brenned in Semicon
agulated par
, M.; Wolfeoparticles in, M. C.; Lazlly, A., Sizeo Study duri
dox catalytiy. Langmuir L.; Pal, T., Racceptor effV.; Pal, M.,ca materials
arch 2011, 1k, C.; Li, S. reening of S
minants from351-1361. C.; Field, J. nd, 2,4-diniterials 2013,- Environmmiconducto
er, S., An Onductor Fab
11
rticles remo
er, J.; Westen Complex Mzzari, R.; Jupe and Catalying CO Oxi
ic property o1999, 15, (
Redox catalyfects. Langm Catalytic re
s: influence 13, (9), 3951Y.; Bushdie
Single-Wallm Carboxyla
A.; Sierra-Atroanisole (D, 262, 281-2ental, Healt
or Equipmen
Occupationalbrication. An
1
oved in the c
erhoff, P.; PoMatrices. Enpille, J.; Robytic Activityidation. Jour
of still-grow10), 3458-3ytic propertmuir 2000, 1eduction of of functiona
1-3959. ecker, D.; Mled Carbon Nated Carbon
Alvarez, R.,DNAN), an287. th, and Safent and Mater
l Exposure Ann. Occup. H
clarifier.
osner, J., Conviron. Sci. bach, O.; G
y of Supportrnal of Phys
wing and fin3463. ties of pallad16, (6), 2457organic dyeal groups an
Musselman, Nanotubes: Nanotubes.
Microbial td its aromat
ety Guidelinrials Interna
AssessmentHyg. 2014,
olorimetric DTechnol. 20araudee, S.;ted Gold sical Chemi
nal palladium
dium nanop7-2463. es at gold nd surfactan
I. H.; PantaDetection a
. Molecular
toxicity of ttic amine
e for Semicoational (SEM
t for Engine58, (2), 251
Detection 015. ; Cabailh,
istry C
m
particles:
nts.
ano, P.; and
the
onductor MI): San
eered -265.

12
10. Feeney, P., The Ecosystem of CMP in the More than Moore Space. In Clarkson Advanced Materials Processing (CAMP) Symposium on CMP, Albany NY, 2014.