Embed Size (px)
Citation preview
ISSN 1463-9076
Physical Chemistry Chemical Physics
www.rsc.org/pccp Volume 15 | Number 16 | 28 April 2013 | Pages 5723–6150
1463-9076(2013)15:16;1-P
PAPERErbe et al.A mechanistic study of the electrochemical oxygen reduction on the model semiconductor n-Ge(100) by ATR-IR and DFT
This journal is c the Owner Societies 2013 Phys. Chem. Chem. Phys., 2013, 15, 5771--5781 5771
Cite this: Phys. Chem.Chem.Phys.,2013,15, 5771
A mechanistic study of the electrochemical oxygenreduction on the model semiconductor n-Ge(100) byATR-IR and DFT†
Simantini Nayak, P. Ulrich Biedermann, Martin Stratmann and Andreas Erbe*
The electrochemical oxygen reduction reaction (ORR) on a n-Ge(100) surface in 0.1 M HClO4 was
investigated in situ and operando using a combination of attenuated total reflection infrared (ATR-IR)
spectroscopy and density functional (DFT) calculations. The vibrational modes of the detected intermediates
were assigned based on DFT calculations of solvated model clusters such as Ge-bound superoxides and
peroxides. ATR-IR shows the Ge-bound superoxide with a transition dipole moment oriented at (28 � 10)1
with respect to the surface normal. At slightly negative potentials, the surface-bound peroxide is identified
by an OOH bending mode as a further intermediate, oriented at a similar angle. At strongly negative
potentials, a surface-bound perchlorate is found. The findings indicate a multistep mechanism of the ORR.
The reaction is furthermore coupled with the hydrogen evolution reaction (HER).
1 Introduction
The electrochemical oxygen reduction reaction (ORR) is acrucial reaction for a number of fields in chemistry, includingconversion of chemical to electrical energy, and corrosion.1,2
The lack of understanding of the reaction mechanism of theelectrochemical ORR is a major bottleneck in the developmentof efficient fuel cells and in the prevention of corrosion. TheORR involves the transfer of 4 electrons and 4 protons to the O2
molecule and breaking of the formal double bond. The netreaction is O2 + 4e� + 4H+ - 2H2O in acidic solution.1,2
Recently, interest in the reaction mechanism has increaseddue to its role in fuel cells and batteries.3–7 Many studies have beenperformed to find ORR catalysts with increased performance orlower cost than existing noble metal catalysts, and to understandthe reaction mechanism.8–11 Several major pathways have beenput forward, a direct mechanism based on dissociative adsorptionof O2 on an electrode surface, or different variants of multistepreaction mechanisms with step-by-step electron transfer, whichproceed via the superoxide radical anions and/or peroxides, to thefinal dissociation of the O–O bond.1,2,7,12–16 A general scheme ofpossible intermediates has been constructed.12,17–19
Traditionally, intermediates that are stable enough to diffuseaway from the electrode surface have been detected by electro-chemical experiments.12,20 Furthermore, vibrational spectro-scopic techniques have been used to detect intermediatesduring ORR on rough noble metal films relevant to fuel cellapplications.21–29 Vibrational spectroscopy is a powerful tool toanalyze the nature of transient oxygen-related species on thesurface, as peak frequencies can clearly distinguish betweendouble bonds (B1550 cm�1) as present in O2, single bonds(B800 cm�1) as present in peroxides including H2O2, and bondswith bond order 1.5 (B1200 cm�1) present in superoxides.22,30
A detailed literature overview of the assignment of vibrationalfrequencies of reported intermediates, and selected data forreference compounds, is given in the ESI.† Experimental studieshave been complemented by computational studies, which leadto more detailed insight into adsorption sites, relative stabilitiesand the nature and orientation of the species.23,31,32 Detailedexperimental studies including the orientation of intermediateshave been reported for flat solid/gas interfaces,33,34 but are so farlacking under conditions of electrochemical reactions.
The crystalline semiconductor Ge has been proposed as amodel for semiconducting passive films,35 as under ambientconditions most metallic materials are covered with protectivesemiconducting oxides.36 More recently, semiconductors and othernon-metallic materials have been suggested as a replacement ofprecious metals in electrocatalysis.5,6,37
Ge exhibits a potential-dependent transition from a hydroxidecovered to hydrogen terminated surface. This transition has
Max-Planck-Institut fur Eisenforschung GmbH, Max-Planck-Str. 1, 40237,
Dusseldorf, Germany. E-mail: [email protected], [email protected];
Fax: +49 211 6792 218; Tel: +49 211 6792 890
† Electronic supplementary information (ESI) available: Vibrational spectra ofreference compounds and results of DFT calculations of Ge3 species. See DOI:10.1039/c2cp43909c
Received 4th November 2012,Accepted 2nd January 2013
DOI: 10.1039/c2cp43909c
www.rsc.org/pccp
PCCP
PAPER
Ope
n A
cces
s A
rtic
le. P
ublis
hed
on 0
4 Ja
nuar
y 20
13. D
ownl
oade
d on
05/
04/2
017
11:3
9:09
. T
his
artic
le is
lice
nsed
und
er a
Cre
ativ
e C
omm
ons
Attr
ibut
ion-
Non
Com
mer
cial
3.0
Unp
orte
d L
icen
ce.
View Article OnlineView Journal | View Issue
5772 Phys. Chem. Chem. Phys., 2013, 15, 5771--5781 This journal is c the Owner Societies 2013
originally been inferred from electrochemical experiments38
and was later confirmed using attenuated total reflectioninfra-red (ATR-IR) spectroscopy and quartz-crystal microbalanceexperiments.39–41 Without systematic studies of the ORR on Ge,this transition has been proposed to be related to the onset ofthe ORR, as it involves a radical surface state.40,42,43
In this work, ATR-IR spectroscopy and density functionaltheory (DFT) calculations have been used to study the mechanismof the ORR on Ge(100) in 0.1 M HClO4.
2 Materials and methods2.1 Electrochemical and spectroscopic experiments
The setup consists of the optical base of the horizontal ATRunit SpectraTech Model 0001-100 (SpectraTech, Stamford, CT).The crystal plate was removed from the unit, and replaced by acopper piece that is used to contact the Ge ATR crystals. It wasfixed on a PTFE mount to prevent electric contact with theoptical base. Trapezoidal Sb-doped n-type Ge(100) crystals(Crystaltechno, Moscow, Russia) were used as substrates. Thecrystals have a specified resistivity of 10–40 O cm and a size of52 mm � 20 mm � 0.5 mm. The short edges were polished toan angle of 301, leading to an angle of incidence of 601 at theGe/electrolyte interface. The Ge crystal was placed in a grooveon the copper piece and moved along the direction of the beamuntil maximum transmitted intensity through the whole systemwas observed. A PTFE basin was used to hold the electrolytewith a FPM O-Ring in direct contact with the Ge crystal. Afteralignment of the IR light path, the PTFE basin was screwedonto the base part, pressing the back of the Ge crystal againstthe copper surface and sealing the electrochemical cell. The cellwas covered with a Teflon lid which contains bores as gas inletand outlet, and connections for the reference electrode (RE)and counter electrode (CE).
Several published cleaning protocols have been tried for theGe(100) surface.40,43,44 Most of them lead to surface roughening.Therefore, the crystals were cleaned by immersing them inneutral Extran lab detergent (VWR) for 1 h. Immersion wasfollowed by rinsing with ultrapure water several times, andleaving them in 2-propanol for 1 h. The crystals were sub-sequently rinsed with excessive amounts of deionised ultrapurewater and dried under an N2 stream prior to experiments. Thefinal cleaning was performed by electrochemical oxidation of thespecies inside the spectroelectrochemical cell prior to experi-ments. Eight cycles of scans in an anodic direction from +0.21 to�0.79 (all electrode potentials are given with respect to thestandard H2 electrode, SHE) were performed. The resultingfinal cyclic voltammograms (CVs) were in good agreement withreferences.38–40,43 The absence of C–H stretching modes in thesubsequent experiments is an additional indication for thesuccessful cleaning of the Ge surface.
In the geometry used, the Ge crystal acted as a workingelectrode (WE) with an electrode area of 5.5 cm2. The dimensionsof the crystal imply that there are B100 internal reflectionsprobing the WE/electrolyte interface. A double junction Ag/AgCl/3 M KCl microreference electrode (MI-403, MICROELECTRODES,
INC., Bedford, NH, USA) was used as a RE. A Pt loop (99.99%,0.4 mm diameter and 0.2 m length), (Goodfellow, Huntingdon,UK) was used as a CE. 0.1 M HClO4 (70%, Sigma-Aldrich) wasused as an electrolyte. The electrolyte was saturated with O2 or Ar,respectively, by purging the solution with gas prior to the experi-ment. During experiments, the gas volume above the electrolytewas continuously purged with the respective gas. All experimentswere carried out at ambient temperature of (23 � 2) 1C.
IR spectra were recorded on a FTS 3000 Fourier transform IRspectrometer (Biorad, Palo Alto, CA, USA; now part of AgilentTechnologies) using a mercury cadmium telluride (MCT) detector.IR spectra were recorded in s- and p-polarisation co-adding1000 scans with a spectral resolution of 4 cm�1. IR spectra aredisplayed as absorbance defined as
A ¼ � log10Is
Io
� �(1)
where Is and Io represent the light intensity of the sample- andreference-spectrum, respectively. All the spectra were referredagainst the initial potential (+0.01 VSHE unless stated other-wise). Spectroelectrochemical experiments were carried out inpotential steps of 100 mV under potentiostatic conditions, with asimultaneous recording of currents in chronoamperometry mode,and IR spectra. An Iviumstat potentiostat (Ivium, Eindhoven, TheNetherlands) was used to measure all the electrochemical data.
For spectra recorded in an Ar saturated electrolyte, theresidual absorbance from bulk ClO4
� was subtracted fromthe spectra by subtracting a spectrum such as that shown inFig. S3 (ESI†) from the measured spectra using the algorithmimplemented in the program specsubtr.45 Using this procedure,only spectral components visible in the bulk are removed from thespectra. Such spectral components may show up in the resultingdifference spectra, e.g. because of changes in the wetted workingelectrode area in the order of Bmm2. In particular, no componentsgenerated during the electrochemical treatment are removed by thesubtraction procedure.
For isotope exchange experiments, a slightly modified setupwas used, where the electrolyte was saturated outside the ATR-IRcell initially with Ar, which was later replaced by 18O2, and thenpumped into the spectroelectrochemical cell.
2.2 Quantification of spectra and electric fields at interfaces
2.2.1 Calculation of orientation. The dichroic ratio D = Ap/As
(Ap – integrated absorbance of respective band in p-polarisation,As – integrated absorbance of respective band in s-polarisation) wasused to determine the orientation of the transition dipole moment(TDM) of different species with respect to the surface normal. Theorientational order parameter S2 has been determined from the
experimental D using D ¼ I0x
I0yþ I0z
I0y1þ 3S2
1� S2
� �.46 The squared
amplitudes of the electric field components at the interface I0x, I0y
and I0z are calculated from the parameters of the experimentalsystem.46,47 The right-handed Cartesian coordinate system is usedwhere the ATR internal reflection element’s surface normal pointsto the z direction, and the x direction is the projection of the
Paper PCCP
Ope
n A
cces
s A
rtic
le. P
ublis
hed
on 0
4 Ja
nuar
y 20
13. D
ownl
oade
d on
05/
04/2
017
11:3
9:09
. T
his
artic
le is
lice
nsed
und
er a
Cre
ativ
e C
omm
ons
Attr
ibut
ion-
Non
Com
mer
cial
3.0
Unp
orte
d L
icen
ce.
View Article Online
This journal is c the Owner Societies 2013 Phys. Chem. Chem. Phys., 2013, 15, 5771--5781 5773
direction of propagation onto the internal reflection element’ssurface.46
S2 is related to the angle y between TDM and surface normal
as S2 ¼3 cos2ðyÞ� �
� 1
2.46 In all cases, only a single orientation
has been assumed in the orientation distribution function ofeach TDM. A random orientation resulting in the ‘‘magicangle’’ of 54.61 is expected for dissolved or weakly physisorbedspecies.46
It should be noted that in the case of coexistence of a certain(small) concentration of dissolved isotropically oriented specieswith the oriented species, an even more upright orientation ofthe surface-bound intermediate would be required to arrive atthe observed polarization dependence. It should also bepointed out that the averaging of the tilt angle is over cos2(y).46
Detailed discussions including examples of orientation distri-bution can be found elsewhere.46,48,49
2.2.2 Calculation of Aiso. Because of the effect of orientation,in ATR-IR spectroscopy, the surface concentration is not directlyproportional to the absorbance integrated over a certain absorp-tion band, as in the case of spectroscopy in transmissiongeometry. Therefore, for each of the major observed absorptionbands, a quantity Aiso has been derived from As and Ap, which isproportional to the isotropic absorbance, and hence to thesurface concentration.50 This quantity is given as
Aiso ¼ As 2� I0x
I0z
� �þ Ap
I0y
I0z: (2)
In the course of this work, only the Aiso of the most intenseabsorption peak observed during the ORR is reported. Therefore,no further index is used to describe the association to anabsorption peak.
2.3 Density functional theory calculations
DFT calculations were done using the program packageTURBOMOLE Version 6.2.51 The hybrid density functionalB3-LYP52–54 was used with the basis set def2-TZVP,55,56 andthe RI-JK approximation.57 The structures have been optimizedusing redundant internal coordinates until the energy changesare below 10�7 Hartree and forces are below 10�4 Hartree Bohr�1
in calculations without the continuum solvation model. Ingeometry optimizations with the continuum solvation model theconvergence criteria were 10�6 Hartree and 10�3 Hartree Bohr�1.Vibrational frequencies have been calculated using theharmonic approximation and analytical second derivatives forsystems without continuum solvation, and numerical (central)second derivatives for systems with continuum solvation.58–60
In the larger Ge clusters only displacements of the atomscorresponding to the ORR species and the directly attachedGeH group have been considered. Due to the computationaldemand all other atoms were not displaced. A test calculationhas shown that coupling with the vibrational modes of thewater molecules is small and can be neglected for the bands ofinterest. Frequencies shift by r3 cm�1. For better comparisonto experimental frequencies the calculated values were scaledby 0.9691.61
Solvent effects were treated applying four differentapproaches:
(1) Neglecting solvent effects by simply calculating themolecules or clusters in a vacuum.
(2) Using the conductor-like screening model COSMO,62
with a static dielectric constant er = 78.36 and a refractive indexn = 1.333 corresponding to water at 25 1C. This approachincludes the polarisation effects due to the dielectric shieldingof the electrolyte, however, neglects hydrogen bonds.
(3) Including explicit water molecules in the first solvationshell in order to include the effects of hydrogen bonds. For thispurpose, a cluster of the solute and water molecules complexingeach OH-group and lone pair is constructed. To secure a bulk-like isotropic solvation with a tetrahedral coordination of thesolute oxygen(s) and nearly linear hydrogen bonds, the Owater–Osolute–Owater and Owater–Osolute–Osolute angles have been con-strained to B1091. In the solvent shell of ClO4
� and HClO4,the water oxygen has been constrained to be collinear with therespective Cl–O bond.
(4) The solute–water complexes described in (3) were calculatedwith the COSMO conductor-like screening model to include thepolarisation effects by the dielectric shielding on the hydrogen-bonded structures.
It should be noted that representing the dynamic andfluctuating water structure around a solute by a single partiallyoptimized configuration is a crude approximation. Neverthelessit should represent the main trends in the vibrational modes dueto aqueous solvation of solutes and adsorbed species.
For each of these solvation models the structures wereoptimized and vibrational frequencies were calculated asdescribed above.
3 Results3.1 Electrochemistry and ATR-IR spectroscopy
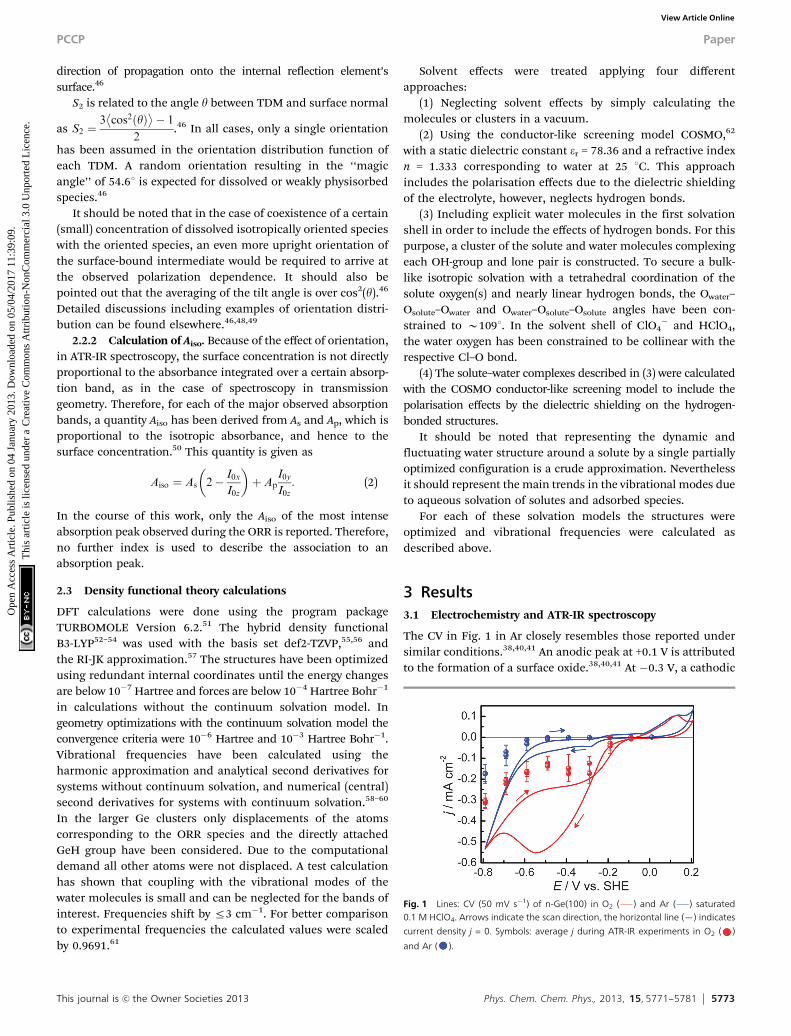
The CV in Fig. 1 in Ar closely resembles those reported undersimilar conditions.38,40,41 An anodic peak at +0.1 V is attributedto the formation of a surface oxide.38,40,41 At �0.3 V, a cathodic
Fig. 1 Lines: CV (50 mV s�1) of n-Ge(100) in O2 ( ) and Ar ( ) saturated0.1 M HClO4. Arrows indicate the scan direction, the horizontal line (—) indicates
current density j = 0. Symbols: average j during ATR-IR experiments in O2 ( )
and Ar ( ).
PCCP Paper
Ope
n A
cces
s A
rtic
le. P
ublis
hed
on 0
4 Ja
nuar
y 20
13. D
ownl
oade
d on
05/
04/2
017
11:3
9:09
. T
his
artic
le is
lice
nsed
und
er a
Cre
ativ
e C
omm
ons
Attr
ibut
ion-
Non
Com
mer
cial
3.0
Unp
orte
d L
icen
ce.
View Article Online
5774 Phys. Chem. Chem. Phys., 2013, 15, 5771--5781 This journal is c the Owner Societies 2013
current peak is observed, attributed to the onset of the changein surface termination from Ge–OH to Ge–H.39,40 The surfacetransition has been proposed to be related to the onset of theORR,38,39 as it involves a radical surface state.40,42,43 The H2
evolution reaction (HER) dominates below �0.6 V.38–40 In O2
saturated solution, substantially increased currents areobserved in the range �0.3 to �0.7 V in addition to surfaceoxidation at +0.1 V, and HER at potentials below �0.7 V.
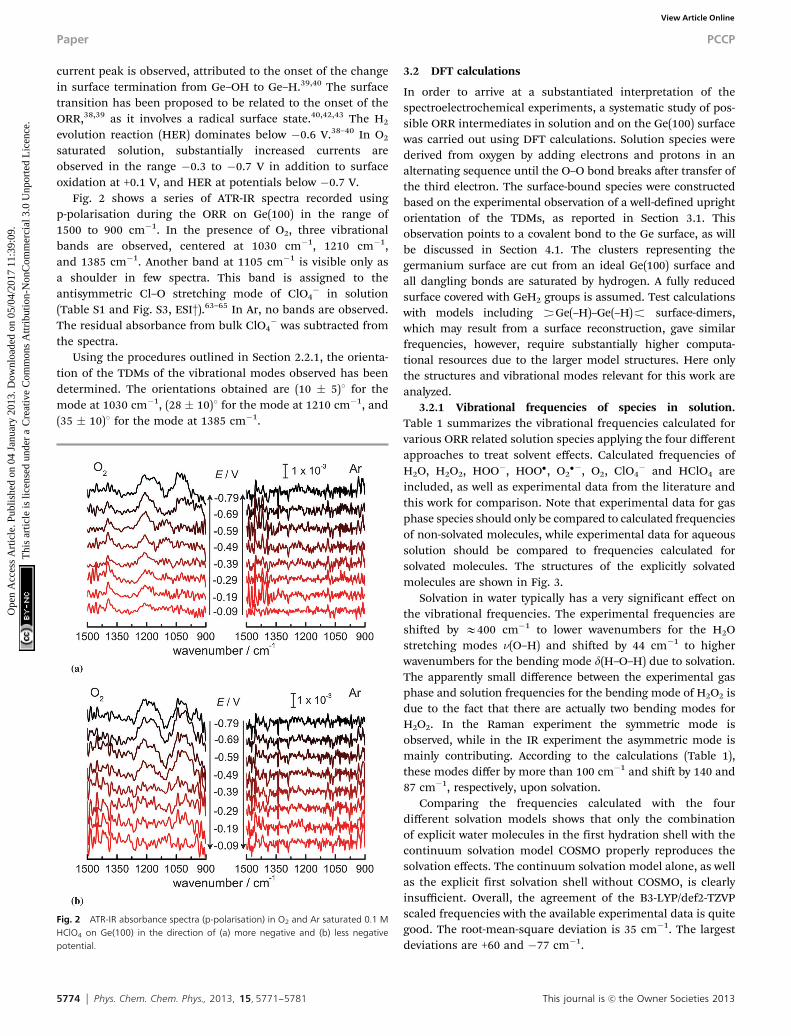
Fig. 2 shows a series of ATR-IR spectra recorded usingp-polarisation during the ORR on Ge(100) in the range of1500 to 900 cm�1. In the presence of O2, three vibrationalbands are observed, centered at 1030 cm�1, 1210 cm�1,and 1385 cm�1. Another band at 1105 cm�1 is visible only asa shoulder in few spectra. This band is assigned to theantisymmetric Cl–O stretching mode of ClO4
� in solution(Table S1 and Fig. S3, ESI†).63–65 In Ar, no bands are observed.The residual absorbance from bulk ClO4
� was subtracted fromthe spectra.
Using the procedures outlined in Section 2.2.1, the orienta-tion of the TDMs of the vibrational modes observed has beendetermined. The orientations obtained are (10 � 5)1 for themode at 1030 cm�1, (28 � 10)1 for the mode at 1210 cm�1, and(35 � 10)1 for the mode at 1385 cm�1.
3.2 DFT calculations
In order to arrive at a substantiated interpretation of thespectroelectrochemical experiments, a systematic study of pos-sible ORR intermediates in solution and on the Ge(100) surfacewas carried out using DFT calculations. Solution species werederived from oxygen by adding electrons and protons in analternating sequence until the O–O bond breaks after transfer ofthe third electron. The surface-bound species were constructedbased on the experimental observation of a well-defined uprightorientation of the TDMs, as reported in Section 3.1. Thisobservation points to a covalent bond to the Ge surface, as willbe discussed in Section 4.1. The clusters representing thegermanium surface are cut from an ideal Ge(100) surface andall dangling bonds are saturated by hydrogen. A fully reducedsurface covered with GeH2 groups is assumed. Test calculationswith models including {Ge(–H)–Ge(–H)z surface-dimers,which may result from a surface reconstruction, gave similarfrequencies, however, require substantially higher computa-tional resources due to the larger model structures. Here onlythe structures and vibrational modes relevant for this work areanalyzed.
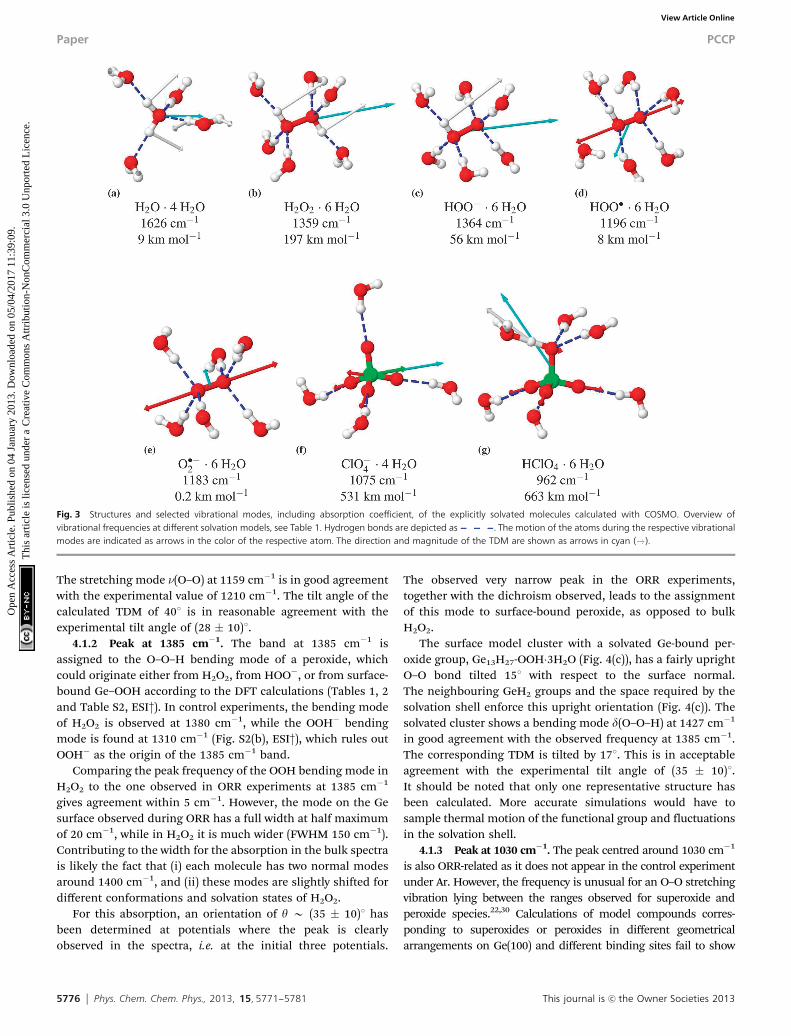
3.2.1 Vibrational frequencies of species in solution.Table 1 summarizes the vibrational frequencies calculated forvarious ORR related solution species applying the four differentapproaches to treat solvent effects. Calculated frequencies ofH2O, H2O2, HOO�, HOO�, O2
��, O2, ClO4� and HClO4 are
included, as well as experimental data from the literature andthis work for comparison. Note that experimental data for gasphase species should only be compared to calculated frequenciesof non-solvated molecules, while experimental data for aqueoussolution should be compared to frequencies calculated forsolvated molecules. The structures of the explicitly solvatedmolecules are shown in Fig. 3.
Solvation in water typically has a very significant effect onthe vibrational frequencies. The experimental frequencies areshifted by E400 cm�1 to lower wavenumbers for the H2Ostretching modes n(O–H) and shifted by 44 cm�1 to higherwavenumbers for the bending mode d(H–O–H) due to solvation.The apparently small difference between the experimental gasphase and solution frequencies for the bending mode of H2O2 isdue to the fact that there are actually two bending modes forH2O2. In the Raman experiment the symmetric mode isobserved, while in the IR experiment the asymmetric mode ismainly contributing. According to the calculations (Table 1),these modes differ by more than 100 cm�1 and shift by 140 and87 cm�1, respectively, upon solvation.
Comparing the frequencies calculated with the fourdifferent solvation models shows that only the combinationof explicit water molecules in the first hydration shell with thecontinuum solvation model COSMO properly reproduces thesolvation effects. The continuum solvation model alone, as wellas the explicit first solvation shell without COSMO, is clearlyinsufficient. Overall, the agreement of the B3-LYP/def2-TZVPscaled frequencies with the available experimental data is quitegood. The root-mean-square deviation is 35 cm�1. The largestdeviations are +60 and �77 cm�1.
Fig. 2 ATR-IR absorbance spectra (p-polarisation) in O2 and Ar saturated 0.1 MHClO4 on Ge(100) in the direction of (a) more negative and (b) less negativepotential.
Paper PCCP
Ope
n A
cces
s A
rtic
le. P
ublis
hed
on 0
4 Ja
nuar
y 20
13. D
ownl
oade
d on
05/
04/2
017
11:3
9:09
. T
his
artic
le is
lice
nsed
und
er a
Cre
ativ
e C
omm
ons
Attr
ibut
ion-
Non
Com
mer
cial
3.0
Unp
orte
d L
icen
ce.
View Article Online
This journal is c the Owner Societies 2013 Phys. Chem. Chem. Phys., 2013, 15, 5771--5781 5775
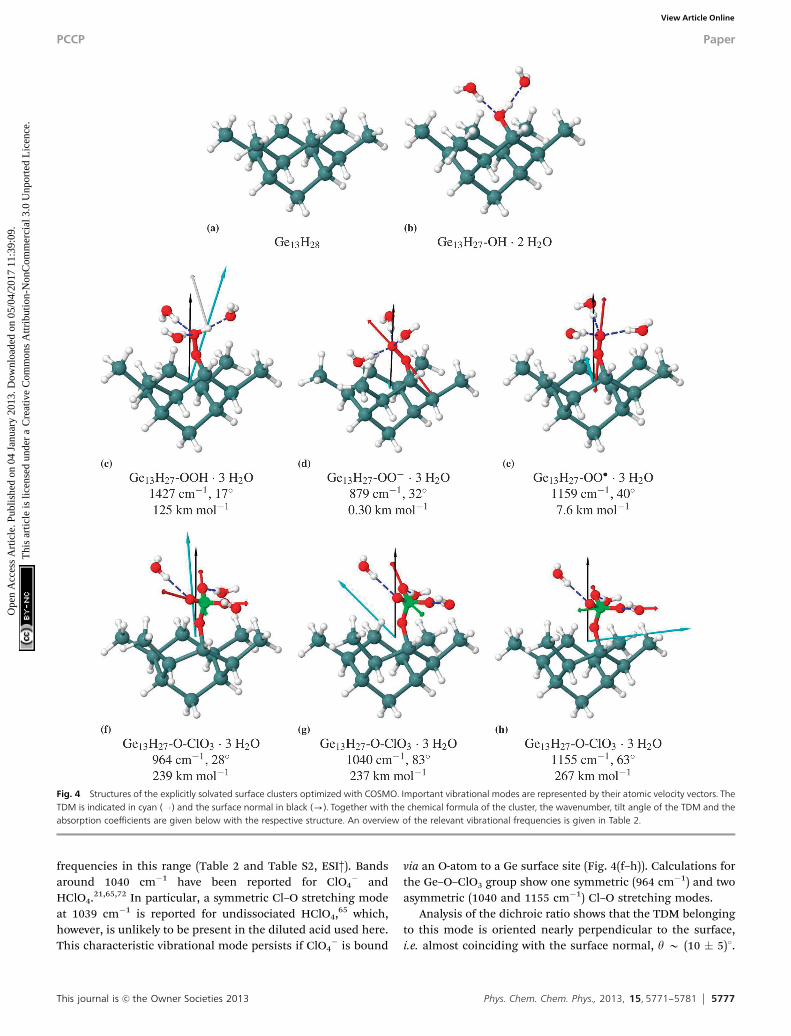
3.2.2 Vibrational frequencies and orientation of intermediatesat the Ge(100)/water interface. Binding motifs relevant for theobserved vibrational modes have been identified with DFTcalculation of clusters consisting of 3 Ge atoms. These resultsare listed in detail in the ESI.† Relevant species with vibrationalmodes in the range of interest have been used as starting pointfor calculations on Ge13H28 clusters that represent the spaceavailable at the fully hydrogenated Ge(100) surface (Fig. 4(a)).One of the two inward-pointing H-atoms at the central GeH2
groups was substituted by the ORR intermediates. All O–Hgroups and lone pairs were coordinated by H-bonding watermolecules as described for the solution species and solventpolarisation was accounted for using COSMO. The optimizedstructures are shown in Fig. 4 and the frequencies are summarizedin Table 2.
4 Discussion4.1 Discussion of the spectral interpretation of ATR-IR spectraduring ORR
4.1.1 Peak at 1210 cm�1. The major experimentallyobserved peak is centred at 1210 cm�1. The DFT calculations(Tables 1 and 2, Table S2, ESI†) show three potential ORRintermediates with frequencies around the experimentallyobserved 1210 cm�1: the OO stretching modes of O2
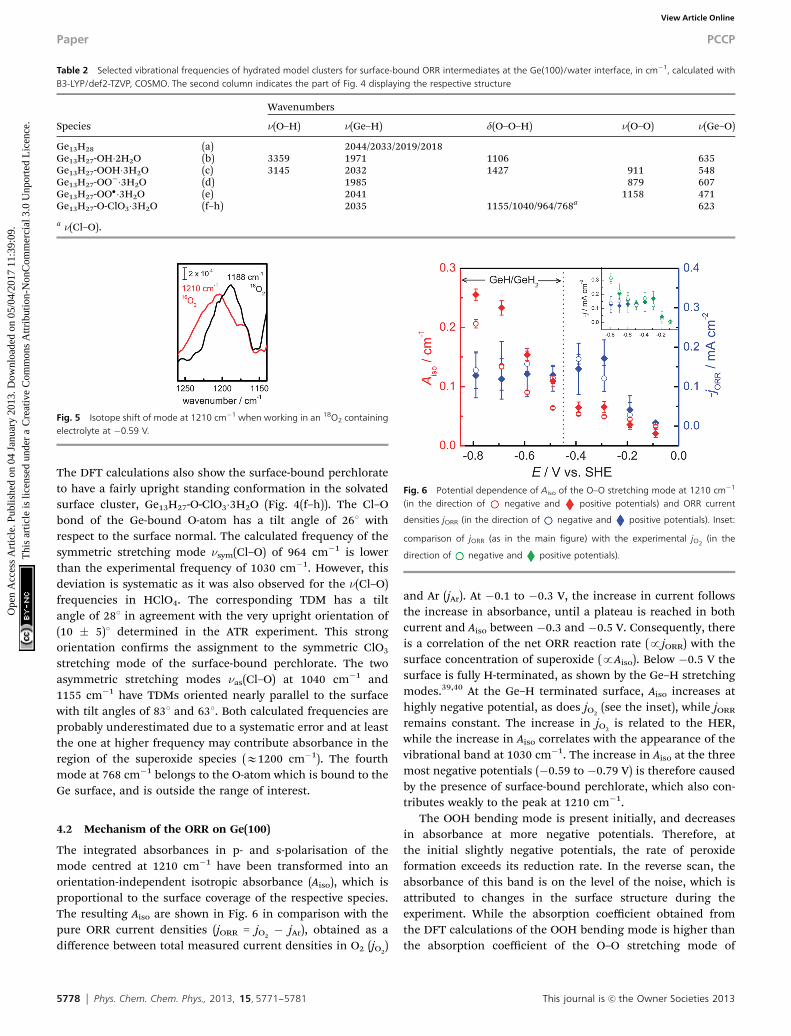
��, HOO�,and a surface-bound superoxide Ge–OO�. Similar electrochemicalATR-IR experiments as above were performed in 2H2O-basedelectrolytes to check for frequency shifts with hydrogen–deuteriumexchange. However, in 2H2O, the region around 1210 cm�1 cannotbe easily analysed experimentally due to strong absorption fromthe bending mode of 2H2O. No shifted peaks were found in theseexperiments. While these observations present already indirectevidence for the assignment of the peak at 1210 cm�1 to an O–Ostretching mode, direct evidence is the observation of an isotopeshift when using 18O2. For such experiments, the electrolyte wasinitially saturated with Ar, which was later replaced by 18O2.Subsequently, electrolyte was pumped into the spectroelectro-chemical cell. The spectrum in 18O2 at �0.59 V referencedagainst the spectrum in Ar shows a shift of the peak to lowerwavenumbers by 22 cm�1 (Fig. 5). Therefore, the O–O bondfrom the oxygen in the ORR must be a strong contributor to thevibrational mode causing the absorption. This experimentproves the assignment of the peak as the O–O stretching modeof an ORR intermediate – a superoxide according to thefrequency. However, distinguishing between O2
��, HOO� andGe–OO� only on the basis of the small differences in thecalculated frequencies would be ambiguous.
This peak cannot originate from an OOH bending mode. Inalkaline H2O2, the bending mode of HOO� is clearly observedat 1310 cm�1, and comparison to H2O2, where no peak isobserved at 1310 cm�1, supports the assignment as bendingmode of the HOO� anion (Fig. S2, ESI†). The vicinity of thesurface is not likely to shift the mode by more than a few cm�1.From the expected modes of ORR intermediates, only the O–Ostretching modes of superoxo-species are therefore in thespectral region where an absorption is observed experimentally.
From the dichroic ratio, a tilt angle y B (28 � 10)1 withrespect to the surface normal has been determined for the TDM ofthe band at 1210 cm�1, independent of the applied potential. Thewell-defined orientation of the TDM observed experimentallyindicates that the vibrational mode at 1210 cm�1 is predominantlydue to an intermediate covalently bound to the surface.
In the DFT calculations, the solvated model cluster for thesurface-bound superoxide radical, Ge13H27-OO��3H2O(Fig. 4(e)), also has a very upright O–O bond (tilt angle 181).
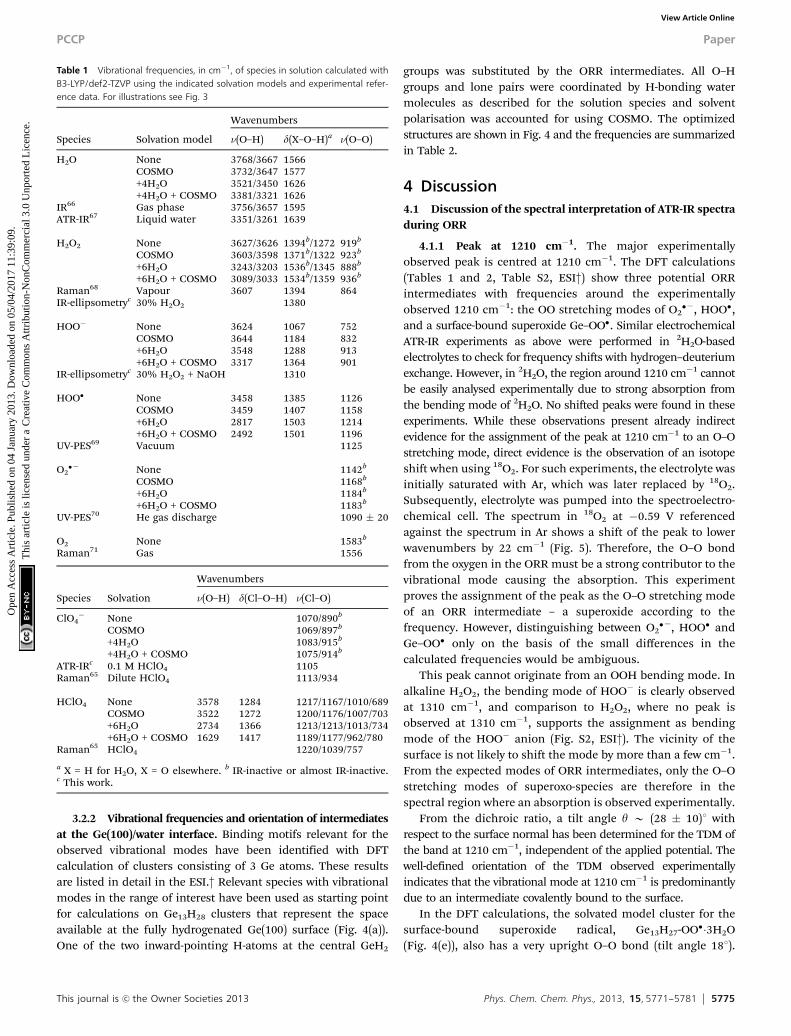
Table 1 Vibrational frequencies, in cm�1, of species in solution calculated withB3-LYP/def2-TZVP using the indicated solvation models and experimental refer-ence data. For illustrations see Fig. 3
Species Solvation model
Wavenumbers
n(O–H) d(X–O–H)a n(O–O)
H2O None 3768/3667 1566COSMO 3732/3647 1577+4H2O 3521/3450 1626+4H2O + COSMO 3381/3321 1626
IR66 Gas phase 3756/3657 1595ATR-IR67 Liquid water 3351/3261 1639
H2O2 None 3627/3626 1394b/1272 919b
COSMO 3603/3598 1371b/1322 923b
+6H2O 3243/3203 1536b/1345 888b
+6H2O + COSMO 3089/3033 1534b/1359 936b
Raman68 Vapour 3607 1394 864IR-ellipsometryc 30% H2O2 1380
HOO� None 3624 1067 752COSMO 3644 1184 832+6H2O 3548 1288 913+6H2O + COSMO 3317 1364 901
IR-ellipsometryc 30% H2O2 + NaOH 1310
HOO� None 3458 1385 1126COSMO 3459 1407 1158+6H2O 2817 1503 1214+6H2O + COSMO 2492 1501 1196
UV-PES69 Vacuum 1125
O2�� None 1142b
COSMO 1168b
+6H2O 1184b
+6H2O + COSMO 1183b
UV-PES70 He gas discharge 1090 � 20
O2 None 1583b
Raman71 Gas 1556
Species Solvation
Wavenumbers
n(O–H) d(Cl–O–H) n(Cl–O)
ClO4� None 1070/890b
COSMO 1069/897b
+4H2O 1083/915b
+4H2O + COSMO 1075/914b
ATR-IRc 0.1 M HClO4 1105Raman65 Dilute HClO4 1113/934
HClO4 None 3578 1284 1217/1167/1010/689COSMO 3522 1272 1200/1176/1007/703+6H2O 2734 1366 1213/1213/1013/734+6H2O + COSMO 1629 1417 1189/1177/962/780
Raman65 HClO4 1220/1039/757
a X = H for H2O, X = O elsewhere. b IR-inactive or almost IR-inactive.c This work.
PCCP Paper
Ope
n A
cces
s A
rtic
le. P
ublis
hed
on 0
4 Ja
nuar
y 20
13. D
ownl
oade
d on
05/
04/2
017
11:3
9:09
. T
his
artic
le is
lice
nsed
und
er a
Cre
ativ
e C
omm
ons
Attr
ibut
ion-
Non
Com
mer
cial
3.0
Unp
orte
d L
icen
ce.
View Article Online
5776 Phys. Chem. Chem. Phys., 2013, 15, 5771--5781 This journal is c the Owner Societies 2013
The stretching mode n(O–O) at 1159 cm�1 is in good agreementwith the experimental value of 1210 cm�1. The tilt angle of thecalculated TDM of 401 is in reasonable agreement with theexperimental tilt angle of (28 � 10)1.
4.1.2 Peak at 1385 cm�1. The band at 1385 cm�1 isassigned to the O–O–H bending mode of a peroxide, whichcould originate either from H2O2, from HOO�, or from surface-bound Ge–OOH according to the DFT calculations (Tables 1, 2and Table S2, ESI†). In control experiments, the bending modeof H2O2 is observed at 1380 cm�1, while the OOH� bendingmode is found at 1310 cm�1 (Fig. S2(b), ESI†), which rules outOOH� as the origin of the 1385 cm�1 band.
Comparing the peak frequency of the OOH bending mode inH2O2 to the one observed in ORR experiments at 1385 cm�1
gives agreement within 5 cm�1. However, the mode on the Gesurface observed during ORR has a full width at half maximumof 20 cm�1, while in H2O2 it is much wider (FWHM 150 cm�1).Contributing to the width for the absorption in the bulk spectrais likely the fact that (i) each molecule has two normal modesaround 1400 cm�1, and (ii) these modes are slightly shifted fordifferent conformations and solvation states of H2O2.
For this absorption, an orientation of y B (35 � 10)1 hasbeen determined at potentials where the peak is clearlyobserved in the spectra, i.e. at the initial three potentials.
The observed very narrow peak in the ORR experiments,together with the dichroism observed, leads to the assignmentof this mode to surface-bound peroxide, as opposed to bulkH2O2.
The surface model cluster with a solvated Ge-bound per-oxide group, Ge13H27-OOH�3H2O (Fig. 4(c)), has a fairly uprightO–O bond tilted 151 with respect to the surface normal.The neighbouring GeH2 groups and the space required by thesolvation shell enforce this upright orientation (Fig. 4(c)). Thesolvated cluster shows a bending mode d(O–O–H) at 1427 cm�1
in good agreement with the observed frequency at 1385 cm�1.The corresponding TDM is tilted by 171. This is in acceptableagreement with the experimental tilt angle of (35 � 10)1.It should be noted that only one representative structure hasbeen calculated. More accurate simulations would have tosample thermal motion of the functional group and fluctuationsin the solvation shell.
4.1.3 Peak at 1030 cm�1. The peak centred around 1030 cm�1
is also ORR-related as it does not appear in the control experimentunder Ar. However, the frequency is unusual for an O–O stretchingvibration lying between the ranges observed for superoxide andperoxide species.22,30 Calculations of model compounds corres-ponding to superoxides or peroxides in different geometricalarrangements on Ge(100) and different binding sites fail to show
Fig. 3 Structures and selected vibrational modes, including absorption coefficient, of the explicitly solvated molecules calculated with COSMO. Overview ofvibrational frequencies at different solvation models, see Table 1. Hydrogen bonds are depicted as . The motion of the atoms during the respective vibrationalmodes are indicated as arrows in the color of the respective atom. The direction and magnitude of the TDM are shown as arrows in cyan ( ).
Paper PCCP
Ope
n A
cces
s A
rtic
le. P
ublis
hed
on 0
4 Ja
nuar
y 20
13. D
ownl
oade
d on
05/
04/2
017
11:3
9:09
. T
his
artic
le is
lice
nsed
und
er a
Cre
ativ
e C
omm
ons
Attr
ibut
ion-
Non
Com
mer
cial
3.0
Unp
orte
d L
icen
ce.
View Article Online
This journal is c the Owner Societies 2013 Phys. Chem. Chem. Phys., 2013, 15, 5771--5781 5777
frequencies in this range (Table 2 and Table S2, ESI†). Bandsaround 1040 cm�1 have been reported for ClO4
� andHClO4.21,65,72 In particular, a symmetric Cl–O stretching modeat 1039 cm�1 is reported for undissociated HClO4,65 which,however, is unlikely to be present in the diluted acid used here.This characteristic vibrational mode persists if ClO4
� is bound
via an O-atom to a Ge surface site (Fig. 4(f–h)). Calculations forthe Ge–O–ClO3 group show one symmetric (964 cm�1) and twoasymmetric (1040 and 1155 cm�1) Cl–O stretching modes.
Analysis of the dichroic ratio shows that the TDM belongingto this mode is oriented nearly perpendicular to the surface,i.e. almost coinciding with the surface normal, y B (10 � 5)1.
Fig. 4 Structures of the explicitly solvated surface clusters optimized with COSMO. Important vibrational modes are represented by their atomic velocity vectors. TheTDM is indicated in cyan ( ) and the surface normal in black (-). Together with the chemical formula of the cluster, the wavenumber, tilt angle of the TDM and theabsorption coefficients are given below with the respective structure. An overview of the relevant vibrational frequencies is given in Table 2.
PCCP Paper
Ope
n A
cces
s A
rtic
le. P
ublis
hed
on 0
4 Ja
nuar
y 20
13. D
ownl
oade
d on
05/
04/2
017
11:3
9:09
. T
his
artic
le is
lice
nsed
und
er a
Cre
ativ
e C
omm
ons
Attr
ibut
ion-
Non
Com
mer
cial
3.0
Unp
orte
d L
icen
ce.
View Article Online
5778 Phys. Chem. Chem. Phys., 2013, 15, 5771--5781 This journal is c the Owner Societies 2013
The DFT calculations also show the surface-bound perchlorateto have a fairly upright standing conformation in the solvatedsurface cluster, Ge13H27-O-ClO3�3H2O (Fig. 4(f–h)). The Cl–Obond of the Ge-bound O-atom has a tilt angle of 261 withrespect to the surface normal. The calculated frequency of thesymmetric stretching mode nsym(Cl–O) of 964 cm�1 is lowerthan the experimental frequency of 1030 cm�1. However, thisdeviation is systematic as it was also observed for the n(Cl–O)frequencies in HClO4. The corresponding TDM has a tiltangle of 281 in agreement with the very upright orientation of(10 � 5)1 determined in the ATR experiment. This strongorientation confirms the assignment to the symmetric ClO3
stretching mode of the surface-bound perchlorate. The twoasymmetric stretching modes nas(Cl–O) at 1040 cm�1 and1155 cm�1 have TDMs oriented nearly parallel to the surfacewith tilt angles of 831 and 631. Both calculated frequencies areprobably underestimated due to a systematic error and at leastthe one at higher frequency may contribute absorbance in theregion of the superoxide species (E1200 cm�1). The fourthmode at 768 cm�1 belongs to the O-atom which is bound to theGe surface, and is outside the range of interest.
4.2 Mechanism of the ORR on Ge(100)
The integrated absorbances in p- and s-polarisation of themode centred at 1210 cm�1 have been transformed into anorientation-independent isotropic absorbance (Aiso), which isproportional to the surface coverage of the respective species.The resulting Aiso are shown in Fig. 6 in comparison with thepure ORR current densities (jORR = jO2
� jAr), obtained as adifference between total measured current densities in O2 (jO2
)
and Ar (jAr). At �0.1 to �0.3 V, the increase in current followsthe increase in absorbance, until a plateau is reached in bothcurrent and Aiso between �0.3 and �0.5 V. Consequently, thereis a correlation of the net ORR reaction rate (pjORR) with thesurface concentration of superoxide (pAiso). Below �0.5 V thesurface is fully H-terminated, as shown by the Ge–H stretchingmodes.39,40 At the Ge–H terminated surface, Aiso increases athighly negative potential, as does jO2
(see the inset), while jORR
remains constant. The increase in jO2is related to the HER,
while the increase in Aiso correlates with the appearance of thevibrational band at 1030 cm�1. The increase in Aiso at the threemost negative potentials (�0.59 to �0.79 V) is therefore causedby the presence of surface-bound perchlorate, which also con-tributes weakly to the peak at 1210 cm�1.
The OOH bending mode is present initially, and decreasesin absorbance at more negative potentials. Therefore, atthe initial slightly negative potentials, the rate of peroxideformation exceeds its reduction rate. In the reverse scan, theabsorbance of this band is on the level of the noise, which isattributed to changes in the surface structure during theexperiment. While the absorption coefficient obtained fromthe DFT calculations of the OOH bending mode is higher thanthe absorption coefficient of the O–O stretching mode of
Table 2 Selected vibrational frequencies of hydrated model clusters for surface-bound ORR intermediates at the Ge(100)/water interface, in cm�1, calculated withB3-LYP/def2-TZVP, COSMO. The second column indicates the part of Fig. 4 displaying the respective structure
Species
Wavenumbers
n(O–H) n(Ge–H) d(O–O–H) n(O–O) n(Ge–O)
Ge13H28 (a) 2044/2033/2019/2018Ge13H27-OH�2H2O (b) 3359 1971 1106 635Ge13H27-OOH�3H2O (c) 3145 2032 1427 911 548Ge13H27-OO��3H2O (d) 1985 879 607Ge13H27-OO��3H2O (e) 2041 1158 471Ge13H27-O-ClO3�3H2O (f–h) 2035 1155/1040/964/768a 623
a n(Cl–O).
Fig. 5 Isotope shift of mode at 1210 cm�1 when working in an 18O2 containingelectrolyte at �0.59 V.
Fig. 6 Potential dependence of Aiso of the O–O stretching mode at 1210 cm�1
(in the direction of negative and positive potentials) and ORR current
densities jORR (in the direction of negative and positive potentials). Inset:
comparison of jORR (as in the main figure) with the experimental jO2(in the
direction of negative and positive potentials).
Paper PCCP
Ope
n A
cces
s A
rtic
le. P
ublis
hed
on 0
4 Ja
nuar
y 20
13. D
ownl
oade
d on
05/
04/2
017
11:3
9:09
. T
his
artic
le is
lice
nsed
und
er a
Cre
ativ
e C
omm
ons
Attr
ibut
ion-
Non
Com
mer
cial
3.0
Unp
orte
d L
icen
ce.
View Article Online
This journal is c the Owner Societies 2013 Phys. Chem. Chem. Phys., 2013, 15, 5771--5781 5779
surface-bound superoxide by a factor of 20, its observed absorbanceis considerably lower. To explain this observation, it should benoted that the absorbance is a function of the concentration at andnear the Ge/electrolyte interface. The concentration of the surface-bound peroxide is therefore considerably lower than the concen-tration of surface-bound superoxide.
The absorbance of surface-bound perchlorate at 1030 cm�1
correlates with the HER current. This absorption is, however,not present in Ar, therefore is not related to the HER alone. Thisspecies may form in a side reaction of the ORR. However, it mayalso point to the active involvement of the electrolyte inthe ORR.
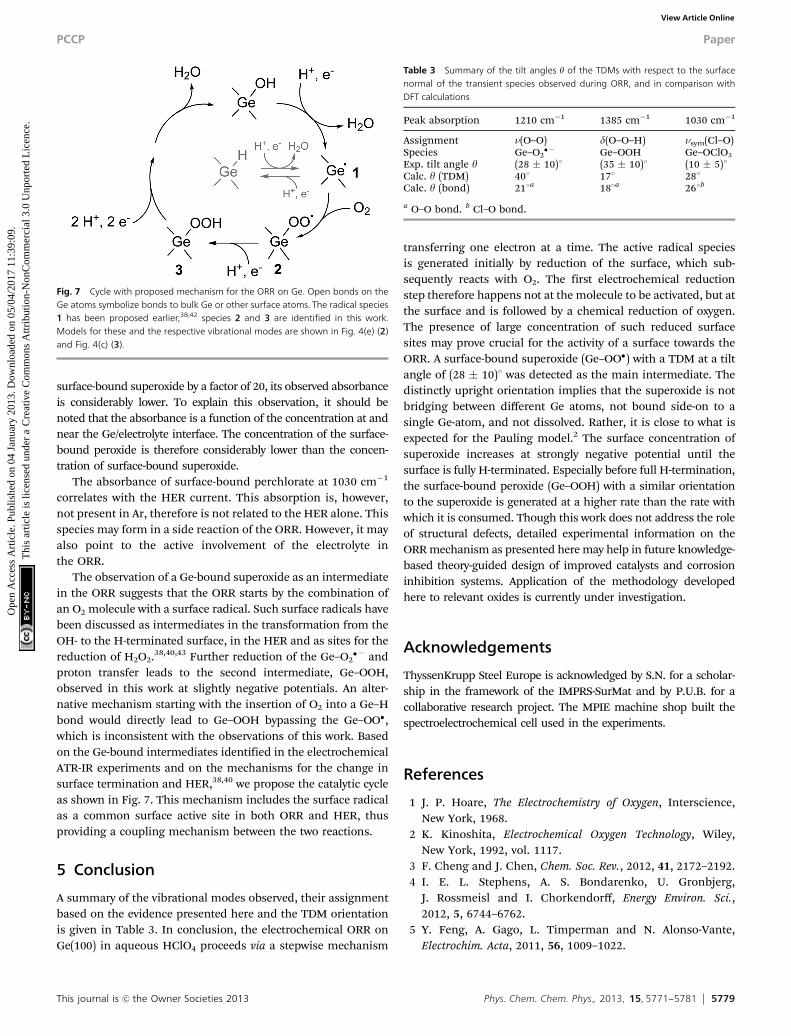
The observation of a Ge-bound superoxide as an intermediatein the ORR suggests that the ORR starts by the combination ofan O2 molecule with a surface radical. Such surface radicals havebeen discussed as intermediates in the transformation from theOH- to the H-terminated surface, in the HER and as sites for thereduction of H2O2.38,40,43 Further reduction of the Ge–O2
�� andproton transfer leads to the second intermediate, Ge–OOH,observed in this work at slightly negative potentials. An alter-native mechanism starting with the insertion of O2 into a Ge–Hbond would directly lead to Ge–OOH bypassing the Ge–OO�,which is inconsistent with the observations of this work. Basedon the Ge-bound intermediates identified in the electrochemicalATR-IR experiments and on the mechanisms for the change insurface termination and HER,38,40 we propose the catalytic cycleas shown in Fig. 7. This mechanism includes the surface radicalas a common surface active site in both ORR and HER, thusproviding a coupling mechanism between the two reactions.
5 Conclusion
A summary of the vibrational modes observed, their assignmentbased on the evidence presented here and the TDM orientationis given in Table 3. In conclusion, the electrochemical ORR onGe(100) in aqueous HClO4 proceeds via a stepwise mechanism
transferring one electron at a time. The active radical speciesis generated initially by reduction of the surface, which sub-sequently reacts with O2. The first electrochemical reductionstep therefore happens not at the molecule to be activated, but atthe surface and is followed by a chemical reduction of oxygen.The presence of large concentration of such reduced surfacesites may prove crucial for the activity of a surface towards theORR. A surface-bound superoxide (Ge–OO�) with a TDM at a tiltangle of (28 � 10)1 was detected as the main intermediate. Thedistinctly upright orientation implies that the superoxide is notbridging between different Ge atoms, not bound side-on to asingle Ge-atom, and not dissolved. Rather, it is close to what isexpected for the Pauling model.2 The surface concentration ofsuperoxide increases at strongly negative potential until thesurface is fully H-terminated. Especially before full H-termination,the surface-bound peroxide (Ge–OOH) with a similar orientationto the superoxide is generated at a higher rate than the rate withwhich it is consumed. Though this work does not address the roleof structural defects, detailed experimental information on theORR mechanism as presented here may help in future knowledge-based theory-guided design of improved catalysts and corrosioninhibition systems. Application of the methodology developedhere to relevant oxides is currently under investigation.
Acknowledgements
ThyssenKrupp Steel Europe is acknowledged by S.N. for a scholar-ship in the framework of the IMPRS-SurMat and by P.U.B. for acollaborative research project. The MPIE machine shop built thespectroelectrochemical cell used in the experiments.
References
1 J. P. Hoare, The Electrochemistry of Oxygen, Interscience,New York, 1968.
2 K. Kinoshita, Electrochemical Oxygen Technology, Wiley,New York, 1992, vol. 1117.
3 F. Cheng and J. Chen, Chem. Soc. Rev., 2012, 41, 2172–2192.4 I. E. L. Stephens, A. S. Bondarenko, U. Gronbjerg,
J. Rossmeisl and I. Chorkendorff, Energy Environ. Sci.,2012, 5, 6744–6762.
5 Y. Feng, A. Gago, L. Timperman and N. Alonso-Vante,Electrochim. Acta, 2011, 56, 1009–1022.
Fig. 7 Cycle with proposed mechanism for the ORR on Ge. Open bonds on theGe atoms symbolize bonds to bulk Ge or other surface atoms. The radical species1 has been proposed earlier,38,42 species 2 and 3 are identified in this work.Models for these and the respective vibrational modes are shown in Fig. 4(e) (2)and Fig. 4(c) (3).
Table 3 Summary of the tilt angles y of the TDMs with respect to the surfacenormal of the transient species observed during ORR, and in comparison withDFT calculations
Peak absorption 1210 cm�1 1385 cm�1 1030 cm�1
Assignment n(O–O) d(O–O–H) nsym(Cl–O)Species Ge–O2
�� Ge–OOH Ge–OClO3
Exp. tilt angle y (28 � 10)1 (35 � 10)1 (10 � 5)1Calc. y (TDM) 401 171 281Calc. y (bond) 211a 181a 261b
a O–O bond. b Cl–O bond.
PCCP Paper
Ope
n A
cces
s A
rtic
le. P
ublis
hed
on 0
4 Ja
nuar
y 20
13. D
ownl
oade
d on
05/
04/2
017
11:3
9:09
. T
his
artic
le is
lice
nsed
und
er a
Cre
ativ
e C
omm
ons
Attr
ibut
ion-
Non
Com
mer
cial
3.0
Unp
orte
d L
icen
ce.
View Article Online

5780 Phys. Chem. Chem. Phys., 2013, 15, 5771--5781 This journal is c the Owner Societies 2013
6 F. Jaouen, E. Proietti, M. Lefevre, R. Chenitz, J.-P. Dodelet,G. Wu, H. T. Chung, C. M. Johnston and P. Zelenay, EnergyEnviron. Sci., 2011, 4, 114–130.
7 N. Ramaswamy and S. Mukerjee, Adv. Phys. Chem., 2012,2012, 491604.
8 J. D. Wiggins-Camacho and K. J. Stevenson, J. Phys. Chem. C,2011, 115, 20002–20010.
9 E. M. Erickson, M. S. Thorum, R. Vasic, N. S. Marinkovic,A. I. Frenkel, A. A. Gewirth and R. G. Nuzzo, J. Am. Chem.Soc., 2012, 134, 197–200.
10 J.-M. Noel, A. Latus, C. Lagrost, E. Volanschi and P. Hapiot,J. Am. Chem. Soc., 2012, 134, 2835–2841.
11 N. Lopez, D. J. Graham, R. McGuire, G. E. Alliger, Y. Shao-Horn, C. C. Cummins and D. G. Nocera, Science, 2012, 335,450–453.
12 N. Anastasijevic, V. Vesovic and R. R. Adzic, J. Electroanal.Chem., 1987, 229, 305–316.
13 J. K. Nørskov, J. Rossmeisl, A. Logadottir, L. Lindqvist,J. R. Kitchin, T. Bligaard and H. Jonsson, J. Phys. Chem. B,2004, 108, 17886–17892.
14 Y. Wang and P. B. Balbuena, J. Phys. Chem. B, 2005, 109,14896–14907.
15 T. Jacob and W. A. Goddard, ChemPhysChem, 2006, 7,992–1005.
16 S. Walch, A. Dhanda, M. Aryanpour and H. Pitsch, J. Phys.Chem. C, 2008, 112, 8464–8475.
17 J. S. Spendelow and A. Wieckowski, Phys. Chem. Chem. Phys.,2007, 9, 2654–2675.
18 A. A. Gewirth and M. S. Thorum, Inorg. Chem., 2010, 49,3557–3566.
19 H. S. Wroblowa, Y.-C. Pan and G. Razumney, J. Electroanal.Chem. Interfacial Electrochem., 1976, 69, 195–201.
20 B. B. Blizanac, A. C. Lucas, E. M. Gallagher, M. Arenz,N. P. Ross and M. N. Markovic, J. Phys. Chem. B, 2004,108, 625–634.
21 X. Li and A. A. Gewirth, J. Am. Chem. Soc., 2005, 127, 5252.22 T. Itoh, T. Maeda and A. Kasuya, Faraday Discuss., 2006, 132,
95–109.23 M. Shao, P. Liu and R. R. Adzic, J. Am. Chem. Soc., 2006, 128,
7408–7409.24 J. Brooker, P. A. Christensen, A. Hamnett and R. He, Faraday
Discuss., 1992, 94, 339–360.25 T. Itoh, K. Abe, K. Dokko, M. Mohamedi, I. Uchida and
A. Kasuya, J. Electrochem. Soc., 2004, 151, A2042–A2046.26 M. H. Shao and R. R. Adzic, J. Phys. Chem. B, 2005, 109,
16563–16566.27 J. Kim and A. A. Gewirth, J. Phys. Chem. B, 2006, 110,
2565–2571.28 Y. Ayato, K. Kunimatsu, M. Osawa and T. Okadaa,
J. Electrochem. Soc., 2006, 153, A203–A209.29 K. Kunimatsu, T. Yoda, D. A. Tryk, H. Uchida and
M. Watanabe, Phys. Chem. Chem. Phys., 2010, 12, 621–629.30 C. Pettenkofer, I. Pockrand and A. Otto, Surf. Sci., 1983, 135,
52–64.31 P. Vassilev and M. T. M. Koper, J. Phys. Chem. C, 2007, 111,
2607–2613.
32 J. A. Keith, G. Jerkiewicz and T. Jacob, ChemPhysChem, 2010,11, 779–2794.
33 J. B. MacNaughton, L.-A. Naslund, T. Anniyev, H. Ogasawaraand A. Nilsson, Phys. Chem. Chem. Phys., 2010, 12, 5712–5716.
34 A. Gonchar, T. Risse, H.-J. Freund, L. Giordano, C. DiValentin and G. Pacchioni, Angew. Chem., Int. Ed., 2011,50, 2635–2638.
35 K. Bohnenkamp and H. Engell, Z. Elektrochem., 1957, 61,1184–1196.
36 A. W. Hassel and J. W. Schultze, Passivity of Metals, Alloys,and Semiconductors, in Encyclopedia of Electrochemistry,Volume 4, Corrosion and Oxide Films, ed. M. Stratmannand G. S. Frankel, Wiley-VCH, Weinheim, 2003, pp. 216–270.
37 K. Gong, F. Du, Z. Xia, M. Durstock and L. Dai, Science, 2009,323, 760–764.
38 R. Memming and G. Neumann, J. Electroanal. Chem., 1969,21, 295–305.
39 F. Maroun, F. Ozanam and J.-N. Chazalviel, J. Phys. Chem. B,1999, 103, 5280–5288.
40 J.-N. Chazalviel, A. Belaıdi, M. Safi, F. Maroun, B. Erne andF. Ozanam, Electrochim. Acta, 2000, 45, 3205–3211.
41 F. Maroun, J.-N. Chazalviel, F. Ozanam and D. Lincot,J. Electroanal. Chem., 2003, 549, 161–163.
42 A. Maurer, W. Mindt and H. Gerischer, Surf. Sci., 1966, 4,431–439.
43 H. Gerischer and W. Mindt, Surf. Sci., 1966, 4, 440–451.44 W. Brattain and C. Garrett, Bell Syst. Tech. J., 1955, 34,
129–176.45 A. Erbe, http://home.arcor.de/aerbe/en/prog/spectraltools.
html, 2012.46 E. Goormaghtigh, V. Raussens and J.-M. Ruysschaert,
Biochim. Biophys. Acta, Biomembr., 1999, 1422, 105–185.47 N. Harrick, Internal Reflection Spectroscopy, Harrick Scientific,
1987.48 A. Erbe, R. J. Bushby, S. D. Evans and L. J. C. Jeuken, J. Phys.
Chem. B, 2007, 111, 3515–3524.49 G. Gonella, H.-L. Dai, H. C. Fry, M. J. Therien, V. Krishnan,
A. Tronin and J. K. Blasie, J. Am. Chem. Soc., 2010, 132,9693–9700.
50 P. Wenzl, M. Fringeli, J. Goette and U. P. Fringeli, Langmuir,1994, 10, 4253–4264.
51 TURBOMOLE V6.2 2010, a development of Universityof Karlsruhe and Forschungszentrum Karlsruhe GmbH,1989–2007, TURBOMOLE GmbH, since 2007; available fromhttp://www.turbomole.com.
52 A. D. Becke, Phys. Rev. A: At., Mol., Opt. Phys., 1988, 38,3098–3100.
53 C. Lee, W. Yang and R. G. Parr, Phys. Rev. B: Condens. MatterMater. Phys., 1988, 37, 785–789.
54 A. D. Becke, J. Chem. Phys., 1993, 98, 5648–5652.55 F. Weigend and R. Ahlrichs, Phys. Chem. Chem. Phys., 2005,
7, 3297–3305.56 F. Weigend, Phys. Chem. Chem. Phys., 2006, 8, 1057–1065.57 F. Weigend, Phys. Chem. Chem. Phys., 2002, 4, 4285–4291.58 P. Deglmann, F. Furche and R. Ahlrichs, Chem. Phys. Lett.,
2002, 362, 511–518.
Paper PCCP
Ope
n A
cces
s A
rtic
le. P
ublis
hed
on 0
4 Ja
nuar
y 20
13. D
ownl
oade
d on
05/
04/2
017
11:3
9:09
. T
his
artic
le is
lice
nsed
und
er a
Cre
ativ
e C
omm
ons
Attr
ibut
ion-
Non
Com
mer
cial
3.0
Unp
orte
d L
icen
ce.
View Article Online
This journal is c the Owner Societies 2013 Phys. Chem. Chem. Phys., 2013, 15, 5771--5781 5781
59 P. Deglmann and F. Furche, J. Chem. Phys., 2002, 117,9535–9538.
60 A. Klamt, J. Phys. Chem., 1996, 100, 3349–3353.61 P. Sinha, S. E. Boesch, C. Gu, R. A. Wheeler and
A. K. Wilson, J. Phys. Chem. A, 2004, 108, 9213–9217.62 A. Klamt and G. Schuurmann, J. Chem. Soc., Perkin Trans. 2,
1993, 799–805.63 L. Bencivenni, R. Caminiti, A. Feltrin, F. Ramondo and
C. Sadun, J. Mol. Struct. (THEOCHEM), 1992, 257,369–403.
64 A. Karelin, Z. Grigorovich and V. Rosolovskii, Spectrochim.Acta, Part A, 1975, 31, 765–775.
65 C. I. Ratcliffe and D. E. Irish, Can. J. Chem., 1984, 62,1134–1144.
66 T. Shimanouchi, Tables of Molecular Vibrational FrequenciesConsolidated Volume I, National Bureau of Standards,Gaithersburg, 1972.
67 S. E. Lappi, B. Smith and S. Franzen, Spectrochim. Acta, PartA, 2004, 60, 2611–2619.
68 P. A. Giguere and T. K. K. Srinivasan, J. Raman Spectrosc.,1974, 2, 125–132.
69 T. M. Ramond, S. J. Blanksby, S. Kato, V. M. Bierbaum,G. E. Davico, R. L. Schwartz, W. C. Lineberger andG. B. Ellison, J. Phys. Chem. A, 2002, 106, 9641–9647.
70 K. M. Ervin, I. Anusiewicz, P. Skurski, J. Simons andW. C. Lineberger, J. Phys. Chem. A, 2003, 107, 8521–8529.
71 A. Weber and E. A. McGinnis, J. Mol. Spectrosc., 1960, 4, 195–200.72 X. Li and A. A. Gewirth, J. Raman Spectrosc., 2005, 36, 715–724.
PCCP Paper
Ope
n A
cces
s A
rtic
le. P
ublis
hed
on 0
4 Ja
nuar
y 20
13. D
ownl
oade
d on
05/
04/2
017
11:3
9:09
. T
his
artic
le is
lice
nsed
und
er a
Cre
ativ
e C
omm
ons
Attr
ibut
ion-
Non
Com
mer
cial
3.0
Unp
orte
d L
icen
ce.
View Article Online