Embed Size (px)
Citation preview
Physical Climate Risk and Vulnerability
Assessment
India Analysis JUNE 2021
2
Physical Climate Risk and Vulnerability Assessment: India Analysis
Publication Date: June 2021
Cotton 2040 Project Lead:
Hannah Cunneen
Forum for the Future
3rd Floor, 22-26 Paul Street
London, EC2A 4QE
United Kingdom
Cotton 2040 Technical Lead:
Erin Owain
Willis Towers Watson
51 Lime Street
London, EC3M 7DQ
United Kingdom
Authors:
Uma Pal
Amanda Rycerz
Álvaro Linares
Richard Bater
Approved by:
Alastair Baglee
Disclaimer
This Physical climate risk and vulnerability assessment: India analysis (the “Report”) is provided for the sole purpose of the Cotton 2040 project (the “Project”).
All information provided in the Report has been collected and provided for the sole purpose of the Project at a high level. The Report may comprise estimated summaries or projections of exposure based on certain underlying data and assumptions discussed in various workshops which included Willis Towers Watson (“WTW”), Forum for the Future and other Project stakeholders. WTW is not responsible for the underlying data (which is or may be supplied by WTW clients) or the manner in which such data is presented and it will not be audited by WTW.
WTW does not make any representation or warranty, express or implied, as to the accuracy, integrity or completeness of the underlying information/data or its presentation and nothing contained in such summaries, projections or reports may be relied upon as a promise, warranty or representation, whether as to the past or the future and no representation can be made as to the accuracy or completeness of the Report. WTW does not recommend making decisions based solely on the information contained in this Report. Rather, this report should be viewed as a supplement to other information, including specific business practice, experience, and financial situation. WTW makes no representation about and does not guarantee outcomes, results, success, or profitability of any venture taken as a result of this Report, whether or not such programme or venture applies the content of this Report.
This Report speaks only as to the date on which it was created. WTW and WTW's group undertakings shall have no obligation to update or amend any information contained in this Report, unless specifically requested and instructed to do so by Forum for the Future. This Report is not prepared for and should not be construed as providing investment advice or services.
WTW and WTW's group undertakings shall not be liable to Forum for the Future in respect of this Report other than in accordance with the terms of the Agreement. The limitations on liability in this disclaimer do not apply to losses or damage caused by death, personal injury, dishonesty or any other liability which cannot be excluded by law.
Users who download this Report shall be deemed to be in acceptance of the above.
Cover photo: C&A Foundation image. Credit: Dinesh Khanna for C&A Foundation
3
Physical Climate Risk and Vulnerability Assessment: India Analysis
About Cotton 2040
Convened by Forum for the Future with support from Laudes Foundation, Cotton 2040 is a multi-
stakeholder initiative with a mission to facilitate the shift to a sustainable global cotton industry
which is resilient in a changing climate; which uses business models that support sustainable
production and livelihoods; and where sustainably produced cotton is the norm. Find out more:
https://www.forumforthefuture.org/cotton-2040.
This India analysis is one of two reports published as part of the Cotton 2040 Climate Adaptation
workstream. An additional study provides a global analysis of physical climate risks to the cotton
growing regions. Both reports, alongside an interactive climate impacts map and supporting
resources are available at http://www.acclimatise.uk.com/collaborations/cotton-2040/.
About Forum for the Future
Forum for the Future is a leading international sustainability non-profit. For 25 years we’ve been
working in partnership with business, governments and civil society to accelerate the
transformation toward a just and regenerative future. We use our systems change and futures
expertise to help tackle critical global challenges: the climate emergency, transforming our food
and farming systems, and ensuring supply chains are more resilient and more equitable. We also
enable long-term, transformative change by equipping individuals and organisations to act more
systemically. Find out more at http://www.forumforthefuture.org or by following
@Forum4theFuture on Twitter.
About Acclimatise
Since November 2020 Acclimatise is wholly owned by leading global advisory, broking and
solutions company Willis Towers Watson. The Acclimatise team is now part of Willis Towers
Watson's Climate and Resilience Hub (CRH). The CRH is a market leading centre of climate
adaptation expertise, supported by the Willis Research Network, a network of more than 60
organizations in science, academia, think tanks and the private sector working to improve the
understanding and quantification of risk, with the aim to improve the resilience of our clients and
society as a whole. Learn more at: https://www.willistowerswatson.com/en-GB/Insights/research-
programs-and-collaborations/climate-and-resilience-hub.
About Willis Towers Watson
Willis Towers Watson (NASDAQ: WLTW) is a leading global advisory, broking and solutions
company that helps clients around the world turn risk into a path for growth. With roots dating to
1828, Willis Towers Watson has 45,000 employees serving more than 140 countries and markets.
We design and deliver solutions that manage risk, optimize benefits, cultivate talent, and expand
the power of capital to protect and strengthen institutions and individuals. Our unique perspective
allows us to see the critical intersections between talent, assets and ideas — the dynamic formula
that drives business performance. Together, we unlock potential. Learn more at
www.willistowerswatson.com.
4
Physical Climate Risk and Vulnerability Assessment: India Analysis
Table of Contents
Foreword ........................................................................................................................................................................................ 5
Part A: Background, context and research objectives........................................................................... 7
1. Background: The climate-cotton nexus in India ............................................................................................... 7
2. Context: India’s cotton and textile sector ........................................................................................................... 11
3. Research objectives ..................................................................................................................................................... 14
Part B: Climate risk scores ........................................................................................................................... 16
Section 1: Results of the cotton cultivation CRVA: Farmer and field .............................................................. 16
1. Cotton cultivation in the focus states .................................................................................................................. 16
2. Results: Climate risk score ....................................................................................................................................... 20
Section 2: Results of the cotton processing CRVA: Field to factory ............................................................ 28
3. Cotton processing in the focus states ............................................................................................................... 28
4. Results: Climate risk score ....................................................................................................................................... 30
Section 3: Summary of the main findings .................................................................................................................... 37
Part C: Discussion: Paving the way forward ........................................................................................... 38
Next steps ........................................................................................................................................................ 59
Glossary ....................................................................................................................................................................................... 59
Acronyms ..................................................................................................................................................................................... 61
Appendix 1: Methodology .................................................................................................................................................... 62
Appendix 2: Full list of indicators reviewed ................................................................................................................ 74
Appendix 3: Metadata table: Cotton cultivation CRVA 1 ..................................................................................... 89
Appendix 4: Metadata table: Cotton processing CRVA 2 ................................................................................ 107
Appendix 5: Results: Cotton cultivation CRVA 1 ..................................................................................................... 117
Appendix 6: Results: Cotton processing CRVA 2 ................................................................................................. 120
Appendix 7: Summary of the main drivers of risk ................................................................................................ 123
5
Physical Climate Risk and Vulnerability Assessment: India Analysis
Foreword
Welcome to the India Climate Risk and Vulnerability Assessment report, which focuses on the
climate risks to cotton growing and production. This work was completed by WTW, in partnership
with international sustainability non-profit Forum for the Future, as part of the Cotton 2040
initiative. This detailed report, a flagship publication for Cotton 2040, is complemented by a broad
Global report, both of which are generated in response to the lack of comprehensive, readily
available information about how the climate crisis is likely to impact cotton production, its supply
chain, and the nature of the industry over the coming decades.
The Cotton 2040 initiative was originally established to bring together existing initiatives to align
around critical issues for - and accelerate the transition to - long term sustainability. In the context
of climate breakdown, this goes beyond standards, certification or corporate commitments.
Whether adequately prepared or not, the cotton system will be forced to change in the face of the
dramatic changes that our warming climate will catalyse. With this report, our intention is to offer
this data and analysis to spark a dialogue that will lead to joined up and informed action, and
resilient responses that are deliberate, collaborative and systemic.
The cotton industry, like many others, is unprepared for the changes that the growing climate crisis
is bringing. Already, the sector is hard-pressed to address deeply entrenched environmental, social
and economic challenges1 across its supply chains. As this report amply demonstrates, these pre-
existing vulnerabilities and inequalities will be exacerbated and accelerated by a warming climate.
In other words, those actors and elements of the value chain that are already vulnerable will come
under even greater pressure, and suffer increasing pressures. Most industry-wide conversations
and plans don’t begin to address the scale of change that the climate crisis, if it continues on its
current course (and even if ambitious steps are taken now), will force upon the industry, and the
world.
India, as the world’s largest cotton producing region, faces particular challenges that this report
covers in detail. Climate threats will have profound effects, and in many cases present enormous
difficulties for farmers and other actors across the value chain. These impacts will require a
response that goes beyond incremental solutions to fundamental changes. We need to radically
rethink where, how and why cotton is produced and traded, and what the future holds for this
economically and culturally important fibre.
This is not just a theoretical exercise for the future. Change is not just on the horizon, it is happening
now. In India there is already a clear pattern of an increasing number of days over 40°C, and
changes to the monsoon patterns resulting in the extremes of floods and droughts. The trend
towards increasing unpredictability and volatility of weather events is already in play. We are on
the pathway to a different world, and the changes will only accelerate.
While the focus of this report starts with the physical impacts of climate breakdown, what emerges
is the interrelationship between climate risk and climate vulnerability. The risks posed by a
changing climate will, like the COVID-19 pandemic, expose and deepen pre-existing vulnerabilities
and inequalities. In an already polarised society, the effects of climate change are likely to
exacerbate gaps and tensions, straining the fabric of society and putting increasing pressure on
already fragile supply chains. These converging risks, that span climate, livelihoods, economics,
politics and security, demonstrate the deeply systemic threat that climate change poses. The
1 For a description of the challenges associated with the cotton industry, see the CottonUP Guide http://cottonupguide.org/
6
Physical Climate Risk and Vulnerability Assessment: India Analysis
effects of climate breakdown on cotton in India alone will have effects all across the global supply
chain.
A systemic threat requires systemic solutions. In considering the impacts of climate change, it is
critical to emphasise that if we are to develop an adequate response, our focus needs to look well
beyond understanding the changes in the weather. We need to not only find ways to build
environmental and social resilience into supply chains, but halt the downward spiral of the most
vulnerable which will cost humanity and society so much more over time. Humanitarian crises have
clearly demonstrated the economic argument for investing in resilience to avoid greater costs in
responding to disasters.i
The information in this report needs to be considered not just for the changing environmental
context for cotton production and processing in India, but for how the impacts of climate will affect
actors all along the supply chain. There are darker possibilities to factor in, such as the likelihood
of societal disruption fuelled by resource scarcity or unequal distribution, leading to conflict or even
war. All of this will have impacts not just on production, but transportation and distribution of goods,
and beyond. The assumptions on which current supply chains are based cannot be assumed as a
viable or predictable part of the future.
We urge people and organisations involved in the cotton industry to use this data and analysis to
think radically about the future of cotton in general, and India’s role in particular. Part of the intent
is that it be used by individual stakeholders to inform their procurement and other strategies. But
we particularly call for the report to be used as a collaborative resource to make decisions together
about how the industry needs to work, from how cotton is produced, transported, and used; to
strategies, business models and more. We offer this report as a tool to inform thinking, and action,
about mitigation as well as adaptation. The information it presents calls for nothing less than a
collective reimagination and transformation of the cotton value chain to be sustainable, resilient
and just.
7
Physical Climate Risk and Vulnerability Assessment: India Analysis
Part A: Background, context and research objectives
This section will: (1) provide a summary of the current literature and understanding of the cotton-
climate nexus with a focus on India; (2) present examples of how the cotton and textile sectors in
India have been impacted over the last few decades by climatic changes; and (3) present a detailed
summary of the nature of cotton cultivation and cotton processing in India.
1. Background: The climate-cotton nexus in India
The Intergovernmental Panel on Climate Change (IPCC) has stated that changes to the global
climate are already being observed and future changes will continue to intensify over the coming
decades.ii Due to the interrelated nature of the climate and the cultivation of agricultural crops, the
agriculture sector is directly impacted by changes in the climate system, and therefore it is one of
the major sectors under threat due to climate change across the world.iii As such, there is growing
concern of the risks climate change presents to the cotton value chain (referred to henceforth as
CVC) and to the textile industry more broadly.
1.1. Cotton’s key climate sensitivities
Cotton (Genus: Gossypium) is grown predominantly in hot and dry climates, however it is sensitive
to various climate parameters during different stages of crop development, including temperature
and rainfall. Gradual changes in climate parameters, rapid shifts in extreme weather events, and
increase in climate hazards all present increased risk to cotton cultivation.
Cotton has adapted to survive in temperate subtropical and tropical environments and is
considered to be relatively resilient to drier and hotter conditions due to its vertical tap root
compared to other agricultural crops. iv Various stages of crop development are sensitive to
different temperature thresholds. While germination is optimum at temperatures of 18°C to 30°C,
with minimum of 14°C and maximum of 40°Cv, temperatures between 27°C and 32°C is optimum
for boll development and maturation, with yields greatly reduced above 38°C.vi Cotton has been
known to grow at temperatures of 41.8°C in regions in northern India. Heat tolerant varieties are
capable of withstanding extreme temperatures for short periods of time given that water is readily
available. While it has not been established that 41.8°C is the upper limit, heat stress is a big
constraint to increasing yields. Increasing global temperatures may exceed cotton’s temperature
threshold tolerance, exposing the crop to enhanced heat stress, and impacting cotton yield and
quality.vii
The length of the total cotton growing period is about 150 to 180 days.viii The long growing season
is a reason why cotton is so susceptible to disease and pests. While increasing atmospheric
temperature may present an opportunity for some regions by lengthening the potential cotton
growing season, regions which are already growing cotton in conditions close to the upper
temperature threshold tolerance may be at significant risk. Furthermore, a warmer climate will
favour pests and diseases, presenting a further threat to cotton.
In addition to specific temperature requirements, cotton is also sensitive to specific rainfall
requirements at specific stages of crop development. During the early stages, relatively less water
is required at 2 – 4 mm of water per day, however water requirements increase during leaf
8
Physical Climate Risk and Vulnerability Assessment: India Analysis
development and flowering to 5 – 7 mm per day.ix Overall, cotton requires between 700 – 1300 mm
of water throughout the growing periodx, with a minimum of 500 mm suggested as a minimum
threshold by some sources.xi Irrigated cotton requires a greater amount of water than rainfed
cotton.xii While cotton is considered fairly drought tolerant as it is deep rooted with tap roots up to
3 metres deep, it is critical that the crop receives adequate water supply during these specific
stages of crop development. Climate change is projected to increase rainfall in some regions while
decreasing rainfall in other regions. Rains are projected to become more erratic and less reliable,
increasing the risk to cotton.
At the other end of the spectrum, cotton is sensitive to excessive moisture and water logging,
especially during the early season. Although the crop is relatively resistant to short periods of
waterlogging, extreme rainfall events can inundate cotton plantations and cause widespread
damage to agricultural crops. Continuous rain during flowering and boll opening will impair
pollination and significantly impact the quality of the cotton fibre.xiii Heavy rainfall during flowering
causes flower buds and young bolls to fall.xiv Heavy rainfall can also cause significant damage to
soils, leading to soil erosion, the loss of nutrients from the soil, and increased run-off.xv
Periods of extreme rainfall events can saturate soils, reduce the frictional shear resistance of the
soils, and may trigger debris flows or landslides in hilly regions. Depending on the debris to water
ratio, debris flow or landslide can cover extensive areas and submerge any feature in its path. In
rural regions, this may include agricultural fields, the damage to which can be detrimental to the
survival of the crop. Climate change is projected to increase the intensity, frequency and duration
of extreme rainfall events, which in turn may increase the risk of landslides in these regions.
The combination of long periods of high temperatures and dry conditions can create the conditions
required for wildfires. If dry fuel is plentiful, wildfires can spread extensively and rapidly and cause
significant loss and damage to human life and the rural community, to key infrastructure including
utilities and transport routes, and to agricultural crops and livelihoods. Climate change will increase
the intensity and frequency of wildfires across regions projected to experience warmer, drier
conditions.xvi
Delicate young cotton seedlings can also be impacted significantly by strong winds, which may be
associated with cyclones, tornadoes and hurricanes, as damaging wind speeds can uproot the
plant during early stages, blow fibre away from opened bolls, erode topsoil due to wind-erosion,
and damage the quality of the cotton boll fibre by covering it in dust particles.xvii Impacts on key
infrastructure may further impact cotton cultivation; for example, damage to electricity supply and
irrigation systems which may restrict the ability of the farmer to tend to the crops, and cause trees
and debris to block critical infrastructure routes. While the confidence in peoples’ abilities to project
wind strengths and impacts are currently low, there are suggestions that a warmer climate may
give rise to stronger winds in some regions and weaker winds in other regions due to a shift in
large-scale atmospheric circulation.xviii Furthermore, an increase in extreme weather events, such
as tornadoes, cyclones and hurricanes, is projected to occur across some regions of Indiaxix,
increasing the risk of damage to cotton crops from strong winds. Strong winds can also seriously
affect young cotton seedlings which are not properly anchored by roots, in addition to impacting
cotton at its maturity, as strong winds can blow away fibre from opened bolls and cause soiling of
the fibre with dust.xx
9
Physical Climate Risk and Vulnerability Assessment: India Analysis
1.2. A preliminary assessment of climate projections and impacts on the CVC
Climate change can cause direct damage to cotton crops either through gradual, incremental
changes, such as atmospheric warming, or changes in total rainfall, or through sudden changes
and extreme weather events such as flooding, hailstorms or heatwaves.
A report from the International Trade Centre (ITC) in 2011 presents a comparative analysis of
climate impacts across several countries, and projects key climate impacts on cotton cultivation
across India.xxi This study projects that climate change will increase the frequency at which the
upper thresholds of the cotton crop are reached, increase regular exposure to extremely high heat
stress and threaten cotton cultivation in the northernmost regions. The International Trade Centre
(ITC) report states that regions that are already producing cotton at close to 40ºC would seem to
be at a disadvantage considering future warming.
The 2011 ITC study further states that water availability for cotton irrigation is at risk across
northern regions of India as a result of glacial and snowfield depletion in the Himalayan and Tibetan
Plateau.xxii The report also projects increasing risks to rainfed cotton across the southern regions
of India due to increasing variability in the intensity, frequency and duration of the monsoon rains,
with longer periods of drought followed by heavy rainfall leading to increased flooding.
While the majority of studies project declining yields in irrigated cotton grown in hot northern
regions that rely on glacial water, or in rainfed cotton grown in wet southern regions which rely on
a stable and dependable monsoon, fewer studies explore the climate impacts on cotton cultivation
in central regions. One study focusing on the central state of Maharashtra shows that a
temperature rise of +1.85°C, +3.20°C and +3.95°C can lead to a ~3% (28 kg/ha), ~10% (268 kg/ha)
and ~17% (477 kg/ha) reduction in cotton seed yield respectively.xxiii Climate change is projected to
increase the intensity, frequency and duration of extreme weather events. Variability in rainfall
threatens cotton yields as cotton cultivation requires both optimal temperature and sufficient
rainfall during critical moments in the development of the crop.
Cotton cultivation provides an entry point for climate change impacts, with important implications
for the value chain. When cotton crops are damaged as a result of increases in temperature or
climate-induced pest attacks, the demand for better quality seed, pesticide and fertiliser greatly
increases. This results in a higher cost of production per acre, which in turn results in lower
expenditures on food and health and education for poorer, small-holder cotton farmers, ultimately
pushing those rural households towards, or further below, the poverty line.
As one moves downstream along the value chain towards the cotton processing sector, the knock-
on impacts accumulate.xxiv For example, cotton ginners, who are the first step in the cotton
processing sector after the cotton is cultivated, mostly rely on local cotton and are therefore more
vulnerable to changes in the domestic cotton production supply as a result of climate change when
compared to actors downstream (spinners, weavers, ready-made garments, etc.).xxv Moreover,
small ginning firms are more vulnerable to climate shocks as compared to large ones.
1.3. Observed changes and impacts: The climate-cotton nexus in action
The Global Climate Risk Index categorised India as the 5th most at risk country due to climate
change in 2018, an increase from its ranking in 2017 at 14th.xxvi In 2019, INFORM ranked overall risk
in India at 5.5, same as Côte d'Ivoire, Mauritania and Tanzania, and driven mainly by hazard and
10
Physical Climate Risk and Vulnerability Assessment: India Analysis
exposure indicators.xxvii In terms of its preparedness and response to climate change, the Notre
Dame Global Adaptation Index (2017)xxviii ranks India low at 122nd (out of 192 countries).
India has experienced an increase in average annual temperature of +0.08°C per decade between
1901-2013, with substantially stronger warming of 0.14–0.25°C per decade over the last 30
years.xxix While there exists a lack of agreement on overall precipitation trends, there has been an
increase in the frequency and intensity of heavy precipitation events.xxx Variability of the Indian
summer monsoon has increased significantly since the 1950s.xxxi For several regions across India,
this means an increase in long dry periods with low or no rainfall, intermittent with short, intense
spells of rainfall.xxxii
Understanding the climate risks to various agricultural commodities is crucial for countries with a
heavy reliance on agriculture. With over half of the population and most of the country’s poorer
citizens depending directly or indirectly on agricultural production, India is largely reliant on
agriculture for food production, employment, livelihoods and provision of inputs to industries. The
importance of the cotton-cultivating sector in India is explored in greater detail in Section 2.1.
Over the last few decades, the cotton sector in India has been severely impacted by extreme
weather events and climate change. Impacts of a changing climate are already being observed
directly on the cotton crop itself, on the start and duration for the growing season, and indirectly
on the rest of the value chain. Farmers are beginning to adapt to this change.
In 2009, extreme rainfall and flooding across Punjab submerged cotton fields under 1.2 - 1.5m (4-
5 feet) of water, saturating the soil for months. Due to a repeat of the disaster in 2011, farmers in
Sri Muktsar Sahib decided to plant rice paddies instead of cotton, as rice crop can withstand water-
logged conditions better than cotton. Farmers state how the monsoon rainfall used to be spread
across the season, but that periods of rainfall are now more intense and frequent following dry
spells.xxxiii
The textile industry contributes 5% of India’s GDP.xxxiv Given the contribution of the sector, any
adverse impact on cotton crops has implications for the business operation of textile
manufacturers and, in turn, for the national economy. The importance of the cotton processing and
textile sector in India is explored in greater detail in Section 2.3.
It has been recognised that heatwaves in India have increased in frequency over the last few years,
with observations from a study in 2019 by the International Labour Organisation (ILO) identifying
that populated areas in India have experienced some of the greatest increases in heat stress
incidents since 1995.xxxv This has had significant impacts on people’s work in areas such as
agriculture and construction. One reason India’s economy is susceptible to events like heat waves
is its large informal sector, comprising people who work with no formal contracts, including manual
farm labourers. The 2019 ILO study identified that by 2030, the Indian agriculture sector would
lose 9% of its working hours to heat stress, a significant increase from 5.8% in 19952. The study
also identified that the Indian manufacturing sector would lose 5.3% of its working hours due to
heat stress, also a significant increase from 2.9% in 1995. In total, by 2030, India will lose an
equivalent to 34 million full-time jobs out of a total of 80 million globally due to heatwaves and heat-
related stresses.xxxvi
2 The data are based on historical observations and on estimates obtained using the RCP2.6 climate change pathway, which envisages a global average temperature rise of 1.5°C by the end of the century.
11
Physical Climate Risk and Vulnerability Assessment: India Analysis
2. Context: India’s cotton and textile sector
This section aims to develop an understanding of the nature of the cotton value chain and the
textile industry in India prior to any assessment of future physical climate risks in order to interpret
the results in an India-specific context.
2.1. India’s cotton cultivation sector
India is the highest cotton producing country in the world (as of 2020).xxxvii While India ranks first
place in terms of land area under cotton cultivation (38% of global cotton area), its yield ranks
poorly (454.43kg/ha) compared to other countries such as the USA (955 kg/ha) and China (1764
kg/ha).xxxviii ‘
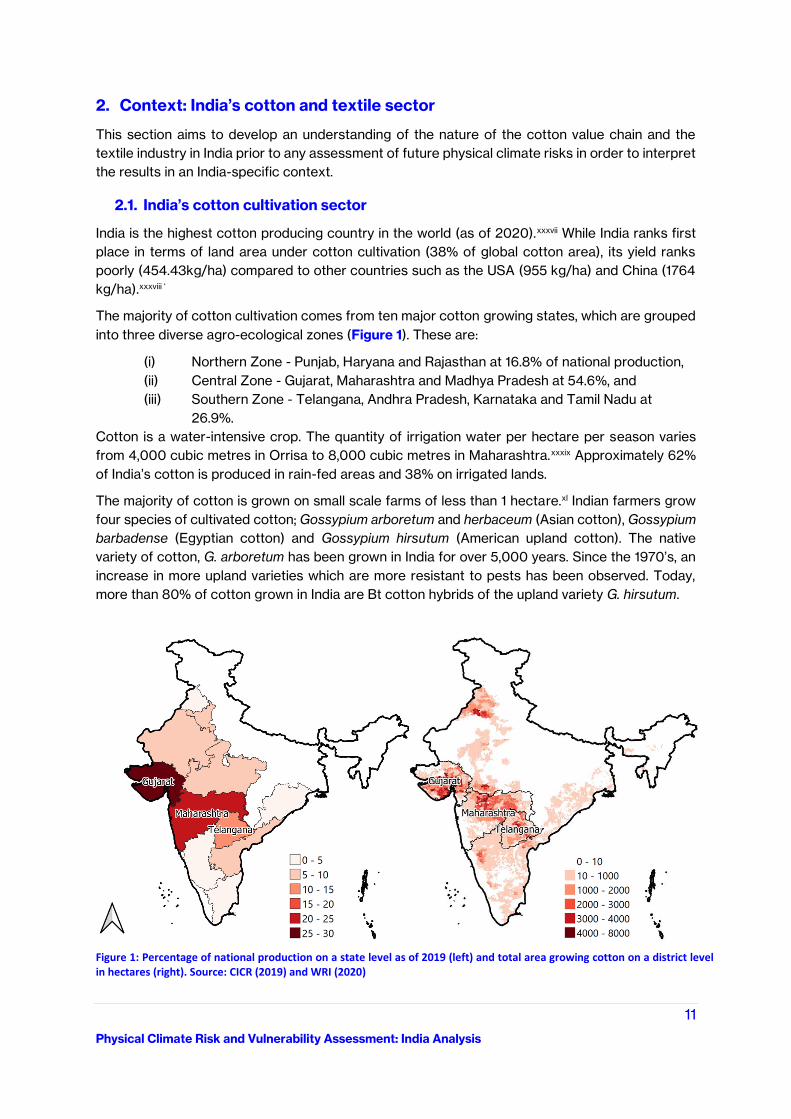
The majority of cotton cultivation comes from ten major cotton growing states, which are grouped
into three diverse agro-ecological zones (Figure 1). These are:
(i) Northern Zone - Punjab, Haryana and Rajasthan at 16.8% of national production,
(ii) Central Zone - Gujarat, Maharashtra and Madhya Pradesh at 54.6%, and
(iii) Southern Zone - Telangana, Andhra Pradesh, Karnataka and Tamil Nadu at
26.9%.
Cotton is a water-intensive crop. The quantity of irrigation water per hectare per season varies
from 4,000 cubic metres in Orrisa to 8,000 cubic metres in Maharashtra.xxxix Approximately 62%
of India’s cotton is produced in rain-fed areas and 38% on irrigated lands.
The majority of cotton is grown on small scale farms of less than 1 hectare.xl Indian farmers grow
four species of cultivated cotton; Gossypium arboretum and herbaceum (Asian cotton), Gossypium
barbadense (Egyptian cotton) and Gossypium hirsutum (American upland cotton). The native
variety of cotton, G. arboretum has been grown in India for over 5,000 years. Since the 1970’s, an
increase in more upland varieties which are more resistant to pests has been observed. Today,
more than 80% of cotton grown in India are Bt cotton hybrids of the upland variety G. hirsutum.
Figure 1: Percentage of national production on a state level as of 2019 (left) and total area growing cotton on a district level in hectares (right). Source: CICR (2019) and WRI (2020)
12
Physical Climate Risk and Vulnerability Assessment: India Analysis
2.2. Climate profile for cotton growing regions
The main cotton growing states have varying and diverse climatic characteristics which ultimately
influence the nature of cotton cultivation between and within each state with regards to the timing
of seed sowing, the length of the cotton growing season, the variety of cotton and the nature of
cotton irrigation.
In the northern cotton growing regions, the climate is arid, receiving an average total of 20 days of
rainfall a year and extremely high temperatures of up to 51°C. The climate is adverse for the sowing
season in May due to high temperatures which have historically hampered seed germination,
however the growing period is limited to this 6 months’ timeframe in order to avoid winter frost in
December. The dry climate means that all cotton grown in the northern region is irrigated, mainly
from glaciated rivers which originate in the Himalayas. Any rain which does fall is short in duration
and intense, which leads to waterlogging issues and issues with soils becoming saline, impeding
cotton growth and yields.
The southern cotton growing regions have a tropical climate which is highly influenced by the
monsoon seasons (June-September). Rainfall fluctuates around 200mm in September-October
and 0-5mm in January. Annual average temperatures are lower than in the northern regions at
around 28°C throughout the year. The region grows rain-fed cotton to benefit from the monsoon
rains. The region also benefits from the higher temperatures and lack of frost days, meaning that
it can therefore also sow irrigated cotton in January. The eastern coastline is especially prone to
extreme weather events, including flooding and cyclones.
The climate of the central cotton regions varies from hot, arid climate in Gujarat, humid-subtropical
climate in Madhya Pradesh, to tropical wet and dry climate in Maharashtra. Rainfed cotton is the
predominant crop across all states, however irrigated cotton is also grown. Madhya Pradesh and
Maharashtra are influenced by the monsoon season, while Madhya Pradesh and Gujarat
experience extreme annual temperature ranges of +/-20°C, which limits the growing season to
May-December.
In the northern regions, cotton is grown as a kharif crop (monsoon season), which is sown in May
and harvested in December before the winter frost, the majority of which is irrigated. Double
cropping ‘cotton-wheat’ is a common practice in the north. In the southern regions, cotton is mainly
a kharif crop, rain-fed by the monsoon rains and sown in September. In the southern regions, cotton
can also be grown as a rabi crop (dry season), sown in January and harvested in June.
2.3. India’s cotton processing and textile sector
Following cotton cultivation, the next rung in the cotton value chain is cotton processing, which
includes ginning, spinning, weaving, knitting, and dyeing of cotton into lint, yarn and fabric. In India,
roughly 60 million people are engaged directly or indirectly in the cotton value chainxli, with about
40-50 million people employed in the cotton trade and its processing.xlii Most cotton ginning and
pressing units are located in the major cotton producing states in India, such as Andhra Pradesh,
Gujarat, Haryana, Karnataka, Madhya Pradesh, Maharashtra and Punjabxliii. There are a total of
381,043 weaving mills and 68,442 looms in India in the states of Andhra Pradesh, Gujarat, Haryana,
Karnataka, Kerala, Madhya Pradesh, Maharashtra, Rajasthan, Tamil Nadu, Uttar Pradesh and West
Bengal.xliv The cotton textile industry, which includes cotton processing and garment
manufacturing, employs the highest number of people in the country after agriculturexlv, and
contributes about 4% to the country’s GDP.xlvi In 2018-19, textile and clothing constituted 12% of
13
Physical Climate Risk and Vulnerability Assessment: India Analysis
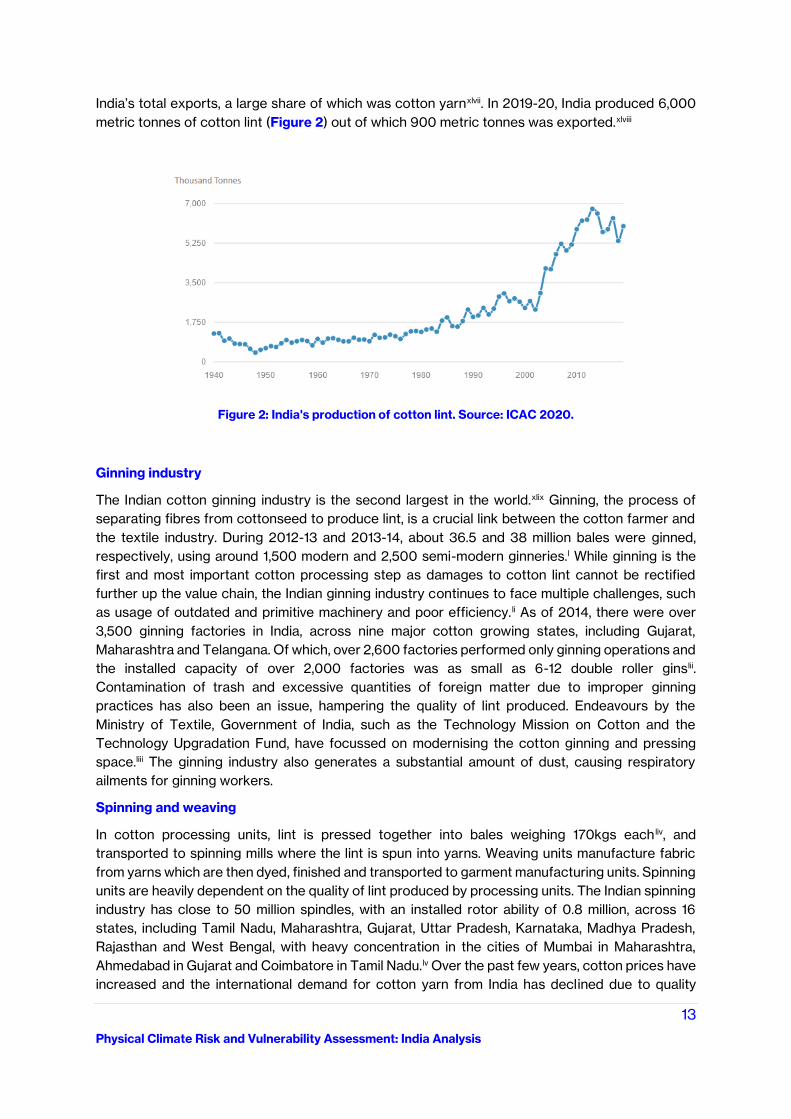
India’s total exports, a large share of which was cotton yarnxlvii. In 2019-20, India produced 6,000
metric tonnes of cotton lint (Figure 2) out of which 900 metric tonnes was exported.xlviii
Figure 2: India's production of cotton lint. Source: ICAC 2020.
Ginning industry
The Indian cotton ginning industry is the second largest in the world.xlix Ginning, the process of
separating fibres from cottonseed to produce lint, is a crucial link between the cotton farmer and
the textile industry. During 2012-13 and 2013-14, about 36.5 and 38 million bales were ginned,
respectively, using around 1,500 modern and 2,500 semi-modern ginneries.l While ginning is the
first and most important cotton processing step as damages to cotton lint cannot be rectified
further up the value chain, the Indian ginning industry continues to face multiple challenges, such
as usage of outdated and primitive machinery and poor efficiency. li As of 2014, there were over
3,500 ginning factories in India, across nine major cotton growing states, including Gujarat,
Maharashtra and Telangana. Of which, over 2,600 factories performed only ginning operations and
the installed capacity of over 2,000 factories was as small as 6-12 double roller ginslii.
Contamination of trash and excessive quantities of foreign matter due to improper ginning
practices has also been an issue, hampering the quality of lint produced. Endeavours by the
Ministry of Textile, Government of India, such as the Technology Mission on Cotton and the
Technology Upgradation Fund, have focussed on modernising the cotton ginning and pressing
space.liii The ginning industry also generates a substantial amount of dust, causing respiratory
ailments for ginning workers.
Spinning and weaving
In cotton processing units, lint is pressed together into bales weighing 170kgs each liv, and
transported to spinning mills where the lint is spun into yarns. Weaving units manufacture fabric
from yarns which are then dyed, finished and transported to garment manufacturing units. Spinning
units are heavily dependent on the quality of lint produced by processing units. The Indian spinning
industry has close to 50 million spindles, with an installed rotor ability of 0.8 million, across 16
states, including Tamil Nadu, Maharashtra, Gujarat, Uttar Pradesh, Karnataka, Madhya Pradesh,
Rajasthan and West Bengal, with heavy concentration in the cities of Mumbai in Maharashtra,
Ahmedabad in Gujarat and Coimbatore in Tamil Nadu.lv Over the past few years, cotton prices have
increased and the international demand for cotton yarn from India has declined due to quality
14
Physical Climate Risk and Vulnerability Assessment: India Analysis
issues and increased competition, causing several spinning yarns to run into losses and shut
down.lvi Unlike the spinning industry in India, which is largely organised, weaving- consisting of
power loom, handloom and hosiery- is largely an unorganised and decentralised sector. lvii Around
95% of the weaving industry is unorganised and is dominated by small-scale enterprises. These
small-scale power looms and hosieries contribute around 85% of the total fabric production lviii. The
Indian weaving industry faces challenges, such as lack of information on latest technology,
research, innovation and upgradation, and low productivity. In terms of technology India only has a
share of 2% of global installed shuttle-less loom capacity.lix
2.4. Policy context
‘National Mission for Sustainable Agriculture’ is one of the eight national missions which form the
core of India’s National Action Plan on Climate Change (NAPCC) lx and is also elaborated in India’s
Nationally Determined Contributions to the UNFCCC.lxi The overarching objective of this mission is
to ‘devise strategies to make Indian agriculture more resilient to climate change,’ lxii including
identifying and developing varieties of crops which can withstand extreme weather patterns, dry
spells and flooding. India’s Economic Survey 2017-18, the guiding survey for policy formulation,
dedicates a chapter to ‘Climate, Climate Change, and Agriculture’, which uses district-level data on
temperature, rainfall and crop production to understand long-term trends in the sector.lxiii
According to the survey, the impact of temperature and rainfall variations are felt only in cases
of extreme temperature (extreme highs are considered to be greater than the 95th percentile of
the grid-point specific temperature distribution), and rainfall (rainfall less than 0.1 mm/day), and the
impact is significantly higher in unirrigated areas. Based on the changes in temperature and rainfall
over the past 60 years, estimates of the effects of fluctuations in weather on agricultural
productivity, and predicted changes in climate over the long-run, the survey projects future impacts
of climate change on agricultural income. It projects that climate change could reduce annual
agricultural incomes by 15-18% on average, and up to 20-25% for unirrigated areas by the end of
the century based on RCP8.5 emission scenario. Furthermore, the survey estimates a 4% decline
in agricultural yield of kharif crops (including cotton) due to extreme temperature shocks and an
increase of 1°C in atmospheric temperatures, and a 12.8% decline in yields resulting from extreme
rainfall shocks with a 100 mm reduction in rainfall. These are 7% and 14.7% respectively, for
unirrigated kharif areas.lxiv The survey also identifies that the key challenges faced by broadly non-
cereal crops, including cotton, in central, western and southern India are inadequate irrigation
facilities, dependence on rainfall, ineffective procurement and insufficient investments in research
and technology.lxv
3. Research objectives
3.1. Gaps in the current literature
An in-depth literature review reveals critical gaps in the current body of research regarding the
climate impacts on the CVC in India. In general, there exists a lack of detailed studies which address
climate risks to the CVC with consideration to socio-economic vulnerabilities and with a specific
focus on India. Thorough assessments have been carried out in other countries, including
Pakistanlxvi, which analyses the entire CVC. While there are attempts at assessing the climate
impacts on cotton cultivation at a state-level, such studies often do not quantitatively assess other
15
Physical Climate Risk and Vulnerability Assessment: India Analysis
stages of the CVC, nor investigate the knock-on effects climate change impacts on cotton
cultivation has on cotton processing.
The majority of studies which assess cotton cultivation in India, obtain primary data through
surveys with cotton farmers and, while this approach has its benefits, this approach only samples
a small proportion of the population, therefore such studies are often content-specific at farm-level
and do not help guide policy development at a district-level or more widely. Furthermore, there is
a lack of studies which make use of the latest climate projections from an ensemble of global
circulation models, with the majority of studies relying on a single, downscaled model for India, the
impact of which skew the climate projections and fail to capture uncertainties in model outputs.
Studies which integrate cotton-specific climate thresholds into their analysis and simulate variables
such as variability in the growing season, are even rarer. Moreover, the majority of studies only
consider basic climate variables such as temperature and precipitation, and there is a lack of
studies which consider other climate hazards such as wildfires, landslides and flooding.
Lastly, while numerous vulnerability assessments exist for India, not many are focused on the
agriculture sector, and rarer so are studies which focus on the cotton sector.
3.2. Research objectives
Based on the gaps identified above which exists in the current literature, this Climate Risk and
Vulnerability Assessment (referred to henceforth as CRVA) addresses those gaps by engaging
with the following objectives:
1. Provide an in-depth analysis of physical climate risks and socio-economic vulnerabilities to
the majority of the cotton value chain with specific focus on India.
2. Use the latest methodology for assessing climate risk as detailed in a methodology set out
by the International Governmental Panel of Climate Change (IPCC). lxvii
3. Use the latest, internationally recognised climate projections from an ensemble of global
circulation models to capture uncertainties in projections.
4. Integrate cotton-specific climate thresholds into the climate hazard component of the
analysis.
5. Consider a plethora of climate hazards rarely considered in the literature, including the
change in the growing seasons, damaging wind speed above a certain threshold, relative
humidity, wildfire and many more.
6. Explore the common and different climate and socio-economic vulnerabilities on a district-
level with the aim of identifying possible focus areas for the Cotton 2040 initative in terms
of supporting climate resilience and adaptation.
7. Identify good-practice adaptation cases currently underway in India which help build
climate resilience.
It should be appreciated that this study is a first step in assessing community-level climate risk and
vulnerability. It provides results based solely on available datasets. Participatory ‘community-based’
engagement will be required to fully understand community vulnerabilities and to define
appropriate resilience building measures, including where social adaptation-related support and
interventions could be best placed. There is a strong body of literature which emphasises this
important point1.
16
Physical Climate Risk and Vulnerability Assessment: India Analysis
Part B: Climate risk scores
Section 1: Results of the cotton cultivation CRVA: Farmer and field
This section focuses on the cotton cultivation aspect of the CVC, and explores at a district-level,
the risks and vulnerabilities of cotton farmers and their rural communities, and risks and
vulnerabilities to the cotton crop itself.
The section consists of; (1) a summary of the nature of cotton cultivation in each of the three focus
states, (2) a summary of the results of the CRVA to identify the main trends in risk and
vulnerabilities.
1. Cotton cultivation in the focus states
An overview of cotton cultivation in each of the three states is provided below.
1.1. Maharashtra
Maharashtra covers nearly 34% of the total cotton producing areas in India. i In 2018-19, the central
state of Maharashtra had the highest land area under cotton cultivation (41.19 lakh3 ha), yet its
average yield (334 kg/ha) was the lowest out of all the central states.
Two species of cotton are predominantly cultivated: viz G. Hirsutum and G. Arboretum, including a
range of hybrids and genetically modified species. Hybrids consist of approximately 73% of cotton
grown in the state, about 11% is cultivated with hirsutum varieties and 16% with arboretum varieties.
Most of the cotton varieties and hybrids grown in Maharashtra process medium and medium-long
fibre.ii Maharashtra produces 11% of the organic cotton fibre produced in India (6735 MT). iii The
cotton crop is grown during the kharif season and sowing is generally done with the onset of the
monsoon (roughly June to the end of October). iv Landholdings in Maharashtra are small and
fragmented with an average size of 1.44 hectares.v
Maharashtra receives moderate amounts of rainfall. Average rainfall over 2012-2016 was 939 mm,
ranking Maharashtra as 6th in terms of highest rainfall among India’s 11 cotton growing states.
Maharashtra’s cotton farms are predominantly rainfed, and less than 20% of Maharashtra’s total
cotton cultivating areas are irrigated. Maharashtra ranks last among India’s core cotton growing
states in terms of irrigated area, and most cotton cultivators lack the capacity to mitigate the
impacts of drought events.vi
Cotton cultivators in Maharashtra use both chemical and biological fertilisers. Chemical fertilisers
including nitrogen (N), phosphorus (P), and potassium (K) tend to be overused, exceeding the
recommendations provided by the Indian Central Institute for Cotton Research (CICR). Per acre
recommendations for NPK are 80:40:40, whereas rainfed farmers surveyed in Maharashtra
applied a split of 100:87:30. Biological fertilisers, in particular farmland manure, are also widely
used. A survey of Maharashtra cultivators showed that 54% of the sample utilised farmland
manure, or another biological fertiliser, in the 2017-18 growing season. Chemical pesticides are also
3 A lakh is a unit in the Indian numbering system equal to one hundred thousand.
17
Physical Climate Risk and Vulnerability Assessment: India Analysis
commonly used although the number of applications varies widely. The vast majority of farmers
report 3-5 applications, while a small quantity of farms report as high as 23 applications.vii
In Maharashtra the major risks facing cotton farmers include drought, pests (particularly the pink
bollworm which has driven significant crop losses in recent years) and price volatility.viii In 2020,
the Cotton Association of India estimated a production reduction of four lakh bales from the 360
lakh bales reported a year prior, attributed to production losses from Maharashtra where pink
bollworm attacks and October rains have led to extensive crop failure.ix
1.2. Gujarat
The central state of Gujarat has 27.09 ha under cotton cultivation, and averages yields of 577
kg/ha.x Gujarat is the second largest cotton producing region by area in India. The state contributes
39% of the total cotton produced in India from 26% of cotton-cultivating areas.xi With regard to
land holdings in Gujarat, 37% are marginal (<1 ha), 29% of parcels are small (1-2 ha), 22% of parcels
are semi-medium (2-4 ha), and 10% of parcels are medium (4-10%). Only 1% of parcels is large (>10
ha).xii
The varieties of cotton cultivated in Gujarat include 7 varieties of G. hirsutum, 4 varieties of G.
arboreum and 11 varieties of G. herbaceum. Beyond this, there are numerous hybrid and genetically
modified varieties.xiii Bt cotton, genetically modified to combat bollworm, has been used widely in
Gujarat since its introduction in 2002. Gujarat produces 11% of India’s organic cotton (2018).xiv The
season typically begins in the last week of June or the first week of July with the onset of the
monsoon and lasts until October or November.
Gujarat receives moderate amounts of rainfall, with the majority heavily concentrated in the
monsoon period.xv Average annual rainfall in Surat is 1188 mm, while average rainfall during the
main sowing periods of cotton from June to July is 285.55 mm.xvi
Statistics on irrigated cotton in Gujarat are variable with the Cotton Association of India reporting
that 27% of land area is irrigated (2015), an academic research study reporting that 56.7% is
irrigatedxvii, and a survey of 351 organic, conventional and certified cotton cultivators reporting 89%
of farms were irrigated in 2013.xviii Despite the variation in numbers, Gujarat has undergone large
scale improvements in irrigation facilities in the last two decades and is considered to have
relatively high access to irrigation.xix
Fertilisers are extensively applied in Gujarat which corresponds with high yields and makes Gujarat
one of the lead producers of cotton in India. Fertiliser use is optimised in irrigated areas which may
be linked to their high usage in Gujarat which has better irrigation than other predominantly rain-
fed regions (e.g. Maharashtra).xx However, fertilisers can worsen predation by certain pest
varieties. Surveys of cotton cultivators in Gujarat show high use of pesticides to control sucking
pests, primarily the highly hazardous monocrotophous, followed by the slightly hazardous
acephate. Further, the sprays generally consist of more than one chemical spray, a practise which
is discouraged by entomologists, and can have health and environmental implications.xxi
In Gujarat the major risks facing cotton cultivators include water stress emerging from erratic or
delayed monsoonsxxii and pests (particularly the cotton mirid bug and the pink bollworm which has
driven significant crop losses in recent years).xxiii The impacts of a delayed or weak monsoon can
restrict cotton growth thereby reducing cotton outputs and cause widespread price volatility.
18
Physical Climate Risk and Vulnerability Assessment: India Analysis
1.3. Telangana
The southern state of Telangana has 17.94 ha under cotton cultivation, and averages yields of 502
kg/ha.xxiv The varieties of cotton cultivated in Telangana include G. hirsutum, G. arboreum, G.
herbaceum, G. barbadense, and countless numbers of hybrid and genetically modified species.xxv
Telangana is a very small producer of organic cotton (0.3% of India’s organic cotton).xxvi In
Telangana, landholdings are predominantly marginal (62%) (<1 ha); 24% are small (1-2 ha); 11% are
semi-medium (2-4 ha); 3% are medium (4-10 ha); and 0.3% are large (>10 ha).xxvii
The northern part of Telangana receives 900-1500 mm of annual rainfall, while the southern drier
part of the state receives 700-900 mm annual rainfall.xxviii Nearly two-thirds of this annual
precipitation occurs during the monsoon season. Approximately 54% of the agriculture is rainfed,
and 46% is irrigated.xxix The cotton season typically brings with it the onset of the monsoon in the
last week of June or the first week of July and goes until October or November.
Agrochemicals (fertilisers, herbicides and pesticides) are used widely in Telangana to maximise
yields and increase pest resistance. Agrochemicals are typically used in excess of the prescribed
quantity, either increasing the number of applications, and / or mixing of various types of
agrochemicals, and often contain highly hazardous substances such as Monocrotophos.xxx
In Telangana and other cotton growing regions of India, some of the major challenges facing cotton
cultivators include a high dependency on the erratic monsoon rains, and insufficient irrigation
facilities; extensive use of chemical fertilisers and pesticides leading to soil imbalance and disease
resistance; monocropping; multiplicity of cotton hybrids; and illegitimate seeds, fertilisers and
pesticides.xxxi
1.4. Policy context
Maharashtra
The Maharashtra State Adaptation Action Plan on Climate Change (MSAAPC)xxxii projects the
impacts of climate change for key sectors in the state, including agriculture. Cotton, being one of
the most important cash crops for the state, has been included in the plan. According to the
MSAAPC, a temperature rise of 3.2ºC can lead to a decline of 268 kg/ha in cotton yield. While an
elevated carbon dioxide level of 650 ppm and a temperature of 40ºC can improve cotton
productivity, with further increase in temperature the CO2 fertilisation effect may get nullified,
leading to decline in yields. Cotton crops under enhanced temperatures are reliant upon adequate
water supply to minimise the impacts of heat stress. In regions where rainfalls are projected to
become increasingly more erratic, and drought conditions are projected to prevail, this will present
a barrier to any potential benefits a warmer climate might present to cotton. The MSAAPC
recognises climate change as a major challenge for cotton cultivation, especially as the area under
cotton cultivation is increasing in the state. Agriculture Contingency Plans for Districts, including
Dhule, Latur, Nagpur, Nandurbar, Wardha and Yavatmal, list contingency measures for cotton
cultivation to enable sustainable production, especially during periods experiencing weather
anomalies and extreme climate events.xxxiii
Gujarat
The Gujarat State Action Plan on Climate Changexxxiv identifies cotton as a thermo-insensitive and
drought resistant crop, and that the state is incentivising increases in cotton production by
providing technological transformation support, training and input subsidy. The document notes
19
Physical Climate Risk and Vulnerability Assessment: India Analysis
that across Gujarat, farmers have been shifting from crops such as groundnut, which is highly
sensitive to saline water, to cotton cultivation. The plan’s ‘Programme of Action for Agriculture’
includes research on quantifying the impact of climate change projections on cotton, and two other
significant crops (wheat and groundnut) in the state. Agriculture Contingency Plans for Districts,
including Rajkot, Banas Kantha and Mahesana, list contingency measures for cotton cultivation to
enable sustainable production, especially during periods experiencing weather anomalies and
extreme climate events.xxxv
Telangana
Agriculture is one of the 10 key sectors identified in the State Action Plan on Climate Change for
Telangana State.xxxvi While cotton finds mention as an important crop, the State Action Plan does
not provide specific data or interventions for the crop’s production. The plan document states that
the adaptation measures mentioned will be implemented in tandem with existing policies, schemes
and initiatives, including the Intensive Cotton Development Programme4. Agriculture Contingency
Plans for Districts, including Adilabad, Karimnagar, Khammam and Mahbubnagar, list contingency
measures for cotton cultivation to enable sustainable production, especially during periods
experiencing weather anomalies and extreme climate events.xxxvii Telangana has a Textiles and
Apparel Policy (2017-18) in place to incentivise investment and growth in the state’s textile
industry.xxxviii The key reason for this could be to bridge gaps in the cotton value chain as the
bifurcation of Andhra Pradesh and Telangana in 2014 led to most of the textile industry being in
Andhra Pradesh, while majority of area under cotton cultivation became a part of the state of
Telangana.xxxix
4 The Intensive Cotton Development Programme under Mini Mission – II of Technology Mission on Cotton, is a centre-based programme, in operation since 2000. The main objective of the scheme is to increase production and productivity of cotton. The sharing of fund between Central Government and State Governments is 75:25. http://djd.dacnet.nic.in/centspoassign.htm
20
Physical Climate Risk and Vulnerability Assessment: India Analysis
2. Results: Climate risk score
This section presents the climate risk score for the cotton cultivation CRVA. Results for the
individual indicators of the cotton cultivation CRVA that comprise the overall risk scores for
exposure, hazard and vulnerability (sensitivity and adaptive capacity) are detailed under
2.1. Climate risk score
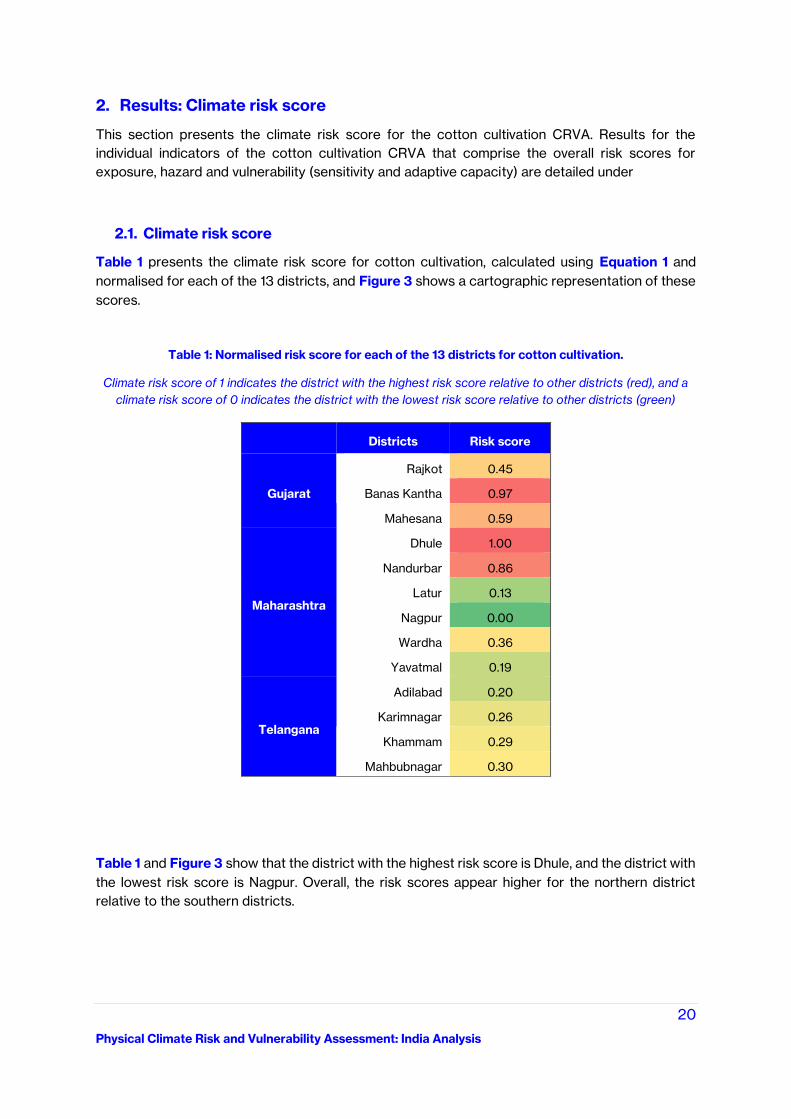
Table 1 presents the climate risk score for cotton cultivation, calculated using Equation 1 and
normalised for each of the 13 districts, and Figure 3 shows a cartographic representation of these
scores.
Table 1: Normalised risk score for each of the 13 districts for cotton cultivation.
Climate risk score of 1 indicates the district with the highest risk score relative to other districts (red), and a
climate risk score of 0 indicates the district with the lowest risk score relative to other districts (green)
Districts Risk score
Gujarat
Rajkot 0.45
Banas Kantha 0.97
Mahesana 0.59
Maharashtra
Dhule 1.00
Nandurbar 0.86
Latur 0.13
Nagpur 0.00
Wardha 0.36
Yavatmal 0.19
Telangana
Adilabad 0.20
Karimnagar 0.26
Khammam 0.29
Mahbubnagar 0.30
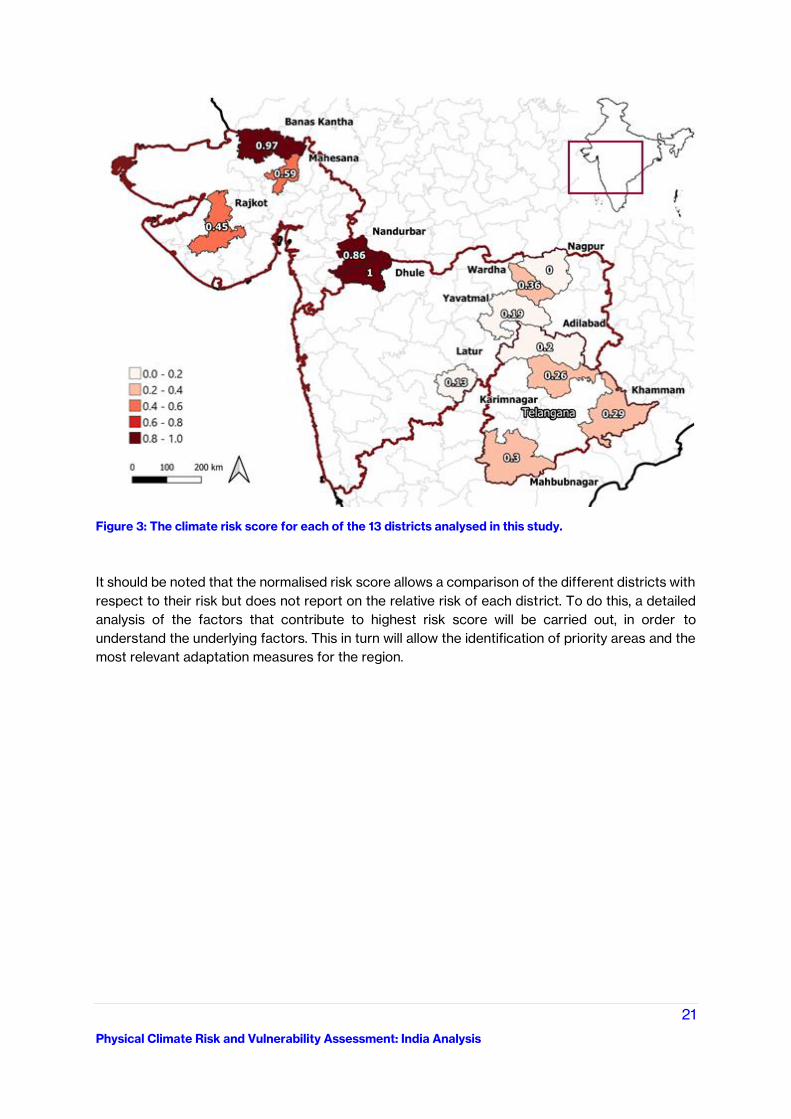
Table 1 and Figure 3 show that the district with the highest risk score is Dhule, and the district with
the lowest risk score is Nagpur. Overall, the risk scores appear higher for the northern district
relative to the southern districts.
21
Physical Climate Risk and Vulnerability Assessment: India Analysis
Figure 3: The climate risk score for each of the 13 districts analysed in this study.
It should be noted that the normalised risk score allows a comparison of the different districts with
respect to their risk but does not report on the relative risk of each district. To do this, a detailed
analysis of the factors that contribute to highest risk score will be carried out, in order to
understand the underlying factors. This in turn will allow the identification of priority areas and the
most relevant adaptation measures for the region.
22
Physical Climate Risk and Vulnerability Assessment: India Analysis
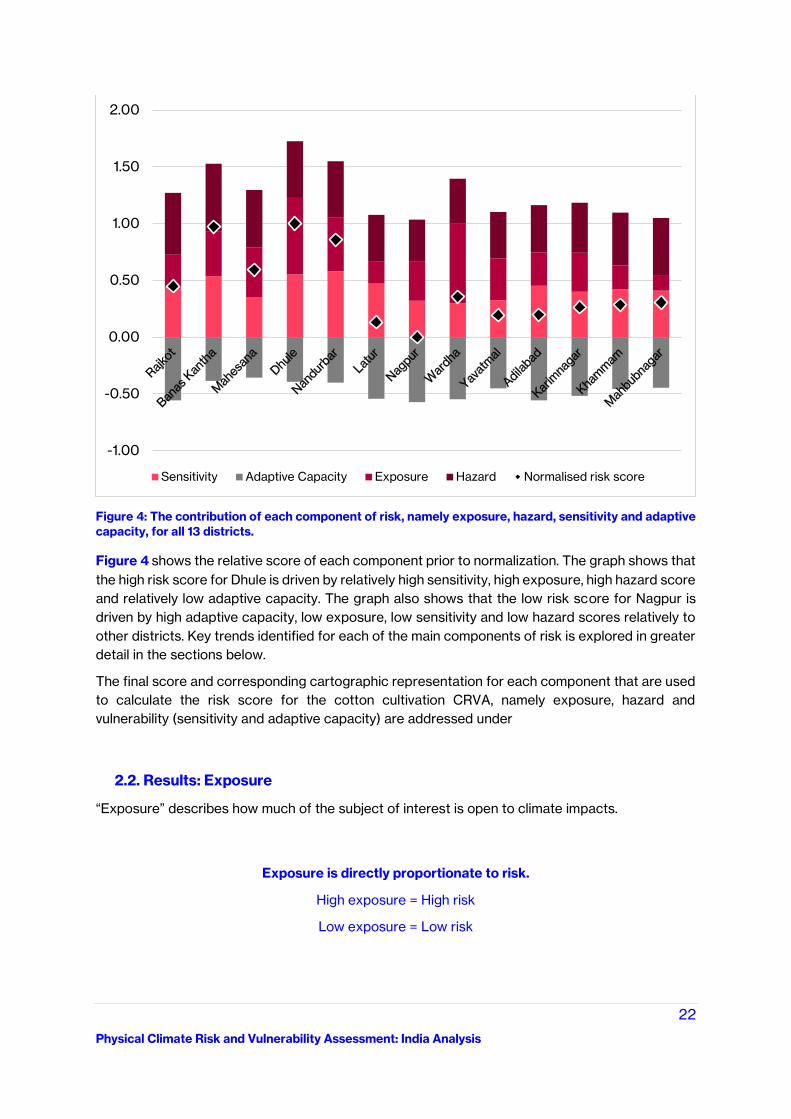
Figure 4: The contribution of each component of risk, namely exposure, hazard, sensitivity and adaptive
capacity, for all 13 districts.
Figure 4 shows the relative score of each component prior to normalization. The graph shows that
the high risk score for Dhule is driven by relatively high sensitivity, high exposure, high hazard score
and relatively low adaptive capacity. The graph also shows that the low risk score for Nagpur is
driven by high adaptive capacity, low exposure, low sensitivity and low hazard scores relatively to
other districts. Key trends identified for each of the main components of risk is explored in greater
detail in the sections below.
The final score and corresponding cartographic representation for each component that are used
to calculate the risk score for the cotton cultivation CRVA, namely exposure, hazard and
vulnerability (sensitivity and adaptive capacity) are addressed under
2.2. Results: Exposure
“Exposure” describes how much of the subject of interest is open to climate impacts.
-1.00
-0.50
0.00
0.50
1.00
1.50
2.00
Sensitivity Adaptive Capacity Exposure Hazard Normalised risk score
Exposure is directly proportionate to risk.
High exposure = High risk
Low exposure = Low risk
23
Physical Climate Risk and Vulnerability Assessment: India Analysis
The most exposed district is Wardha, followed closely in second place by Dhule. Both districts are
located in the state of Gujarat. The least exposed district is Mahbubnagar, located in the state of
Telangana.
The high exposure scoring for Wardha and Dhule is driven by a high % of net sown area, and a high
number of people employed as cotton cultivators relative to other districts. The low exposure
scoring for Mahbubnagar is driven by low rural population density and low net sown area relative
to other districts.
Overall, the districts located in the states of Gujarat and Maharashtra are more exposed than
Telangana.
2.3. Results: Hazard
The highest scoring districts are Rajkot and Banas Kantha, which are located in the state of Gujarat.
The lowest scoring district is Nagpur, which is located in the state of Maharashtra.
Common hazard indicators which increase risk across all districts
The results for the following indicators are high across all, or the majority, of the districts, showing
that these indicators are commonly projected hazards (2040s) for cotton cultivation across the
focus regions:
● Projected increase in number of days when maximum temperature exceeds 40°C
● Projected increase in number of days when maximum temperature exceeds 34°C
● Projected increase in frequency of heatwaves
● Projected increase in number of days when wildfire risk is ‘high’
● Projected increase in number of days subject to damaging wind speeds
● Projected increase in extreme precipitation
Significant differences in hazard indicators
There exists significant difference in the results for some of the indicators between individual
districts, and more broadly between states. Whilst not all the districts in each state are considered
in this analysis, broad approximations can be made.
There is a clear trend in that districts located in the state of Gujarat score higher in terms of
projected hazards for the 2040s relatively to Maharashtra and Telangana. District located in the
state of Gujarat are projected to experience the greatest increase in number of days when
maximum temperature exceeds the temperature threshold of 40°C for cotton cultivation. They are
also projected to experience the greatest increase in frequency of heatwaves. Both indicators in
turn contribute to the projected decrease in the number of effective growing degree days (when
Hazard is directly proportionate to risk.
High hazard = High risk
Low hazard = Low risk
24
Physical Climate Risk and Vulnerability Assessment: India Analysis
temperatures are between 15-30°C), projected for the district of Rajkot. In addition, northern
districts are projected to experience the greatest number of days when wildfire risk is ‘high’, and
the greatest change in Standard Precipitation Index towards drier conditions.
Notably, for Telangana, districts are projected to experience the greatest increase in extreme
precipitation relative to present day, the greatest increase in number of days when maximum
temperatures exceed 34°C, and the greatest increase in the number of days when windspeeds
exceed 25mph (40kmh). Districts located in Telangana are also at greatest risk from fluvial flooding
during a 1 in 100 year event and greatest risk from landslides.
2.4. Results: Vulnerability
The most vulnerable district is Nandurbar, located in the state of Maharashtra. The least vulnerable
district is Wardha, also located in the state of Maharashtra.
A detailed analysis of the factors that contribute to highest vulnerability score are provided in
Sections 2.5 and 2.6, in order to understand the underlying factors. This in turn will allow the
identification of priority areas and the most relevant adaptation measures for the region.
2.5. Results: Sensitivity
“Sensitivity” describes the degree to which a population is affected, either adversely or beneficially,
by climate variability “sensitivity”.
Similarly, for the overall vulnerability score, the most sensitive district is Nandurbar, while the least
sensitive district is Wardha. Both districts are located in the state of Maharashtra.
Common indicators which elevate sensitivity across all districts
The results for the following indicators are high across all, or the majority, of the districts, showing
that these indicators are common drivers of vulnerability for cotton cultivation and rural, agricultural
communities across the focus regions:
● Dependency on agriculture for rural employment
● Gender pay gap in the wages of cotton farmers
● Agricultural sector’s contribution to the Gross Domestic Product (GDP)
● Multidimensional poverty.
Significant differences in sensitivity between districts
Sensitivity is directly proportionate to vulnerability.
High sensitivity = High vulnerability
Low sensitivity = Low vulnerability
25
Physical Climate Risk and Vulnerability Assessment: India Analysis
There exists significant difference in the results for some of the indicators between individual
districts, and more broadly between states. Whilst not all the districts in each state are considered
in this analysis, broad approximations can be made.
Some of the indicators identified below are also identified in the section above, as common drivers
of sensitivity across all focus regions, however, some of the indicators identified above also show
significant disparity between districts.
● Dependency on agriculture for rural employment is high for all districts, however the
results range significantly from 19% (Banas Kantha) to 70% (Mahbubnagar). Overall, the
dependency is less for the districts located in the state of Gujarat relatively to the other
two states.
● Difference in wages between male and females cotton growers ranges from a low of ~0%
(Khammam) to a high of 63% difference (Nandurbar). While the gender pay gap in the
wages of male and female cotton growers is high overall for the majority of districts, the
difference is especially high for districts located in the state of Maharashtra and lower for
districts located in the state of Telangana.
● While the agricultural sector’s contribution to the Gross Domestic Product (GDP) is high
for all districts, it is especially high for Mahbubnagar and Banas Kantha (~35-40%), while
being relatively lower for Nagpur at ~2%.
● The proportion of marginal workers is relatively higher for the districts located in Gujarat
(18% to 25%) and relatively lower for the districts located in Maharashtra (9% to 17%).
● Proportion of farms of less than 1 hectare is particularly high for the districts located in
the state of Telangana (58% to 68%) compared to the districts located in the state of
Maharashtra (10% to 38%).
● People living in multidimensional poverty ranges from 8% (Nagpur) to 60% (Nandurbar).
Both districts are located in Maharashtra, which shows that significant disparity exists
between districts within the same state. The district of Nandurbar is especially high
considering the second highest district is Adilabad at 35%.
● Proportion of rural female head of households is higher overall for the districts located in
Telangana (13% to 21%) compared to districts located in Gujarat (6% to 13%).
● Proportion of degraded and waste land is relatively higher for the districts located in
Telangana (20% to 48%) compared to the districts located in Gujarat (4% to 11%). The
districts with the highest proportion of degraded and waste land are Dhule at 54%, and
lowest is Mahesana at 4%, both of which are located in the state of Maharashtra.
2.6. Results: Adaptive capacity
“Adaptive capacity” describes the degree to which a population has the ability to respond to a
hazard and to cope with change.
Adaptive capacity is indirectly proportionate to vulnerability.
Low adaptive capacity = High vulnerability
High adaptive capacity = Low vulnerability
26
Physical Climate Risk and Vulnerability Assessment: India Analysis
The district with the greatest capacity to adapt is Nagpur in the state of Maharashtra and the
district with the least capacity to adapt is Mahesana in the state of Gujarat.
Common indicators which decrease adaptive capacity across all districts
The results for the following indicators are low across all, or the majority, of the districts, showing
that these indicators are common drivers of vulnerability for cotton cultivation and rural, agricultural
communities across the focus regions:
● All districts have a low percentage of cotton grown as irrigated cotton
● Rural female work participation rate is low for the majority of districts
● Literacy rates for both male and female are low for all districts
● Access to bank accounts is low for all districts
● Proportion of rural households with computer/laptop with Internet connection is
significantly low
Significant differences in adaptive capacity between districts
There exists significant difference in the results for some of the indicators between individual
districts, and more broadly between states. Whilst not all the districts in each state are considered
in this analysis, broad approximations can be made.
Some of the indicators identified below are also identified in the section above, as common drivers
of vulnerability across all focus regions, however, some of these indicators identified above also
show significant disparity between districts.
● Average daily wages of a male field labourer are significantly different between the
different districts in the state of Gujarat, at a low of 192 Rs/day (Mahesana) to a high of
460 Rs/day (Rajkot). Compared to all other districts, the wages for Rajkot are significantly
higher especially considering that the second highest wage is Banas Kantha (also located
in Gujarat) at 384 Rs/day.
● Average daily wages of a female field labourer are lower for the districts located in the
state of Maharashtra at 100 Rs/day to 150 Rs/day whilst wages are higher for the districts
located in Gujarat and Telangana.
● While the area growing irrigated cotton is rather low for all districts, significant difference
exists between districts, with the districts located in Telangana showing a relatively smaller
percentage (0% to 20%), and the districts in Gujarat showing a relatively higher percentage
(16% to 35%). However, the district with the greatest percentage of cotton grown as
irrigated cotton is Latur in Maharashtra, at 51%.
● A significant difference exists for crop diversity, with the effective number of crops grown
in a total of 4 districts being more than 10 crops (for Banas Kantha, Dhule, Nandurbar and
Mahbubnagar), while a total of 4 districts grow less than 2 types of crops (Wardha,
Yavatmal, Karimnagar and Khammam). There is no clear trend at a state level.
● While the rural female work participation rate is low for the majority of districts, significant
difference exists with a clear trend that districts located in Gujarat have a lower female
work participation rate (25% to 27%) and districts located in the state of Telangana have
a higher participation rate (56% to 64%).
27
Physical Climate Risk and Vulnerability Assessment: India Analysis
● There is a significant disparity between literacy rate between states and between genders.
Overall, Gujarat and Maharashtra have the highest literacy rates compared to Telangana.
Female literacy rates are significantly lower than male literacy rates for the districts located
in Telangana (18% to 32%) compared to 41% to 50% for male literacy rate in Telangana.
● Soil organic carbon stocks are less in general for the districts located in Gujarat (24 t/ha
to 29 t/ha) relative to districts located in Telangana (34 t/ha to 46 t/ha).
28
Physical Climate Risk and Vulnerability Assessment: India Analysis
Section 2: Results of the cotton processing CRVA: Field to factory
This section focuses on the cotton processing aspect of the CVC and explores at a district-level
the risks and vulnerabilities of manufacturers and the urban/ peri-urban community, and to the
cotton processing sectors from ginning to pre-garment manufacturing. This section consists of:
(1) a summary of the nature of cotton processing in each of the three focus states, and (2) a
summary of the results of the CRVA to identify the main trends in risk and vulnerabilities.
3. Cotton processing in the focus states
An overview of cotton processing in each of the three states is provided below.
3.1. Maharashtra
The state of Maharashtra processes about 8 million bales of cotton lint annuallyxl with the city of
Mumbai being one of the largest textile hubs in the country. Almost all the cotton is ginned on
double roller (DR) gins. The cotton ginning workforce in the state consists of roughly 60,000
people and most of the state’s ginning units are located in the Marathwada region.5xli The state also
exports cotton lint bales to countries such as Bangladesh, Vietnam and China. The state’s textile
industry has a share of 10.4% in the country’s textile and apparel production.xlii The state has close
to 2000 textile businesses with a fixed capital of US$ 2417 million.xliii Weaving is highly
decentralised in the state. The handloom industry faces challenges such as lack of modern
technology awareness and upgrades, and low yield.
3.2. Gujarat
Gujarat has around 800 ginning mills across the statexliv, with more than 120 mills in Kadi, in the
district of Mahesana alonexlv, and the ginning industry is one of the state’s main agro-based
industries.xlvi Most of the ginning mills consist of mechanised raw cotton feeder machines and
employ an average of 100 people in each.xlvii One of the biggest challenges faced by the state’s
cotton ginning industry is that of overcrowding due to physical proximity, causing many smaller
units to shut down operation. While Gujarat has a cotton production capacity of 10 million bales,
the ginning industry in the state has the capacity to process around 30 million cotton bales.xlviii This
issue is further exacerbated by fluctuations in cotton production in the state, creating knock on
implications for spinning mills and weaving in the state.
The spinning industry in Gujarat is one of the leading spurn yarn producing industries in India, with
cotton accounting for around 83% of the share.xlix However, the industry has remained stagnant
over the yearsl and has limited capacity, compared to the ginning industry in the state. li The state
has around 11 textile hubs including activities such as spinning, weaving, yarn dyeing, knitting and
garmenting. The state’s textile and apparel exports were at US$ 4.79 billion in 2014-15.lii
3.3. Telangana
Telangana, the third largest producer of cotton and known for the cultivation of long staple cotton
(>35mm), has around 320 ginning mills across the state. liii The state was formed in 2014, after
bifurcation from Andhra Pradesh, and ever since 2014 the number of ginning facilities have
increased in the state.liv However, the Ministry of Telangana notes that the cotton value chain in
5 Marathwada region consists of the districts- Aurangabad, Beed, Hingoli, Jalna, Latur, Nanded, Osmanabad, Parbhani.
29
Physical Climate Risk and Vulnerability Assessment: India Analysis
the state is largely limited to cotton cultivation and ginning and pressing, with considerable gaps
further along the value chain.lv The state had only 35 spinning mills in 2017, with a capacity of
930,000 spindles and the ability to spin 1 million bales, as opposed to the state’s annual cotton
production of 6 million bales.lvi Most of the processed cotton from Telangana is exported to the
states of Gujarat, Maharashtra and Andhra Pradesh for further value addition. Weaving activities,
through power looms and handlooms, are also limited in the state with about 49,000 power looms
and 17,000 handlooms, mostly concentrated in the town of Sircilla. lvii Telangana’s traditional
weaves such as Pochampally, Ikat and Gadwal, are of cultural significance. However, the weaving
sector in the state, as in other states, faces several challenges such as outdated technologies,
absence of linkages within the value chain, dependence on middlemen, credit shortages and lack
of product diversification. To address these gaps across the cotton value chain, the Government
of Telangana introduced the Telangana Textiles and Apparel Policy in 2017,lviii aimed at
encouraging both downstream and upstream investments in the processing sector, with a focus
on processing, spinning, weaving, knitting and garment manufacturing.
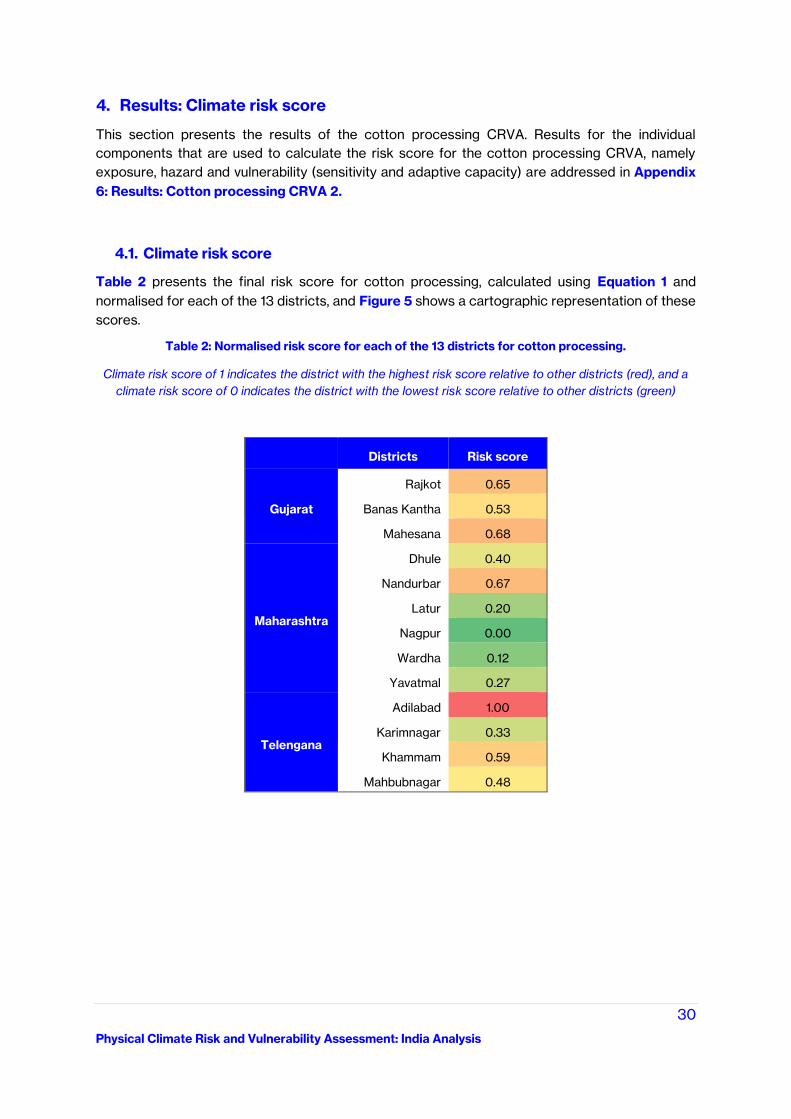
30
Physical Climate Risk and Vulnerability Assessment: India Analysis
4. Results: Climate risk score
This section presents the results of the cotton processing CRVA. Results for the individual
components that are used to calculate the risk score for the cotton processing CRVA, namely
exposure, hazard and vulnerability (sensitivity and adaptive capacity) are addressed in Appendix
6: Results: Cotton processing CRVA 2.
4.1. Climate risk score
Table 2 presents the final risk score for cotton processing, calculated using Equation 1 and
normalised for each of the 13 districts, and Figure 5 shows a cartographic representation of these
scores.
Table 2: Normalised risk score for each of the 13 districts for cotton processing.
Climate risk score of 1 indicates the district with the highest risk score relative to other districts (red), and a
climate risk score of 0 indicates the district with the lowest risk score relative to other districts (green)
Districts Risk score
Gujarat
Rajkot 0.65
Banas Kantha 0.53
Mahesana 0.68
Maharashtra
Dhule 0.40
Nandurbar 0.67
Latur 0.20
Nagpur 0.00
Wardha 0.12
Yavatmal 0.27
Telengana
Adilabad 1.00
Karimnagar 0.33
Khammam 0.59
Mahbubnagar 0.48
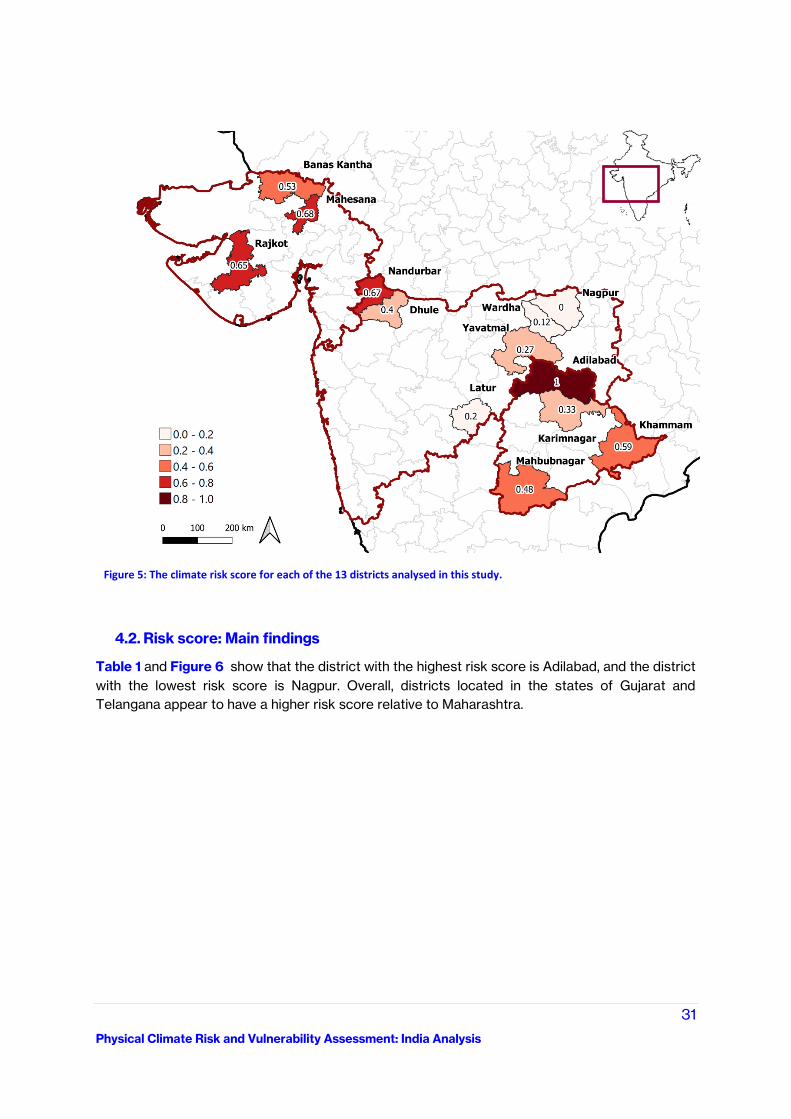
31
Physical Climate Risk and Vulnerability Assessment: India Analysis
4.2. Risk score: Main findings
Table 1 and Figure 6 show that the district with the highest risk score is Adilabad, and the district
with the lowest risk score is Nagpur. Overall, districts located in the states of Gujarat and
Telangana appear to have a higher risk score relative to Maharashtra.
Figure 5: The climate risk score for each of the 13 districts analysed in this study.
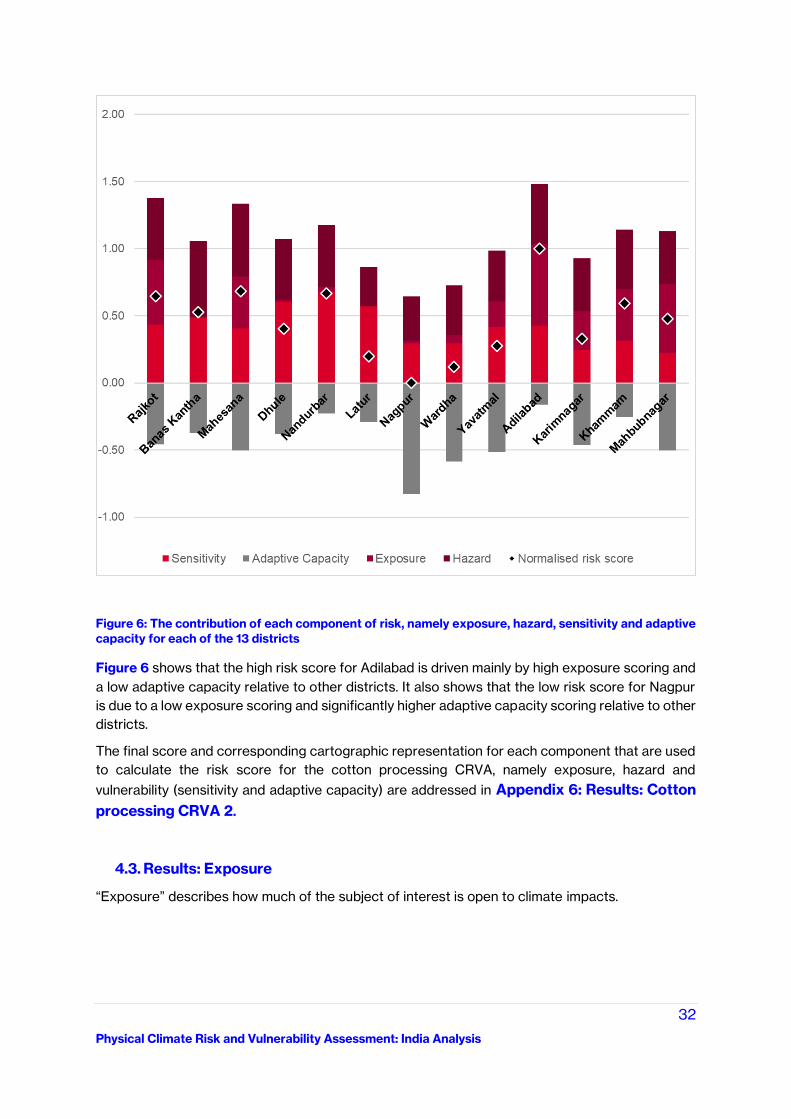
32
Physical Climate Risk and Vulnerability Assessment: India Analysis
Figure 6: The contribution of each component of risk, namely exposure, hazard, sensitivity and adaptive
capacity for each of the 13 districts
Figure 6 shows that the high risk score for Adilabad is driven mainly by high exposure scoring and
a low adaptive capacity relative to other districts. It also shows that the low risk score for Nagpur
is due to a low exposure scoring and significantly higher adaptive capacity scoring relative to other
districts.
The final score and corresponding cartographic representation for each component that are used
to calculate the risk score for the cotton processing CRVA, namely exposure, hazard and
vulnerability (sensitivity and adaptive capacity) are addressed in Appendix 6: Results: Cotton
processing CRVA 2.
4.3. Results: Exposure
“Exposure” describes how much of the subject of interest is open to climate impacts.
33
Physical Climate Risk and Vulnerability Assessment: India Analysis
The most exposed district is Adilabad, which is are located in the state of Telangana. Exposure is
high for Adilabad as it is the district with the highest number of ginning and pressing factories.
Exposure is also high for the district of Mahbubnagar, also located in Telangana, due to the district
having the highest number of people working in the cotton processing sector. Overall, exposure is
lower for the districts located in the state of Maharashtra and higher for the districts located in the
state of Telangana.
4.4. Results: Hazard
The highest scoring district is Banas Kantha, located in the state of Gujarat, and the lowest scoring
district is Latur, located in the state of Maharashtra.
Common hazard indicators which increase risk across all districts
The results for the following indicators are high across all, or the majority, of the districts, showing
that these indicators are common hazards for cotton cultivation across the focus regions:
● Projected increase in number of days when maximum temperature exceeds 34 °C
● Projected increase in frequency of heatwaves
● Projected increase in number of days when wildfire risk is ‘high’
● Projected increase in extreme precipitation
Significant differences in hazard indicators
There exists significant difference in the results for some of the indicators between individual
districts, and more broadly between states. Whilst not all the districts in each state are considered
in this analysis, broad approximations can be made.
There is a clear trend that districts located in the state of Gujarat score higher in terms of projected
hazard for the 2040s relative to Maharashtra and Telangana. Districts located in the state of
Gujarat are projected to experience the greatest increase in frequency of heatwaves, the greatest
number of days when wildfire risk is ‘high’, and the greatest change in Standard Precipitation Index.
Exposure is directly proportionate to vulnerability.
High exposure = High vulnerability
Low exposure = Low vulnerability
Hazard is directly proportionate to risk.
High hazard = High risk
Low hazard = Low risk
34
Physical Climate Risk and Vulnerability Assessment: India Analysis
There is also a trend whereby districts located in the state of Telangana score relatively higher in
terms of the escalation of hazards from present day to the 2040s. These districts are projected to
experience the greatest increase in extreme precipitation relative to present day, the greatest
increase in number of days when maximum temperatures exceed 34 °C, and the greatest increase
in the number of days when wind speeds exceed 25mph (40kmh). Districts located in Telangana
are also at greatest risk from fluvial flooding during a 1 in 100 year event and greatest risk from
landslides.
4.5. Results: Vulnerability
The most vulnerable district is Nandurbar and the least vulnerable district is Nagpur. Both districts
are located in the state of Maharashtra.
A detailed analysis of the factors that contribute to highest vulnerability score will be carried out,
in order to understand the underlying factors. This in turn will allow the identification of priority
areas and the most relevant adaptation measures for the region.
4.6. Results: Sensitivity
“Sensitivity” describes the degree to which a population is affected, either adversely or beneficially,
by climate variability “sensitivity”.
The most sensitive district is Nandurbar, located in Maharashtra, and the least sensitivity district is
Mahbubnagar located in Telangana.
Common indicators which elevate sensitivity across all districts
The results for the following indicators are high across all, or the majority, of the districts, showing
that these indicators are common drivers of vulnerability in cotton manufacturers and urban
communities across the focus regions:
● Multidimensional poverty
● Volatility in production
Significant differences in sensitivity between districts
There exists significant difference in the results of some of the indicators between individual
districts, and more broadly between states. Whilst not all the districts in each state are considered
in this analysis, broad approximations are made. Some of the indicators identified below are also
identified in the section above, as common drivers of sensitivity across all focus regions, however,
some of the indicators identified above also show significant disparity between districts.
Sensitivity is directly proportionate to vulnerability.
High sensitivity = High vulnerability
Low sensitivity = Low vulnerability
35
Physical Climate Risk and Vulnerability Assessment: India Analysis
● There is significant volatility in the production of cotton identified for Rajkot relative to all
other districts.
● People living in multidimensional poverty ranges from 8% (Nagpur) to 60% (Nandurbar).
Both districts are located in Maharashtra. The district of Nandurbar is especially high at
60% considering the second highest district is Adilabad at 35%.
● The top three districts with the highest water stress are located in the state of Gujarat
while the three districts with the least water stress are located in the state of Telangana.
4.7. Results: Adaptive capacity
“Adaptive capacity” the degree to which the population has the ability to respond to a hazard and
to cope with change.
The district with the greatest capacity to adapt is Nagpur (0.83) in the state of Maharashtra, and
the district with the least capacity to adapt is Adilabad (0.16) in the state of Telangana.
Common indicators which decrease adaptive capacity across all districts
The results for the following indicators are low across all, or the majority, of the districts, showing
that these indicators are common drivers of vulnerability across the focus regions:
● Across all districts, the urban work participation rate
● Urban female participation rate is significantly low
● Urban female literacy rate is low
● Proportion of households with access to bank accounts
● Proportion of urban households with computer/laptop with Internet connection
Significant differences in adaptive capacity between districts
There exists significant difference in the results of some of the indicators between individual
districts, and more broadly between states. Whilst not all the districts in each state are considered
in this analysis, broad approximations are made. Some of the indicators identified below are also
identified in the section above, as common drivers of vulnerability across all focus regions, however,
some of the indicators identified above also show significant disparity between districts.
● There is significant difference in the wages of men employed in cotton processing sector,
ranging from the highest in Nagpur (769 Rs/day) to the lowest in Khammam (192 Rs/day).
There are significant discrepancies between districts within the same state for all states,
such as for Maharashtra where wages from 769 Rs/day (Nagpur) to 230 Rd/day
(Nandurbar).
Adaptive capacity is indirectly proportionate to vulnerability.
Low adaptive capacity = High vulnerability
High adaptive capacity = Low vulnerability
36
Physical Climate Risk and Vulnerability Assessment: India Analysis
● Urban female participation rate is significantly lower for all districts, with a range of 9% to
27%. The lowest three districts are all located in Gujarat (9% to 11%). The highest three
districts are located in Telangana (20% to 27%).
● While male literacy rates are higher than female literacy rates, there is a general trend in
that districts located in Telangana are generally lower (85% to 87%) than the other two
states.
● While the proportion of urban households with access to bank accounts is low for all
districts, in general the districts located in the state of Telangana are lower (57% to 64%),
while the districts located in the state of Gujarat are higher (62% to 73%).
37
Physical Climate Risk and Vulnerability Assessment: India Analysis
Section 3: Summary of the main findings
Appendix 7: Summary of the main drivers of risk presents a summary of the main findings for
both the cotton cultivation CRVA and the cotton processing CRVA.
The CRVAs for both cotton cultivating and cotton processing reveal common indicators that
exacerbate risk across all districts.
As for the hazard indicators, these show a clear trend across all districts, in that an increase in
temperature, increase in extreme weather events (including heatwaves and extreme precipitation),
and increase in climate hazards (flood risk, landslides, wildfires and damaging wind speeds) is
projected for the 2040s. All districts are also projected to experience an increase in the number
of days at which labour productivity significantly decreases, and, furthermore, all districts are
projected to experience an increase in the number of days whereby maximum temperatures are
projected to exceed the threshold at which cotton can be successfully cultivated (40°C).
As for the vulnerability indicators, there are common indicators which are high across all districts,
and these include multidimensional poverty, female work participation rates, male and female
literacy rates, access to banking services, and access to technology and information. These are
key issues facing society which need to be addressed more broadly. While the results are slightly
better for urban areas compared to rural areas, the issues identified here are significant for both
rural and urban.
While this analysis did not cover all districts in each of the three states, it is possible to make broad
approximations based on the general trends revealed in the analysis.
For both the cotton cultivation CRVA and cotton processing CRVA, the final climate risk scores
appear to be higher overall for the northern districts located in the state of Gujarat relative to
southern districts located in the states of Maharashtra and Telangana. The primary component
driving these higher scores across the northern districts are hazard indicators which projected
absolute climate conditions for the 2040s, such as the highest total number of days above
maximum temperature thresholds. Districts located in Telangana appear to have scored higher for
hazard indicators which project change in climate conditions for the 2040s, including the greatest
increase in the number of days when wildfire risk is ‘high’.
As for the vulnerability indicators, some indicators are more pronounced in some states compared
to others. For Maharashtra, the existing gender pay gap and absolute wages of cotton growers
stand out as key concerns. Telangana has a low % of irrigated cotton grown, high % of small
agricultural holdings, high % of rural female head of households, and significantly low male and
female literacy rates. For cotton cultivation in Gujarat, ‘natural capital’ indicators stand out as key
drivers of vulnerability, including high projected water stress, and low organic carbon stocks,
however Gujarat especially stands out in terms of significantly low female work participation rates.
There are also trends in indicators which show significant differences between districts located in
the same state. This is especially true of districts located in the state of Maharashtra, for example,
the district with the highest (Nandurbar) and lowest (Nagpur) multidimensional poverty are both
located in the state of Maharashtra, however this may be skewed due to the number of districts
sampled for Maharashtra (5 districts) being higher than for Gujarat (3 districts) and Telangana (4
districts).
38
Physical Climate Risk and Vulnerability Assessment: India Analysis
Part C: Discussion: Paving the way forward
The climate vulnerability and risk assessment carried out for the cotton cultivation and cotton
processing aspect of the CVC has revealed key indicators which exacerbate physical climate risk
for the 13 districts considered in this study. Identifying these drivers of risk is a crucial first step in
the adaptation story, as it can be used to guide action and drive interventions towards increasing
resilience to climate change.
The following section discusses the main indicators relating to the increasing physical climate risks
across the various districts located in Gujarat, Maharashtra and Telangana, and identifies examples
of various programmes, practical activities and research efforts which have helped to tackle these
challenges and build climate resilience.
Each of the components used to calculate climate risks, namely hazard, exposure, sensitivity and
adaptive capacity, have been used to structure the discussion and example solutions provided
below. Moreover, the focus areas are identified i.e. with one, some or all districts would benefit from
the proposed adaptation action. It is also specified whether a solution is applicable for cotton
cultivation and the rural communities, or for the cotton processing and the urban communities i.e.
the actors in the CVC. These solutions are intended to demonstrate initial examples of good-
practice adaptation cases currently underway in India which help build climate resilience going
forward.
1. Hazards and exposure: Reducing direct impacts
The following present hazard and exposure indicator led solutions to build climate resilience.
1.1. Challenge 1: Heatwaves and heat stress: Reducing the impacts of heat stress
on labour productivity (cultivators and manufacturers)
Heat stress during work is an occupational health risk as it restricts workers’ physical functions
and capabilities, work capacity and productivity, and in extreme cases, can lead to heatstroke and
fatality. In India, a study by the International Labour Organization (ILO) shows that working hours
lost to heat stress across the agriculture sector in India is projected to increase from 5.87% in 1995
to 9.04% in 2030, while working hours lost to heat stress across the manufacturing sector is
projected to increase from 2.95% in 1995 to 5.29% by 2030. i Heat stress impacts both aspects
of the CVC. Not only does heat stress impact cotton cultivators who are directly exposed to heat
in fields, but studies show that it also impacts manufacturers working in factories in densely
populated urban areas, as small industries, such as cloth-weaving units, cannot afford air-
conditioning.ii
Across all 13 districts analysed in this CRVA, the number of days when temperature exceeds a
threshold of 34°C is projected to increase for the 2040s – a temperature threshold at which,
according to the ILO, reduced labour productivity by 50%.iii The top three districts which are
projected to experience the greatest increase are located in the state of Telangana, namely the
districts of Khammam, Karimnagar and Adilabad, which are projected to experience an increase
above present day (2000-2019) of +41 days, +39 days and +37 days respectively. This is echoed
by the findings of the ILO report, which projects that populated areas in southern India will be one
of the regions of the world to suffer greatest from heat stress.
39
Physical Climate Risk and Vulnerability Assessment: India Analysis
Currently in Telangana, maximum temperature during the summer months can reach up to 47°C
across Khammam and Karimnagar. In 2015, the country witnessed the fifth deadliest heat wave in
history which killed 2,500 people across Andhra Pradesh and Telangana.iv Heatwaves across India
are becoming more intense and frequent.v
While swift action is required to address heat stress across all districts, immediate action is
required across the state of Telangana, and especially targeting the districts of Khammam,
Karimnagar and Adilabad, to implement measures to reduce the impact of heat stress on both
cotton cultivators and textile manufacturers.
1.1.1. Adaptation actions for the cotton cultivation sector
Aim: Prepare contingency plans for dealing with heatwaves, to incorporate the recommendations
as stated in the state action plan such as rescheduling of working hours of cotton cultivators. Target
area: All districts, but especially Khammam, Karimnagar and Adilabad [Telangana].
Following the 2015 heatwave, the state of Telangana took the initiative to develop a comprehensive
Heatwaves Action Plan (2020)vi for extreme heat events, which identifies prevention and mitigation
measures to minimise the effects of heatwaves and build capacity. Preparedness measures
identified in the report for agriculture and outdoor working include shifting the outdoor workers
schedules away from peak afternoon hours (1PM to 4 PM), ensuring adequate drinking water
facilities is provided, and ensuring adequate shade is provided from direct sunlight. Given that the
greatest increase in heatwaves and heat stress is projected for the district of Khammam,
Karimnagar and Adilabad, it is vitally important that employers and landowners of cotton fields in
these districts ensure that similar measures to those recommended in the Heatwaves Action Plan
are incorporated into their practices as these address the health and safety of cotton cultivators,
and ensure that the cotton farm maintains good levels of productivity.
Supporting initiatives which aim to help employers and cotton farmers to prepare contingency
plans for dealing with heatwaves and heat stress would be significantly beneficial to all districts,
but especially for the districts of Khammam, Karimnagar and Adilabad, to help build resilience
across rural communities.
1.1.2. Adaptation actions for the cotton processing sector
Aim: Support the implementation of cool roofs in urban areas, with a focus on cotton processing
factories and textile manufacturing factories. Target area: All districts, but especially Khammam,
Karimnagar and Adilabad [Telangana]
The Heatwaves Action Plan incorporates a cool roof initiative into its action plan. The Telangana
Cool Roofs Programvii aims to improve 150,000 sq. km of roof area by 2030, by turning the roofs
of slum dwellings into cool roofs, improve the reflectivity of roofs on government buildings and
schools, and raise public awareness. Studies have shown that cool roofs can be up to 30°C cooler
than conventional roofs and can bring the indoor temperatures down by 3-5°C.viii Cool roofs reflect
sunlight and absorb less heat, reducing the urban heat island effect. They can comprise a coating
of a material or paint with high reflectivity on top of a conventional roof material; pre-fabricated
materials such as membranes or sheeting to cover an existing roof; the application of high albedo,
china mosaic tiles or shingles on top of an existing roof; or make use of vegetation to help the roof
absorb less solar energy. Telangana is at the forefront of initiating measures for implementing the
cool roofs programme, however further funding and resources are required to implement cool
roofs programmes.
40
Physical Climate Risk and Vulnerability Assessment: India Analysis
Providing funding to initiatives which implement the Telangana Cool Roofs Program, and especially
by targeting cotton processing factories and textile manufacturing factories in densely populated
urban areas, would highly benefit the districts of Khammam, Karimnagar and Adilabad, to help build
climate resilience across the urban manufacturing community.
1.2. Challenge 2: Drought and water stress: Reducing the impact of water stress on
cotton cultivation
Optimum temperature for cotton cultivation ranges from 20-30°C, and yields in general are greatly
reduced above 38°C.ix Despite this, cotton has been known to grow at temperatures of 41.8°C and
higher in regions in northern India, far exceeding expected thresholds, however heat stress is a big
constraint to increasing yields.x This study utilised a threshold of 40°C as a proxy for the
temperature tolerance threshold of cotton.
High temperature accelerates water losses from the soil and plant through increased rates of
evaporation and transpiration, placing the crop under water stress in dry regions and/or during dry
spells. The FAO states that cotton requires adequate water supply during critical phases of
development.xi Abrupt changes in water supply and severe water deficits will adversely affect
growth and cause flower and boll shedding. This shows that not only is the timing of rainfall crucial
for rainfed cotton, but interannual variability in rainfall will also impact on the quantity of water
available for irrigated cotton.
This CRVA shows that the districts of Rajkot, Banas Kantha and Mahesana, all located in the state
of Gujarat, are projected to experience a significant increase of up to +25 days in the number of
days the temperature exceeds a threshold of 40°C – a critical temperature threshold for cotton.
This increase in temperature and increase in exposure to heat stress is a key driver for the notable
lower effective growing degree days projected for the 2040s across these northern districts
relative to other districts. This is especially true for the district of Rajkot which is projected to
experience a decrease in Effective Growing Degree Days (EGDD) due to the upper temperature
limit being exceeded far more frequently than during present day conditions (2000-2019).
Furthermore, the CRVA shows that while overall total rainfall during the growing season is
projected to remain high and adequate for cotton cultivation, climate change will increase rainfall
variability, and thus water availability. The analysis shows that water stress is projected to be
significantly higher for all the districts located in the northern state of Gujarat, namely Rajkot, Banas
Kantha and Mahesana, relative to the other districts. These districts also show a tendency towards
drier conditions for the 2040s according to the projected SPI index, with the greatest decrease
and lowest absolute SPI projected for the district of Mahesana.
The cotton cultivation CRVA also identifies that districts in Gujarat have amongst the lowest soil
water holding capacity, and by far the lowest soil organic carbon stocks. Again, both of these are
especially low for the district of Mahesana. Both soil water holding capacity and soil organic carbon
are crucial drivers of land productivity and water security, as good quality soil can retain water
during dry spells and avoid water stress. A series of interventions are necessary across the districts
of Gujarat, and especially for Mahesana, to mitigate water stress across cotton growing areas.
41
Physical Climate Risk and Vulnerability Assessment: India Analysis
1.2.1. Adaptation actions for the cotton cultivation sector
Aim: Support programmes which implement irrigation channels, micro-irrigation devices and training
on good water practice. Target area: Rajkot, Banas Kantha, Mahesana, Dhule, Khammam,
Mahbubnagar, Yavatmal and Adilabad
Irrigated cotton, versus rain-fed cotton, has higher resilience to periods of low-rainfall, drought,
delayed or erratic monsoons, as cultivators have access to water during periods of low rainfall.
Regions with irrigated cotton have greater adaptive capacity than rain-fed cotton during times of
water stress, improving cultivators yields and incomes.
As is identified in the CRVA, while districts located in Gujarat have a higher percentage of total
cotton grown as irrigated cotton relative to other districts considered in this study, a range of 16-
35% is still low considering the projected increase in water stress and extreme rainfall events
facing these districts with future climate change.
The CRVA also shows that the district of Dhule in the state of Maharashtra is both high in exposure
and high in hazard scoring and has only 3% of its cotton grown as irrigated cotton. While districts
including Khammam, Mahbubnagar, Yavatmal and Adilabad have the lowest % of irrigated cotton,
these districts are projected to receive adequate rainfall during the growing period, therefore
implementing measures to mitigate water stress is not as much of a priority. Nonetheless, given
the increasingly delayed and erratic monsoons rainfall observed over the last few decadesxii, these
districts would benefit from implementing measures to mitigate water stress at some point in the
future.
Maharashtra has implemented numerous government-led and international-led projects
supporting the implementation of irrigation systems over the last few years. One example is from
the Jalna district in central Maharashtra, where a project led by the Sustainable Trade initiative
(IDH) and Watershed Organisation Trust (WOTR)xiii is securing smallholder farmers’ livelihoods by
through coordinated solutions promoting water security and integrated livelihood opportunities.
Solutions have been implemented which target cotton smallholder farmers, and these include
improving access to water by constructing check dams and micro-irrigation devices (water
absorption trenches, water impounding and harvesting structure) to conserve rainfall. Over 6,300
small-holder farmers have engaged with the initiative, and increased water infrastructure facilities
have resulted in a 9% increase in water access thus far. In parallel, cultivators receive training on
water management, good agricultural practices, training on female empowerment through the
mainstreaming women’s roles, and training on how to utilise meteorological advisories to inform on
farm decision-making. Cultivator have also reported a 20% reduction in production costs and over
a third of cultivators have added a second crop into production. Furthermore, the cost of cotton
cultivation has reduced from Rs. 9,338 per acre in 2018 to Rs. 7,488 per acre.xiv
As shown by the success of the programme in Jalna, supporting initiatives which encourage the
implementation of measures which promote sustainable water management, cognisant of future
water scarcity conditions, through the building of irrigation channels and the holistic training on
water management, could increase water security of smallholder farmers. Around ~38% of farms
across Mahesana and ~34% of farms across Dhule are less than 1 hectare and thus, supporting
similar initiatives in these districts would help build climate resilience in the face of increasing water
stress.
42
Physical Climate Risk and Vulnerability Assessment: India Analysis
1.2.2. Adaptation actions for the cotton processing sector
Aim: Conduct water risk assessments for the cotton textile value chain for present and the future
climate conditions, to develop context specific strategies for efficient water use and secure
livelihoods of people engaged in the sector. Target area: Rajkot, Banas Kantha and especially
Mahesana and Dhule
Urban spaces in India experience high levels of water stress due to various demographic,
geographical and climatic reasons. Rural-urban migration to search for employment opportunities,
rapid and often unplanned urbanisation, and concentration of production hubs in cities cause
significant increases in water demand.xv Deterioration in water quality, reduction in groundwater
levels, inequitable distribution of water resources and an intermittent water supplyxvi further impact
the availability of, and access to, clean water. The state of Gujarat is drought-prone and has been
facing significant water shortages. More than 20 districts in the state were severely affected in
2019, with water supply being limited to twice a week in towns and villages.xvii The city of Rajkot
faced water shortages in 2020, as its water demand has increased from about 260 million litres
per day in 2019, to 280 million litres per day in 2020.xviii The cotton processing and textile industry
is heavily dependent on water. A textile unit producing around 9,000 kgs of fabric per day,
consumes around 36,000 litres of water.xix
Columbia Water Centre, in partnership with Federation of Indian Chambers of Commerce and
Industry, undertook a national level assessmentxx to understand water risk perceptions and
responses across 27 industrial sectors in India, including the textile industry. The study identified
primary sources of water, impact of water availability on businesses at present and in the future,
and initiatives undertaken for wastewater treatment and recycling. Industrial sectors such as
textiles are highly vulnerable to water insecurity as they do not just rely on water availability for
their operations but are also reliant on agricultural produce. A lack of data and assessments have
been identified as a major gap in addressing inefficient water usage and water scarcity. Corporate
water-related reporting has largely been qualitative, with descriptions of water stewardship
initiatives, policies and programmes aimed at reducing internal water usage. However, most of
these policies and programmes are not based on comprehensive quantitative assessments of
present and future climate and water risks. The study states the importance of preparing climate
and water risk and sustainability frameworks within the industry for quantification and analysis of
water risks for the industry in different geographies, based on which context specific decision-
making frameworks can be prepared for water risk reduction, sustainability reporting and
disclosure.
The Institute for Sustainable Communities (ISC) has been working towards enabling adoption of
water stewardship practices across the textile value chain in India.xxi This initiative is a part of the
Women + Water Alliance, a public-private partnership led by the United States Agency for
International Development (USAID) and Gap Inc., aimed at improving the health and wellbeing of
women and communities directly or indirectly involved in the textile value chain. Based on research,
stakeholder engagement and assessment of water stewardship practices, guidelines and tools
across the CVC, ISC formulated a comprehensive list of best practices and categorised them
according to their potential impact and costs. The study states that while most industrial units
across the CVC are aware of water stewardship initiatives, there is no regulatory mechanism in
place to drive them in a systematic manner. For example, due to specific environmental regulations
in the state of Tamil Nadu, many processing units have internalised costs of environmental
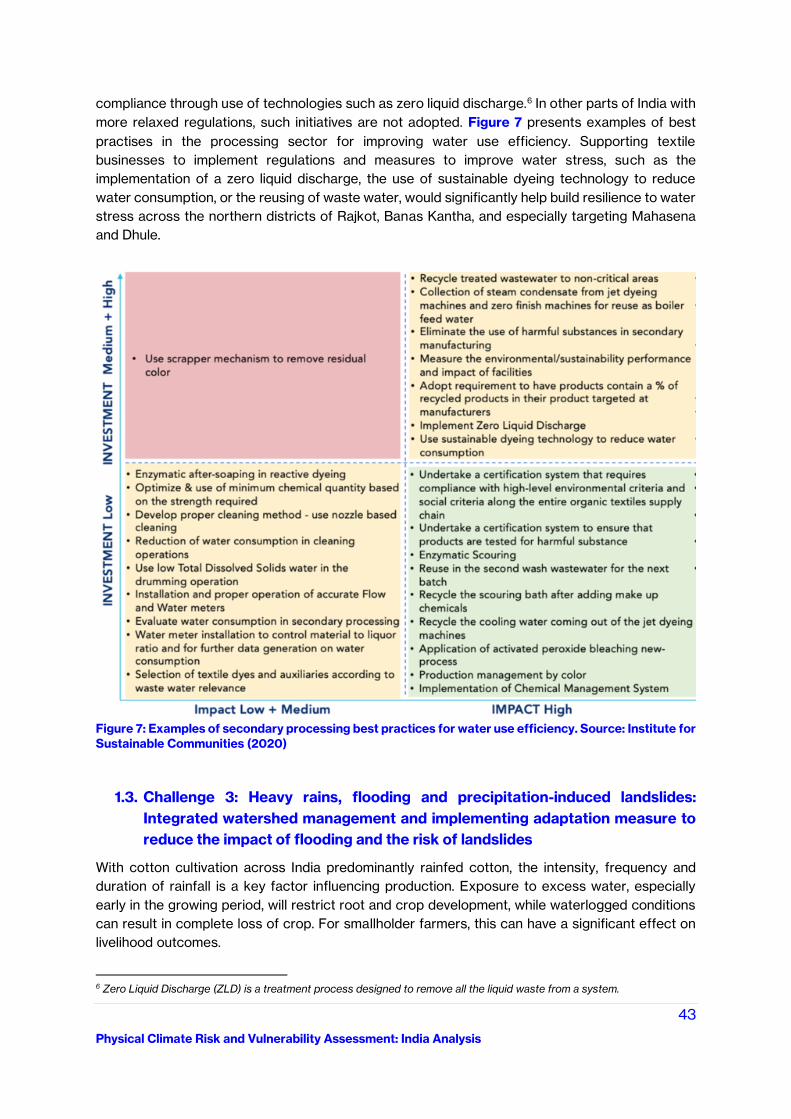
43
Physical Climate Risk and Vulnerability Assessment: India Analysis
compliance through use of technologies such as zero liquid discharge.6 In other parts of India with
more relaxed regulations, such initiatives are not adopted. Figure 7 presents examples of best
practises in the processing sector for improving water use efficiency. Supporting textile
businesses to implement regulations and measures to improve water stress, such as the
implementation of a zero liquid discharge, the use of sustainable dyeing technology to reduce
water consumption, or the reusing of waste water, would significantly help build resilience to water
stress across the northern districts of Rajkot, Banas Kantha, and especially targeting Mahasena
and Dhule.
Figure 7: Examples of secondary processing best practices for water use efficiency. Source: Institute for
Sustainable Communities (2020)
1.3. Challenge 3: Heavy rains, flooding and precipitation-induced landslides:
Integrated watershed management and implementing adaptation measure to
reduce the impact of flooding and the risk of landslides
With cotton cultivation across India predominantly rainfed cotton, the intensity, frequency and
duration of rainfall is a key factor influencing production. Exposure to excess water, especially
early in the growing period, will restrict root and crop development, while waterlogged conditions
can result in complete loss of crop. For smallholder farmers, this can have a significant effect on
livelihood outcomes.
6 Zero Liquid Discharge (ZLD) is a treatment process designed to remove all the liquid waste from a system.
44
Physical Climate Risk and Vulnerability Assessment: India Analysis
The CRVA shows that while Rajkot, Banas Kantha and Mahesana (Gujarat) are projected to be
exposed to increasing water stress for the 2040s, these districts will continue to experience
periods of extreme precipitation; significantly higher compared to the other districts considered in
this study. As previously described, the soils in Gujarat are poor quality with less water holding
capacity and soil organic carbon content, limiting permeability. Moreover, dried out soil following
periods of drought, increases the risk of surface water flooding and soil erosion, following periods
of heavy rain.
The CRVA identifies that the percentage of district exposure to projected flood risk during both a
1 in 10, and 1 in 100 year event is highest for Wardha in the state of Maharashtra, and Adilabad and
Khammam, in the state of Telangana state. Extreme precipitation is projected to increase across
these three districts. Furthermore, the absolute total rainfall received during the growing period is
projected to be significantly higher for the districts of Wardha, Adilabad and Khammam relative to
other districts, further increasing the risk of flooding. An additional hazard impacting these
southern districts, is that the districts of Adilabad and Khammam are also projected to experience
the greatest exposure to precipitation-induced landslides, with a coverage of 28% of total district
area exposed to landslide risk across Khammam.
Extreme precipitation, flooding and landslides pose a threat to both agricultural crops and to
buildings and infrastructure, hence is a risk to both the cotton cultivation and cotton processing
aspect of the CVC.
1.3.1 Adaptation actions for the cotton cultivation sector
Aim: Supporting the implementation of integrated watershed management. Target area: Rajkot,
Banas Kantha, Mahesana, Dhule, Wardha, Adilabad and Khammam
In rainfed areas, integrated watershed management can contribute significantly to the
improvement of livelihoods and towards building climate resilience, as projects have shown that
appropriate soil and water conservation practices can not only reduce surface water runoff,
prevent soil erosion and land degradation, and reduce flood and landslide risk, but can also
increase crop yield. Many organisations have attempted to promote improved land use and uptake
of soil-water conservation (SWC) technologies at the community level to improve agriculture,
improve livelihoods and prevent further erosion.xxii Government-led investments in the Adarsha
watershed in Telangana implemented various SWC technologies and techniques. The project
showed that the uptake of SWC practices significantly improved agricultural practices, and farmers
realised returns amounting to US$720/ha from cotton.xxiii The SWC technologies and techniques
implemented to reduce surface water runoff, to reduce soil erosion and to reduce the risk from
flooding and precipitation-induced landslides included the construction of contour and graded
bunds in the fields to minimise the velocity of runoff and allow more water to percolate into the soil
to protect it from erosion, the removal of silt from river channels, the management of impoundment
structures (e.g. sluice gates) to reduce peak discharge, and the control of runoff into soakaways
to increases groundwater recharge. Other SWC practices to improve water and soil conservation
included techniques such as balanced fertiliser application, use of improved seeds, supplementary
irrigation and crop diversification. Before the above SWC project was implemented, the baseline
average yield for cotton was 1050 kg/ha, however this increased to 1300 kg/ha after the
watershed intervention, representing a 24% increase in yield.
As shown here, SWC approaches can reduce the risk of flooding from surface water runoff or
fluvial flooding and can reduce soil erosion and protect soils from degradation, increasing crop
yield, and reducing climate sensitivity by making degraded lands more suitable for cotton
45
Physical Climate Risk and Vulnerability Assessment: India Analysis
cultivation. Supporting and implementing projects which employ soil-water conservation practices
across the districts of Rajkot, Banas Kantha, Mahesana, Wardha, Adilabad and Khammam could
provide significant climate resilience benefits.
1.3.2. Adaptation actions for the cotton processing sector
Aim: Implement adaptation measures such as early warning systems, real-time weather forecasting,
and evacuation plans to reduce the impacts of flooding on urban areas. Target area: Rajkot, Banas
Kantha, Mahesana, Wardha, Adilabad and Khammam
As part of the Asian Cities Climate Resilience Network’s working paper series, a study was
conducted to assess the ‘Flood-induced economic loss and damage to the textile industry in Surat
City, Gujarat’xxiv, following a significant flood event in 2006 that killed 150 people. The study aimed
to estimate the extent of direct and indirect loss and damage to the textile and weaving industry in
Surat and understand the measures adopted by the weavers and textile associations to build their
resilience to flooding. The study found that businesses in the city were severely impacted by the
2006 floods, with each business assessed requiring 49 days to return to normal operation. Most
workers left the city, causing a shortage of labour. The mean loss and damage for each business
was assessed to be approximately US$ 20,400. The surveyed textile businesses were unable to
access insurance, due to the reluctance of insurers to cover businesses located in flood risk areas.
Prior to the 2006 flood, the study showed that around 63% of textile business owners had
insurance. Despite the increase in insurance coverage, up to around 78% in 2014, the majority of
respondents interviewed for the study clarified that the ground floor of their business premises are
not typically covered by insurance. The study states that textile businesses are keen to buy
insurance to reduce the potential impacts of floods, however, most insurance companies are not
willing to insure their businesses, particularly the ground floor.
The study emphasises the overall urgency to implement measures to reduce the loss and damage
to the textile industry following flood events, and proposes a set of infrastructure- and policy-based
measures to help the textile industry become more resilient to climate change induced disasters.
Infrastructure measures include the installation of permanent pumps within the industrial areas to
help drain the flood waters, increasing the storm water drainage system, improving solid-waste
management systems to increase the workers’ health, incorporating tax waivers for businesses
post-floods so that businesses can collectively invest in infrastructure facilities. Furthermore, many
of the business owners interviewed for the study cited the availability of good quality and
trustworthy insurance products as a measure to strengthen business continuity.
In 2011, the Surat Municipal Corporation developed its City Resilience Strategy to address the
challenges of climate change in general, and flood vulnerability. This work was done in partnership
with the Rockefeller Foundation’s Asian Cities Climate Change Resilience Network and local
experts such as TARU Leading Edge, an Indian urban development consultancy. A major objective
of the strategy is to safely rehabilitate the poor and most vulnerable populations living in low-lying,
flood-prone parts of the city. The first major accomplishment by the strategy was an early warning
system that uses satellite data and hydrological models to forecast weather conditions. Mobile
phone messages are sent to citizens 48 hours in advance of the release of water, which gives them
time to react and evacuate, if necessary. The early warning system was critical in preventing large-
scale devastation by a flood in 2013. Another important development was the setting up of the
Urban Health and Climate Resilience Center (UHCRC) in 2013 to monitor the impact of extreme
health events. Industrial units at Hazira also partly financed the building of a weir.xxv
46
Physical Climate Risk and Vulnerability Assessment: India Analysis
Measures to prepare for and reduce the impacts of extreme precipitation and reduce the risk of
flooding across Rajkot, Banas Kantha, Mahesana, Wardha, Adilabad and Khammam, are required
to build climate resilience in these districts. To reduce the impacts on flooding, the support and
implementation of measures, in collaboration with local and regional governments, such as early
warning systems, real-time weather forecasting, and evacuation plans, are recommended. Other
measures may include producing a detailed city-level flood risk assessment, the formation of
designated overflow areas such as parks etc, and the implementation of improved upstream
watershed management. To prepare for extreme hazards, facilitating access to insurance for
textile business owners is recommended.
2. Sensitivity: How socio-economic improvements can help reduce
vulnerability
The following present sensitivity indicator led solutions to help build climate resilience.
2.1. Challenge 4: Gender inequality: How encouraging women to engage in
sustainable farming and other economic activities can reduce vulnerability
Women play a major role in the cotton value chain. As for the cotton cultivation sector, tasks
undertaken by female farmers have a direct impact on the quality and quantity of cotton produced.
The choices that women make in the field related to sowing, weeding, fertiliser application and pest
management can be optimised with proper information and resources, allowing them to respond
adequately to changing weather regimes and improve crop resilience in the wake of climate shocks
and stressors. Yet females often do not have equal access to education, training, decision-making,
skill development, finance and land-ownership, which limits their potential to improve cotton-
productivity and break out of low-wage positions.xxvi
The CRVA shows that the district of Mahesana has the lowest percentage of rural females in the
workforce (25%), followed closely by Rajkot, Nandurbar and Banas Kanthas (27%), Dhule (32%)
and Yavatmal (33%). The other districts record a range of 41% to 64% which is still generally low.
As for urban female work participation, again these are predominantly low in the districts located
in the northern regions, namely Banas Kantha (9%), Rajkot (10%), Mahesana (11%) and Dhule (14%)
and Latur (15%). All other districts fall within a range of 17% to 27%, which shows that urban female
work participation rate is significantly low across all districts.
Access to education and overall literacy is positively correlated with climate resilience, as it allows
access to information and knowledge, and increases the possibilities of accessing jobs of higher
pay. Rural female literacy rates amongst cultivators are very low at 18% in Mahbubnagar, Adilabad
(25%), Karimnagar (28%) and Khammam (33%). Urban female literacy rates amongst
manufacturers are slightly higher, but still low, especially in Adilabad (51%), Khammam (58%) and
Karimnagar (61%).
The CRVA shows that gender inequality is an issue across all districts. This is a compound issue
which varies in root cause across districts, from gender pay gap across the districts located in
Maharashtra, female participation in the workforce across districts located in Gujarat to literacy
rates across districts located in Telangana. Moreover, these discrepancies are higher for rural
cultivators relative to urban manufacturers, however discrepancies are still high for urban
manufacturer communities.
2.1.1. Adaptation actions for the cotton cultivation sector
47
Physical Climate Risk and Vulnerability Assessment: India Analysis
Aim: Supporting educational and training programs which aim to empower female cotton farmers
and encourage rural women to participate in economic activities. Target area: Rajkot, Banas Kantha,
Mahesana, Mahbubnagar, Adilabad, Karimnagar, and Khammam
Encouragingly, initiatives focused on reducing gender disparity and female empowerment are
taking place across India. Irish retailer Primark and CottonConnect, in collaboration with a local
NGO partner, established a sustainable cotton programme in Gujarat which focused on supporting
female farmers to learn sustainable farming methods, improve cotton yields and increase incomes.
Women were trained in the most appropriate farming techniques for their land, and decision-
making with regard to seed selection, water use, pest management and pesticide use, fibre quality
and grading, and proper storage of harvested cotton. Over 1,250 female smallholders were trained
through classroom sessions, in-field training and learning groups. The results of the initiative
resulted in average small-holder profit improvements of 211%, and an increase in household
incomes.xxvii
Furthermore, a ‘Business case for gender mainstreaming in cotton in Maharashtra’xxviii
commissioned by IDH, The Sustainable Trade Initiative, analysed gender-related division of labour
and responsibilities on cotton farms, women’s participation in decision making processes and their
access to resources and constraints that limit women’s role in cotton production. The study also
assessed existing farm practices, women farmer’s access to support through schemes, training,
subsidies, finances and extension services. The business case builds on the assessment’s findings
and suggests strategies such as building knowledge and skills of women farmers in agronomic
practices, and digital and financial literacy, improving access to credit linkages, government
schemes and extension services, forming women farmers’ cooperatives (Self Help Groups) and
sensitising communities and addressing gendered social norms.
A series of similar interventions to encourage women to participate in agricultural economic
activities would be especially beneficial in Rajkot, Banas Kantha and Mahesana to build resilience
across rural communities. Furthermore, supporting programmes which educate women around
sustainable farming, and enable women to access training and education, would also highly benefit
climate resilience-building effort in these districts in addition to Mahbubnagar, Adilabad,
Karimnagar, and Khammam.
2.1.2. Adaptation actions for the cotton processing sector
Aim: Create an enabling policy environment to empower women engaged in the CVC and ensure
effective implementation and reach. Build capacity and enhance skills of women engaged in cotton
cultivation and across the textile value chain. Target area: Rajkot, Banas Kantha, Mahesana, Dhule,
Latur, Adilabad, Karimnagar, and Khammam
The majority of the unskilled and semi-skilled workforce within the textile value chain constitute
women.xxix Gender pay gap, lack of wage security and benefits, and poor working conditions
subject women workers to exploitation and discrimination in the textile and garment industry.xxx
The handloom sector, which is largely unorganised and consists of small scale household based
units, engages about 3.5 million handloom workers, out of which 2.3 million workers (over 70%) are
women, mostly within the age bracket of 18-35 years.xxxi The demand on women in the handloom
sector is high, as in addition to handloom activities, they are also responsible for household chores
and family care work.xxxii Most women in the handloom sector are involved in allied activities such
as pre-loom and post loom activitiesxxxiii, which constitutes around 24% of the handloom
workforce.xxxiv A higher proportion of women handloom workers are self-employed compared to
men engaged in the sector, making them particularly vulnerable.xxxv Most handloom workers belong
48
Physical Climate Risk and Vulnerability Assessment: India Analysis
to socio-economically marginalised groups, with about 67% of weaver households earning less
than US$ 70 per month.xxxvi
To empower women engaged in the sector, the Ministry of Textiles has introduced multiple
schemes such as the National Handloom Development Programme, the Handloom Weavers’
Comprehensive Welfare Scheme, the Yarn Supply Scheme and the Comprehensive Handloom
Cluster Development Scheme.xxxvii As part of the National Handloom Development Programme, a
100% subsidy is given to women belonging to Scheduled Castes, Scheduled Tribes and who are
living Below Poverty Line (BPL) for construction of workspaces, and are provided 75% subsidy for
enrolling under Indira Gandhi National Open University (IGNOU) and National Institute of Open
Schooling (NIOS). Under the Ministry’s Integrated Skill Development Scheme, women were trained
to bridge the skill gap in the textile sector.xxxviii The Stand-up India scheme provides subsidies and
financial assistance to women entrepreneurs from marginalised communities to purchase power-
looms and other machinery.
Alongside the introduction of schemes for women workers in the textile sector, it is imperative to
increase awareness amongst females living in urban communities about government schemes,
eligibility and how to access benefits available for them. Supporting initiatives which aim to
empower women to engage with economic activities, especially textile and cotton processing
activities, would highly benefit the districts of Rajkot, Banas Kantha, Mahesana, Dhule, Latur,
Adilabad, Karimnagar and Khammam to build resilience amongst their urban communities.
2.2. Challenge 5: Small-holder farmers forming co-operatives to reduce
vulnerability
Marginal and small landholders are often non-viable for commercial production, are resource-
constrained, lack access to technology and information to boost productivity.xxxix They lack the
capacity to manage and respond to climatic events (e.g. access to irrigation during periods of water
stress) and therefore tend to have higher vulnerability to climate change, as compared to larger
farms with better access to resources. The CRVA shows that a key driver of climatic sensitivity is
the proportion of marginal landholdings (<1 ha), which is significantly high in Karimnagar (67%),
Khammam (62%), Mahbubnagar (58%) and Adilabad (50%), all of which are located in Telangana.
2.2.1. Adaptation actions for the cotton cultivation sector
Aim: Supporting initiatives which encourage cotton farmers to create group farms or co-operatives.
Target area: Karimnagar, Khammam, Mahbubnagar and Adilabad
The pooling of land and labour into group farming, or farming cooperatives, can offer farmers
economies of scale; reduced expenses for farm inputs, shared labour and skills, and greater access
to markets and government support. These advantages are particularly beneficial for women
cultivators. In Telangana, research shows that group farming results in savings on purchased
inputs, in particular hired labour, while matching annual productivity of individual farms.
A recently published paper evaluates the success of a project by the United Nations Development
Programme (UNDP) and the Government of India which supported 500 group farms across
Telangana between 2001-2005.xl Under the project, the UNDP-GoI provided small-scale farms,
which were solely managed by women, with a seed grant of Rs. 35,000 as a start-up revolving
fund, agricultural implements, training in specialised agricultural practices, and financial literacy.
The research has shown that group farming can provide an effective alternative, subject to
49
Physical Climate Risk and Vulnerability Assessment: India Analysis
specified conditions and tailoring of the model to the local context. Group farming could provide
them a dependable labour force, more investible funds and skills, and greater bargaining power
with governments and markets. These potential advantages could prove especially important for
women farmers who face production constraints over and above those faced by cultivators in
general.
The CRVA results reveal that not only do districts located in Telangana score highest with regards
to percentage of marginal and smallholder farmers, especially Karimnagar (67%), but they also
score highest in terms of rural female head of household, at up to 20% in Khammam. Considering
the benefits of group farming in terms of economic security for female farmers, supporting the
implementation of group farming or farming co-operatives would help build climate resilience in
Mahbubnagar, Adilabad and especially Karimnagar and Khammam.
2.3. Challenge 6: Combatting land degradation and soil erosion
Unsustainable land management practices and soil erosion increases the vulnerability of a district
to climate change as soil erosion is a major threat to cotton cultivation, particularly in rain-fed areas,
where continuous soil erosion reduces land productivity and harms livelihoods. Soil erosion, by
wind and water, strips topsoil of its organic content as well as acidity, salinity and alkalinity, making
soils unsuitable for agricultural activities.xli Particularly in rain-fed areas, continuous erosion
reduces land productivity and poses a major threat to cotton cultivation. Growing cotton on
degraded soils increases climate vulnerability as the soil has limited capacity to sustain the crop,
and no capacity to mitigate climatic hazards (e.g. waterlogging and drought).
Approximately 90% of cotton grown in India today is Bt cotton.xlii This variety was first developed
in the 1970’s as a cotton variety resistant to bollworm. While it was initially effective and temporarily
reduced pesticide use, secondary pests emerged with high pest resistance. The over-reliance on
Bt cotton and lack of seed diversification has resulted in high input costs through pesticide overuse
and lower profit margins.xliii Furthermore, Bt-cotton has resulted in widespread monocropping, a
lack of seed variety, and extensive fertiliser and pesticide use, which greatly deteriorates soils and
eventually makes land unsuitable for further cultivation. Areas with a high ratio of Bt-cultivated
cotton are more climatically sensitive due to poor soil health from extensive chemical inputs, and
poor performance under water-stressed conditions.
Bt cotton is grown extensively across all the districts analysed in this study, however the CRVA
shows that the proportion of degraded and waste land is highest for Dhule (53%) and Adilabad
(48%). Furthermore, Dhule ranks second place in terms of hazard risk due to projected increase in
drought conditions, wildfire risk and increase in damaging wind speeds – all of which contribute
to increasing land degradation and soil erosion.
2.3.1. Adaptation actions for the cotton cultivation sector
Aim: Supporting initiatives which provide education and training to cotton farmers on cultivation
methods that prioritise soil health. Target area: Dhule and Adilabad
A range of initiatives have successfully supported the training of farmers in sustainable land
management practices, improving soil health and achieving more secure livelihoods. For example,
the Laudes Foundation has supported 23,000 cotton farmers to convert to organic cultivation
practices, of which 16,000 of these will be organic certified and will receive a premium for their
cotton.xliv Ecological and organic cotton farming, that utilise diverse seeds, integrates crop rotation,
50
Physical Climate Risk and Vulnerability Assessment: India Analysis
and require minimal or no chemical inputs, can improve cotton productivity while improving soil
health, and land quality.
CottonConnect’s Organic Cotton Farmer Training Programme prioritises soil health as a key
component in supporting farmers to develop skills and knowledge to transition to organic. Farmers
learn a range of skills including how to intercrop cotton with peas or beans to support nutrient
fixation and ultimately improve cotton quality; how to compost and organically add nutrients to the
soil; and how to produce organic fertiliser, greatly reducing input costs. Improved soil management
through composting also increase water filtration in the soils, making soils less prone to
waterlogging during wet periods, and helping soils to retain moisture during dry periods.xlv Cotton
cultivation practices that prioritise soil health (organic, ecological) can greatly improve productivity
while enhancing the health and resilience of the land.
An initiative by the International Cotton Advisory Committee (ICAC) has developed a mobile phone
application named the ‘Soil and Plant Health App’, which uses the GPS location of a particular field
to enable a cotton farmer to receive information about the specific field of interest directly to the
phone.xlvi The mobile phone application provides a complete diagnosis for soil health and plant
health, soil nutrient deficiencies, insect pests and beneficial insects, diseases and nematodes,
agrochemical toxicities and extreme weather changes. Furthermore, the application has a unique
voice over feature for illiterate farmers and is available in four Indian languages.
Supporting and implementing initiatives similar to Laudes Foundation and CottonConnect’s organic
cotton training programmes, and ICAC’s mobile phone application, which provide education and
training to cotton farmers on cultivation methods that prioritise soil health, would benefit the
districts of Dhule and Adilabad, and increase the climate resilience of rural communities.
2.4. Challenge 7: Creating an enabling a policy environment for boosting growth
and investments across the cotton value chain
The CVC in India is complex, with small landholdings, small scale and fragmented processing units,
as well as large sized organised textile mills and enterprises.xlvii This makes it challenging to
strengthen cotton value chain linkages. However, over the past decade, the sector’s expanded
considerably with new enterprises and integrated manufactures and technology upgradationxlviii,
providing more employment opportunities. Many of these have been a result of schemes and
incentives introduced by the Ministry of Textiles. The CRVA shows that the districts with the lowest
number of cotton processing factories are Nagpur, Nandurbar, Dhule and Mahbubnagar.
2.4.1. Adaptation actions for the cotton processing sector
Aim: Create an enabling policy environment for the cotton value chain through schemes and
incentives for boosting investments and engagement in cotton processing and the textile value
chain. This will help build synergy and improve linkages across the CVC and address existing gaps.
Target area: Nagpur, Nandurbar, Dhule and especially Mahbubnagar
Telangana implemented a set of schemes as part of the Telangana Textiles and Apparel Policy
(2017), to boost downstream investments and generate employment opportunities in the textile
sector, with a focus on processing, spinning, weaving, knitting and garment manufacturing. While
the state produces one of the finest long staple cotton varieties, the CVC is largely limited to cotton
cultivation and ginning and pressing. While the state produces roughly 6 million bales of cotton,
spinning units in the state, as of 2017, had the capacity to spin only a million bales, annually.xlix Due
51
Physical Climate Risk and Vulnerability Assessment: India Analysis
to lack of spinning and weaving units in the state, processed cotton is exported to neighbouring
states such as Andhra Pradesh, Gujarat and Maharashtra, for further value addition. To address
these gaps in the value chain, the policy introduces schemes for capital assistance for new and
existing units, operational assistance including power tariffs, interest and tax subsidies, assistance
for energy, water and environmental compliance to existing units and incentives for adopting
environmental protection measures, assistance for purchase of new technology and capacity
building, among others. The ‘Fibre to Fabric’ incentive provides additional subsidies for entities that
establish production chains from production of fibre to fabric. The policy also includes support
provisions for the largely unorganised small-scale weaving sector. Along with a focus on
encouraging investments and generating employment opportunities for the local population, the
policy emphasises on providing ‘fair and decent wage to the workforce’.l,li
Support in implementing a similar incentive to the ‘Fibre to Fabric’ to encourage the establishment
of cotton processing units in order to add value to raw cotton, would not only increase financial
security and decrease the dependency on agriculture, but would increase the adaptive capacity
and build climate resilience across the districts of Nagpur, Nandurbar, Dhule and Mahbubnagar.
2.5. Challenge 8: Reducing volatility in cotton yield and production to reduce
vulnerability along the cotton value chain
Volatility in cotton prices may be due to several factors such as fluctuation in global market prices,
national regulation, subsidies and stockpiling. Crop failures due to various production constraints
such as small land holdings, rainfed cotton cultivation, weather-related natural hazards and a lack
of irrigation resources are a major challenge for cotton farmers. This creates an uncertain market
for farmers and has knock-on effects across the CVC. For example, increase in cotton prices and
market competitions have heavily impacted ginning and spinning mills in India. lii While minimum
support price (MSP) and procurement regulations introduced by the government and the Cotton
Corporation of India provides a certain degree of income security to cotton farmers liii, enterprises
across the cotton value chain have struggled with fluctuation in market prices. In 2018, the
Government of India increased the minimum support price for cotton by 28%, to ensure that cotton
farmers receive a minimum of 50% profit on their production costs. liv While this has boosted cotton
production, the textile industry, especially small spinning and weaving units, faces the challenge of
purchasing raw cotton at higher prices. In 2019, the difference between prices of yarn and cotton
(cotton price spread) fell as low as US$ 1/kg, leading to low profit margins for the spinning
industry.lv The price of yarn, being an intermediary product, is dependent both on cotton prices as
well as the demand in the fabric market.lvi Raw cotton exports have been increasing since 2004,
leading to the domestic textile industry competing with the international market.lvii In the domestic
market, price differences in different states is also a major challenge. lviii
The CRVA shows that cotton yield volatility between 1998 and 2007 was highest for Rajkot, Latur,
Banas Kantha and Nagpur, while the districts with the highest production volatility were Rajkot,
Yavatmal and Adilabad. While the volatility in yields is a greater driver of vulnerability across the
cotton cultivation sector and thus rural cotton farmers, volatility in production has a greater impact
on the vulnerability of urban, textile manufacturers.
2.5.1. Adaptation actions for the cotton cultivation sector
Aim: Identify financial bottlenecks which limit fair price realisation for farmers. Equip farmers with
price and market information, introduce regulatory mechanisms to connect farmers to the market,
52
Physical Climate Risk and Vulnerability Assessment: India Analysis
identify effective measures to improve price transparency and empower farmers through formation
of cooperatives to better control local markets. Target area: Rajkot, Latur, Banas Kantha and
Nagpur
IDH, in collaboration with Technoserve, studied the status of cotton cultivation in Maharashtra to
understand existing challenges which inhibit cotton farmers’ incomes and outline a strategy for
improving farmers’ livelihoods and incomes.lix One of the major challenges identified by the study
is cotton farmers are often not adequately compensated for high quality cotton, with aggregators
and local middlemen often capturing the bulk of profits. The assessment finds considerable
differences in cotton prices in different districts, based on access to government’s minimum
support prices and Agricultural Produce Market Committee (APMC)7 as opposed to markets
dominated by aggregators and local middlemen. For example, in the district of Yavatmal, only 2
percent of raw cotton was sold by farmers to local aggregators, while in the district of Jalna, about
98 percent of cotton was sold to middlemen. Districts with better competition, could sell their
produce at a higher rate, while those dominated by aggregators negatively impact farmer price
realisation. The other financial challenge recognised is that farmers’ access to finance remains
limited to crop loans. To address price realisation challenges, the strategy suggests a variety of
measures such as better market linkages and information, formation of cotton farmers’
cooperatives for farmers to better control the market through collective selling and purchasing,
improving access to crop insurance and lint-based marketing to avoid opaque pricing, among
others.
Supporting initiatives which aim to improve cotton farmers’ access to financial compensation and
crop insurance would mitigate the impacts of yield volatility on rural farming communities,
especially across the districts of Rajkot, Latur, Banas Kantha and Nagpur, decrease vulnerability
and help build climate resilience.
2.5.2. Adaptation actions for the cotton processing sector
Aim: Assess cotton price volatility along the CVC to understand existing bottlenecks and economic
and political drivers for different CVC interest groups. Introduce measures to improve access to
information and technology and empower farmers, weavers and decentralised units to be able to
make more informed market decisions. Provide financial safety nets for farmers, cooperatives and
spinning and weaving units to reduce market risks associated with price volatility and demand supply
gaps. Target area: Rajkot, Yavatmal and Adilabad
The International Institute for Sustainable Development (IISD) conducted an assessment of price
volatility in the cotton yarn industrylx to understand how price volatility of cotton and cotton yarn
impacts different rungs of the CVC, and national and local interventions implemented to address
price volatility challenges and provides recommendations to address these. The study notes that
most efforts made in the sector have been disjointed and there is need for a more integrated and
systematic approach to tackling price volatility across the CVC. The study’s recommendations
include institutional corrections such as maintaining yarn stocks, cooperatives creating reserve
funds for periods of high price volatility, regulation of cotton trade through licensing and price caps,
enabling cotton farmers and weavers to take control of cooperative mills, and integrating spinning
and weaving activities. Furthermore, the study also recommends improving technology access to
encourage scaling up of small units in cotton growing areas, make price information available to
farmers, spinners and weavers through rural kiosks, radio, etc. and encourage; strengthening
7 Agriculture markets are regulated under the Agricultural Produce Market Committee (APMC) Act and enacted by State governments.
53
Physical Climate Risk and Vulnerability Assessment: India Analysis
supply and trading processes through effective procurement mechanisms, market based risk
instruments to manage price fluctuations caused by unforeseen issues such as weather variability
and market price fluctuations, improving access to exchange markets and infrastructure, and more
research to strengthen risk insurance for farmers and all actors across the CVC; enhancing
capacity and knowledge of farmers and weavers to access and read trends; and expansion of
financial and technological support and funding from the mill sector to farmers and weavers.
Overall, the study emphasises the need to base interventions on social, economic and political
drivers for decision making among different interest groups along the CVC.
The plethora of recommendations stated in the study would highly benefit the districts of Rajkot,
Yavatmal and Adilabad, thus supporting projects and programs which aim to implement such
measures, including the formation of cooperatives to create reserve funds for periods of high price
volatility, improving technology access to make price information available through rural kiosks and
radios, and encouraging more research to strengthen risk insurance for all actors across the CVC.
3. Adaptive capacity: Supporting communities through skills, training etc and
buildings capacity
3.1. Challenge 9: Fair wages: Improving social compliance and empowering
workers
Adaptive capacity is poor among low-wage earners, and the impacts of climatic events are
disproportionately felt by those with poor access to resources. Low wages among cotton farmers
result in less resources for savings, less ability to make investments into better agricultural
practices or diversity income, and less ability to rebound after shocks and stress, for example
floods, droughts or pest outbreaks. Low wages among workers in the processing sector likewise
results in less resources for savings, more working hours to meet basic needs, and less ability to
rebound after market volatility / price spikes.
The CRVA shows that the average daily wages for male cotton labourers are variable ranging from
a low of 192 Rs/day (Mahesana) to a high of 460 Rs/day (Rajkot). The districts with the lowest
male wages are Mahesana (192 Rs/day), Dhule (200 Rs/day) and Latur (200 Rs/day) in Gujarat,
Yavatmal (192 Rs/day) in Maharashtra, and Khammam (192 Rs/day) in Telangana. Average daily
wages for female cotton labourers are lower than male wages, ranging from a low of 100 Rs/day
to a high of 300 Rs/day. The districts with the lowest female wages are Dhule (100 Rs/day), Latur
(100 Rs/day), and Nandurbar (115 Rs/day) in Maharashtra. The CRVA shows that the gender pay
gap is high in the majority of districts in this study (between 20-60%) and is illustrative of gender
inequality among cotton farmers. In Maharashtra women cultivators are typically paid 150 Rs/day
(£1.5) while men are paid 200-300 Rs/day (£2-3). Difference in wages between male and female
cotton growers is highest for all districts located in Maharashtra – namely Nandurbar, Nagpur,
Latur, Wardha, Yavatmal, Dhule. Additionally, according to a 2019 study in Maharashtra, only a third
of women cultivators had received any training in the last two years.lxi
The CRVA shows that average daily wages for males engaged in cotton processing activities range
from a low of 192 Rs/day to a high of 769 Rs/day (Nagpur). The district with the lowest wages is
Khammam, Telangana (192 Rs/day), followed by Nandurbar (231 Rs/day) in Maharashtra. Wages
are also low in Mahbubnagar (300 Rs/day), Wardha (300 Rs/day) and Latur (346 Rs/day). Data
was unavailable for the wages of females in the cotton processing sector. Thus, a comparison was
not possible.
54
Physical Climate Risk and Vulnerability Assessment: India Analysis
3.1.1. Adaptation actions for the cotton cultivation sector
Aim: Support initiatives which encourage farmers to produce cotton in a sustainable manner to be
rewarded with a Fairtrade minimum price and a Fairtrade premium. Target area: Mahesana, Dhule,
Latur, Yavatmal and Khammam
Initiatives that minimise production costs (e.g. fertilisers), and standards that fetch a higher price
for cotton (e.g. organic, Fairtrade) serve as a means to improve the livelihoods of cotton farmers
and minimise harmful environmental practices. Chetna Organics, based in Maharashtra, is India’s
largest organic and Fairtrade producer. They supported 15,279 cotton-cultivating families
organised into 13 cooperatives since its inception in 1994. Organic farming provides farmers with
the opportunity to obtain yields on par with conventional cotton while drastically minimising the
high production costs associated with pesticides and chemical fertilisers. Farmers that produce
cotton in a sustainable manner are rewarded with a Fairtrade minimum price and a Fairtrade
premium. The Fairtrade premium is an additional sum of money that is pooled into a communal fund
for farmers and cultivators to use as deemed necessary. This could entail providing payments to
farmers to otherwise prevent them from selling cotton when prices are low or investing in
technological investments or infrastructure that build climate resilience. Additionally, investments
have included constructing warehouses for cotton storage so that communities can store cotton
and sell it when the price is high.lxii,lxiii
As identified in the CRVA, cotton farmers in the districts of Mahesana, Dhule, Latur, Yavatmal and
Khammam would highly benefit from being engaged in Fairtrade initiatives to not only improve the
wages for cotton farmers in general, but to also eliminate the significant gender disparity in wages.
3.1.2. Adaptation actions for the cotton processing sector
Aim: Support the implementation of programs such as the Fairtrade Textile Programmes which
supports supply chain actors in changing their approach to tackling social compliance. Target area:
Khammam, Nandurbar, Mahbubnagar, Wardha and Latur
As for people employed in the textile industry and the cotton processing aspect of the CVC,
Fairtrade International, an ethical marketing organisation, has introduced the Fairtrade Textile
Standard as part of the Fairtrade Textile Programme, aimed at facilitating change in textile supply
chains and associated businesses. Recognising the existing challenges in the textile industry such
as lack of safety in workspaces, low wages, forced labour and gender-based violence in the largely
unorganised sector, the organisation launched the Fairtrade Textile Programme to support supply
chain actors in changing their approach to tackling social compliance. The Fairtrade Textile
Standard sets requirements for participation in the Fairtrade system for workers across the textile
supply chain, focusing on improving living standards of workers, and empowering them socially and
economically. As part of this initiative, the organisation supports management of production sites
through preparing action plans and providing specialised training .
The CRVA results point to the districts of Khammam, Nandurbar, Mahbubnagar, Wardha and Latur
as potential important beneficiaries of the Fairtrade Textile Programme, as all these districts
record low average wages for males engaged in cotton processing activities.
55
Physical Climate Risk and Vulnerability Assessment: India Analysis
3.2. Challenge 10: Increasing access to banking services to increase financial
security.
Access to banking services provides a form of security in the face of disaster. Banking facilities
are an important indicator of wealth and provide information related to the adaptive capacity of the
region in response to extreme events or climate related shocks. The higher the proportion of urban
and rural population with access to banking services, the higher the adaptive capacity.
The cotton cultivation CRVA shows that access to banking services is low for rural communities
across all districts ranging from 30% to 67%. It is particularly low in Khammam, Telangana (42%),
Dhule, Maharashtra (38%) and especially in Nandurbar, Maharashtra where the proportion of
households availing banking services out of the total rural population is as low as 30%. Maharashtra
has the districts with the lowest access to bank accounts Nandurbar (30%) and Dhule (38%).
Access to banking services is comparatively higher in urban communities, ranging from 56% to
73.3. Access to bank accounts is low in Telangana; Khammam (57%), Mahbubnagar (58%), and
Maharashtra; Dhule (58 %) and as with rural areas, is the lowest in Nandurbar (56%). The
proportion of urban households with access to banking services is lowest in Telangana, followed
by Maharashtra.
Access to banking services is greater in urban areas than rural areas across all districts, with the
exception of Latur, Maharashtra where it is equal. For example, in rural Nandurbar 30% of
households have access to banking services, compared to urban Nandurbar where 56% of
households have access.
3.2.1. Adaptation actions for the cotton cultivation sector
Aim: Support initiatives which help set up ‘banking kiosks’ in rural communities. Target area:
Khammam, Dhule and especially Nandurbar
Access to banking facilities are low to moderate for rural communities, and particularly low for rural
women who seldom have opportunities for land ownership and decision-making in farming
practices. Rural women tend to lack experience in commercial transactions and have limited
knowledge of private and public financial products and services. Yet research shows that when
women cultivators have access to decision-making, it can result in a profit increase of 40%.lxiv
Technoserve in partnership with Visa Inc and Gap Inc piloted a project in 60 villages in the state of
Madhya Pradesh to advance women’s decision-making and create access to finance. One of the
programme’s initiatives involved bringing a banking representative to a local residence at a time
whereby a group of women could convene and set up their own bank accounts. A bank account
would allow women to save formally, grow investments, withdraw funds as needed, and enable
digital payments for business transactions. The initiative also set up ‘banking kiosks’ located in rural
areas as bank branches are often concentrated in populous areas and reaching a bank for a
transaction can take a full day. These initiatives increase women’s income and decision-making
power on the farm, making them more resilient and better equipped to manage climate stressors. lxv
Launched by the International Fund for Agricultural Development (IFAD) in 2012, the Adaptation
for Smallholder Agriculture Programme (ASAP) is the world’s largest climate change adaptation
programme for smallholder farmers.lxvi The aim of the trust fund is to channel climate finance to
smallholder farmers so they can access the tools and technologies that help build their resilience
to climate change, reaching millions of smallholders worldwide, including across India. ASAP
empowers community-based organizations to make use of new climate risk management skills,
56
Physical Climate Risk and Vulnerability Assessment: India Analysis
information and technologies and combine them with tried and tested approaches to sustainable
land and water management. For example, improved weather station networks are providing
farmers with more reliable seasonal forecasts while mapping technologies are helping farmers to
better understand and monitor landscape use in a changing environment. India is the largest
borrower from the IFAD Fund, and IFAD has invested US$2.8 billion, including US$1 billion of IFAD’s
own financing, through 28 projects, directly benefiting some 4.6 million households. In partnership
with the government, these IFAD-supported projects have delivered significant results in various
areas including the commercialization of smallholder agriculture, grass-roots institution building to
enable communities to manage their own development, the empowerment of women, and the
improvement of livelihoods in tribal and other communities. lxvii
While this pilot project occurred in Madhya Pradesh, it could be applied to Khammam, Dhule and
especially Nandurbar to increase access to bank accounts for rural women, men, and households,
and thus help build resilience across rural communities.
3.2.2. Adaptation actions for the cotton processing sector
Aim: Support initiatives which encourage training in financial literacy and improve access to and
invest in technologies such as ATMs, telephone and internet banking. Target area: Khammam,
Mahbubnagar, Dhule and especially Nandurbar
Access to banking services is comparatively higher in urban than rural communities, ranging from
56% to 73.3%, yet there is still a large proportion of the population without a bank account. In
recent years, the Indian government undertook an ambitious strategy to enhance financial inclusion
(both in rural and urban areas) to achieve development objectives. Government sponsored
programmes promoted access to no-frills savings accounts for low-income groups that required
zero balance to set up and offered very low maintenance fees. Additionally, expanding
technologies such as ATMs8, telephone and Internet banking and biometric point of transaction
terminals have been very successful in enhancing access in a region like India, where
telecommunications, particularly in urban areas, are strong. Yet surveys show that accessibility still
remains an issue with low-income workers needing to pay a substantial portion of their wages to
travel to a bank, wait in long queues at the bank to be served and thereby foregoing a working day
as a result.lxviii While efforts to enhance banking access have been broadly successful across India,
the urban and rural working poor still tend to channel savings into informal saving mechanisms. lxix
Efforts to enhance financial literacy and bank accessibility; potentially through longer operating
hours, more locations, information on how to use telephone/wireless options, may help facilitate
greater uptake among urban cotton processors in the districts of Khammam, Mahbubnagar, Dhule
and especially Nandurbar.
3.3. Challenge 11: Increasing access to technology/Internet access to increase
access to information.
Access to technology and to the internet enables households to receive emergency warnings prior
to disasters, increasing their ability to respond to warnings and take preventative measures. The
8 In recent years there has been an enormous growth in ATMs in India; between 2014 to 2017 ATMs grew by 28% across India.
57
Physical Climate Risk and Vulnerability Assessment: India Analysis
higher the proportion of the rural population with access to the Internet, the greater their adaptive
capacity.
The cotton cultivation CRVA shows that access to technology and Internet for rural communities
is extremely low, ranging from 0.3% to 0.9%. The districts with the lowest access are Karimnagar
(0.4%) and Mahbubnagar (0.3%) in Telangana, Nandurbar (0.4%) in Maharashtra and Banas
Kantha (0.3%) in Gujarat.
Access to technology and Internet is comparatively higher in urban communities, whilst still low,
ranging from 0.7% to 8%. The districts with the lowest access are Adilabad (0.7%), Karimnagar
(2.6%) and Mahbubnagar (3%) in Telangana, and Banas Kantha (2.5%) in Gujarat.
3.3.1. Adaptation actions for the cotton cultivation sector
Aim: Support programmes which help rural cotton farmers access web-based Decision Support
System (DSS). Target area: Adilabad, Karimnagar, Mahbubnagar and Banas Kantha
To help cotton farmers access real-time data to help make informed decisions, WWF-India's
Sustainable Agriculture Programme (SAP) in collaboration with Swedish multinational IKEA,
introduced in 2017 the ‘Cotton Doctor’ mobile app, an Android and web-based decision support
system.lxx The app delivers alerts about extreme weather events, pest forecasts and irrigation
advice straight to the farmers’ smartphones – this information assists them in making effective
farming decisions. While not all farmers have access to a smartphone, WWF-India has launched a
physical ‘farmer kiosk’ in the Jalna district of Mahrashtra, which allows farmers from the district to
access the app via a tablet computer situated inside the kiosk. WWF-India expects around 30,000
farmers to benefit from access to the kiosk.
Supporting programmes which help rural cotton farmers access web-based Decision Support
System (DSS), such as the ‘Cotton Doctor’ mobile app would highly benefit all districts addressed
in this study, but would especially help build climate resilience in Adilabad, Karimnagar,
Mahbubnagar and Banas Kantha.
3.3.2. Adaptation actions for the cotton processing sector
Aim: Help textile businesses to access government funds to facilitate the adoption of ICT. Target
area: Adilabad, Karimnagar, Mahbubnagar and Banas Kantha
A studylxxi published in 2007 assessed the level of technology adoption within the context of the
Indian garment industry. Access to technology and access to the Internet generally helps to reduce
production cost and time, enables manufacturers to market their products online, and ensures that
the Indian garment manufacturers remain competitive and grow relative to global markets. The
study, which has a number of important translatable messages for the pre-garment manufacturing
CVC (the subject of our study), showed that small firms have less access to technology compared
to larger firms, and that small sized firms may be constrained by available resources that could
otherwise be allocated to the adoption of advanced technologies, and thus are limited in
responding to global competition. Moreover, this potential lack of ICT may hinder access to
information that can help companies take action on weather- and climate-related risks. Smaller
firms therefore require support from government initiatives and industry programmes to remain
competitive and access the resources that support their businesses.
The Government of India is making investments under the Credit Linked Capital Subsidy and
Technology Upgradation Scheme (CLCS-TUS) to encourage private investment in the Indian
textile and apparel industry, to facilitate modernisation / technology upgradation of textiles mills,
58
Physical Climate Risk and Vulnerability Assessment: India Analysis
to make available funds to the domestic textile industry for existing units as well as to set up new
units with state-of-the-art technology, and to facilitate the upgrade existing technology to a
substantially higher tech level. Specifically, the Promotion of Information and Communication
Technology in MSME Sectorlxxii scheme was set up to encourage and assist small businesses in
adopting ICT applications to achieve competitiveness in national and international markets. The
broad activities planned under the scheme include identifying target cluster for ICT intervention,
setting up of e-readiness infrastructure, developing web portals for clusters, skill development of
MSME staff in ICT applications, preparation of local software solution for MSMEs to enhance their
competitiveness, construction of e-catalogues and e-commerce etc., and networking MSMEs on a
national portal in order to outreach MSMEs into global markets. It is possible that schemes, like the
above, could be used to disseminate and create business to business dialogue around managing
physical climate risks, including the sharing of good practices and guidelines covering many of the
issues described in this section.
Helping textile businesses to access the fund in order to implement measures to facilitate the
adoption of ICT would not only ensure that textile businesses remain competitive on a national and
global stage, but also help them indirectly build resilience, particularly across the districts of
Adilabad, Karimnagar, Mahbubnagar and Banas Kantha.
59
Physical Climate Risk and Vulnerability Assessment: India Analysis
Next steps
How should this report be used?
The India Analysis, and the broader Global Analysis, were both generated by Cotton 2040 in
response to the lack of comprehensive, readily available information about how the climate crisis
is likely to impact cotton production, its supply chain, and the nature of the industry over the coming
decades. The reports and supporting resources are aimed at apparel brands and retailers, cotton
producers or those working with them, sustainable cotton standards and industry associations, the
climate finance community, civil society organisations working on climate justice and adaptation,
and other actors across the cotton value chain.
The information presented in these resources is designed to help users prioritise supporting and
implementing adaptation actions to help build climate resilience across the cotton value chain.
Users can identify in which districts cotton cultivation or cotton processing aspects of the cotton
value chain are at greatest risk from climate change projected for the 2040s. Most importantly,
resources allow individuals and organisations to explore the vital drivers which exacerbate risks in
these districts, and, utilise this information to address the question:
“How can I, as a stakeholder in the cotton value chain, take action to help address climate risks
and work towards increasing climate resilience in my district?”
Addressing this question forms the core objective of Cotton 2040. Identifying these drivers of risk
is a crucial first step in the cotton value chain adaptation story, as it can be used to guide
responsible action and drive interventions towards increasing resilience of the CVC to climate
change. What is clear, however, is that investing in climate justice and socio-economic resilience
IS investing in climate resilience.
The section ‘Discussion: Paving the way forward’ in the full report makes a first attempt at
identifying examples of various programmes, practical activities and research efforts which have
been successful in tackling these challenges and building climate resilience of the CVC across
India. Each of the components used to calculate climate risks – namely hazard, exposure, sensitivity
and adaptive capacity – have been used to structure the discussion. The focus areas are identified
i.e., one, some or all districts that will benefit from the proposed adaptation actions. It is also
specified whether a solution is applicable for cotton cultivation and the rural communities, or for
cotton processing and urban communities. These solutions are intended to demonstrate initial
examples of good-practice adaptation cases currently underway in India which help build climate
resilience going forward.
The Cotton 2040 Climate Adaptation workstream will further build on this work through 2021-22
and beyond. The focus will be on supporting the sector to further understand the report findings;
explore the implications for individual organisations and the cotton value chain; create a more
exhaustive pool of adaptation actions and solutions to build resilience; and – critically – identify and
act collectively on systemic solutions. We hope you will join us!
To access the reports, the Climate Risk Explorer tool and supporting resources visit
www.acclimatise.uk.com/collaborations/cotton-2040/. For more information, please contact:
To learn more and explore how your organisation can help create a resilient cotton sector,
please contact Hannah Cunneen at [email protected].
To find out more about Cotton 2040 visit www.forumforthefuture.org/cotton2040.
60
Physical Climate Risk and Vulnerability Assessment: India Analysis
Glossary
Adaptive capacity- The ability of systems, institutions, humans, and other organisms to adjust to
potential damage, to take advantage of opportunities, or to respond to consequences. lxxiii Building
adaptive capacity involves undertaking research, monitoring data and relevant information
sources, awareness raising, capacity building and creating a supportive institutional framework.lxxiv
Baseline scenario- Scenario without the project, or scenario that is based on the assumption that
no mitigation policies or measures will be implemented beyond those that are already in force
and/or are legislated or planned to be adopted. Baseline scenarios are not intended to be
predictions of the future, but rather counterfactual constructions that can serve to highlight the
level of emissions that would occur without further effort. “Baseline Scenario” is used
synonymously with “Reference Scenario”, but also sometimes with “Business-as-Usual (BAU)
Scenario” although the use of the term BAU has fallen out of favour due to uncertainties in very
long-term projections.lxxv
Climate change- A change of climate which is attributed directly or indirectly to human activity
that alters the composition of the global atmosphere and which is in addition to natural climate
variability observed over comparable time periods. lxxvi
Climate change adaptation- Adjustment in natural or human systems in response to actual or
expected climatic stimuli or their effects, which moderates harm or exploits beneficial
opportunities.lxxvii
Climate variability- Climate variability refers to variations in the climate on all spatial and temporal
scales beyond that of individual weather events. Variability may be due to natural internal
processes within the climate system (internal variability), or to variations in natural or
anthropogenic external forcing (external variability).lxxviii The term is often used to denote deviations
of climatic statistics over a given period of time (e.g. a month, season or year) when compared to
long-term statistics for the same calendar period. Climate variability is measured by these
deviations, which are usually termed anomalies.lxxix
Exposure- The presence of people, livelihoods, species or ecosystems, environmental functions,
services, and resources, infrastructure, or economic, social, or cultural assets in places and
settings that could be adversely affected.lxxx
Extreme weather event- Refers to weather phenomena that are at the extremes of the historical
distribution and are infrequent for a particular place and/or time, especially severe or unseasonal
weather. Such extremes include flooding, hurricanes, and high winds, and heat waves. lxxxi When a
pattern of extreme weather persists for some time, such as a season, it may be classed as an
extreme climate event, especially if it yields an average or total that is itself extreme (e.g., drought
or heavy rainfall over a season).lxxxii
Hazard- The potential occurrence of a natural or human-induced physical event, or trend or
physical impact, that may cause loss of life, injury, or other health impacts, as well as damage and
loss to property, infrastructure, livelihoods, service provision, ecosystems, and environmental
resources. In the context of climate change, the term hazard usually refers to climate-related
physical events or trends or their physical impacts. lxxxiii
Representative concentration pathways (RCPs)- Understanding the relationship between GHG
emissions of today and its long-term impacts over the next years or decades requires standardised
basis. RCPs are scenarios that describe alternative trajectories for CO2 emissions and its resulting
61
Physical Climate Risk and Vulnerability Assessment: India Analysis
concentration in the atmosphere from 2000 to 2100. RCPs provide common standard scenarios
for climate researchers and modellers to work on. Four RCP trajectories are commonly used, and
each RCP projects a different degree of warming by the end of the century. Projected change in
temperature by 2081-2100 relative to 1850-2100 under a RCP 2.6 is +1.6°C, +2.4°C for RCP 4.5,
+2.8°C for RCP 6.0. and +4.3°C for RCP 8.5.
Resilience- The capacity of social, economic, and environmental systems to cope with climate
change induced hazardous events or trend or disturbance, responding or reorganizing in ways that
maintain their essential function, identity and structure, while also maintaining the capacity for
adaptation, learning and transformation.lxxxiv
Risk- The potential for consequences where something of value is at stake and where the outcome
is uncertain, recognising the diversity of values. Risk is often represented as probability of
occurrence of hazardous events or trends multiplied by the impacts if these events or trends occur.
Risk results from the interaction of vulnerability, exposure and hazard. The Intergovernmental
Panel on Climate Change (IPCC) primarily use the term risk to mostly refer to the physical risks of
climate change impacts.lxxxv
Sensitivity- This is the degree to which ‘a system’ is affected, either adversely or beneficially, by
climate variability or change. It is ‘typically shaped by natural and/or physical attributes of the
system’ but also ‘refers to human activities which affect the physical constitution of a system’.9
Vulnerability- The propensity or predisposition to be adversely affected. Vulnerability
encompasses a variety of concepts and elements including sensitivity or susceptibility to harm and
lack of capacity to cope and adapt.lxxxvi
Acronyms
CVC- Cotton Value Chain
CRVA- Climate Risk and Vulnerability Assessment
EGDD- Effective Growing Degree Days
GCM- Global Circulation Models
GDP- Gross Domestic Product
IPCC- Intergovernmental Panel on Climate Change
ILO- International Labour Organisation
RCP- Representative Concentration Pathway
UNFCCC- United Nations Framework Convention on Climate Change
VA- Vulnerability Assessment
9 GIZ. 2014. The Vulnerability Sourcebook. Concepts and guidelines for standardised vulnerability assessments. GIZ, Bonn and Eschborn, Germany.
62
Physical Climate Risk and Vulnerability Assessment: India Analysis
Appendix 1: Methodology
This chapter presents the methodology used in this analysis, which takes a four-step systemic
approach.
Step 1: Identifying the focus along the cotton value chain
This study essentially carries out two separate analyses, each of which focuses on two separate
components of the CVC: cotton cultivation and cotton processing up until the pre-garment
manufacturing stage.
The cotton cultivation Climate Risk and Vulnerability Assessment (CRVA), the subject of this report,
will predominantly assess physical climate risks to cotton growing areas, people employed as
cotton growers, cultivators and agricultural workers, and to rural communities more broadly. The
cotton processing CRVA will predominantly assess physical climate risks to cotton processing
factories and units, people employed as manufacturers, and to urban/ peri-urban communities
more broadly.
Step 2: Identifying focus regions
In order to identify which districts in India should be the focus of the study, the analysis makes use
of a ‘location quotient (LQ)’ methodology. A LQ is used to quantify the concentration of a particular
economic activity/industry in a specific region relative to the national average (Equation 1).
District-scale employment data was obtained for 2018-2019 for various industry codes specific to
the CVC in India using the following sector sub-classes of the CVC as per India Standard Industry
Codes10:
Cotton cultivation
A. 01161 - Growing of cotton
Cotton processing
B. 01632 - Cotton ginning, cleaning and bailing
C. 13111 - Preparation and spinning of cotton fibre
D. 13121 - Weaving, manufacture of cotton and cotton mixture fabrics
E. 13131 - Finishing of cotton and blended cotton textiles
F. 13911 - Manufacture of knitted and crocheted cotton fabric
10 Data derived from: Unit level Periodic Labour Force Survey Data 2018-2019, Government of India. Edited by: Dr. Paaritosh Nath
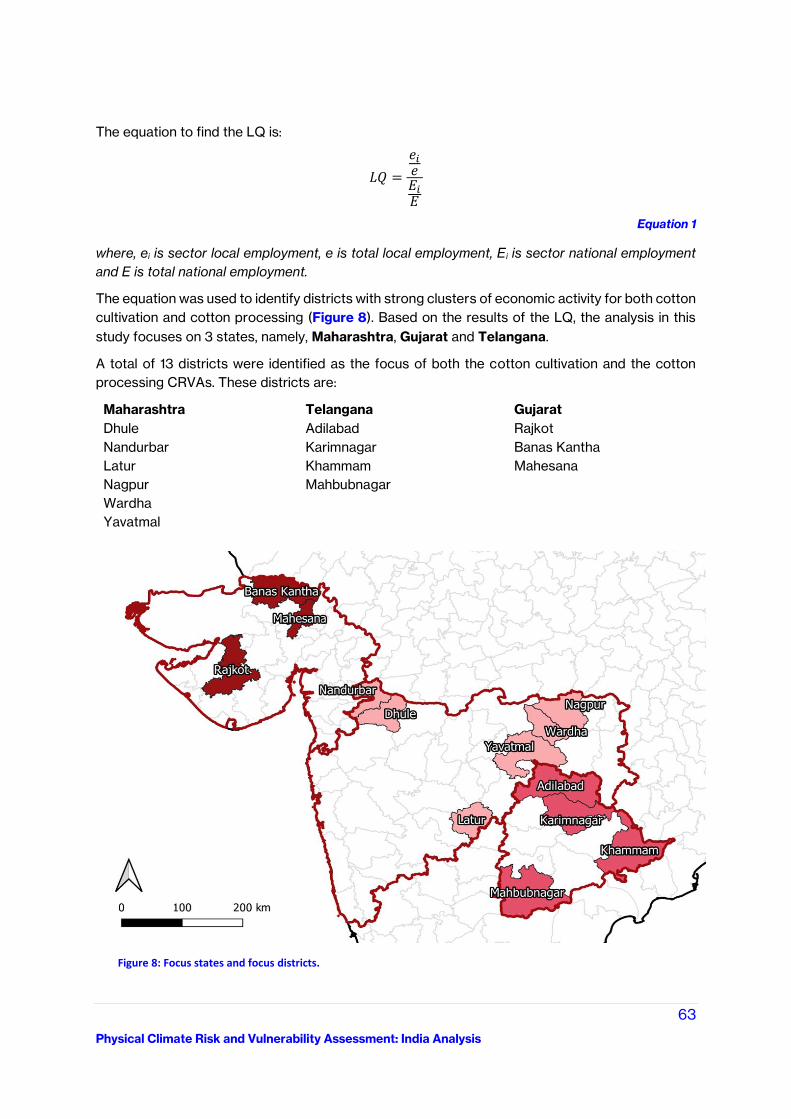
63
Physical Climate Risk and Vulnerability Assessment: India Analysis
The equation to find the LQ is:
𝐿𝑄 =
𝑒𝑖𝑒𝐸𝑖𝐸
Equation 1
where, ei is sector local employment, e is total local employment, Ei is sector national employment
and E is total national employment.
The equation was used to identify districts with strong clusters of economic activity for both cotton
cultivation and cotton processing (Figure 8). Based on the results of the LQ, the analysis in this
study focuses on 3 states, namely, Maharashtra, Gujarat and Telangana.
A total of 13 districts were identified as the focus of both the cotton cultivation and the cotton
processing CRVAs. These districts are:
Maharashtra Telangana Gujarat
Dhule
Nandurbar
Latur
Nagpur
Wardha
Yavatmal
Adilabad
Karimnagar
Khammam
Mahbubnagar
Rajkot
Banas Kantha
Mahesana
Figure 8: Focus states and focus districts.
64
Physical Climate Risk and Vulnerability Assessment: India Analysis
Step 3: Defining the CRVA framework
Aim of the CRVA
The purpose of both CRVAs is to formalise and quantify concepts of risk to climate change in order
to provide a measure of the vulnerability to both stages of the CVC;
● CRVA 1: Cotton cultivation
● CRVA 2: Cotton processing
Selection of the CRVA approach
A literature review of existing CRVA approaches was carried out to inform the CRVA methodology.
A framework has been created to provide a powerful tool for assessing the issues contributing to
physical climate risk and vulnerability for the CVC. Many frameworks and guidance documents on
vulnerability assessments specifically for India were reviewed, including:
● UNFCCC Resource Guide for Preparing the National Communications of Non-Annex I
Parties – Module 2: Vulnerability and Adaptation to Climate Change i
● GIZ: A Framework for Climate Change Vulnerability Assessments ii
● The Toolkit for Vulnerability and Adaptation Training by the Stockholm Environment
Institute iii
● Gender and Climate Change Research in Agriculture and Food Security for Rural
Development by the Food and Agriculture Organization iv
● CARE Climate Vulnerability and Capacity Analysis Handbook v
● Handbook on Vulnerability and Adaptation Assessment vi
In line with the mandate for this study, a CRVA methodology was developed on the basis of the
latest internationally accepted definitions and approach to CRVA as presented by the
Intergovernmental Panel on Climate Change (IPCC) report, the 2014 Fifth Assessment Report
(AR5).
Defining the main component of a Climate Vulnerability and Risk Index
Hazards, exposure, vulnerability and impacts are central to the concept of “risk” as defined in the
IPCC’s Fifth Assessment report. As shown in Figure 9, changes in both the climate system (left
hand side) and socioeconomic processes including adaptation and mitigation (right hand side) are
drivers of hazards, exposure, and vulnerability. As such, risk is “the interaction of climate-related
hazards (including hazardous events and trends) with the vulnerability and exposure of human and
natural systems” that results in the risk of climate-related impacts.
A CRVA informed by the IPCC’s tripartite concept of risk can help form the evidence base for a
structured assessment of future possible climate risks, as well as the prioritisation of risk
management / adaptation options at a range of spatial scales. The CRVA can bring together a suite
of hazard, sensitivity, exposure and adaptive capacity indicators that can be normalised to a
common scale, enabling a rich picture to be formed of climate risk and vulnerability hotspots, and
the drivers behind these hotspots. As such, the CRVA helps to ensure that adaptation options are
linked to specific risks and vulnerabilities, and that these options are tailored to specific regions.
Probing more deeply, the development of individual indicators that describe the separate
components of the CRVA (e.g. capacity to adapt) can allow the identification of the drivers of risk
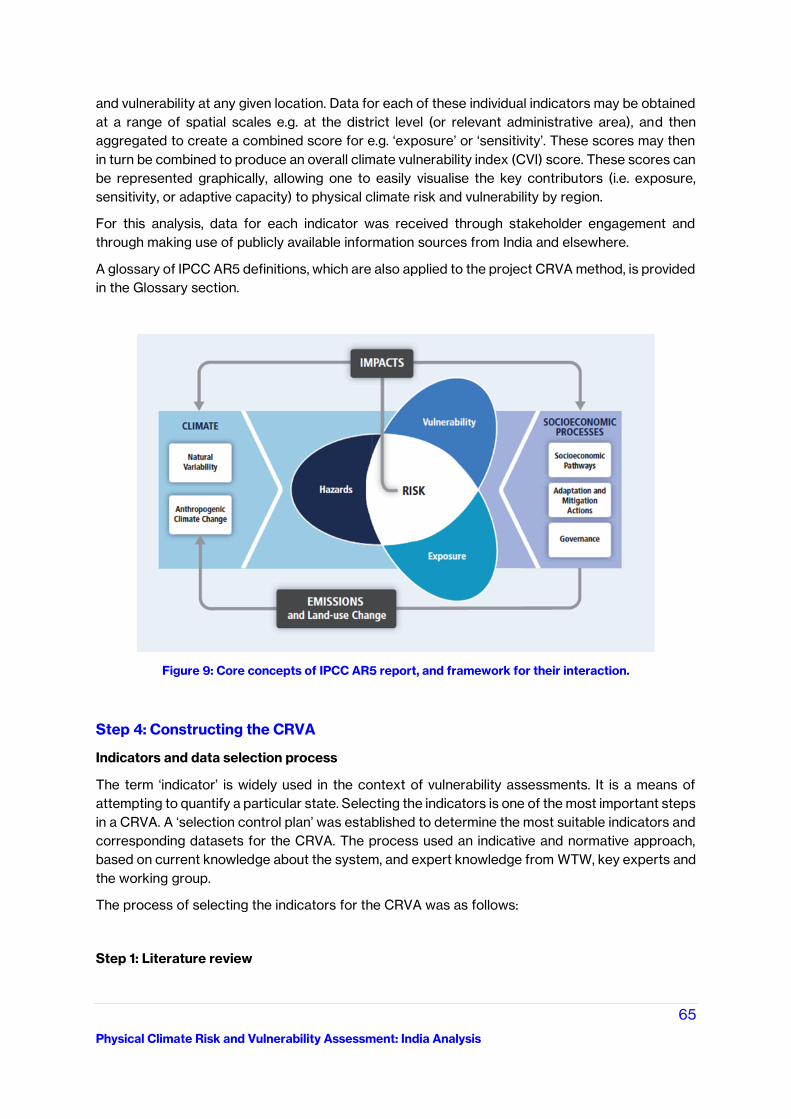
65
Physical Climate Risk and Vulnerability Assessment: India Analysis
and vulnerability at any given location. Data for each of these individual indicators may be obtained
at a range of spatial scales e.g. at the district level (or relevant administrative area), and then
aggregated to create a combined score for e.g. ‘exposure’ or ‘sensitivity’. These scores may then
in turn be combined to produce an overall climate vulnerability index (CVI) score. These scores can
be represented graphically, allowing one to easily visualise the key contributors (i.e. exposure,
sensitivity, or adaptive capacity) to physical climate risk and vulnerability by region.
For this analysis, data for each indicator was received through stakeholder engagement and
through making use of publicly available information sources from India and elsewhere.
A glossary of IPCC AR5 definitions, which are also applied to the project CRVA method, is provided
in the Glossary section.
Figure 9: Core concepts of IPCC AR5 report, and framework for their interaction.
Step 4: Constructing the CRVA
Indicators and data selection process
The term ‘indicator’ is widely used in the context of vulnerability assessments. It is a means of
attempting to quantify a particular state. Selecting the indicators is one of the most important steps
in a CRVA. A ‘selection control plan’ was established to determine the most suitable indicators and
corresponding datasets for the CRVA. The process used an indicative and normative approach,
based on current knowledge about the system, and expert knowledge from WTW, key experts and
the working group.
The process of selecting the indicators for the CRVA was as follows:
Step 1: Literature review
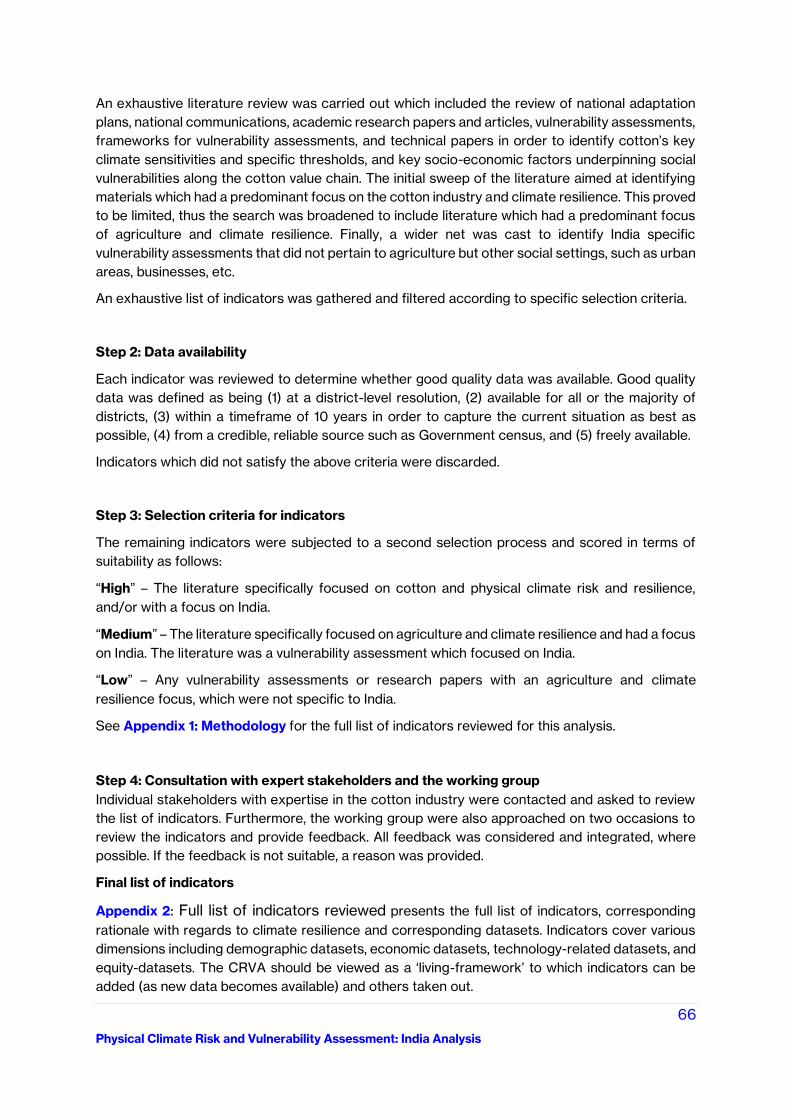
66
Physical Climate Risk and Vulnerability Assessment: India Analysis
An exhaustive literature review was carried out which included the review of national adaptation
plans, national communications, academic research papers and articles, vulnerability assessments,
frameworks for vulnerability assessments, and technical papers in order to identify cotton’s key
climate sensitivities and specific thresholds, and key socio-economic factors underpinning social
vulnerabilities along the cotton value chain. The initial sweep of the literature aimed at identifying
materials which had a predominant focus on the cotton industry and climate resilience. This proved
to be limited, thus the search was broadened to include literature which had a predominant focus
of agriculture and climate resilience. Finally, a wider net was cast to identify India specific
vulnerability assessments that did not pertain to agriculture but other social settings, such as urban
areas, businesses, etc.
An exhaustive list of indicators was gathered and filtered according to specific selection criteria.
Step 2: Data availability
Each indicator was reviewed to determine whether good quality data was available. Good quality
data was defined as being (1) at a district-level resolution, (2) available for all or the majority of
districts, (3) within a timeframe of 10 years in order to capture the current situation as best as
possible, (4) from a credible, reliable source such as Government census, and (5) freely available.
Indicators which did not satisfy the above criteria were discarded.
Step 3: Selection criteria for indicators
The remaining indicators were subjected to a second selection process and scored in terms of
suitability as follows:
“High” – The literature specifically focused on cotton and physical climate risk and resilience,
and/or with a focus on India.
“Medium” – The literature specifically focused on agriculture and climate resilience and had a focus
on India. The literature was a vulnerability assessment which focused on India.
“Low” – Any vulnerability assessments or research papers with an agriculture and climate
resilience focus, which were not specific to India.
See Appendix 1: Methodology for the full list of indicators reviewed for this analysis.
Step 4: Consultation with expert stakeholders and the working group
Individual stakeholders with expertise in the cotton industry were contacted and asked to review
the list of indicators. Furthermore, the working group were also approached on two occasions to
review the indicators and provide feedback. All feedback was considered and integrated, where
possible. If the feedback is not suitable, a reason was provided.
Final list of indicators
Appendix 2: Full list of indicators reviewed presents the full list of indicators, corresponding
rationale with regards to climate resilience and corresponding datasets. Indicators cover various
dimensions including demographic datasets, economic datasets, technology-related datasets, and
equity-datasets. The CRVA should be viewed as a ‘living-framework’ to which indicators can be
added (as new data becomes available) and others taken out.
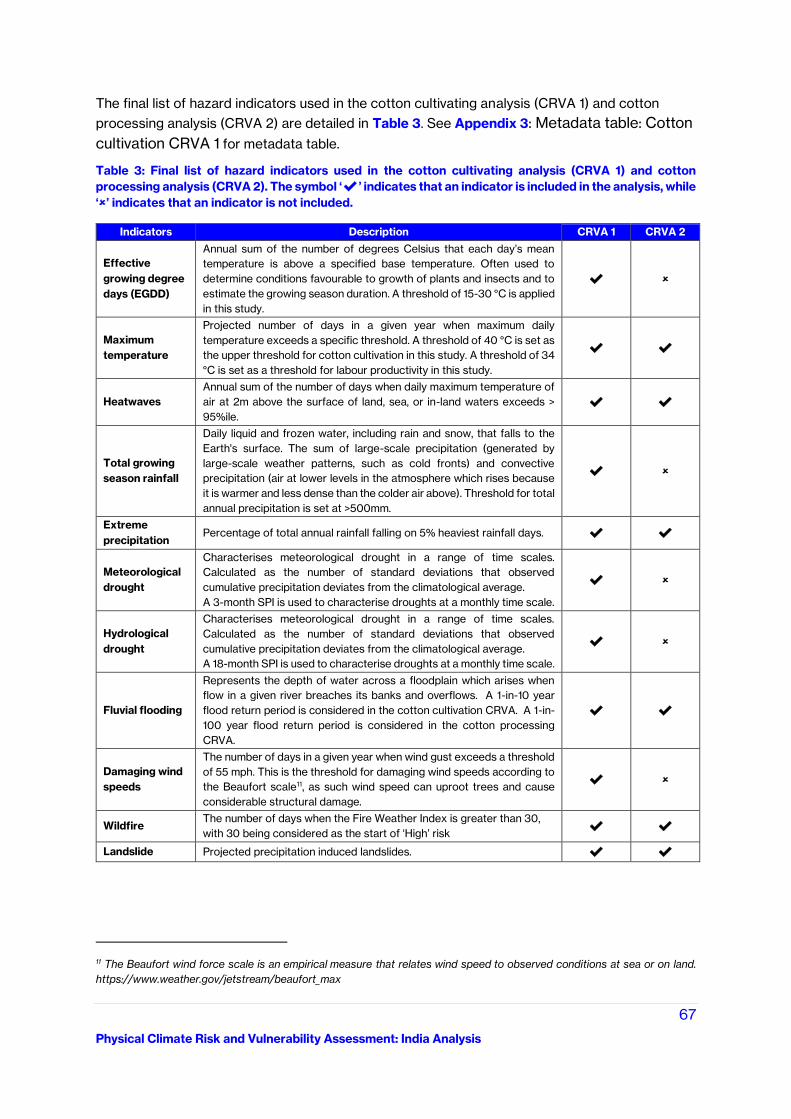
67
Physical Climate Risk and Vulnerability Assessment: India Analysis
The final list of hazard indicators used in the cotton cultivating analysis (CRVA 1) and cotton
processing analysis (CRVA 2) are detailed in Table 3. See Appendix 3: Metadata table: Cotton
cultivation CRVA 1 for metadata table.
Table 3: Final list of hazard indicators used in the cotton cultivating analysis (CRVA 1) and cotton
processing analysis (CRVA 2). The symbol ‘✔’ indicates that an indicator is included in the analysis, while
‘🗶’ indicates that an indicator is not included.
Indicators Description CRVA 1 CRVA 2
Effective
growing degree
days (EGDD)
Annual sum of the number of degrees Celsius that each day’s mean
temperature is above a specified base temperature. Often used to
determine conditions favourable to growth of plants and insects and to
estimate the growing season duration. A threshold of 15-30 °C is applied
in this study.
✔ 🗶
Maximum
temperature
Projected number of days in a given year when maximum daily
temperature exceeds a specific threshold. A threshold of 40 °C is set as
the upper threshold for cotton cultivation in this study. A threshold of 34
°C is set as a threshold for labour productivity in this study.
✔ ✔
Heatwaves
Annual sum of the number of days when daily maximum temperature of
air at 2m above the surface of land, sea, or in-land waters exceeds >
95%ile.
✔ ✔
Total growing
season rainfall
Daily liquid and frozen water, including rain and snow, that falls to the
Earth's surface. The sum of large-scale precipitation (generated by
large-scale weather patterns, such as cold fronts) and convective
precipitation (air at lower levels in the atmosphere which rises because
it is warmer and less dense than the colder air above). Threshold for total
annual precipitation is set at >500mm.
✔ 🗶
Extreme
precipitation Percentage of total annual rainfall falling on 5% heaviest rainfall days. ✔ ✔
Meteorological
drought
Characterises meteorological drought in a range of time scales.
Calculated as the number of standard deviations that observed
cumulative precipitation deviates from the climatological average.
A 3-month SPI is used to characterise droughts at a monthly time scale.
✔ 🗶
Hydrological
drought
Characterises meteorological drought in a range of time scales.
Calculated as the number of standard deviations that observed
cumulative precipitation deviates from the climatological average.
A 18-month SPI is used to characterise droughts at a monthly time scale.
✔ 🗶
Fluvial flooding
Represents the depth of water across a floodplain which arises when
flow in a given river breaches its banks and overflows. A 1-in-10 year
flood return period is considered in the cotton cultivation CRVA. A 1-in-
100 year flood return period is considered in the cotton processing
CRVA.
✔ ✔
Damaging wind
speeds
The number of days in a given year when wind gust exceeds a threshold
of 55 mph. This is the threshold for damaging wind speeds according to
the Beaufort scale11, as such wind speed can uproot trees and cause
considerable structural damage.
✔ 🗶
Wildfire The number of days when the Fire Weather Index is greater than 30,
with 30 being considered as the start of ‘High’ risk ✔ ✔
Landslide Projected precipitation induced landslides. ✔ ✔
11 The Beaufort wind force scale is an empirical measure that relates wind speed to observed conditions at sea or on land.
https://www.weather.gov/jetstream/beaufort_max
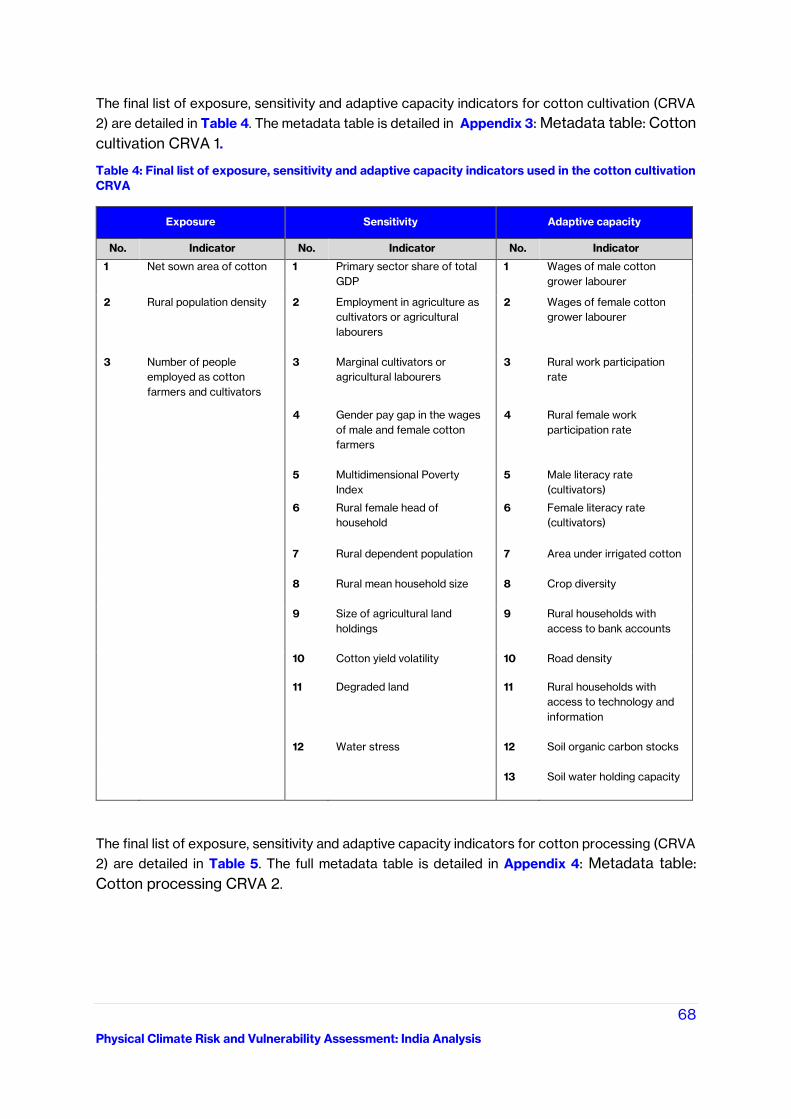
68
Physical Climate Risk and Vulnerability Assessment: India Analysis
The final list of exposure, sensitivity and adaptive capacity indicators for cotton cultivation (CRVA
2) are detailed in Table 4. The metadata table is detailed in Appendix 3: Metadata table: Cotton
cultivation CRVA 1.
Table 4: Final list of exposure, sensitivity and adaptive capacity indicators used in the cotton cultivation
CRVA
Exposure Sensitivity Adaptive capacity
No. Indicator No. Indicator No. Indicator
1 Net sown area of cotton 1 Primary sector share of total
GDP
1 Wages of male cotton
grower labourer
2 Rural population density 2 Employment in agriculture as
cultivators or agricultural
labourers
2 Wages of female cotton
grower labourer
3 Number of people
employed as cotton
farmers and cultivators
3 Marginal cultivators or
agricultural labourers
3 Rural work participation
rate
4 Gender pay gap in the wages
of male and female cotton
farmers
4 Rural female work
participation rate
5 Multidimensional Poverty
Index
5 Male literacy rate
(cultivators)
6 Rural female head of
household
6 Female literacy rate
(cultivators)
7 Rural dependent population
7 Area under irrigated cotton
8 Rural mean household size
8 Crop diversity
9 Size of agricultural land
holdings
9 Rural households with
access to bank accounts
10 Cotton yield volatility 10 Road density
11 Degraded land 11 Rural households with
access to technology and
information
12 Water stress 12 Soil organic carbon stocks
13 Soil water holding capacity
The final list of exposure, sensitivity and adaptive capacity indicators for cotton processing (CRVA
2) are detailed in Table 5. The full metadata table is detailed in Appendix 4: Metadata table:
Cotton processing CRVA 2.
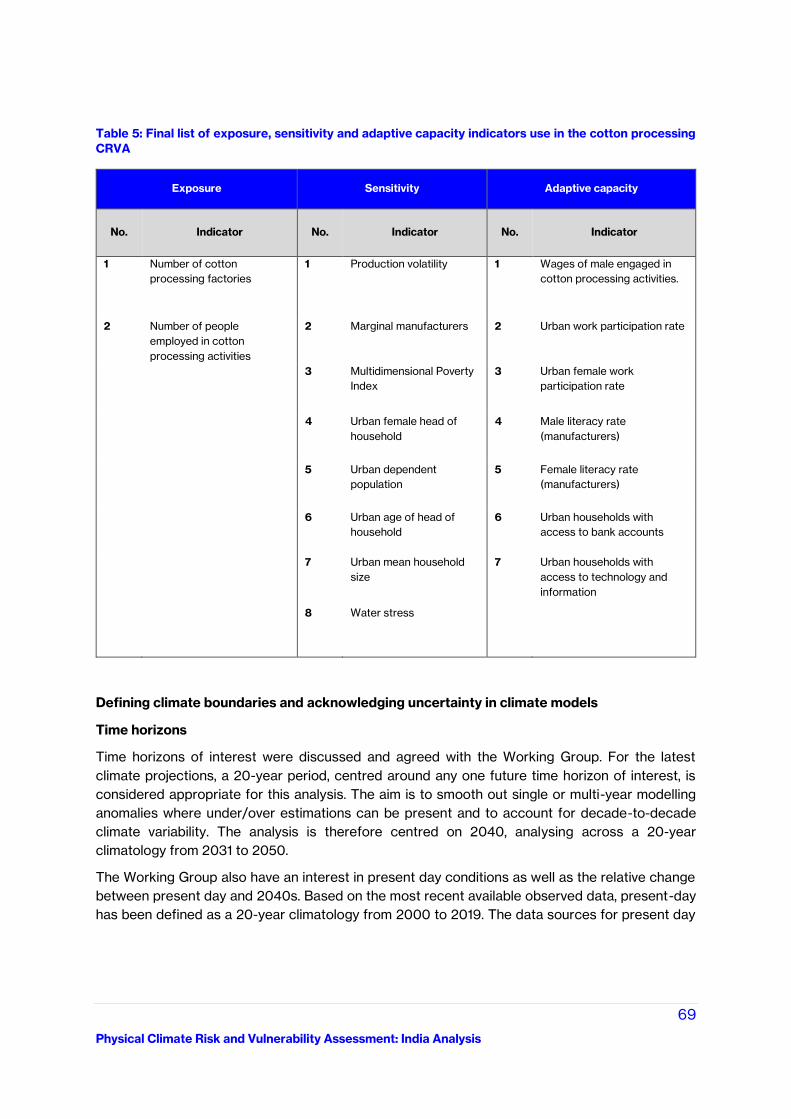
69
Physical Climate Risk and Vulnerability Assessment: India Analysis
Table 5: Final list of exposure, sensitivity and adaptive capacity indicators use in the cotton processing
CRVA
Exposure Sensitivity Adaptive capacity
No. Indicator No. Indicator No. Indicator
1 Number of cotton
processing factories
1 Production volatility 1 Wages of male engaged in
cotton processing activities.
2 Number of people
employed in cotton
processing activities
2 Marginal manufacturers 2 Urban work participation rate
3 Multidimensional Poverty
Index
3 Urban female work
participation rate
4 Urban female head of
household
4 Male literacy rate
(manufacturers)
5 Urban dependent
population
5 Female literacy rate
(manufacturers)
6 Urban age of head of
household
6 Urban households with
access to bank accounts
7 Urban mean household
size
7 Urban households with
access to technology and
information
8 Water stress
Defining climate boundaries and acknowledging uncertainty in climate models
Time horizons
Time horizons of interest were discussed and agreed with the Working Group. For the latest
climate projections, a 20-year period, centred around any one future time horizon of interest, is
considered appropriate for this analysis. The aim is to smooth out single or multi-year modelling
anomalies where under/over estimations can be present and to account for decade-to-decade
climate variability. The analysis is therefore centred on 2040, analysing across a 20-year
climatology from 2031 to 2050.
The Working Group also have an interest in present day conditions as well as the relative change
between present day and 2040s. Based on the most recent available observed data, present-day
has been defined as a 20-year climatology from 2000 to 2019. The data sources for present day
70
Physical Climate Risk and Vulnerability Assessment: India Analysis
are derived from the ERA5 and ERA5-Land reanalysis data sets (both part of the ECMWF
dataset12).
Percentiles
To account for uncertainties in the climate models, two percentiles have been used for each of the
hazard indicators:
1. the mean of the ensemble model distribution (also referred to as the 50th percentile,
or P50), and
2. either the 75th percentile or the 25th percentile (also referred to as the P75 or P25
respectively) in order to capture the extremes of the ensemble model distribution.
Representative Concentration Pathway (RCP) selection
In 2014, the IPCC (Intergovernmental Panel on Climate Change) published its fifth assessment
report (AR5). AR5 provides a comprehensive assessment of literature on the three inter-related
aspects of climate change science: the physical science; impacts, vulnerability and adaptation; and
mitigation. The literature underpinning AR5 is, to a large extent, associated with climate projections
from the 5th phase of the Coupled Model Inter-comparison Project (CMIP5), for the first time using
RCPs. RCPs describe the evolution of future atmospheric greenhouse gas (GHG) concentrations
without any assumptions on mitigation actions, thus RCPs are possible future GHG emissions and
concentration scenarios that give rise to a given radiative forcing.
Four RCPs (RCP8.5, RCP6.0, RCP4.5 and RCP2.6) have been widely used in climate modelling as
well as adaptation and mitigation analyses. Each RCP number represents the projected radiative
forcing at 2100, for example, 2.6Wm2 of radiative forcing by 2100 is represented by RCP2.6.
In addition, all RCPs show a broadly similar warming pathway up to mid to late 2030s, with no
significant difference. As shown in Figure 10, RCPs begin to diverge after the 2030s. Current
warming trends exceed that projected by all RCPs except RCP8.5.
GHG emission reductions are essential to avoid the worst effects of climate change being
experienced over the longer term. However, regardless of future action on reducing emissions,
society and ecosystems are already faced with inevitable changes in climate that will impact over
the coming decades. In terms of the CVC, every stakeholder will be affected, from individual
farmers and cooperatives and their communities, to large corporates and major brands.
Despite the ambitious goal as set out by the Paris Agreement to keep global warming “under 2°C
by 2050”, to date, even the ambitious pledges and targets of countries around the world will only
limit warming to between 2.2-3.4°C.vii As it stands, current policies are being missed by the majority
of countries around the world, meaning that warming of more than 3°C is probable by the end of
this century. This will limit changes in our climate, but some change will inevitably continue to occur.
However successful we are with decarbonisation, we are faced with decades of unavoidable
climate change and changes for our oceans and cryosphere that are expected to be irreversible
on timescales relevant to human societies and ecosystems.viii As such, it is essential we explore
the more profound changes in the climate and the impacts that this will have on the CVC. This
approach will enable us to identify robust adaptation actions that are relevant to all climate futures
12 ECMWF is the European Centre for Medium-Range Weather Forecasts. https://www.ecmwf.int/en/about
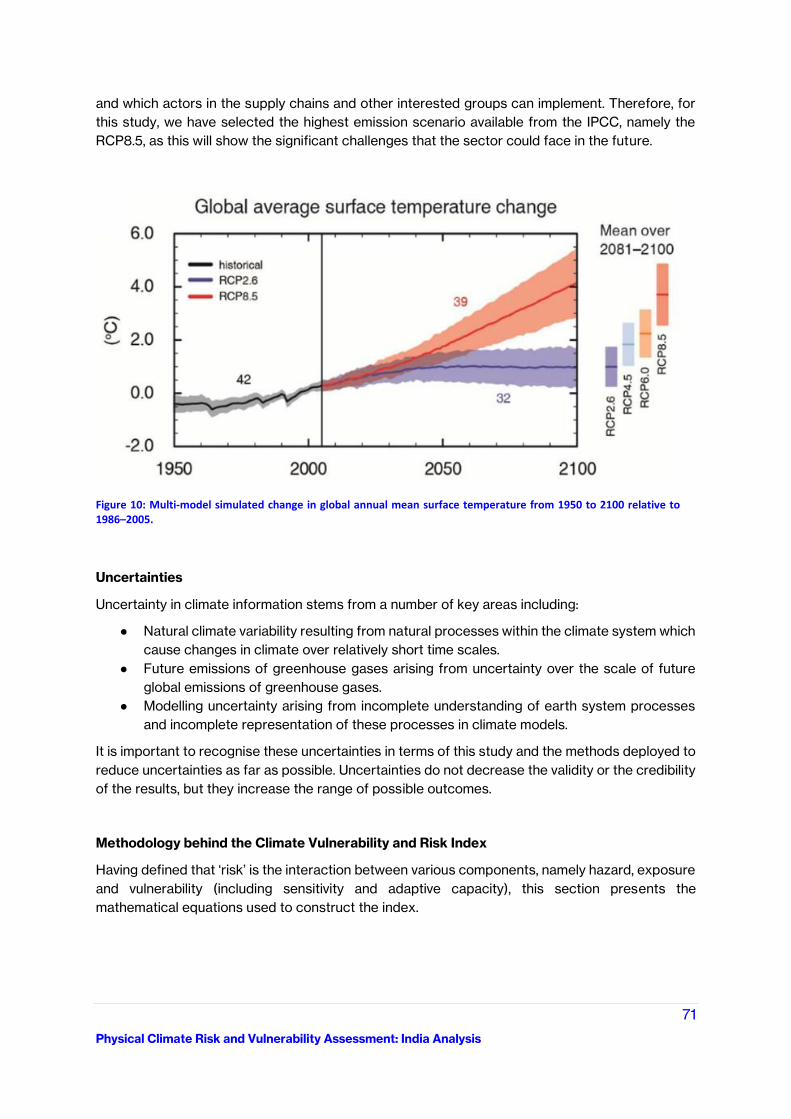
71
Physical Climate Risk and Vulnerability Assessment: India Analysis
and which actors in the supply chains and other interested groups can implement. Therefore, for
this study, we have selected the highest emission scenario available from the IPCC, namely the
RCP8.5, as this will show the significant challenges that the sector could face in the future.
Uncertainties
Uncertainty in climate information stems from a number of key areas including:
● Natural climate variability resulting from natural processes within the climate system which
cause changes in climate over relatively short time scales.
● Future emissions of greenhouse gases arising from uncertainty over the scale of future
global emissions of greenhouse gases.
● Modelling uncertainty arising from incomplete understanding of earth system processes
and incomplete representation of these processes in climate models.
It is important to recognise these uncertainties in terms of this study and the methods deployed to
reduce uncertainties as far as possible. Uncertainties do not decrease the validity or the credibility
of the results, but they increase the range of possible outcomes.
Methodology behind the Climate Vulnerability and Risk Index
Having defined that ‘risk’ is the interaction between various components, namely hazard, exposure
and vulnerability (including sensitivity and adaptive capacity), this section presents the
mathematical equations used to construct the index.
Figure 10: Multi-model simulated change in global annual mean surface temperature from 1950 to 2100 relative to 1986–2005.
72
Physical Climate Risk and Vulnerability Assessment: India Analysis
Raw data and Normalisation
The raw data for each indicator are cleaned and processed for each 13 districts. The raw data are
then normalised to the dimensionless scale from 0 to 1 through conversion that is used, for
instance, by the Human Development Index (HDI) and similar studies on climate change
vulnerability.
The normalisation equation for the indicators which make up the components ‘exposure’, ‘hazard’
and ‘sensitivity’ is described as:
𝑁′ =𝑆 − 𝑀𝑥
𝑀 − 𝑀𝑥
Equation 2
Where N’ is the normalised value for the indicator, S is the raw datum, Mx is the maximum value of
the raw datum and M is minimum value of the raw datum. The normalisation procedure is denoted
by an apostrophe (‘).
The normalisation equation for the indicators which make up the component ‘adaptive capacity’ is
described as:
𝑁′ =𝑆 − 𝑀
𝑀𝑥 − 𝑀
Equation 3
Where N’ is the normalised value for the indicator, S is the raw datum, M is the minimum value of the
raw datum and Mx is maximum value of the raw datum. The normalisation procedure is denoted by
an apostrophe (‘).
Component 1: Vulnerability
Vulnerability is composed of two elements; ‘sensitivity’ and ‘adaptive capacity’.
Once each indicator has been normalised, the indicators are summed up. The two components of
vulnerability are calculated separately as follows:
𝑌 =(𝑁′
1 + ⋯ + 𝑁′𝑛)
𝑛
Equation 4
Where Y is either the sum of the sensitivity or adaptive capacity indicators, 𝑁 is either normalised
sensitivity or normalised adaptive capacity indicators (from Equation 2 or Equation 3), and 𝑛
donates the total number of indicators for the specific component. The (‘) denotes that the
components have been normalised.
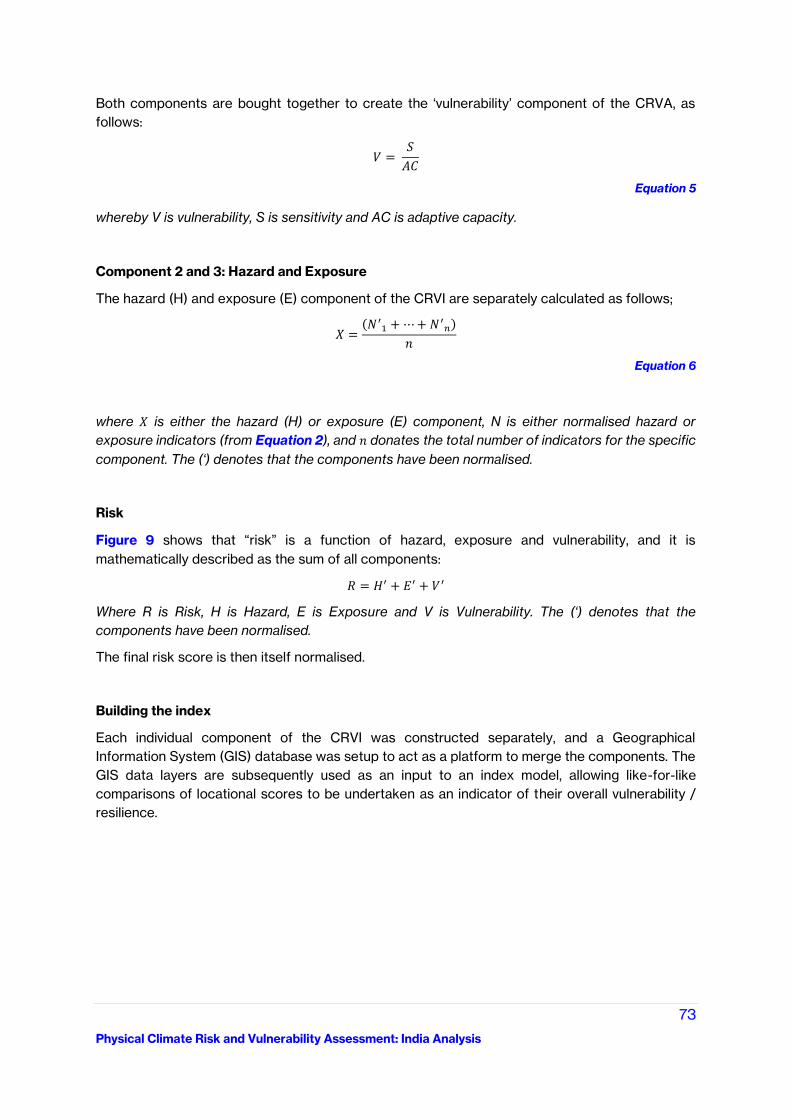
73
Physical Climate Risk and Vulnerability Assessment: India Analysis
Both components are bought together to create the ‘vulnerability’ component of the CRVA, as
follows:
𝑉 = 𝑆
𝐴𝐶
Equation 5
whereby V is vulnerability, S is sensitivity and AC is adaptive capacity.
Component 2 and 3: Hazard and Exposure
The hazard (H) and exposure (E) component of the CRVI are separately calculated as follows;
𝑋 =(𝑁′
1 + ⋯ + 𝑁′𝑛)
𝑛
Equation 6
where 𝑋 is either the hazard (H) or exposure (E) component, N is either normalised hazard or
exposure indicators (from Equation 2), and 𝑛 donates the total number of indicators for the specific
component. The (‘) denotes that the components have been normalised.
Risk
Figure 9 shows that “risk” is a function of hazard, exposure and vulnerability, and it is
mathematically described as the sum of all components:
𝑅 = 𝐻′ + 𝐸′ + 𝑉′
Where R is Risk, H is Hazard, E is Exposure and V is Vulnerability. The (‘) denotes that the
components have been normalised.
The final risk score is then itself normalised.
Building the index
Each individual component of the CRVI was constructed separately, and a Geographical
Information System (GIS) database was setup to act as a platform to merge the components. The
GIS data layers are subsequently used as an input to an index model, allowing like-for-like
comparisons of locational scores to be undertaken as an indicator of their overall vulnerability /
resilience.
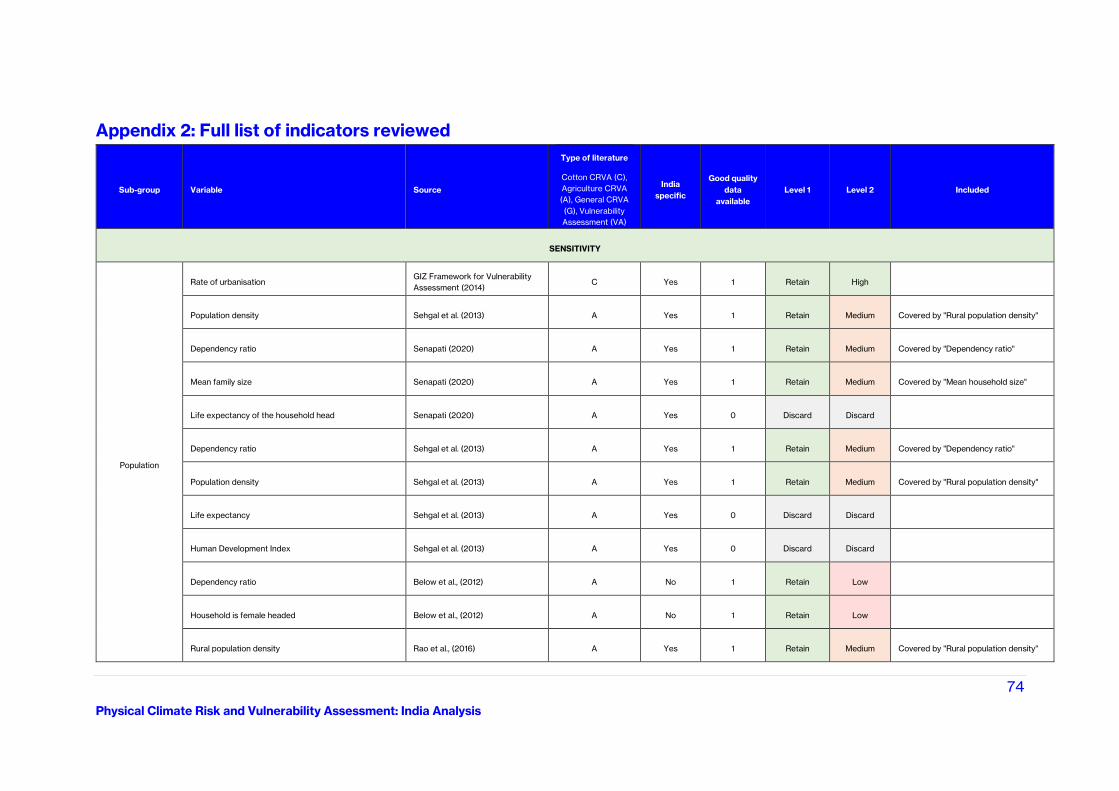
74
Physical Climate Risk and Vulnerability Assessment: India Analysis
Appendix 2: Full list of indicators reviewed
Sub-group Variable Source
Type of literature
Cotton CRVA (C),
Agriculture CRVA
(A), General CRVA
(G), Vulnerability
Assessment (VA)
India
specific
Good quality
data
available
Level 1 Level 2 Included
SENSITIVITY
Population
Rate of urbanisation GIZ Framework for Vulnerability
Assessment (2014) C Yes 1 Retain High
Population density Sehgal et al. (2013) A Yes 1 Retain Medium Covered by "Rural population density"
Dependency ratio Senapati (2020) A Yes 1 Retain Medium Covered by "Dependency ratio"
Mean family size Senapati (2020) A Yes 1 Retain Medium Covered by "Mean household size"
Life expectancy of the household head Senapati (2020) A Yes 0 Discard Discard
Dependency ratio Sehgal et al. (2013) A Yes 1 Retain Medium Covered by "Dependency ratio"
Population density Sehgal et al. (2013) A Yes 1 Retain Medium Covered by "Rural population density"
Life expectancy Sehgal et al. (2013) A Yes 0 Discard Discard
Human Development Index Sehgal et al. (2013) A Yes 0 Discard Discard
Dependency ratio Below et al., (2012) A No 1 Retain Low
Household is female headed Below et al., (2012) A No 1 Retain Low
Rural population density Rao et al., (2016) A Yes 1 Retain Medium Covered by "Rural population density"
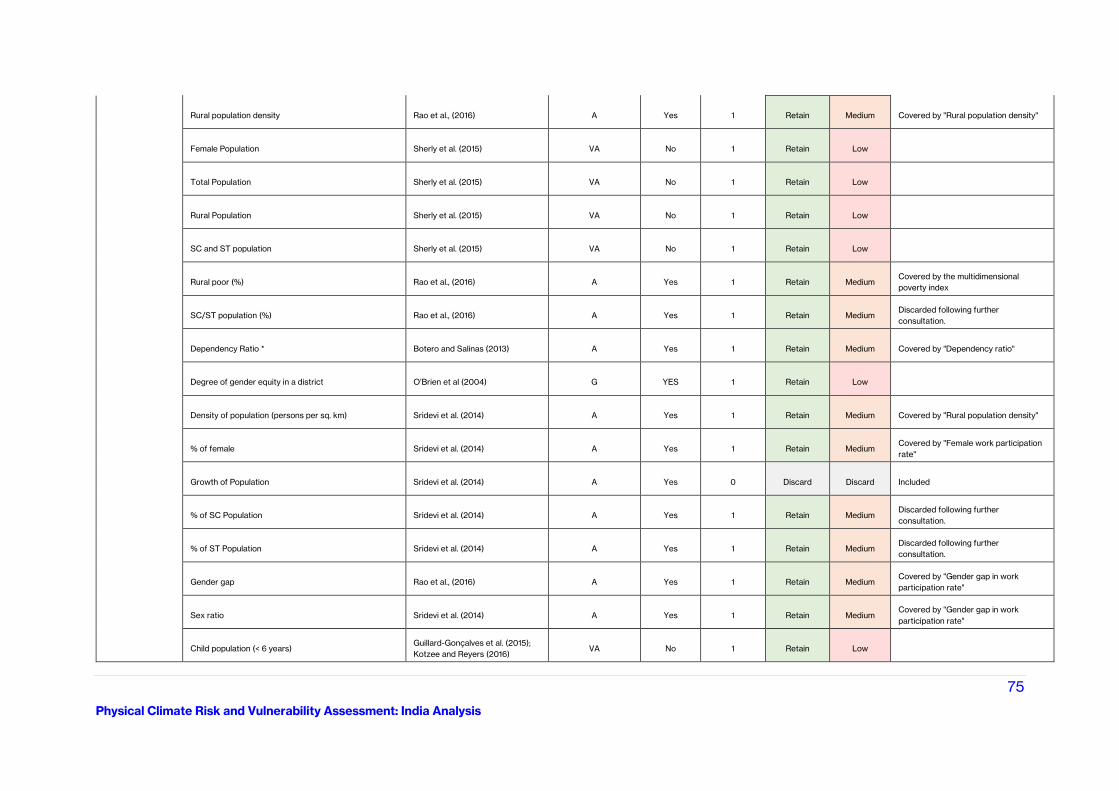
75
Physical Climate Risk and Vulnerability Assessment: India Analysis
Rural population density Rao et al., (2016) A Yes 1 Retain Medium Covered by "Rural population density"
Female Population Sherly et al. (2015) VA No 1 Retain Low
Total Population Sherly et al. (2015) VA No 1 Retain Low
Rural Population Sherly et al. (2015) VA No 1 Retain Low
SC and ST population Sherly et al. (2015) VA No 1 Retain Low
Rural poor (%) Rao et al., (2016) A Yes 1 Retain Medium Covered by the multidimensional
poverty index
SC/ST population (%) Rao et al., (2016) A Yes 1 Retain Medium Discarded following further
consultation.
Dependency Ratio * Botero and Salinas (2013) A Yes 1 Retain Medium Covered by "Dependency ratio"
Degree of gender equity in a district O’Brien et al (2004) G YES 1 Retain Low
Density of population (persons per sq. km) Sridevi et al. (2014) A Yes 1 Retain Medium Covered by "Rural population density"
% of female Sridevi et al. (2014) A Yes 1 Retain Medium Covered by "Female work participation
rate"
Growth of Population Sridevi et al. (2014) A Yes 0 Discard Discard Included
% of SC Population Sridevi et al. (2014) A Yes 1 Retain Medium Discarded following further
consultation.
% of ST Population Sridevi et al. (2014) A Yes 1 Retain Medium Discarded following further
consultation.
Gender gap Rao et al., (2016) A Yes 1 Retain Medium Covered by "Gender gap in work
participation rate"
Sex ratio Sridevi et al. (2014) A Yes 1 Retain Medium Covered by "Gender gap in work
participation rate"
Child population (< 6 years) Guillard-Gonçalves et al. (2015);
Kotzee and Reyers (2016) VA No 1 Retain Low
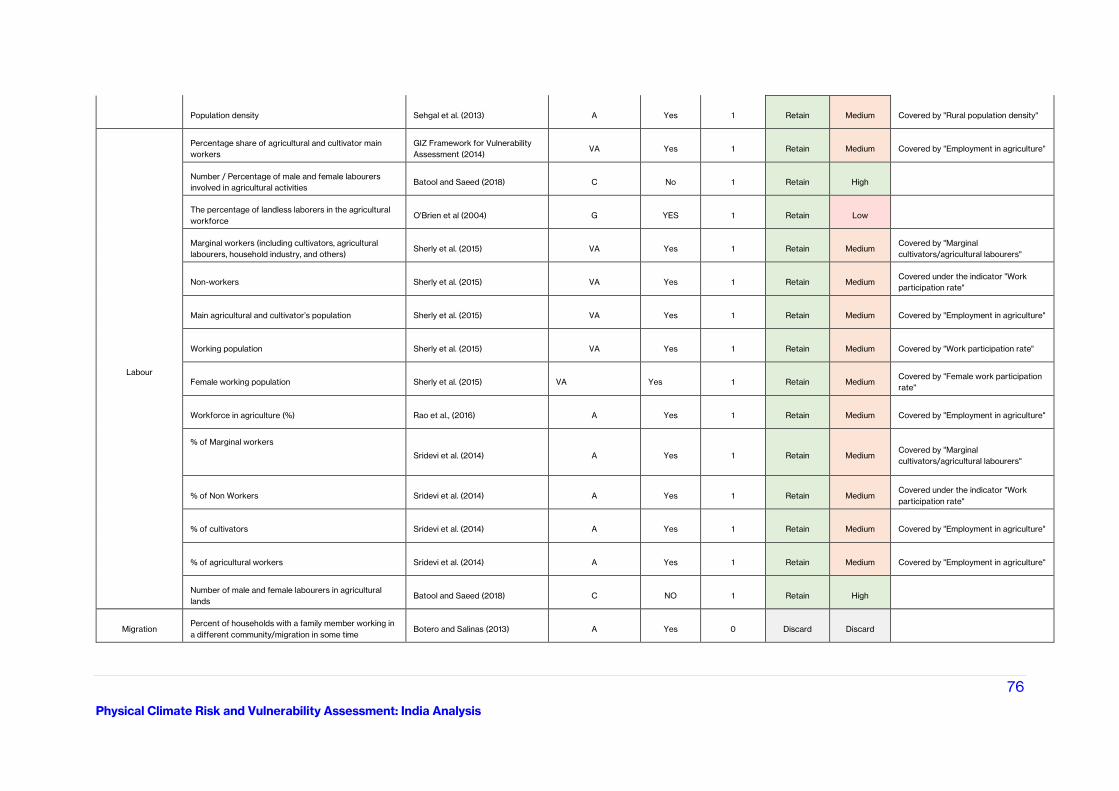
76
Physical Climate Risk and Vulnerability Assessment: India Analysis
Population density Sehgal et al. (2013) A Yes 1 Retain Medium Covered by "Rural population density"
Labour
Percentage share of agricultural and cultivator main
workers
GIZ Framework for Vulnerability
Assessment (2014) VA Yes 1 Retain Medium Covered by "Employment in agriculture"
Number / Percentage of male and female labourers
involved in agricultural activities Batool and Saeed (2018) C No 1 Retain High
The percentage of landless laborers in the agricultural
workforce O'Brien et al (2004) G YES 1 Retain Low
Marginal workers (including cultivators, agricultural
labourers, household industry, and others) Sherly et al. (2015) VA Yes 1 Retain Medium
Covered by "Marginal
cultivators/agricultural labourers"
Non-workers Sherly et al. (2015) VA Yes 1 Retain Medium Covered under the indicator "Work
participation rate"
Main agricultural and cultivator’s population Sherly et al. (2015) VA Yes 1 Retain Medium Covered by "Employment in agriculture"
Working population Sherly et al. (2015) VA Yes 1 Retain Medium Covered by "Work participation rate"
Female working population Sherly et al. (2015) VA Yes 1 Retain Medium Covered by "Female work participation
rate"
Workforce in agriculture (%) Rao et al., (2016) A Yes 1 Retain Medium Covered by "Employment in agriculture"
% of Marginal workers
Sridevi et al. (2014) A Yes 1 Retain Medium Covered by "Marginal
cultivators/agricultural labourers"
% of Non Workers Sridevi et al. (2014) A Yes 1 Retain Medium Covered under the indicator "Work
participation rate"
% of cultivators Sridevi et al. (2014) A Yes 1 Retain Medium Covered by "Employment in agriculture"
% of agricultural workers Sridevi et al. (2014) A Yes 1 Retain Medium Covered by "Employment in agriculture"
Number of male and female labourers in agricultural
lands Batool and Saeed (2018) C NO 1 Retain High
Migration Percent of households with a family member working in
a different community/migration in some time Botero and Salinas (2013) A Yes 0 Discard Discard
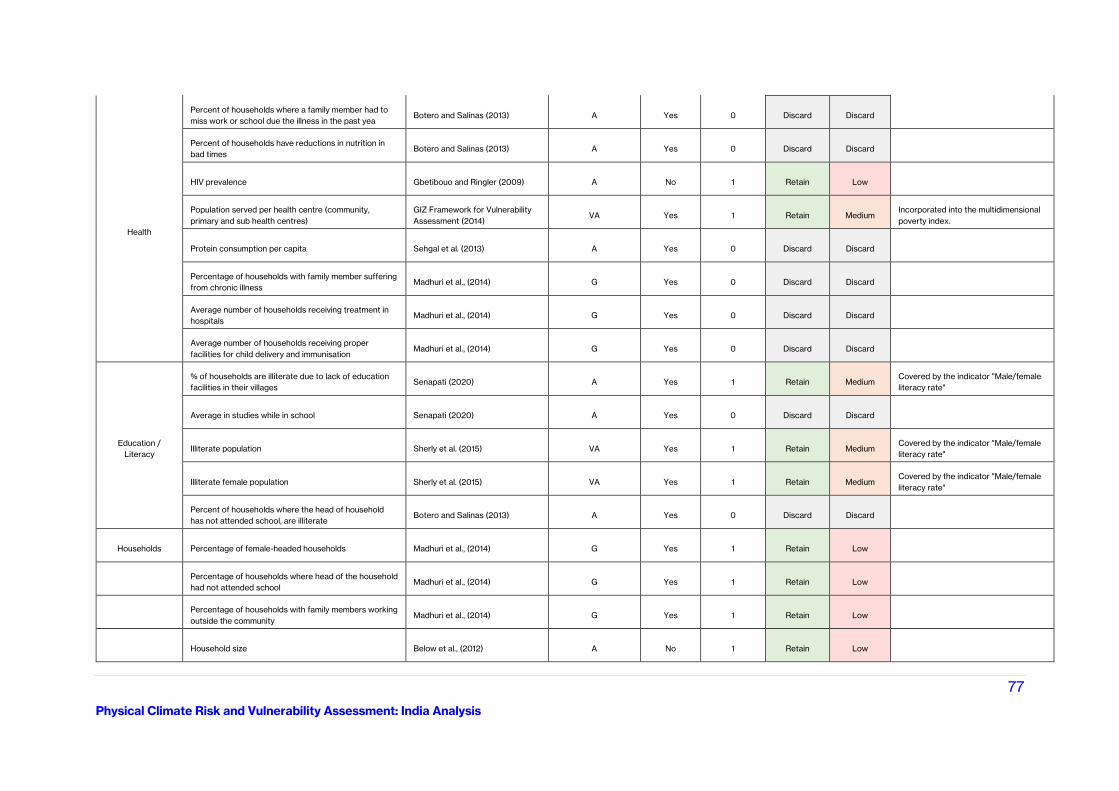
77
Physical Climate Risk and Vulnerability Assessment: India Analysis
Health
Percent of households where a family member had to
miss work or school due the illness in the past yea Botero and Salinas (2013) A Yes 0 Discard Discard
Percent of households have reductions in nutrition in
bad times Botero and Salinas (2013) A Yes 0 Discard Discard
HIV prevalence Gbetibouo and Ringler (2009) A No 1 Retain Low
Population served per health centre (community,
primary and sub health centres)
GIZ Framework for Vulnerability
Assessment (2014) VA Yes 1 Retain Medium
Incorporated into the multidimensional
poverty index.
Protein consumption per capita Sehgal et al. (2013) A Yes 0 Discard Discard
Percentage of households with family member suffering
from chronic illness Madhuri et al., (2014) G Yes 0 Discard Discard
Average number of households receiving treatment in
hospitals Madhuri et al., (2014) G Yes 0 Discard Discard
Average number of households receiving proper
facilities for child delivery and immunisation Madhuri et al., (2014) G Yes 0 Discard Discard
Education /
Literacy
% of households are illiterate due to lack of education
facilities in their villages Senapati (2020) A Yes 1 Retain Medium
Covered by the indicator "Male/female
literacy rate"
Average in studies while in school Senapati (2020) A Yes 0 Discard Discard
Illiterate population Sherly et al. (2015) VA Yes 1 Retain Medium Covered by the indicator "Male/female
literacy rate"
Illiterate female population Sherly et al. (2015) VA Yes 1 Retain Medium Covered by the indicator "Male/female
literacy rate"
Percent of households where the head of household
has not attended school, are illiterate Botero and Salinas (2013) A Yes 0 Discard Discard
Households Percentage of female-headed households Madhuri et al., (2014) G Yes 1 Retain Low
Percentage of households where head of the household
had not attended school Madhuri et al., (2014) G Yes 1 Retain Low
Percentage of households with family members working
outside the community Madhuri et al., (2014) G Yes 1 Retain Low
Household size Below et al., (2012) A No 1 Retain Low
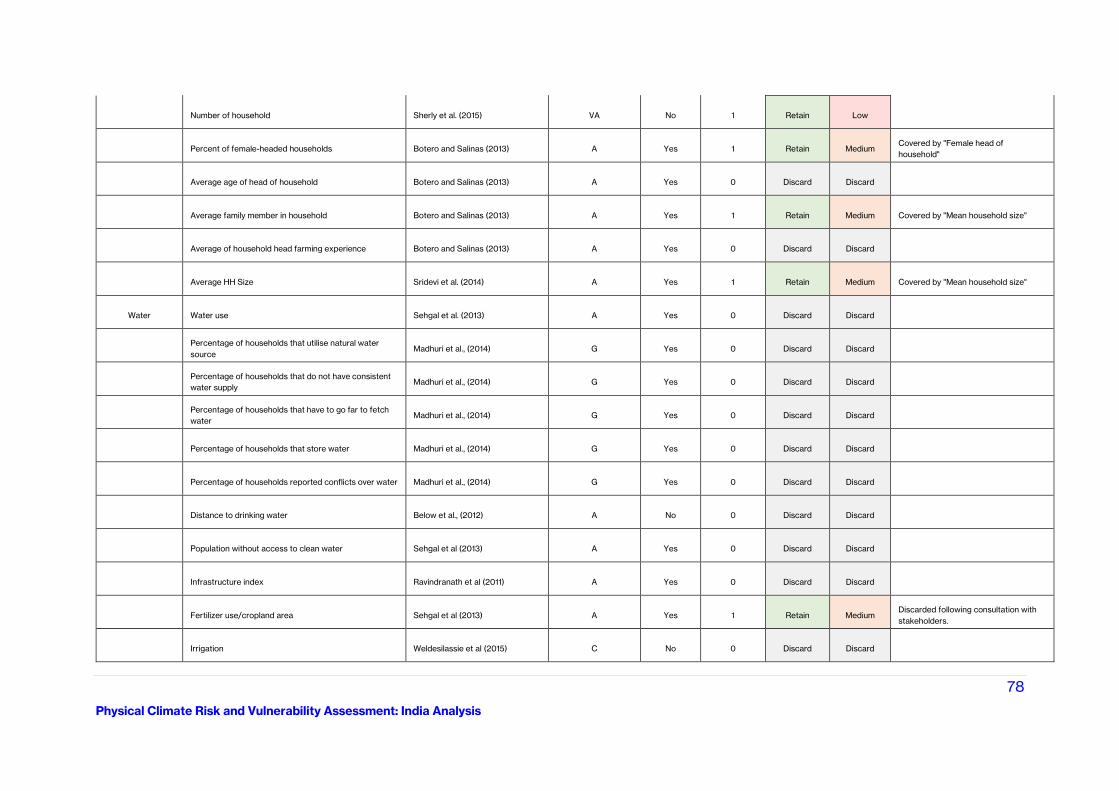
78
Physical Climate Risk and Vulnerability Assessment: India Analysis
Number of household Sherly et al. (2015) VA No 1 Retain Low
Percent of female-headed households Botero and Salinas (2013) A Yes 1 Retain Medium Covered by "Female head of
household"
Average age of head of household Botero and Salinas (2013) A Yes 0 Discard Discard
Average family member in household Botero and Salinas (2013) A Yes 1 Retain Medium Covered by "Mean household size"
Average of household head farming experience Botero and Salinas (2013) A Yes 0 Discard Discard
Average HH Size Sridevi et al. (2014) A Yes 1 Retain Medium Covered by "Mean household size"
Water Water use Sehgal et al. (2013) A Yes 0 Discard Discard
Percentage of households that utilise natural water
source Madhuri et al., (2014) G Yes 0 Discard Discard
Percentage of households that do not have consistent
water supply Madhuri et al., (2014) G Yes 0 Discard Discard
Percentage of households that have to go far to fetch
water Madhuri et al., (2014) G Yes 0 Discard Discard
Percentage of households that store water Madhuri et al., (2014) G Yes 0 Discard Discard
Percentage of households reported conflicts over water Madhuri et al., (2014) G Yes 0 Discard Discard
Distance to drinking water Below et al., (2012) A No 0 Discard Discard
Population without access to clean water Sehgal et al (2013) A Yes 0 Discard Discard
Infrastructure index Ravindranath et al (2011) A Yes 0 Discard Discard
Fertilizer use/cropland area Sehgal et al (2013) A Yes 1 Retain Medium Discarded following consultation with
stakeholders.
Irrigation Weldesilassie et al (2015) C No 0 Discard Discard
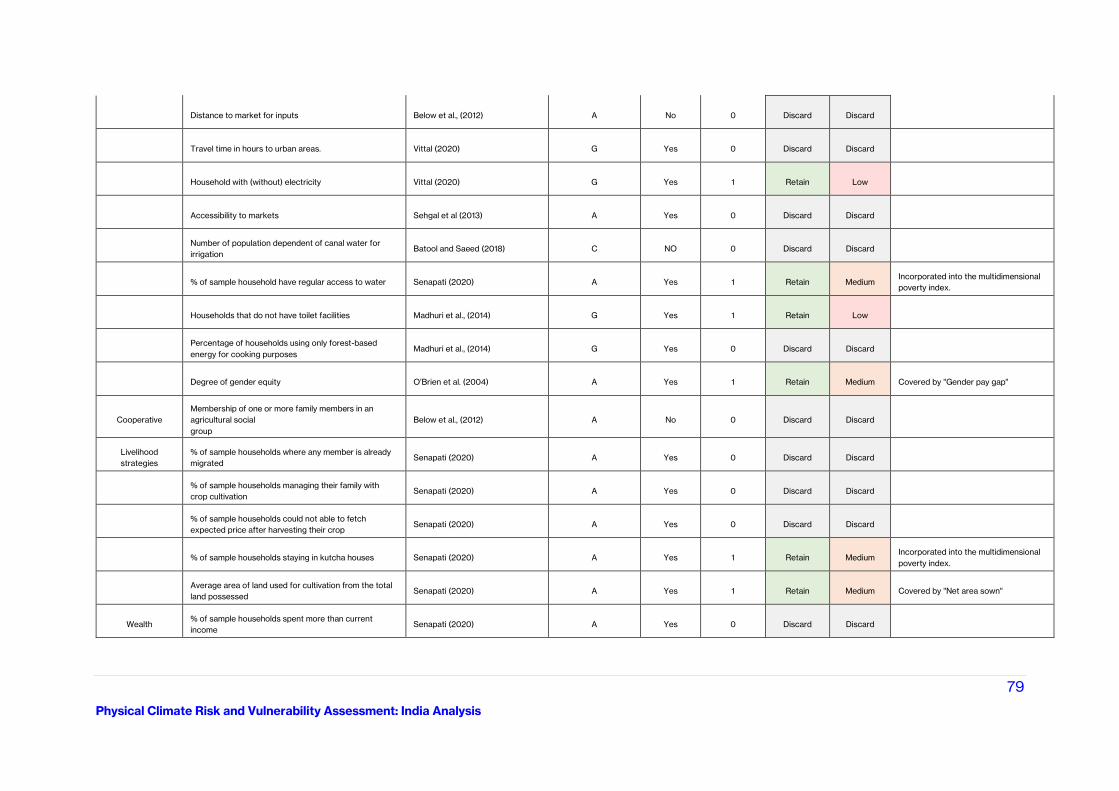
79
Physical Climate Risk and Vulnerability Assessment: India Analysis
Distance to market for inputs Below et al., (2012) A No 0 Discard Discard
Travel time in hours to urban areas. Vittal (2020) G Yes 0 Discard Discard
Household with (without) electricity Vittal (2020) G Yes 1 Retain Low
Accessibility to markets Sehgal et al (2013) A Yes 0 Discard Discard
Number of population dependent of canal water for
irrigation Batool and Saeed (2018) C NO 0 Discard Discard
% of sample household have regular access to water Senapati (2020) A Yes 1 Retain Medium Incorporated into the multidimensional
poverty index.
Households that do not have toilet facilities Madhuri et al., (2014) G Yes 1 Retain Low
Percentage of households using only forest-based
energy for cooking purposes Madhuri et al., (2014) G Yes 0 Discard Discard
Degree of gender equity O’Brien et al. (2004) A Yes 1 Retain Medium Covered by "Gender pay gap"
Cooperative
Membership of one or more family members in an
agricultural social
group
Below et al., (2012) A No 0 Discard Discard
Livelihood
strategies
% of sample households where any member is already
migrated Senapati (2020) A Yes 0 Discard Discard
% of sample households managing their family with
crop cultivation Senapati (2020) A Yes 0 Discard Discard
% of sample households could not able to fetch
expected price after harvesting their crop Senapati (2020) A Yes 0 Discard Discard
% of sample households staying in kutcha houses Senapati (2020) A Yes 1 Retain Medium Incorporated into the multidimensional
poverty index.
Average area of land used for cultivation from the total
land possessed Senapati (2020) A Yes 1 Retain Medium Covered by "Net area sown"
Wealth % of sample households spent more than current
income Senapati (2020) A Yes 0 Discard Discard
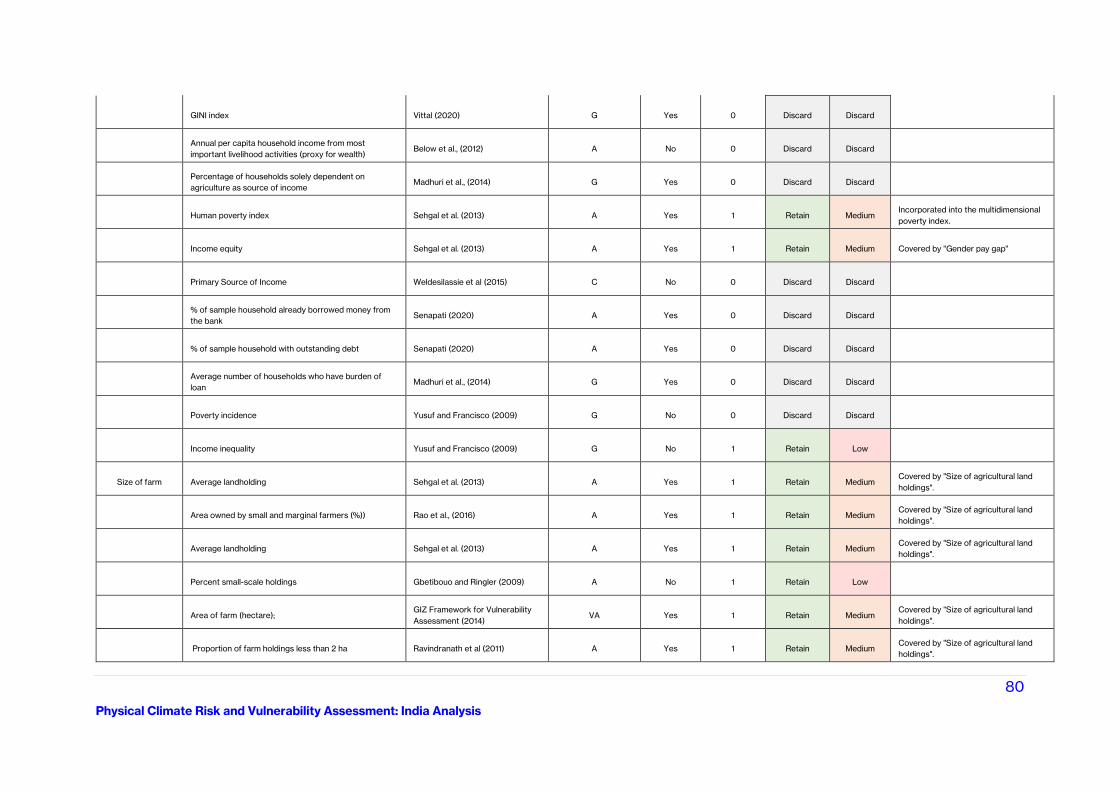
80
Physical Climate Risk and Vulnerability Assessment: India Analysis
GINI index Vittal (2020) G Yes 0 Discard Discard
Annual per capita household income from most
important livelihood activities (proxy for wealth) Below et al., (2012) A No 0 Discard Discard
Percentage of households solely dependent on
agriculture as source of income Madhuri et al., (2014) G Yes 0 Discard Discard
Human poverty index Sehgal et al. (2013) A Yes 1 Retain Medium Incorporated into the multidimensional
poverty index.
Income equity Sehgal et al. (2013) A Yes 1 Retain Medium Covered by "Gender pay gap"
Primary Source of Income Weldesilassie et al (2015) C No 0 Discard Discard
% of sample household already borrowed money from
the bank Senapati (2020) A Yes 0 Discard Discard
% of sample household with outstanding debt Senapati (2020) A Yes 0 Discard Discard
Average number of households who have burden of
loan Madhuri et al., (2014) G Yes 0 Discard Discard
Poverty incidence Yusuf and Francisco (2009) G No 0 Discard Discard
Income inequality Yusuf and Francisco (2009) G No 1 Retain Low
Size of farm Average landholding Sehgal et al. (2013) A Yes 1 Retain Medium Covered by "Size of agricultural land
holdings".
Area owned by small and marginal farmers (%)) Rao et al., (2016) A Yes 1 Retain Medium Covered by "Size of agricultural land
holdings".
Average landholding Sehgal et al. (2013) A Yes 1 Retain Medium Covered by "Size of agricultural land
holdings".
Percent small-scale holdings Gbetibouo and Ringler (2009) A No 1 Retain Low
Area of farm (hectare); GIZ Framework for Vulnerability
Assessment (2014) VA Yes 1 Retain Medium
Covered by "Size of agricultural land
holdings".
Proportion of farm holdings less than 2 ha Ravindranath et al (2011) A Yes 1 Retain Medium Covered by "Size of agricultural land
holdings".
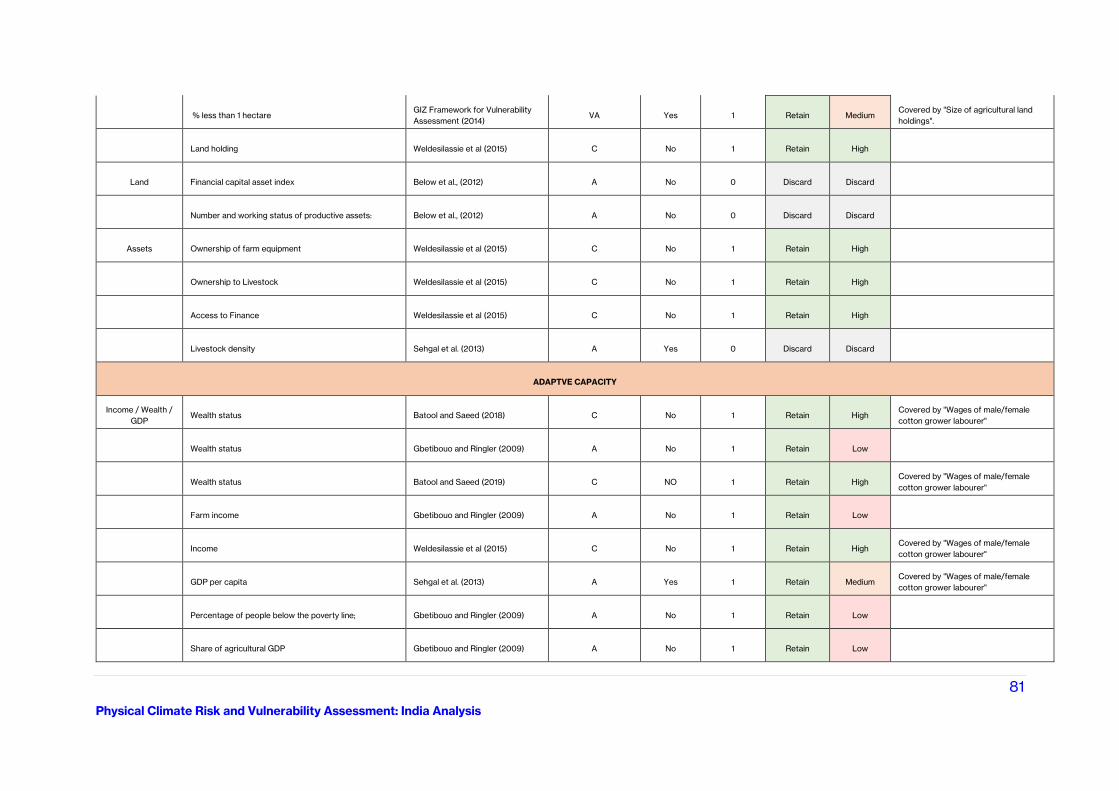
81
Physical Climate Risk and Vulnerability Assessment: India Analysis
% less than 1 hectare GIZ Framework for Vulnerability
Assessment (2014) VA Yes 1 Retain Medium
Covered by "Size of agricultural land
holdings".
Land holding Weldesilassie et al (2015) C No 1 Retain High
Land Financial capital asset index Below et al., (2012) A No 0 Discard Discard
Number and working status of productive assets: Below et al., (2012) A No 0 Discard Discard
Assets Ownership of farm equipment Weldesilassie et al (2015) C No 1 Retain High
Ownership to Livestock Weldesilassie et al (2015) C No 1 Retain High
Access to Finance Weldesilassie et al (2015) C No 1 Retain High
Livestock density Sehgal et al. (2013) A Yes 0 Discard Discard
ADAPTVE CAPACITY
Income / Wealth /
GDP Wealth status Batool and Saeed (2018) C No 1 Retain High
Covered by "Wages of male/female
cotton grower labourer"
Wealth status Gbetibouo and Ringler (2009) A No 1 Retain Low
Wealth status Batool and Saeed (2019) C NO 1 Retain High Covered by "Wages of male/female
cotton grower labourer"
Farm income Gbetibouo and Ringler (2009) A No 1 Retain Low
Income Weldesilassie et al (2015) C No 1 Retain High Covered by "Wages of male/female
cotton grower labourer"
GDP per capita Sehgal et al. (2013) A Yes 1 Retain Medium Covered by "Wages of male/female
cotton grower labourer"
Percentage of people below the poverty line; Gbetibouo and Ringler (2009) A No 1 Retain Low
Share of agricultural GDP Gbetibouo and Ringler (2009) A No 1 Retain Low
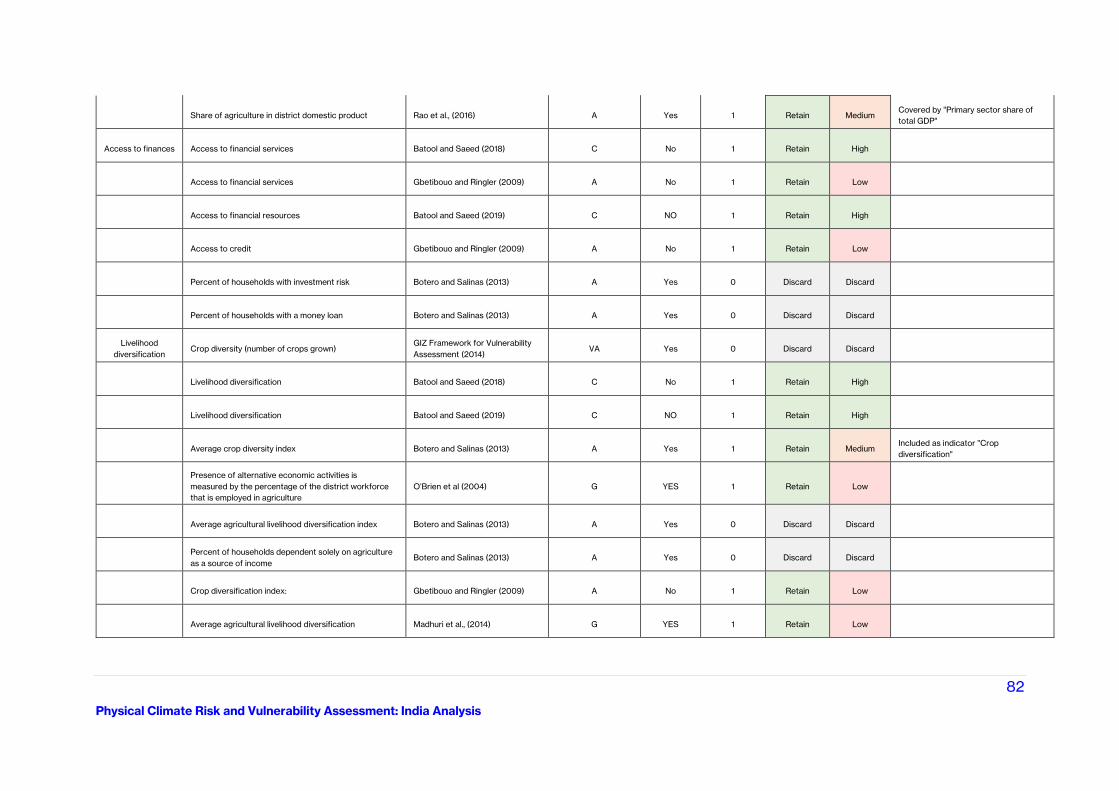
82
Physical Climate Risk and Vulnerability Assessment: India Analysis
Share of agriculture in district domestic product Rao et al., (2016) A Yes 1 Retain Medium Covered by "Primary sector share of
total GDP"
Access to finances Access to financial services Batool and Saeed (2018) C No 1 Retain High
Access to financial services Gbetibouo and Ringler (2009) A No 1 Retain Low
Access to financial resources Batool and Saeed (2019) C NO 1 Retain High
Access to credit Gbetibouo and Ringler (2009) A No 1 Retain Low
Percent of households with investment risk Botero and Salinas (2013) A Yes 0 Discard Discard
Percent of households with a money loan Botero and Salinas (2013) A Yes 0 Discard Discard
Livelihood
diversification Crop diversity (number of crops grown)
GIZ Framework for Vulnerability
Assessment (2014) VA Yes 0 Discard Discard
Livelihood diversification Batool and Saeed (2018) C No 1 Retain High
Livelihood diversification Batool and Saeed (2019) C NO 1 Retain High
Average crop diversity index Botero and Salinas (2013) A Yes 1 Retain Medium Included as indicator "Crop
diversification"
Presence of alternative economic activities is
measured by the percentage of the district workforce
that is employed in agriculture
O’Brien et al (2004) G YES 1 Retain Low
Average agricultural livelihood diversification index Botero and Salinas (2013) A Yes 0 Discard Discard
Percent of households dependent solely on agriculture
as a source of income Botero and Salinas (2013) A Yes 0 Discard Discard
Crop diversification index: Gbetibouo and Ringler (2009) A No 1 Retain Low
Average agricultural livelihood diversification Madhuri et al., (2014) G YES 1 Retain Low
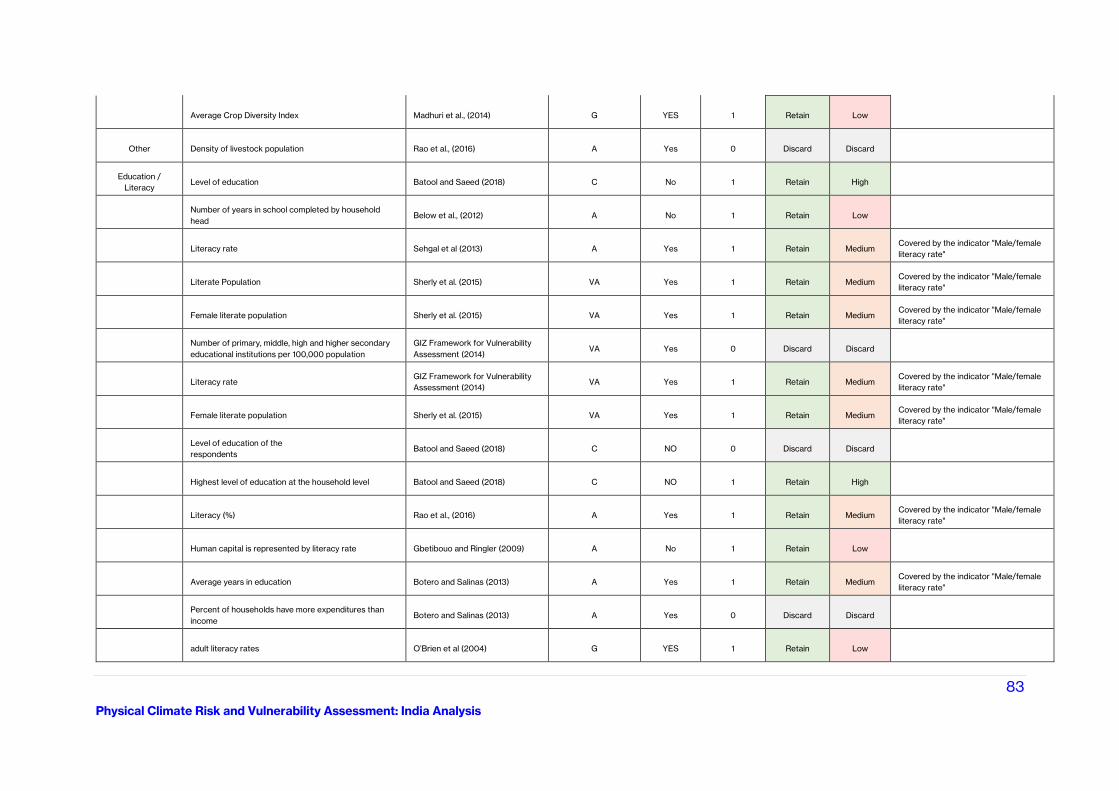
83
Physical Climate Risk and Vulnerability Assessment: India Analysis
Average Crop Diversity Index Madhuri et al., (2014) G YES 1 Retain Low
Other Density of livestock population Rao et al., (2016) A Yes 0 Discard Discard
Education /
Literacy Level of education Batool and Saeed (2018) C No 1 Retain High
Number of years in school completed by household
head Below et al., (2012) A No 1 Retain Low
Literacy rate Sehgal et al (2013) A Yes 1 Retain Medium Covered by the indicator "Male/female
literacy rate"
Literate Population Sherly et al. (2015) VA Yes 1 Retain Medium Covered by the indicator "Male/female
literacy rate"
Female literate population Sherly et al. (2015) VA Yes 1 Retain Medium Covered by the indicator "Male/female
literacy rate"
Number of primary, middle, high and higher secondary
educational institutions per 100,000 population
GIZ Framework for Vulnerability
Assessment (2014) VA Yes 0 Discard Discard
Literacy rate GIZ Framework for Vulnerability
Assessment (2014) VA Yes 1 Retain Medium
Covered by the indicator "Male/female
literacy rate"
Female literate population Sherly et al. (2015) VA Yes 1 Retain Medium Covered by the indicator "Male/female
literacy rate"
Level of education of the
respondents Batool and Saeed (2018) C NO 0 Discard Discard
Highest level of education at the household level Batool and Saeed (2018) C NO 1 Retain High
Literacy (%) Rao et al., (2016) A Yes 1 Retain Medium Covered by the indicator "Male/female
literacy rate"
Human capital is represented by literacy rate Gbetibouo and Ringler (2009) A No 1 Retain Low
Average years in education Botero and Salinas (2013) A Yes 1 Retain Medium Covered by the indicator "Male/female
literacy rate"
Percent of households have more expenditures than
income Botero and Salinas (2013) A Yes 0 Discard Discard
adult literacy rates O’Brien et al (2004) G YES 1 Retain Low
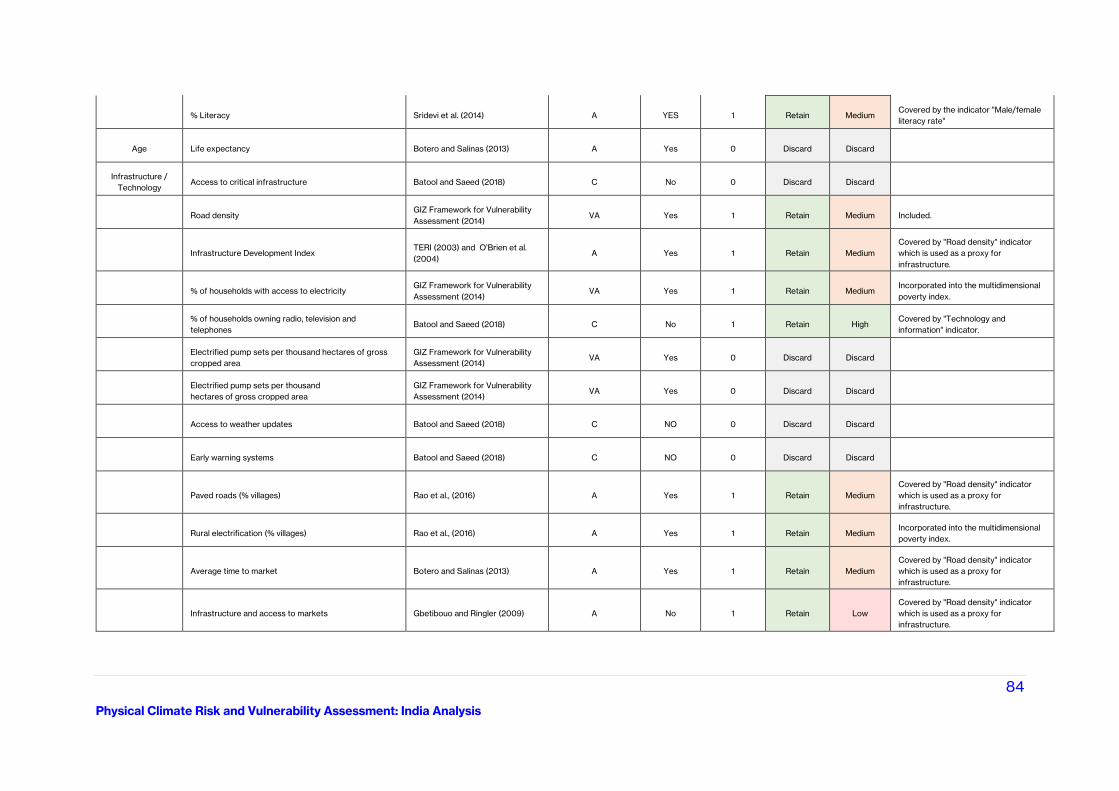
84
Physical Climate Risk and Vulnerability Assessment: India Analysis
% Literacy Sridevi et al. (2014) A YES 1 Retain Medium Covered by the indicator "Male/female
literacy rate"
Age Life expectancy Botero and Salinas (2013) A Yes 0 Discard Discard
Infrastructure /
Technology Access to critical infrastructure Batool and Saeed (2018) C No 0 Discard Discard
Road density GIZ Framework for Vulnerability
Assessment (2014) VA Yes 1 Retain Medium Included.
Infrastructure Development Index TERI (2003) and O’Brien et al.
(2004) A Yes 1 Retain Medium
Covered by "Road density" indicator
which is used as a proxy for
infrastructure.
% of households with access to electricity GIZ Framework for Vulnerability
Assessment (2014) VA Yes 1 Retain Medium
Incorporated into the multidimensional
poverty index.
% of households owning radio, television and
telephones Batool and Saeed (2018) C No 1 Retain High
Covered by "Technology and
information" indicator.
Electrified pump sets per thousand hectares of gross
cropped area
GIZ Framework for Vulnerability
Assessment (2014) VA Yes 0 Discard Discard
Electrified pump sets per thousand
hectares of gross cropped area
GIZ Framework for Vulnerability
Assessment (2014) VA Yes 0 Discard Discard
Access to weather updates Batool and Saeed (2018) C NO 0 Discard Discard
Early warning systems Batool and Saeed (2018) C NO 0 Discard Discard
Paved roads (% villages) Rao et al., (2016) A Yes 1 Retain Medium
Covered by "Road density" indicator
which is used as a proxy for
infrastructure.
Rural electrification (% villages) Rao et al., (2016) A Yes 1 Retain Medium Incorporated into the multidimensional
poverty index.
Average time to market Botero and Salinas (2013) A Yes 1 Retain Medium
Covered by "Road density" indicator
which is used as a proxy for
infrastructure.
Infrastructure and access to markets Gbetibouo and Ringler (2009) A No 1 Retain Low
Covered by "Road density" indicator
which is used as a proxy for
infrastructure.
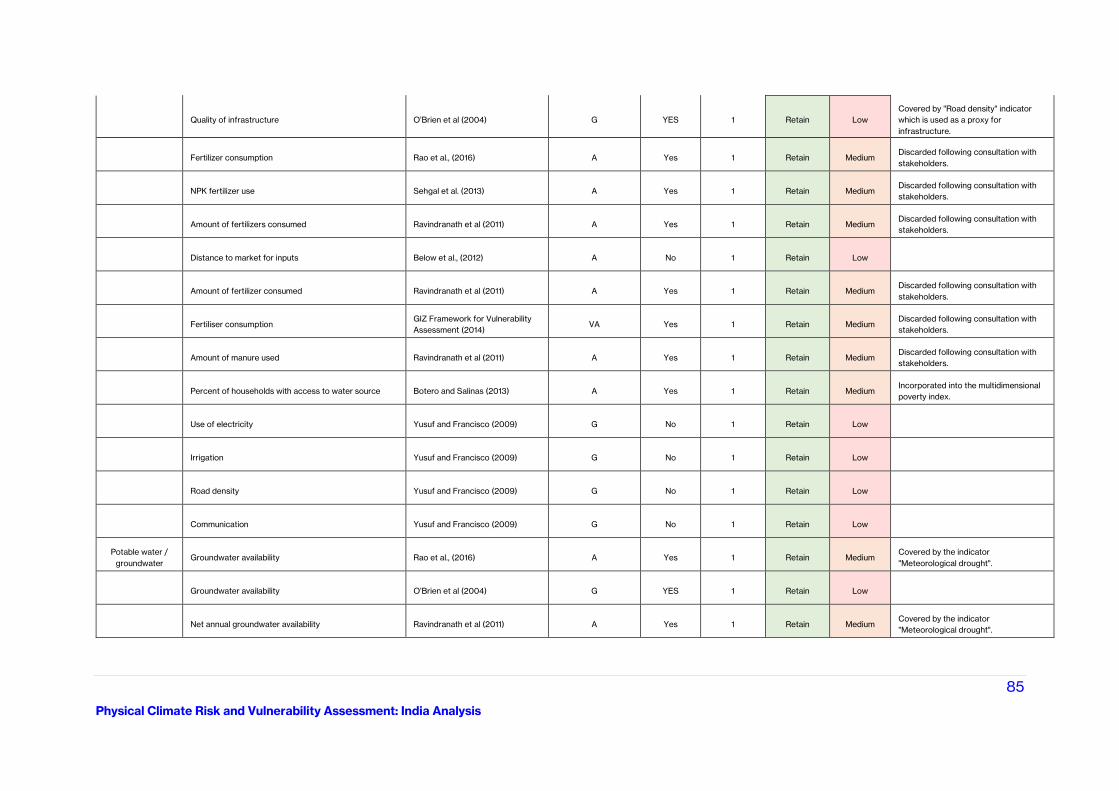
85
Physical Climate Risk and Vulnerability Assessment: India Analysis
Quality of infrastructure O’Brien et al (2004) G YES 1 Retain Low
Covered by "Road density" indicator
which is used as a proxy for
infrastructure.
Fertilizer consumption Rao et al., (2016) A Yes 1 Retain Medium Discarded following consultation with
stakeholders.
NPK fertilizer use Sehgal et al. (2013) A Yes 1 Retain Medium Discarded following consultation with
stakeholders.
Amount of fertilizers consumed Ravindranath et al (2011) A Yes 1 Retain Medium Discarded following consultation with
stakeholders.
Distance to market for inputs Below et al., (2012) A No 1 Retain Low
Amount of fertilizer consumed Ravindranath et al (2011) A Yes 1 Retain Medium Discarded following consultation with
stakeholders.
Fertiliser consumption GIZ Framework for Vulnerability
Assessment (2014) VA Yes 1 Retain Medium
Discarded following consultation with
stakeholders.
Amount of manure used Ravindranath et al (2011) A Yes 1 Retain Medium Discarded following consultation with
stakeholders.
Percent of households with access to water source Botero and Salinas (2013) A Yes 1 Retain Medium Incorporated into the multidimensional
poverty index.
Use of electricity Yusuf and Francisco (2009) G No 1 Retain Low
Irrigation Yusuf and Francisco (2009) G No 1 Retain Low
Road density Yusuf and Francisco (2009) G No 1 Retain Low
Communication Yusuf and Francisco (2009) G No 1 Retain Low
Potable water /
groundwater Groundwater availability Rao et al., (2016) A Yes 1 Retain Medium
Covered by the indicator
"Meteorological drought".
Groundwater availability O’Brien et al (2004) G YES 1 Retain Low
Net annual groundwater availability Ravindranath et al (2011) A Yes 1 Retain Medium Covered by the indicator
"Meteorological drought".
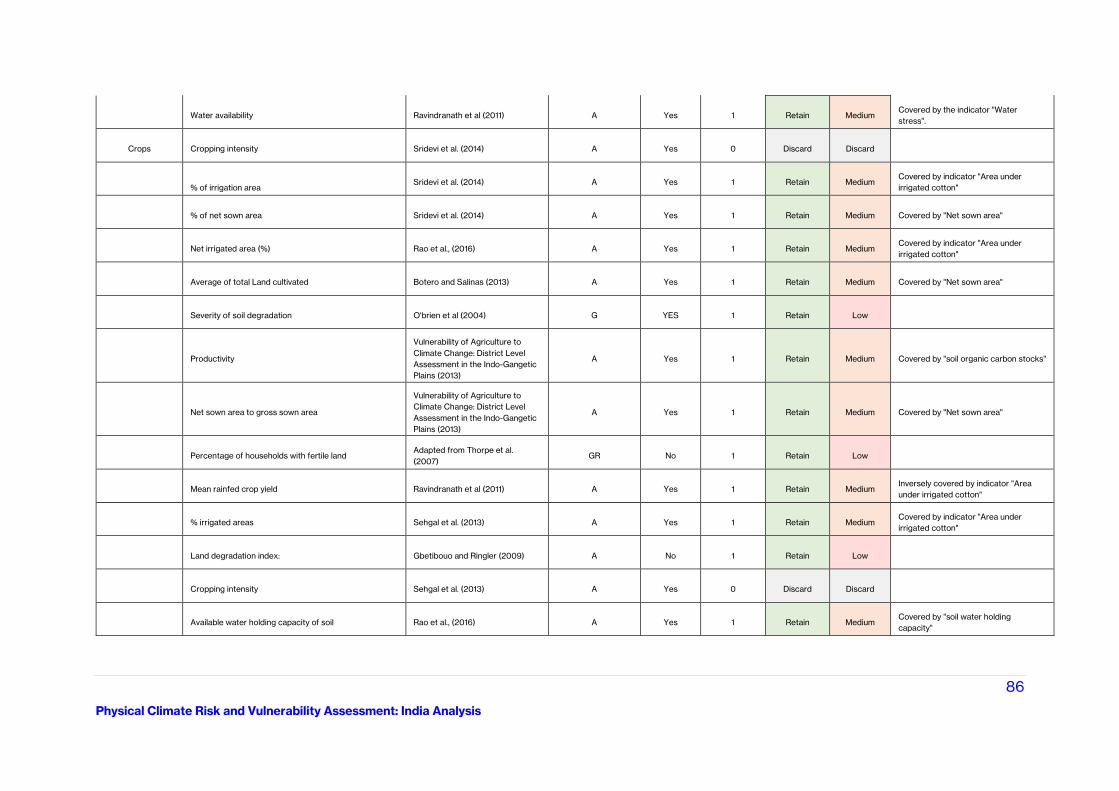
86
Physical Climate Risk and Vulnerability Assessment: India Analysis
Water availability Ravindranath et al (2011) A Yes 1 Retain Medium Covered by the indicator "Water
stress".
Crops Cropping intensity Sridevi et al. (2014) A Yes 0 Discard Discard
% of irrigation area Sridevi et al. (2014) A Yes 1 Retain Medium
Covered by indicator "Area under
irrigated cotton"
% of net sown area Sridevi et al. (2014) A Yes 1 Retain Medium Covered by "Net sown area"
Net irrigated area (%) Rao et al., (2016) A Yes 1 Retain Medium Covered by indicator "Area under
irrigated cotton"
Average of total Land cultivated Botero and Salinas (2013) A Yes 1 Retain Medium Covered by "Net sown area"
Severity of soil degradation O'brien et al (2004) G YES 1 Retain Low
Productivity
Vulnerability of Agriculture to
Climate Change: District Level
Assessment in the Indo-Gangetic
Plains (2013)
A Yes 1 Retain Medium Covered by "soil organic carbon stocks"
Net sown area to gross sown area
Vulnerability of Agriculture to
Climate Change: District Level
Assessment in the Indo-Gangetic
Plains (2013)
A Yes 1 Retain Medium Covered by "Net sown area"
Percentage of households with fertile land Adapted from Thorpe et al.
(2007) GR No 1 Retain Low
Mean rainfed crop yield Ravindranath et al (2011) A Yes 1 Retain Medium Inversely covered by indicator "Area
under irrigated cotton"
% irrigated areas Sehgal et al. (2013) A Yes 1 Retain Medium Covered by indicator "Area under
irrigated cotton"
Land degradation index: Gbetibouo and Ringler (2009) A No 1 Retain Low
Cropping intensity Sehgal et al. (2013) A Yes 0 Discard Discard
Available water holding capacity of soil Rao et al., (2016) A Yes 1 Retain Medium Covered by "soil water holding
capacity"
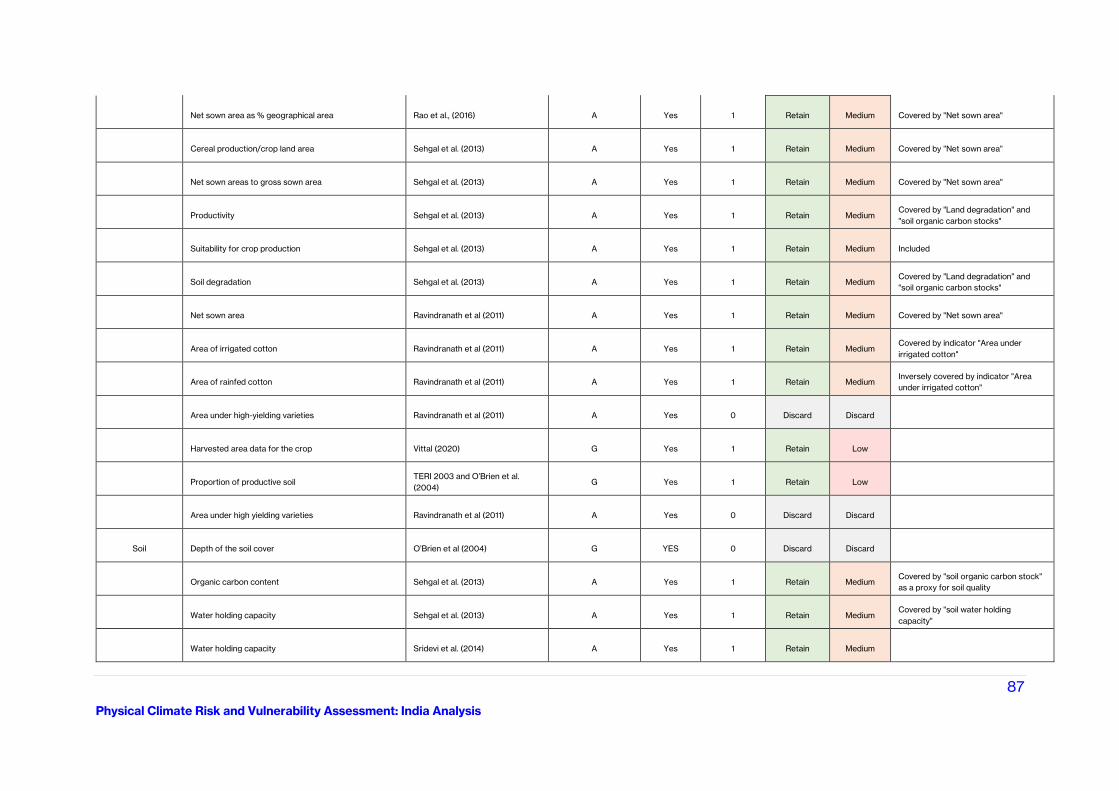
87
Physical Climate Risk and Vulnerability Assessment: India Analysis
Net sown area as % geographical area Rao et al., (2016) A Yes 1 Retain Medium Covered by "Net sown area"
Cereal production/crop land area Sehgal et al. (2013) A Yes 1 Retain Medium Covered by "Net sown area"
Net sown areas to gross sown area Sehgal et al. (2013) A Yes 1 Retain Medium Covered by "Net sown area"
Productivity Sehgal et al. (2013) A Yes 1 Retain Medium Covered by "Land degradation" and
"soil organic carbon stocks"
Suitability for crop production Sehgal et al. (2013) A Yes 1 Retain Medium Included
Soil degradation Sehgal et al. (2013) A Yes 1 Retain Medium Covered by "Land degradation" and
"soil organic carbon stocks"
Net sown area Ravindranath et al (2011) A Yes 1 Retain Medium Covered by "Net sown area"
Area of irrigated cotton Ravindranath et al (2011) A Yes 1 Retain Medium Covered by indicator "Area under
irrigated cotton"
Area of rainfed cotton Ravindranath et al (2011) A Yes 1 Retain Medium Inversely covered by indicator "Area
under irrigated cotton"
Area under high-yielding varieties Ravindranath et al (2011) A Yes 0 Discard Discard
Harvested area data for the crop Vittal (2020) G Yes 1 Retain Low
Proportion of productive soil TERI 2003 and O’Brien et al.
(2004) G Yes 1 Retain Low
Area under high yielding varieties Ravindranath et al (2011) A Yes 0 Discard Discard
Soil Depth of the soil cover O’Brien et al (2004) G YES 0 Discard Discard
Organic carbon content Sehgal et al. (2013) A Yes 1 Retain Medium Covered by "soil organic carbon stock"
as a proxy for soil quality
Water holding capacity Sehgal et al. (2013) A Yes 1 Retain Medium Covered by "soil water holding
capacity"
Water holding capacity Sridevi et al. (2014) A Yes 1 Retain Medium
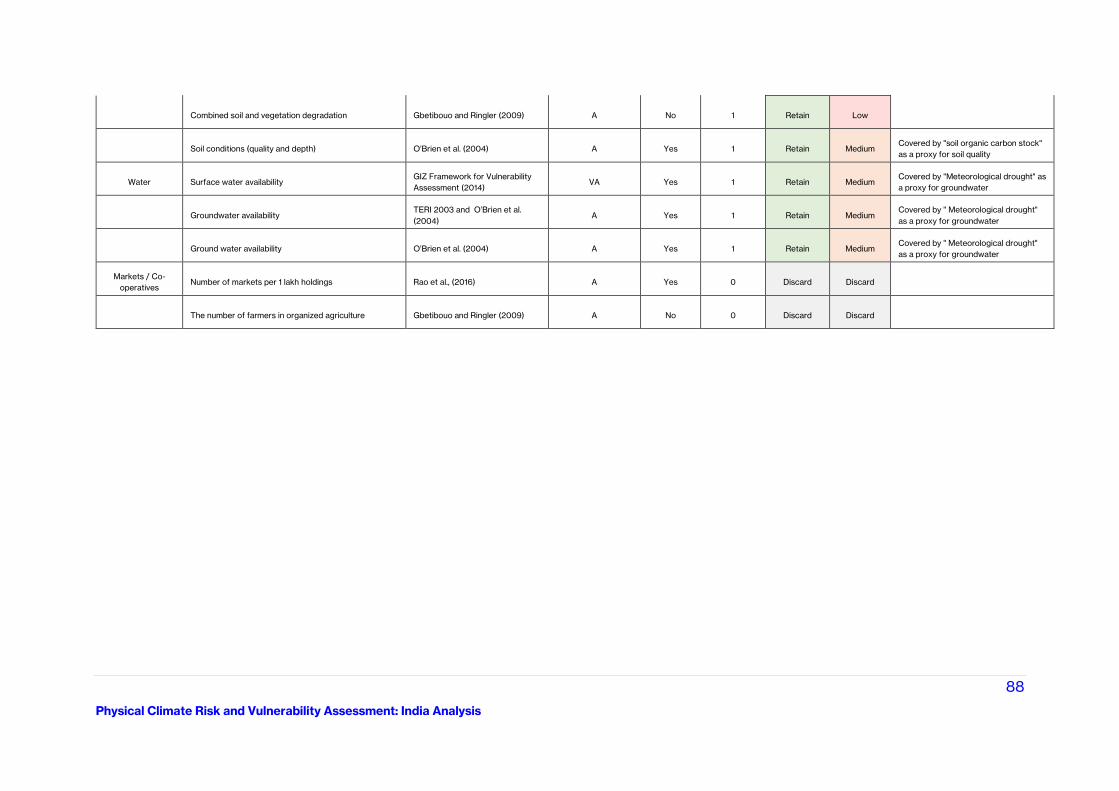
88
Physical Climate Risk and Vulnerability Assessment: India Analysis
Combined soil and vegetation degradation Gbetibouo and Ringler (2009) A No 1 Retain Low
Soil conditions (quality and depth) O’Brien et al. (2004) A Yes 1 Retain Medium Covered by "soil organic carbon stock"
as a proxy for soil quality
Water Surface water availability GIZ Framework for Vulnerability
Assessment (2014) VA Yes 1 Retain Medium
Covered by "Meteorological drought" as
a proxy for groundwater
Groundwater availability TERI 2003 and O’Brien et al.
(2004) A Yes 1 Retain Medium
Covered by " Meteorological drought"
as a proxy for groundwater
Ground water availability O’Brien et al. (2004) A Yes 1 Retain Medium Covered by " Meteorological drought"
as a proxy for groundwater
Markets / Co-
operatives Number of markets per 1 lakh holdings Rao et al., (2016) A Yes 0 Discard Discard
The number of farmers in organized agriculture Gbetibouo and Ringler (2009) A No 0 Discard Discard
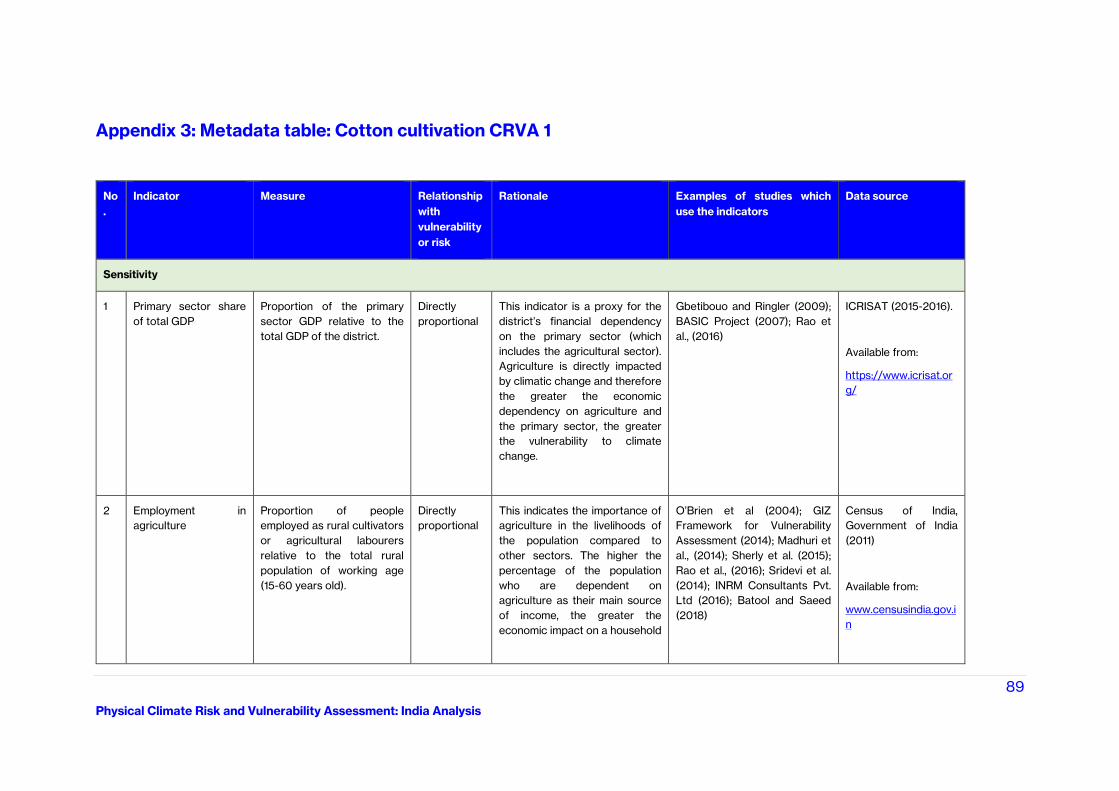
89
Physical Climate Risk and Vulnerability Assessment: India Analysis
Appendix 3: Metadata table: Cotton cultivation CRVA 1
No
.
Indicator Measure Relationship
with
vulnerability
or risk
Rationale Examples of studies which
use the indicators
Data source
Sensitivity
1 Primary sector share
of total GDP
Proportion of the primary
sector GDP relative to the
total GDP of the district.
Directly
proportional
This indicator is a proxy for the
district’s financial dependency
on the primary sector (which
includes the agricultural sector).
Agriculture is directly impacted
by climatic change and therefore
the greater the economic
dependency on agriculture and
the primary sector, the greater
the vulnerability to climate
change.
Gbetibouo and Ringler (2009);
BASIC Project (2007); Rao et
al., (2016)
ICRISAT (2015-2016).
Available from:
https://www.icrisat.or
g/
2 Employment in
agriculture
Proportion of people
employed as rural cultivators
or agricultural labourers
relative to the total rural
population of working age
(15-60 years old).
Directly
proportional
This indicates the importance of
agriculture in the livelihoods of
the population compared to
other sectors. The higher the
percentage of the population
who are dependent on
agriculture as their main source
of income, the greater the
economic impact on a household
O’Brien et al (2004); GIZ
Framework for Vulnerability
Assessment (2014); Madhuri et
al., (2014); Sherly et al. (2015);
Rao et al., (2016); Sridevi et al.
(2014); INRM Consultants Pvt.
Ltd (2016); Batool and Saeed
(2018)
Census of India,
Government of India
(2011)
Available from:
www.censusindia.gov.i
n
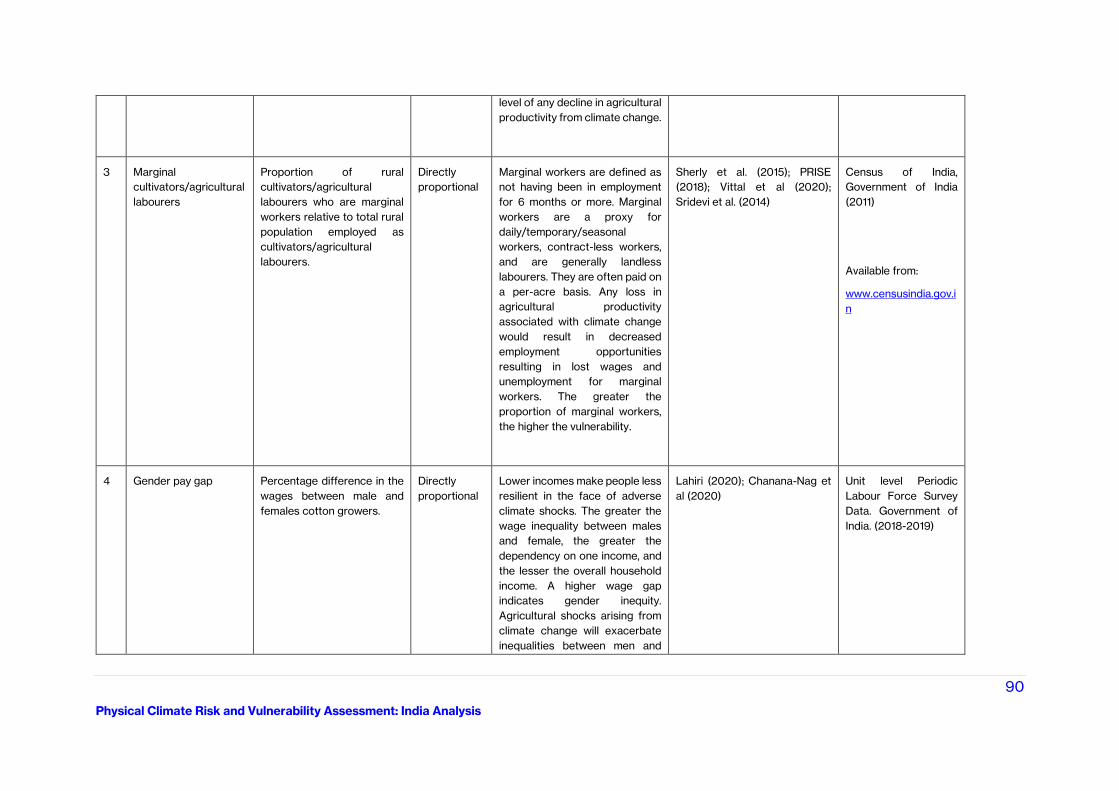
90
Physical Climate Risk and Vulnerability Assessment: India Analysis
level of any decline in agricultural
productivity from climate change.
3 Marginal
cultivators/agricultural
labourers
Proportion of rural
cultivators/agricultural
labourers who are marginal
workers relative to total rural
population employed as
cultivators/agricultural
labourers.
Directly
proportional
Marginal workers are defined as
not having been in employment
for 6 months or more. Marginal
workers are a proxy for
daily/temporary/seasonal
workers, contract-less workers,
and are generally landless
labourers. They are often paid on
a per-acre basis. Any loss in
agricultural productivity
associated with climate change
would result in decreased
employment opportunities
resulting in lost wages and
unemployment for marginal
workers. The greater the
proportion of marginal workers,
the higher the vulnerability.
Sherly et al. (2015); PRISE
(2018); Vittal et al (2020);
Sridevi et al. (2014)
Census of India,
Government of India
(2011)
Available from:
www.censusindia.gov.i
n
4 Gender pay gap Percentage difference in the
wages between male and
females cotton growers.
Directly
proportional
Lower incomes make people less
resilient in the face of adverse
climate shocks. The greater the
wage inequality between males
and female, the greater the
dependency on one income, and
the lesser the overall household
income. A higher wage gap
indicates gender inequity.
Agricultural shocks arising from
climate change will exacerbate
inequalities between men and
Lahiri (2020); Chanana-Nag et
al (2020)
Unit level Periodic
Labour Force Survey
Data. Government of
India. (2018-2019)
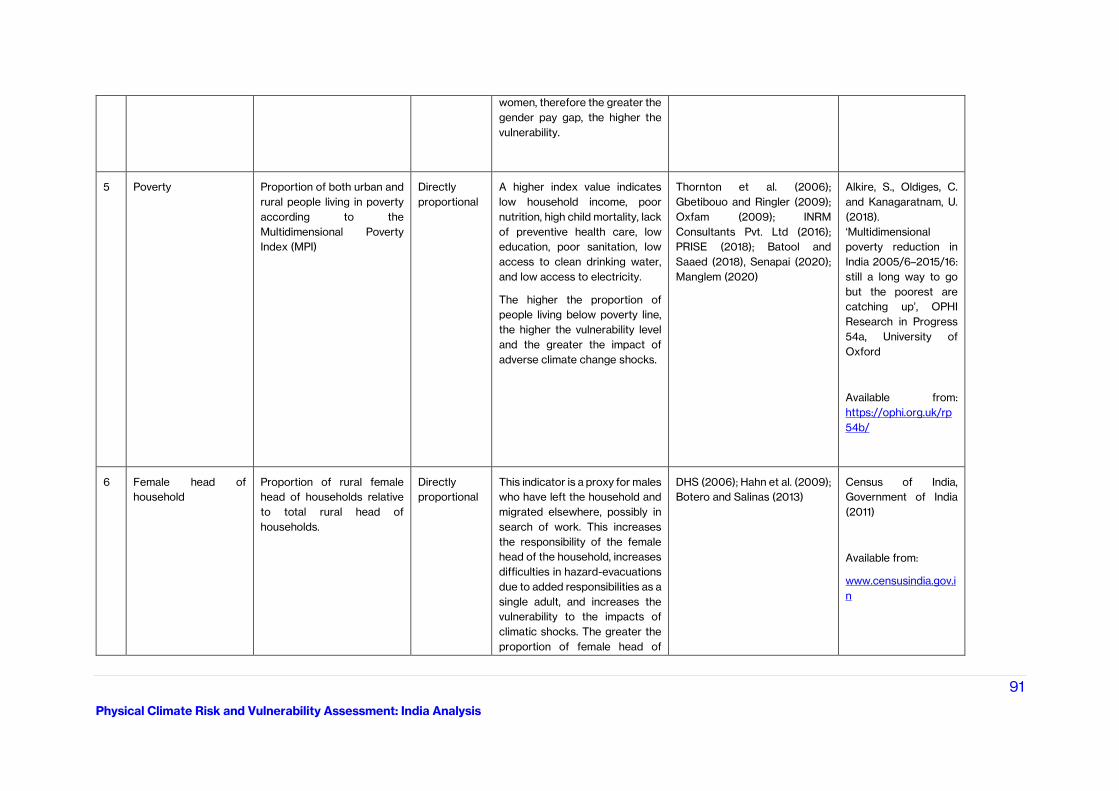
91
Physical Climate Risk and Vulnerability Assessment: India Analysis
women, therefore the greater the
gender pay gap, the higher the
vulnerability.
5 Poverty Proportion of both urban and
rural people living in poverty
according to the
Multidimensional Poverty
Index (MPI)
Directly
proportional
A higher index value indicates
low household income, poor
nutrition, high child mortality, lack
of preventive health care, low
education, poor sanitation, low
access to clean drinking water,
and low access to electricity.
The higher the proportion of
people living below poverty line,
the higher the vulnerability level
and the greater the impact of
adverse climate change shocks.
Thornton et al. (2006);
Gbetibouo and Ringler (2009);
Oxfam (2009); INRM
Consultants Pvt. Ltd (2016);
PRISE (2018); Batool and
Saaed (2018), Senapai (2020);
Manglem (2020)
Alkire, S., Oldiges, C.
and Kanagaratnam, U.
(2018).
‘Multidimensional
poverty reduction in
India 2005/6–2015/16:
still a long way to go
but the poorest are
catching up’, OPHI
Research in Progress
54a, University of
Oxford
Available from:
https://ophi.org.uk/rp
54b/
6 Female head of
household
Proportion of rural female
head of households relative
to total rural head of
households.
Directly
proportional
This indicator is a proxy for males
who have left the household and
migrated elsewhere, possibly in
search of work. This increases
the responsibility of the female
head of the household, increases
difficulties in hazard-evacuations
due to added responsibilities as a
single adult, and increases the
vulnerability to the impacts of
climatic shocks. The greater the
proportion of female head of
DHS (2006); Hahn et al. (2009);
Botero and Salinas (2013)
Census of India,
Government of India
(2011)
Available from:
www.censusindia.gov.i
n
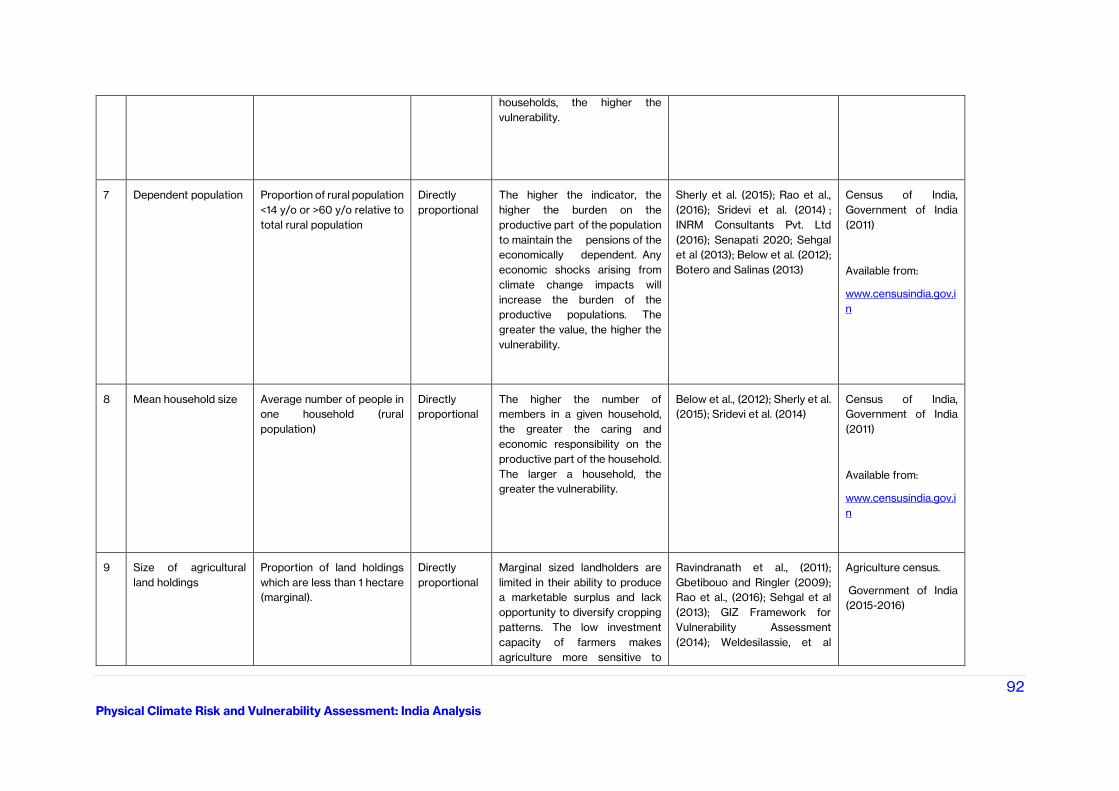
92
Physical Climate Risk and Vulnerability Assessment: India Analysis
households, the higher the
vulnerability.
7 Dependent population Proportion of rural population
<14 y/o or >60 y/o relative to
total rural population
Directly
proportional
The higher the indicator, the
higher the burden on the
productive part of the population
to maintain the pensions of the
economically dependent. Any
economic shocks arising from
climate change impacts will
increase the burden of the
productive populations. The
greater the value, the higher the
vulnerability.
Sherly et al. (2015); Rao et al.,
(2016); Sridevi et al. (2014) ;
INRM Consultants Pvt. Ltd
(2016); Senapati 2020; Sehgal
et al (2013); Below et al. (2012);
Botero and Salinas (2013)
Census of India,
Government of India
(2011)
Available from:
www.censusindia.gov.i
n
8 Mean household size Average number of people in
one household (rural
population)
Directly
proportional
The higher the number of
members in a given household,
the greater the caring and
economic responsibility on the
productive part of the household.
The larger a household, the
greater the vulnerability.
Below et al., (2012); Sherly et al.
(2015); Sridevi et al. (2014)
Census of India,
Government of India
(2011)
Available from:
www.censusindia.gov.i
n
9 Size of agricultural
land holdings
Proportion of land holdings
which are less than 1 hectare
(marginal).
Directly
proportional
Marginal sized landholders are
limited in their ability to produce
a marketable surplus and lack
opportunity to diversify cropping
patterns. The low investment
capacity of farmers makes
agriculture more sensitive to
Ravindranath et al., (2011);
Gbetibouo and Ringler (2009);
Rao et al., (2016); Sehgal et al
(2013); GIZ Framework for
Vulnerability Assessment
(2014); Weldesilassie, et al
Agriculture census.
Government of India
(2015-2016)
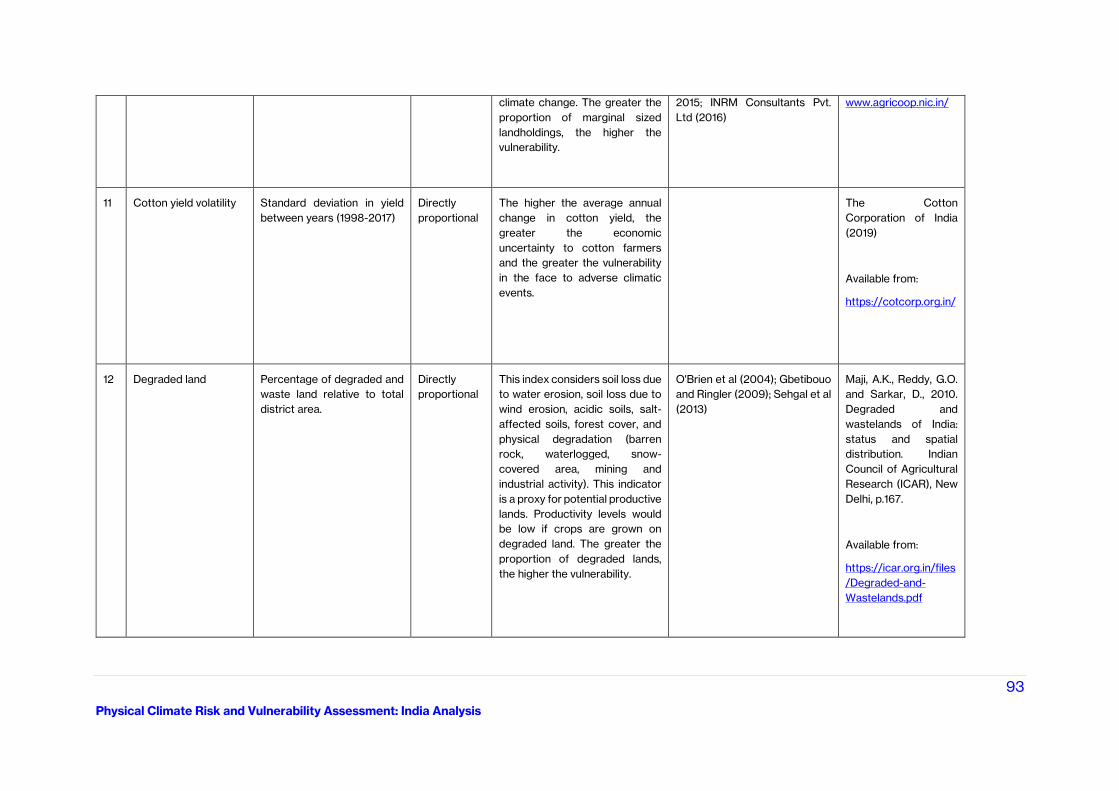
93
Physical Climate Risk and Vulnerability Assessment: India Analysis
climate change. The greater the
proportion of marginal sized
landholdings, the higher the
vulnerability.
2015; INRM Consultants Pvt.
Ltd (2016)
www.agricoop.nic.in/
11 Cotton yield volatility Standard deviation in yield
between years (1998-2017)
Directly
proportional
The higher the average annual
change in cotton yield, the
greater the economic
uncertainty to cotton farmers
and the greater the vulnerability
in the face to adverse climatic
events.
The Cotton
Corporation of India
(2019)
Available from:
https://cotcorp.org.in/
12 Degraded land Percentage of degraded and
waste land relative to total
district area.
Directly
proportional
This index considers soil loss due
to water erosion, soil loss due to
wind erosion, acidic soils, salt-
affected soils, forest cover, and
physical degradation (barren
rock, waterlogged, snow-
covered area, mining and
industrial activity). This indicator
is a proxy for potential productive
lands. Productivity levels would
be low if crops are grown on
degraded land. The greater the
proportion of degraded lands,
the higher the vulnerability.
O'Brien et al (2004); Gbetibouo
and Ringler (2009); Sehgal et al
(2013)
Maji, A.K., Reddy, G.O.
and Sarkar, D., 2010.
Degraded and
wastelands of India:
status and spatial
distribution. Indian
Council of Agricultural
Research (ICAR), New
Delhi, p.167.
Available from:
https://icar.org.in/files
/Degraded-and-
Wastelands.pdf
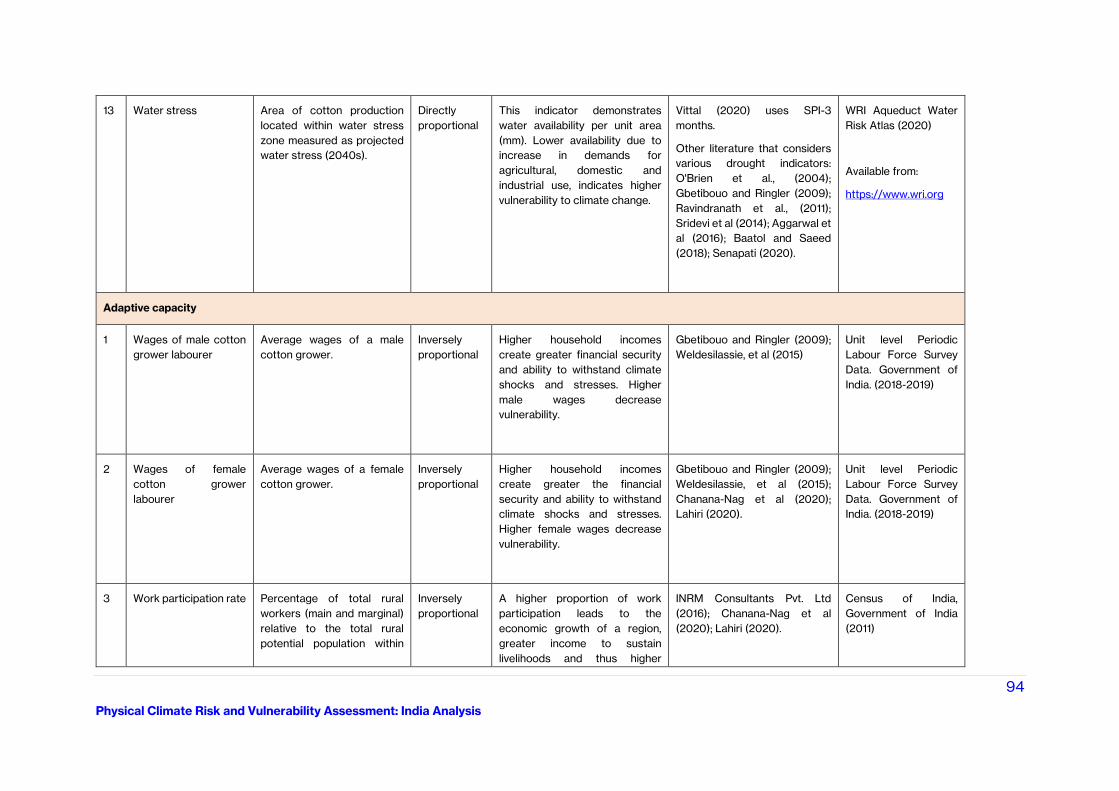
94
Physical Climate Risk and Vulnerability Assessment: India Analysis
13 Water stress Area of cotton production
located within water stress
zone measured as projected
water stress (2040s).
Directly
proportional
This indicator demonstrates
water availability per unit area
(mm). Lower availability due to
increase in demands for
agricultural, domestic and
industrial use, indicates higher
vulnerability to climate change.
Vittal (2020) uses SPI-3
months.
Other literature that considers
various drought indicators:
O'Brien et al., (2004);
Gbetibouo and Ringler (2009);
Ravindranath et al., (2011);
Sridevi et al (2014); Aggarwal et
al (2016); Baatol and Saeed
(2018); Senapati (2020).
WRI Aqueduct Water
Risk Atlas (2020)
Available from:
https://www.wri.org
Adaptive capacity
1 Wages of male cotton
grower labourer
Average wages of a male
cotton grower.
Inversely
proportional
Higher household incomes
create greater financial security
and ability to withstand climate
shocks and stresses. Higher
male wages decrease
vulnerability.
Gbetibouo and Ringler (2009);
Weldesilassie, et al (2015)
Unit level Periodic
Labour Force Survey
Data. Government of
India. (2018-2019)
2 Wages of female
cotton grower
labourer
Average wages of a female
cotton grower.
Inversely
proportional
Higher household incomes
create greater the financial
security and ability to withstand
climate shocks and stresses.
Higher female wages decrease
vulnerability.
Gbetibouo and Ringler (2009);
Weldesilassie, et al (2015);
Chanana-Nag et al (2020);
Lahiri (2020).
Unit level Periodic
Labour Force Survey
Data. Government of
India. (2018-2019)
3 Work participation rate Percentage of total rural
workers (main and marginal)
relative to the total rural
potential population within
Inversely
proportional
A higher proportion of work
participation leads to the
economic growth of a region,
greater income to sustain
livelihoods and thus higher
INRM Consultants Pvt. Ltd
(2016); Chanana-Nag et al
(2020); Lahiri (2020).
Census of India,
Government of India
(2011)
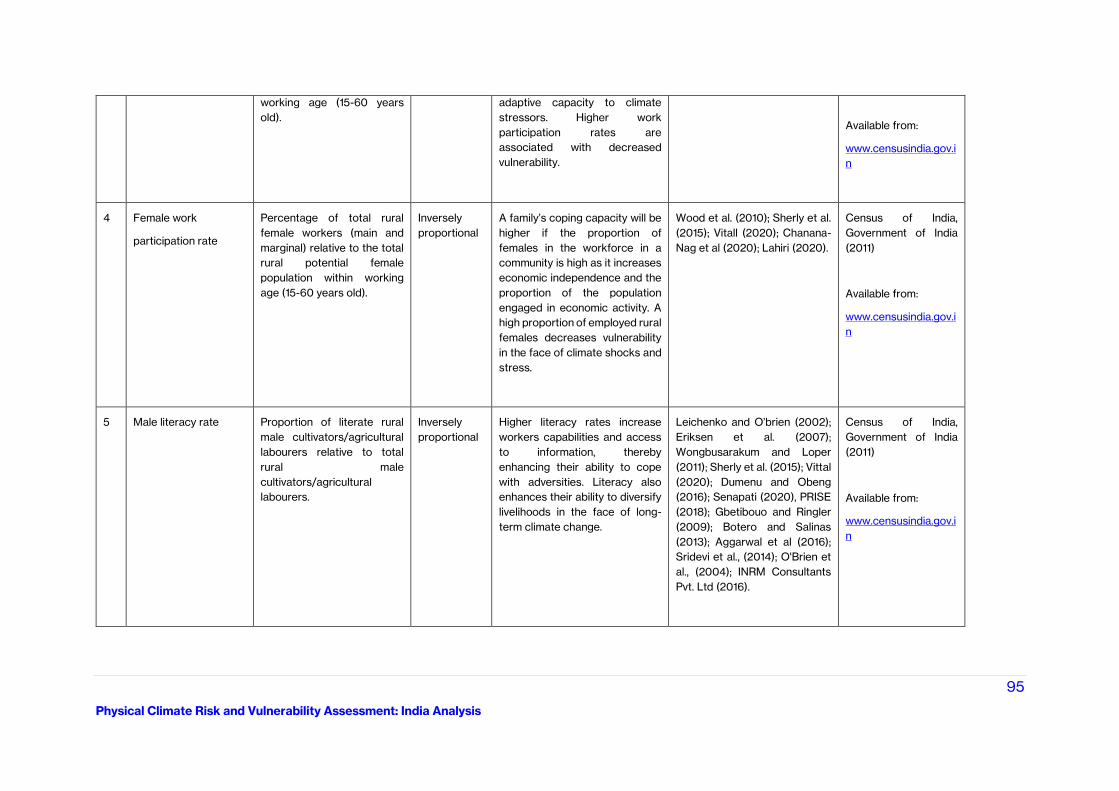
95
Physical Climate Risk and Vulnerability Assessment: India Analysis
working age (15-60 years
old).
adaptive capacity to climate
stressors. Higher work
participation rates are
associated with decreased
vulnerability.
Available from:
www.censusindia.gov.i
n
4 Female work
participation rate
Percentage of total rural
female workers (main and
marginal) relative to the total
rural potential female
population within working
age (15-60 years old).
Inversely
proportional
A family’s coping capacity will be
higher if the proportion of
females in the workforce in a
community is high as it increases
economic independence and the
proportion of the population
engaged in economic activity. A
high proportion of employed rural
females decreases vulnerability
in the face of climate shocks and
stress.
Wood et al. (2010); Sherly et al.
(2015); Vitall (2020); Chanana-
Nag et al (2020); Lahiri (2020).
Census of India,
Government of India
(2011)
Available from:
www.censusindia.gov.i
n
5 Male literacy rate Proportion of literate rural
male cultivators/agricultural
labourers relative to total
rural male
cultivators/agricultural
labourers.
Inversely
proportional
Higher literacy rates increase
workers capabilities and access
to information, thereby
enhancing their ability to cope
with adversities. Literacy also
enhances their ability to diversify
livelihoods in the face of long-
term climate change.
Leichenko and O’brien (2002);
Eriksen et al. (2007);
Wongbusarakum and Loper
(2011); Sherly et al. (2015); Vittal
(2020); Dumenu and Obeng
(2016); Senapati (2020), PRISE
(2018); Gbetibouo and Ringler
(2009); Botero and Salinas
(2013); Aggarwal et al (2016);
Sridevi et al., (2014); O'Brien et
al., (2004); INRM Consultants
Pvt. Ltd (2016).
Census of India,
Government of India
(2011)
Available from:
www.censusindia.gov.i
n
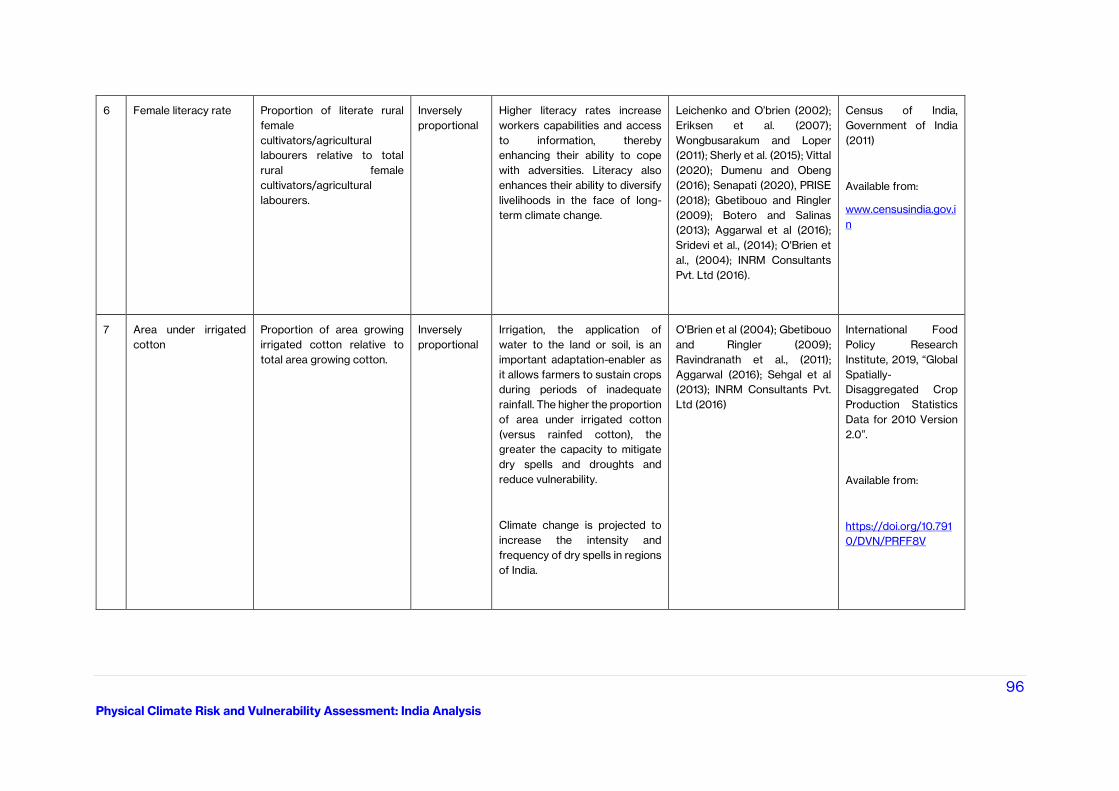
96
Physical Climate Risk and Vulnerability Assessment: India Analysis
6 Female literacy rate Proportion of literate rural
female
cultivators/agricultural
labourers relative to total
rural female
cultivators/agricultural
labourers.
Inversely
proportional
Higher literacy rates increase
workers capabilities and access
to information, thereby
enhancing their ability to cope
with adversities. Literacy also
enhances their ability to diversify
livelihoods in the face of long-
term climate change.
Leichenko and O’brien (2002);
Eriksen et al. (2007);
Wongbusarakum and Loper
(2011); Sherly et al. (2015); Vittal
(2020); Dumenu and Obeng
(2016); Senapati (2020), PRISE
(2018); Gbetibouo and Ringler
(2009); Botero and Salinas
(2013); Aggarwal et al (2016);
Sridevi et al., (2014); O'Brien et
al., (2004); INRM Consultants
Pvt. Ltd (2016).
Census of India,
Government of India
(2011)
Available from:
www.censusindia.gov.i
n
7 Area under irrigated
cotton
Proportion of area growing
irrigated cotton relative to
total area growing cotton.
Inversely
proportional
Irrigation, the application of
water to the land or soil, is an
important adaptation-enabler as
it allows farmers to sustain crops
during periods of inadequate
rainfall. The higher the proportion
of area under irrigated cotton
(versus rainfed cotton), the
greater the capacity to mitigate
dry spells and droughts and
reduce vulnerability.
Climate change is projected to
increase the intensity and
frequency of dry spells in regions
of India.
O'Brien et al (2004); Gbetibouo
and Ringler (2009);
Ravindranath et al., (2011);
Aggarwal (2016); Sehgal et al
(2013); INRM Consultants Pvt.
Ltd (2016)
International Food
Policy Research
Institute, 2019, “Global
Spatially-
Disaggregated Crop
Production Statistics
Data for 2010 Version
2.0”.
Available from:
https://doi.org/10.791
0/DVN/PRFF8V
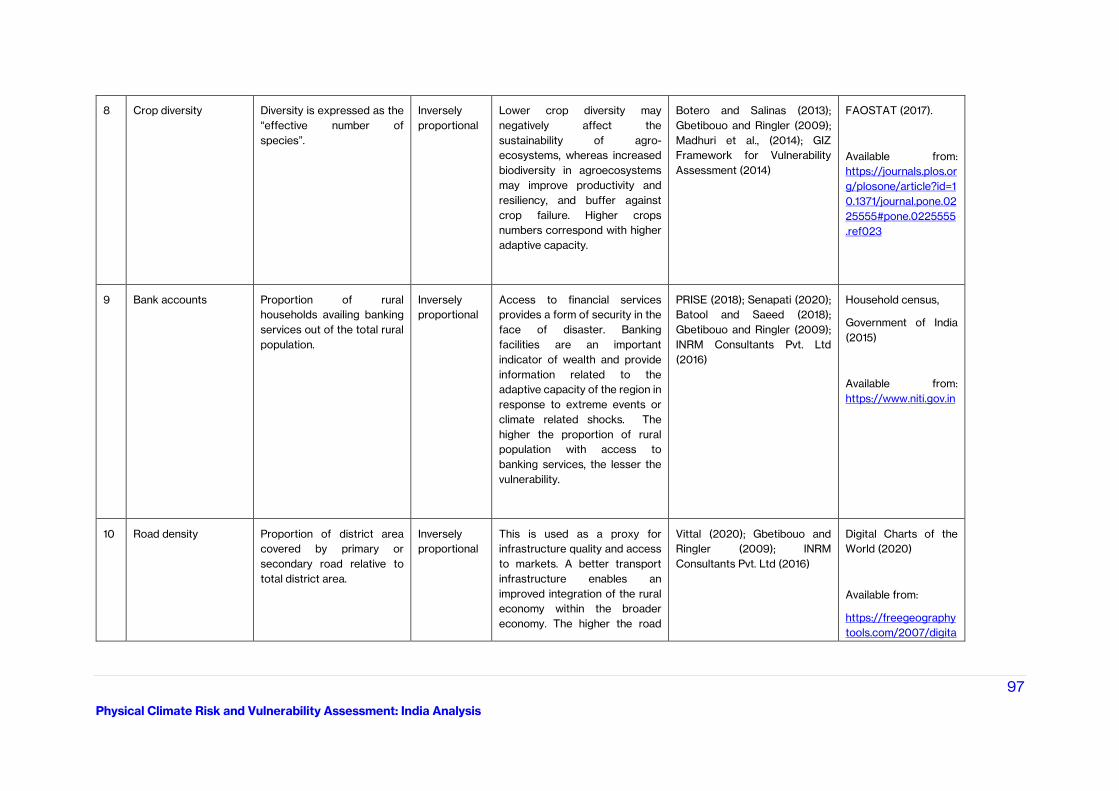
97
Physical Climate Risk and Vulnerability Assessment: India Analysis
8 Crop diversity Diversity is expressed as the
“effective number of
species”.
Inversely
proportional
Lower crop diversity may
negatively affect the
sustainability of agro-
ecosystems, whereas increased
biodiversity in agroecosystems
may improve productivity and
resiliency, and buffer against
crop failure. Higher crops
numbers correspond with higher
adaptive capacity.
Botero and Salinas (2013);
Gbetibouo and Ringler (2009);
Madhuri et al., (2014); GIZ
Framework for Vulnerability
Assessment (2014)
FAOSTAT (2017).
Available from:
https://journals.plos.or
g/plosone/article?id=1
0.1371/journal.pone.02
25555#pone.0225555
.ref023
9 Bank accounts Proportion of rural
households availing banking
services out of the total rural
population.
Inversely
proportional
Access to financial services
provides a form of security in the
face of disaster. Banking
facilities are an important
indicator of wealth and provide
information related to the
adaptive capacity of the region in
response to extreme events or
climate related shocks. The
higher the proportion of rural
population with access to
banking services, the lesser the
vulnerability.
PRISE (2018); Senapati (2020);
Batool and Saeed (2018);
Gbetibouo and Ringler (2009);
INRM Consultants Pvt. Ltd
(2016)
Household census,
Government of India
(2015)
Available from:
https://www.niti.gov.in
10 Road density Proportion of district area
covered by primary or
secondary road relative to
total district area.
Inversely
proportional
This is used as a proxy for
infrastructure quality and access
to markets. A better transport
infrastructure enables an
improved integration of the rural
economy within the broader
economy. The higher the road
Vittal (2020); Gbetibouo and
Ringler (2009); INRM
Consultants Pvt. Ltd (2016)
Digital Charts of the
World (2020)
Available from:
https://freegeography
tools.com/2007/digita
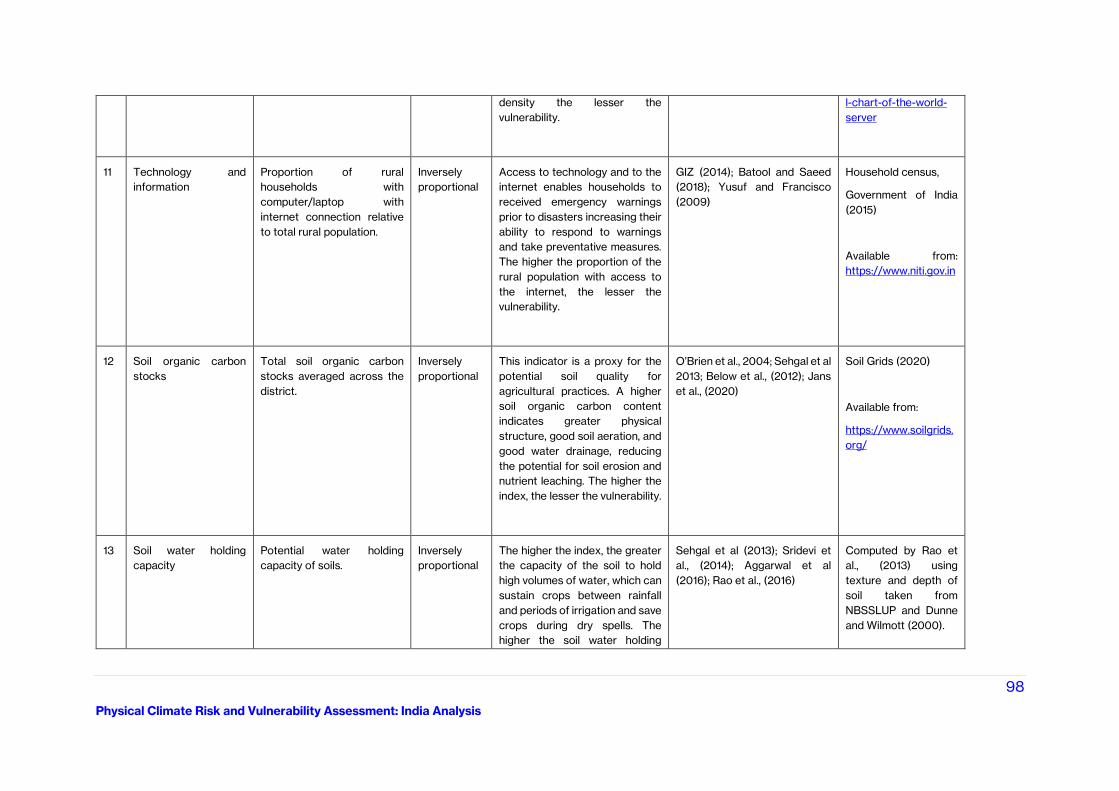
98
Physical Climate Risk and Vulnerability Assessment: India Analysis
density the lesser the
vulnerability.
l-chart-of-the-world-
server
11 Technology and
information
Proportion of rural
households with
computer/laptop with
internet connection relative
to total rural population.
Inversely
proportional
Access to technology and to the
internet enables households to
received emergency warnings
prior to disasters increasing their
ability to respond to warnings
and take preventative measures.
The higher the proportion of the
rural population with access to
the internet, the lesser the
vulnerability.
GIZ (2014); Batool and Saeed
(2018); Yusuf and Francisco
(2009)
Household census,
Government of India
(2015)
Available from:
https://www.niti.gov.in
12 Soil organic carbon
stocks
Total soil organic carbon
stocks averaged across the
district.
Inversely
proportional
This indicator is a proxy for the
potential soil quality for
agricultural practices. A higher
soil organic carbon content
indicates greater physical
structure, good soil aeration, and
good water drainage, reducing
the potential for soil erosion and
nutrient leaching. The higher the
index, the lesser the vulnerability.
O’Brien et al., 2004; Sehgal et al
2013; Below et al., (2012); Jans
et al., (2020)
Soil Grids (2020)
Available from:
https://www.soilgrids.
org/
13 Soil water holding
capacity
Potential water holding
capacity of soils.
Inversely
proportional
The higher the index, the greater
the capacity of the soil to hold
high volumes of water, which can
sustain crops between rainfall
and periods of irrigation and save
crops during dry spells. The
higher the soil water holding
Sehgal et al (2013); Sridevi et
al., (2014); Aggarwal et al
(2016); Rao et al., (2016)
Computed by Rao et
al., (2013) using
texture and depth of
soil taken from
NBSSLUP and Dunne
and Wilmott (2000).
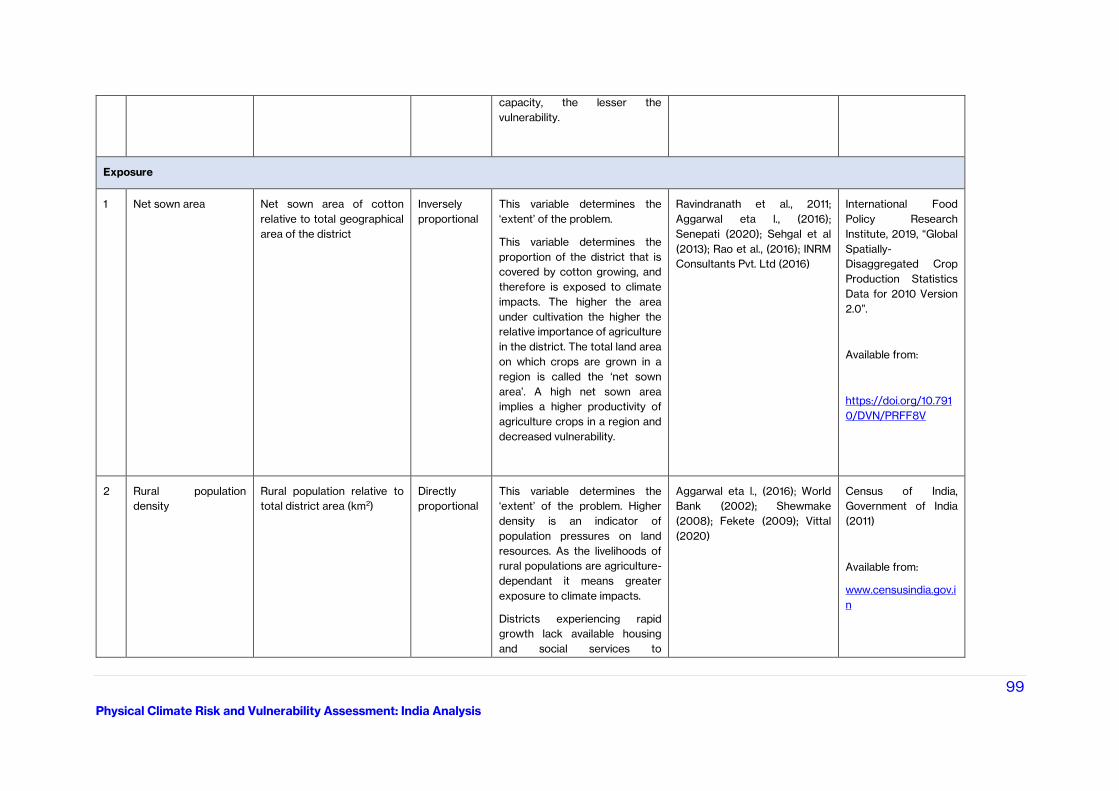
99
Physical Climate Risk and Vulnerability Assessment: India Analysis
capacity, the lesser the
vulnerability.
Exposure
1 Net sown area Net sown area of cotton
relative to total geographical
area of the district
Inversely
proportional
This variable determines the
‘extent’ of the problem.
This variable determines the
proportion of the district that is
covered by cotton growing, and
therefore is exposed to climate
impacts. The higher the area
under cultivation the higher the
relative importance of agriculture
in the district. The total land area
on which crops are grown in a
region is called the ‘net sown
area’. A high net sown area
implies a higher productivity of
agriculture crops in a region and
decreased vulnerability.
Ravindranath et al., 2011;
Aggarwal eta l., (2016);
Senepati (2020); Sehgal et al
(2013); Rao et al., (2016); INRM
Consultants Pvt. Ltd (2016)
International Food
Policy Research
Institute, 2019, “Global
Spatially-
Disaggregated Crop
Production Statistics
Data for 2010 Version
2.0”.
Available from:
https://doi.org/10.791
0/DVN/PRFF8V
2 Rural population
density
Rural population relative to
total district area (km2)
Directly
proportional
This variable determines the
‘extent’ of the problem. Higher
density is an indicator of
population pressures on land
resources. As the livelihoods of
rural populations are agriculture-
dependant it means greater
exposure to climate impacts.
Districts experiencing rapid
growth lack available housing
and social services to
Aggarwal eta l., (2016); World
Bank (2002); Shewmake
(2008); Fekete (2009); Vittal
(2020)
Census of India,
Government of India
(2011)
Available from:
www.censusindia.gov.i
n
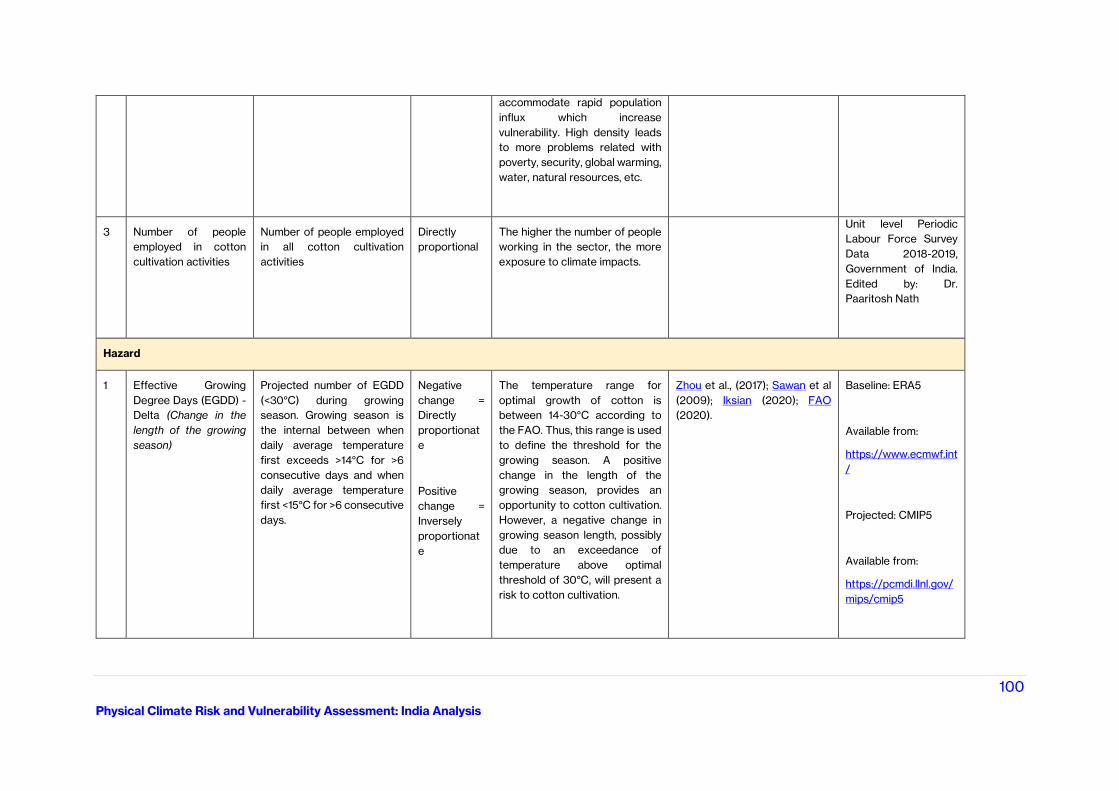
100
Physical Climate Risk and Vulnerability Assessment: India Analysis
accommodate rapid population
influx which increase
vulnerability. High density leads
to more problems related with
poverty, security, global warming,
water, natural resources, etc.
3 Number of people
employed in cotton
cultivation activities
Number of people employed
in all cotton cultivation
activities
Directly
proportional
The higher the number of people
working in the sector, the more
exposure to climate impacts.
Unit level Periodic
Labour Force Survey
Data 2018-2019,
Government of India.
Edited by: Dr.
Paaritosh Nath
Hazard
1 Effective Growing
Degree Days (EGDD) -
Delta (Change in the
length of the growing
season)
Projected number of EGDD
(<30°C) during growing
season. Growing season is
the internal between when
daily average temperature
first exceeds >14°C for >6
consecutive days and when
daily average temperature
first <15°C for >6 consecutive
days.
Negative
change =
Directly
proportionat
e
Positive
change =
Inversely
proportionat
e
The temperature range for
optimal growth of cotton is
between 14-30°C according to
the FAO. Thus, this range is used
to define the threshold for the
growing season. A positive
change in the length of the
growing season, provides an
opportunity to cotton cultivation.
However, a negative change in
growing season length, possibly
due to an exceedance of
temperature above optimal
threshold of 30°C, will present a
risk to cotton cultivation.
Zhou et al., (2017); Sawan et al
(2009); Iksian (2020); FAO
(2020).
Baseline: ERA5
Available from:
https://www.ecmwf.int
/
Projected: CMIP5
Available from:
https://pcmdi.llnl.gov/
mips/cmip5
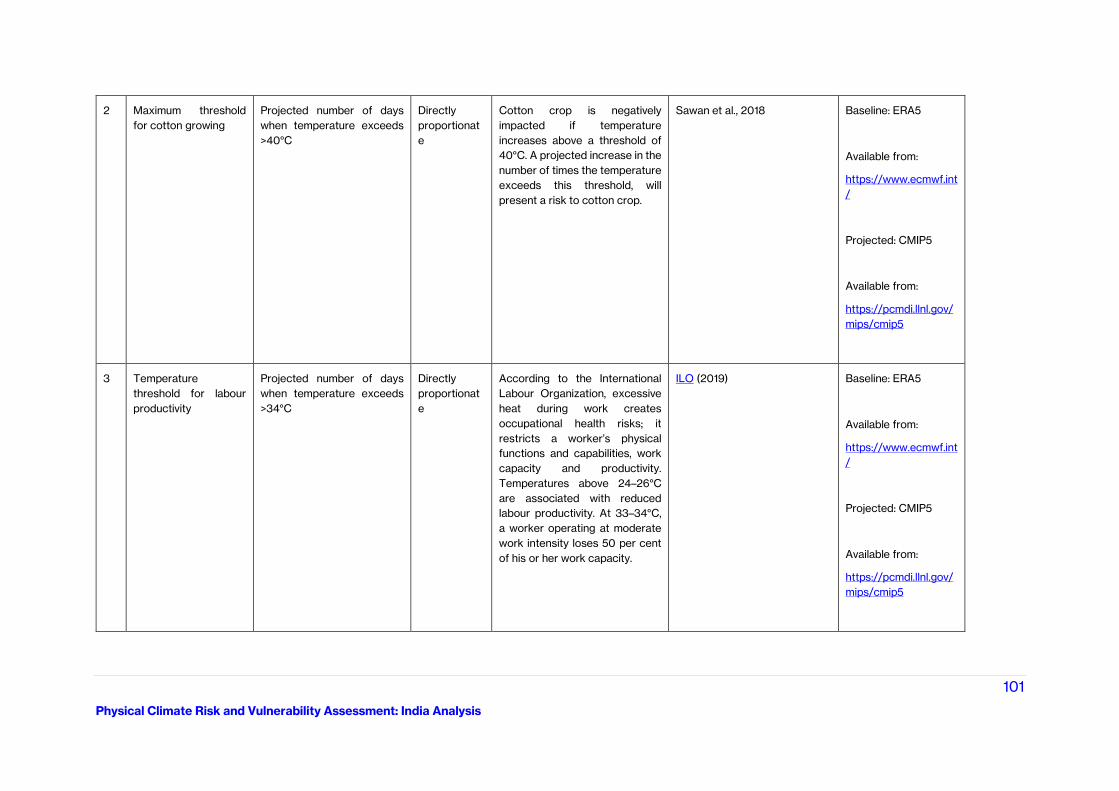
101
Physical Climate Risk and Vulnerability Assessment: India Analysis
2 Maximum threshold
for cotton growing
Projected number of days
when temperature exceeds
>40°C
Directly
proportionat
e
Cotton crop is negatively
impacted if temperature
increases above a threshold of
40°C. A projected increase in the
number of times the temperature
exceeds this threshold, will
present a risk to cotton crop.
Sawan et al., 2018 Baseline: ERA5
Available from:
https://www.ecmwf.int
/
Projected: CMIP5
Available from:
https://pcmdi.llnl.gov/
mips/cmip5
3 Temperature
threshold for labour
productivity
Projected number of days
when temperature exceeds
>34°C
Directly
proportionat
e
According to the International
Labour Organization, excessive
heat during work creates
occupational health risks; it
restricts a worker’s physical
functions and capabilities, work
capacity and productivity.
Temperatures above 24–26°C
are associated with reduced
labour productivity. At 33–34°C,
a worker operating at moderate
work intensity loses 50 per cent
of his or her work capacity.
ILO (2019) Baseline: ERA5
Available from:
https://www.ecmwf.int
/
Projected: CMIP5
Available from:
https://pcmdi.llnl.gov/
mips/cmip5
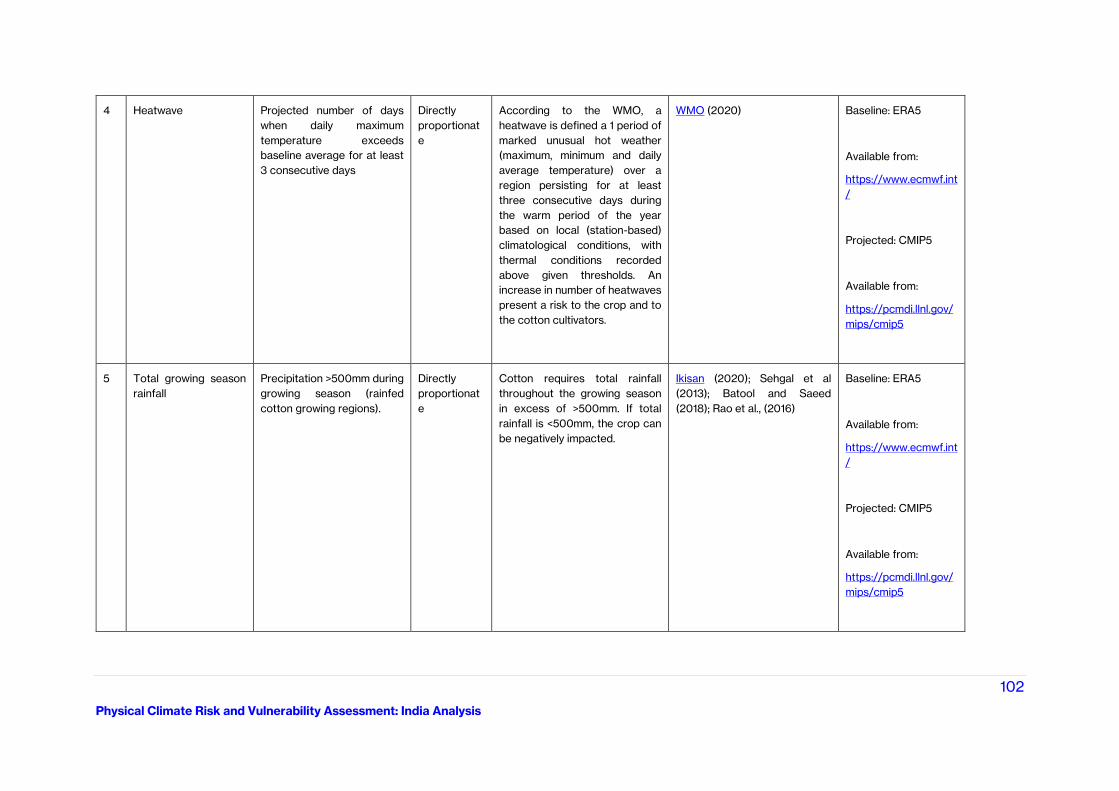
102
Physical Climate Risk and Vulnerability Assessment: India Analysis
4 Heatwave Projected number of days
when daily maximum
temperature exceeds
baseline average for at least
3 consecutive days
Directly
proportionat
e
According to the WMO, a
heatwave is defined a 1 period of
marked unusual hot weather
(maximum, minimum and daily
average temperature) over a
region persisting for at least
three consecutive days during
the warm period of the year
based on local (station-based)
climatological conditions, with
thermal conditions recorded
above given thresholds. An
increase in number of heatwaves
present a risk to the crop and to
the cotton cultivators.
WMO (2020) Baseline: ERA5
Available from:
https://www.ecmwf.int
/
Projected: CMIP5
Available from:
https://pcmdi.llnl.gov/
mips/cmip5
5 Total growing season
rainfall
Precipitation >500mm during
growing season (rainfed
cotton growing regions).
Directly
proportionat
e
Cotton requires total rainfall
throughout the growing season
in excess of >500mm. If total
rainfall is <500mm, the crop can
be negatively impacted.
Ikisan (2020); Sehgal et al
(2013); Batool and Saeed
(2018); Rao et al., (2016)
Baseline: ERA5
Available from:
https://www.ecmwf.int
/
Projected: CMIP5
Available from:
https://pcmdi.llnl.gov/
mips/cmip5
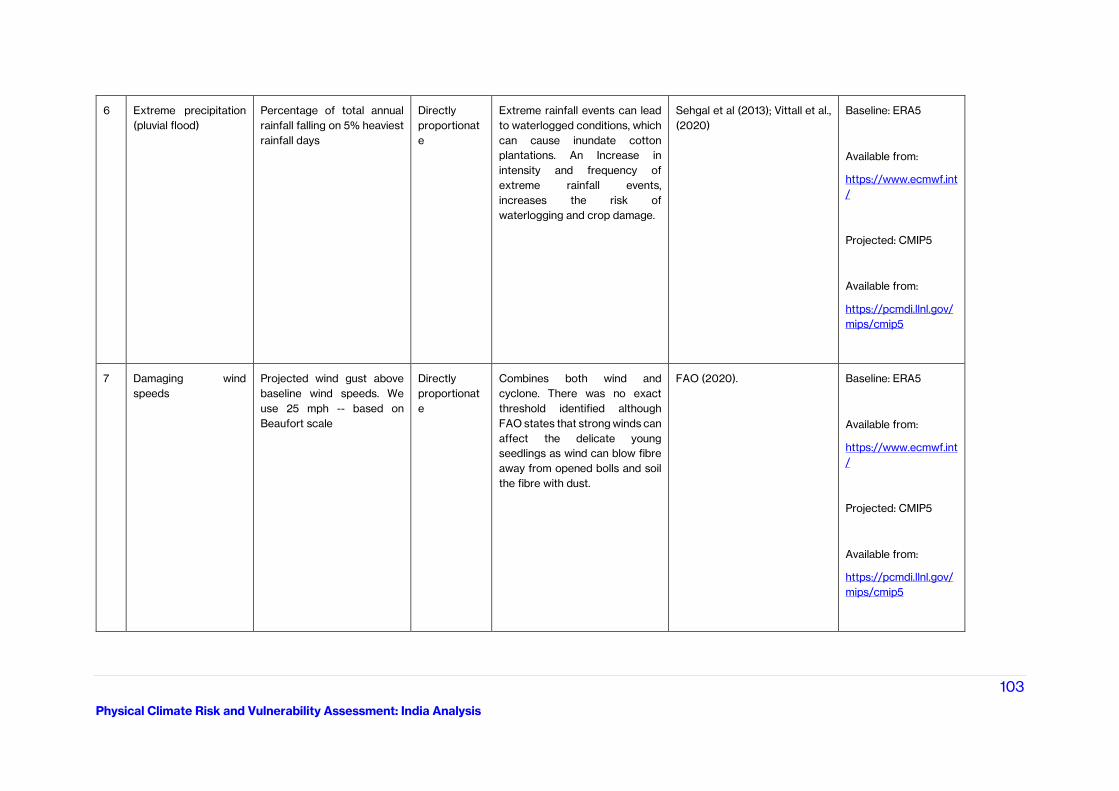
103
Physical Climate Risk and Vulnerability Assessment: India Analysis
6 Extreme precipitation
(pluvial flood)
Percentage of total annual
rainfall falling on 5% heaviest
rainfall days
Directly
proportionat
e
Extreme rainfall events can lead
to waterlogged conditions, which
can cause inundate cotton
plantations. An Increase in
intensity and frequency of
extreme rainfall events,
increases the risk of
waterlogging and crop damage.
Sehgal et al (2013); Vittall et al.,
(2020)
Baseline: ERA5
Available from:
https://www.ecmwf.int
/
Projected: CMIP5
Available from:
https://pcmdi.llnl.gov/
mips/cmip5
7 Damaging wind
speeds
Projected wind gust above
baseline wind speeds. We
use 25 mph -- based on
Beaufort scale
Directly
proportionat
e
Combines both wind and
cyclone. There was no exact
threshold identified although
FAO states that strong winds can
affect the delicate young
seedlings as wind can blow fibre
away from opened bolls and soil
the fibre with dust.
FAO (2020). Baseline: ERA5
Available from:
https://www.ecmwf.int
/
Projected: CMIP5
Available from:
https://pcmdi.llnl.gov/
mips/cmip5
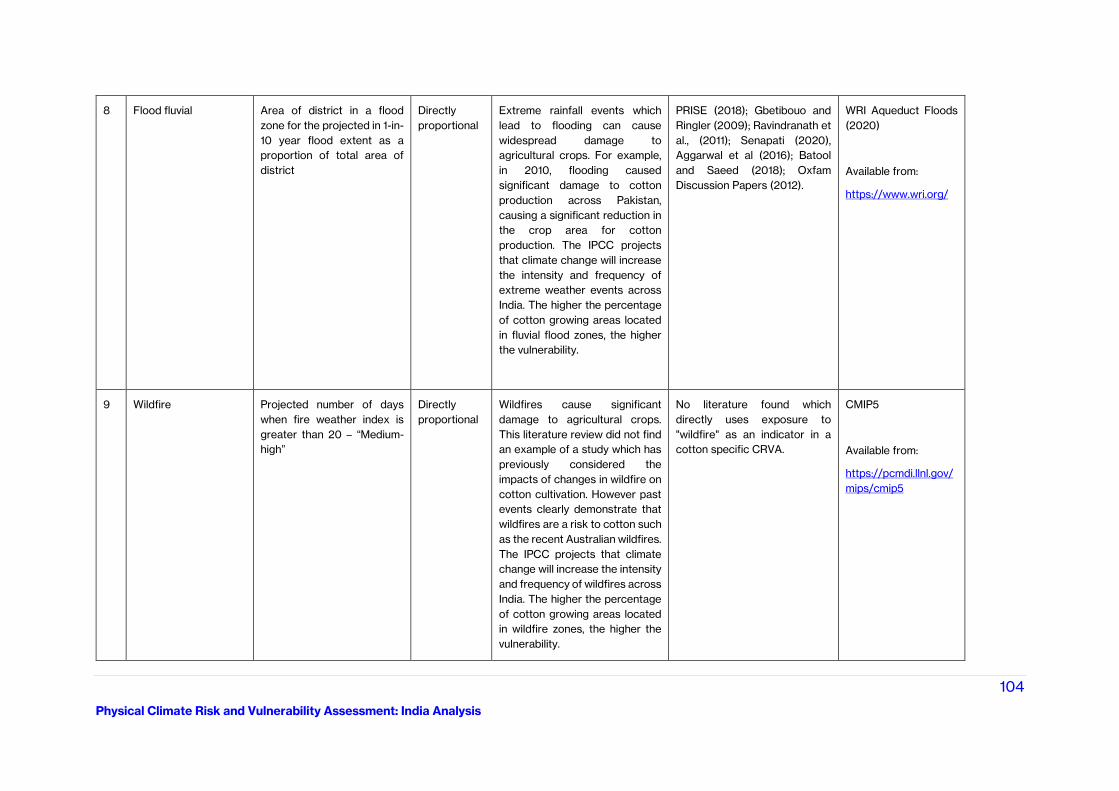
104
Physical Climate Risk and Vulnerability Assessment: India Analysis
8 Flood fluvial Area of district in a flood
zone for the projected in 1-in-
10 year flood extent as a
proportion of total area of
district
Directly
proportional
Extreme rainfall events which
lead to flooding can cause
widespread damage to
agricultural crops. For example,
in 2010, flooding caused
significant damage to cotton
production across Pakistan,
causing a significant reduction in
the crop area for cotton
production. The IPCC projects
that climate change will increase
the intensity and frequency of
extreme weather events across
India. The higher the percentage
of cotton growing areas located
in fluvial flood zones, the higher
the vulnerability.
PRISE (2018); Gbetibouo and
Ringler (2009); Ravindranath et
al., (2011); Senapati (2020),
Aggarwal et al (2016); Batool
and Saeed (2018); Oxfam
Discussion Papers (2012).
WRI Aqueduct Floods
(2020)
Available from:
https://www.wri.org/
9 Wildfire Projected number of days
when fire weather index is
greater than 20 – “Medium-
high”
Directly
proportional
Wildfires cause significant
damage to agricultural crops.
This literature review did not find
an example of a study which has
previously considered the
impacts of changes in wildfire on
cotton cultivation. However past
events clearly demonstrate that
wildfires are a risk to cotton such
as the recent Australian wildfires.
The IPCC projects that climate
change will increase the intensity
and frequency of wildfires across
India. The higher the percentage
of cotton growing areas located
in wildfire zones, the higher the
vulnerability.
No literature found which
directly uses exposure to
"wildfire" as an indicator in a
cotton specific CRVA.
CMIP5
Available from:
https://pcmdi.llnl.gov/
mips/cmip5
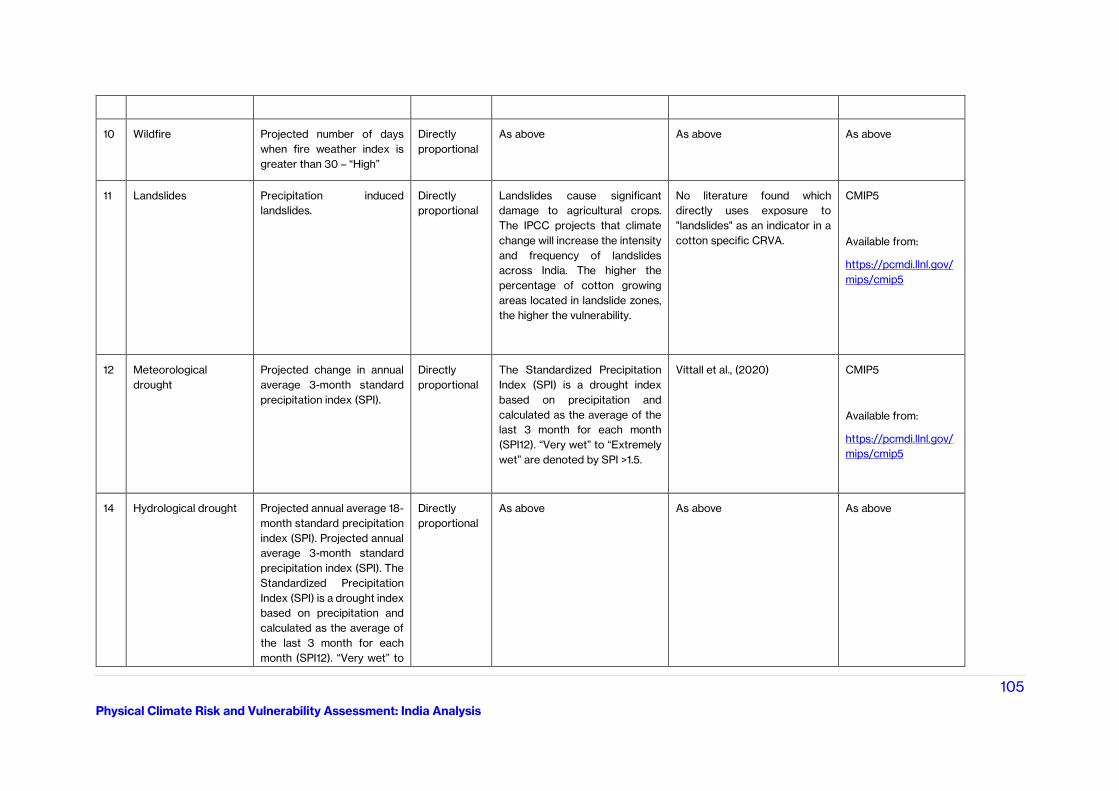
105
Physical Climate Risk and Vulnerability Assessment: India Analysis
10 Wildfire Projected number of days
when fire weather index is
greater than 30 – “High”
Directly
proportional
As above As above As above
11 Landslides Precipitation induced
landslides.
Directly
proportional
Landslides cause significant
damage to agricultural crops.
The IPCC projects that climate
change will increase the intensity
and frequency of landslides
across India. The higher the
percentage of cotton growing
areas located in landslide zones,
the higher the vulnerability.
No literature found which
directly uses exposure to
"landslides" as an indicator in a
cotton specific CRVA.
CMIP5
Available from:
https://pcmdi.llnl.gov/
mips/cmip5
12 Meteorological
drought
Projected change in annual
average 3-month standard
precipitation index (SPI).
Directly
proportional
The Standardized Precipitation
Index (SPI) is a drought index
based on precipitation and
calculated as the average of the
last 3 month for each month
(SPI12). “Very wet” to “Extremely
wet” are denoted by SPI >1.5.
Vittall et al., (2020) CMIP5
Available from:
https://pcmdi.llnl.gov/
mips/cmip5
14 Hydrological drought Projected annual average 18-
month standard precipitation
index (SPI). Projected annual
average 3-month standard
precipitation index (SPI). The
Standardized Precipitation
Index (SPI) is a drought index
based on precipitation and
calculated as the average of
the last 3 month for each
month (SPI12). “Very wet” to
Directly
proportional
As above As above As above
106
Physical Climate Risk and Vulnerability Assessment: India Analysis
“Extremely wet” are denoted
by SPI >1.5.
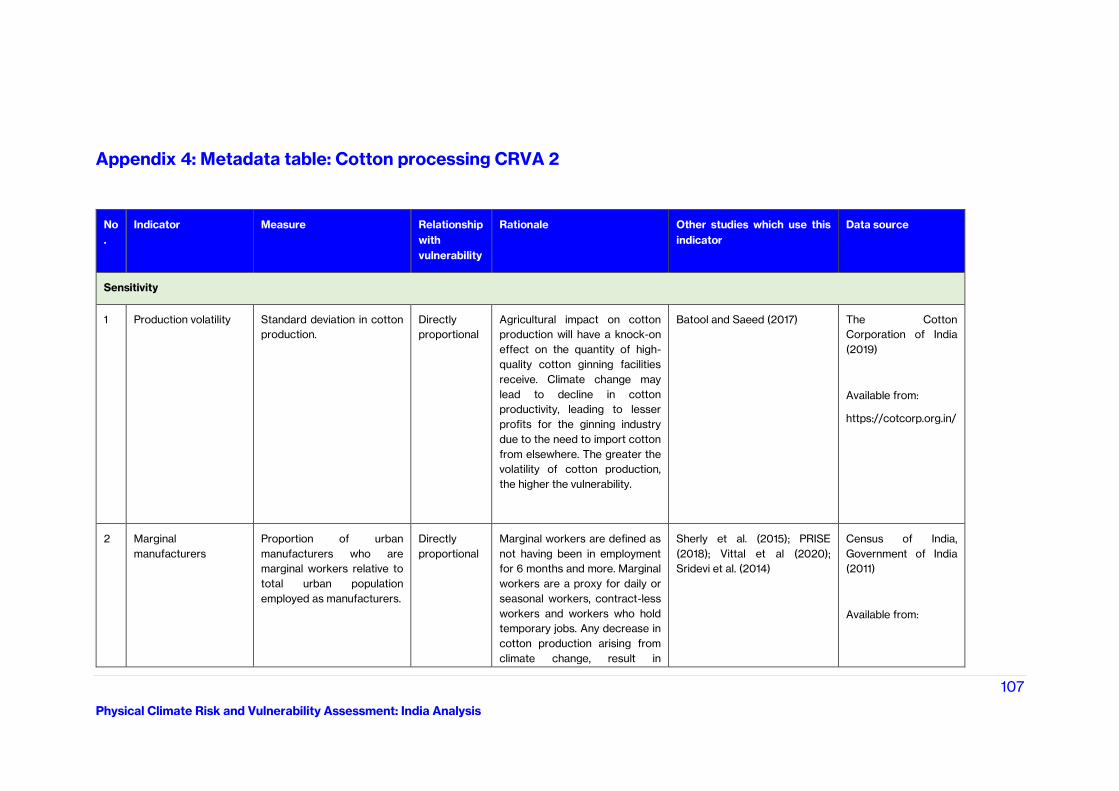
107
Physical Climate Risk and Vulnerability Assessment: India Analysis
Appendix 4: Metadata table: Cotton processing CRVA 2
No
.
Indicator Measure Relationship
with
vulnerability
Rationale Other studies which use this
indicator
Data source
Sensitivity
1 Production volatility Standard deviation in cotton
production.
Directly
proportional
Agricultural impact on cotton
production will have a knock-on
effect on the quantity of high-
quality cotton ginning facilities
receive. Climate change may
lead to decline in cotton
productivity, leading to lesser
profits for the ginning industry
due to the need to import cotton
from elsewhere. The greater the
volatility of cotton production,
the higher the vulnerability.
Batool and Saeed (2017) The Cotton
Corporation of India
(2019)
Available from:
https://cotcorp.org.in/
2 Marginal
manufacturers
Proportion of urban
manufacturers who are
marginal workers relative to
total urban population
employed as manufacturers.
Directly
proportional
Marginal workers are defined as
not having been in employment
for 6 months and more. Marginal
workers are a proxy for daily or
seasonal workers, contract-less
workers and workers who hold
temporary jobs. Any decrease in
cotton production arising from
climate change, result in
Sherly et al. (2015); PRISE
(2018); Vittal et al (2020);
Sridevi et al. (2014)
Census of India,
Government of India
(2011)
Available from:
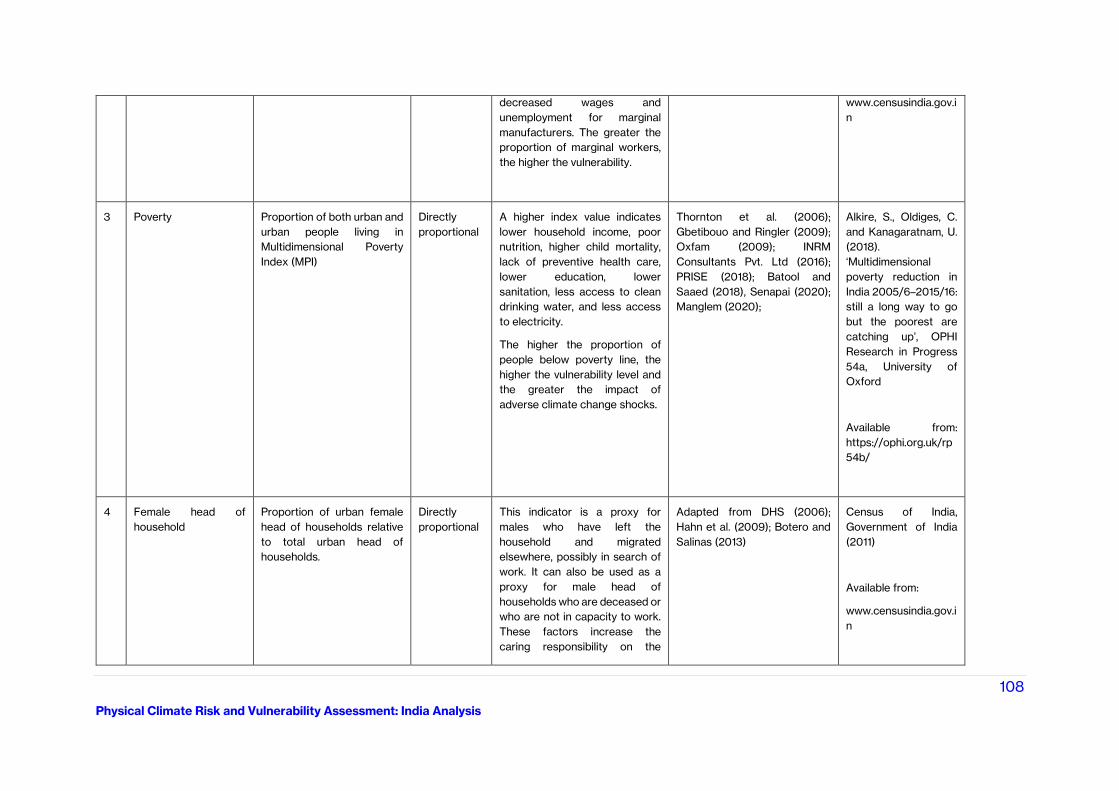
108
Physical Climate Risk and Vulnerability Assessment: India Analysis
decreased wages and
unemployment for marginal
manufacturers. The greater the
proportion of marginal workers,
the higher the vulnerability.
www.censusindia.gov.i
n
3 Poverty Proportion of both urban and
urban people living in
Multidimensional Poverty
Index (MPI)
Directly
proportional
A higher index value indicates
lower household income, poor
nutrition, higher child mortality,
lack of preventive health care,
lower education, lower
sanitation, less access to clean
drinking water, and less access
to electricity.
The higher the proportion of
people below poverty line, the
higher the vulnerability level and
the greater the impact of
adverse climate change shocks.
Thornton et al. (2006);
Gbetibouo and Ringler (2009);
Oxfam (2009); INRM
Consultants Pvt. Ltd (2016);
PRISE (2018); Batool and
Saaed (2018), Senapai (2020);
Manglem (2020);
Alkire, S., Oldiges, C.
and Kanagaratnam, U.
(2018).
‘Multidimensional
poverty reduction in
India 2005/6–2015/16:
still a long way to go
but the poorest are
catching up’, OPHI
Research in Progress
54a, University of
Oxford
Available from:
https://ophi.org.uk/rp
54b/
4 Female head of
household
Proportion of urban female
head of households relative
to total urban head of
households.
Directly
proportional
This indicator is a proxy for
males who have left the
household and migrated
elsewhere, possibly in search of
work. It can also be used as a
proxy for male head of
households who are deceased or
who are not in capacity to work.
These factors increase the
caring responsibility on the
Adapted from DHS (2006);
Hahn et al. (2009); Botero and
Salinas (2013)
Census of India,
Government of India
(2011)
Available from:
www.censusindia.gov.i
n
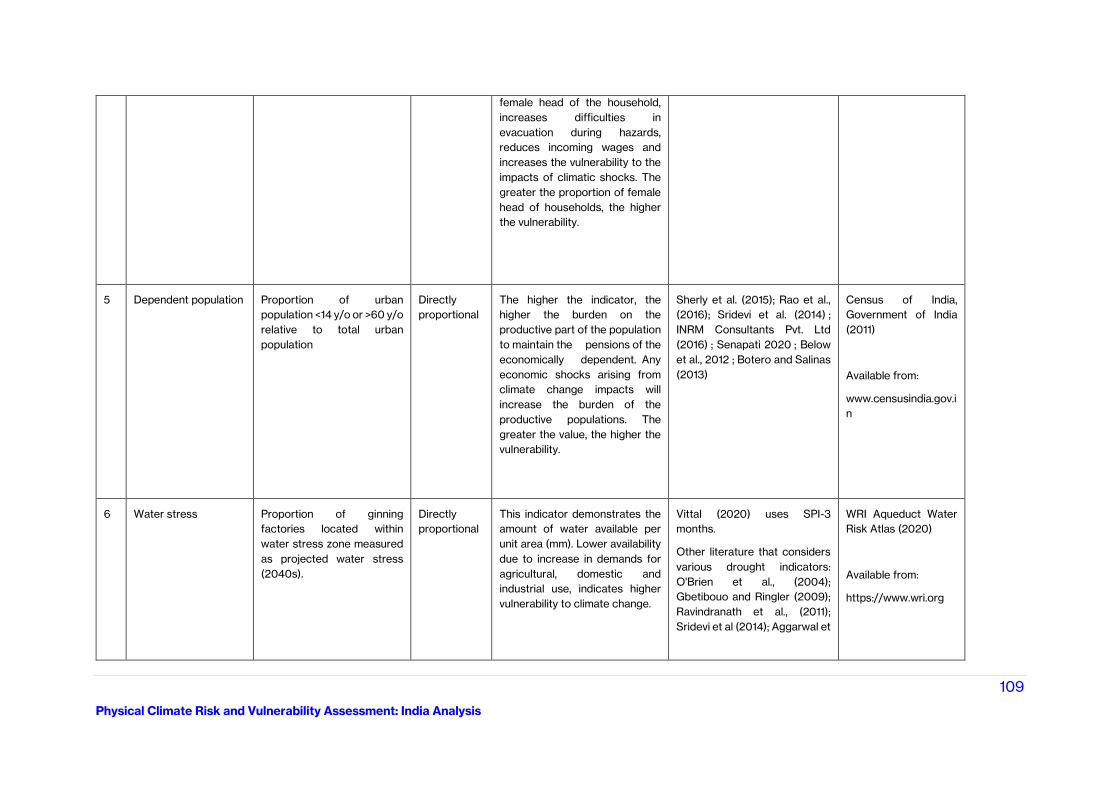
109
Physical Climate Risk and Vulnerability Assessment: India Analysis
female head of the household,
increases difficulties in
evacuation during hazards,
reduces incoming wages and
increases the vulnerability to the
impacts of climatic shocks. The
greater the proportion of female
head of households, the higher
the vulnerability.
5 Dependent population Proportion of urban
population <14 y/o or >60 y/o
relative to total urban
population
Directly
proportional
The higher the indicator, the
higher the burden on the
productive part of the population
to maintain the pensions of the
economically dependent. Any
economic shocks arising from
climate change impacts will
increase the burden of the
productive populations. The
greater the value, the higher the
vulnerability.
Sherly et al. (2015); Rao et al.,
(2016); Sridevi et al. (2014) ;
INRM Consultants Pvt. Ltd
(2016) ; Senapati 2020 ; Below
et al., 2012 ; Botero and Salinas
(2013)
Census of India,
Government of India
(2011)
Available from:
www.censusindia.gov.i
n
6 Water stress Proportion of ginning
factories located within
water stress zone measured
as projected water stress
(2040s).
Directly
proportional
This indicator demonstrates the
amount of water available per
unit area (mm). Lower availability
due to increase in demands for
agricultural, domestic and
industrial use, indicates higher
vulnerability to climate change.
Vittal (2020) uses SPI-3
months.
Other literature that considers
various drought indicators:
O'Brien et al., (2004);
Gbetibouo and Ringler (2009);
Ravindranath et al., (2011);
Sridevi et al (2014); Aggarwal et
WRI Aqueduct Water
Risk Atlas (2020)
Available from:
https://www.wri.org
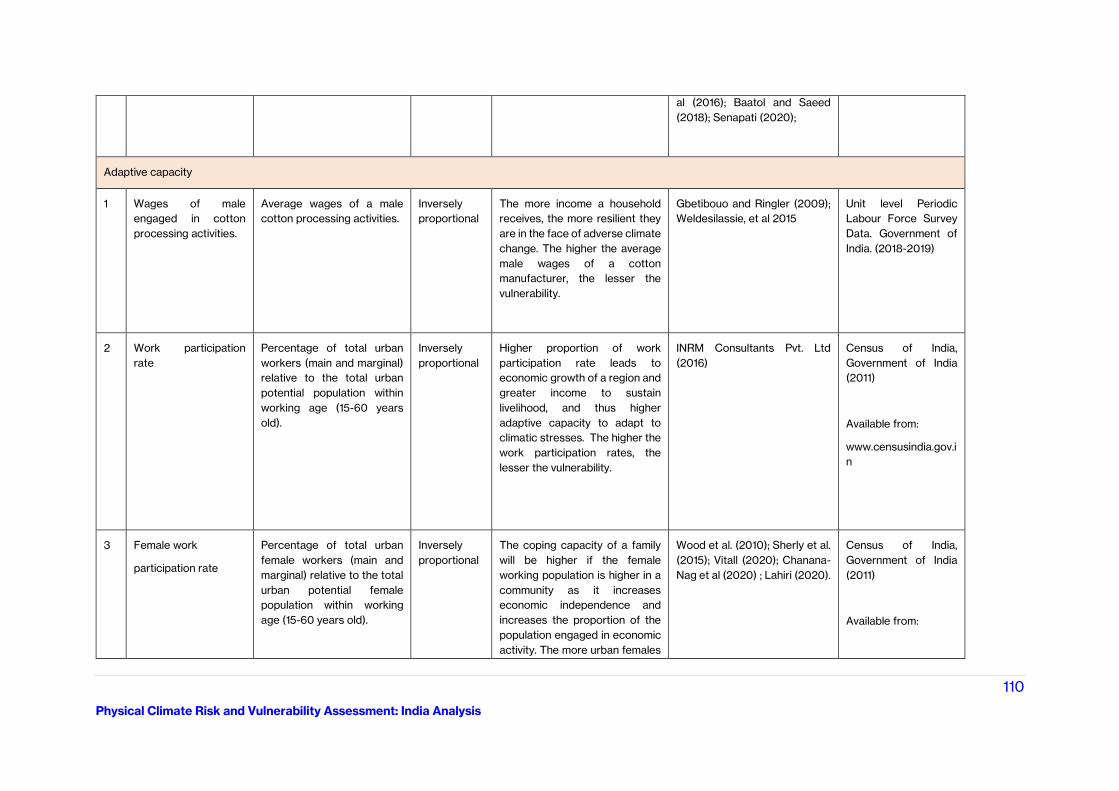
110
Physical Climate Risk and Vulnerability Assessment: India Analysis
al (2016); Baatol and Saeed
(2018); Senapati (2020);
Adaptive capacity
1 Wages of male
engaged in cotton
processing activities.
Average wages of a male
cotton processing activities.
Inversely
proportional
The more income a household
receives, the more resilient they
are in the face of adverse climate
change. The higher the average
male wages of a cotton
manufacturer, the lesser the
vulnerability.
Gbetibouo and Ringler (2009);
Weldesilassie, et al 2015
Unit level Periodic
Labour Force Survey
Data. Government of
India. (2018-2019)
2 Work participation
rate
Percentage of total urban
workers (main and marginal)
relative to the total urban
potential population within
working age (15-60 years
old).
Inversely
proportional
Higher proportion of work
participation rate leads to
economic growth of a region and
greater income to sustain
livelihood, and thus higher
adaptive capacity to adapt to
climatic stresses. The higher the
work participation rates, the
lesser the vulnerability.
INRM Consultants Pvt. Ltd
(2016)
Census of India,
Government of India
(2011)
Available from:
www.censusindia.gov.i
n
3 Female work
participation rate
Percentage of total urban
female workers (main and
marginal) relative to the total
urban potential female
population within working
age (15-60 years old).
Inversely
proportional
The coping capacity of a family
will be higher if the female
working population is higher in a
community as it increases
economic independence and
increases the proportion of the
population engaged in economic
activity. The more urban females
Wood et al. (2010); Sherly et al.
(2015); Vitall (2020); Chanana-
Nag et al (2020) ; Lahiri (2020).
Census of India,
Government of India
(2011)
Available from:
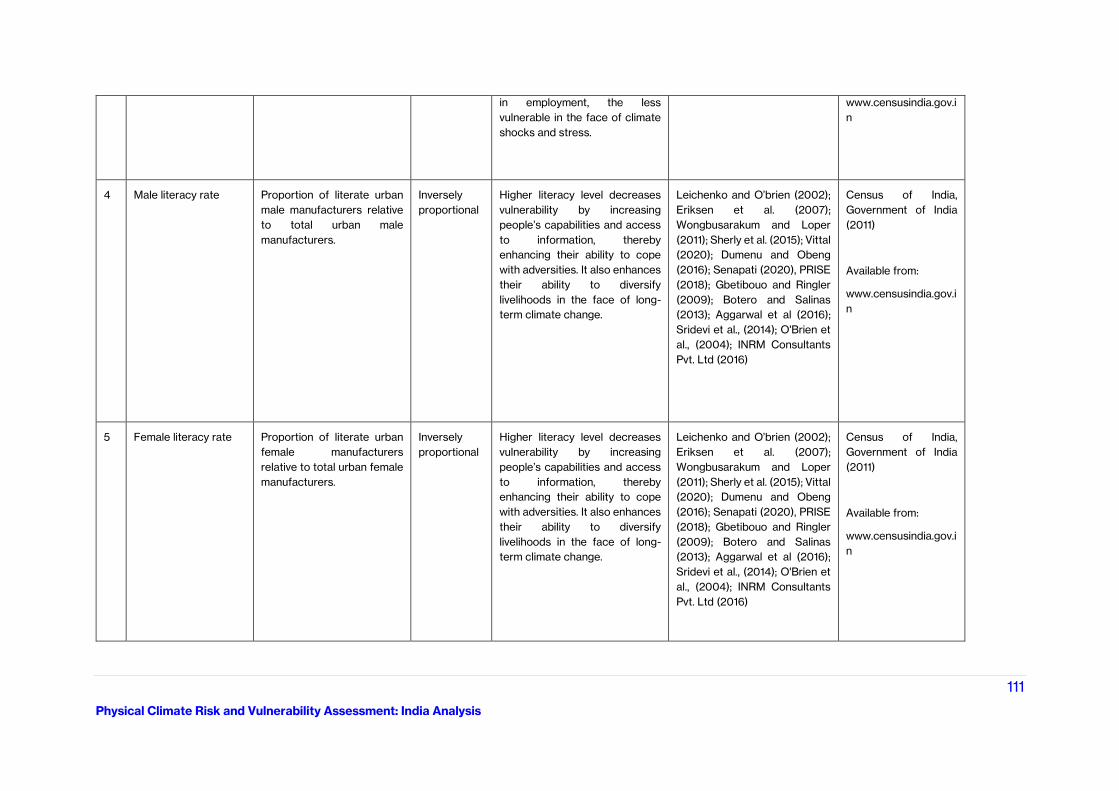
111
Physical Climate Risk and Vulnerability Assessment: India Analysis
in employment, the less
vulnerable in the face of climate
shocks and stress.
www.censusindia.gov.i
n
4 Male literacy rate Proportion of literate urban
male manufacturers relative
to total urban male
manufacturers.
Inversely
proportional
Higher literacy level decreases
vulnerability by increasing
people’s capabilities and access
to information, thereby
enhancing their ability to cope
with adversities. It also enhances
their ability to diversify
livelihoods in the face of long-
term climate change.
Leichenko and O’brien (2002);
Eriksen et al. (2007);
Wongbusarakum and Loper
(2011); Sherly et al. (2015); Vittal
(2020); Dumenu and Obeng
(2016); Senapati (2020), PRISE
(2018); Gbetibouo and Ringler
(2009); Botero and Salinas
(2013); Aggarwal et al (2016);
Sridevi et al., (2014); O'Brien et
al., (2004); INRM Consultants
Pvt. Ltd (2016)
Census of India,
Government of India
(2011)
Available from:
www.censusindia.gov.i
n
5 Female literacy rate Proportion of literate urban
female manufacturers
relative to total urban female
manufacturers.
Inversely
proportional
Higher literacy level decreases
vulnerability by increasing
people’s capabilities and access
to information, thereby
enhancing their ability to cope
with adversities. It also enhances
their ability to diversify
livelihoods in the face of long-
term climate change.
Leichenko and O’brien (2002);
Eriksen et al. (2007);
Wongbusarakum and Loper
(2011); Sherly et al. (2015); Vittal
(2020); Dumenu and Obeng
(2016); Senapati (2020), PRISE
(2018); Gbetibouo and Ringler
(2009); Botero and Salinas
(2013); Aggarwal et al (2016);
Sridevi et al., (2014); O'Brien et
al., (2004); INRM Consultants
Pvt. Ltd (2016)
Census of India,
Government of India
(2011)
Available from:
www.censusindia.gov.i
n
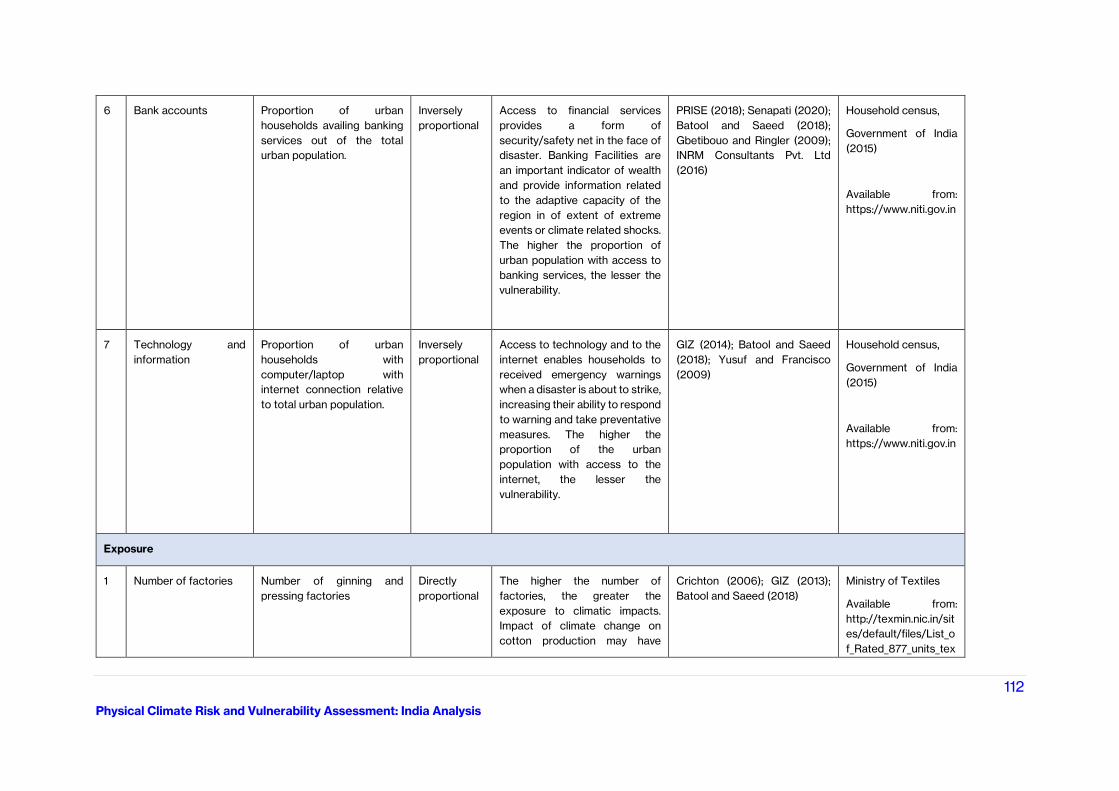
112
Physical Climate Risk and Vulnerability Assessment: India Analysis
6 Bank accounts Proportion of urban
households availing banking
services out of the total
urban population.
Inversely
proportional
Access to financial services
provides a form of
security/safety net in the face of
disaster. Banking Facilities are
an important indicator of wealth
and provide information related
to the adaptive capacity of the
region in of extent of extreme
events or climate related shocks.
The higher the proportion of
urban population with access to
banking services, the lesser the
vulnerability.
PRISE (2018); Senapati (2020);
Batool and Saeed (2018);
Gbetibouo and Ringler (2009);
INRM Consultants Pvt. Ltd
(2016)
Household census,
Government of India
(2015)
Available from:
https://www.niti.gov.in
7 Technology and
information
Proportion of urban
households with
computer/laptop with
internet connection relative
to total urban population.
Inversely
proportional
Access to technology and to the
internet enables households to
received emergency warnings
when a disaster is about to strike,
increasing their ability to respond
to warning and take preventative
measures. The higher the
proportion of the urban
population with access to the
internet, the lesser the
vulnerability.
GIZ (2014); Batool and Saeed
(2018); Yusuf and Francisco
(2009)
Household census,
Government of India
(2015)
Available from:
https://www.niti.gov.in
Exposure
1 Number of factories Number of ginning and
pressing factories
Directly
proportional
The higher the number of
factories, the greater the
exposure to climatic impacts.
Impact of climate change on
cotton production may have
Crichton (2006); GIZ (2013);
Batool and Saeed (2018)
Ministry of Textiles
Available from:
http://texmin.nic.in/sit
es/default/files/List_o
f_Rated_877_units_tex
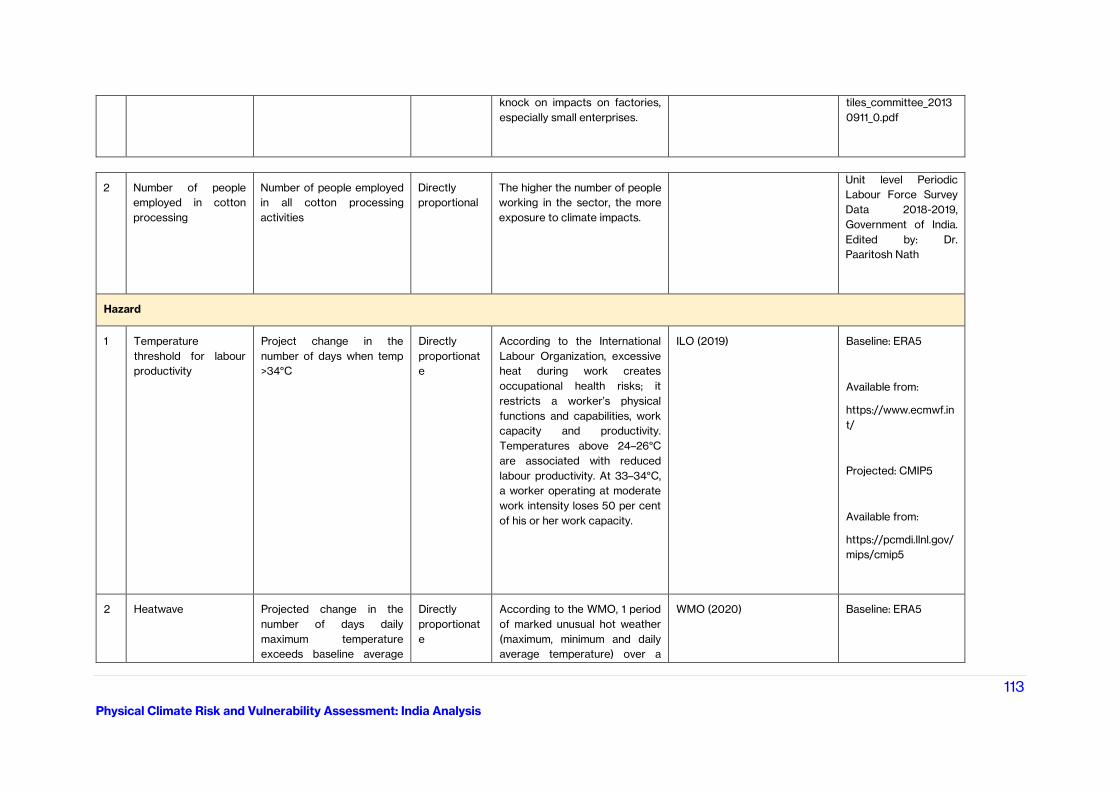
113
Physical Climate Risk and Vulnerability Assessment: India Analysis
knock on impacts on factories,
especially small enterprises.
tiles_committee_2013
0911_0.pdf
2 Number of people
employed in cotton
processing
Number of people employed
in all cotton processing
activities
Directly
proportional
The higher the number of people
working in the sector, the more
exposure to climate impacts.
Unit level Periodic
Labour Force Survey
Data 2018-2019,
Government of India.
Edited by: Dr.
Paaritosh Nath
Hazard
1 Temperature
threshold for labour
productivity
Project change in the
number of days when temp
>34°C
Directly
proportionat
e
According to the International
Labour Organization, excessive
heat during work creates
occupational health risks; it
restricts a worker’s physical
functions and capabilities, work
capacity and productivity.
Temperatures above 24–26°C
are associated with reduced
labour productivity. At 33–34°C,
a worker operating at moderate
work intensity loses 50 per cent
of his or her work capacity.
ILO (2019) Baseline: ERA5
Available from:
https://www.ecmwf.in
t/
Projected: CMIP5
Available from:
https://pcmdi.llnl.gov/
mips/cmip5
2 Heatwave Projected change in the
number of days daily
maximum temperature
exceeds baseline average
Directly
proportionat
e
According to the WMO, 1 period
of marked unusual hot weather
(maximum, minimum and daily
average temperature) over a
WMO (2020) Baseline: ERA5
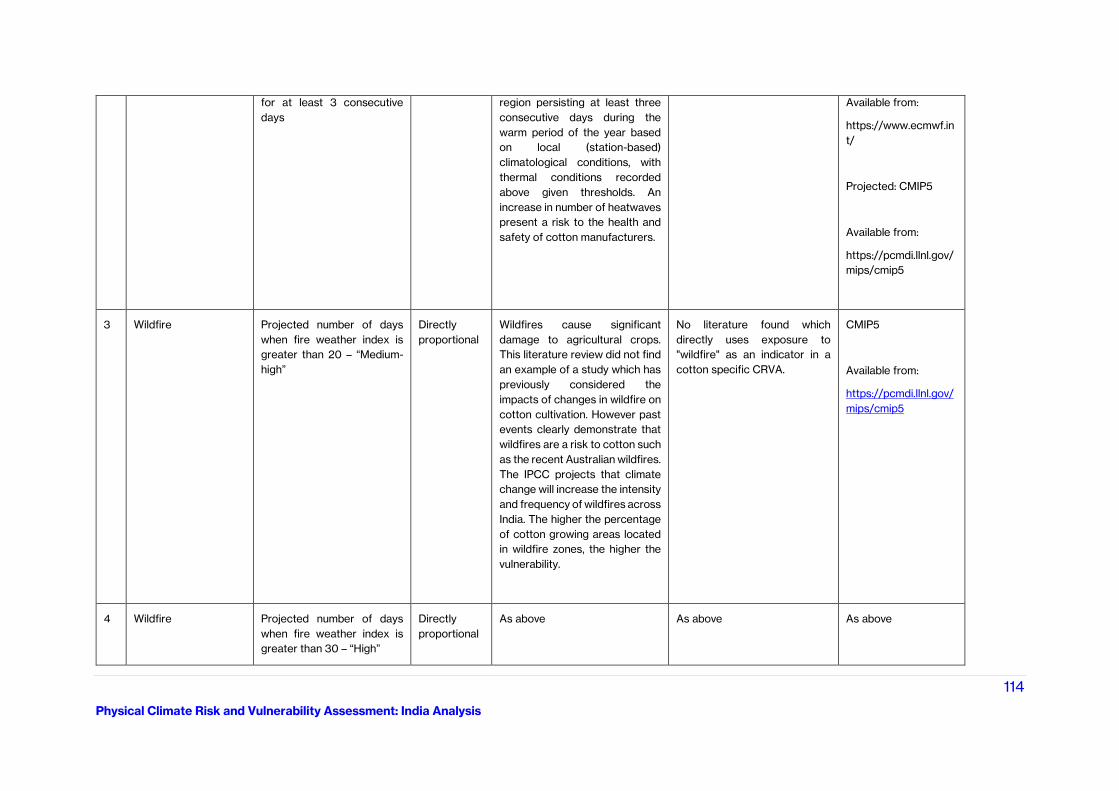
114
Physical Climate Risk and Vulnerability Assessment: India Analysis
for at least 3 consecutive
days
region persisting at least three
consecutive days during the
warm period of the year based
on local (station-based)
climatological conditions, with
thermal conditions recorded
above given thresholds. An
increase in number of heatwaves
present a risk to the health and
safety of cotton manufacturers.
Available from:
https://www.ecmwf.in
t/
Projected: CMIP5
Available from:
https://pcmdi.llnl.gov/
mips/cmip5
3 Wildfire Projected number of days
when fire weather index is
greater than 20 – “Medium-
high”
Directly
proportional
Wildfires cause significant
damage to agricultural crops.
This literature review did not find
an example of a study which has
previously considered the
impacts of changes in wildfire on
cotton cultivation. However past
events clearly demonstrate that
wildfires are a risk to cotton such
as the recent Australian wildfires.
The IPCC projects that climate
change will increase the intensity
and frequency of wildfires across
India. The higher the percentage
of cotton growing areas located
in wildfire zones, the higher the
vulnerability.
No literature found which
directly uses exposure to
"wildfire" as an indicator in a
cotton specific CRVA.
CMIP5
Available from:
https://pcmdi.llnl.gov/
mips/cmip5
4 Wildfire Projected number of days
when fire weather index is
greater than 30 – “High”
Directly
proportional
As above As above As above
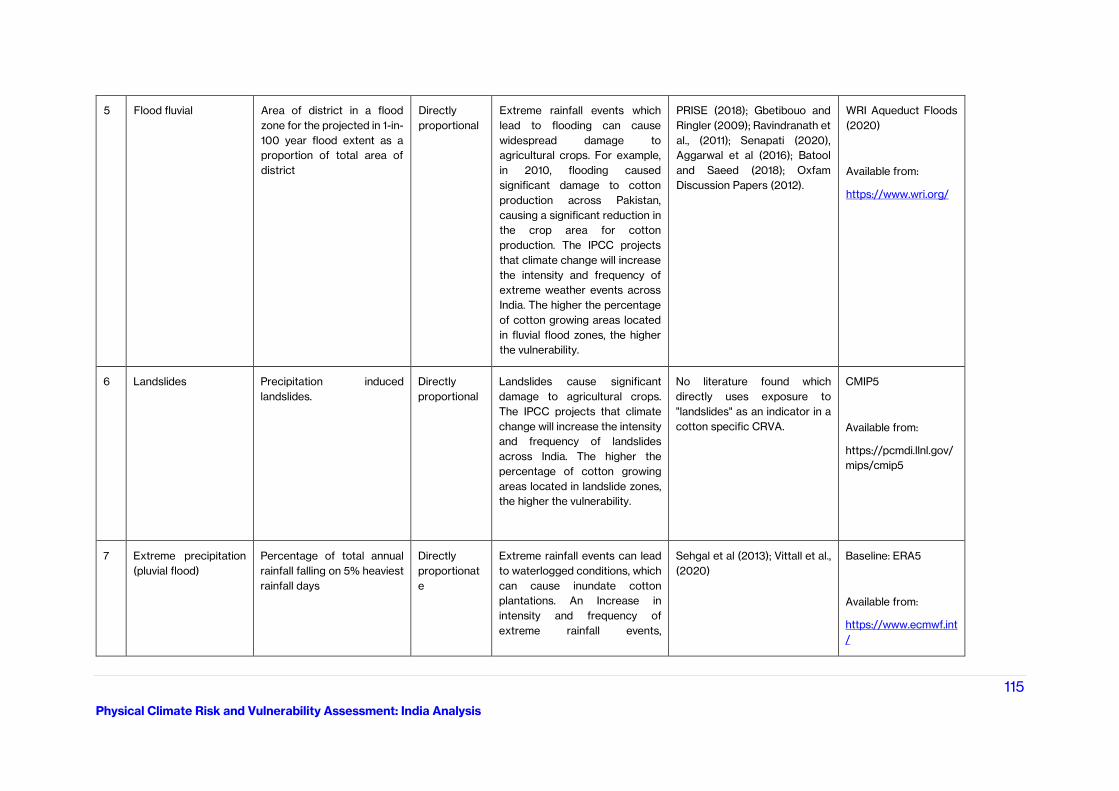
115
Physical Climate Risk and Vulnerability Assessment: India Analysis
5 Flood fluvial Area of district in a flood
zone for the projected in 1-in-
100 year flood extent as a
proportion of total area of
district
Directly
proportional
Extreme rainfall events which
lead to flooding can cause
widespread damage to
agricultural crops. For example,
in 2010, flooding caused
significant damage to cotton
production across Pakistan,
causing a significant reduction in
the crop area for cotton
production. The IPCC projects
that climate change will increase
the intensity and frequency of
extreme weather events across
India. The higher the percentage
of cotton growing areas located
in fluvial flood zones, the higher
the vulnerability.
PRISE (2018); Gbetibouo and
Ringler (2009); Ravindranath et
al., (2011); Senapati (2020),
Aggarwal et al (2016); Batool
and Saeed (2018); Oxfam
Discussion Papers (2012).
WRI Aqueduct Floods
(2020)
Available from:
https://www.wri.org/
6 Landslides Precipitation induced
landslides.
Directly
proportional
Landslides cause significant
damage to agricultural crops.
The IPCC projects that climate
change will increase the intensity
and frequency of landslides
across India. The higher the
percentage of cotton growing
areas located in landslide zones,
the higher the vulnerability.
No literature found which
directly uses exposure to
"landslides" as an indicator in a
cotton specific CRVA.
CMIP5
Available from:
https://pcmdi.llnl.gov/
mips/cmip5
7 Extreme precipitation
(pluvial flood)
Percentage of total annual
rainfall falling on 5% heaviest
rainfall days
Directly
proportionat
e
Extreme rainfall events can lead
to waterlogged conditions, which
can cause inundate cotton
plantations. An Increase in
intensity and frequency of
extreme rainfall events,
Sehgal et al (2013); Vittall et al.,
(2020)
Baseline: ERA5
Available from:
https://www.ecmwf.int
/
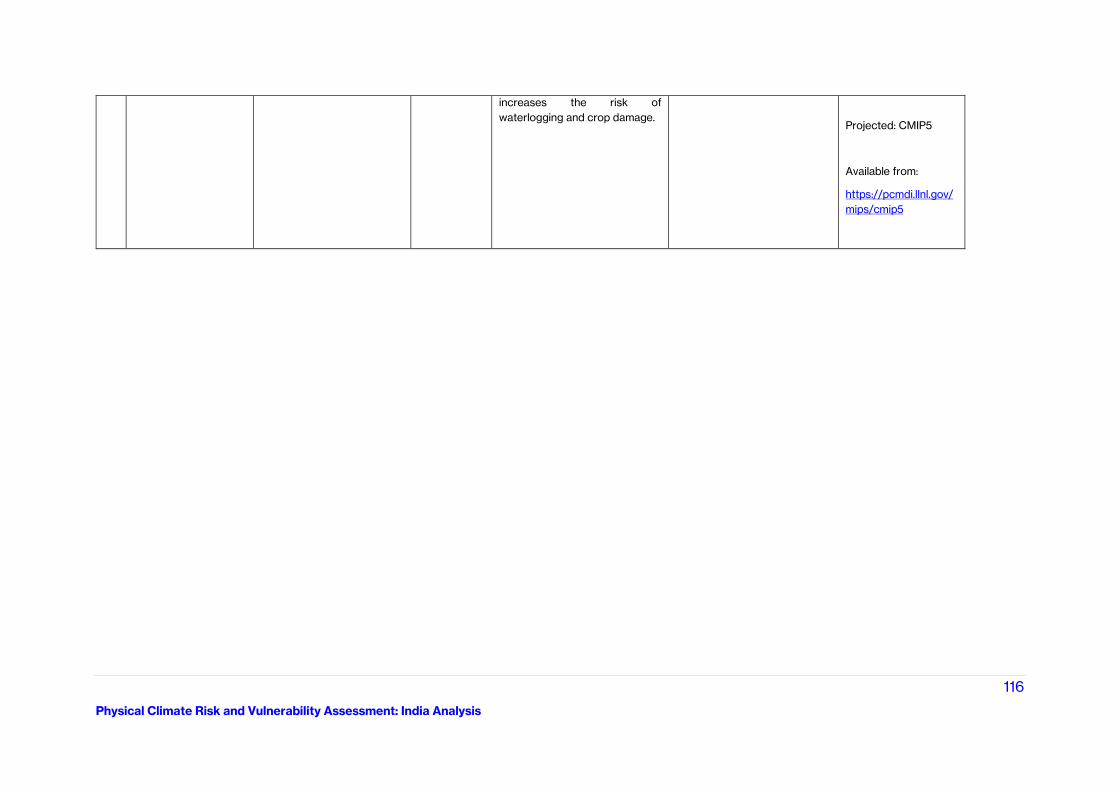
116
Physical Climate Risk and Vulnerability Assessment: India Analysis
increases the risk of
waterlogging and crop damage.
Projected: CMIP5
Available from:
https://pcmdi.llnl.gov/
mips/cmip5
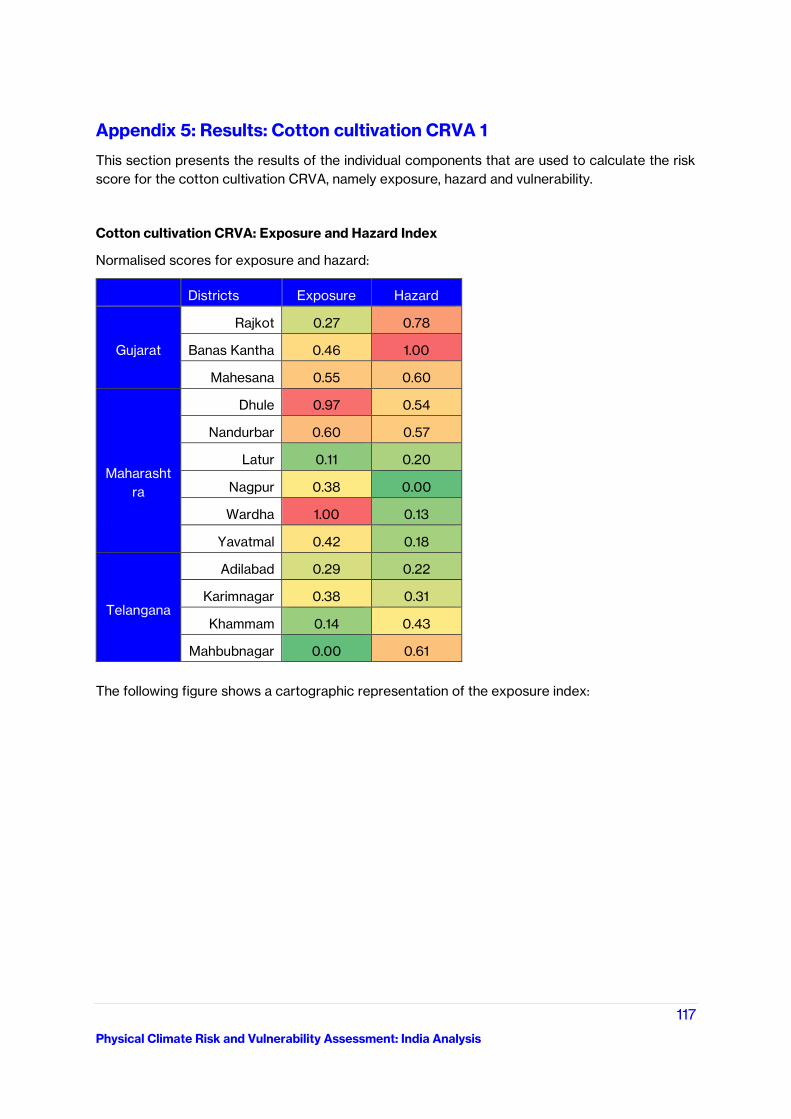
117
Physical Climate Risk and Vulnerability Assessment: India Analysis
Appendix 5: Results: Cotton cultivation CRVA 1
This section presents the results of the individual components that are used to calculate the risk
score for the cotton cultivation CRVA, namely exposure, hazard and vulnerability.
Cotton cultivation CRVA: Exposure and Hazard Index
Normalised scores for exposure and hazard:
Districts Exposure Hazard
Gujarat
Rajkot 0.27 0.78
Banas Kantha 0.46 1.00
Mahesana 0.55 0.60
Maharasht
ra
Dhule 0.97 0.54
Nandurbar 0.60 0.57
Latur 0.11 0.20
Nagpur 0.38 0.00
Wardha 1.00 0.13
Yavatmal 0.42 0.18
Telangana
Adilabad 0.29 0.22
Karimnagar 0.38 0.31
Khammam 0.14 0.43
Mahbubnagar 0.00 0.61
The following figure shows a cartographic representation of the exposure index:
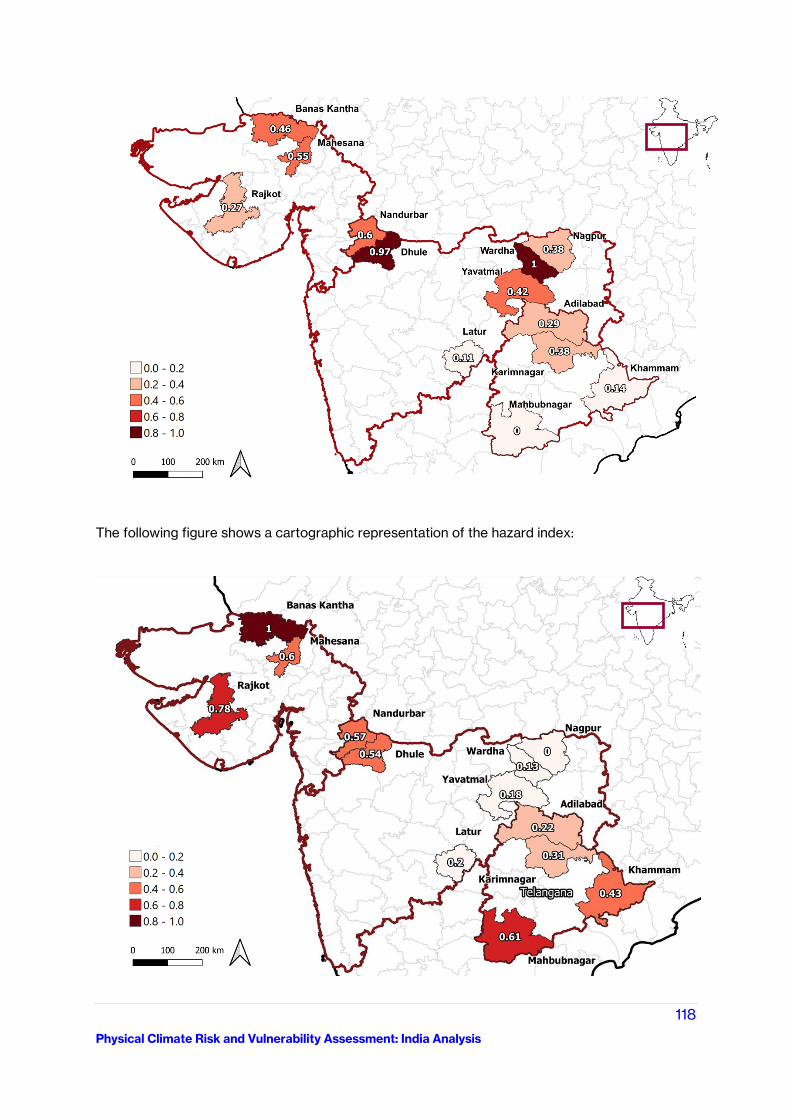
118
Physical Climate Risk and Vulnerability Assessment: India Analysis
The following figure shows a cartographic representation of the hazard index:
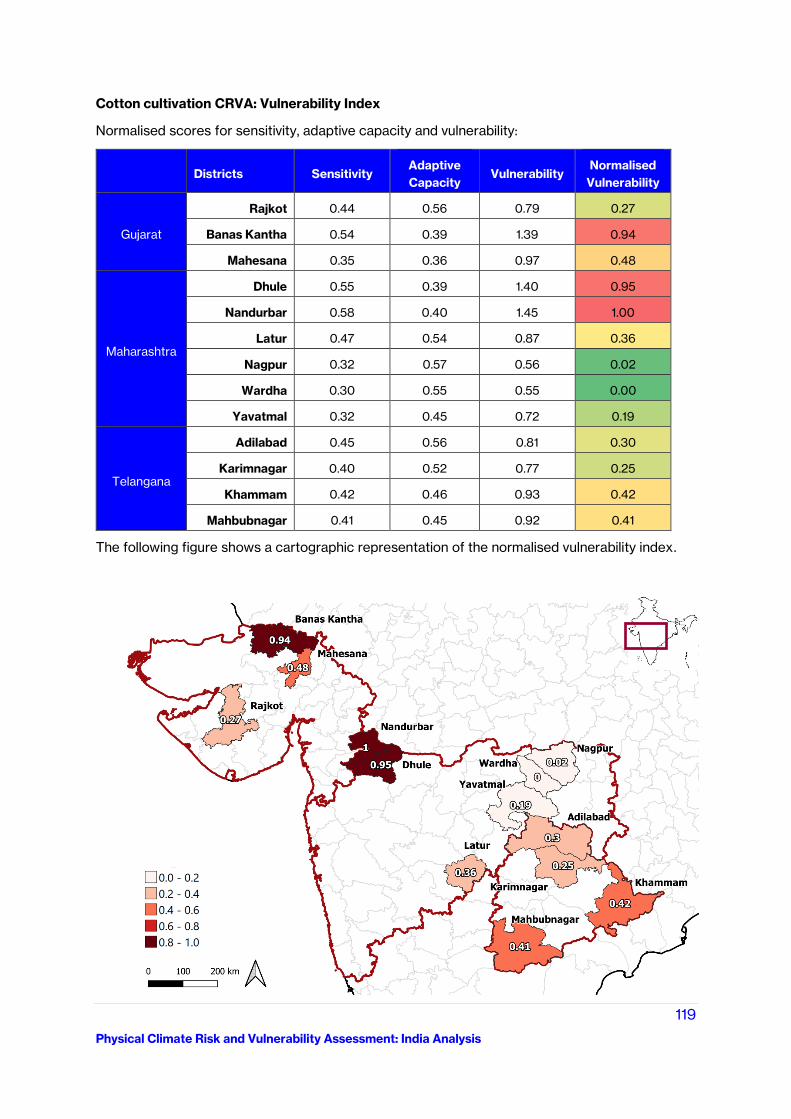
119
Physical Climate Risk and Vulnerability Assessment: India Analysis
Cotton cultivation CRVA: Vulnerability Index
Normalised scores for sensitivity, adaptive capacity and vulnerability:
Districts Sensitivity Adaptive
Capacity Vulnerability
Normalised
Vulnerability
Gujarat
Rajkot 0.44 0.56 0.79 0.27
Banas Kantha 0.54 0.39 1.39 0.94
Mahesana 0.35 0.36 0.97 0.48
Maharashtra
Dhule 0.55 0.39 1.40 0.95
Nandurbar 0.58 0.40 1.45 1.00
Latur 0.47 0.54 0.87 0.36
Nagpur 0.32 0.57 0.56 0.02
Wardha 0.30 0.55 0.55 0.00
Yavatmal 0.32 0.45 0.72 0.19
Telangana
Adilabad 0.45 0.56 0.81 0.30
Karimnagar 0.40 0.52 0.77 0.25
Khammam 0.42 0.46 0.93 0.42
Mahbubnagar 0.41 0.45 0.92 0.41
The following figure shows a cartographic representation of the normalised vulnerability index.
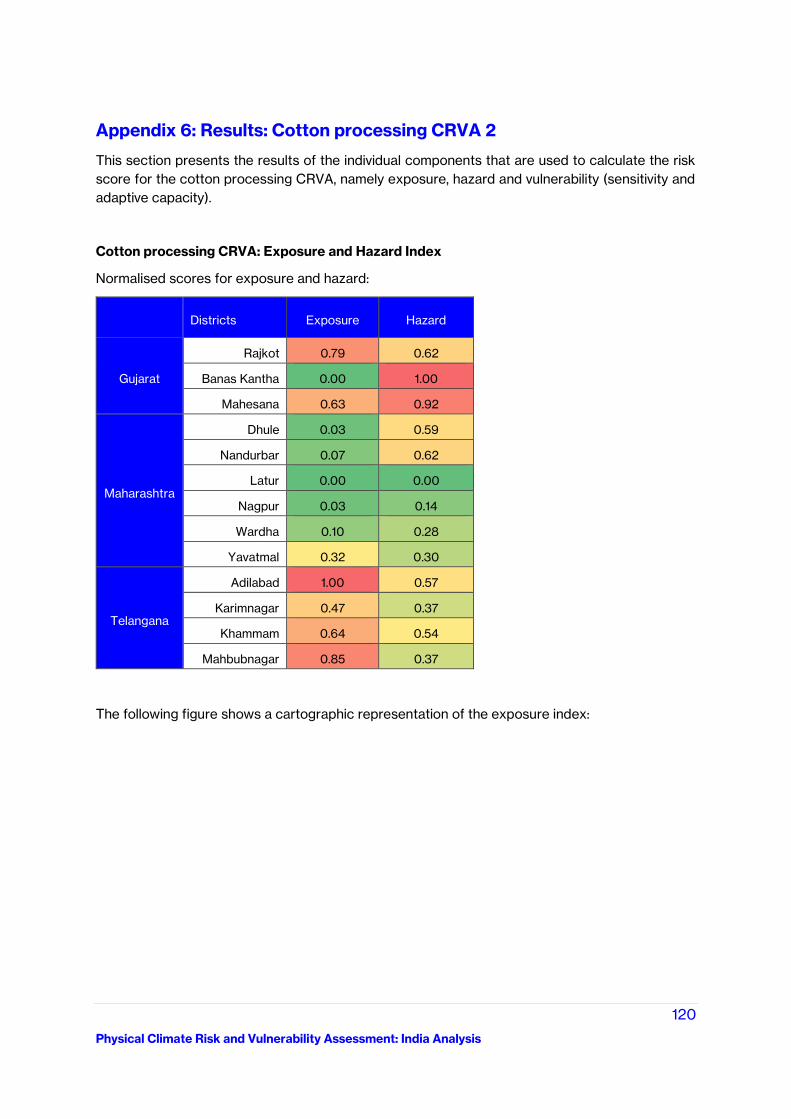
120
Physical Climate Risk and Vulnerability Assessment: India Analysis
Appendix 6: Results: Cotton processing CRVA 2
This section presents the results of the individual components that are used to calculate the risk
score for the cotton processing CRVA, namely exposure, hazard and vulnerability (sensitivity and
adaptive capacity).
Cotton processing CRVA: Exposure and Hazard Index
Normalised scores for exposure and hazard:
Districts Exposure Hazard
Gujarat
Rajkot 0.79 0.62
Banas Kantha 0.00 1.00
Mahesana 0.63 0.92
Maharashtra
Dhule 0.03 0.59
Nandurbar 0.07 0.62
Latur 0.00 0.00
Nagpur 0.03 0.14
Wardha 0.10 0.28
Yavatmal 0.32 0.30
Telangana
Adilabad 1.00 0.57
Karimnagar 0.47 0.37
Khammam 0.64 0.54
Mahbubnagar 0.85 0.37
The following figure shows a cartographic representation of the exposure index:
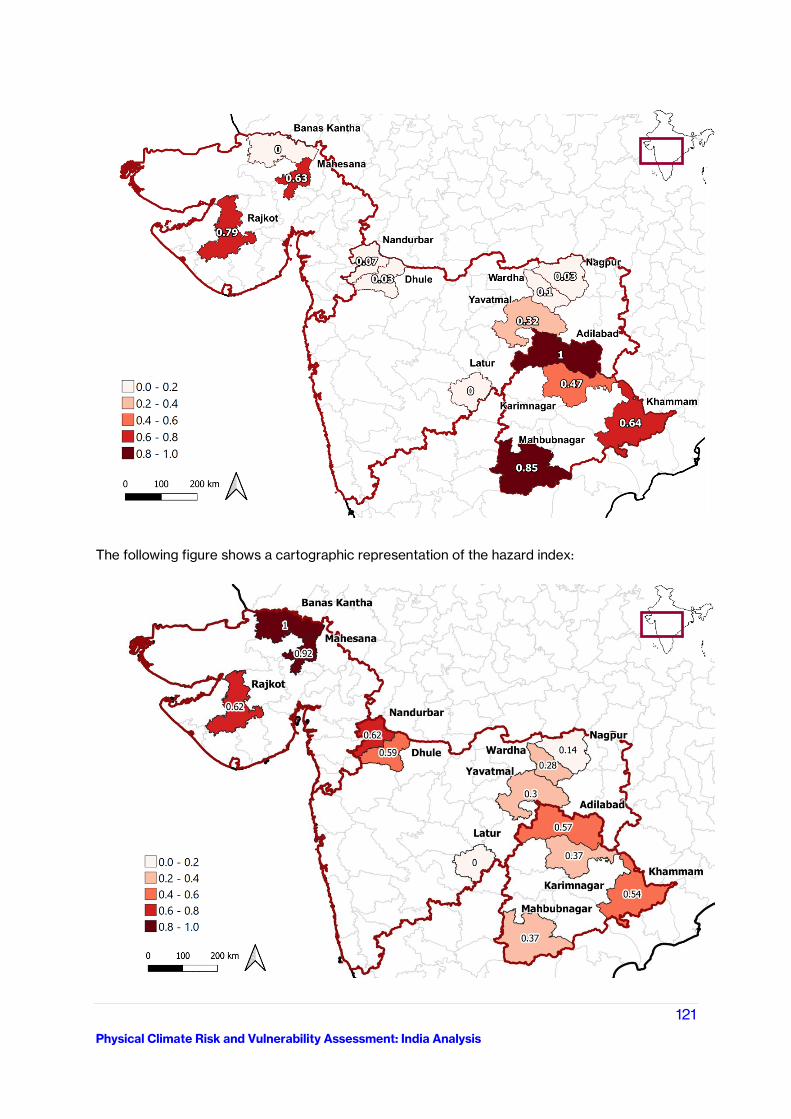
121
Physical Climate Risk and Vulnerability Assessment: India Analysis
The following figure shows a cartographic representation of the hazard index:
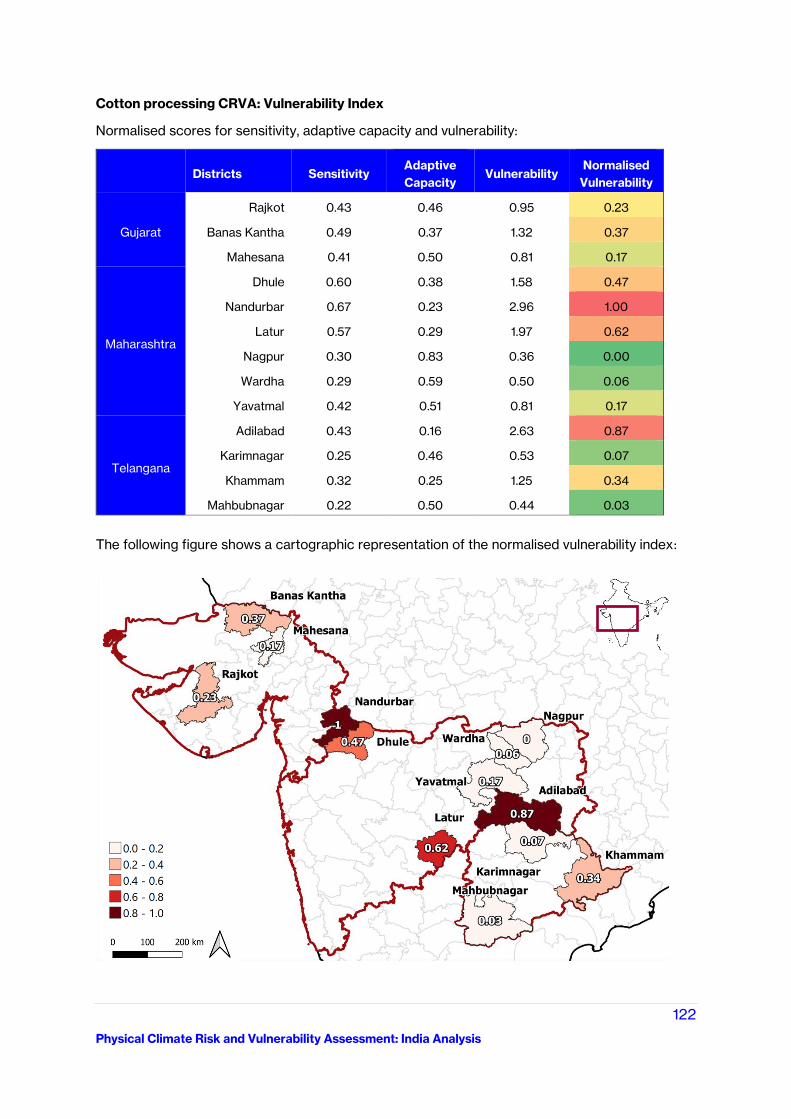
122
Physical Climate Risk and Vulnerability Assessment: India Analysis
Cotton processing CRVA: Vulnerability Index
Normalised scores for sensitivity, adaptive capacity and vulnerability:
Districts Sensitivity Adaptive
Capacity Vulnerability
Normalised
Vulnerability
Gujarat
Rajkot 0.43 0.46 0.95 0.23
Banas Kantha 0.49 0.37 1.32 0.37
Mahesana 0.41 0.50 0.81 0.17
Maharashtra
Dhule 0.60 0.38 1.58 0.47
Nandurbar 0.67 0.23 2.96 1.00
Latur 0.57 0.29 1.97 0.62
Nagpur 0.30 0.83 0.36 0.00
Wardha 0.29 0.59 0.50 0.06
Yavatmal 0.42 0.51 0.81 0.17
Telangana
Adilabad 0.43 0.16 2.63 0.87
Karimnagar 0.25 0.46 0.53 0.07
Khammam 0.32 0.25 1.25 0.34
Mahbubnagar 0.22 0.50 0.44 0.03
The following figure shows a cartographic representation of the normalised vulnerability index:
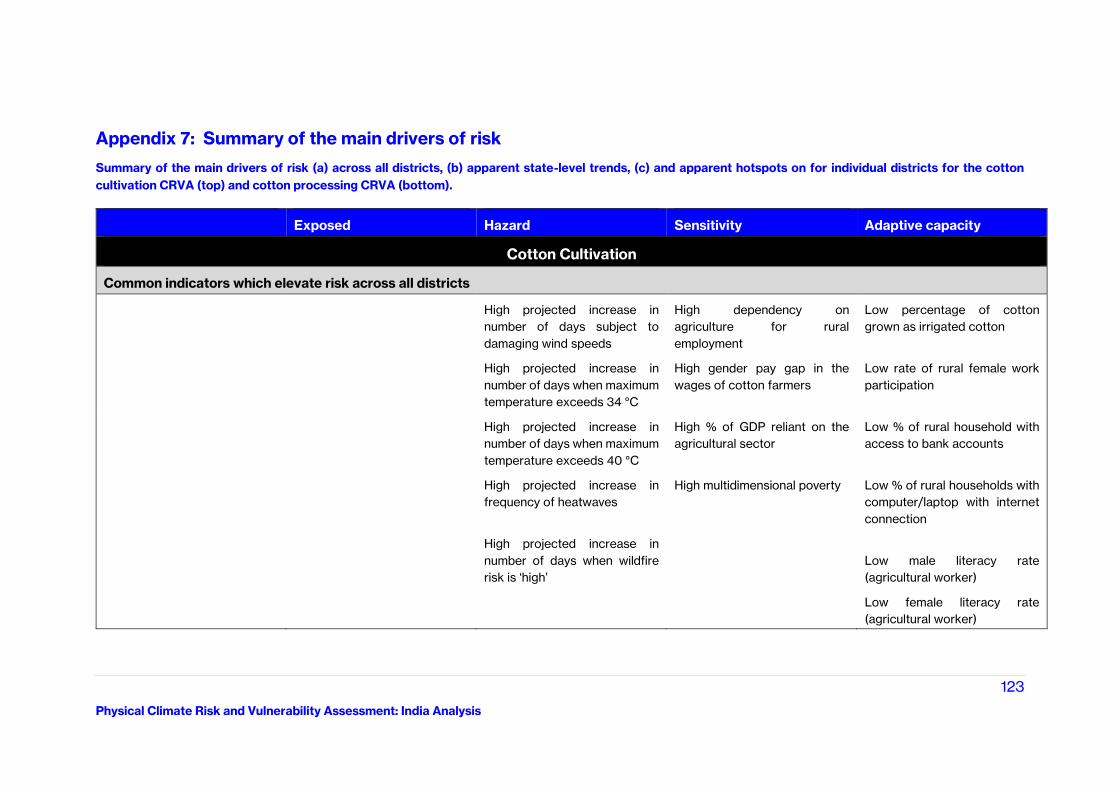
123
Physical Climate Risk and Vulnerability Assessment: India Analysis
Appendix 7: Summary of the main drivers of risk
Summary of the main drivers of risk (a) across all districts, (b) apparent state-level trends, (c) and apparent hotspots on for individual districts for the cotton
cultivation CRVA (top) and cotton processing CRVA (bottom).
Exposed Hazard Sensitivity Adaptive capacity
Cotton Cultivation
Common indicators which elevate risk across all districts
High projected increase in
number of days subject to
damaging wind speeds
High dependency on
agriculture for rural
employment
Low percentage of cotton
grown as irrigated cotton
High projected increase in
number of days when maximum
temperature exceeds 34 °C
High gender pay gap in the
wages of cotton farmers
Low rate of rural female work
participation
High projected increase in
number of days when maximum
temperature exceeds 40 °C
High % of GDP reliant on the
agricultural sector
Low % of rural household with
access to bank accounts
High projected increase in
frequency of heatwaves
High multidimensional poverty Low % of rural households with
computer/laptop with internet
connection
High projected increase in
number of days when wildfire
risk is ‘high’
Low male literacy rate
(agricultural worker)
Low female literacy rate
(agricultural worker)
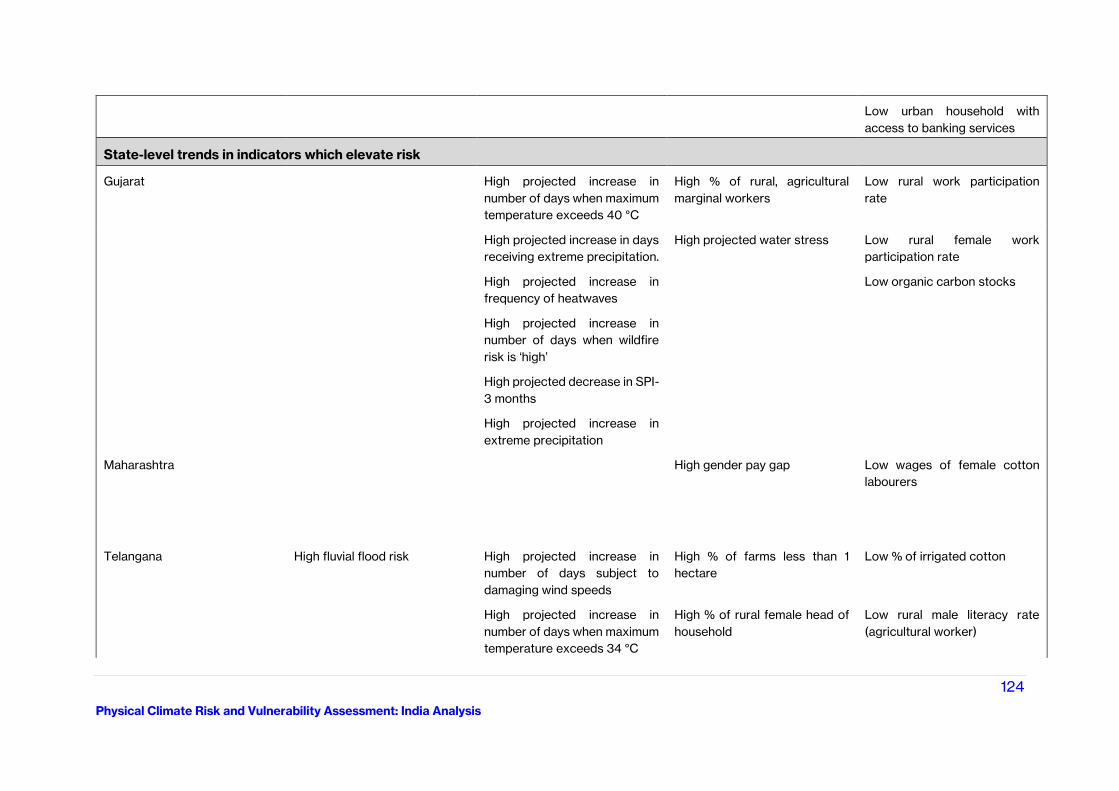
124
Physical Climate Risk and Vulnerability Assessment: India Analysis
Low urban household with
access to banking services
State-level trends in indicators which elevate risk
Gujarat High projected increase in
number of days when maximum
temperature exceeds 40 °C
High % of rural, agricultural
marginal workers
Low rural work participation
rate
High projected increase in days
receiving extreme precipitation.
High projected water stress Low rural female work
participation rate
High projected increase in
frequency of heatwaves
Low organic carbon stocks
High projected increase in
number of days when wildfire
risk is ‘high’
High projected decrease in SPI-
3 months
High projected increase in
extreme precipitation
Maharashtra High gender pay gap Low wages of female cotton
labourers
Telangana High fluvial flood risk High projected increase in
number of days subject to
damaging wind speeds
High % of farms less than 1
hectare
Low % of irrigated cotton
High projected increase in
number of days when maximum
temperature exceeds 34 °C
High % of rural female head of
household
Low rural male literacy rate
(agricultural worker)
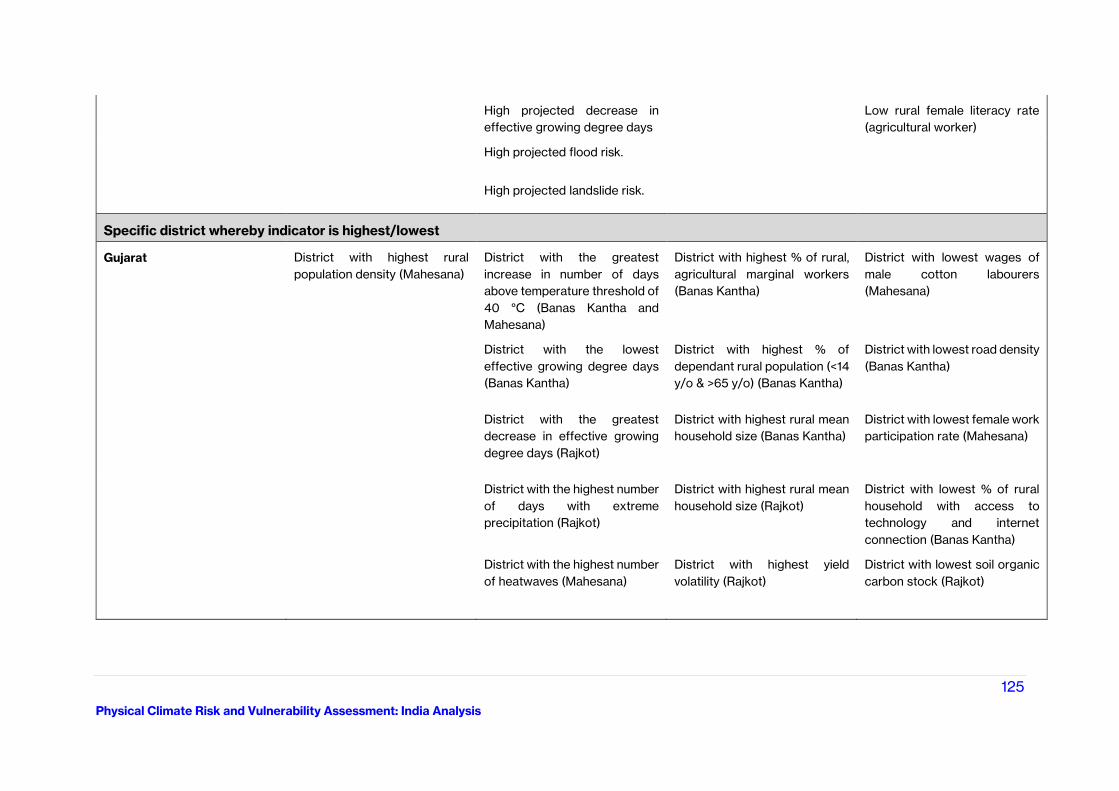
125
Physical Climate Risk and Vulnerability Assessment: India Analysis
High projected decrease in
effective growing degree days
Low rural female literacy rate
(agricultural worker)
High projected flood risk.
High projected landslide risk.
Specific district whereby indicator is highest/lowest
Gujarat District with highest rural
population density (Mahesana)
District with the greatest
increase in number of days
above temperature threshold of
40 °C (Banas Kantha and
Mahesana)
District with highest % of rural,
agricultural marginal workers
(Banas Kantha)
District with lowest wages of
male cotton labourers
(Mahesana)
District with the lowest
effective growing degree days
(Banas Kantha)
District with highest % of
dependant rural population (<14
y/o & >65 y/o) (Banas Kantha)
District with lowest road density
(Banas Kantha)
District with the greatest
decrease in effective growing
degree days (Rajkot)
District with highest rural mean
household size (Banas Kantha)
District with lowest female work
participation rate (Mahesana)
District with the highest number
of days with extreme
precipitation (Rajkot)
District with highest rural mean
household size (Rajkot)
District with lowest % of rural
household with access to
technology and internet
connection (Banas Kantha)
District with the highest number
of heatwaves (Mahesana)
District with highest yield
volatility (Rajkot)
District with lowest soil organic
carbon stock (Rajkot)
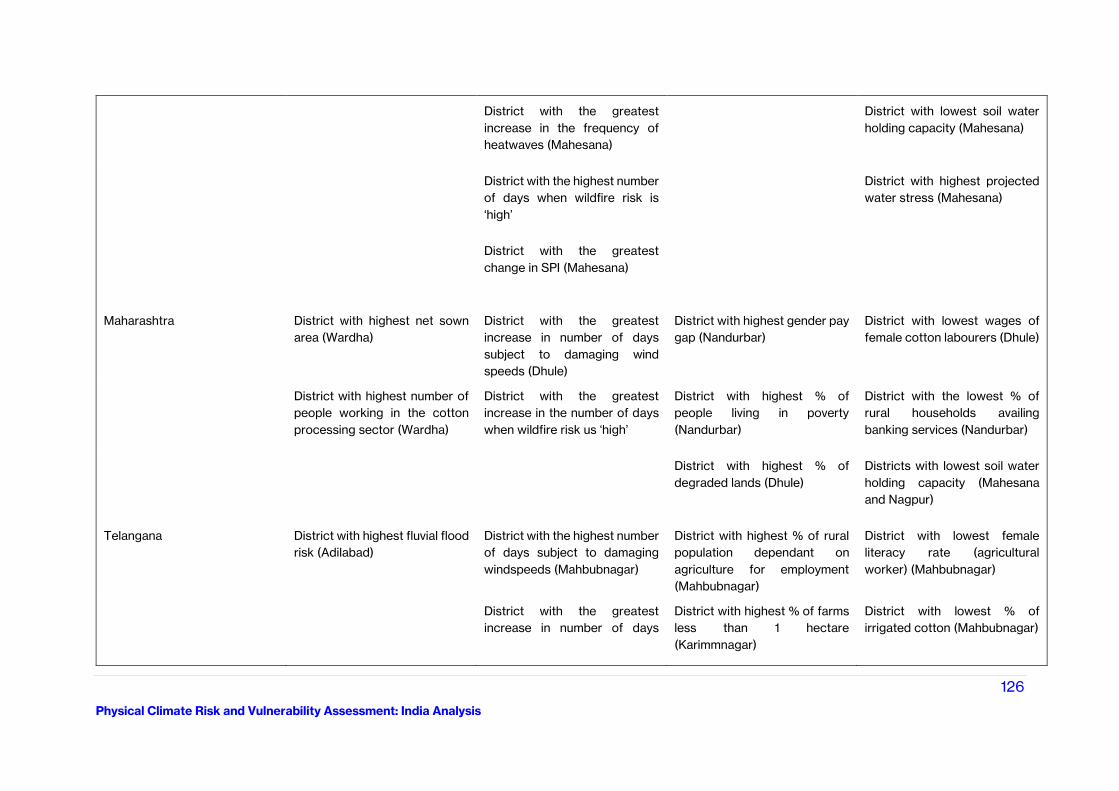
126
Physical Climate Risk and Vulnerability Assessment: India Analysis
District with the greatest
increase in the frequency of
heatwaves (Mahesana)
District with lowest soil water
holding capacity (Mahesana)
District with the highest number
of days when wildfire risk is
‘high’
District with highest projected
water stress (Mahesana)
District with the greatest
change in SPI (Mahesana)
Maharashtra District with highest net sown
area (Wardha)
District with the greatest
increase in number of days
subject to damaging wind
speeds (Dhule)
District with highest gender pay
gap (Nandurbar)
District with lowest wages of
female cotton labourers (Dhule)
District with highest number of
people working in the cotton
processing sector (Wardha)
District with the greatest
increase in the number of days
when wildfire risk us ‘high’
District with highest % of
people living in poverty
(Nandurbar)
District with the lowest % of
rural households availing
banking services (Nandurbar)
District with highest % of
degraded lands (Dhule)
Districts with lowest soil water
holding capacity (Mahesana
and Nagpur)
Telangana District with highest fluvial flood
risk (Adilabad)
District with the highest number
of days subject to damaging
windspeeds (Mahbubnagar)
District with highest % of rural
population dependant on
agriculture for employment
(Mahbubnagar)
District with lowest female
literacy rate (agricultural
worker) (Mahbubnagar)
District with the greatest
increase in number of days
District with highest % of farms
less than 1 hectare
(Karimmnagar)
District with lowest % of
irrigated cotton (Mahbubnagar)
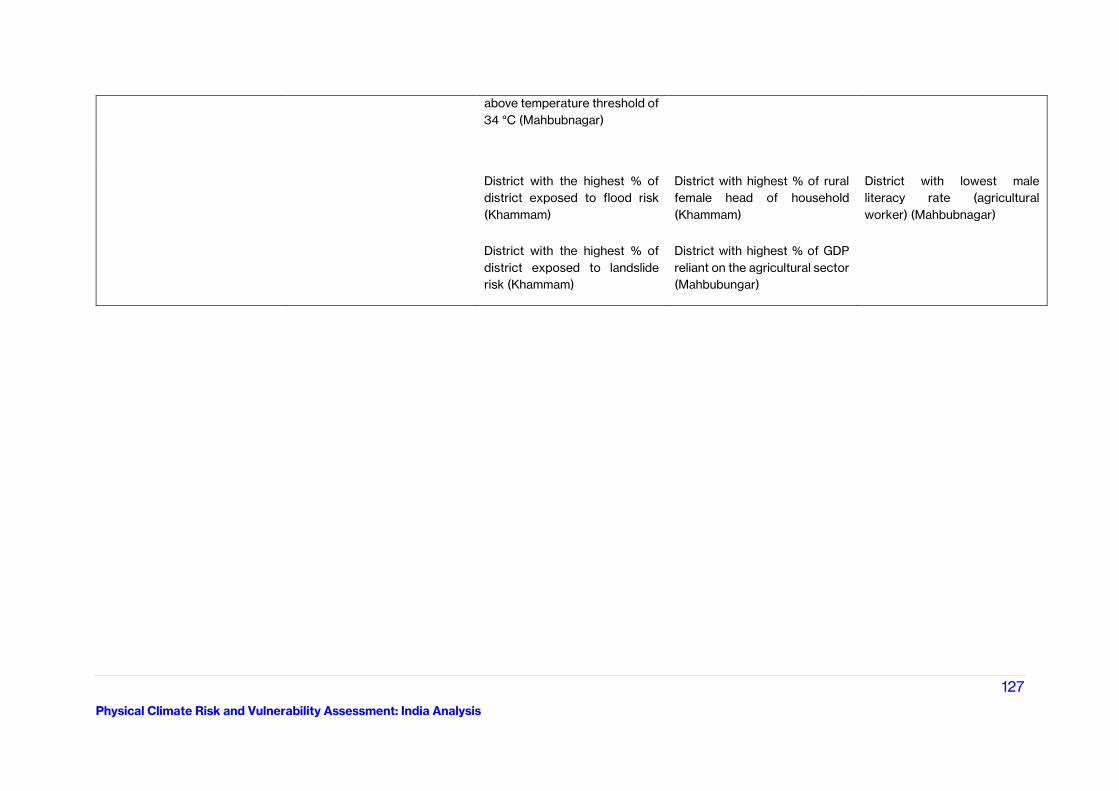
127
Physical Climate Risk and Vulnerability Assessment: India Analysis
above temperature threshold of
34 °C (Mahbubnagar)
District with the highest % of
district exposed to flood risk
(Khammam)
District with highest % of rural
female head of household
(Khammam)
District with lowest male
literacy rate (agricultural
worker) (Mahbubnagar)
District with the highest % of
district exposed to landslide
risk (Khammam)
District with highest % of GDP
reliant on the agricultural sector
(Mahbubungar)
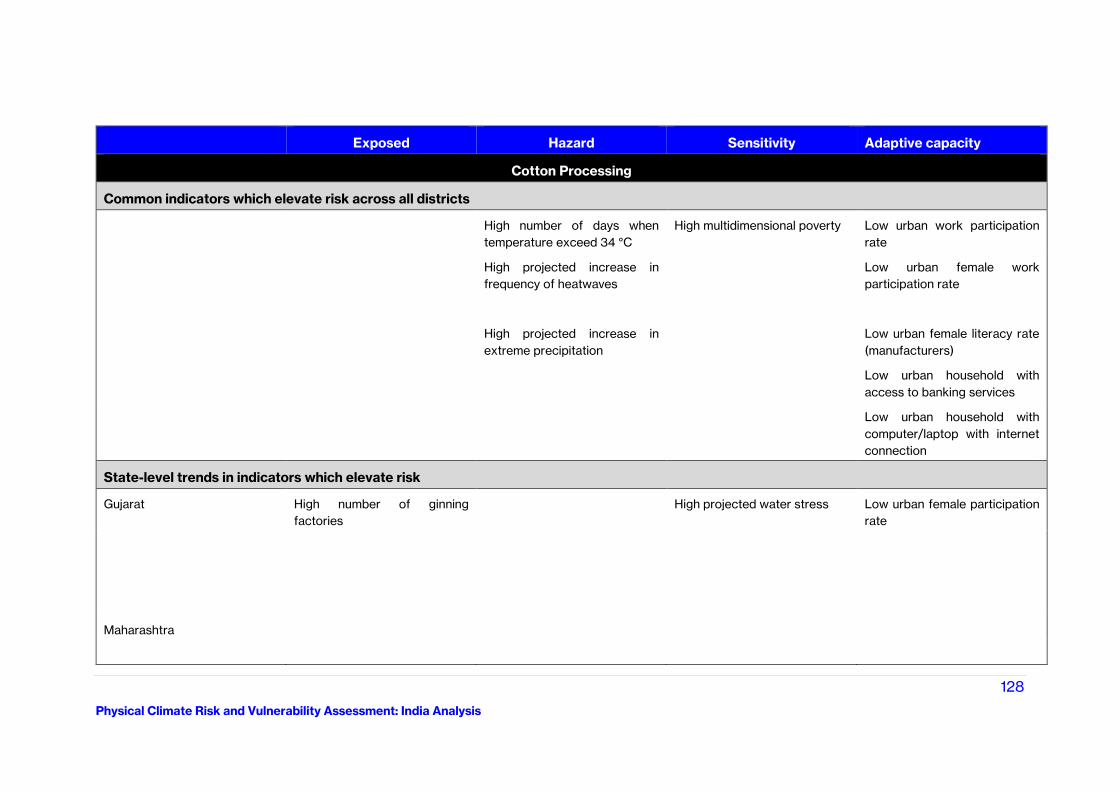
128
Physical Climate Risk and Vulnerability Assessment: India Analysis
Exposed Hazard Sensitivity Adaptive capacity
Cotton Processing
Common indicators which elevate risk across all districts
High number of days when
temperature exceed 34 °C
High multidimensional poverty Low urban work participation
rate
High projected increase in
frequency of heatwaves
Low urban female work
participation rate
High projected increase in
extreme precipitation
Low urban female literacy rate
(manufacturers)
Low urban household with
access to banking services
Low urban household with
computer/laptop with internet
connection
State-level trends in indicators which elevate risk
Gujarat High number of ginning
factories
High projected water stress Low urban female participation
rate
Maharashtra
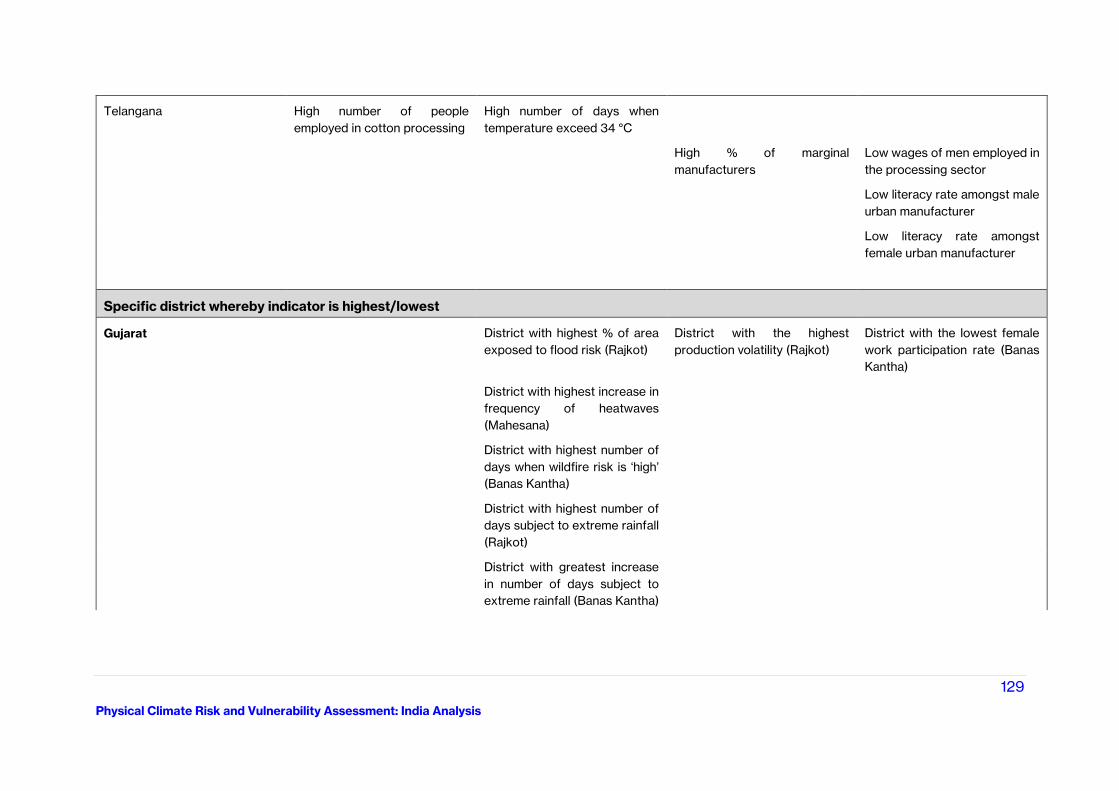
129
Physical Climate Risk and Vulnerability Assessment: India Analysis
Telangana High number of people
employed in cotton processing
High number of days when
temperature exceed 34 °C
High % of marginal
manufacturers
Low wages of men employed in
the processing sector
Low literacy rate amongst male
urban manufacturer
Low literacy rate amongst
female urban manufacturer
Specific district whereby indicator is highest/lowest
Gujarat District with highest % of area
exposed to flood risk (Rajkot)
District with the highest
production volatility (Rajkot)
District with the lowest female
work participation rate (Banas
Kantha)
District with highest increase in
frequency of heatwaves
(Mahesana)
District with highest number of
days when wildfire risk is ‘high’
(Banas Kantha)
District with highest number of
days subject to extreme rainfall
(Rajkot)
District with greatest increase
in number of days subject to
extreme rainfall (Banas Kantha)
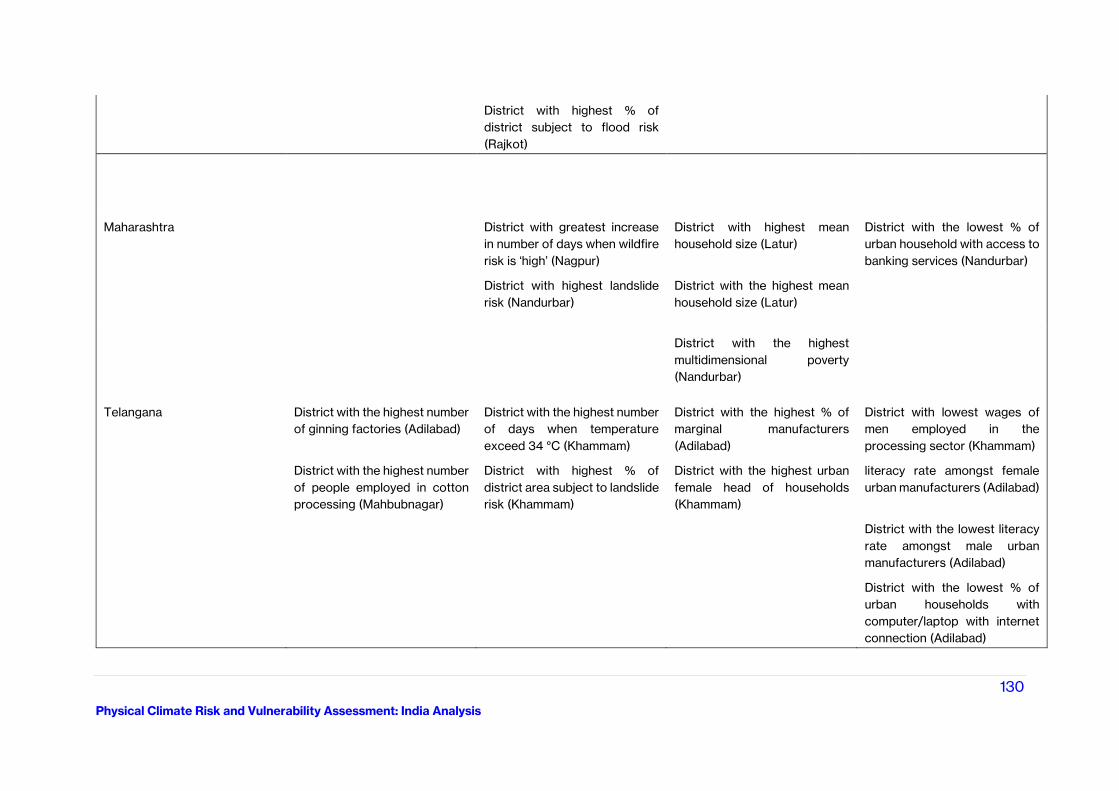
130
Physical Climate Risk and Vulnerability Assessment: India Analysis
District with highest % of
district subject to flood risk
(Rajkot)
Maharashtra District with greatest increase
in number of days when wildfire
risk is ‘high’ (Nagpur)
District with highest mean
household size (Latur)
District with the lowest % of
urban household with access to
banking services (Nandurbar)
District with highest landslide
risk (Nandurbar)
District with the highest mean
household size (Latur)
District with the highest
multidimensional poverty
(Nandurbar)
Telangana District with the highest number
of ginning factories (Adilabad)
District with the highest number
of days when temperature
exceed 34 °C (Khammam)
District with the highest % of
marginal manufacturers
(Adilabad)
District with lowest wages of
men employed in the
processing sector (Khammam)
District with the highest number
of people employed in cotton
processing (Mahbubnagar)
District with highest % of
district area subject to landslide
risk (Khammam)
District with the highest urban
female head of households
(Khammam)
literacy rate amongst female
urban manufacturers (Adilabad)
District with the lowest literacy
rate amongst male urban
manufacturers (Adilabad)
District with the lowest % of
urban households with
computer/laptop with internet
connection (Adilabad)
131
Physical Climate Risk and Vulnerability Assessment: India Analysis
Appendix 8: References
i The World Bank. 2013. Strong, safe and resilient. Available from:
https://openknowledge.worldbank.org/bitstream/handle/10986/13108/758470PUB0EPI0001300PUBDATE
02028013.pdf;sequence=1
ii IPCC. 2014: Climate Change 2014: Impacts, Adaptation, and Vulnerability. Part A:Global and Sectoral
Aspects. Contribution of Working Group II to the FifthAssessment Report of the Intergovernmental Panel on
Climate Change[Field, C.B., V.R. Barros, D.J. Dokken, K.J. Mach, M.D. Mastrandrea, T.E. Bilir,M. Chatterjee,
K.L. Ebi, Y.O. Estrada, R.C. Genova, B. Girma, E.S. Kissel, A.N. Levy,S. MacCracken, P.R. Mastrandrea, and
L.L. White (eds.)]. Cambridge UniversityPress, Cambridge, United Kingdom and New York, NY, USA, 1132 pp.
Available from: https://www.ipcc.ch/site/assets/uploads/2018/02/WGIIAR5-PartA_FINAL.pdf
iii IPCC. 2014. Annex II: Glossary [Mach, K.J., S. Planton and C. von Stechow (eds.)]. In: Cli-mate Change
2014: Synthesis Report. Contribution of Working Groups I, II and III to the Fifth Assessment Report of the
Intergovernmental Panel on Climate Change [Core Writing Team, R.K. Pachauri and L.A. Meyer (eds.)]. IPCC,
Geneva, Switzerland, pp. 117-130. Available from: https-
//www.ipcc.ch/site/assets/uploads/2019/01/SYRAR5-Glossary_en.pdf
iv Ton, P. 2011. Cotton and climate change: impacts and options to mitigate and adapt. International Trade
Centre, pp.1-17. Available from: https://www.intracen.org/Cotton-and-Climate-Change-Impacts-and-options-
to-mitigate-and-adapt/
v FAO. 2020. Cotton. Available from : http://www.fao.org/land-water/databases-and-software/crop-
information/cotton/en/
vi FAO. 2020. Cotton. Available from : http://www.fao.org/land-water/databases-and-software/crop-
information/cotton/en/
vii Bange, M.P., Baker, J.T., Bauer, P.J., Broughton, K.J., Constable, G.A., Luo, Q., Oosterhuis, D.M., Osanai, Y.,
Payton, P., Tissue, D.T. and Reddy, K.R. 2016. Climate change and cotton production in modern farming
systems (No. 6). CABI. Available from: https://www.cabdirect.org/cabdirect/abstract/20163079569
viii FAO. 2020. Cotton. Available from : http://www.fao.org/land-water/databases-and-software/crop-
information/cotton/en/
ix Ferrigno, S. 2020. The Inside Guide to Cotton & Sustainability. Cotton Incorporated, Laudes Foundation
and MCL News & Media. Available from: https://www.mclnews.com/guidebooks/insider-s-guide-to-
sustainable-cotton
x FAO. 2020. Cotton. Available from : http://www.fao.org/land-water/databases-and-software/crop-
information/cotton/en/
xi Ikisan. 2020. Cotton. Available from: http://www.ikisan.com/ka-cotton-soils-and-climate.html
xii Ferrigno, S. 2020. The Inside Guide to Cotton & Sustainability. Cotton Incorporated, Laudes Foundation
and MCL News & Media. Available from: https://www.mclnews.com/guidebooks/insider-s-guide-to-
sustainable-cotton
xiii Ikisan. 2020. Cotton. Available from: http://www.ikisan.com/ka-cotton-soils-and-climate.html
xiv FAO. 2020. Cotton. Available from : http://www.fao.org/land-water/databases-and-software/crop-
information/cotton/en/
xv Ferrigno, S. 2020. The Inside Guide to Cotton & Sustainability. Cotton Incorporated, Laudes Foundation
and MCL News & Media. Available from: https://www.mclnews.com/guidebooks/insider-s-guide-to-
sustainable-cotton
132
Physical Climate Risk and Vulnerability Assessment: India Analysis
xvi Jones, M.W., Smith, A., Betts, R., Canadell, J.G., Prentice, I.C. and Le Quéré, C. 2020. Climate change
increases risk of wildfires. ScienceBrief Review, 116, p.117. Available from:
https://www.preventionweb.net/files/73797_wildfiresbriefingnote.pdf
xvii FAO. 2020. Cotton. Available from : http://www.fao.org/land-water/databases-and-software/crop-
information/cotton/en/
xviii IPCC Fourth Assessment Report. 2007. Wind speeds. Available from :
https://archive.ipcc.ch/publications_and_data/ar4/wg1/en/ch11s11-3-3-5.html
xix GFDL. 2020. Global warming and hurricanes. Available from: https://www.gfdl.noaa.gov/global-warming-
and-
hurricanes/#:~:text=Tropical%20cyclone%20intensities%20globally%20will,no%20reduction%20in%20stor
m%20size
xx FAO. 2020. Cotton. Available from: http://www.fao.org/land-water/databases-and-software/crop-
information/cotton/en/
xxi International Trade Centre. 2011. Cotton and climate change: Impacts and options to mitigate and adapt.
Available from: https://www.intracen.org/Cotton-and-Climate-Change-Impacts-and-options-to-mitigate-
and-adapt/
xxii International Trade Centre. 2011. Cotton and climate change: Impacts and options to mitigate and adapt.
Available from: https://www.intracen.org/Cotton-and-Climate-Change-Impacts-and-options-to-mitigate-
and-adapt/
xxiii Hebbar, K.B., Venugopalan, M.V., Prakash, A.H. and Aggarwal, P.K. 2013. Simulating the impacts of climate change on cotton production in India. Climatic change, 118(3-4), pp.701-713. Available from: https://link.springer.com/article/10.1007/s10584-012-0673-4?shared-article-renderer
xxiv Batool, S. and Saeed, F. 2018. Unpacking Climate Impacts and Vulnerabilities of Cotton Farmers in Pakistan: A Case Study of Two Semi-arid Districts. Earth Systems and Environment, 2(3), pp.499-514. Available from: https://link.springer.com/article/10.1007/s41748-018-0068-4
xxv Batool, S. and Saeed, F. 2018. Unpacking Climate Impacts and Vulnerabilities of Cotton Farmers in Pakistan: A Case Study of Two Semi-arid Districts. Earth Systems and Environment, 2(3), pp.499-514. Available from: https://link.springer.com/article/10.1007/s41748-018-0068-4
xxvi Germanwatch. Available from : https://germanwatch.org/en/17307
xxvii INFORM India. . Available from: https://drmkc.jrc.ec.europa.eu/inform-index
xxviii ND-GAIN. 2018. Country ranking. Available from: https://gain.nd.edu/our-work/country-index/rankings/
xxix USAID. 2017. Climate risk profile: India. Available from: https://www.climatelinks.org/resources/climate-
risk-profile-india
xxx USAID. 2017. Climate risk profile: India. Available from: https://www.climatelinks.org/resources/climate-
risk-profile-india
xxxi Roxy, M.K. and Chaithra, S.T. 2018. Impacts of climate change on the Indian Summer Monsoon. Ministry
of Environment, Forest and Climate Change (MoEF&CC), Government of India. Available from:
https://www.researchgate.net/publication/329771172_Impacts_of_Climate_Change_on_the_Indian_Summer_
Monsoon
xxxii Roxy, M.K. and Chaithra, S.T. 2018. Impacts of climate change on the Indian Summer Monsoon. Ministry
of Environment, Forest and Climate Change (MoEF&CC), Government of India. Available from:
https://www.researchgate.net/publication/329771172_Impacts_of_Climate_Change_on_the_Indian_Summer_
Monsoon
133
Physical Climate Risk and Vulnerability Assessment: India Analysis
xxxiii IndiaSpend. 2018. Climate change crisis : Why Fatuhi Khera in Pujab changes from cotton to rice.
Available from: https://www.indiaspend.com/climate-change-crisis-why-fatuhi-khera-in-punjab-changed-
from-cotton-to-rice-59222/
xxxiv IBEF. 2020. Cotton industry and export. Available from : https://www.ibef.org/exports/cotton-industry-
india.aspx#:~:text=Cotton%20Industry%20and%20Exports,-
Last%20Updated%3A%20November&text=India%20is%20one%20of%20the,11%25%20to%20total%20ex
port%20earnings
xxxv Kjellstrom, T., Maıtre, N., Saget, C., Otto, M. and Karimova, T. 2019. Working on a Warmer Planet: The
Effect of Heat Stress on Productivity and Decent Work. Available from:
https://www.ilo.org/wcmsp5/groups/public/---dgreports/---dcomm/---
publ/documents/publication/wcms_711919.pdf
xxxvi Kjellstrom, T., Maıtre, N., Saget, C., Otto, M. and Karimova, T. 2019. Working on a Warmer Planet: The Effect of Heat Stress on Productivity and Decent Work. Available from: https://www.ilo.org/wcmsp5/groups/public/---dgreports/---dcomm/---publ/documents/publication/wcms_711919.pdf
xxxvii ICAC. 2020. Data portal. Production of Cotton Lint in ‘000 Metric Tonnes. Available from :
https://www.icac.org/DataPortal/DataPortal/?menuId=23
xxxviii Cotton Advisory Board. Available from: https://www.caionline.in/
xxxix Bange, M.P., Baker, J.T., Bauer, P.J., Broughton, K.J., Constable, G.A., Luo, Q., Oosterhuis, D.M., Osanai,
Y., Payton, P., Tissue, D.T. and Reddy, K.R. 2016. Climate change and cotton production in modern farming
systems (No. 6). CABI. Available from : https://www.intracen.org/cotton-and-climate-
change.pdf/#:~:text=produced%20with%20agrochemicals.-
,Impact%20of%20climate%20change%20on%20cotton%20production,crop%20failures%20and%20produ
ction%20declines
xl Bange, M.P., Baker, J.T., Bauer, P.J., Broughton, K.J., Constable, G.A., Luo, Q., Oosterhuis, D.M., Osanai, Y.,
Payton, P., Tissue, D.T. and Reddy, K.R. 2016. Climate change and cotton production in modern farming
systems (No. 6). CABI. Available from : https://www.intracen.org/cotton-and-climate-
change.pdf/#:~:text=produced%20with%20agrochemicals.-
,Impact%20of%20climate%20change%20on%20cotton%20production,crop%20failures%20and%20produ
ction%20declines
xli Chockalingam, M. 2018. A Profile of Indian Cotton: At a Glance. Available from:
https://cotcorp.org.in/Writereaddata/Downloads/Article-ICAC-DM-CCI.pdf
xlii Junagadh agricultural university. 2014. Cotton research station. Available from:
http://www.jau.in/index.php/resources/2-init-content/research/100-cotton-research-station
xliii Ministry of Textiles. 2016. List of Ginning & Pressing Units Rated under scheme on “Assessment & Rating
of G&P factories. Available from:
http://texmin.nic.in/sites/default/files/List_of_Rated_877_units_textiles_committee_20130911_0.pdf
xliv Textile Value Chain. 2018. Weaving Sector in India. Available from:
https://textilevaluechain.in/2018/06/21/weaving-sector-in-india/
xlv Gupta, U.K. 2020. Weaving the Way for Indian Textile Industry. NITI Aayog. GoI. Available from:
https://niti.gov.in/weaving-way-indian-textile-industry
xlvi Chockalingam, M. 2018. A Profile of Indian Cotton: At a Glance. Available from:
https://cotcorp.org.in/Writereaddata/Downloads/Article-ICAC-DM-CCI.pdf
134
Physical Climate Risk and Vulnerability Assessment: India Analysis
xlvii Gupta, U.K. 2020. Weaving the Way for Indian Textile Industry. NITI Aayog. GoI. Available from:
https://niti.gov.in/weaving-way-indian-textile-industry
xlviii ICAC. 2018. Data portal. Available from :
https://www.icac.org/DataPortal/ProductionDetails?country=IND
xlix Patil, P.G., Arude, V.G. 2014. Recent Advances in Cotton Ginning Technology in India.
https://www.icac.org/Content/SEEPDocuments/PdfFiles93cd3183_8866_4c10_95e6_8cb25d4a3c96/PGP
atil_India-(1).pdf
l Patil, P.G., Arude, V.G. 2014. Recent Advances in Cotton Ginning Technology in India. Available from:
https://www.icac.org/Content/SEEPDocuments/PdfFiles93cd3183_8866_4c10_95e6_8cb25d4a3c96/PGP
atil_India-(1).pdf
li Ministry of Textiles. 2014. Assessment & Rating of Ginning & Pressing Factories. Available from:
http://textilescommittee.nic.in/sites/default/files/02readmore.pdf
lii Ministry of Textiles. 2014. Assessment & Rating of Ginning & Pressing Factories. Available from:
http://textilescommittee.nic.in/sites/default/files/02readmore.pdf
liii Cotton Corporation of India. 2018. Available from:
https://cotcorp.org.in/WriteReadData/Downloads/32%2059%203396G&P%20tender%2018-
19%20Non%20Modern.pdf
liv Cotton Corporation of India. 2018. Available from:
https://cotcorp.org.in/WriteReadData/Downloads/32%2059%203396G&P%20tender%2018-
19%20Non%20Modern.pdf
lv Umamaheshwari, S., Kowsalyadevi. 2018. Spinning Mills an Overview. IJRAR, vol 5, issue 3. Available from:
http://ijrar.org/papers/IJRAR190E022.pdf
lvi ICRA Rating : Revenue of Indian Cotton Spinning Sector Decline by 25-30% in FY21. Available from:
https://textilevaluechain.in/2020/07/17/icra-rating-revenue-of-indian-cotton-spinning-sector-decline-by-
25-30-in-fy21/
lvii Umamaheshwari, S., Kowsalyadevi. 2018. Spinning Mills an Overview. IJRAR, vol 5, issue 3. Available from:
http://ijrar.org/papers/IJRAR190E022.pdf
lviii Gupta, U.K. 2020. Weaving the Way for Indian Textile Industry. NITI Aayog. GoI. Available from:
https://niti.gov.in/weaving-way-indian-textile-industry
lix Gupta, U.K. 2020. Weaving the Way for Indian Textile Industry. NITI Aayog. GoI. Available from:
https://niti.gov.in/weaving-way-indian-textile-industry
lx Ministry of Environment, Forests and Climate Change. 2008. National Action Plan on Climate Change. GoI.
Available from: http://moef.gov.in/wp-content/uploads/2018/04/NAP_E.pdf
lxi India’s Intended Nationally Determined Contribution. Available from:
https://www4.unfccc.int/sites/ndcstaging/PublishedDocuments/India%20First/INDIA%20INDC%20TO%2
0UNFCCC.pdf
lxii India’s Intended Nationally Determined Contribution. Available from:
https://www4.unfccc.int/sites/ndcstaging/PublishedDocuments/India%20First/INDIA%20INDC%20TO%2
0UNFCCC.pdf
lxiii Economic Survey 2017-18. Climate, Climate Change and Agriculture. GoI. Available from:
http://mofapp.nic.in:8080/economicsurvey/pdf/082-101_Chapter_06_ENGLISH_Vol_01_2017-18.pdf
135
Physical Climate Risk and Vulnerability Assessment: India Analysis
lxiv Economic Survey 2017-18. Climate, Climate Change and Agriculture. GoI. Available from:
http://mofapp.nic.in:8080/economicsurvey/pdf/082-101_Chapter_06_ENGLISH_Vol_01_2017-18.pdf
lxv Economic Survey 2017-18. Climate, Climate Change and Agriculture. GoI. Available from:
http://mofapp.nic.in:8080/economicsurvey/pdf/082-101_Chapter_06_ENGLISH_Vol_01_2017-18.pdf
lxvi Batool, S. and Saeed, F. 2018. Towards a Climate Resilient Cotton Value Chain in Pakistan: Understanding
Key Risks, Vulnerabilities and Adaptive Capacities. Pathways to Resilience in Semi-Arid Economies (PRISE)
Working Paper. Overseas Development Institute. Available from:
https://www.researchgate.net/publication/327069395_Towards_a_climate_resilient_cotton_value_chain_in_
Pakistan_Understanding_key_risks_vulnerabilities_and_adaptive_capacities
lxvii IPCC. 2014. Climate Change 2014: Impacts, Adaptation, and Vulnerability. Part A:Global and Sectoral
Aspects. Contribution of Working Group II to the FifthAssessment Report of the Intergovernmental Panel on
Climate Change[Field, C.B., V.R. Barros, D.J. Dokken, K.J. Mach, M.D. Mastrandrea, T.E. Bilir,M. Chatterjee,
K.L. Ebi, Y.O. Estrada, R.C. Genova, B. Girma, E.S. Kissel, A.N. Levy,S. MacCracken, P.R. Mastrandrea, and
L.L. White (eds.)]. Cambridge UniversityPress, Cambridge, United Kingdom and New York, NY, USA, 1132 pp.
Available from: https://www.ipcc.ch/site/assets/uploads/2018/02/WGIIAR5-PartA_FINAL.pdf
Part B: Methodology
i CICR. 2019. Available from: https://www.cicr.org.in/
ii Ministry of Environment, Forestry and Climate Change. 2018. Performance of Bt. Cotton Cultivation in
Maharashtra. Report of State Department of Agriculture. Available from: http://moef.gov.in/wp-
content/uploads/2018/03/srmh.pdf
iii Textile Exchange. 2018. Organic Cotton Market Report 2018. Available from:
https://textileexchange.org/wp-content/uploads/2018/11/2018-Organic-Cotton-Market-Report.pdf
iv Ministry of Environment, Forestry and Climate Change. 2018. Performance of Bt. Cotton Cultivation in
Maharashtra. Report of State Department of Agriculture. Available from: http://moef.gov.in/wp-
content/uploads/2018/03/srmh.pdf
v Reindl, M., Gupta, P., Subramanian, S., Kaur, R., and Rani, D. 2019. Towards Doubling Cotton Farmer
Incomes in Maharashtra. IDH and Technoserve. Available from:
https://www.idhsustainabletrade.com/uploaded/2019/05/Doubling-Cotton-Farmer-Incomes-in-
Maharashtra.pdf
vi Reindl, M., Gupta, P., Subramanian, S., Kaur, R., and Rani, D. 2019. Towards Doubling Cotton Farmer
Incomes in Maharashtra. IDH and Technoserve. Available from:
https://www.idhsustainabletrade.com/uploaded/2019/05/Doubling-Cotton-Farmer-Incomes-in-
Maharashtra.pdf
vii Reindl, M., Gupta, P., Subramanian, S., Kaur, R., and Rani, D. 2019. Towards Doubling Cotton Farmer
Incomes in Maharashtra. IDH and Technoserve. Available from:
https://www.idhsustainabletrade.com/uploaded/2019/05/Doubling-Cotton-Farmer-Incomes-in-
Maharashtra.pdf
viii Reindl, M., Gupta, P., Subramanian, S., Kaur, R., and Rani, D. 2019. Towards Doubling Cotton Farmer
Incomes in Maharashtra. IDH and Technoserve. Available from:
https://www.idhsustainabletrade.com/uploaded/2019/05/Doubling-Cotton-Farmer-Incomes-in-
Maharashtra.pdf
ix Biswas, P. 2020. November 10. ‘Maharashtra reports dip in production: ‘cotton exports expected to hit 60
L bales this season’. The India Express. Available from:
136
Physical Climate Risk and Vulnerability Assessment: India Analysis
https://indianexpress.com/article/cities/pune/maharashtra-reports-dip-in-production-cotton-exports-
expected-to-hit-60-l-bales-this-season-7037101/
x CICR. 2019. Available from: https://www.cicr.org.in/
xi Cotton Association of India. 2015. Cotton Statistics and News; History of Cotton in Gujarat. No. 34.
Available from: https://www.caionline.in/
xii Deshpande, T. 2017. State of Agriculture in India. PRS Legislative Research India. Available from:
https://www.prsindia.org/sites/default/files/parliament_or_policy_pdfs/State%20of%20Agriculture%20in%
20India.pdf
xiii Singh, P., and Kairon, MS. No Date. Cotton Varieties and Hybrids. CICR Techincal Bulletin NO: 13. Central
Institute for Cotton Research Nagpur. Available from:
https://www.cicr.org.in/pdf/cotton_varieties_hybrids.pdf
xiv Textile Exchange. 2018. Organic Cotton Market Report 2018. Available from:
https://textileexchange.org/wp-content/uploads/2018/11/2018-Organic-Cotton-Market-Report.pdf
xv Safaya, S., Zhang, G., Mathews, R. 2016. Toward Sustainable Water Use in the Cotton Supply Chain. A
comparative assessment of the water footprint of agricultural practices in India. Water Footprint Network.
Available from: https://waterfootprint.org/media/downloads/Assessm_water_footprint_cotton_India.pdf
xvi Thakare, H.S., Shrivastava, P.K. and Bardhan, K. 2014. Impact of weather parameters on cotton
productivity at Surat (Gujarat), India. Journal of Applied and Natural Science, 6(2), pp.599-604. Available
from: http://journals.ansfoundation.org/index.php/jans/article/view/503
xvii Singandhupe, R.B., Manikandan, A., Blaise, D. and Chattaraj, S. 2020. Climate reactive strategies for
improving cotton yield: A case study of Gujarat State, India. International Journal of Irrigation and Water
Management Vol. 7(5), pp. 001-0014. Available from:
https://www.researchgate.net/profile/Ramlal_Singandhupe/publication/342121717_Climate_reactive_strateg
ies_for_improving_cotton_yield_A_case_study_of_Gujarat_State_India/links/5ee37052299bf1faac4e8bb3/Cli
mate-reactive-strategies-for-improving-cotton-yield-A-case-study-of-Gujarat-State-India.pdf
xviii Safaya, S., Zhang, G., Mathews, R. 2016. Toward Sustainable Water Use in the Cotton Supply Chain. A
comparative assessment of the water footprint of agricultural practices in India. Water Footprint Network.
Available from: https://waterfootprint.org/media/downloads/Assessm_water_footprint_cotton_India.pdf
xix Kranthi, K.R. and Stone, G.D. 2020. Long-term impacts of Bt cotton in India. Nature Plants, 6(3), pp.188-
196. Available from: https://www.nature.com/articles/s41477-020-0615-5
xx Kranthi, K.R. and Stone, G.D. 2020. Long-term impacts of Bt cotton in India. Nature Plants, 6(3), pp.188-
196. Available from: https://www.nature.com/articles/s41477-020-0615-5
xxi Laitha and Viswanathan. 2013. Bt Cotton Cultivation in Gujarat: Emerging Issues and Environmental
Challenges. Gurajat Institute of Development Research. Available from:
https://link.springer.com/chapter/10.1007/978-3-642-36143-2_18
xxii Singandhupe, R.B., Manikandan, A., Blaise, D. and Chattaraj, S. 2020. Climate reactive strategies for
improving cotton yield: A case study of Gujarat State, India. International Journal of Irrigation and Water
Management Vol. 7(5), pp. 001-0014. Available from:
https://www.researchgate.net/profile/Ramlal_Singandhupe/publication/342121717_Climate_reactive_strateg
ies_for_improving_cotton_yield_A_case_study_of_Gujarat_State_India/links/5ee37052299bf1faac4e8bb3/Cli
mate-reactive-strategies-for-improving-cotton-yield-A-case-study-of-Gujarat-State-India.pdf
xxiii Zala, M.B., Thumar, R.R., Bharpoda, T.M., Borad, P.K. 2015. Emerging inspect pests of Bt cotton in middle
Gujarat. Agricultural research station. Cotton Association of India. 2015, Nov 24. Cotton Statistics and News;
History of Cotton in Gujarat. No. 34. Available from:
137
Physical Climate Risk and Vulnerability Assessment: India Analysis
https://www.researchgate.net/publication/303550626_Emerging_insect_pests_of_Bt_cotton_in_Middle_guja
rat
xxiv CICR. 2019. Available from: https://www.cicr.org.in/
xxv Choudhary, B., and Gaur, B. 2010. Bt Cotton in India: A country profile. ISAAA series of Biotech Crop
Profiles. Available from:
https://www.isaaa.org/resources/publications/biotech_crop_profiles/bt_cotton_in_india-
a_country_profile/download/Bt_Cotton_in_India-A_Country_Profile.pdf
xxvi Textile Exchange. 2018. Organic Cotton Market Report 2018. Available from:
https://textileexchange.org/wp-content/uploads/2018/11/2018-Organic-Cotton-Market-Report.pdf
xxvii Open Data Telangana. 2020. Agricultural Land Holdings. Available from:
https://data.telangana.gov.in/dataset/agricultural-land-holdings
xxviii Open Data Telangana. 2020. Agricultural Land Holdings. Available from:
https://data.telangana.gov.in/dataset/agricultural-land-holdings
xxix Reindl, M., Gupta, P., Subramanian, S., Kaur, R., and Rani, D. 2019. Towards Doubling Cotton Farmer
Incomes in Maharashtra. IDH and Technoserve. Available from :
https://www.idhsustainabletrade.com/uploaded/2019/05/Doubling-Cotton-Farmer-Incomes-in-
Maharashtra.pdf
xxx Kannuri, N.K. and Jadhav, S. 2018. Generating toxic landscapes: impact on well-being of cotton farmers in
Telangana, India. Anthropology & Medicine, 25(2), pp.121-140. Available from :
https://www.tandfonline.com/doi/full/10.1080/13648470.2017.1317398
xxxi Kannuri, N.K. and Jadhav, S. 2018. Generating toxic landscapes: impact on well-being of cotton farmers in
Telangana, India. Anthropology & Medicine, 25(2), pp.121-140. Available from :
https://www.tandfonline.com/doi/full/10.1080/13648470.2017.1317398
xxxii Assessing Climate Change Vulnerability and Adaptation Strategies for Maharashtra: Maharashtra State
Adaptation Action Plan on Climate Change (MSAAPC). Available from:
https://www.teriin.org/projects/nutrition-security/files/Maharashtra-CC-Report.pdf
xxxiii ICAR. 2016. District Agricultural Contingency Plans for Managing Weather Aberrations and Sustainable
Agriculture. Available from: http://www.icar-crida.res.in/DACP%20brochure%202016.pdf
xxxiv Gujarat State Action Plan on Climate Change. 2014. Available from : http://gujenvis.nic.in/PDF/Gujarat-
SAPCC.pdf
xxxv ICAR. 2016. District Agricultural Contingency Plans for Managing Weather Aberrations and Sustainable
Agriculture. Available from: http://www.icar-crida.res.in/DACP%20brochure%202016.pdf
xxxvi State Action Plan on Climate Change for Telangana State. 2017. Available from: http://moef.gov.in/wp-
content/uploads/2017/09/Telangana.pdf
xxxvii ICAR. 2016. District Agricultural Contingency Plans for Managing Weather Aberrations and Sustainable
Agriculture. Available from: http://www.icar-crida.res.in/DACP%20brochure%202016.pdf
xxxviii Telangana Textiles and Apparel Policy 2017-18. Available from:
http://industries.telangana.gov.in/Library/Textile%20policy.pdf
xxxix The Hindu Business. 2013. Textile mills will suffer once Telangana turns cotton hub. Available from :
https://www.thehindubusinessline.com/economy/textile-mills-will-suffer-once-telangana-turns-cotton-
hub/article20650158.ece1
138
Physical Climate Risk and Vulnerability Assessment: India Analysis
xl Financial express. 2019. Cotton crunch: Maharashtra ginning units working 40% capacity. Available from :
https://www.financialexpress.com/industry/cotton-crunch-maharashtra-ginning-units-working-at-40-
capacity/1538492/
xli Financial express. 2019. Cotton crunch: Maharashtra ginning units working 40% capacity. Available from :
https://www.financialexpress.com/industry/cotton-crunch-maharashtra-ginning-units-working-at-40-
capacity/1538492/
xlii Doing buisness in Maharashtra. Textiles. Available from:
http://www.doingbusinessinmaharashtra.org/Textiles.aspx
xliii Government of India. Maharashtra: Textile Sector. Available from:
https://maitri.mahaonline.gov.in/PDF/Textile%20Sector.pdf
xliv Financial express. 2019. 800 Gujarat ginning factories facing acute shortage of cotton. Available from:
https://www.financialexpress.com/industry/800-gujarat-ginning-factories-facing-acute-shortage-of-
cotton/1553721/
xlv Gujarat cotton ginning industry being ‘overcrowded’ becomes house of NPAs: Expert. 2016. Available from: https://knnindia.co.in/news/newsdetails/economy/gujarat-cotton-ginning-industry-being-overcrowded-becomes-house-of-npas-expert
xlvi Safety and health of labourers in cotton ginning industries in Gujarat. Available from:
http://prayaschittor.org/safetyhl.pdf
xlvii Safety and health of labourers in cotton ginning industries in Gujarat. Available from:
http://prayaschittor.org/safetyhl.pdf
xlviii The Fashionating World. 2016. Gujarat cotton ginning industry saddled with NPAS. Available from:
https://www.fashionatingworld.com/new1-2/gujarat-cotton-ginning-industry-saddled-with-npas
xlix ASSOCHAM. 2019. Gujarat: The growing engine for textile and apparel manufacturing. Available from:
https://wazir.in/pdf/Wazir%20Advisors%20-%20Vibrant%20Gujarat%20Whitepaper%20-
%2023Jan2019.pdf
l ASSOCHAM. 2019. Gujarat: The growing engine for textile and apparel manufacturing. Available from:
https://wazir.in/pdf/Wazir%20Advisors%20-%20Vibrant%20Gujarat%20Whitepaper%20-
%2023Jan2019.pdf
li The Textile Magazine. 2013. Gujarat textile industry in for major transformation. Available from:
https://www.indiantextilemagazine.in/industry-news/gujarat-textile-industry-major-transformation/
lii ASSOCHAM. 2019. Gujarat: The growing engine for textile and apparel manufacturing. Available from:
https://wazir.in/pdf/Wazir%20Advisors%20-%20Vibrant%20Gujarat%20Whitepaper%20-
%2023Jan2019.pdf
liii The Hindu Times. 2020. Ginning mills appeal to TS govt for support. Available from: https://www.thehindu.com/news/national/telangana/ginning-mills-appeal-to-ts-govt-for-support/article31559638.ece
liv The Hindu Times. 2020. Ginning mills appeal to TS govt for support. Available from:
https://www.thehindu.com/news/national/telangana/ginning-mills-appeal-to-ts-govt-for-
support/article31559638.ece
lv Telangana Textiles and Apparel Policy 2017-18. Available from:
http://industries.telangana.gov.in/Library/Textile%20policy.pdf
lvi Telangana Textiles and Apparel Policy 2017-18. Available from:
http://industries.telangana.gov.in/Library/Textile%20policy.pdf;
139
Physical Climate Risk and Vulnerability Assessment: India Analysis
lvii Telangana Textiles and Apparel Policy 2017-18. Available from:
http://industries.telangana.gov.in/Library/Textile%20policy.pdf;.
lviii Telangana Textiles and Apparel Policy 2017-18. Available from:
http://industries.telangana.gov.in/Library/Textile%20policy.pdf;.
Part C: Discussion: Paving the way forward
i International Labour Organization. 2019. Working on a warmer planet. Available from :
https://www.ilo.org/global/about-the-ilo/newsroom/news/WCMS_711917/lang--en/index.htm
ii Tripathi, B. 2020. Vulnerable to rise in temperature, India needs to take heatwave seriously. Available from :
https://www.business-standard.com/article/current-affairs/vulnerable-to-rise-in-temperature-india-needs-
to-take-heatwave-seriously-120062001309_1.html
iii International Labour Organization. 2019. Working on a warmer planet. Available from :
https://www.ilo.org/global/about-the-ilo/newsroom/news/WCMS_711917/lang--en/index.htm
iv Guleria, S & Gupta, A. 2016. Heat Wave in India: Documentation of State of Telangana and Odisha.
Available from: https://nidm.gov.in/PDF/pubs/heat_wave_18.pdf
v Ratnam, J.V., Behera, S.K., Ratna, S.B., Rajeevan, M. and Yamagata, T. 2016. Anatomy of Indian
heatwaves. Scientific reports, 6, p.24395. Available from: https://www.nature.com/articles/srep24395
vi Government of Telangana. 2020. The Telangana State Heatvwae Action Plan. Available from :
https://tsdps.telangana.gov.in/downloads/Action_Plan_2020.pdf
vii Government of Telangana. 2019. Making Telangana a Cool State: State Wide Cool Roofs Program.
Available from :
https://tsredco.telangana.gov.in/PDFs/Telangana_Cool_Roofs_Policy_for_Public_Comments.pdf
viii Government of Telangana. 2019. Making Telangana a Cool State: State Wide Cool Roofs Program.
Available from :
https://tsredco.telangana.gov.in/PDFs/Telangana_Cool_Roofs_Policy_for_Public_Comments.pdf
ix FAO. 2020. Cotton. Available from: http://www.fao.org/land-water/databases-and-software/crop-
information/cotton/en/
x International Trade Centre. 2011. Cotton and Climate Change: Impacts and options to mitigate and adapt.
Available from: https://www.intracen.org/Cotton-and-Climate-Change-Impacts-and-options-to-mitigate-
and-adapt/
xi FAO. 2020. Available from : http://www.fao.org/land-water/databases-and-software/crop-
information/cotton/en/
xii Loo, Y.Y., Billa, L. and Singh, A. 2015. Effect of climate change on seasonal monsoon in Asia and its impact
on the variability of monsoon rainfall in Southeast Asia. Geoscience Frontiers, 6(6), pp.817-823.. Available
from : https://www.sciencedirect.com/science/article/pii/S167498711400036X
xiii IDH - The Sustainable Trade Initiative. Cotton. Available from:
https://www.idhsustainabletrade.com/sectors/cotton/
xiv IDH - The Sustainable Trade Initiative. Securing Smallholder Livelihoods in Rainfed Maharashtra. 2020.
Available from : https://www.idhsustainabletrade.com/initiative/securing-smallholder-livelihoods-in-rainfed-
maharashtra/
140
Physical Climate Risk and Vulnerability Assessment: India Analysis
xv Down to Earth. 2020. Two sides of the same coin: Shrinking water bodies and urban floods. Available
from: https://www.downtoearth.org.in/news/urbanisation/two-sides-of-the-same-coin-shrinking-water-
bodies-and-urban-floods-72702
xvi Sandeep, V. et al. 2020. Water Supply, Urbanization and Climate Change. In: Kumar M., Munoz-Arriola F.,
Furumai H., Chaminda T. (eds) Resilience, Response, and Risk in Water Systems. Springer Transactions in
Civil and Environmental Engineering. Springer, Singapore. Available from:
https://link.springer.com/chapter/10.1007/978-981-15-4668-6_11
xvii Langa, M. 2019. Gujarat facing massive water crisis. Available from:
https://www.thehindu.com/news/national/other-states/gujarat-facing-massive-water-
crisis/article27085712.ece
xviii The Times of India. 2020. Rajkot stares at water scarcity. Available from: https://timesofindia.indiatimes.com/city/rajkot/rajkot-stares-at-water-scarcity/articleshow/74632461.cms
xix Shaikh, M.A. 2009. Water conservation in the textile industry. Available from:
https://sswm.info/sites/default/files/reference_attachments/SHAKIH%202009%20Water%20conservation
%20in%20the%20textile%20industry.pdf
xx Perveen, S. et al. 2012. India’s deeping water crisis?: Water risk for Indian industries. Columbia Water
Centre. Available from: http://water.columbia.edu/files/2012/06/FICCI_CWC_IndiaWaterCrisisPaper.pdf
xxi Institute for Sustainable Communities, 2019. Identifying Indian Textile Water Best Practices with the
Women + Water Alliance Available from: https://sustain.org/ww-alliance-bps/
xxii Peddi, D., and Kumar, K. 2020. Farmers’ perceptions about soil erosion in rainfed areas of Telangana,
India. J Public Affairs, e. 2374. Available from: https://onlinelibrary.wiley.com/doi/abs/10.1002/pa.2374
xxiii Anantha, K. H., & Wani, S. P. 2016. Evaluation of cropping activities in the Adarsha watershed project,
southern India. Food Security, 8(5), 885–897. Available from:
https://link.springer.com/article/10.1007/s12571-016-0613-7
xxiv Bahinipati, C.S. et al. 2015. Flood-induced economic loss and damage to the textile industry in Surat City,
India. ACCRN Working Paper Series 26:2015. https://pubs.iied.org/pdfs/10749IIED.pdf
xxv Improving Surat’s flood resilience. 2015. Available from : https://www.clc.gov.sg/docs/default-
source/urban-solutions/urb-sol-iss-7-pdfs/case-study-improving-surat's-flood-resilience.pdf
xxvi IDH – The sustainable trade initiative. 2019. Business case for gender mainstreaming in cotton in
Maharashtra. Available from : https://www.idhsustainabletrade.com/uploaded/2019/05/Business-case-for-
gender-mainstreaming-in-cotton-in-Maharashtra.pdf
xxvii Cotton Connect. Planting the seed: A journey to gender equality in the cotton industry. Available from:
http://cottonconnect.org/wp-content/uploads/cc_planting_the_seed_final-1-1.pdf
xxviii IDH and Sattva. 2019. Business case for gender mainstreaming in cotton in Maharashtra. Available from: https://www.idhsustainabletrade.com/uploaded/2019/05/Business-case-for-gender-mainstreaming-in-cotton-in-Maharashtra.pdf
xxix Mala, P. 2016. Socio-Economic profile of women working in textile units of Tiruppur district in Tamil Nadu.
International Journal of Multidisciplinary Research and Development. Available from:
http://www.allsubjectjournal.com/archives/2016/vol3/issue1/2-9-85
xxx Mala, P. 2016. Socio-Economic profile of women working in textile units of Tiruppur district in Tamil Nadu.
International Journal of Multidisciplinary Research and Development. Available from:
http://www.allsubjectjournal.com/archives/2016/vol3/issue1/2-9-85
141
Physical Climate Risk and Vulnerability Assessment: India Analysis
xxxi Ministry of Textiles. 2019. Fourth all India handloom census. Government of India. Available from:
http://handlooms.nic.in/writereaddata/3736.pdf
xxxiiChoudhary, S. 2020. With silent looms, crisis loom for handloom weavers and allied-workers. DNA.
Available from: https://www.dnaindia.com/business/report-with-silent-looms-crisis-loom-for-handloom-
weavers-and-allied-workers-2823912
xxxiii Choudhary, S. 2020. With silent looms, crisis loom for handloom weavers and allied-workers. DNA.
Available from: https://www.dnaindia.com/business/report-with-silent-looms-crisis-loom-for-handloom-
weavers-and-allied-workers-2823912
xxxiv Ministry of Textiles. 2019. Fourth all India handloom census. Government of India. Available from:
http://handlooms.nic.in/writereaddata/3736.pdf
xxxv Ministry of Textiles. 2019. Fourth all India handloom census. Government of India. Available from:
http://handlooms.nic.in/writereaddata/3736.pdf
xxxvi Choudhary, S. 2020. With silent looms, crisis loom for handloom weavers and allied-workers. DNA.
Available from: https://www.dnaindia.com/business/report-with-silent-looms-crisis-loom-for-handloom-
weavers-and-allied-workers-2823912
xxxvii Elets e-gov. 2019. Ministry of Textiles launches women-empowerment schemes. Available from:
https://egov.eletsonline.com/2019/03/ministry-of-textiles-launches-women-empowerment-schemes/
xxxviii Elets e-gov. 2019. Ministry of Textiles launches women-empowerment schemes. Available from:
https://egov.eletsonline.com/2019/03/ministry-of-textiles-launches-women-empowerment-schemes/
xxxix Batool, S. and Saeed, F. 2018. Towards a Climate Resilient Cotton Value Chain in Pakistan:
Understanding Key Risks, Vulnerabilities and Adaptive Capacities. Pathways to Resilience in Semi-Arid
Economies (PRISE) Working Paper. Overseas Development Institute. Available from:
https://www.researchgate.net/publication/327069395_Towards_a_climate_resilient_cotton_value_chain_in_
Pakistan_Understanding_key_risks_vulnerabilities_and_adaptive_capacities
xl Agarwal, B. 2018. Can group farms outperform individual family farms? Empirical insights from India. World
Development, 108, pp.57-73. Available from:
https://www.sciencedirect.com/science/article/pii/S0305750X18300913
xli Kumar, S.V. 2019. Reversing land degradation in India. Teri: The Energy and Resources Institute. Available
from : https://www.teriin.org/article/reversing-land-degradation-india
xlii Kranthi, K.R. and Stone, G.D., 2020. Long-term impacts of Bt cotton in India. Nature Plants, 6(3), pp.188-
196. Available from: https://www.nature.com/articles/s41477-020-0615-5
xliii Kranthi, K.R. and Stone, G.D., 2020. Long-term impacts of Bt cotton in India. Nature Plants, 6(3), pp.188-
196. Available from: https://www.nature.com/articles/s41477-020-0615-5
xliv Cotton Connect. 2020. Laudes Foundation. Available from: http://cottonconnect.org/portfolio-posts/ca-
foundation-organic-cotton-case-study/
xlv Cotton Connect. 2020. Planting the Seed: The Role of Organic in Creating a Sustainable Supply Chain.
Available from: http://cottonconnect.org/wp-content/uploads/the-role-of-organic-cotton-in-creating-a-
sustainable-cotton-supply-chain.pdf
xlvi Hughes, K. 2020. “Technology critical to unlocking the agricultural potential of cotton”. Trade for
Development News. Available from: https://trade4devnews.enhancedif.org/en/op-ed/technology-critical-
unlocking-agricultural-potential-cotton
xlviiWWF-India. 2012. Cotton Market and Sustainability in India. Available from:
http://awsassets.wwfindia.org/downloads/cotton_market_and_sustainability_in_india.pdf
142
Physical Climate Risk and Vulnerability Assessment: India Analysis
xlviii WWF-India. 2012. Cotton Market and Sustainability in India. Available from:
http://awsassets.wwfindia.org/downloads/cotton_market_and_sustainability_in_india.pdf
xlix Telangana Textiles and Apparel Policy 2017-18. Available from:
http://industries.telangana.gov.in/Library/Textile%20policy.pdf
l Telangana Textiles and Apparel Policy 2017-18. Available from:
http://industries.telangana.gov.in/Library/Textile%20policy.pdf
li The Econoic Times. 2017. Telangana govt offers incentives to textiles industry. Available from:
https://retail.economictimes.indiatimes.com/news/apparel-fashion/apparel/telangana-govt-offers-
incentives-to-textiles-industry/60132570
lii International Institute for Sustainable Development (IISD). 2007. Available from :
https://www.iisd.org/system/files/publications/trade_price_case_cottonyarn.pdf
liii Ramasundaram, P., Gajbhiye, H. 2011. Constraints to cotton production in India. CICR Technical Bulletin no.
19. Available from: https://www.cicr.org.in/pdf/constraint_cotton.pdf
liv Financial Express Bureau. 2019. High production, decline in exports may affect cotton prices. Available
from: https://www.financialexpress.com/industry/cotton-msp-textile-industry-seeks-proper-delivery-
mechanism-revamp-of-cci/1234516/
lv Kamat, V. 2019. Spinning mills face margin pressure on weak yarn demand, high cotton prices. Available
from: https://www.livemint.com/market/mark-to-market/spinning-mills-face-margin-pressure-on-weak-
yarn-demand-high-cotton-prices-11577633126482.html
lvi Grandhi, V.S., Crawford, A. 2007. Price Volatility in the Cotton Yarn Industry: Lessons from India.
International Institute for Sustainable Development. Available from:
https://www.iisd.org/system/files/publications/trade_price_case_cottonyarn.pdf
lvii International Institute for Sustainable Development (IISD). 2007. Available from :
https://www.iisd.org/system/files/publications/trade_price_case_cottonyarn.pdf
lviii Ramasundaram, P., Gajbhiye, H. 2011. Constraints to cotton production in India. CICR Technical Bulletin
no. 19. Available from: https://www.cicr.org.in/pdf/constraint_cotton.pdf
lix Reindl, M. et al. 2019. Towards doubling cotton farmer incomes in Maharashtra. IDH the Sustainable Trade
Initiative and Technoserve. Available from:
https://www.idhsustainabletrade.com/uploaded/2019/05/Doubling-Cotton-Farmer-Incomes-in-
Maharashtra-1.pdf
lx Grandhi, V.S., Crawford, A. 2007. Price Volatility in the Cotton Yarn Industry: Lessons from India.
International Institute for Sustainable Development. Available from:
https://www.iisd.org/system/files/publications/trade_price_case_cottonyarn.pdf
lxi IDH. 2019. Business case for gender mainstreaming in Maharashtra. Available from:
https://www.idhsustainabletrade.com/uploaded/2019/05/Business-case-for-gender-mainstreaming-in-
cotton-in-Maharashtra.pdf
lxii IDH. 2019. Towards doubling cotton farmer incomes in Maharashtra. Available from:
https://www.idhsustainabletrade.com/uploaded/2019/05/Doubling-Cotton-Farmer-Incomes-in-
Maharashtra-1.pdf
lxiii Fairtrade. Chetna organic agriculture producer company ltd, India. Available from:
https://www.fairtrade.org.uk/farmers-and-workers/cotton/chetna-organic-agriculture-producer-company-
ltd/
143
Physical Climate Risk and Vulnerability Assessment: India Analysis
lxiv TechnoServe. 2018. Cultivating Change for Women Farmers through Cotton. Available from :
https://www.technoserve.org/blog/cultivating-change-in-cotton/
lxv TechnoServe. 2018. Cultivating Change for Women Farmers through Cotton. Available from :
https://www.technoserve.org/blog/cultivating-change-in-cotton/
lxvi IFAD. Adaptation for Smallholder Agriculture Programme. Available from: https://www.ifad.org/en/asap
lxvii IFAD. Adaptation for Smallholder Agriculture Programme. Available from: https://www.ifad.org/en/asap
lxviii Morawczynski, O., Hutchful, D., Cutrell, E. and Rangaswamy, N. 2010, December. The bank account is not
enough: Examining strategies for financial inclusion in India. In Proceedings of the 4th ACM/IEEE
international conference on information and communication technologies and development (pp. 1-11).
Available from:
https://www.researchgate.net/publication/255564251_The_Bank_Account_is_not_Enough_Examining_Strate
gies_for_Financial_Inclusion_in_India
lxix Morawczynski, O., Hutchful, D., Cutrell, E. and Rangaswamy, N. 2010, December. The bank account is not
enough: Examining strategies for financial inclusion in India. In Proceedings of the 4th ACM/IEEE
international conference on information and communication technologies and development (pp. 1-11).
Available from:
https://www.researchgate.net/publication/255564251_The_Bank_Account_is_not_Enough_Examining_Strate
gies_for_Financial_Inclusion_in_India
lxx Better Cotton Initative. 2018. WWF-India Improves Access to Technology for Tens of Thousands of
Cotton Farmers. Available from : https://bettercotton.org/blog/wwf-india-improves-access-to-technology-
for-tens-of-thousands-of-cotton-farmers/
lxxi Varukolu, V. 2007. Technology adoption of Indian garment manufacturing firms. Available from :
https://digitalcommons.lsu.edu/cgi/viewcontent.cgi?article=4604&context=gradschool_theses
lxxii Ministry of Micro, Small and Medium Enterprises. Government of India. “Promotion of Information &
Communication Technology (ICT) in Indian MSME Sector.” Available from:
http://www.dcmsme.gov.in/schemes/ictdetail.pdf
Glossary
lxxiii IPCC. 2014. Annex II: Glossary [Mach, K.J., S. Planton and C. von Stechow (eds.)]. In: Cli-mate Change
2014: Synthesis Report. Contribution of Working Groups I, II and III to the Fifth Assessment Report of the
Intergovernmental Panel on Climate Change [Core Writing Team, R.K. Pachauri and L.A. Meyer (eds.)]. IPCC,
Geneva, Switzerland, pp. 117-130. Available from: https-
//www.ipcc.ch/site/assets/uploads/2019/01/SYRAR5-Glossary_en.pdf
lxxiv Climate ADAPT. Identifying adaptation options: Creating a catalogue of relevant adaptation options.
Available from: https-//climate-adapt.eea.europa.eu/knowledge/tools/urban-ast/step-3-1
lxxv IPCC. 2018. Annex I: Glossary [Matthews, J.B.R. (ed.)]. In: Global Warming of 1.5°C. An IPCC Special Report on the impacts of global warming of 1.5°C above pre-industrial levels and related global greenhouse gas emission pathways, in the context of strengthening the global response to the threat of climate change, sustainable development, and efforts to eradicate poverty [Masson-Delmotte, V., P. Zhai, H.-O. Pörtner, D. Roberts, J. Skea, P.R. Shukla, A. Pirani, W. Moufouma-Okia, C. Péan, R. Pidcock, S. Connors, J.B.R. Matthews, Y. Chen, X. Zhou, M.I. Gomis, E. Lonnoy, T. Maycock, M. Tignor, and T. Waterfield (eds.)]. Available from: https-//www.ipcc.ch/sr15/chapter/glossary
lxxvi UNFCCC. Article 1. Available from: https-//unfccc.int/resource/ccsites/zimbab/conven/text/art01.htm
144
Physical Climate Risk and Vulnerability Assessment: India Analysis
lxxvii IPCC. 2014. Annex II: Glossary [Mach, K.J., S. Planton and C. von Stechow (eds.)]. In: Cli-mate Change
2014: Synthesis Report. Contribution of Working Groups I, II and III to the Fifth Assessment Report of the
Intergovernmental Panel on Climate Change [Core Writing Team, R.K. Pachauri and L.A. Meyer (eds.)]. IPCC,
Geneva, Switzerland, pp. 117-130. Available from: https-
//www.ipcc.ch/site/assets/uploads/2019/01/SYRAR5-Glossary_en.pdf
lxxviii IPCC. 2018. Annex I: Glossary [Matthews, J.B.R. (ed.)]. In: Global Warming of 1.5°C. An IPCC Special
Report on the impacts of global warming of 1.5°C above pre-industrial levels and related global greenhouse
gas emission pathways, in the context of strengthening the global response to the threat of climate change,
sustainable development, and efforts to eradicate poverty [Masson-Delmotte, V., P. Zhai, H.-O. Pörtner, D.
Roberts, J. Skea, P.R. Shukla, A. Pirani, W. Moufouma-Okia, C. Péan, R. Pidcock, S. Connors, J.B.R. Matthews,
Y. Chen, X. Zhou, M.I. Gomis, E. Lonnoy, T. Maycock, M. Tignor, and T. Waterfield (eds.)]. Available from:
https-//www.ipcc.ch/sr15/chapter/glossary
lxxix World Meteorological Organisation. 2019. Commission for Climatology. Available from:
http://www.wmo.int/pages/prog/wcp/ccl/faqs.php
lxxx World Meteorological Organisation. 2019. Commission for Climatology. Available from:
http://www.wmo.int/pages/prog/wcp/ccl/faqs.php.
lxxxi Institute of Medicine (US) Forum on Microbial Threats. 2008. Global Climate Change and Extreme
Weather Events: Understanding the Contributions to Infectious Disease Emergence: Workshop Summary.
Available from: https://www.ncbi.nlm.nih.gov/books/NBK45750/
lxxxii IPCC. 2018. Annex I: Glossary [Matthews, J.B.R. (ed.)]. In: Global Warming of 1.5°C. An IPCC Special
Report on the impacts of global warming of 1.5°C above pre-industrial levels and related global greenhouse
gas emission pathways, in the context of strengthening the global response to the threat of climate change,
sustainable development, and efforts to eradicate poverty [Masson-Delmotte, V., P. Zhai, H.-O. Pörtner, D.
Roberts, J. Skea, P.R. Shukla, A. Pirani, W. Moufouma-Okia, C. Péan, R. Pidcock, S. Connors, J.B.R. Matthews,
Y. Chen, X. Zhou, M.I. Gomis, E. Lonnoy, T. Maycock, M. Tignor, and T. Waterfield (eds.)]. Available from:
https-//www.ipcc.ch/sr15/chapter/glossary
lxxxiii IPCC. 2014. Annex II: Glossary [Mach, K.J., S. Planton and C. von Stechow (eds.)]. In: Cli-mate Change
2014: Synthesis Report. Contribution of Working Groups I, II and III to the Fifth Assessment Report of the
Intergovernmental Panel on Climate Change [Core Writing Team, R.K. Pachauri and L.A. Meyer (eds.)]. IPCC,
Geneva, Switzerland, pp. 117-130. Available from: https-
//www.ipcc.ch/site/assets/uploads/2019/01/SYRAR5-Glossary_en.pdf
lxxxiv IPCC. 2014. Annex II: Glossary [Mach, K.J., S. Planton and C. von Stechow (eds.)]. In: Cli-mate Change
2014: Synthesis Report. Contribution of Working Groups I, II and III to the Fifth Assessment Report of the
Intergovernmental Panel on Climate Change [Core Writing Team, R.K. Pachauri and L.A. Meyer (eds.)]. IPCC,
Geneva, Switzerland, pp. 117-130. Available from: https-
//www.ipcc.ch/site/assets/uploads/2019/01/SYRAR5-Glossary_en.pdf
lxxxv IPCC. 2014. Annex II: Glossary [Mach, K.J., S. Planton and C. von Stechow (eds.)]. In: Cli-mate Change
2014: Synthesis Report. Contribution of Working Groups I, II and III to the Fifth Assessment Report of the
Intergovernmental Panel on Climate Change [Core Writing Team, R.K. Pachauri and L.A. Meyer (eds.)]. IPCC,
Geneva, Switzerland, pp. 117-130. Available from: https-
//www.ipcc.ch/site/assets/uploads/2019/01/SYRAR5-Glossary_en.pdf
lxxxvi IPCC. 2018. Annex I: Glossary [Matthews, J.B.R. (ed.)]. In: Global Warming of 1.5°C. An IPCC Special
Report on the impacts of global warming of 1.5°C above pre-industrial levels and related global greenhouse
gas emission pathways, in the context of strengthening the global response to the threat of climate change,
sustainable development, and efforts to eradicate poverty [Masson-Delmotte, V., P. Zhai, H.-O. Pörtner, D.
Roberts, J. Skea, P.R. Shukla, A. Pirani, W. Moufouma-Okia, C. Péan, R. Pidcock, S. Connors, J.B.R. Matthews,
145
Physical Climate Risk and Vulnerability Assessment: India Analysis
Y. Chen, X. Zhou, M.I. Gomis, E. Lonnoy, T. Maycock, M. Tignor, and T. Waterfield (eds.)]. Available from:
https-//www.ipcc.ch/sr15/chapter/glossary
Appendix 1: Methodology
i UNFCCC. 2008. Resource Guide for Preparing the National Communications of Non-Annex I Parties – Module 2: Vulnerability and Adaptation to Climate Change. Available from: https://unfccc.int/resource/docs/publications/08_resource_guide2.pdf
ii GIZ. 2014. A Framework for Climate Change Vulnerability Assessments (India). Available from:
https://www.adaptationcommunity.net/?wpfb_dl=236
iii The Toolkit for Vulnerability and Adaptation Training by the Stockholm Environment Institute. 2014. Available from: https://www.sei.org/projects-and-tools/tools/
iv Gender and Climate Change Research in Agriculture and Food Security for Rural Development by the Food and Agriculture Organization. 2011. Available from: http://www.fao.org/climatechange/29830-0beb869615795a9960ada6400c62b3783.pdf
v CARE. 2009. Climate Vulnerability and Capacity Analysis Handbook. Available from: https://careclimatechange.org/wp-content/uploads/2016/06/CARE-CVCA-Handbook-EN-v0.8-web.pdf
vi Handbook on Vulnerability and Adaptation Assessment. 2008. Available from: https://unfccc.int/resource/cd_roms/na1/v_and_a/
vii UNFCCC. 2020. The Paris Agreement. Available from: https://unfccc.int/process-and-meetings/the-paris-
agreement/the-paris-agreement
viii IPCC. 2019: Summary for Policymakers. In: IPCC Special Report on the Ocean and Cryosphere in a
Changing Climate [H.- O. Portner, D.C. Roberts, V. Masson-Delmotte, P. Zhai, M. Tignor, E. Poloczanska, K.
Mintenbeck, M. Nicolai, A. Okem, J. Petzold, B. Rama, N. Weyer (eds.)]. Available from:
https://www.ipcc.ch/srocc/