Embed Size (px)
Citation preview

HYDROLOGICAL PROCESSESHydrol. Process. 16, 2559–2575 (2002)Published online 18 April 2002 in Wiley InterScience (www.interscience.wiley.com). DOI: 10.1002/hyp.1048
Physical controls on septic leachate movement in thevadose zone at the hillslope scale, Putnam County,
New York, USA
Mark D. Sherlock,1* Jeffrey J. McDonnell,2 Debra S. Curry3 and Albert T. Zumbuhl3
1 Department of Geography, National University of Singapore, 1 Arts Link, Kent Ridge, Singapore 1175702 Department of Forest Engineering, Oregon State University, Corvallis, Oregon 97331-5706
3 College of Environmental Science and Forestry, State University of New York, Syracuse, NY 13210, USA
Abstract:
The fate and transport of contaminants in the vicinity of septic fields remains poorly understood in many hydroge-omorphological environments. We report hydrometric data from an intensive hillslope-scale experiment conductedbetween 29 August and 11 November 1998 at a residential leach field in New York State. The objective of our studywas to characterize water flux within the vadose zone, understand the physical controls on the flux, and predict howthis ultimately will affect subsurface water quality. Soil-water flux was calculated using matric potential measurementsfrom a network of 25 tensiometer nests, each nest consisting of three tensiometers installed to depths of 10, 50 and130 cm. Unsaturated hydraulic conductivity curves were derived at each depth from field-determined time-domainreflectometry–tensiometry moisture-release curves and borehole permeametry measurements. Flownets indicated thata strong upward flux of soil water occurred between rainstorms. Following the onset of (typically convective) rainfall,low near-surface matric potentials were rapidly converted to near-saturated and saturated conditions, promoting steepvertical gradients through the near-surface horizons of the hillslope. Lateral hydraulic gradients were typically 10 timessmaller than the vertical gradients. Resultant flow vectors showed that the flux was predominantly vertical through thevadose zone, and that the flux response to precipitation was short-lived. The flux response was controlled primarilyby the shape of the unsaturated hydraulic conductivity curves, which indicated a rapid loss of conductivity belowsaturation. Thus, soil water had a very high residence time in the vadose zone. The absence of rapid wetting at 130 cmand the delayed and small phreatic zone response to rainfall indicated that water movement through macropores didnot occur on this hillslope. These results are consistent with a Cl tracing experiment, which demonstrated that thetracer was retained in the vadose zone for several months after injection to the system. Copyright 2002 John Wiley& Sons, Ltd.
KEY WORDS vadose zone; septic leachate; flow pathways
INTRODUCTION
The fate and transport of subsurface contaminants in many hydrogeological settings remain poorly understood.As human population places increased demands upon surface and groundwater reservoirs for water supply,there is an urgent need to understand the processes controlling the subsurface transport of contaminants.Conventional septic tank and leach-field systems are now used in 24% of USA households for on-sitewastewater disposal (Bureau of the Census, 1992). Septic systems are being used in denser populationsettings around urban fringes, as low-density residential populations expand into suburban zones. In the NewYork City (NYC) area of the USA, these suburban neighbourhoods are located directly in the water supplycatchments for the larger metropolitan area. According to census data from the New York City Department of
* Correspondence to: M. D. Sherlock, Department of Geography, National University of Singapore, 1 Arts Link, Kent Ridge, Singapore117570. E-mail: [email protected]
Received 28 April 2000Copyright 2002 John Wiley & Sons, Ltd. Accepted 9 August 2001
2560 M. D. SHERLOCK ET AL.
Environmental Protection, about 20 000 conventional septic tank systems are now in use within these watersupply catchments. Despite growing public awareness, there are few robust studies on the effects of theseseptic systems on groundwater and surface water quality at the hillslope and catchment scale.
A typical septic system comprises a septic tank from which clarified effluent flows by gravity to a networkof drainage lines, which distribute the effluent into the soil. Although septic tanks may remove a considerableamount of total suspended solids from household wastewater through settling (Canter and Knox, 1985), theyhave rather limited ability to reduce biochemical oxygen demand (BOD) and total nitrogen (N) owing to thepredominant anaerobic conditions (Lawrence, 1973; Canter and Knox, 1985). The receiving vadose zone soilsaround the distribution lines are relied upon to provide much of the wastewater treatment. However, septicsystem designs are based primarily upon soil percolation rates and hydraulic loadings, without considerationbeing given to the effectiveness of the soil in removing pollutants (Huang, 1999). The nitrogen removalcapability of these systems is a primary concern for groundwater contamination. In general, septic tankeffluents contain large amounts of total Kjeldahl nitrogen (organic nitrogen plus ammonium) and very littlenitrate (NO�
3 ). Oxidation of organic nitrogen and ammonium (NHC4 ) to NO�
3 occurs quickly in the vadosezone beneath the leachlines and causes elevated concentration of NO�
3 in groundwater (Wilhelm et al., 1996).Recently, Heisig (2000) has shown that baseflow concentrations of NO�
3 and Cl were directly proportionalto septic system density in 30 subcatchments of the Croton Watershed, located in the greater metropolitanarea of NYC. Elsewhere, Wernick et al. (1998) demonstrated the effect of septic system density and locationon NO�
3 loadings in the Salmon River near Vancouver, Canada. Thus, there is a connection between septicloading and groundwater NO�
3 concentrations. Indeed, our work has shown that groundwater wells up to30 m down-gradient of leachate distribution lines show elevated NO�
3 levels at various times of the year inthe Croton watershed, several times in excess of the U.S. Environmental Protection Agency drinking waterquality standard (Curry, 1999).
The efficiency and functionality of septic systems is highly dependent on site-specific factors such assoil physical properties and soil-water energy distributions (Amoozegar, 1997). Although several studies inthe NYC area (Curry, 1999) and elsewhere (Harman et al., 1996) have shown how migration of leachate-rich water occurs in the phreatic zone, the controls on water and leachate movement in the vadose zonein, around and downslope from leachfields is not well described. In North Carolina, Penninger and Hoover(1998) provided hydrometric evidence that downslope effluent flow occurred from a septic system throughthe upper soil horizons of a clayey soil, as a result of perched saturation over an impeding B/C horizon.Although this flow pathway potentially provides the opportunity for extended aerobic treatment of effluent,the magnitude of the flux was not specified. Further, restricted vertical percolation in a septic leachfieldincreases the risk of surface effluent ponding, and thus, system failure (Wolf et al., 1998). Overland flow maythen transport untreated effluent directly to sensitive zones such as reservoirs or poorly sealed drinking waterwells. Other studies of septic effluent migration have observed rapid vertical percolation of effluent throughhighly permeable (e.g. Robertson et al., 1991) and/or macroporous (e.g. Brown et al., 1979; McKay et al.,1993) subsoils. Where effluent migration is vertical and rapid beneath leach lines, the potential for groundwatercontamination is elevated because of the short residence time of effluent (and thus limited opportunity fortreatment) in the vadose zone. Conversely, soils with high saturated hydraulic conductivities, such as sands,tend to have very steep moisture-release curves and rapidly lose permeability below saturation. Where thesesoils are unsaturated, water and effluent is immobilized and retained within the vadose zone, increasing effluentexposure to aerobic treatment processes (e.g. Cogger et al., 1988). Anderson et al. (1994) demonstrated thatconsiderable treatment of septic tank effluent occurred in the vadose zone of a fine sandy soil in Florida, andthat this was directly attributable to the steep moisture-release curve of this soil. Similar data for glaciatedregions with podzolized soil are rare. In the context of the NYC water supply no data exist on how soilsdeveloped in glacial till might control vadose zone movement of septic leachate.
This paper is part of a larger study investigating the fate and transport of septic effluent in the NYC watersupply catchments (Curry, 1999). In this paper, we explore the physical controls on soil water movement inthe vadose zone of a residential septic field in Putnam County, NY. Previous Cl water tracing experiments
Copyright 2002 John Wiley & Sons, Ltd. Hydrol. Process. 16, 2559–2575 (2002)
LEACHATE MOVEMENT IN THE VADOSE ZONE 2561
at this site indicated that much of the tracer mass was retained within the vadose zone in the vicinity of theseptic distribution lines. To explain the flow mechanisms controlling soil-water movement in the septic field,we present hydrometric data collected along a topographic flow line extending 30 m downslope from theseptic distribution lines. The data were collected between September and mid-November 1998, when the soilmoisture deficit was very high following a relatively dry summer. We examine hillslope-scale vadose zoneflux of water as an ultimate control on leachate migration within the phreatic zone. Our objectives are:
1. to determine the magnitude and direction of soil water flux in the vadose zone of a residential septic field;2. to examine the physical controls on the flux characteristics during and among rainstorms;3. to explore linkages between vadose zone flux and observed tracer distributions in the phreatic zone.
SITE DESCRIPTION
A 50 by 50 m plot was established in and around a residential septic field in the township of Patterson,Putnam County, south-eastern New York (Figure 1). The field site lies within the Croton watershed, whichprovides approximately 10% of the NYC water supply. The septic system is gravity-fed and comprises a3785 L septic tank from which effluent flows to a distribution box. The distribution box channels the effluentthrough three 34-m parallel distribution lines, which distribute the effluent into the unsaturated soil matrix.The septic system serves a three-bedroom house, in which two people reside. Daily effluent flow is estimatedat 2271 L per day.
The soils are Charlton loams (a coarse-loamy, mixed, mesic Typic Dystrochrept), which formed from astratified glacial drift deposit. The soil profile typically comprises a sandy loam Ap horizon (0–20 cm), aloam B horizon (20–80 cm), and a silt loam C horizon (>80 cm). Visible root channels are fine and confinedto the upper 40 cm of the profile. These channels are abundant within the upper Ap horizon at 0–5 cm depth.The field is abandoned pasture land, with shallow slopes ranging from 2° to 8°. Rainfall averages 1160 mmannually.
METHODOLOGICAL APPROACH
An intensive hydrological investigation was conducted at the study site between 29 August and 13 November1998. This period represents a time of significant groundwater recharge, during which the water table elevationbelow the septic distribution lines rose by more than 1 m. Hydrometric, water tracing and geophysicaltechniques were used during investigation at the site. The hydrometric data set comprises tensiometric andpiezometric measurements, which were combined with measurements of soil physical properties to characterizewater flux within the hillslope. In this paper, we focus on the hydrometric measurements taken from the vadosezone of the hillslope, although reference is made to soil-density profiles obtained from the use of a dynamiccone penetrometer, the results of a Cl water-tracing experiment, the phreatic-zone piezometric response andgroundwater chemistry.
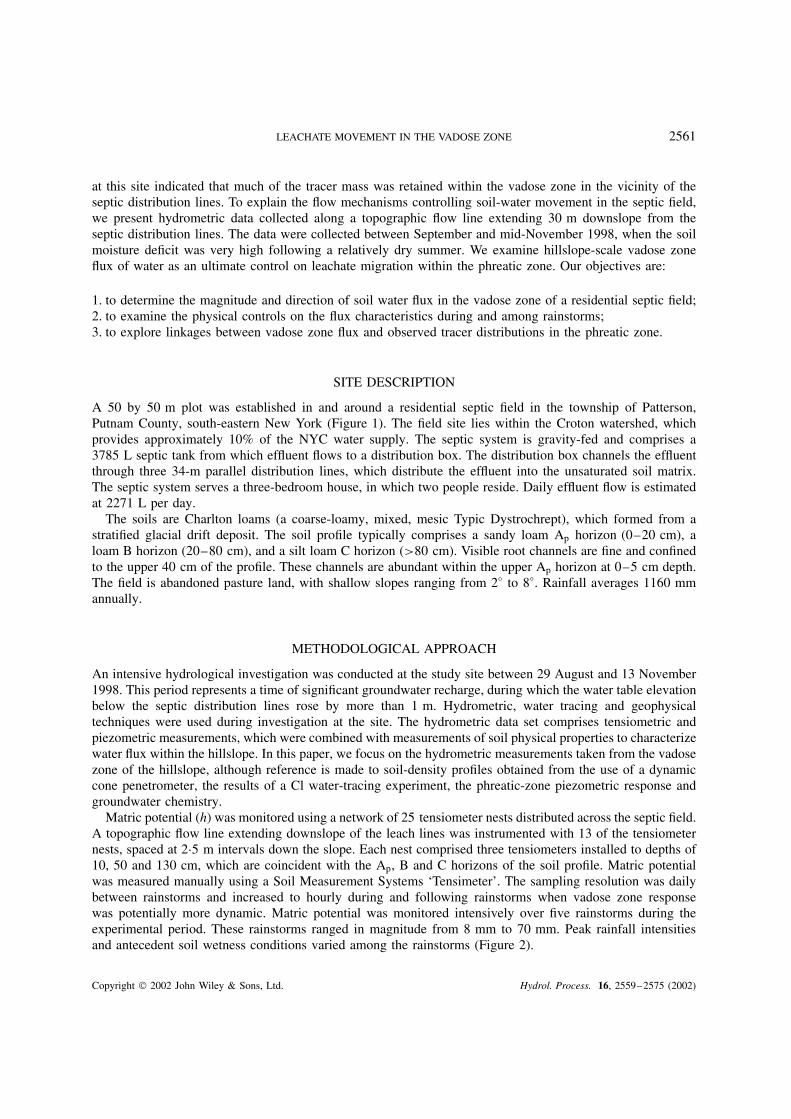
Matric potential (h) was monitored using a network of 25 tensiometer nests distributed across the septic field.A topographic flow line extending downslope of the leach lines was instrumented with 13 of the tensiometernests, spaced at 2Ð5 m intervals down the slope. Each nest comprised three tensiometers installed to depths of10, 50 and 130 cm, which are coincident with the Ap, B and C horizons of the soil profile. Matric potentialwas measured manually using a Soil Measurement Systems ‘Tensimeter’. The sampling resolution was dailybetween rainstorms and increased to hourly during and following rainstorms when vadose zone responsewas potentially more dynamic. Matric potential was monitored intensively over five rainstorms during theexperimental period. These rainstorms ranged in magnitude from 8 mm to 70 mm. Peak rainfall intensitiesand antecedent soil wetness conditions varied among the rainstorms (Figure 2).
Copyright 2002 John Wiley & Sons, Ltd. Hydrol. Process. 16, 2559–2575 (2002)

2562 M. D. SHERLOCK ET AL.
Road
99
98
97
96
95
94
9310 m0
N
MW3
MW4
MW2
MW5
MW6
MW7
X
Y
100
(a)
(b)
0 5 10 15 20 25 3092
95
98
MW2 MW3 MW4 MW5 MW6
X
Y
(c)
New York State
Moisture content probes
Leach lines
Distribution box
Instrumentedflowline
Contours in meters above sea level
Tensiometer nest Piezometer Suction lysimeter Monitoring well
Ele
vatio
n (m
)
Distance (m)
TensiometersWater table
Figure 1. (a) Regional field site location. (b) Field site instrumentation layout. (c) Cross-section along instrumented flowline
The saturated hydraulic conductivity (Ksat) of the vadose zone was determined from 43 borehole perme-ametry measurements (Amoozegar, 1997). Moisture release curves (i.e. the relationship between volumetricmoisture content (�) and (h) were determined at 10, 50 and 130 cm using three Campbell Scientific soil-moisture reflectometers co-located with the upslope tensiometer array (Figure 1). These curves were derivedempirically from measurements of porosity and particle-size distribution (Van Genuchten, 1980; Rawls andBrakensiek, 1989). The unsaturated hydraulic conductivity curve, K�h), at 10, 50 and 130 cm soil depths wasobtained using methods described by Millington and Quirk (1960). The matric potential measurements were
Copyright 2002 John Wiley & Sons, Ltd. Hydrol. Process. 16, 2559–2575 (2002)
LEACHATE MOVEMENT IN THE VADOSE ZONE 2563
0
10
20
30
40
50
60
70
80
0 10 20 30 40
Time since start of rainfall (hours)50 60 70 80 90
Cum
ulat
ive
rain
fall
(mm
)
9/7/98: I10 = 18.3 mm hr−1; 7 day API = 9.1 mm
9/22/98: I10 = 41.1 mm hr−1; 7 day API = 0 mm
10/8/98: I10 = 12.2 mm hr−1; 7 day API = 0.3 mm
9/27/98: I10 = 15.2 mm hr−1; 7 day API = 50.0 mm
11/10/98: I10 = 7.6 mm hr−1; 7 day API = 0 mm
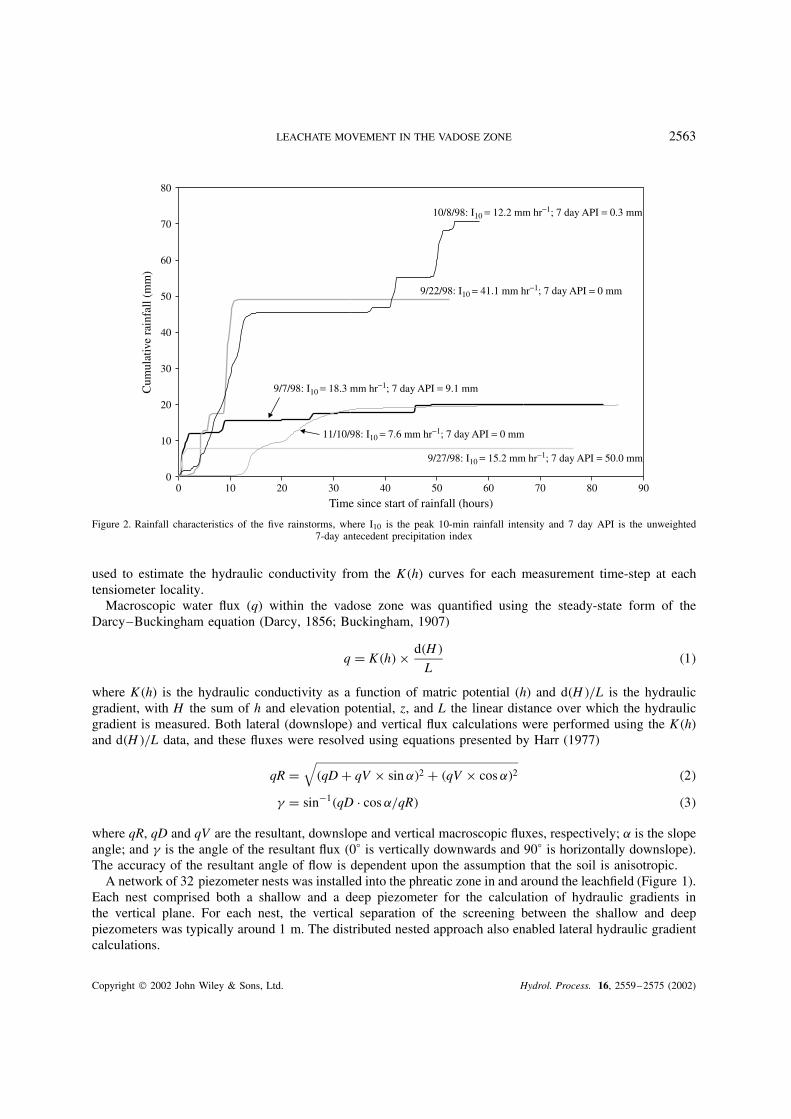
Figure 2. Rainfall characteristics of the five rainstorms, where I10 is the peak 10-min rainfall intensity and 7 day API is the unweighted7-day antecedent precipitation index
used to estimate the hydraulic conductivity from the K�h) curves for each measurement time-step at eachtensiometer locality.
Macroscopic water flux (q) within the vadose zone was quantified using the steady-state form of theDarcy–Buckingham equation (Darcy, 1856; Buckingham, 1907)
q D K�h� ð d�H�
L�1�
where K�h) is the hydraulic conductivity as a function of matric potential (h) and d�H�/L is the hydraulicgradient, with H the sum of h and elevation potential, z, and L the linear distance over which the hydraulicgradient is measured. Both lateral (downslope) and vertical flux calculations were performed using the K�h)and d�H�/L data, and these fluxes were resolved using equations presented by Harr (1977)
qR D√
�qD C qV ð sin ˛�2 C �qV ð cos ˛�2 �2�
� D sin�1�qD Ð cos ˛/qR� �3�
where qR, qD and qV are the resultant, downslope and vertical macroscopic fluxes, respectively; ˛ is the slopeangle; and � is the angle of the resultant flux (0° is vertically downwards and 90° is horizontally downslope).The accuracy of the resultant angle of flow is dependent upon the assumption that the soil is anisotropic.
A network of 32 piezometer nests was installed into the phreatic zone in and around the leachfield (Figure 1).Each nest comprised both a shallow and a deep piezometer for the calculation of hydraulic gradients inthe vertical plane. For each nest, the vertical separation of the screening between the shallow and deeppiezometers was typically around 1 m. The distributed nested approach also enabled lateral hydraulic gradientcalculations.
Copyright 2002 John Wiley & Sons, Ltd. Hydrol. Process. 16, 2559–2575 (2002)

2564 M. D. SHERLOCK ET AL.
RESULTS AND DISCUSSION
Soil physical properties
The permeametry data set indicated that Ksat decreased with depth through the soil profile (Figure 3).Geometric means of Ksat in the Ap, B and C horizons respectively were 4Ð1, 5Ð5 and 0Ð66 cm h�1. Thisdecrease was associated with increasing overburden compression, a reduction in fine roots and an increasein silt with depth. Forty piezometer recovery tests indicated that Ksat within the phreatic zone was highlyvariable across the septic field, although the geometric means of the shallow and deep piezometer Ksat datawere similar (0Ð11 cm h�1 and 0Ð17 cm h�1, respectively). Therefore, no significant hydraulic discontinuitywas evident between the unsaturated C horizon and the phreatic zone.
A comparison of field-measured Ksat with short-term rainfall intensities gives some indication of thedirection of water and effluent flux through the unsaturated soil profile (Figures 2 and 3). Peak 10-minrainfall intensities were much lower than near-surface Ksat over the five monitored rainstorms. Therefore,significant downslope deflection of soil water and effluent within the B and C horizons ordinarily wouldnot be expected. During the 22 September 1998 rainstorm, however, short-term intensities approachedthe near-surface Ksat. Given the marked increase in root density within the upper 5 cm of the profile,actual surface infiltration rates are probably much greater than the near-surface Ksat. Surface pondingand infiltration-excess overland flow were not observed on the hillslope during the experimental period.Between the B1 and C horizons, Ksat values decreased by approximately one order of magnitude. TheKsat values within the C horizon were generally lower than peak short-term rainfall intensities measuredduring the rainstorms. Vertical percolation of soil water through the C horizon may become impeded ifhigh rainfall intensities prevail following wetting of the overlying horizons. Under these circumstances,the soil-water and effluent-flow vectors must comprise a downslope flow component within the C hori-zon. Rainfall intensities exceeding the C horizon Ksat were short-lived (up to 10 min duration), sug-gesting that flux during and among rainstorms was predominantly vertical at this depth within the septicfield.
0
50
100
150
200
250
(a) (b)
0.1 1 10 100 0 5 10 15
No. of ImpactsKsat (cm hr−1)
Dep
th (
cm)
n = 43
AP
B1
B2
C
Figure 3. (a) Vadose zone saturated hydraulic conductivity determined from borehole permeametry, and (b) a typical soil strength/densityprofile determined using a dynamic cone penetrometer. Number of impacts is the hit count required to drive the cone through 5 cm of soil
Copyright 2002 John Wiley & Sons, Ltd. Hydrol. Process. 16, 2559–2575 (2002)

LEACHATE MOVEMENT IN THE VADOSE ZONE 2565
The field-measured ��h� curves at 10, 50 and 130 cm are shown in Figure 4. The predicted ��h� curvesderived from the Rawls and Brakensiek (1989) technique are overlain, but matched poorly against the field-determined ��h� curves. With decreasing h at 10 cm, the predicted decrease in � was much greater than the mea-sured decrease in �. Conversely, at 130 cm the predicted loss of � with decreasing h was smaller than was actu-ally measured. Thus, there was no consistency between the measured and modelled curves, indicating that theuncertainties associated with the predictive approach can be significant. Therefore, field-derived ��h� curves areused in the subsequent discussion. Volumetric moisture content at saturation was greatest at 10 cm, and smallestat 130 cm, which indicates that total porosity decreased with depth in the soil profile. This is consistent with themeasured vertical Ksat distributions in the vadose zone. Near saturation, the Ap horizon at 10 cm depth exhib-ited the greatest decrease in moisture content with decreasing h. However, the loss of moisture content withinthis matric potential range was smaller at 50 cm and 130 cm, suggesting that changes in hydraulic conductivitybelow the Ap horizon were less dynamic during rainstorms. A Millington and Quirk (1960) type analysis of themoisture release curves indicated that the magnitude of hydraulic conductivity was highly sensitive to matricpotential changes in the Ap, B and C horizons. From 0 to �10 cm H2O h, hydraulic conductivity decreasedby almost three orders of magnitude in those horizons (Figure 5). Therefore, when antecedent soil moisture ishigh, water flux is highly responsive to increases in h associated with rainfall inputs through the soil profile.
Soil water variables: temporal distributions
Data from the 39 tensiometers installed along the topographic flowline (Figure 1) indicated that h at anygiven time was highly dependent upon measurement depth and exhibited little variability downslope at thatdepth. In the B1 and C horizons, h typically varied by less than 50 cm H2O within each horizon along theflowline at a given time, indicating that the water content in the deeper horizons is relatively uniform across thehillslope. However, within the Ap horizon, the h range along the flowline increased markedly during periods ofno rainfall (e.g. between the 7 September and 22 September 1998 storms). Presumably, this resulted from two
0−1000 −900 −800 −700 −600 −500 −400 −300 −200 −100 0
Soil water suction (cm H2O)
0.05
0.1
0.15
0.2
0.25
0.3
0.35
0.4
0.45
0.5
10 cm predicted50 cm predicted
130 cm predicted
10 cm measured
50 cm measured
130 cm measured
Vol
umet
ric
moi
stur
e co
nten
t
Figure 4. Field-measured and predicted moisture release curves at 10, 50 and 130 cm depths in the septic field
Copyright 2002 John Wiley & Sons, Ltd. Hydrol. Process. 16, 2559–2575 (2002)

2566 M. D. SHERLOCK ET AL.
101
10−7
10−6
10−5
10−4
10−3
10−2
10−1
100
Hyd
raul
ic c
ondu
ctiv
ity (
cm h
r−1)
10 cm50 cm130 cm
−900 −800 −700 −600 −500 −400 −300 −200 −100 0
Soil water suction (cm H2O)
Figure 5. Unsaturated hydraulic conductivity curves derived using the Millington and Quirk (1960) method on the field-measured moisturerelease curves
key factors. Firstly, tall deciduous trees, which line the south-western perimeter of the study site, shaded muchof the lower slope elevations during the afternoon hours, and resulted in highly variable solar radiation inputsto the soil surface along the instrumented flowline. Therefore, during dry periods, evapotranspiration wasprobably greater at the top of the slope, causing greater decreases in h. Secondly, permeability measurementsindicated that Ksat ranged by over 1Ð6 orders of magnitude in the Ap horizon (Figure 3), probably becauseof textural variability across the hillslope. Such variability would lead to variable moisture losses within thishorizon from both drainage and evapotranspiration.
During rainfall, h variability within the Ap horizon was rapidly reduced, as saturation was typically achievedwithin this horizon across the hillslope within minutes of the onset of intense rainfall. Saturation was attainedat the 10 cm depth in the Ap horizon during four of the five monitored rainstorms (Figure 6).
The frequency of saturation within the Ap horizon was unexpected, given the near-surface Ksat measure-ments and peak rainfall intensities discussed above. In the light of previous studies (e.g. Wilson et al., 1989;Sherlock et al., 2000) it is unlikely that the borehole permeametry technique overestimated the effective Ksat
of the hillslope soils. Saturation within the Ap horizon may have been induced by a short-term hydraulic dis-continuity within the B1 horizon, which existed because this horizon remained unsaturated even over intenserainstorms (Figure 6). The B1 horizon K�h� curve demonstrates that the field-state hydraulic conductivitywas typically two to three orders of magnitude below measured Ksat (Figures 3 and 5). Although verticalhydraulic gradients typically approached 6 when the Ap horizon attained saturation (Figure 7), this is notsufficient to compensate for the decreased field-state hydraulic conductivity of the B1 horizon. This leads tothe development of perched saturation within the Ap horizon, as rainfall inputs to the soil surface exceed thevertical flux rate to the B1 horizon.
Flow impedance to the B1 horizon is further evidenced by the delayed wetting front arrival times. Significantchanges in h in the B1 horizon were observable 5 h after the beginning of the 22 September 1998 rainstorm,8 h after the beginning of the 8 October 1998 and 10 November 1998 rainstorms and 1 day after the beginning
Copyright 2002 John Wiley & Sons, Ltd. Hydrol. Process. 16, 2559–2575 (2002)

LEACHATE MOVEMENT IN THE VADOSE ZONE 2567
10 cm (Ap) 50 cm (B1) 130 cm (C)
9/7/
98
9/22
/98
9/27
/98
10/8
/98
11/1
0/98
Hou
rly
rain
fall
(mm
)So
il w
ater
suc
tion
(cm
H2O
)
Date
30
20
10
0
100
0
−100
−200
−300
−400
−500
−6008/29 9/8 9/18 9/28 10/8 10/18 10/28 11/7
Figure 6. Matric potential ranges within the Ap, B1 and C horizons along the instrumented flowline. Each horizon-specific suction range isderived from 13 time-series data sets
of the 7 September 1998 rainstorm. No significant wetting of the B1 horizon was observed during the 27September 1998 storm, presumably because of the small magnitude of the rainstorm. The timing of wettingwithin the C horizon was similar to that within the B1 horizon, or lagged only slightly behind. This suggeststhat, despite the Ksat discontinuity (Figure 3), flow between these horizons is not impeded. This is consistentwith cone penetrometer data collected across the site, which consistently indicated that the penetrability wasrelatively constant between the B1 and C horizons (Figure 3).
The dynamic response of the Ap horizon to rainfall (Figure 6) resulted in rapid and marked changesin the magnitude of the hydraulic gradients between the Ap and B1 horizons (Figure 7). Prior to rainfall,these gradients were often negative and large (exceeding �6 cm prior to the 22 September 1998 rainstorm),indicating a strong upwards flux of soil moisture required to replace evapotranspirative losses. Followingthe onset of rainfall, the negative vertical gradients were rapidly reversed and converted to large positivegradients, indicating vertical flow towards the B1 horizon. Vertical gradients between the B1 and C horizonswere almost always positive, typically ranging between 0 and 0Ð5 between rainstorms and increasing to 0Ð5–1following rainfall. The gradients at this depth were much less dynamic than those between the A and B1
horizons, which is consistent with the h responses.The lateral hydraulic gradients were much smaller than the vertical hydraulic gradients (Figure 7). Although
vertical gradients between the Ap and B1 horizons were between 2 and 4 following rainfall, lateral gradientsthrough the Ap horizon never exceeded 0Ð8. The lateral gradients were generally positive, indicating that thisflow component, although small, was in the downslope direction. Lateral gradients at 50 cm and 130 cmdepths were small, generally between 0 and 0Ð2. Again, this indicates a very small lateral flow component atthese depths.
Copyright 2002 John Wiley & Sons, Ltd. Hydrol. Process. 16, 2559–2575 (2002)

2568 M. D. SHERLOCK ET AL.
−1
0
1
−8
−6
−4
−2
0
2
4
6
80
10
20
30H
ydra
ulic
gra
dien
tH
ydra
ulic
gra
dien
tH
ydra
ulic
gra
dien
tH
ydra
ulic
gra
dien
t
−1
0
1−1
0
1
8/29 9/8 9/18 9/28 10/8
Date10/18 10/28 11/7
Lateral hydraulic gradients through C horizon
Lateral hydraulic gradients through B1 horizon
Lateral hydraulic gradients through AP horizon
Vertical hydraulic gradients
Hou
rly
rain
fall
(mm
)
AP - B1 horizonB1 - C horizon
Figure 7. Measured vertical and lateral hydraulic gradients along the instrumented flowline
Soil-water variables: spatial distributions
The distribution of total potential along the instrumented flowline was examined in the vadose zone duringindividual rainstorms. This enabled a two-dimensional spatial visualization of the direction and magnitude ofthe hydraulic gradients. These data were coupled with piezometric head data measured in the phreatic zonealong the instrumented flowline to examine hydrological linkages between the vadose and phreatic zones,
Copyright 2002 John Wiley & Sons, Ltd. Hydrol. Process. 16, 2559–2575 (2002)
LEACHATE MOVEMENT IN THE VADOSE ZONE 2569
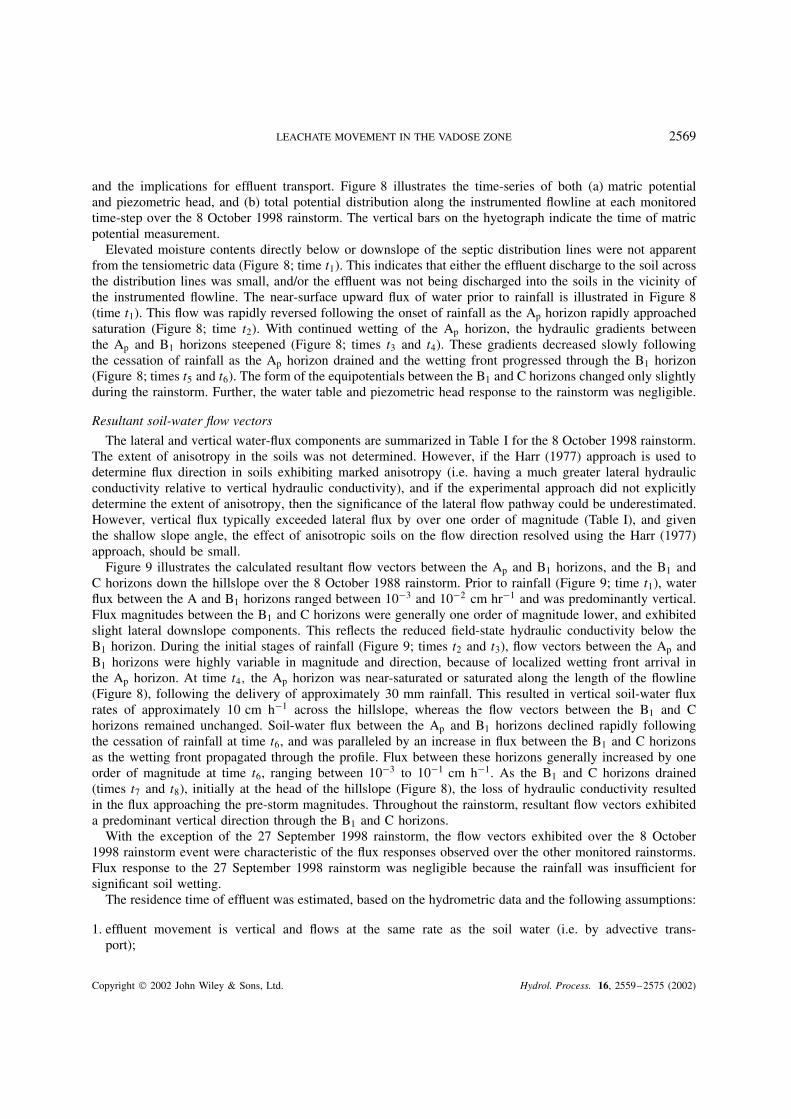
and the implications for effluent transport. Figure 8 illustrates the time-series of both (a) matric potentialand piezometric head, and (b) total potential distribution along the instrumented flowline at each monitoredtime-step over the 8 October 1998 rainstorm. The vertical bars on the hyetograph indicate the time of matricpotential measurement.
Elevated moisture contents directly below or downslope of the septic distribution lines were not apparentfrom the tensiometric data (Figure 8; time t1). This indicates that either the effluent discharge to the soil acrossthe distribution lines was small, and/or the effluent was not being discharged into the soils in the vicinity ofthe instrumented flowline. The near-surface upward flux of water prior to rainfall is illustrated in Figure 8(time t1). This flow was rapidly reversed following the onset of rainfall as the Ap horizon rapidly approachedsaturation (Figure 8; time t2). With continued wetting of the Ap horizon, the hydraulic gradients betweenthe Ap and B1 horizons steepened (Figure 8; times t3 and t4). These gradients decreased slowly followingthe cessation of rainfall as the Ap horizon drained and the wetting front progressed through the B1 horizon(Figure 8; times t5 and t6). The form of the equipotentials between the B1 and C horizons changed only slightlyduring the rainstorm. Further, the water table and piezometric head response to the rainstorm was negligible.
Resultant soil-water flow vectors
The lateral and vertical water-flux components are summarized in Table I for the 8 October 1998 rainstorm.The extent of anisotropy in the soils was not determined. However, if the Harr (1977) approach is used todetermine flux direction in soils exhibiting marked anisotropy (i.e. having a much greater lateral hydraulicconductivity relative to vertical hydraulic conductivity), and if the experimental approach did not explicitlydetermine the extent of anisotropy, then the significance of the lateral flow pathway could be underestimated.However, vertical flux typically exceeded lateral flux by over one order of magnitude (Table I), and giventhe shallow slope angle, the effect of anisotropic soils on the flow direction resolved using the Harr (1977)approach, should be small.
Figure 9 illustrates the calculated resultant flow vectors between the Ap and B1 horizons, and the B1 andC horizons down the hillslope over the 8 October 1988 rainstorm. Prior to rainfall (Figure 9; time t1), waterflux between the A and B1 horizons ranged between 10�3 and 10�2 cm hr�1 and was predominantly vertical.Flux magnitudes between the B1 and C horizons were generally one order of magnitude lower, and exhibitedslight lateral downslope components. This reflects the reduced field-state hydraulic conductivity below theB1 horizon. During the initial stages of rainfall (Figure 9; times t2 and t3), flow vectors between the Ap andB1 horizons were highly variable in magnitude and direction, because of localized wetting front arrival inthe Ap horizon. At time t4, the Ap horizon was near-saturated or saturated along the length of the flowline(Figure 8), following the delivery of approximately 30 mm rainfall. This resulted in vertical soil-water fluxrates of approximately 10 cm h�1 across the hillslope, whereas the flow vectors between the B1 and Chorizons remained unchanged. Soil-water flux between the Ap and B1 horizons declined rapidly followingthe cessation of rainfall at time t6, and was paralleled by an increase in flux between the B1 and C horizonsas the wetting front propagated through the profile. Flux between these horizons generally increased by oneorder of magnitude at time t6, ranging between 10�3 to 10�1 cm h�1. As the B1 and C horizons drained(times t7 and t8), initially at the head of the hillslope (Figure 8), the loss of hydraulic conductivity resultedin the flux approaching the pre-storm magnitudes. Throughout the rainstorm, resultant flow vectors exhibiteda predominant vertical direction through the B1 and C horizons.
With the exception of the 27 September 1998 rainstorm, the flow vectors exhibited over the 8 October1998 rainstorm event were characteristic of the flux responses observed over the other monitored rainstorms.Flux response to the 27 September 1998 rainstorm was negligible because the rainfall was insufficient forsignificant soil wetting.
The residence time of effluent was estimated, based on the hydrometric data and the following assumptions:
1. effluent movement is vertical and flows at the same rate as the soil water (i.e. by advective trans-port);
Copyright 2002 John Wiley & Sons, Ltd. Hydrol. Process. 16, 2559–2575 (2002)
2570 M. D. SHERLOCK ET AL.
(b) Total hydraulic potential (cm)
0−20−50−100−150−200−300−450
(a) Matric potential (cm H2O)
9300
9380
9460
9540
9620
9700
9780
9860
9940
9200
9500
9800
9520
9200
9500
9800
9520
9520
9200
9500
9800
9520
9200
9500
9800
9520
9200
9500
9800
9200
9500
9800
9520
9200
9500
9800
9520
9200
9500
9800
9520
0 500 1000 1500 2000 2500 3000
Ele
vatio
n (c
m)
Distance (cm)
500
100
−20−50
−100−150
09200
500 1000 1500 2000 2500 3000
9500
9800
9200
9500
9800
9200
9500
9800
9200
9500
9800
9200
9500
9800
9200
9500
9800
9200
9500
9800
9200
9500
9800
Distribution lines
Rai
nfal
l int
ensi
ty (
mm
/hr)
0
5
10
15
20
25
30
35
40
0
20
10
30
40
50
60
10/8/98 0:00 10/8/98 6:00 10/8/98 12:00 10/8/98 18:00 10/9/98 0:00 10/9/98 6:00 10/9/98 12:00 10/9/98 18:00 10/10/98 0:00
Cumulative rainfallt1
t2 t3t4
t5t6 t7 t8
(c) Hyetograph
Date
Rainfall intensity
Cum
ulative rainfall (mm
)
Distance (cm)
Ele
vatio
n (c
m)
t1: 10/7/98 19:35
t2: 10/8/98 9:12
t3: 10/8/98 11:12
t4: 10/8/98 14:01
t5: 10/8/98 17:51
t6: 10/8/98 23:15
t7: 10/9/98 7:23
t8: 10/9/98 15:31
t1: 10/7/98 19:35
t2: 10/8/98 9:12
t3: 10/8/98 11:12
t4: 10/8/98 14:01
t5: 10/8/98 17:51
t6: 10/8/98 23:15
t7: 10/9/98 7:23
t8: 10/9/98 15:31
Figure 8. (a) Matric potential and (b) total potential distributions along the instrumented flowline, and (c) rainfall over the 8 October 1998rainstorm
Copyright 2002 John Wiley & Sons, Ltd. Hydrol. Process. 16, 2559–2575 (2002)

LEACHATE MOVEMENT IN THE VADOSE ZONE 2571
Table I. Summary of calculated lateral and vertical flux magnitudes prior to and at the peak of the rainfall event on8 October 1998
Direction ofFlux
Distancedepth
Pre-storm flux Flux at peak of storm (attime t5: 1751 hours)
Mean flux(cm h�1)
Flux range(cm h�1)
Mean flux(cm h�1)
Flux range(cm h�1)
Lateral 10 cm 1Ð0E-4 1Ð0E-5 to 4Ð0E-4 4Ð0E-1 1Ð0E-1 to 1Ð0E050 cm 5Ð0E-4 3Ð0E-5 to 2Ð0E-3 4Ð0E-3 1Ð0E-4 to 1Ð0E-2
130 cm 3Ð0E-5 3Ð0E-7 to 1Ð0E-4 3Ð0E-5 2Ð0E-7 to 1Ð0E-4Vertical 10–50 cm 3Ð0E-3 9Ð0E-4 to 6Ð0E-3 4Ð0E0 2Ð0E-1 to 8Ð0E0
50–130 cm 2Ð0E-3 2Ð0E-4 to 6Ð0E-3 2Ð0E-2 2Ð0E-4 to 8Ð0E-2
Ele
vatio
n (c
m)
Distance (cm)
0 500 1000 1500 2000 2500 3000
9200
9500
9800
9200
9500
9800
9200
9500
9800
9200
9500
9800
9200
9500
9800 t1: 10/7/98 19:35
t2: 10/8/98 9:12
t3: 10/8/98 11:12
t4: 10/8/98 14:01
t5: 10/8/98 17:51
t6: 10/8/98 23:15
t7: 10/9/98 7:23
t8: 10/9/98 15:31
9200
9500
9800
9200
9500
9800
0 500 1000 1500 2000 2500 3000
10−4
10−310−2
10−1100
101Flux (cm hr−1):
9200
9500
9800
Figure 9. Magnitude and direction of water flux in the vadose zone over the 8 October 1998 rainstorm. Flow vectors are calculated usingthe approach of Harr (1977)
2. there is a 2 m vertical separation distance between the distribution lines and the water table;3. the effective porosity of the B1 and C horizons averages 25%.
Based on the data collected between 29 August and 13 November 1998, the travel time of the septic effluentthrough the vadose zone of the hillslope ranged from 200–500 days (according to calculations developed bySherlock et al. (2000)).
Flow pathway evidence from Cl tracing
A Cl tracing experiment was conducted on 7 October 1998, and is described in detail in Curry (1999). Theobjective of this work was to make direct observations of flow direction and magnitude through the vadose and
Copyright 2002 John Wiley & Sons, Ltd. Hydrol. Process. 16, 2559–2575 (2002)

2572 M. D. SHERLOCK ET AL.
0
20
40
60
80
100
120
140
160
180
−50 0 50 100 150 200 250 300
Cl c
once
ntra
tion
(mg/
l)
0 m downslope
3 m downslope
7.6 m downslope
0
5
10
15
20
25
30
35
−2 0 2 4 6 8 10 12
Cl c
once
ntra
tion
(mg/
l)
0 m downslope
2 m downslope
4 m downslope
(a)
(b)
Time after Cl injection (days)
Time after Cl injection (days)
Figure 10. Concentrations of Cl in (a) the vadose zone at 100 cm depth, and (b) in the phreatic zone
Copyright 2002 John Wiley & Sons, Ltd. Hydrol. Process. 16, 2559–2575 (2002)
LEACHATE MOVEMENT IN THE VADOSE ZONE 2573
phreatic zones of the hillslope. The Cl tracing experiment results are used here for comparison with the flowpathways indicated by the hydrometric investigation. Figure 10 illustrates that some of the Cl tracer (injectedinto the septic junction box) migrated vertically to 100 cm depth (40 cm below the leach lines) within 6 hof injection, where it remained for the following 10 days. Measured Cl concentrations at this locality weremore than three orders of magnitude lower than input Cl concentrations to the distribution box. Presumablysignificant mixing of the Cl tracer occurred with effluent from the septic tank in both the distribution systemand the vadose zone soils. No downslope migration of the tracer was observed in the vadose zone overthe first 10 days following Cl injection. Unfortunately Cl monitoring in the vadose zone ceased after day10 of the experiment, because the onset of overnight freezing would have damaged the automatic sampler.Breakthrough of Cl in the phreatic zone was delayed. Tracer concentrations in the groundwater verticallybelow the leachlines (MW2; see Figure 1) peaked 125 days after injection (10b). Concentrations of Cl ingroundwater 3 m downslope of the leachlines (MW3) peaked almost 200 days after injection.
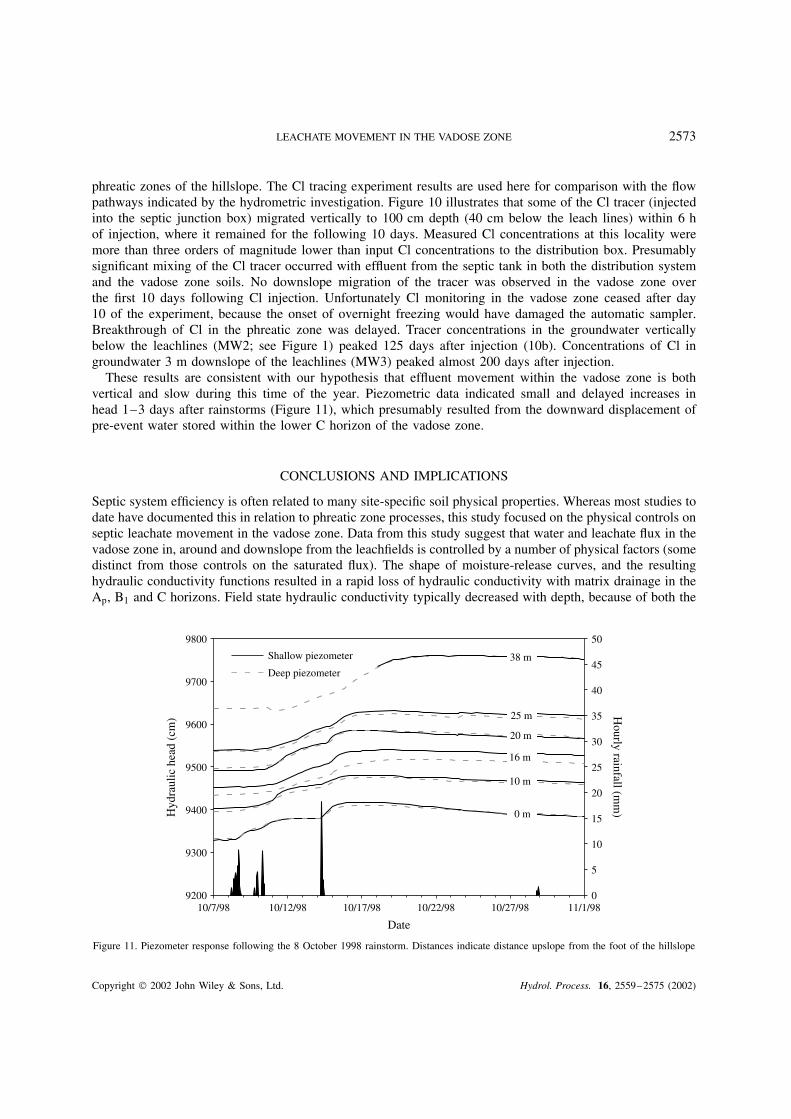
These results are consistent with our hypothesis that effluent movement within the vadose zone is bothvertical and slow during this time of the year. Piezometric data indicated small and delayed increases inhead 1–3 days after rainstorms (Figure 11), which presumably resulted from the downward displacement ofpre-event water stored within the lower C horizon of the vadose zone.
CONCLUSIONS AND IMPLICATIONS
Septic system efficiency is often related to many site-specific soil physical properties. Whereas most studies todate have documented this in relation to phreatic zone processes, this study focused on the physical controls onseptic leachate movement in the vadose zone. Data from this study suggest that water and leachate flux in thevadose zone in, around and downslope from the leachfields is controlled by a number of physical factors (somedistinct from those controls on the saturated flux). The shape of moisture-release curves, and the resultinghydraulic conductivity functions resulted in a rapid loss of hydraulic conductivity with matrix drainage in theAp, B1 and C horizons. Field state hydraulic conductivity typically decreased with depth, because of both the
9200
9600
9700
9800
10/7/98 10/12/98 10/17/98 10/22/98 10/27/98 11/1/98
Date
0
5
9300
9400
9500
Hyd
raul
ic h
ead
(cm
)
10
15
20
25
30
35
40
45
50
Hourly rainfall (m
m)
38 m
25 m
20 m
16 m
10 m
0 m
Shallow piezometer
Deep piezometer
Figure 11. Piezometer response following the 8 October 1998 rainstorm. Distances indicate distance upslope from the foot of the hillslope
Copyright 2002 John Wiley & Sons, Ltd. Hydrol. Process. 16, 2559–2575 (2002)
2574 M. D. SHERLOCK ET AL.
reduction in Ksat with depth, and the limited wetting of the B1 and C horizons during rainstorms. Secondly,the vertical hydraulic gradients were much steeper than the lateral gradients, because of both the shallow slopeangle and the pronounced wetting, which typically occurred in the near-surface. Thirdly, visible macroporespace was confined to the very near-surface, above the depth of the buried leach lines. Thus, soil water andeffluent migration probably occurs within matrix pore-space, and therefore is controlled by the key elementsin soil-water physics; field-state hydraulic conductivity and hydraulic gradients.
We demonstrated that flux within the vadose zone was predominantly vertical, and dynamic during fiverainstorms occurring between 29 August and 13 November 1998. However, the response to rainfall wastypically short-lived (of the order of a few hours), and the calculated peak fluxes between the B1 and Chorizons were relatively small. Our calculations indicated that septic effluent has a long residence time ofbetween 200 and 500 days within the vadose zone during this time of the year.
These findings are broadly consistent with the results of a Cl tracer experiment, which suggested that thetracer mass was retained within the matrix pore space directly below the distribution lines for several monthsafter Cl injection (Curry, 1999). Thus, the predominantly vertical flow pathways through the vadose zone,which would otherwise minimize the distance along which leachate could be ‘cleaned’ by aerobic processesen route to the water table, are offset by the long residence times.
During the study period, the rapid reduction in hydrological response (i.e. flux) with depth in the vadosezone accounted for the small and delayed storm-based response of the phreatic zone. Again, this indicatesthat water and effluent movement through the soil system was confined to the matrix pore-space, and thatmacropore flow was not a significant flow mechanism within this hillslope during the study period. Given thevadose zone flux and residence time calculations, the data suggest that water table recharge is derived frompre-event soil water stored within the lower C horizon. This water is mobilized during rainfall by steepenedhydraulic gradients in the overlying horizons, and displaced towards the phreatic zone. These results may helpexplain some of the patterns observed by Heisig (2000) and shed further light on the amount of ‘memory’there may be in hillslopes and watersheds impacted by septic systems.
ACKNOWLEDGEMENTS
The authors are grateful to Tom and Edie Keasbey for allowing us unrestricted access to their property duringthe course of the field experimentation. This research was conducted as part of the New York City Departmentof Environmental Protection Septic Siting Study (contract number 090065).
REFERENCES
Amoozegar A. 1997. Comparison of saturated hydraulic conductivity and percolation rate: implications for designing septic systems. In SiteCharacterization and Design of On-site Septic Systems , Bedinger MS, Fleming JS, Johnson AI (eds). Special Technical Publication 1324,American Society for Testing and Materials (ASTM): Fredericksburg, Vancouver; 129–143.
Anderson DL, Tyl MB, Otis RJ, Mayer TG, Sherman KM. 1998. Onsite wastewater nutrient reduction systems (OWNRS) for nutrientsensitive environments. In On-Site Wastewater Treatment , Sievers DM (ed.). Proceedings of the Eighth National Symposium on Individualand Small Community Sewage Systems, 8–10 March, Orlando, Florida. American Society of Agricultural Engineers: Michigan; 436–445.
Brown KW, Wolf HW, Donnelly KC, Slowey JF. 1979. The movement of fecal coliforms and coliphages below septic lines. Journal ofEnvironmental Quality 8: 121–125.
Buckingham E. 1907. Studies on the Movement of Soil Moisture. Bureau of Soils, US Department of Agriculture; Washington, DC; 38.Bureau of the Census. 1992. 1990 Census of Housing. Department of Characteristics of Housing Units, Detailed Housing Characteristics,
United States Summary, US Department of Commerce: Washington; 16.Canter LW, Knox RC. 1985. Septic Tank System Effects on Ground Water Quality . Lewis Publishers: Michigan.Cogger CG, Hajjar LM, Moe CL, Sobsey MD. 1988. Septic system performance on a coastal barrier island. Journal of Environmental
Quality 17: 401–408.Curry DS. 1999. Final Report for the Septic Siting Project. New York City Department of Environmental Protection Report.Darcy H. 1856. Les fontaines publiques de la ville de Dijon. Victor Dalmont: Paris.Harman J, Robertson WD, Zanini L. 1996. Impacts on a sand aquifer from an old septic system: nitrate and phosphate. Groundwater 34:
1105–1114.
Copyright 2002 John Wiley & Sons, Ltd. Hydrol. Process. 16, 2559–2575 (2002)

LEACHATE MOVEMENT IN THE VADOSE ZONE 2575
Harr RD. 1977. Water flux in soil and subsoil on a steep forested slope. Journal of Hydrology 33: 37–58.Heisig P. 2000. Effects of Residential and Agricultural Land Uses on the Chemical Quality of Baseflow of Small Streams in the Croton
Watershed, Southeastern New York. Water-Resources Investigations Report 99-4173, U.S. Geological Survey: Reston, Virginia.Huang F. 1999. Development of an influent flow monitoring and autosampling system for onsite wastewater treatment systems. The Small
Flows Journal 5(1): 12–19.Lawrence CH. 1973. Septic tank performance. Journal of Environmental Quality 36: 226–228.McKay LD, Balfour DJ, Cherry JA. 1998. Lateral chloride migration from a landfill in a fractured clay-rich glacial deposit. Ground Water
36: 988–999.Millington RJ, Quirk JP. 1960. Permeability of porous solids. Transactions of the Faraday Society 57: 1200–1207.Penninger PG, Hoover MT. 1998. Performance of an at-grade septic system preceded by a pressure-dosed filter on a wet, clayey belt soil.
In On-site Wastewater Treatment , Sievers DM (ed.). Proceedings of the Eighth National Symposium on Individual and Small CommunitySewage Systems, 8–10 March, Orlando, Florida. American Society of Agricultural Engineers: Michigan; 326–335.
Rawls WJ, Brakensiek DL. 1989. Estimation of soil water retention and hydraulic properties. In Unsaturated Flow in Hydrologic ModellingTheory and Practice, Morel-Seytoux HJ (ed.) NATO ASI Series. Series C. Mathematical and Physical Science, Vol. 275. Kluwer Academic:Dordrecht; 275–300.
Robertson WD, Cherry JA, Sudicky EA. 1991. Ground-water contamination from two small septic systems on sand aquifers. Ground Water29: 82–92.
Sherlock MD, Chappell NA, McDonnell JJ. 2000. Effects of experimental uncertainty on the calculation of hillslope flow paths. HydrologicalProcesses 14: 2457–2471.
Van Genuchten Mth. 1980. A closed-form equation for predicting the hydraulic conductivity of unsaturated soils. Soil Science Society ofAmerica Journal 44: 892–898.
Wernick BG, Cook KE, Schreier H. 1998. Land use and streamwater nitrate-N dynamics in an urban-rural fringe watershed. Journal of theAmerican Water Resources Association 34: 639–650.
Wilhelm S, Schiff S, Robinson W. 1996. Biogeochemical evolution of domestic waste water in septic systems: 2. Application of a conceptualmodel in sandy aquifers. Groundwater 34: 853–864.
Wilson GV, Alfonsi JM, Jardine PM. 1989. Spatial variability of saturated hydraulic conductivity of the subsoil of two forested watersheds.Soil Science Society of America Journal 53: 679–685.
Wolf DC, Gross MA, Earlywine KE, Davis KJ, Rutledge EM. 1998. Renovation of onsite domestic wastewater in a poorly drained soil. InOn-site Wastewater Treatment , Sievers DM (ed.). Proceedings of the Eighth National Symposium on Individual and Small CommunitySewage Systems, 8–10 March, Orlando, Florida. American Society of Agricultural Engineers: Michigan; 320–325.
Copyright 2002 John Wiley & Sons, Ltd. Hydrol. Process. 16, 2559–2575 (2002)