Embed Size (px)
Citation preview

'AD-0I61185 THE PHYSICAL OCEANOCRAP)Y OF THE NORTHERN BAFFIN --- _____BAY-NMES STRAIT REGIONCU) NAVAL POSTGRADUATE SCHOOL 1'MONTEREY CA V C ADDISON DEC 87 NPS-68-87-BAS
UNCLASSIFIED F/G 8/3, IiillliElhijElIIIIIIIIIIIIIEEIIIIIIEIIIIIEEllllElhllllhEEllllEllllIIhElllEEEEllllIhE
Ehh~EE~hIhh
I?
""' _V_0 Ilan,.
MiCROCCPY RESOLUTION TEST
CHAR-
NAONL BuREAU OF
4~ 0

NPS-68-87-008NAMVAL POSTGRADUATE SCHOOLC Monterey California
A srmAW1' D T ICli ELECTE I .
SMARI I MD98THESIS
THE PHYSICAL OCEANOGRAPHYOF THE
NOFTHERN BAFFIN BAY-NARES STRAIT REGION
by
Victor G. Addison, Jr.
December 1987
Thesis Advisor R.H. Bourke
Approved for public release; distribution is unlimited.
Prepared for:Dierctor, Arctic Submarine LaboratoryNaval Ocean Systems CenterSan Diego, CA 92152
88 3 1) 022
NAVAL POSTGRADUATE SCHOOLMonterey, California
Rear Admiral R. C. Austin Kneale T. MarshallSuperintendent Acting Provost
This thesis was prepared in conjunction with research sponsored by theArctic Submarine Laboratory, Naval Ocean Systems Center, San Diego, Californiiaunder Work Order N66001-86-WR-00131. Reproduction of all or part of this
report is authorized.
Released by:
Gordon E. SchacherDean of Science and Engineering
A .
I-- -U 4g 5 ,/, ~ /.,,
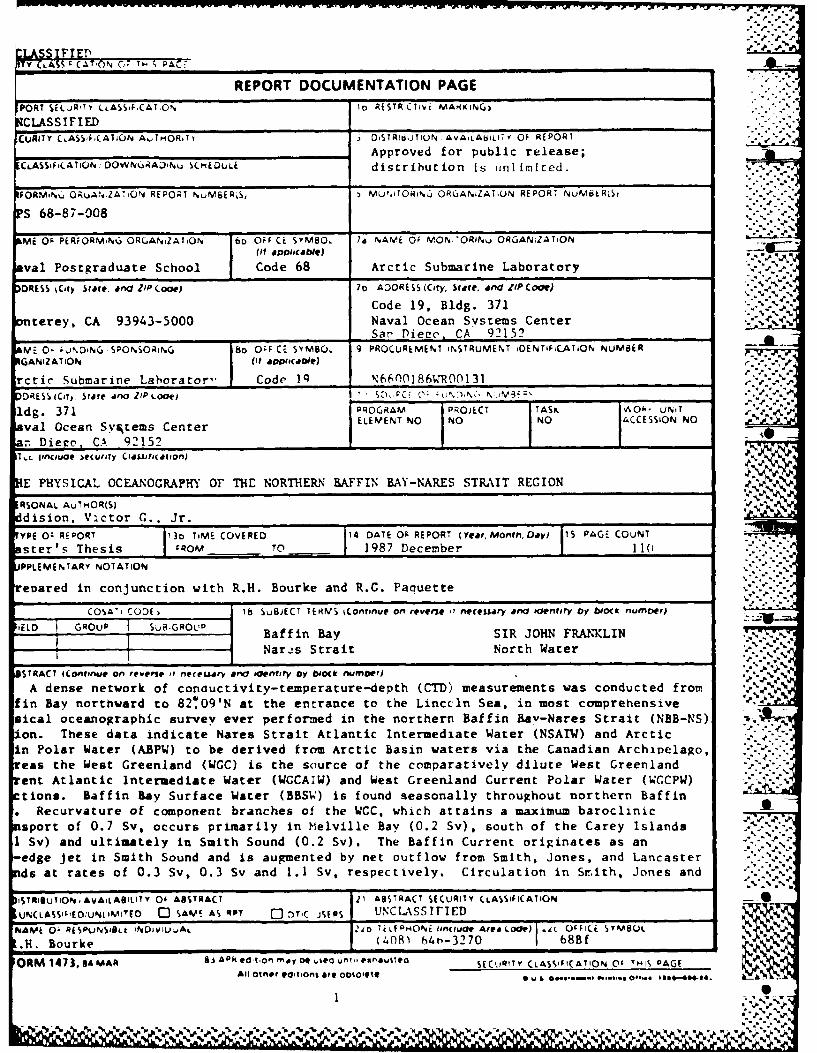
REPORT DOCUMENTATION PAGEPORT SiLiR' LLASSFCAT.ON Io RESTRCit MAKKIuNG
'CLASSIFIED _________________________
CURITY CASSJCAT4ION Ai, NOR!T IOSTR16UT10N. AVA,LA8lJ OF REPOR!
__________________________________ Approved for public release;CLASSiCAT(ON -DOWN6RA~iNu iE(uH . di strihut ion is unimi ted.
FORIMil 0RuAN,.ZA~iCN REPORT Nu1EMSi MU1.LTO~i4N ORGANiZATIN REPORT NublR!Si
S 68-87-008
ME Of PERi0RMNGi ORGANiZATiON 6D OFF CE SyMSO. la NAME OF MON ORII~i ORGANiZATIONI (it aocbe .*,
val Postgraduate School Code 68 Arctic Submarine Laboratory
DRESS %Cty State, and ZIP (ode) 70 ADDRE Ss(City, State, anld ZIP Code)
Code 19, Bldg. 371nterey, CA 93943-5000 Naval Ocean Systems Center
___________ SarDiec.CA 9215?
M: 0- ;jDiNG SPONSORING 80o 0" CE SYMBO 9 PROCUREMENT iNSTRUMENT iDENTiFiCATiON NUMBERGANIZATION ~(taopilcable)rctic Submarine Lahorator"- Code 19 N66101 861TO01 31
DRESS iCl, Stare ana ZIP .ooi) SC)_i~ OZ tM.-'N M
ldg. 371 PROGRAM PROJECT TASK A011- uliva Oea S~rmsCete IELEMENT NO NO NO ACCESSION NO
a-Dieco, CA 921521 Ii.L Ionciuae jecurity L'dlJitscaIof)
E PHYSICAL OCE.NOGRAPHY OF THE NORTHERN BAFFIN BAY-MARES STRAIT REGION
RSONAL AUTmOR(S) 'OP-
dision. Victor C.. Jr.
YPE OZ RE PORT 13D TiME COVERED 14 DATE OF REPORT (year, Monil.Day) 1s PAG COUNT -
ster' s Thesis FCROM To 1987 December I 10 ..-
PPLEMENTARY NOTATION-
enared in conjunction with R.H. Bourke and R.C. Paauette
COSAi CODE' 1b SuBJECT TERM'S i~ontfinve on reverse p"necessary ainc icienrr oy tlocx numr)
EL IGRUPI uBGRU~Baffin Bay SIR JOHN FRANKLIN %- .
Nar,-s Strait North Water%
STRACT (onhinuo, an reverse it neceugary ars dienty oy odio nume'J .
A dense network of conductivity-temperature-depth (CTD) measurements was conducted from :.,%fin Bay northward to 821'9' at the entrance to the Lincil Sea, in most comprehensive I
sical oceanographic survey ever performed in the northern Baf fin Bav-Nares Strait (NBB-NS) '1'
on. These data indicate Nares Strait Atlantic Intermediate Water (NSAIW) and Arctic .
in Polar Water (A.BPW) to be derived from Arctic Basin waters via the Canadian Arhplg,teas the West Greenland (WGC) is the source of the comparatively dilute West Greenlandent Atlantic Intermediate Water (WCCAIIJ) and West Greenland Current Polar Water (WCCPW)tiona. Baffin bay Surface Water (BBSW) is found seasonally throughout northern Baffin*Recurvature of component branches of the WCC which attains a maximum baroclinic...
asport of 0.7 Sv, occurs primarily in Melville Bay (0.2 Sv). south of the Carey IslandsI Sv) and ultimately In Smith Sound (0.2 Sv). The Baffin Current originates as an-edge jet in Smith Sound and is augmented by net outflow from Smith, Jones, and Lancasterds at rates of 0.3 Sv, 0.3 Sv and 1.1 Sv, respectively. Circulation in Sm~ith. Jones and
STRIBUTION AVAlLABILITY Of ABSTRACT 21 ABSTRACT SECURITY CLASSIFICATION-
UNC LASS itDUWili TED [J SAME AS RPT 0 TC jSFOS UNCLSSUrIED
NiAME 0- RESPONSIB8ss IN[DiVIL~AL 'do IiLfPOil lonowde Area Lodle) "4( 091iC syMBOL.H1. Bourke(4864-20I 8BIORM 147 3, BA MVAR &J Ai @(,Io May 1 6$00 ur, il~i SECURIY CLASSIFICATION CE Tmi' PAGE%
All otner edtns are osot'T .. .*l*.. ... .-. ,
pip %'% %
611110 -%.
UNCLASSIFIED
SCCURITr CLASSIICATION OF 'THIS PAG6 (Whm DM& owre*
Block 18 (continued)
Geostrophic Estuarine Circulation Smith SoundLancaster Sound Kane BasinJones Sound MIelville Bay
",lock 19 (continued)
Lancaster Sounds can be described in terms of the Geostrophic EstuarineCirculation Model (GEC). The North Water is caused by the combined influencesof near-surface layer enthalpy and mechanical ice removal.
N 92 L .1 -6 1U W A S F E
SI4IVCASFCTO FTHSPG(hnDt no*
% . .. 1 ... 1 " % . .. _r'.TiS
- Approved for public release; distribution is unlimited.
The Physical Oceanography of theNorthern Baffin Bay-Nares Strait Region
by
Victor G. Addison, Jr
Lieutenant, United States NavyB.S., State University of New 'ork, Stony Brook, lq7Q
Submitted in partial fulfillment of therequirements for the degree of
MASTER OF SCIENCE IN METEOROLOGY AND OCEANOGRAPHY
from the
NAVAL POSTGRADUATE SCHOOLDecember 1987
Author:Victor Addison, Jr.
Approved by: , s "jR.H. Bourke. Thesis Advisor
R,.,. tfaquette.i Second keader
C., Collins. Chairman
Department of Oceanographv
Lo1 (loll F Schache 1
Dean of Science and Eng inerli( r
N,
* .3
-, le'
'ABSTRACT
A dense network of conductivity-temperature-depth (CTD) measurements
was conducted from Baffin Bay northward to 82709;N at the entrance to
the Lincoln Sea, in the most comprehensive physical oceanographic survey:4
ever performed in the northern Baffin Bay-Nares Strait (NBB-NS) region.
These data indicate Nares Strait Atlantic Intermediate Water (NSAIW) and.,. ,
Arctic Basin Polar Water (ABPW) to be derived from Arctic Basin waters
via the Canadian Archipelago, whereas the West Greenland Current (W(;C)
0is the source of the comparatively dilute West Greenland Current
Atlantic Intermediate Water (WGCAIW) and West Greenland Current Polar
Water (WGCPW) fractions. Baffin Bay Surface Water (BBSW) is found
seasonally throughout northern Baffin Bay. Recurvature of component
branches of the WGC, which attains a maximum baroclinic transport of
0.7 Sv, occurs primarily in Melville Bay (0.2 Sv), south of the Carey
Islands (0.1 Sv) and ultimately in Smith Sound (0.2 Sv). The Baffin
Current originates as an ice-edge jet in Smith Sound and is augmented by
net outflow from Smith, Jones, and Lancaster Sounds at rates of 0.3 Sv,
0.3 Sv and 1.1 Sv, respectively. Circulation in Smith, Jones and
Lancaster Sounds can be described in terms of the Geostrophic Estuarinp
Circulation Model,(GEC). The North Water is caused by the combined
influences of near-surface layer enthalpy and mechanical ice removal.
$44
044
~~~ "" zV,

TABLE OF CONTENTS
1 . I 'rR O U C T O N .. . . . . . . . . . . . . . . . . . . . . . . . . . . . . . . . . . . . 1
A. IN RCTON......................................................12
A. PUCKRPOE ........ ........................................ 13
B. BKGOUND.................................................1.3
3. Wathetry............................................... 159~
2. GheNrl Cicatio.................................... ..160
A . WatIE SMAsse.............................................9
.INThUENoThTO Wa.............................. ............ 20
C.. MEHDST EUO AND MESRM N......................... ............ 23
A.I RUAIE SMMRYCE.......................................-.23
A. INTRUCETION.............................................. 28
C. DATAI REDUCTIONAND WAALYIS.............. .................. 25
C. THROLALRN SATRUCTU............................................284
A. INTRODUCTION................................................258
B. BYAFI BAYPSGRACEY WATER.....................................258
C. POLA WTGER AN CURN 34...............6
D. ATRCLATIN INREDAE WTATR..................................65
E. C TION BAFFND TURANT..... .................................. 580
C . THECWESTIO GREENLAND OURNTS........... ........ ............. 61
55
F. CRCUATIO INTHE OUNS /1V.N
2 . Sm i th Sound ...... .. ...................... ........... 71
3 . Jo ne s Sou nd ..... ... .. ..... ............. ... ........... 73
4 . Lancaster Sound ...................................... 75
5. Geostrophic Estuarine Circulation ..................... 75
G. BAROCLINIC TRANSPORTS ............................. ...... 82
V. THE NORTH WATER PROCESS ...................................... 88
VI . D ISCU SS IO N .................. ............ ... .......... ........ 9 2
VII . CONCLUSIONS .................................................. 9 4
APPENDIX: COMPUTATIONS ASSOCIATED WITH THE GEC MODEL ................ 96
LIST OF REFERENCES ...................................................98
INITIAL DISTRIBUTION LIST i...........................................100
6
*,
" - "" "" ... - ' " F ) ' ""V€'' € ' ''

LIST OF TABLES
I. NEAR-SURFACE AND INTERMEDIATE-DEPTH WATERS OF THE NORTHERNBAFFIN BAY-NARES STRAIT REGION ............................... 29
II. GEOSTROPHIC ESTUARINE CIRCULATION MODEL CALCULATIONS ......... 79
7
Or A
'vI /A' ,fI
LIST OF FIGURES
1I. A chart of the northern Baffin Bay-Nares Strait region ....... 14
1.2 The West Greenland Current and the Baffin Current (fromMuench , 1971 , p . 2 ) ................... ....................... 17
1.3 The approximate monthly mean extent of the North Water(from Dunbar, 1970, p. 279) .................................. 21
2.1 The locations of CTD stations conducted during the September1986 cruise of CCGS SIR JOHN FRANKLIN ......................... 24
2.2 The locations of transects used in the analysis ............... 26
3.1 A composite temperature profile illustrating the shallow
thermocline characteristic of BBSW ............................ 31
3 .2 The horizontal distribution of maximum temperatures in*the BBSW laver.................................................. 32
3.3 A T/S transect northeastward across Melville Bay ............. 33
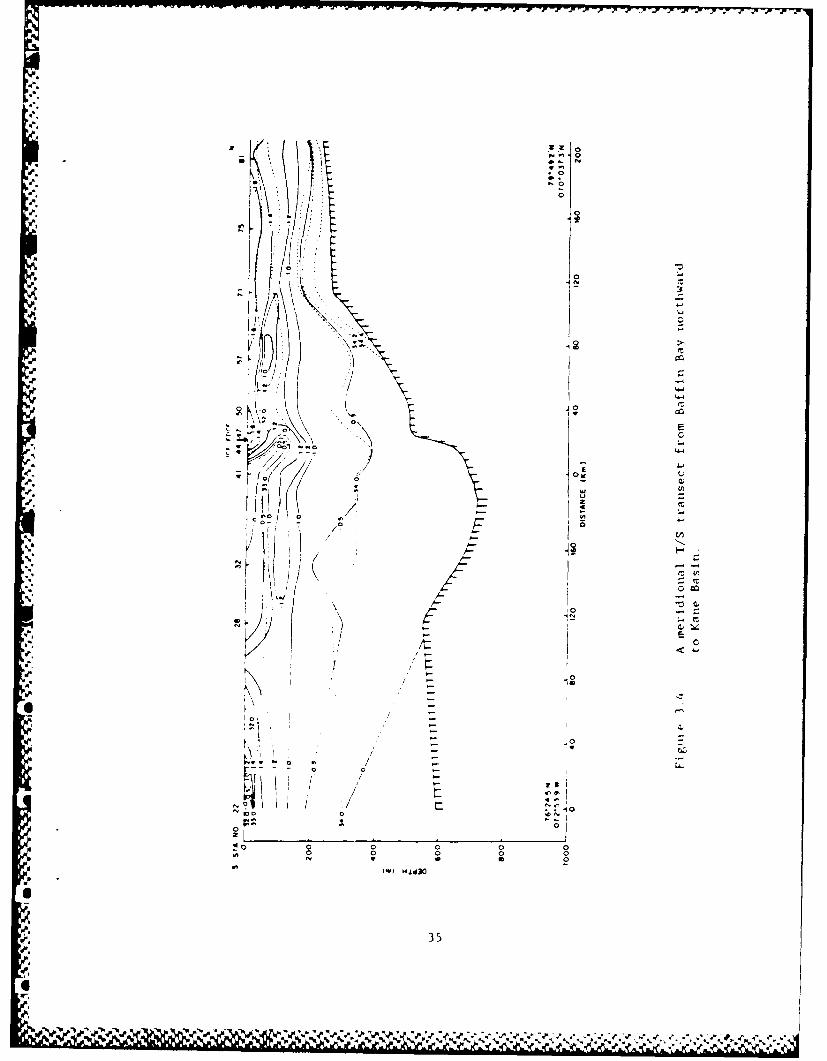
3.4 A meridional T/S transect from Baffin Bay northward to
K a n e Ba s in . ............ ........ ..... .. ..... ... ................35
3.5 A composite salinity profile illustrating the dilution ofWGCPW relative to ABPW ....................................... 37
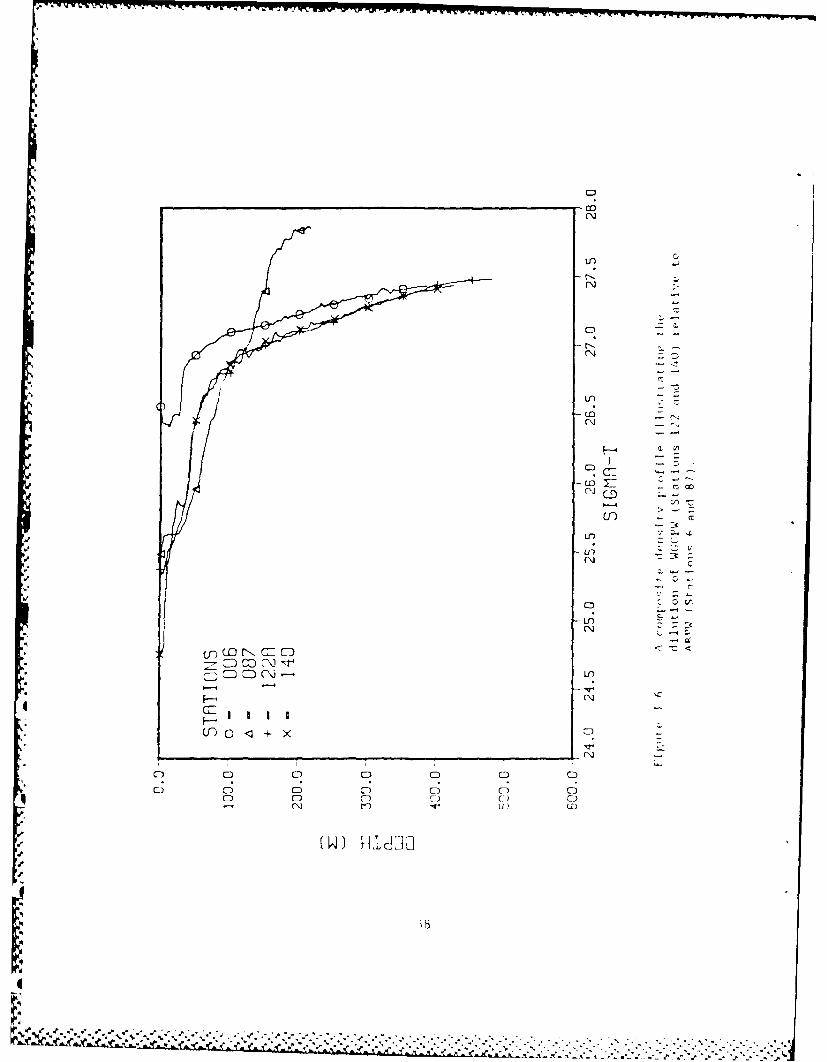
3.6 A composite density profile illustrating the dilution ofWGCPW relative to ABPW ....................................... 38
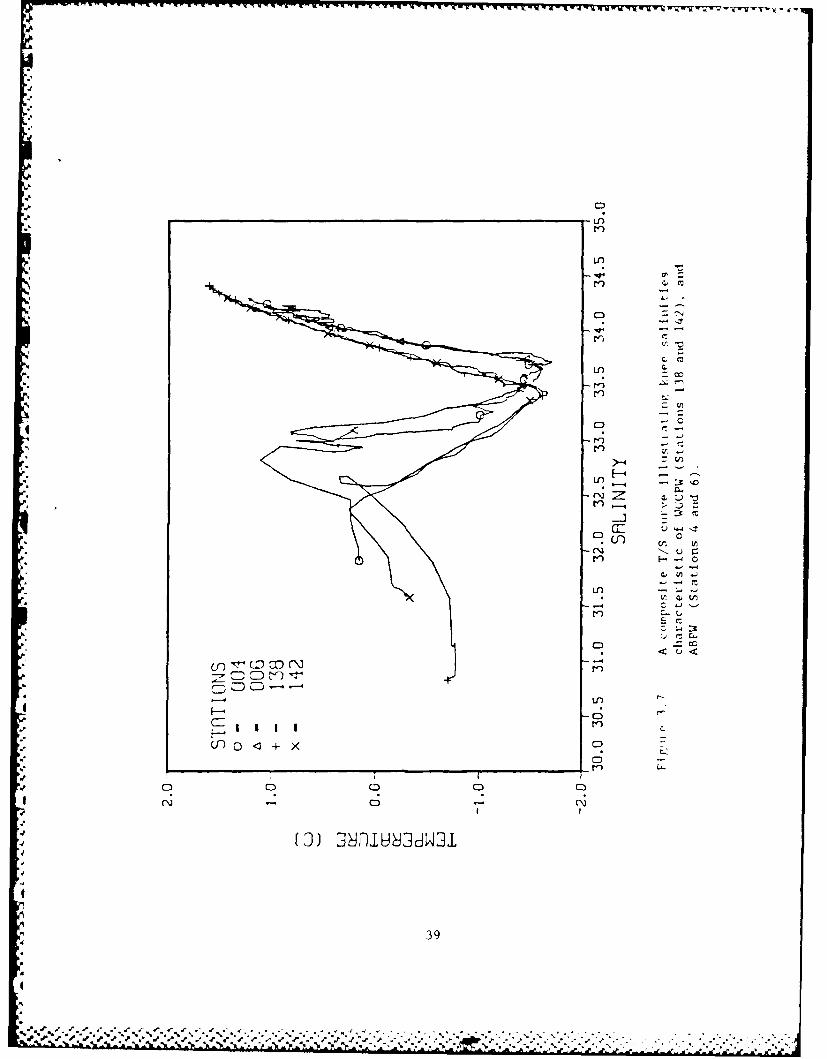
3.7 A composite T/S curve illustrating knee salinities* characteristic of WGCPW and ABPW ............................. 3q
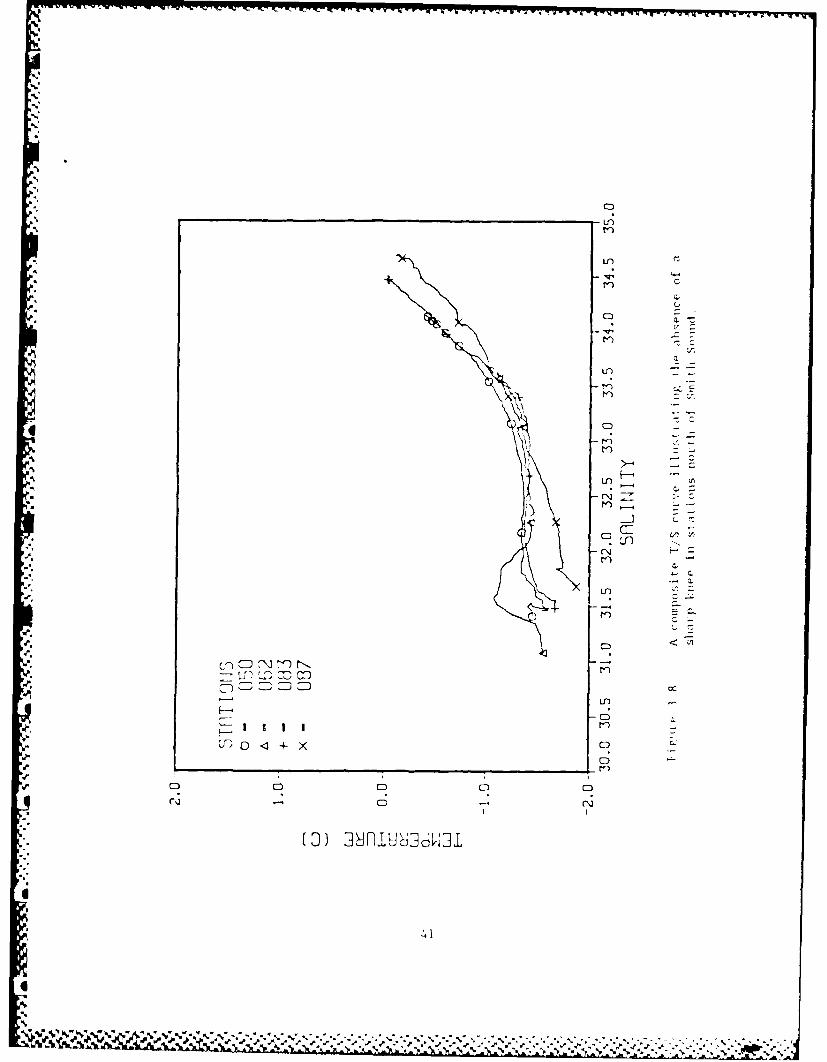
3.8 A composite T/S curve illustrating the absence of a sharpI. knee in stations north of Smith Sound ....................... 41
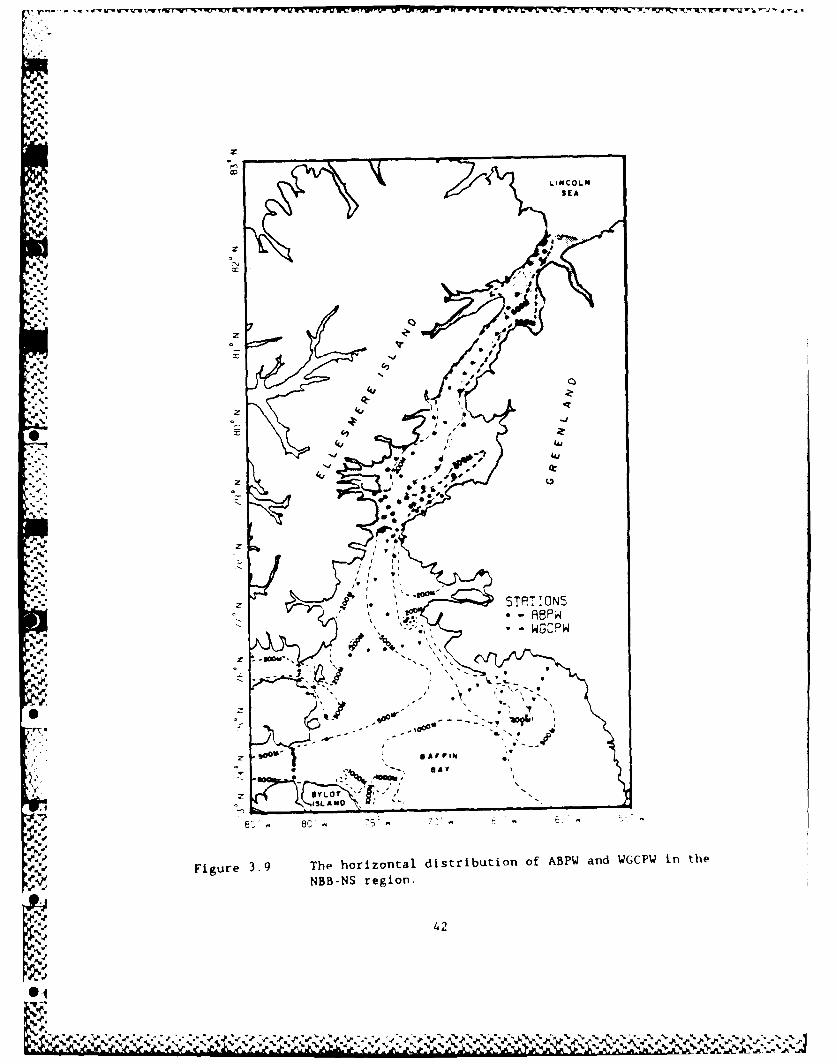
3.q The horizontal distribution of ABPW and WGCPW in the NBB-NS
r e g io n. .... .............. ................................. . 4 2
3.10 A composite temperature profile illustrating the interi-avingof ABPW and W(;CPW in Smith Sound. Jones Sound andMelville Ba'. . ......... ...... . ... ....... 4
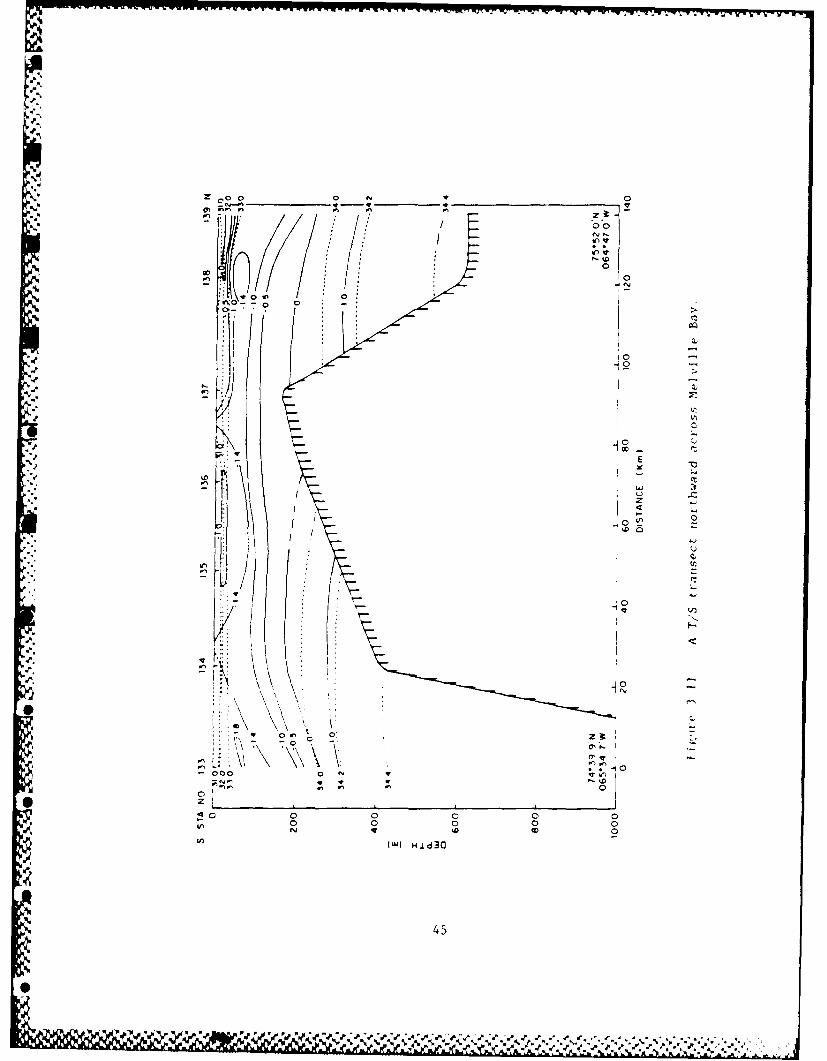
3.11 A T/S transect northward across Mel.'ille. b, 41,
3 .12 A T/S transect across Kant B, ir ,
3.13 A T/S transect across the sotthein e1Iaicf' t( Lint basin .. 8
8
r( e 41 r
%14,V06;0 F g- % -. % %

4, 3.14 A T/S transect across the mouth of Jones Sound ............... 49
3.15 A T/S transect across the mouth of Lancaster Sound ........... 50
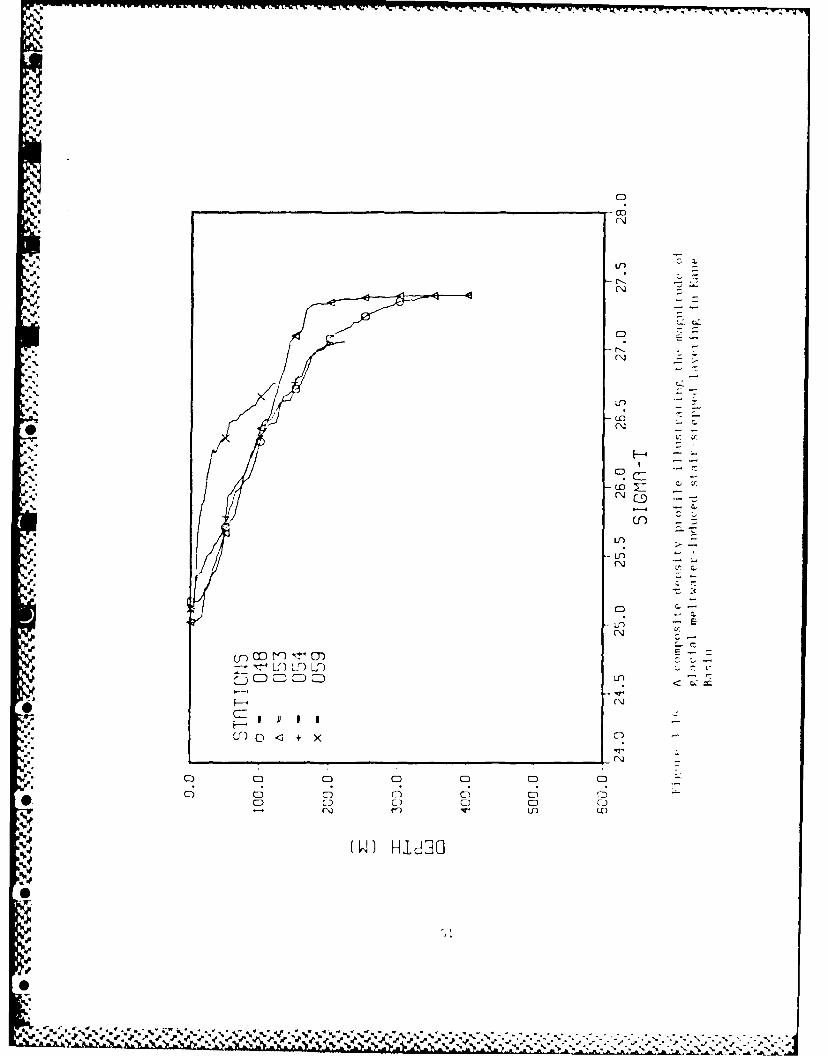
3.16 A omposite density profile illustrating the magittude of
PI ,cial meltwater-indliced stair-stepped layering in KaneB a , i n ..... .............. ....... ....... ................5 1
3 17 A F/S transect in Robeson Channel ............................. 52
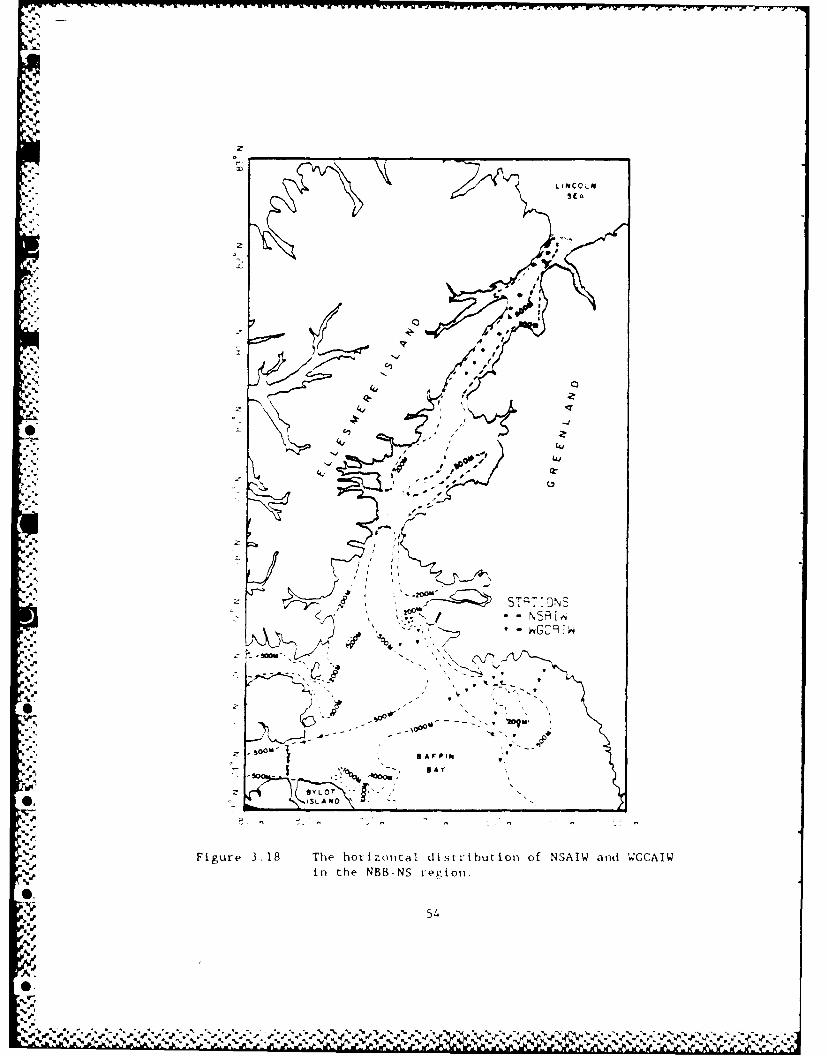
* 3.18 The horizontal distribution of NSAIW and WGCAIW in the
NB B -N S reg ion ... .. ... ............ .... .... ... .. .............. 54
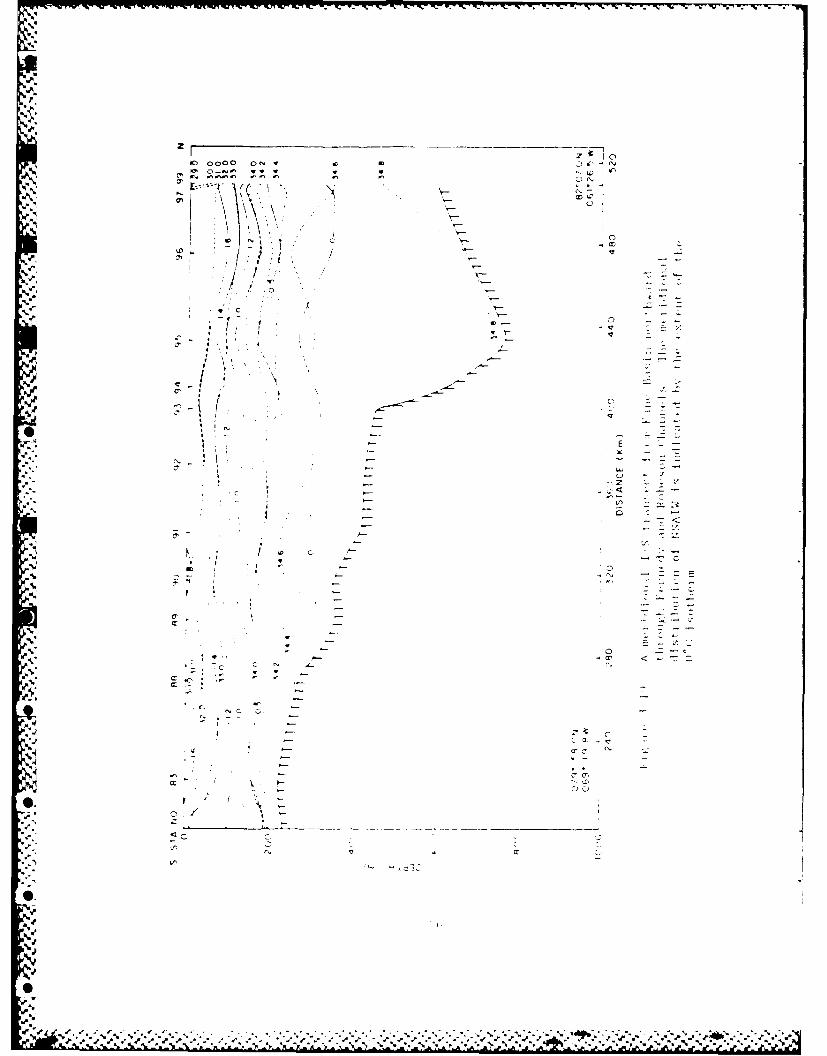
S3.19 A meridional T/S transect from Kane Basin northwardthrough Kennedy and Robeson Channels .......................... 56
3.20 A T/S transect Jones Sound eastward to Thule ................. 57
%, 4.1 Surface circulation in the NBB-NS region ...................... 59
4.2 The surface dynamic topography referenced to 200
decibars, in dynamic centimeters ............................. 60
4.3 A baroclinic velocity cross section through Melville Bay.....63
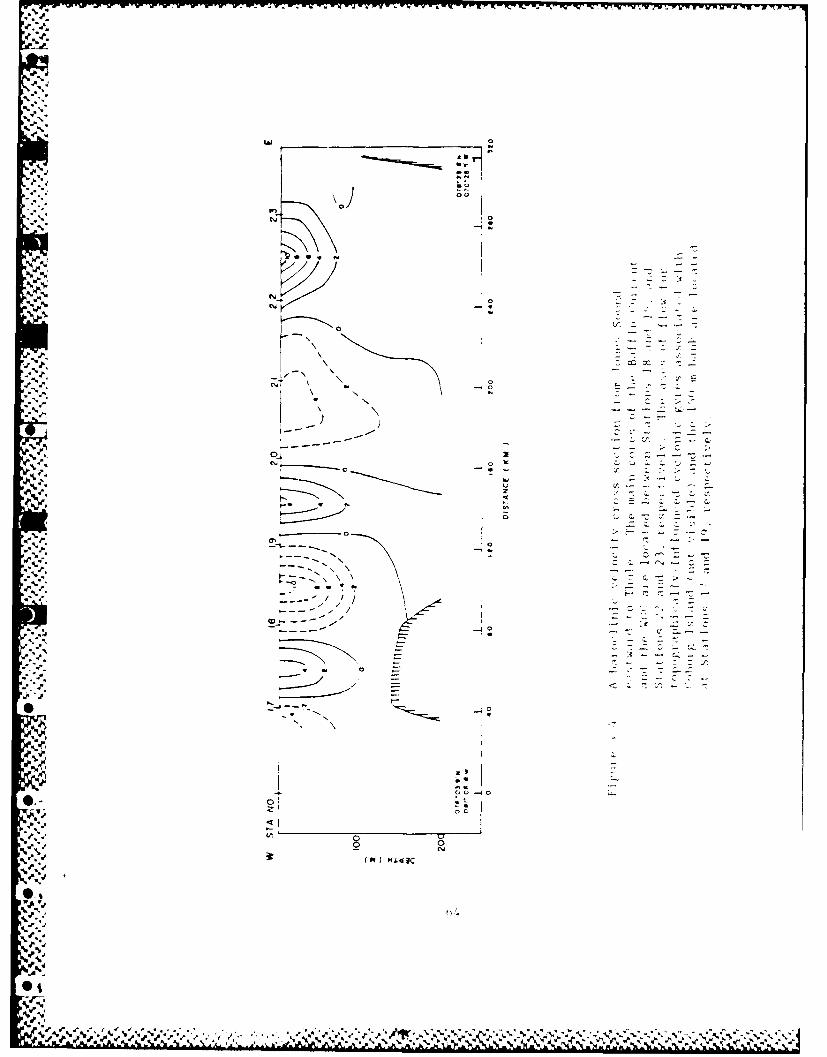
4.4 A baroclinic velocity cross section from Jones Sound
eastward to Thule . ........................................... 64
. 4.5 A eridional baroclinic velocity cross section from BaffinBay northward to Kane Basin .................................... 66
4.6 A baroclinic velocity cross section through a southern
part of Kennedy Channel ...................................... 67
4.7 A baroclinic velocity cross section through the southern
portion of the Kane Basin Gyre ............................... 69
4.8 A baroclinic velocity cross section through Smith Sound ...... 72
4.9 A baroclinic velocity cross section through Jones Sound ...... 74
4,10 A baroclinic velocity cross section through Lancaster Sound..76
4.11 A schematic cross section of coastal upper laver flow
(from Leblond , 1980 , p . 191) ................................. 77
4.12 Sitrface dynamic height anomalies ii, Lancaster Sound(in dynamic cm) relative to 300 dbar level (from
Fissel et al . 1982. p. 187) ........ .......................... 8
4-13 Dvnamic topograph. ot the 'kl ,,t 1 , I ? i" 1" ), d, 1.W'(I , ill
Jones Sound for various 'ears t f lnin M l3ICII. 1Ki; . ). 'Q) ..... 8
* 9

'V4.14 Major baroclintic transports in, the NBB-NS region ............. 85
5.1 Enthalpy of the near-surface tupper 75 m) layer li the
NBB-NS region (referenced to -I.80 C) ......................... 9
4$0
%-
.4
4440
4,
ACKNOWLEDGEMENTS
Funding for the work described in this thesis was provided by the
Arctic Submarine Laboratory, Naval Ocean Systems Center, San Diego,
California under Work Order N-66001-86-WROO131.
I wish to thank Dr. R.H. Bourke for initially providing me with the
opportunity to participate in this study, and, thereafter, for his
invaluable assistance and encouragement. Dr. R.G. Paquette is also
gratefully acknowledged for his advice and assistance and, in
particular, for this continued support during periods of severe personal
hardship.
The success of the cruise can be attributed to the enthusiasm andS
dedication of the Captain and crew of the CCGS SIR JOHN FRANKLIN. I
also wish to thank A.M. Weigel, K.O. McCoy and Dr. P. Jones for their .. %
innumerable personal contributions to this effort. Miss J.E. Bennett is
also gratefully acknowledged for her indispensable assistance in the
preparation of this manuscript.' %
Finally. I wish to thank my lovely wife, Karen, for being there when
I needed he *.
" .
ZV'
'-,." V-.",
%-% %.
I. INTRODUCTION
A. PURPOSE
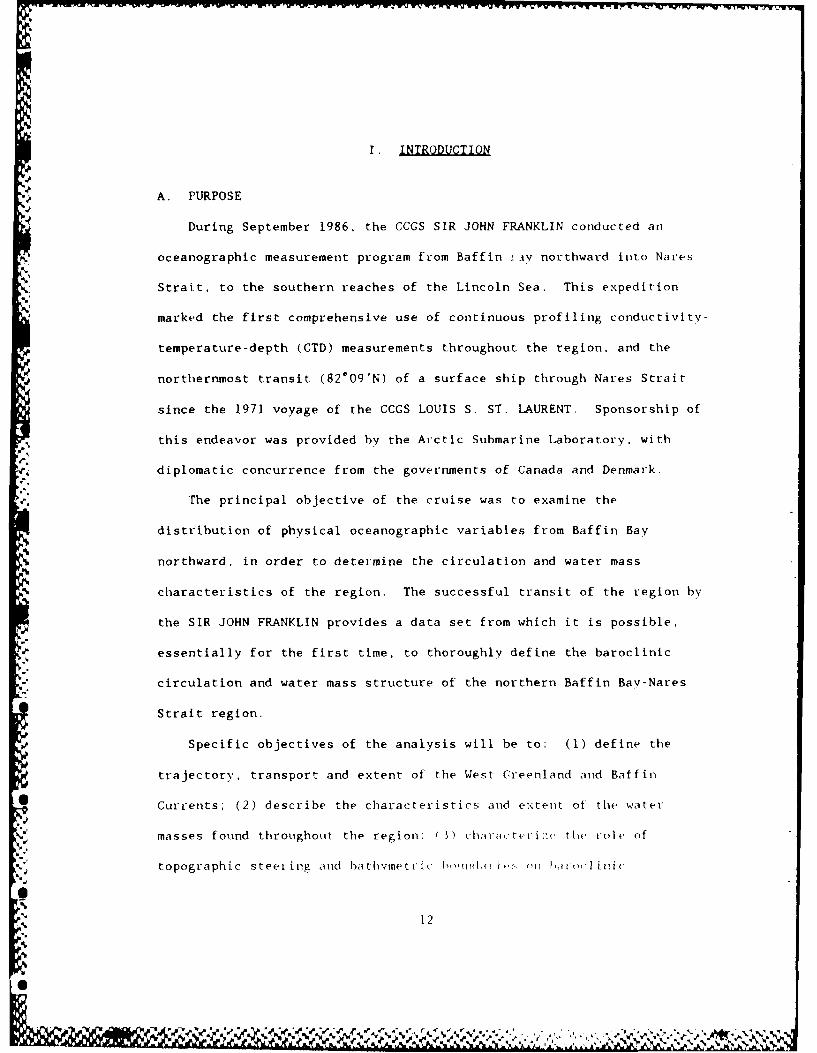
During September 1986, the CCGS SIR JOHN FRANKLIN conducted an
oceanographic measurement program from Baffin iay northward into Nares
Strait, to the southern reaches of the Lincoln Sea. This expedition
marked the first comprehensive use of continuous profiling conductivity-
temperature-depth (CTD) measurements throughout the region, and the
northernmost transit (82*09'N) of a surface ship through Nares Strait
since the 1971 voyage of the CCGS LOUIS S. ST. LAURENT. Sponsorship of
this endeavor was provided by the Arctic Submarine Laboratory, with
diplomatic concurrence from the governments of Canada and Denmark.
The principal objective of the cruise was to examine the
distribution of physical oceanographic variables from Baffin Bay
northward, in order to determine the circulation and water mass
characteristics of the region. The successful transit of the region by
the SIR JOHN FRANKLIN provides a data set from which it is possible.
essentially for the first time, to thoroughly define the baroclinic
circulation and water mass structure of the northern Baffin Bay-Nares
Strait region.
Specific objectives of the analysis will be to: (1) define the
trajectory, transport and extent of the West Greenland and Baffin
6Currents; (2) describe the characteristics and extent of the water
. masses found throughout the region: ( 3) characteri::e the role of
." topographic steering and bathyinetri hwmdi i I, lfi , ini c
% 12
6%
,' d't eA A;.* * t *~ * * ~

circulation and water mass penetration; (4) present a model which
explains the observed circulation in Smith, Jones, and Lancaster
Sounds; and (5) present a hypothesis for the formation and maintenance
of the North Water, a large polynya located in Northern Baffin Bay.
B. BACKGROUND
4 The northern Baffin Bay-Nares Strait (hereinafter referred to as
NBB-NS) region is historically significant for a number of seemingly
unrelated reasons (Figure 1.1). Lancaster Sound, noted as the
traditional Atlantic entrance to the Northwest Passage and as a net
source of Arctic Ocean water inflow to the region, remains relatively
ice free during winter. Indeed, northern Baffin Bay as a whole was
thought to remain conspicuously unencumbered by ice during the winter
due to the presence of the North Water. The Humboldt Glacier, the
largest glacier in the northern hemisphere, is located on the eastern
side of Nares Strait and is the source for many of the icebergs which
are observed throughout the NBB-NS region. Once calved from the
glacier, many of these icebergs trav'el southward past Cape York, in
defiance of the northward flowing West Greenland Current. The most
comprehensive oceanographic analysis of the northern Baffin Bay region
is provided by Muench (1971). Muench's work serves as a summary of all
significant oceanographic research conducted prior to 1971, and has been
referenced in all subsequent analyses of the NBB-NS region.
Prior to 1972, all baroclinic o,-eanographic analyses in the NBB-NS
region were derived from bottle sampling techniques. The CGUS LOUIS S
ST. LAURENT obtained discrete me s,-inf.nt , ,, it,'i,. ,Itl iimx
in Nares Strait during August 19i71. r-eachiqng ,! lititkide oi 820 56'N
% 0N N,-1

z
LINCOL4SFA
A
A A AA
5A A
(.40
7 H ALL GASU
.0.
' "_. i r
C*7
z, q ~ . a*S ' ',A-...
= = , |
KANE ~ ,
I /t
0-'
Figur 1. hr ftenrtenBf~ a-ae
JOE :/)ILAND B-
DEVON-nSoANO S e - - - A. t
Srprsneda sae aras
r, 000zACSE BAFFINd
SOU. D AY
4ISLAND'
85W eo0 750w 70 w 65, 60 .4 55' w
Figure 1.1 A chart of the northern Baffin Bay-NaresStrait region. Ice concentrations greater than7/10 (durin~g the FRANKLIN 86 cruise) arerepresented as shaded areas.
14
S.%

(Sadler, 1976). During 1Q72, scientific personnel aboard the LOUIS S.
ST. LAURENT .btained the first winter oceanographic dati from Davis
Strait utilizing an in situ saliitv/,'tempe rat Lre/depth mit (STD)
(Muench and Sadier, 1973). Transports through Naro's St!'ait have been
investiga ted by Sadler (176), providing the most ,iccura te current meter
derived estimates of Lincoln Sea Inflow to the region. In 1978 and
197Q, the Eastern Arctic Marine Environment Studies (EAMES) program
utilized current meters and CTD stations to investigate the southward
flowing Baffin Current (Fissel et al.. 1182). Research concerning the
processes leading to the formation of the North Water has most recently
been conducted by Steffen and Ohmura (1985).
1. Bathyme
The bottom topography of the NBB-NS region is complex and, as
such, has the potential to exert significant control over physical
oceanographic processes. The influence of glaciers on all aspects of
the morphology of this region is quite obvious.
Northern Baffin Bay is fed by Lancaster and Jones Sounds to the
west, and Smith Sound to the north. S.,oaling to depths of less than
200 m occurs at some point in both Lancaster and Jones Sounds,
effectively restricting deeper Arctic Ocean inflow. A sill which ranges
in depth from 160 m to 200 m is present at the southern end of Kennedy
Channel, providing similar constraints on Lincoln Sea inflow to the
region. Similarly, shoaling to a depth of ."1) m occurs It the Smith
Sound entrance to Kane Basin.
The deep. relativelv flat c(nte l p .. t oin,, of nortlti-n Biff in
Bay is plinc tuar ed ill it', ,. - em li .1 1 ~ j in f
15
y,%
aa r

located in Melville Bay. A deep (500 m to 900 m) channel passes
offshore from Cape York, terminating northward in Smith Sound. To the
west, the mouths of Jones and Lancaster Sounds reach depths of 700 m,
but the bottom northeast of Devon Island shoals to less than 200 m
approaching Smith Sound.
2. General Circulation
A The baroclinic circulation pattern in the NBB-NS region is
dominated by the northward flowing West Greenland Current (WOC) and the
southward flowing Baffin Current (Figure 1.2). Augmenting the transport
of the Baffin Current are net outflows from Jones and Lancaster Sounds,
coupled with southward flow through Nares Strait. The net baroclinic
% transport through northern Baffin Bay has been computed to be
approximately 2.0 Sv (106m3 s"1) southward (Muench, 1971). Muench
postulated that this transport is driven by a higher surface elevation
in the Arctic Ocean relative to that in Baffin Bay, presumed to be a
consequence of differing water structures in their respective upper
250 m layers.
Bottom topography, predominantly northerly winds, and meltwater
admixture are thought to play variable roles in the maintenance of a
cyclonic circulation pattern in northern Baffin Bay. The WCC, a
significantly barotropic current, may be enhanced baroclinically by
near-shore low salinity wedges of meltwater. Alternately, the Baffin
Current exhibits the increased baroclinic intensity characteristicallv
found in western boundary currents. The westward tirninpg of the W(;C off
Cape York, and the southward turning of h, S oitie ) Somd ,itfln%.: ,re
both influenced bv topographic stet ii ' '1I. i, I I
16
fNq

4
S, . 4 ,,-,,.-. .
Alll
i -'------- -,t:+
I I
- ,
a-
6V G0" 5.. 50.
:Figtre 1.2 The West (Creetil and Cur-rent an~d the Baf ftin
,,,, Current (trom Muencth, l971, p. 2).
17
.J.
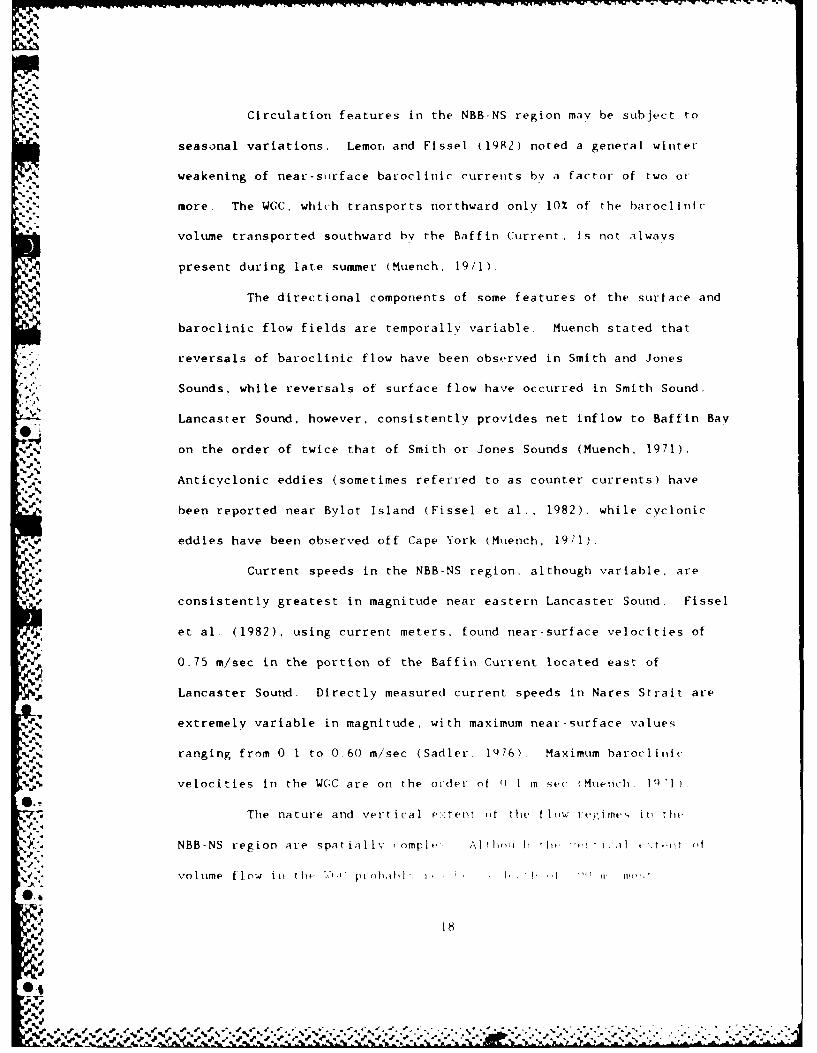
Circulation features in the NBB-NS region may be subject to
seasonal variations. Lemon and Flssel (1982) noted a general winter
weakening of near-surface baroclinic currents by a factor of two or
more. The WGC, which transports northward only 10% of the baroclinic
volume transported southward by the Baffin Current, is not always
present during late summer (Muench, 1971).
The directional components of some features of the surface and
baroclinic flow fields are temporally variable. Muench stated that
reversals of baroclinic flow have been observed in Smith and Jones
Sounds, while reversals of surface flow have occurred in Smith Sound.
Lancaster Sound, however, consistently provides net inflow to Baffin Bay
on the order of twice that of Smith or Jones Sounds (Muench, 1971).
' Anticyclonic eddies (sometimes referred to as counter currents) have
been reported near Bylot Island (Fissel et al., 1982), while cyclonic
eddies have been observed off Cape York (Muench, 19;1).
Current speeds in the NBB-NS region, although variable, are
consistently greatest in magnitude near eastern Lancaster Sound. Fissel
et al. (1982), using current meters, found near-surface velocities of
0.75 m/sec in the portion of the Baffin Current located east of
Lancaster Sound. Directly measured current speeds in Nares Strait are
% extremely variable in magnitude, with maximum near-surface values
ranging from 0 1 to 0.60 m/sec (Sadler. 1q76) Maximum baroclinic
velocities in the W(;C are on the order of I) t insec (Muench. 1 '11
The nature and vertical e:.:tent ot the f iw ierjimes ii he
NBB-NS region are spatially ,omple> Al l ,I h I ,. ' , :..t .t t
Ikolime flow ii1 th. '.,pI.Iio,,Ih1 f C. I tp I o .1
18
"A. A. -A -*A A -* , A .. .. ,'
'.p

baroclinic flow is limited to the upper 100 m (Muench, 1971). The
Baffin Current nominally extends to a depth of 500 m, with flow reaching
the bottom (700 m to 840 m deep) in the region of its intrusion into
Lancaster Sound (Fissel et al., 1982). Significant baroclinic flow in
this current is associated with the upper few hundred meters (Muench,
1971). The flow in Nares Strait has a substantial baroclinic component
which reaches to depths of 300 m (Sadler, IQ76).
3. Water Masses
Adopting the usual convention for Arctic regions, Muench (1971)
divided the waters of northern Baffin Bay into three layers: a cold
(<0C) upper Arctic Water laver; a warmer (>0 C) intermediate-depth
Atlantic Water layer: and a cold (<()°C) Deep Water Layer. The Arctic
Water, confined to the upper 200 m to 300 m, has an upper limit in
salinity of approximately 34.0. The Atlantic Water extends from the
bottom of the Arctic Water laver to depths of 700 m in Lancaster Sound
and 1300 m in northern Baffin Bay, exhibiting salinities of 34.2 to
34.5. Baffin Bay Deep Water extends from the bottom of the Atlantic
Layer to the seabed, and is characteristically isohaline at 34.48.
The density of water masses in the NBB-NS region, as in other
Arctic regions, is primarily determined by salinity. Surface and near--
surface layers, therefore, are usually characterized by strong
haloclines and associated pycnoclines. The delineation of a surface
(upper 75 m) laver of Arctic Water. which is modified bv boundarv 1.ivei.,
processes, has been suggested by Fissel et .i], (182) Since diverse
processes such as solar heating l , ,11l uiud Ini-:i ug
0.lg
*'
"'5'"',% "% "% "% *% % o " "% .% .* ." ""% ." .%.% ", ' 1 ." " ",

play roles in the formation of this laver, its temperatuire and salinity
characteristics vary seasonally.
The thermohaline characteristics of the water masses of the
region can generally be traced to their sources, while their horizontal
extent is often determined by bathvmetric effects. Arctic Water is
water of Arctic Ocean origin which either entered Baffin Bay via Davis
Strait and was modified by cooling and admixture of runoff within
northern Baffin Bay, or was modified by cooling and freshening within
the Arctic Ocean prior to entering Baffin Bay from the north. Mixing of
inflowing Arctic Ocean Water and resident Baffin Bay Arctic Water of the
9 same density occurs in southern Smith Sound, Jones Sound, and Lancaster
Sound. Shallow sills present in Lancaster Sound, Jones Sound and
Kennedy Channel prevent southward flow of Arctic Ocean Atlantic Water
into Baffin Bay. Atlantic Water in northern Baffin Bay, therefore,
originates from the Atlantic Ocean via Davis Strait (Muench, 1971).
4. The North Water
Extensive interest has been focused on a persistent polynya,
termed the North Water, which is located in northern Baffin Bay
(Figure 1.3). Dunbar (1970) concluded that the polynya is defined by a
stable northern boundary at the Smith Sound entrance to Kane Basin, and
a consistent western ice edge which forms along Ellesmere Island. The
d locations of the eastern and southern boundaries are seasonally
dependent Significant penetration ot the' North W:atvr occli-s westward
into Lancaster Sour! in June Th&, ph*-Tf,.m*:,lru)l is I 1.5 ..'lI de i ed
duriig the summer sasou af t,- ( (i. .,, I , , ,. I ,MTI i i ,, I (I
earll ei re.por-t , tO , 1 '., ' . , '. l , , , itl.

K(ANE SASIN
ELLESMERE10
ISLAND
S..'-P1M c ~ RENSSELAERS9
LirfTLE-TON/ *- GREENLAND
*C
4...' ."..,., 1
';.'f .- - .' ,' "----T '
.4 DEVON ISLANt
s~-. -'BAFFIN
LANCASTER SOUNO BAY
•8
* Figure 1.3 The approximate mean monthly extent of the North
Water in: March (. .), April (_ _ _) May
(---), June (_ ), (from Dunbar. 1Q70, p.
21
.4%

winter, and is characterized by extensive areas of new ice formation
(Dunbar, 1973). Steffen and Ohmura (1985) used thermal infrared
-; measurements from an airplane in winter to determine that the North
Water was mostly covered with new and voting ice, and probably devoid of
first year ice until March. The ice surface, they surmised, was
approximately 20*C warmer than that of the surrounding fast ice.
The North Water essentially remains an unexplained phenomenon.
Muench (1971) computed a heat budget for the region and concluded that
insufficient heat is present in the Atlantic Water layer in northern
Baffin Bay to prevent ice formation. He similarly concluded that there
was not enough heat present in the surface Arctic Water layer either,
and postulated mechanical ice removal by northerly winds and currents as
the effects responsible for the formation of the North Water. Dunbar
(1973) reinforced this hypothesis by noting that the age and thickness
of ice increases from the Smith Sound ice arch southward. Steffen and
Ohmura (1985), however, computed more accurate heat budgets for the
region and concluded that oceanic heat of unknown origin is responsible
for the formation and maintenance of this polynva.
22
S%
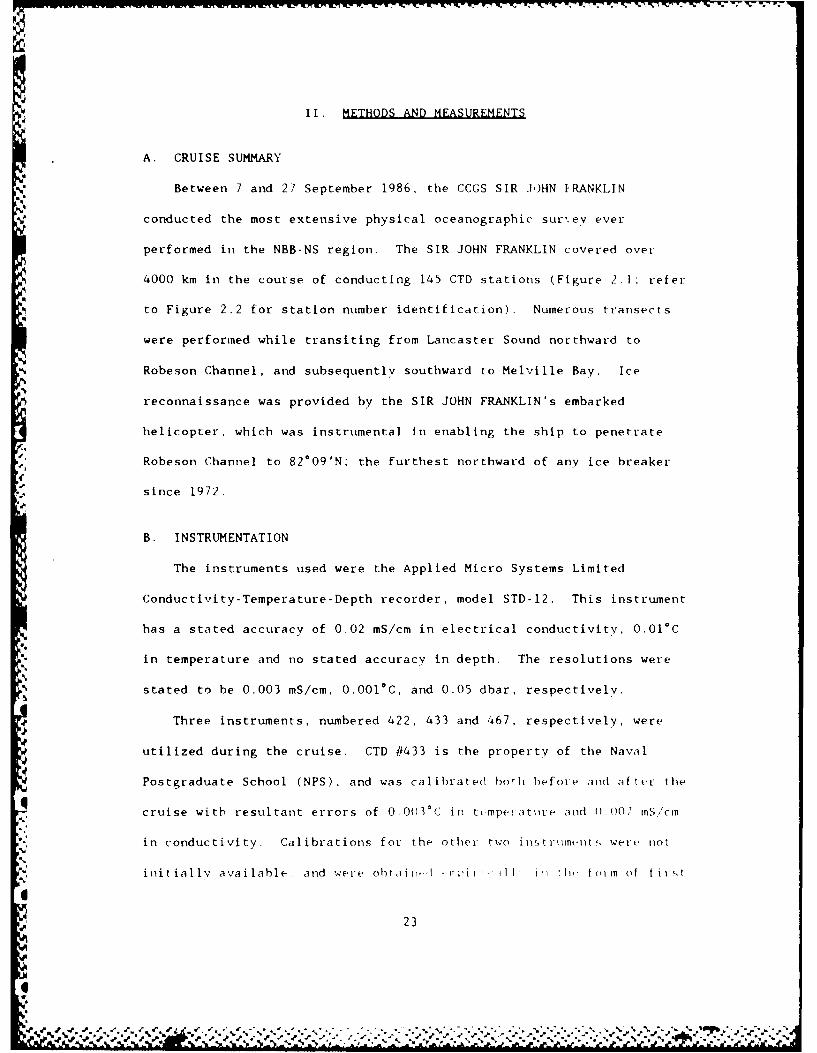
II. METHODS AND MEASUREMENTS
A. CRUISE SUMMARY
Between 7 and 27 September 1986, the CCGS SIR JOHN FRANKLIN
conducted the most extensive physical oceanographic sur. ey ever
performed in the NBB-NS region. The SIR JOHN FRANKLIN covered over
4000 km in the course of conducting 145 CTD stations (Figure 2.1; refer
to Figure 2.2 for station number identification). Numerous transects
were performed while transiting from Lancaster Sound northward to
Robeson Channel, and subsequently southward to Melville Bay. Ice
reconnaissance was provided by the SIR JOHN FRANKLIN's embarked
helicopter, which was instrumental in enabling the ship to penetrate
Robeson Channel to 82*09'N; the furthest northward of any ice breaker
since 1972.
B. INSTRUMENTATION
The instruments used were the Applied Micro Systems Limited
Conductivity-Temperature-Depth recorder, model STD-12. This instrument
has a stated accuracy of 0.02 mS/cm in electrical conductivity, 0.01C
in temperature and no stated accuracy in depth. The resolutions were
5' stated to be 0.003 mS/cm, 0.001*C, and 0.05 dbar, respectively.
Three instruments, numbered 422, 433 and 467, respectively, were
utilized during the cruise. CTD #433 is the property of the Naval
Postgraduate School (NPS), and was calibrated both before and after the
cruise with resultant errors of 0.0()3C in t( mper iatxte and ().007 mS/cm
in conductivity. Calibrations for the other two inst rumnents were, not
init ially available, and were obtaiii- ,ip'i d Ip i 11 thn, t(l1in of |i l't
I23
I%
A e ld

LINCOLN
44-
orL
DEVONpISLAND
BAFFI
SA )
a? (3T
ISLAND
*Figure 2.1 The locations of CTD stations conducted during the
September 1986 cruise of CCGS SIR JOH~N FRANKLIN.
a? %M1
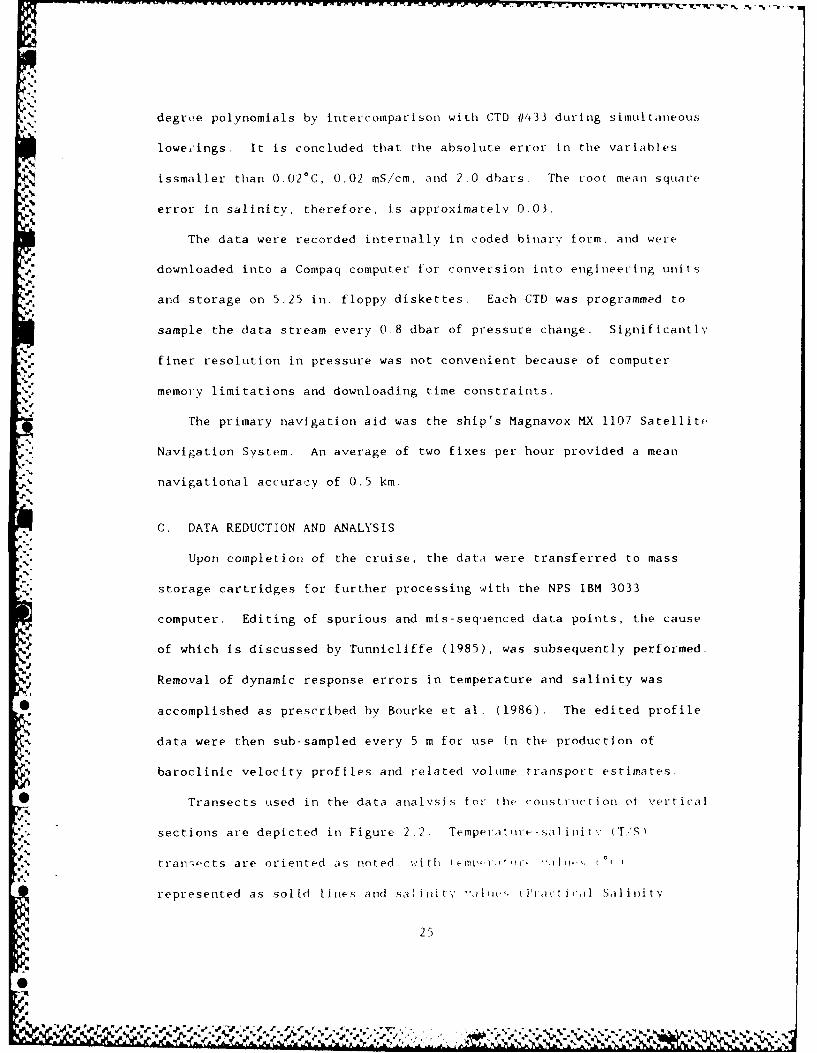
degree polynomials by intercomparison with CTD #0433 during simultaneous
lowef'ings. It is concluded that the absolute error in the variables
issmaller than 0.02°C, 0.02 mS/cm, and 2.0 dbars. The root mean square
S error in salinity, therefore, is approximately 0.03.
The data were recorded internally in coded binary form. and were
downloaded into a Compaq computer for conversion into engineering units
and storage on 5.25 in. floppy diskettes. Each CTD was programmed to
sample the data stream every 0.8 dbar of pressure change. Significantly
finer resolution in pressure was not convenient because of computer
memory limitations and downloading time constraints.
The primary navigation aid was the ship's Magnavox MX 1107 Satellite.
Navigation System. An average of two fixes per hour provided a mean
navigational accuracy of 0.5 km.
C. DATA REDUCTION AND ANALYSIS
Upon completion of the cruise, the data were transferred to mass
storage cartridges for further processing with the NPS IBM 3033
computer. Editing of spurious and mis-sequenced data points, the cause
of which is discussed by Tunnicliffe (1985), was subsequently performed.
Removal of dynamic response errors in temperature and salinity was
* accomplished as prescribed by Bourke et al. (1986). The edited profile
data were then sub-sampled every 5 m for use in the production of
Sbaroclinic velocity profiles and related volume transport estimates.
* Transects used in the data analysis for the construction ot vertical
sections are depicted in Figure 2.2. Temperattire-salinitv (T,'S)
,'N tratsects are oriented as noted, it- t e%.:i.tlht . lb .. (I
represented as solid lites and salinit. , s tlha,.tic,i Salinity
25
0'. '.0 46 ,

LINCOLNSEA
4-"v
'44.1
34.
141
:c c
D EV~ON vl I
iS"AND,7' I
N~
'. .. 5, BAFFIN
N; fBAY
Figure 2.2 The locations of transects used in the analysis.
The dotted I ne denotes stations used forconstruction ot me idional cross sections.
S.

4
Scale) represented as dashed lines. Baroclinic velocitv; cross se rions
are oriented with velocities (cm/se ) "into" and "out of" the pagt
represented as solid (positive valuts) and dashed (negative values),
respectively.
Surface dynamic heights and baroclinic velocity profiles were
derived from the geostrophic approximation, assuming a level of no
motion of 200 dbars. The technique of Helland-Hansen (1934) was deemed
inappropriate for use in the NBB-NS region because of the inherently
shillow and irregular bathymetry. thereby precluding the selectio, of a
deeper reference level for regional application. Although a 200 dbar
reference level is suitable for estimating direction in near-surface
*" baroclinic currents, magnitudes were found to be underestimated by as
mu, h as 25% when compared to those derived with a level of no motion of
400 dbars.
Baroclinic volume transports were calculated using variable
reference levels, determined by the maximum common sample depth in a
station pair. As -he sample depths were occasionally limited by
mechanical rather than bathymetric considerations, the associated
transports may be subject to underestimation accordingly. The
transports were cAlculated by vertical trapezoidal integration of
baroclinic velocities over 5 m intervals.
I
27
so.
a'%
Ne te
-101 -V L
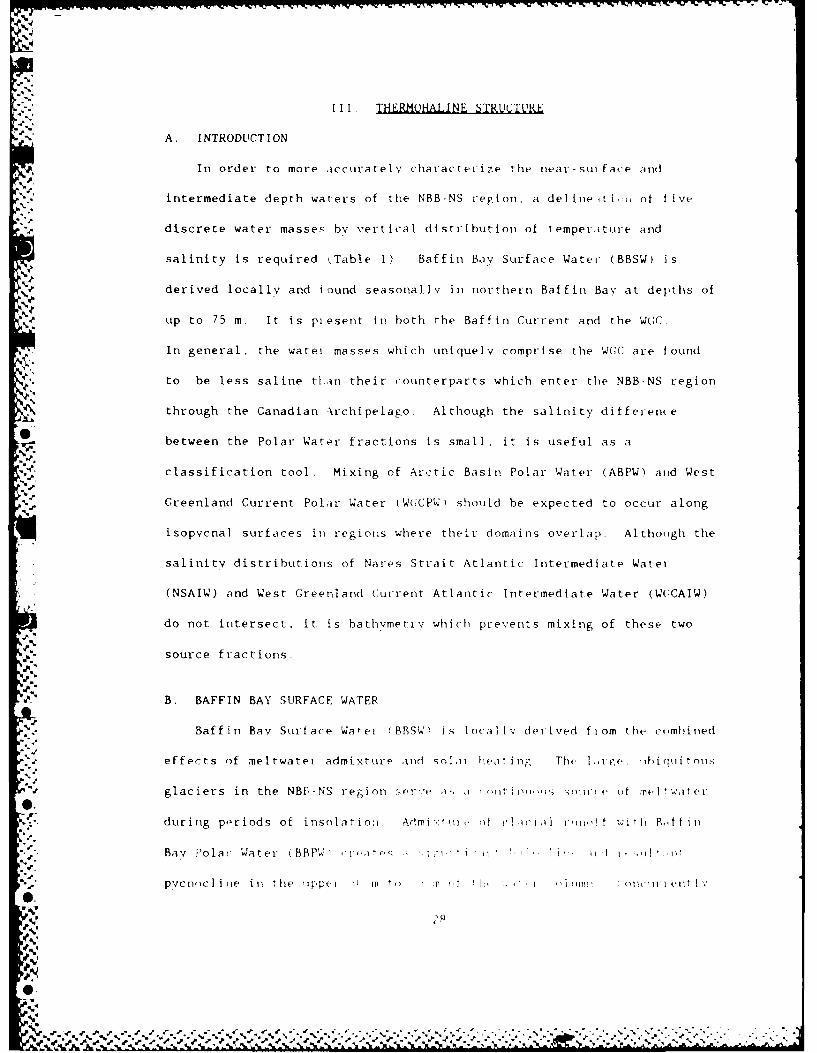
.II THERMOHALINE STRUCTURE
A. INTRODUCTION
In order to more iccurately characterize the near-sui face and
intermediate depth waters of the NBB-NS region, a deline,ti, ot ive
discrete water masses by vertical distribution of temperiture and
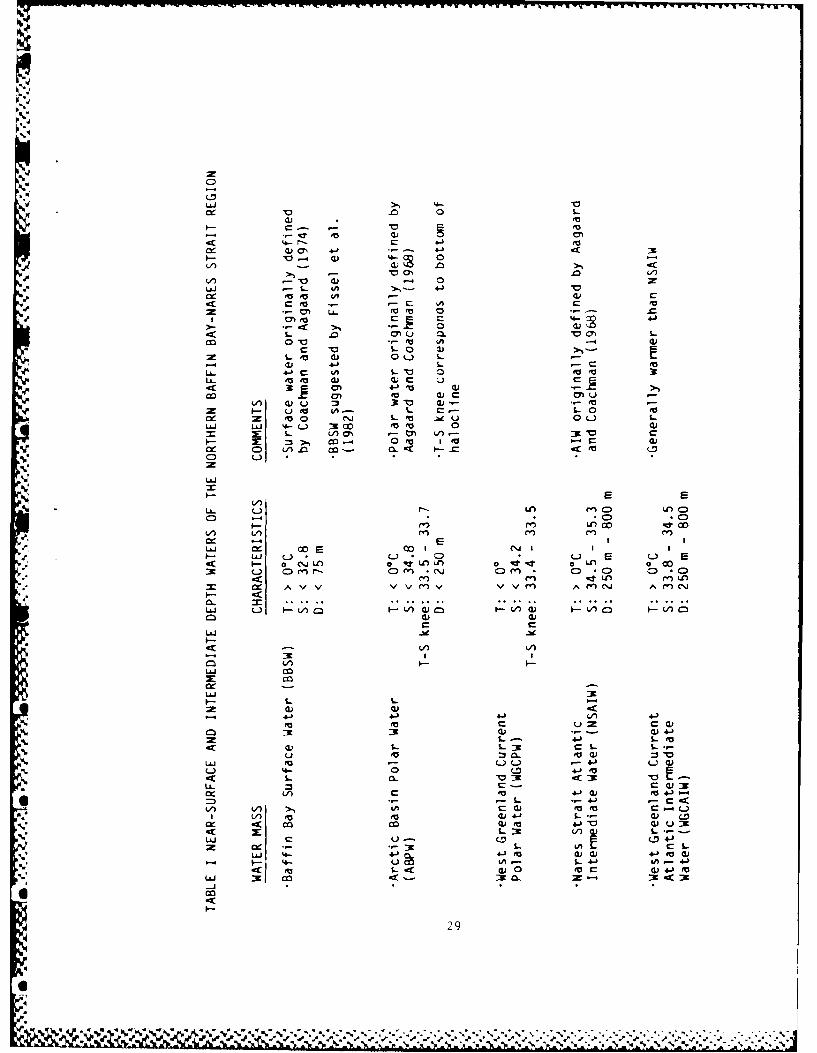
salinity is required kTable 1). Baffin Bay Surface Water (BBSW) is
derived locally and found seasonally in northern Baffin Bay at depths of
up to 75 m. It is piesent in both 'he Baffin Current and the WGC
In general, the watei masses which uniquely comprise the WG( are found
to be less saline tian their counterparts which enter the NBB-NS region
through the Canadian \rchipelago. Although the salinity difference
"S. between the Polar Wator fractions is small, it is useful as a
classification tool. Mixing of Arctic Basin Polar Water (ABPW) and West
Greenland Current Polar Water (W(;CPW) should be expected to occur along
isopvcnal surfaces iIl regions where their domains overlap. Altho igh the
salinity distributions of Nares Strait Atlantic Intermediate Watei
(NSAIW) and West Greenland Current Atlantic Intermediate Water (W(:CAIW)
do not intersect, it is bathvmetrv which prevents mixing of these two
source fractions.
B. BAFFIN BAY SURFACE WATER
Baffin Bay Surface Water (BBSW is locall'; derived fiom the combined
effects of meltwater admixtuie and soli.i heatin , The ihiqek. , iqitnui
glaciers in the NB'-NS region i iere.' ., , ow oII,,IIS nW li t elk w4lte'r
during poriods of insola tio:t Admi:,:tuii0 of cl 'ic 1 ' i, '!f "'ith ,itfi
Bay Polar Water (BBP , - i.i .. I. , '
pvcno,)c I i i tlie I Ippt. I t ;, TI, .I j t i 1)! I IW~ l ' l l it I
,%
04 % %
--* i'. . .i--
z
< c:h 4'. - - 4-0
LiiL >, '4-) -
C--- - E
CL V,~ aN
. 4-nas C ' 4 VA- ea m 4= 4 af
< 39 CM 4- ( v-
co GC fa 4)c
u- L 0 ea
faI Sfl 0a -f) L.
V- .- I- - ) V--
3 -4 0 to Ir 4)CD L^ im 0" 0. a. .
• E
LA L. 1-0 C" C)vO-
" -) • - -0 . -. .f... m C, -Lt,0
Li.,,'V' ",- ",- :3: ..): .
4A 00 I E ~ ' 00 1 )~
.r.' ) 0 L. 3-v E..< 4 L'V LX) OL) O
:2c L-i -.) > ~ MV' 0- M 0jf
CC r "1 n -n . - U':3V -
v1 0 v~ v~ e.n r. <E"
.....
La)
,<
I E
II-
Li4) V)~i
4f m- = ~)e~f ~ ~ a ~ eU
LA- fa4.-
0. V=M -
C C-LA) V) >. o e .
I 3n mm4 L -L
La) <3oc )t 1VWu:<.- Z: %- :m- --
0)J 4) 4j4 oa)a a- . 4-) u- as ~ 0A 4-3I. 4
-C m) L- <: WC4l-
'VJ -N ccL :m- L
- ~~~ca.)44 1- 29
%a. %- %OIA~~~ C %U4.0 V1.
-4.%
• the effects of solai heating are essentially confined to this surfact
layer due to its inherent buoyancy The admittedly arbitrary
delineation of BBSW by the 00 C isotherm serves to dlist inguish it from
BBPW, rather than imply that the effects of insolation are restricted to
a discrete temperature range. BBSW is best identified, however. by the
presence of a strong. shallow thermocline (Figure i.1). A seasonal
reversal of the processes which create BBSW, tdtimatelv results in its
i *" eliminat ion.
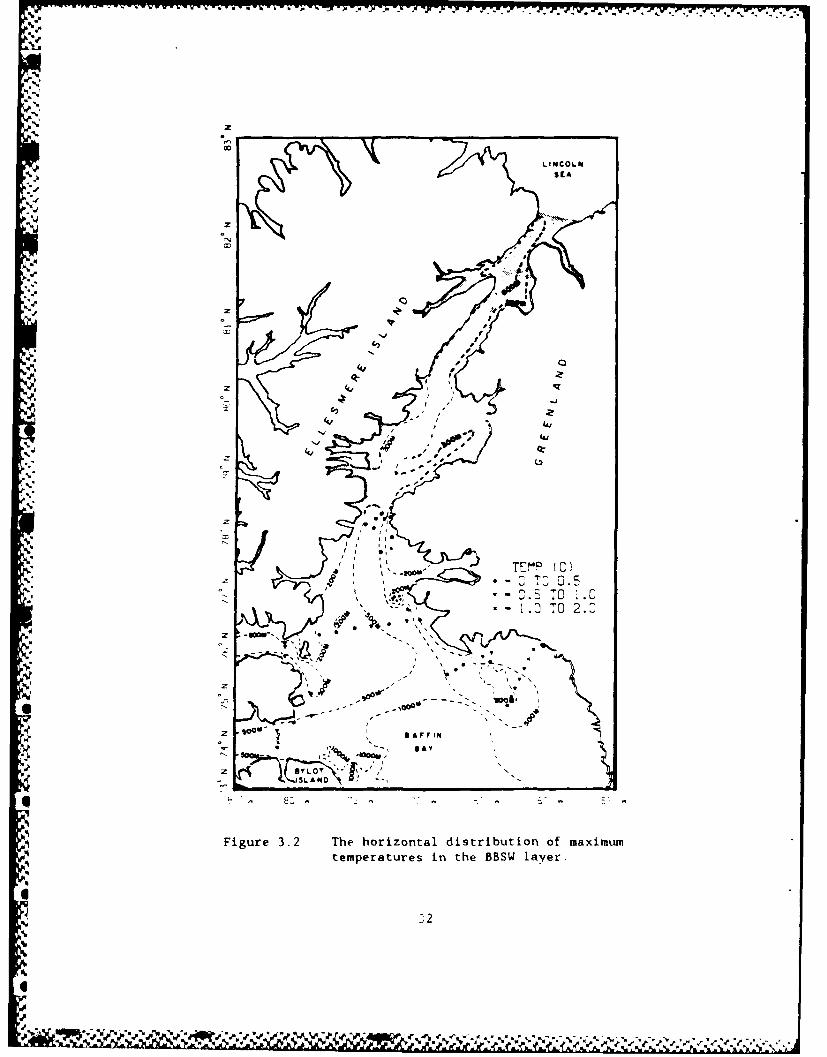
The distribution of BBSW is a regional pli.nomenon. The horizontal
distribution of maximum temperatures in the B SW laver shows distinct
gradients in the meridional and offshore directions (Figure 3.2). This
result implies that BBSW is formed primarily hv co,,stal processes, and
is subsetuentlv advected throughout most of northern Baffin Bay. The
complete absence of BBSW north of Smith Sound is due to the widespread
occurrence of pack ice. which serves to raise the albedo of the region
and reduce insolation.
, The considerable concentration of BBSW located in the shelf waters
of Melville Bay contributes significantly to the baroclinicitv of the
WGC. A ,jualitative examination of a T'S transect through Melville Bay
not only indicates that a major po-tIon of the baroclinicitv occurs in
* the upper 100 m, but that the isohalines (isopycnals) related to the
presence of BBSW assume a negative slope in the core of the WGC between
Stations 122 and 123 (Figure 3. 3 The sea sonial presenice ot BBSW.
therefore, would he Pxpected io -,ihcc, (- li hi r)cI i li' t ra spor of t he
-1,0 C ..?.K P
*-4 '.

-4
CDC
C -:
f4~
ZC,~
'4 C-
(L)
CD~~ C) C) C
Ln C
~~31
I" ' Z
SINCOLN
, --3 [A
.. %1
-two' TEMP fC)
.In
j'' - - " - '-
Figure 3.2 The horizontal distribution of maximum
~temperatures in the BBSW layer.
6,2
%; "° ="" - "'" 4 % . . " . ,,VP7 'U,, . •

0 0 0 z 3
If!t .) in on
0 0
u u
- CL,
0 0.
C-,ej-N) F7
too~ 0
CY.1 DN np l n W
-0-zCI
N0 -)- 0. 0 00W OD 0
3: (W Hl-3O0A
33>-
% ;: ne
The presence of BBSW at an ice edge can he considered to represent
an equilibrium state The northernmost extent ot BBSW is preciselv
correlated with the location of the pack Ice edge. A meridional T/S
transect from Baffin Bay northward to Kane Basin graphically illustrates
this interaction between relatively warm surface water and an ice edge
(Figure 3.4). A filament of BBSW dives subsurface between Stations 44
and 47 beneath water of lower density at the ice edge. An equilibrium
state can exist if sufficient thermal advection is present to prevent
ice growth. Mitigation of thermal advection or atmospheric cooling will
cause the ice edge to advance or retreat, respectively.
-vj
C. POLAR WATER
Polar Water in the NBB-NS region is derived from two distinct
sources. Direct inflow from the Arctic Ocean through the Canadian
Archipelago is generically classified as Arctic Basin Polar Water
(ABPW), whereas northward flow via the WGC through Davis Strait is
termed West Greenland Current Polar Water (WCCPW). Subtle contrasts in
the thermohaline signatures of these two water masses are indicative of
their different origins, and serve as qualitative tracers of their
respective flow fields.
Although both forms of Polar Water have origins in the Arctic Ocean,
the flow of WGCPW follows a circuitous route around the southern tip of
(;reenland before entering the NBB-NS region The cumulative influence
of shelf and surface -driven processes on the thelmohalille Srrulictu-e of
W;CPW is therefore, of rreater macnit,ide lhi the eff,'t of similar
processes on ABPW The p-imniv- ii ,.,...li i ; ,t,,e. to
meltwater admixture. reslltinti, ii i ii* I Ini!i-,, ,i t tli, wate. col.ll
34
%0
.,-~~~~~~~ ~ ~ .. . . .- .. . ., .,.-* . ., -, . ",t ,-""",+""u- 'SL.P 2 2".+'r°" el."1*.",, ", r- ",,A'.'° e-" "Or ',
10
10.
UD 0
0
00
IW Il~
p 35
, Viewed simplistically, WGCPW can be consldsred a diluted form of ABPW
The comparative decrease in .salinity and, hence, density of Wi;CPW below
the surfice laver is most apparent in vertical property profiles
(Figures 3.5 and 3.6). The maximum salinity of WGCPW is approximately
34.2. while ABPW reaches 34.8.
The presence of Polar Water with an underlying warm laver produces
a characteristic inflection, or knee, when temperature is plotted
against salinity. This knee can be viewed as a boundary between the
bottom of the arctic halocline, formed as a consequence of convective
overturn in winter, and a deeper thermocline, which marks the transition
to an underlying warm laver. The salinity and depth at which this knee
occurs are functions of the inherent thermohaline characteristics of the
particular Polar Witer mass. The combination of relatively dilute VW;CPW
and underlying Atlaitic Intermediate Water results in a knee with a
salinity of 33.4 to 33.5, a' deoths ranging tvpically from 50 m to 120
m. As ABPW enters the NBB->'S region through Lancaster Sound, for
instance it is subject to interleaving and mixing along isopvcnal
surfaces. This comparatively undiluted inflow is characteristically
more dense than the resident Polar ater of northern Baffin Bay, and
consequently sinks. The resultant combination of comparatively saline
* ABPW and underlying Atlantic Intermediate Water produces a knee with
salinities between 33.5 and 33. 7, at depths of up to 250 m A composite
T/S curve illustrates thxe ctnirast ing V!:E * 'Ilit o01, r~f~ ('P '1-m0
. ABPW (Figure 3.7).
A imPdmcio in sgii ra t tom, -t'it t' I I-
% ' ~th e i, e cf- ( ,t l r l . [ , i " " I,]' i , ; I I ! 1, 1 ' I 1 i ,l
4-
S..n-,.. -.-.-.. ' '..-.,.-..-- ' ' ' ' ", "," ," - ,, '-. "," -", .: ' s ' ,2 ,$.. . . ' , , .
,."""""""S . -. . . . . .-.. . . . . . . . . -" , * . ._. .' . ;. . _ -, ,, . ,,, ,

CZ)
-. 4
In
-z
0 0~ (A
In CD
+ x
0 C- .CJ 0
C)~0 0 C/U-) L 0
(W) Hiz]
.4., 37
e 0 r e e p d, -ei(N ".r
LO)
C-
d ~CD
CD
I-n o
C)CD 0C) C-) Q
CD CD C-) CD C) Ci)
(k-I)) LOCJI
-In
r)
0
Lr
r)r
u <~
Dtcf c - rl)
-F-
(ID o + x
CD CD C
39
%

..,-74
."gradient and a bend, rather than a sharply defined knee, in the curve.
This condition is apparent north of Smith Sound due to the widespread
, occurrence of pack ice, with an associated increase in albedo
4. (Figure 3.8.
The thermohaline characteristics of the two Polar Water inssts (an
% be used to roughly estimate the horizontal extent o" their flow4,
regimes. A plan view of Polar Water distributions rIdicates that inflow
of WGCPW represents the minority fraction of Polar Water in th. NBB-NS
region (Figure 3.9). WGCPW is prevalent along th W.est Coast of
Greenland northward to Cape York, where a bifurcation in flow reates
one filament which extends to Smith Sound and another which projects
0westward into Jones Sound. Northward passage ot WGCPW into Kanie Basin
was not obs,,rved.
ABPW is present from the Lincoln Sea to the southern end )f Kane
Basin, and throughout the central and western portions of Baffin Bav.
The presence of ABPW at stations north of 77°N not only suggests that
Smith Sound is a mixing site for the two Polar Water masses, bit is
indicative of southward passage of ABPW from Nares Strait into northern
Baffin Bay. Inflow of ABPW is restricted to the southernmost portion of
Jones Sound, implying significant mixing there as well Inflow of ABPW
* to the region is greatest in Lancaster Sound, as indicated by the
consistently high knee salinities encountered there A filamntt of
ABPW can be seen in the southweptern corner of Melv' i B Pa\ at Stltiol '
132 and 133, which marks the io at ion of a font I louiould'1v ht-w n.ll '111
extreme northeastern branchi of lIie BAtfi ill '1 1-?t I")" j i d- u i.d I I ()II
Lancaster Sound oiin f Iow Il a o,. -, I i , . . ','u. lii
410
% ' N V . -% % %4P ' .%~~. %.~~~'
-UO
-If)
* C
* C)
5%n
CDC
C C
C)
CD
%z I
SSEA
I%.
z
z
*-4f
I''4
4r'
S 4
z
'e I - N0'.
%4 % %0 h
L
extensive interleaving which would he expected in regions such as thes,.,
where ABPW ind WGCPV coexist, is evident in composite tfmperature
profiles (Figure 3.10).
The presence of subsurface temperature extremes in the Polar Water
laver is associated with the contrasting effects of convective overturn
in winter and insolation in summer. Convective overturi during ice
formation creates a cold, isohaline layer which can project to a depth
of greater than 50 m locally. Lateral infusion of brine produced during
the freezing of shelf waters can increase the vertical extent of this
isohaline laver to over 100 m. Subsequent surface heating and meltwater
mixture produces significant enthalpy increases in the shallow
pwcocline laver only, isolating an underlying cold lens at depths
typicallv between 50 m and 150 m.
South of Smith Sound cold lensE s are sharply defined by strong
temperature gradients. This is typically the case in Melville Bay,
where cold, isohaline water is sanduiched between an overlying layer of
BBSW and an underlying layer of Atlantic Intermediate Water
(Figure 3.11).
The absence of cold lenses north of Smith Sound is indicative of
the inherently persistent ice cover. The associated high albedo
results in steadily decreasing temperatures towards the surface and,
consequently, no subsurface cold lenses are apparent north of
Station 72, located at approximately 79.2 0 N (Figure 3.12).
Southward decreases in ice concentration result in the formation of
diffuse cold lenses in northern Smith Sound. A T S t ransect taken at
the souithern entrance to Line Ba ,I' I. vll. in' , of I suhskllf ,.c(,
43
V0 A, %II

In CN
= i -I
LIn
-'ZI
LLJ 4
0 0cp 0'
CD CD CD CD C)C
a CD
-N r--) L
(W) HIJ10
4-
I'I
(I 00K0 In
-7 0 0
E
ft I
1 0 -z
-0
u
0 z ag
0 0 0 0
CY O
(W) H.Ld30
45
A II v
IN' per o.1 %~~9% P?~*~

(D 0
q ZL
I~ %0
N% % -
,,
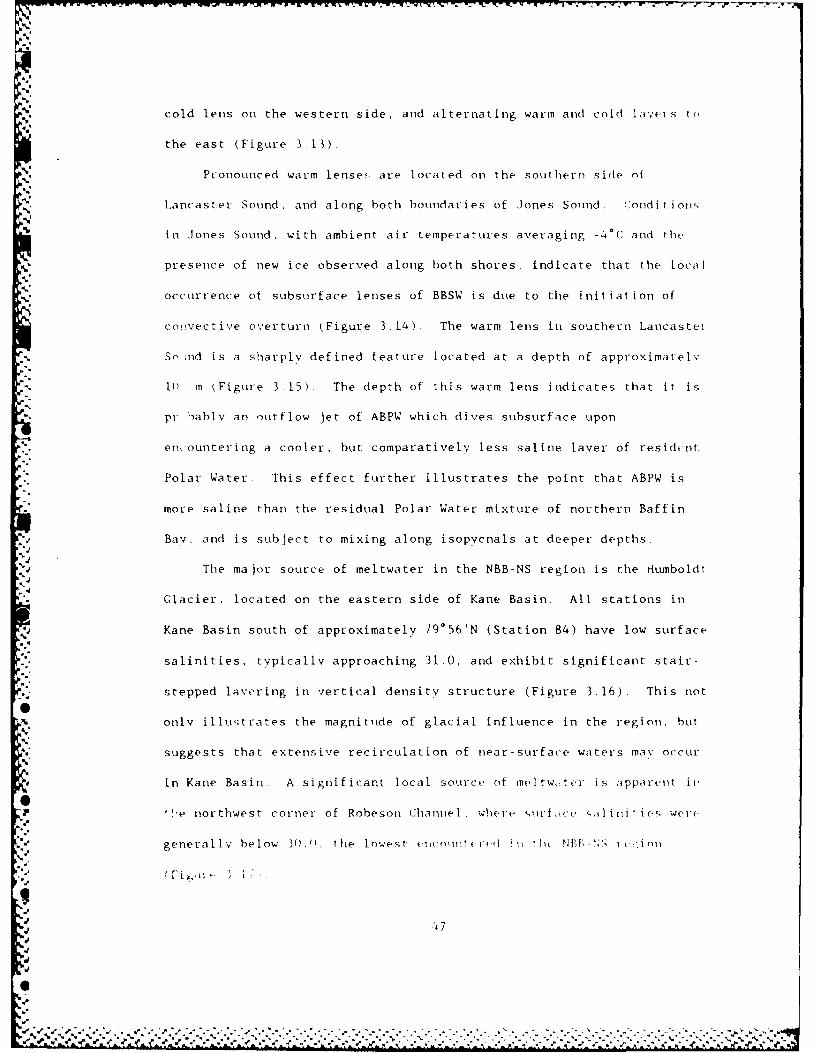
cold lens on the western side, and alternating warm and cold lavers t(,
the east (Figure 3.13).
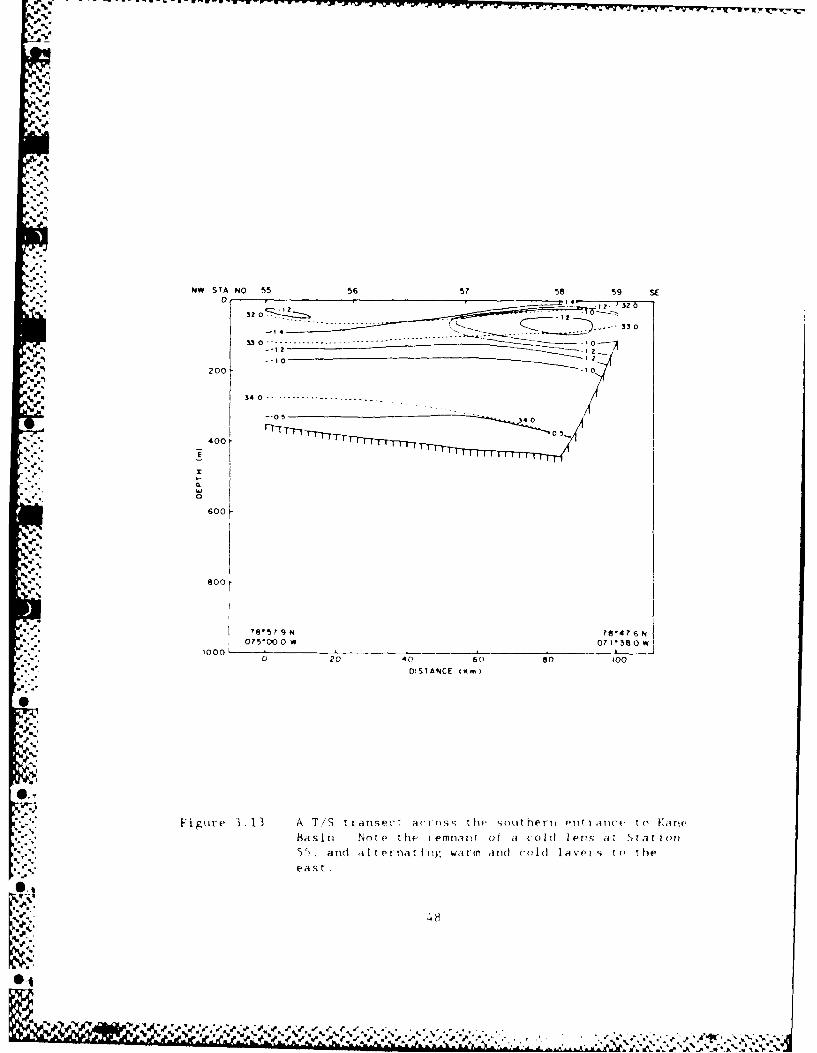
Pronounced warm lensec are located on the southern side of
Lancaster Sound, and along both boundaries of Jones Sound. Conditioils
in Jones Sound, with ambient air temperatures averaging -4 0 C and the
presence of new ice observed along both shores, indicate that the local
occurrence of subsurface lenses of BBSW is due to the initiation of
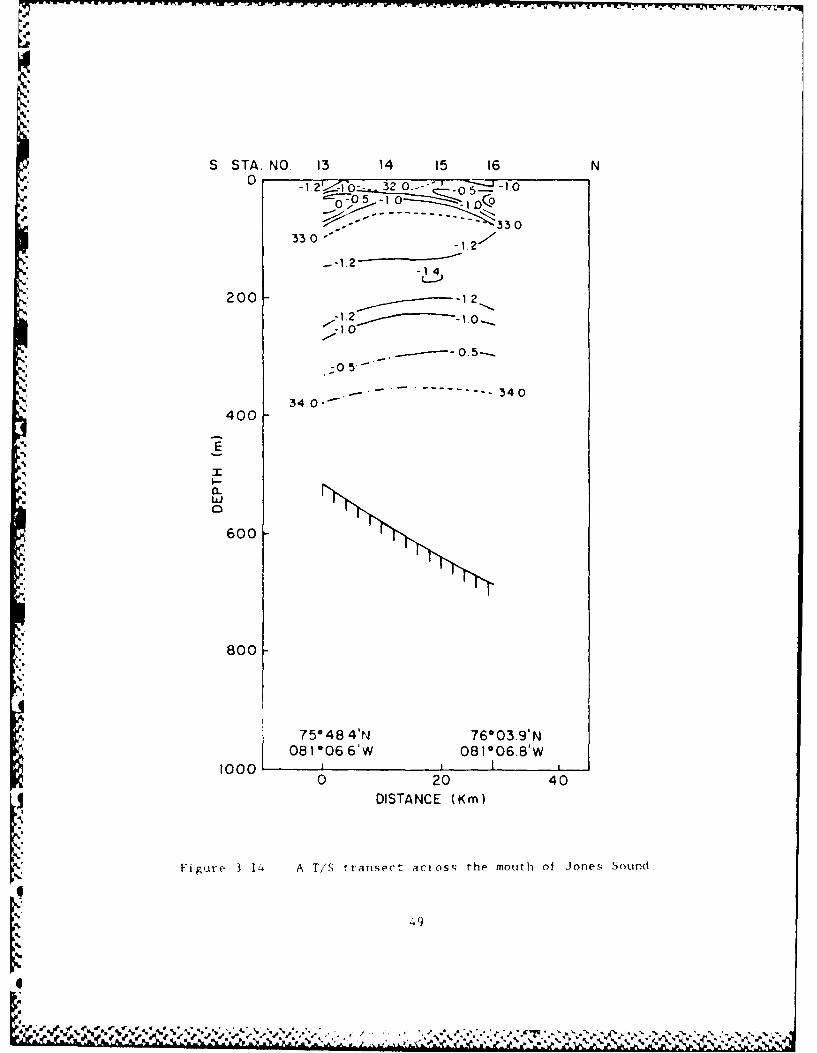
convective overturn (Figure 3.14). The warm lens in southern Lancastei
-. So ind is a sharply defined feature located at a depth of approximatelv
Is 1) m (Figure 3 15) The depth of this warm lens indicates that it is
pr bablv an outflow jet of ABPW which dives subsurface upon
S.encountering a cooler, but comparatively less saline layer of resident
Polar Water. This effect further illustrates the point that ABPW is
more saline than the residual Polar Water mixture of northern Baffin
Bay, and is subject to mixing along isopvcnals at deeper depths.
The major source of meltwater in the NBB-NS region is the tumboldt
Glacier, located on the eastern side of Kane Basin. All stations in
Kane Basin south of approximately 79*56'N (Station 84) have low surface
salinities, typically approaching 31.0, and exhibit significant stair-
stepped layering in vertical density structure (Figure 3.16). This not
only illustrates the magnitude of glacial influence in the region, butC.
suggests that extensive recirculation of near-surface waters may occura.
in Kane Basin. A significant local source of meltw,,ter is apparent ill
f',e northwest corner of Robeson Channel. where su rf' al ii: ie wer(1
generally below 30() . the lowest e'olltef -d il lit NB NS re'jon
1%
% ,a '.- - " - -" . .- -.-.-... .. -. . . .. - ......... ..
m- - 0 Ommo -
'4'
'%
.5 ": NW STA NO 55 56 57 58 59 SE-1 1 2 r -I~ - . .1... 7_.$ 32
3 '2
-I~- 4 -50.
3 30 ----------------- - 10
200 -0
340..........................-
-'"-' 600 .
440
_.
7s-57 i .N T,-? . 6 N
0 0 ?50 1000 040 61) s0 100
-. DISTANCE I1,l
F i goe3 13i A T/ S t ianse ct a(rs t lip sooit herTo ell t' I ATI t 0 Kcano
Ba s i Not e th t emn.n of c Id I( lers ,a S t at i ona nd ;lt ernart iig warm and cold lavei t to t he
east,
0wi
S STA. NO. 13 14 15 16 N
0 -1 320 0 -1o'-05 0~
330
-14
200 1-..2
-1.0
0.- 55
34.0 - - 340"' ~3 4 .0 " "
400
E
a-
600
800
750484'N 7603.9'N081006.6'W 0810 06.8'W
1000 1 , 1 ,0 20 40
DISTANCE (Kin)
Figure 3, 14 A T/S transect across the mouth of Jones Sound,
49
.,,*%
5 STA. NO 1 2 3 4 5 6 7 8 N
0 . 32 Or
033.0
33,040-34;,2). \.",2
50' 200 -- 1 4-1 4 01
8000
-- -
400 .3472N 42
34 20 40 60
Soun
.00
r-o lr
',',73"47 2'N 74*23 5'Nl
o"
1108? '36 5'W 08 1 "39 2'1
,.0 20 40 60
,,,Fipurv 3. 15 A TIS transect across the mouth of Lanlcaster
SSound,
%4, 5 .5 , , i *. ~a , .%'.\l~,_,' ,l ,. .,-. - * .--. . . . ...-.. .,. . ....... ..- . .*..5%*
'7 -
- -- - -- -
CD
*~ C-9
cn
n
Lfl
CDC)C C 'J
In U-
HIJIO
%N .5%4.%%-

S STA.NO 105 103 99 N0 - 1 -T" . --% 29 0
30,0320 32 0
-~~~~Z 14 . ----- -33 0
34.0 .--- -340
34.2 -:-0-34.4200 34.2 -- 0--------------- 3442
-~3 6. 34 --------------
S34 ~------.
34 6
400E
600r
800
81055 IN 820070ON-. 061028.64 0610265'W
.4.100011 I I
020 40DISTANCE (KMn
Figure 31 ATiiP~efi a n~
"aX

D ATLANTic lITERMEDIATExr VATER
The two At 1 ant c Int ermed iate V at er tt iOns Iotid t ill tilt.
te-i on exihi t j tihtvenitI d itt erent sal j tv 'iatatel 1d i
-\ ,t'Cluisve ittrizolttil (list L ibt ioits. Nbates Strtait At lati Iv lt itimdi itt
lae NSAIV") is derived from tile Atlantic Laver of tip Aict jt Sai i
Anid flows southward f rom the Linc:oln Sea ittto bares. Strai t . W e -
te~enil and *ttrr& nt At lanttic Initertmediat e Water WI&XAIW) f lows norrt iwrd
Il ltr'lh taS tertI Davis Strait. advected hv thle Wtinto ttot itetit Bat f itt
W~AWis warm., r butt less saline than NSAIIL Following, the same,
I i nte of reasoning which requires subdivision of the Polar Water
ILAC i Onls . WCIissuibjec t to more signif icant d i lut ion ef fOc ts by-
site 14f and surf ace -dr iven processes cotmpared to direct inf low f ron thle
vrc I-i B as i iti. Since CTD cast depthis were tiot deep enough to reach thle
hottotn. of the W;GCA 1W 1laver. the upper limit itt saIi nit v pre setnted inl
Tabhle I for thi s wat-r mass should be considered ;an estimate . The
* ttaxlmttm sal iitv encountered in WG;CAIW was 34.44, at a depth of 5)62 in
Sta i tti2 wlterea s a maximumn salinitv of 35.24 was recorded for
';SAIl at a depth of 481 in (stat ion 07). The comparativelv lower
cine rt oesin NSA IL are a ref lec tion of the general nort-h -southi
eitpi~ tregra'tient in the regiott. The highest Atlantic Laver
- - cMPf'iatireP recorded in NSAIV was ().2()0(;at a depth ot /1') in
o I. it ruonttas t Witt) a ma:-imiitn t itp. t t i( of I 1 0 ,- itlcd
of04 l S~to ht
TSF o ,o ti is i m n fi, 'I
or , o .0
'p%
A-0.
L NOCOL. M
I A"
%A
G It
*5.. -. ,' ",
*~ S -J
" ." - & . - , 0" t =
, ° . - . -
.,.-S.. -, ,,.
i.
%,#FP -'
* '- ~SAY
'554
-~~ %~i.

Southward passage of NSA W inlt o Kanie Basi ii is prevent ed h%- soliiijp of
the sea flIoor- in sou(thlerni Kentnedv "I ianine I ( Fiture-( 3. P Al t liotli t ic
major port in) of WtIGAT1W flow is ttirniedl(concl to the su'itthwt-st Iv:
thle coast 1 iiies of Melvi Ile Bay- and Ccape York ,northward tranMspor t of t Ink
remainder is; abrupt l\ terminated bv a shal low hoink (2Mu) in) located( inl
th e v ic in i t v o f th1)e Ca r e I sIandcts . Northward i low of VGCAILV could
continue to fol low a deep nariow ch inod around this: h. k (Figtire
but was not observed to do so . Once t urned t o he s,,outhlwes,;t th t ll fIow
of V GCAI1W throughout nor thern Baff in BaY is not rest i-i c ted hr
ba thvmetry, it should be noted tha- even with tile livpothe-t i cal
occurrence of westward f low from Ca:,e York. penetration int o Jones Sound
by WGCAIW would be impossible becau -;e of shall ow banks locaited easit (,f
thle mouth. Thle flow into Lancas ter Sound, however, is not si mi lariv
restricted. P is apparent that southeastern Lancaster Sound is a site
of significant interleaving of dissimilar water masses , as the
associated T/S cross section reveals the presence of BBSW, ABPW. and
VGCAII4T in profile (refer to Figure IvIt is presum(d that 1ACCATV is
present at stations 7. 8, 9. 10 and I1. although the shillow (:TD casts
at these stations pre-luhdes absolute conf irma tion.
%4
4
'p's
z 0
~ 0000 0"' w U 1) ~ -~ ~C O-N~ W~ * V V
C' r~ , n~, ~ , r
E~'~-4 s-~"'5 a~f ,\ ,~ Cl
~\ \\ \A A - 0* -~
I ~- -
* /v-
*5* A
'.5 z ~- -*V'C -
* -q-. - I I -, q0 * I
I?1-~ if 0
Si.., ~l,I *, -
E'II
- K -
'3* -z
- I- U -
U-
0
* I
-~ r I .~ 0 ~* , V -
'5 -- - C)
"S'5 V - -
V -0
- -a' ~- .~- -
*55* C ~
"S. * V V
r -~4Cs 0
I. - -
'S 'I - c ai ~ -
- rN~
c~ C'-.1 ~ U-
- 0)2'
S. I I -
55~*
C)V
Sp..!
5/555*55
'p
S
~' Q-iK.K* .

0 0
-0 0
0 0
V coC
Hld3

J ITR ' 'T I N
Ai tIL 1 t 1 1 t' l' ; 0 h 1 1 O 1 f I I 11 1 111 (If In- t- i I III II V
i 11. f I LI 11, 111 hc t11 111,1 t j6 ()I C ' In11i i (i t 1 1, 1 6 r'. I I ( I 'I f
I .1oc'1 illL 6.0 ',to.- t 10 d ". nIom d~P i i I,- 6,t -i I 1 , i I ('115 -I 1s t h( I .1 1I,
hi hi q lit liiell-k F; gul- r.4 1- Peeti I v' chi , I oli 11
d i a IIIi is in pl ied ill lhe's n di scussi ow;
B. DYiNAM1I(' 1 )P KRAPH'i
Ali 111 1-m n~~r )! III t t si ' -I ipimnic i)popi-phv oft the NBP-NS
dvvl* 7II Ieiii -v~556'21P ith the
11' t l' t' t -, F6 1. 1 A 11,6,' II' lE c 16i -Ildi~r ol patt (rn
wai I4 I , ti- ti't . hf- I~ ,..i -710 .f . ie Iror ase ill dviainic 110i1211 S
tIl .i l* 1 .11 1 S,,t l1 1( I I '' I id
-~ X I
S.%
z
Lk LIN COLN
'A '
o ,/,4
5 ,/ S
• "',v - "' '" 'IIL --
'Po
,- "---" C '," " -
'V -IL N
-., -. • 4,,- 1"
z\
% ;,
6A - I "
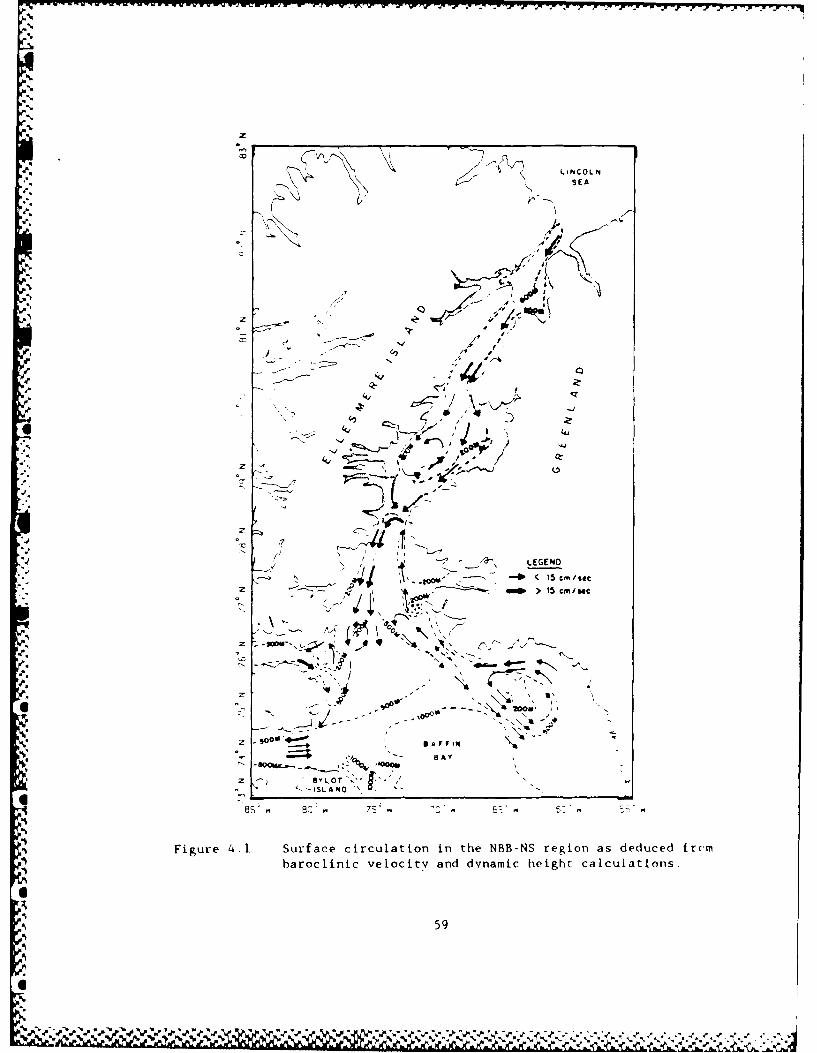
4,. Fiur 4.£ufc iclto nteNBN eina eue r,
baroclinlc velocity an dyai-egt acltos
~ ~ *' - -SAF59
¢. .. .,_..' " -- 2 . '.. '. .. '' .i"
_# .. ''' . ¢ _'.._,..%, . , ' .. _ . ,..,,', , . .,.-- , . .A..Y,

\' sEA
"I
* ' zs
323
A'.j
%-
-)N 1~' a FF N~ . '
O-v LO- -,-AP--
ir ac c-iimi it*porrC'hA -e e e to 2o00
Figure O2AThe
de iah In ina i ce tietr
- -~O .., 'O60
the perilnet er of a shal low b~iiik sget i I possilie tpgipi
inrf Iutenrce .Westward iotilisi ens of suirfaice f low are app;ireiit it the
nor1,therni s ides of t ; e enlt ranI c ks to hothl La I IcAs te vItI d 'esSoeuids
Although net t low V. eastward in beth cases,. the (lIoser paig ot
Contours inl Lancast, r Souind i s associ ated wi th much gre(at er barer II ni
velo 1(-c iti ES A Signl fi;C a )t 1port io oil0f thte ABP Nou tflIow f loinA Jole'; S0111id
i nt o nor: hern Bz,f fiii Bav is , r ned anit icv'c Ilical I Iv arounII d t h e solnt beaI
shor e of Devon I sland A, augment ing thte we s tvar1d i n truks ion of f low i n t
I antca s t er S ound.
Thle sharvp be nd i ng o f c onltou rs ini Sm it h S ound ma r ks t he boundar1-y
be tween I wo intersect inrg c ircula tion regi mes . A northward flowing
branch of the (4CC tutrns cvc 1oni rall coinc ident with the forma tion o f
aice-edcre jet at the southern limit of the ice pack. Th ((36 dyni a ic
meter contour is representative of the impingement of the relatively
warm surface cur-rent on the ice pack, with a resultant densi tv gradient
norm il to the ice edge. The deflection of southward flow from Nares
Strai t at the f ront is also apparent. but determination of associated
circuilation pattern; within Kane Basin is not possible at this
reosoIut ionl. Thle meinder ing 0. 28 dvinamlc Me ter conltour in Kane Basin.
howe.ver' is -suggest '.e of tHP potential for gyre- format ion inl this
C THE WESI GREENLAND CURRE'IT
C ircu Ia t ionl of t-he U(4CC in llrth(bIll bsIf f i) o 11) Ba;;lpa to li
kgo'.''r-I Iec h'i' coII s E-I-v; It i o I) of pet t'olt I ''IUl A .~ p I .
Ie n ll~ It .i C II ;I r 0; (,il *. *(. . .j, i;
h~~~~ii~( 1tr p c)
% "A,%%
Ieli qu ires ha rtot I ( t lo I IoS ol i I kI I i h- W -I' I T n l i t I i I ,, t I h
Corijol is parame!te r. I 01 8 H I I lit W'. T (.I dt-p th1 Sill ;t lift Io Ii
'a r i It i o us inI th1)e CoI:i olI s pI 1itf~ Inc i t I f- I'i ,d( tl,1 j. v,
will tenid to paral Ic 1 i sobat hi
Just i f icat ionl ot h( l l -kek-d i 11 . 'i- p i in 11 t 11 '.e 't. Ii.
15l prvO\ided~ hv' a Iiiflllel of Cl'5*i'>it ioll' Al thln'u:h thle di-ioi -f ILI m'
flow ill the WGLC is .- ioselv (orrelaittd wi ithe- _(W Il isohrith.
relt r\'ari~re t o thIIe w e st aniid s o IIt h is n o tefd .t t bre I pr C 1 inr' I I;I I- (II'i IioI .
Int Melvill Ie Bav the flosw is ob':erved l 'n'' Soid beast wariid a ounld ai
s hall Iow hanIIk. A (: ro ssse SO oiP ot ba ro,; ii i re I ot- r 1( 1n h is iare a no)t
onilv inidicat es signii f iIant deep' f low ariound the per iphery- of tll he bank.
bIt COnIIf i tIIns -1he f iI ArnIn al nIIIiatr Ie otf thei II return erret ( F goe
*.The two dlist iict f low regimes onl the ;out hwes t side, of tti-he ank ai e, as
s ta It ed inI ChIiap1)t er 3 . o f dli ff e r (-ntI orIi FinIs . FlIo w b)e t w e en S ta It i
an~d 12Q i s a ret-ur'.'ed hiranobl of th tic- irh.C 1i I+b assli, ni Ili conie(r'.; ionl o f
velat ive .,ovt icit v . probably; formis a .(lnnir ilr ao'lnid lhe p r Iilft fIn
o f t hc banI)k . S outhet o1, 10f an I :1 Pa I-ent1 f Iro II ta 1 1) U'.ida'I l ,I Iowev e I
e ConId axi s o f f I ow ex i s t s wiIi (:Ii hai is 1)e -I, shIIownl to pr ) in II( pal lx lit a i 1
% ~~~~Shoa Iing of thle ot toil in 1te vi' Ili Iv of t he Car,-v Isl and I- ra Isesf
'om plet-p reF ,Irra t 11'e of d I The, hl-ar I i n)ir oeloi -, ri etin
f iu lonies Sounid sep t wa rd o hu I I e I f I -;hat') 'o , of h le ~i
f1 ori11in ha;st bee rtof I oll li "'(~i-.0I ' I
,I AT I in has he f-i s , if i i- r' h ,.
%0
%0N

z Nz
-iit
/n 0 --
'r q
%.
%
-
.
0_
-
- - --
.
N
-4
,-----
- "° -
-
,-.,
-
o--
z,. -
.r
", \
.
C
.-
,
, ,
- ---
0O
-- 0
%P
. 4 N
Ott
'-.0 0' % '
at 375 m, indic ate s that southward flIow fo(r thi s stat ion 1,i ii i ;I i
to the upper 55 in of the water column. Norit hwaid f low bel weemo
Stations 22 and 23, calculated with a levtl oIf nio n1ot ion it 4M) III
decreased from Q-. 12 m7 s at the surface to less than U).1)i fit ' 'I' rie1 Bkpl
of 1 15 in. The implication of this resul t is, that most ioi- i , I1 -. f
the Wc;C is corn mned to the surf ace and near -surf ac, 1 ai :-e r- s B I ', I ()~i
Cur rents are p-esumed to domin; te below this level he lie, he( l
postulated inf luence of topograiphic steering on the I
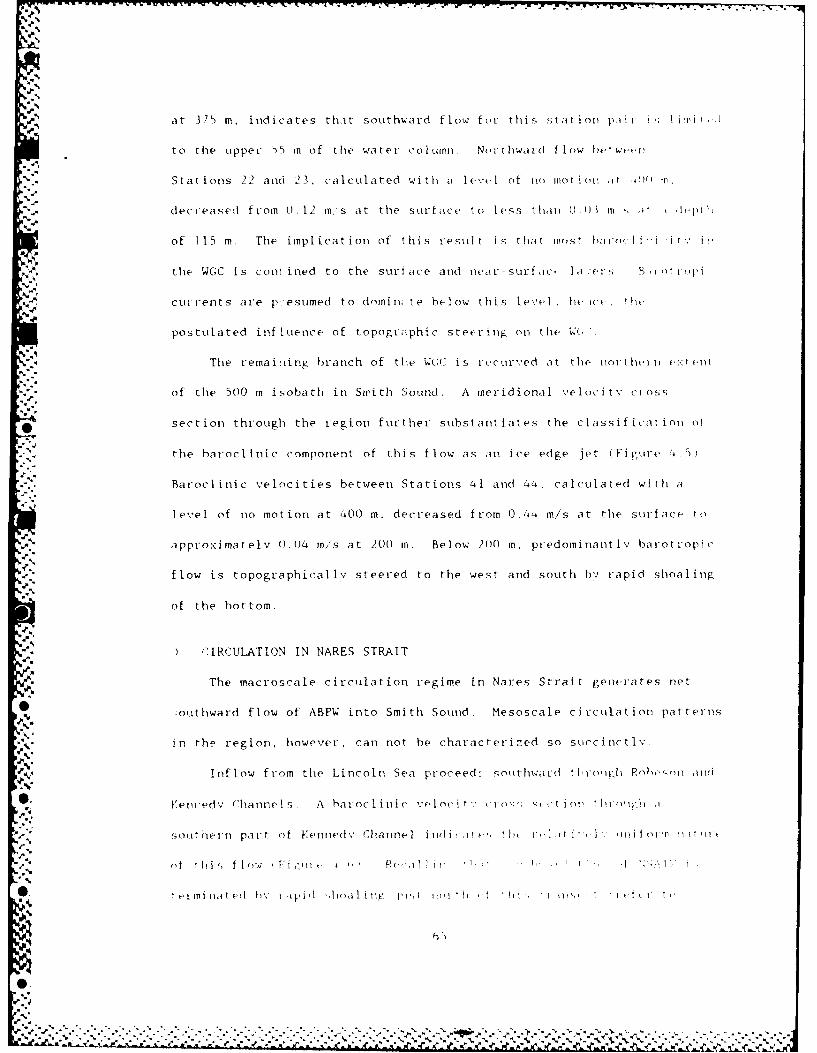
The rema id ng branch of time V(UC is 1ccurv.ed at the nor-thern (xI n
of the 500 in isobath in Smith Sound. A meridional velocity cross".
*sec t i on through the regi on f ur t hier subs tant i at es the clIa ss i f i c-a t i on ol
the harocI Inic component of th is flIow as an i ce edge jet (Fip,'.ire 45
Baroclinic veloci ties between Stat ions 4 1 and 44a, ca lcula ted wi thI a
level of no motion at 400 mn. decreased from 0.44 in/s at the surface to
approxima telv 0.04 in/s at 200 in. Be low 200 In. predomninant lv barot ropi r
flow is topographically steered to the west and south by rapid shoaling
of the bottom.
. IRCULATION IN NARES STRAIT
The macroscale circulation regime in Nares Strait generates net
'outhward flow of ABFWI into Smith Sound. Mesoscale circulation patternis
in the region, however, can not, be characterized so surmcinctlv..
I nf low from the Lincoln Sea proceed, souithwardl ti roIiliRb Pns'on a 1101
Keniedv; ChannelIs A bar-oclIinic veln(j% ori: rs , -t iou imil
sour hie It pa I. o f KEiiE( Clianne 1 iiidic itf- !hk Ia 1, j .i t I it li t I t)f l '1
P ermni [hi I ed ' I p (I -101 f 1 1 I I ow Fi 0-4 I I Pt ]11
.4.i a t d 1 % I I i I t ' o
aZ . -V- -
.4r.
- - - - - - - -
Q S..
:5
CC
&r7- Q,'IL
.4 . - -3t
A11
* Ix
let

W, STANO. 88 87 86 E0
\ \ -20 \
* 10 -
200
80025.6 N 80*2 f.rN068 056.04W 067r36.d
*0 20 40
DISTANCE (KM)
h A hat-ocli iic %'E1oci tV cro(Si; SP&Ctiol thlo ll -I
S Cu the rn par t of tKe tmed,. (hamt
067
% *.0 . . , , .. -.- .. .,; - . - , . - -1. 0
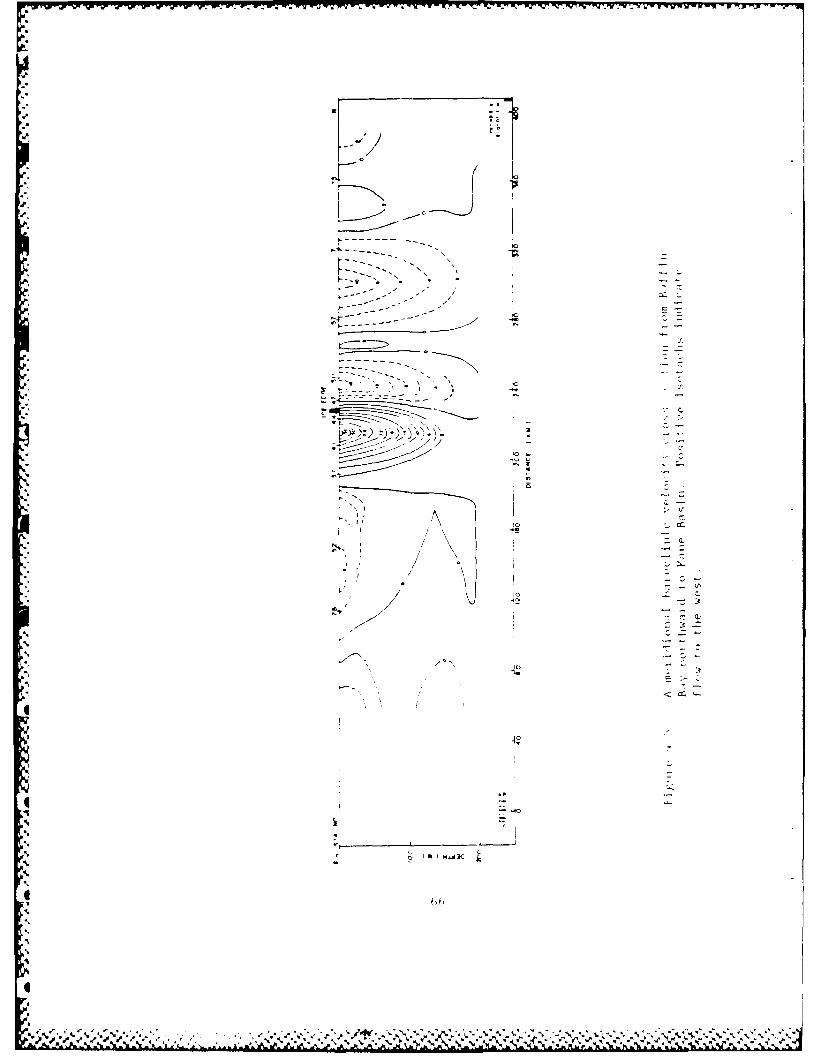
F igur e 1. i t is probable that the relti ivelv high ckurrent spis in
this area are as socia ted w it h 'ous t r ictIi ni of flIow . Fur the rmore
shoaling is more extreme on the eastern side of the channel result ingi iii
correspond ingly higher speeds InI contrast .the high barocl inc ciiirc!
s;peedi in Robe son Cha one I is pr ohci 1v dute t o t he i ifl uI ice )f t he
previOuislIy desc r ibed l ocal Iconcent ratIil of mel t Walt erl
Circulation in Katie Basin is charact cci :-ed b"- sout Iiw'iid fI low inl two
peripheral branlches uronlo a centrcal ('(l01cFtVC .1ccea ioll
along the eastern side of Kanle Basin is topographically st-eeved
southward a long the inherent ly shallow seabed . Augmented bv runioffI from
the Humboldt Glac ier. this eastern branch coot inues southwestward 1and
dmerges with recurved 14CC waiter in Smith Sound. The flow of the western
branch is also bathvmetrica ill itfluenced. A portion ol this brall h
turnis cyclonicallY a long tlie 2100 in isobath forming a gvre, while the
remainder coot inues southward, merging with bo(-th the wes tern b~ranchi and
the recurved WGC . The southern port ion of tHie gvre is qite apparent il
a baroclini- velocity cross section through FVane Basin (Figu-re 4.'
Inl contrast to its eff',ct onl the W(;(-. topographic steering does niot
atppeart to play as strcong a role in Kaine Ba sit . This imipl ies that
p. circulationl within Kane Basin has a signif icant baroclinic Component of
f low, This presumpt ion is most apparent betiweeni Stat ions 74 aind 1'0 at
the nor thern edge of the gvie . Baroc I ic veloncities between thesec
stations rever,;e from southwaird it- th1( Z"fiC r!hid t in
depth. This vf rt-ical sheair in >l'it i-, i- jidi i ti tI '' I
nsaIlitv, whIic h IT)igh t solo I.. I, .l ''!I ioh
A:A

*11*
w ow
%. Ix
..% z :5-5.5--
'N..' N
E. THE BAFFIN CURRENT
The Bat f ill Current ortijnat e ill Sin i t I S mlid wiltn f, '(It!hi
% ~~floi frvoi Nayrec Stuai t mnerges witt vcrmveI VeV ! .Ir Dl )i 1"i~
pro 'yression southward, the Bat' inr Current is yite h; ow I I o
f roi! Jones and Lancast er Sound anird b"y V411 war i whi his . 1
sou hi of Sini th Sound.
As a tvpi il westc-rni hcoiyn: v moml-itn the Bai fiil I 11ilet cill hi
cons idered h1i gh I , ha vocIi n i A) h o cI oin c -mIc, p o f t
S ta t i ontis 2 8 ant d 2~ a ssu ing a I ev e I o f 110 o ot ion i it 0 'in . i of ( i c is
surface f low of 0. 19 in.,sec steadi Iv decreasingi t o (( m .o i in
Lini ke the W4CC, signif icant barlIinic it V it! the Baf-f in) Cu1(Iiet 4 riot
con! 1 ned to the upper 100 M,
Interact ion between the Coriol is force and hathvmet-r ". Provi des tllh
prim arv s~teering influence for the Baff in m:urreilt .Tli. oughiouz. he,
cou, se of the cut-rrent, the teldenlcv for- westward mmrit v, 11y the- Cot jol is
-. for e is off set by the preec faI irlhudm At the- nor hr
enti ance to Jones and Lancaster, Sounds, however, the L-eino,.a of this
reC S ' Vi Ct i In I1Per mitS th obs -)) ;erFVed We t Warid iTot -1, rison o)f fi 'I Ow 0 1o' I
be eminphIIas~ i d h Iowe .. e r, thamt r Ie ba o tI ro pi c c omnponIIen of r f I ow ;.ss iil r t
with the [-at f ilo cut.rent is tint iiegji igihlc A i i xainii a t to of t ime
ha roc Ii iti c VEI O tonitx Lus 1s C. im) t omp lot., S o ldt-i Wa5WI (I T! fI, I
p rov,,i de three i.ea (a5rc1-s o f t c)po')ih s7 1i 1, I'l Oi (I I'I'
F i ie -. E f. r fer to F i . Al, i,' !- l.h o, i.K 2
.d1
0.1efd'
eiuei: %JmI.i f'~.
% %

ba t hviet rY Al so appar ent are two cvci off c v,,vres otle ar (Hind Cohi 1 'i.
Island, and the other Ini tile viciitv of aI IMY in hank,
a ~~Eastward outf low from thle souih Side ot onles Soilnd osaierl
merges with thle main core of thet Bat fil Curre-nt alongli the coasi-t o)f [
IslIand. III con1trast to tile na'rrow f i V-nt ent eriny, foles Soliud tht-
* major bran,-h of thle Baffin (Crrent forms the westward itit rusion oft fl1,W
into Lanicaster Sound.
F. CIRCULATION IN THE SOUNDS
1. Introduction
Smith. Jones anid Lancastecr Sounds ace all cou sidered regions of
0net volume inflow to northern Baffin Bay. Ani examination of thle
circulation characteristics associated with each sound will provide a
basis for their comparisoni.
W~ithin Smith Sound e: ists a frontal boundary separating
southward Iflowing ABPV and re( urved WGC water . C i rcuIa t i ol ill th is
region, therefore, is determnived primaril v b barocliInic influences. A
baroclinic velocitY cross section through Smith Souind reveals a weak
core between Stations 41 and 4' whitch Is actual ly the remaining branch
* ~of the northiwa rd flowing WGC ( Fi gore 4,8 ) . Compl ete recurva tture of this
branch occur-s just north of Station 141. Sou~thward flow betweenl St at ions
142 and~ 4~ 3 is; a f ilament of ARPV~ f rom thet is1,t raulinit of ci Inui o ill
* ~~~Kane Basin. The interact ion hetveen 4 i...... PB. Ind ctIv't-
flIowingip ABPW is-, marked by t he puesn' i li-t ini I 1 iit
lt. i mp i tig-eu n t t of :, c m RRYS' o I ' 11.
9 fr'ii~~~~l I~ eunt willj cli I ()(-I I I cI n t -, I. I p i' i
Il%

4.r
1 0
0 0f
ad3
.3O

- baroc 1.i ni c influence on flow di retct ion. The resultant format io t II
ice edge jet between Stations 40 and 41 marks the origin of the Ball it
Current. Augmentation of the Baff in Current by ABPW occurs beneath t hI
shillow pvcnocline, which is associated with relatively warm, btovni'alt
BBW from the WGC (refer to Figure 3.4).
Significant batt vmetric influence in Smith Sound is limit(d to
po;itioning of the frontal boundary between the two circulation regimes.
Al.hough topographic steering along the 500 m isobath clearly inf lenCes
re urvature of the WGC. baroclinic effects are responsible for the
fo:-mation of the Baffin Current. Smith Sound, therefore, is the site
where a significantlY barotropic circulation regime is transformed into0
a predominantly baroclinic one.
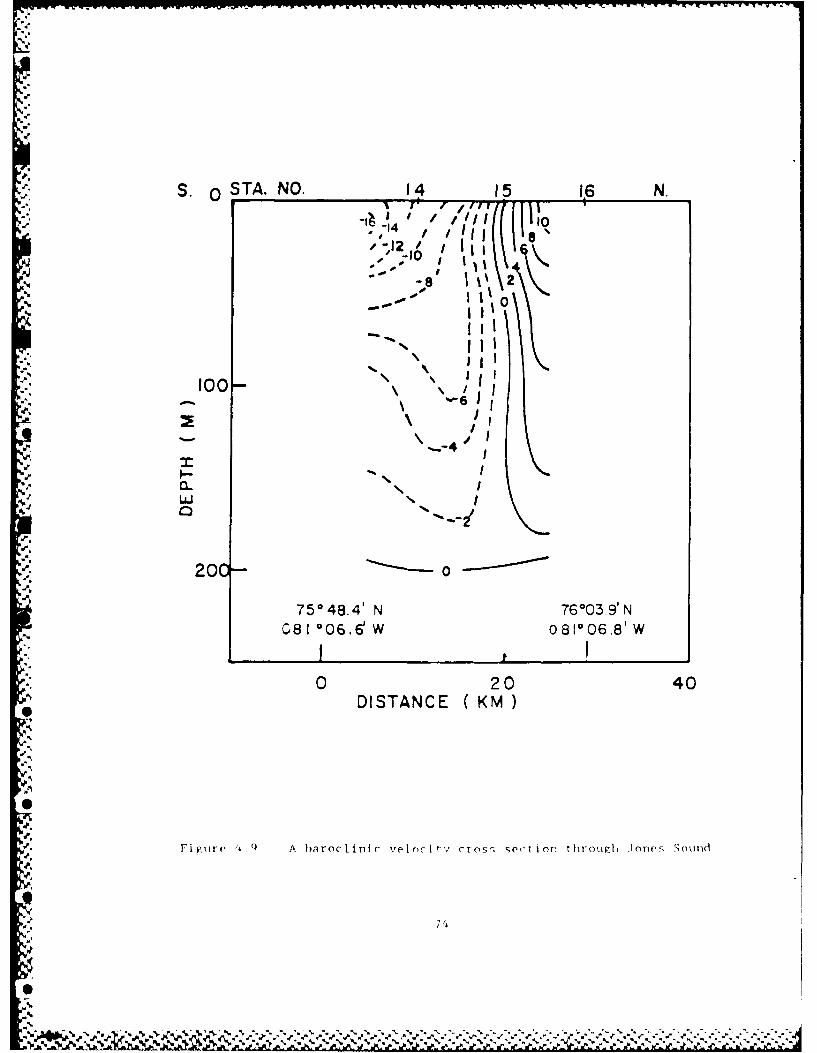
Ni 3. Jones Sound
The combined influence of bathvmetrv and the Coriolis force on
the circulation structure of Jones Sound is most apparent in a cross
section of baroclinic velocities (Figure 4.9). A filament of the Baffin
Current is deflected westward by the Coriolis force around the
% southeast corner of Ellesmere Island and into Jones Sound north of
Station 15. Eastward outflow of ABPW is restricted to the south of
Station 15, continuing along the east coast of Devon Island. The
presence of a cyclonic gvre around Coburg Island (refer to Figure 4.1)
links the flow paths accordingly.
'..hi I e eastward outflow from .Jones Sound te nds t f oII o% t l
500 in i soha th, the westward intrusion i; d r i'.'.n ii ' t he -rio Ii foI r-
. over1 a 200 m batik, aga i n pr. ,va i ivr, '-o,,v tr,r 1 1i(1-,. I i ' . 11 11,li~i
73
I-WIi
-4. S. o STA. NO. 14 15 N.
" " I1 III-14 11,10
J - K a N
". i l'
... III.4 ,Ilj
•1 / \ I
it
I00"
'. "I I',,. n . I
La Il N I
00'.
200o75048.4' N 76003.9'N
081006.d W 081 06.8'W
0 20 40DISTANCE ( KM )
I..,
4',
Figiire ' A baroclinic velocitv cross, section throuvrlg I!nes Sowd(t
-, 74
*4%.

velocity cross sect ion illustrates the relat ivelv shal low 1at ul of thi'
westward intrusion of flow.
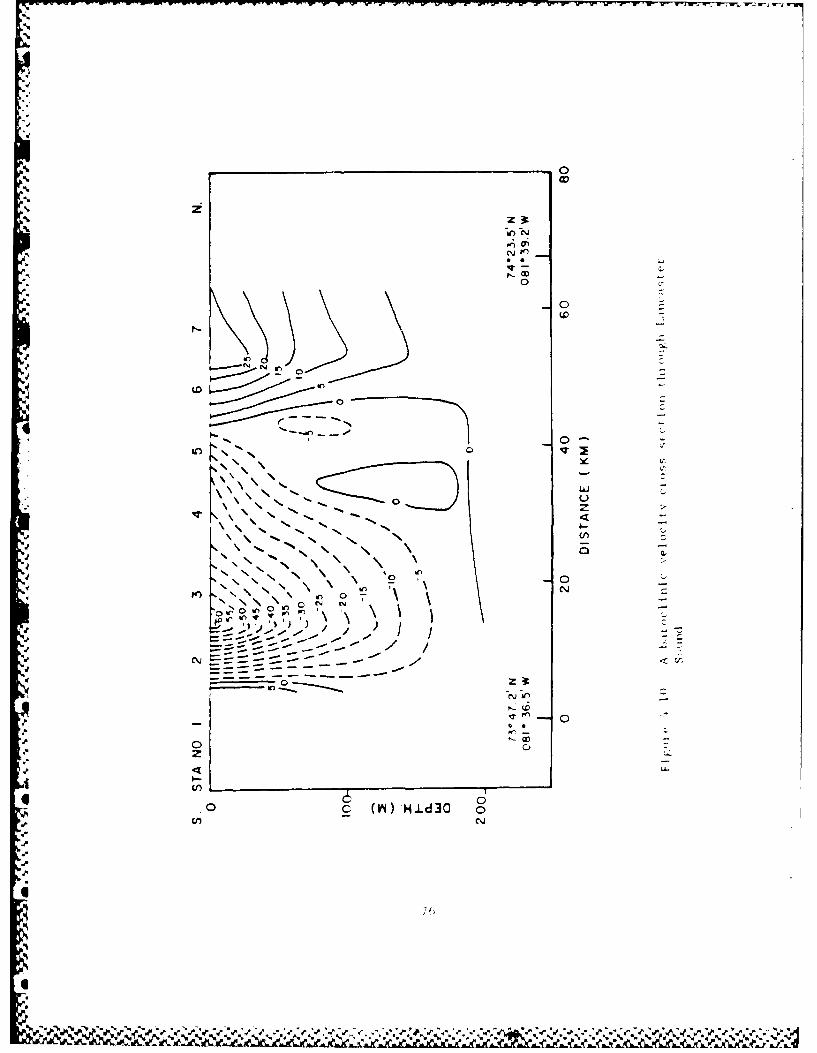
4. Lancaster Sound
Circulation in Lancaster Sound i, characterized by i we twar(
intrusion of flow betwcen Stations f and ,nd an eastward ret uLti
current of greater maguitude between Sr ot ,. I and 6 (Fig r. ,i P))
The increase in velocities towards the sides of the sound indicates th,
effect of the Coriolis force on the inflov. ,nd outflow branclhes
Baroclinic velocities in the outflow branch are the highest in the
entire NBB-NS region, reachIng a maximum of (t. 78 r/set at the surf ace
between Stations 2 and 3 (assuming a level of no motion at 340 m).O
5. Geostrophic Estuarine Circulation
Although their thermohaline and bathvmetric features are
inherently differeidt, the general characteristics of circulation in
Smith. Jones and Lancaster Sounds are remarkably similar. In each case,
geostrophicallv ba anced inflow is entrained, in estuarine fashion, by
geostrophicallv ba'anced outflow. A quasi-vertical frontal feature
initially separate,; the two current regimes, the slope of which is
.r.- determined by their respective velocity structures (refer, for example,
to Figure 4.10). The dvnamic aspe ts of the ensuing model, hereinafter
referred to as Geostrophic Estuarine Circulation ((GEC), are derived
* from the work of Leblond ( t1)) Variations in the observed character
of the circulation in each sound c:.n he e'.:plained in telms of how
closel'; local conditions approximat, (-FC
In proposi ng a two l.v \ 'e I ' ' I 1.1 I l ' ' ' '4!' i I
. : (observ.ed ci c a i t!i ',m ] II> I ,* ' , 1 l ,, ,}i l .
K 7A
S.,.°
-z
pe. 0 0
-~o z
hrO
or 0- 0
\\
z \:
-ULn
z
N N
04) H.Ld3

Leblond showed that two geostrophically balianced, upper-layer flows
would coexist without interference in a channel whose width is
sufficiently large compared to the local internal Rossbyv radius of
S deformation. Restriction of flow to the lipper layer creates a sloped
interfacial surface. resulting in a charateristically wedge-shaped
velocity structure (Figure 4.11)
I,..
0. 'U
Figure '4.11 A schematic cross section of coa!.tal upperlayer [low (out ot the page) of speed u,driven by a sea surface slope n(,. ) Thelower laver of densityv p,~ is at lest becausethe interface h(v) slopes in a directionopposite to that of the free surface. Yois the distance from the coast a, which the
thickness of the upper layer vanishes (fromLeblond, 1980, p. 191).
Additionally. Leblond found thait purely geostrophic flow canl turn
corners without sepairating trori a coast it the radius of curvature of
the coast is Large enough that the Rossov number remains well below
tiIt v As a conser-iative estirate of Cie width of a coastal geostroph-c
-~current. Y. is defined as Y,- R/F: where P iS the internal Rossbv
radius of detormat inn and F is the internal Fintkde' numhei If thte wid-
of a channel is shown to exceed .~' 0 tue ireos tlop1i cll." h'i 1ancod
.5 -tippet- laver f Lows cmi theoret ical] Ii f- i th-l, int k f t 1 on cte
N %N.%%-
5.-
'Te esuIt s of apply inrg I blo~nd - p'iat ions t S i tI I o i ii
~ ~Lan-caster Sounds are Iisted ini rahi e I I. wit t 'li Ie riqi ';i
% % c alIcul at ioils pre sen t d ini thle 10perd i > i Itoe tV11 (c mpu t 1Ps-
number Rat the mouths of aL t lit et -lind is Is lin (i I
noni inea r e ff e ct1s ma'; he IlocalIIl; ln.j: ect ed I t sii ti ute I I 1 11,1
values of '1'0 are only% c'llculatd tot 'ht out": low :eYrimes vhlich. it, t'ohI
.r, ~s ountd, we re thle w id e st o f t he, '-o tirr, i I s
COnld i t i otis n i Laica'ls i, S eanrd . 4i t h m1ini lln h I I t- 1 wi d! ht 1
of 80 kmn anrd -a zeo.s t roph i , c uti reti widI t i' o f 2() I V', pnos;t I ls' I'v
a ppro x imiate i EC . Re t't-r r iiF t ( t he ha ioc Ii jut ' eIocjit '; ri- sSf- c t in
~~~thio-gh Lanicaster Sounl~d ( FigUre L4 P i t C lear that Ili t houg The;
c'-lcu111a ted v1-1ti .t 1 'j i s considered an unlderestimationl of the widith of
r.tite outflow 'ur renlt , i tecrfevrerce 1Vt ween the two c ircuala tion cc g i ites
appears n gli ic i hie The ohVi ous wedge -shaped currenlt struicturei i mlpl i e'
that tflow is priimari 1; restricted to the Lipper 15 irn. The bi-oaderini , of
the ouit t I ow wtiF-t ige Load the calculted Value1f Of' howeverPl. ildi cat es
that this r esti jct i it is not complete. Inldeed. tl e: likel ihood ot
sirif an lw ocr'lvril' below in1 ( depth is, c, ntirmed I-)% thc-
- ~~presence (if r -,:- i ''s! t in ac ti on
% F, Tnt caltivilt ') jut low reulsllt yctlnic cross-c Iralrik'] flow
6The rcutter t oi j ot f i tit 1 o-', in tot oI' f I OiW tit 1 t i-it 5 1 1, aiia I[S (-V S--W d hV
1 o) S S- I' ha I P I I o.w a W in II, t iI, 1 ; t i s t i c 1 (-dl vt' F i :cset I e t a I
1') . whi If .ri1A hi I;, o .4 K*' . t' II '; n ' I
maI d h ; ,il
*1~f
0p
~k2W~I %; % r
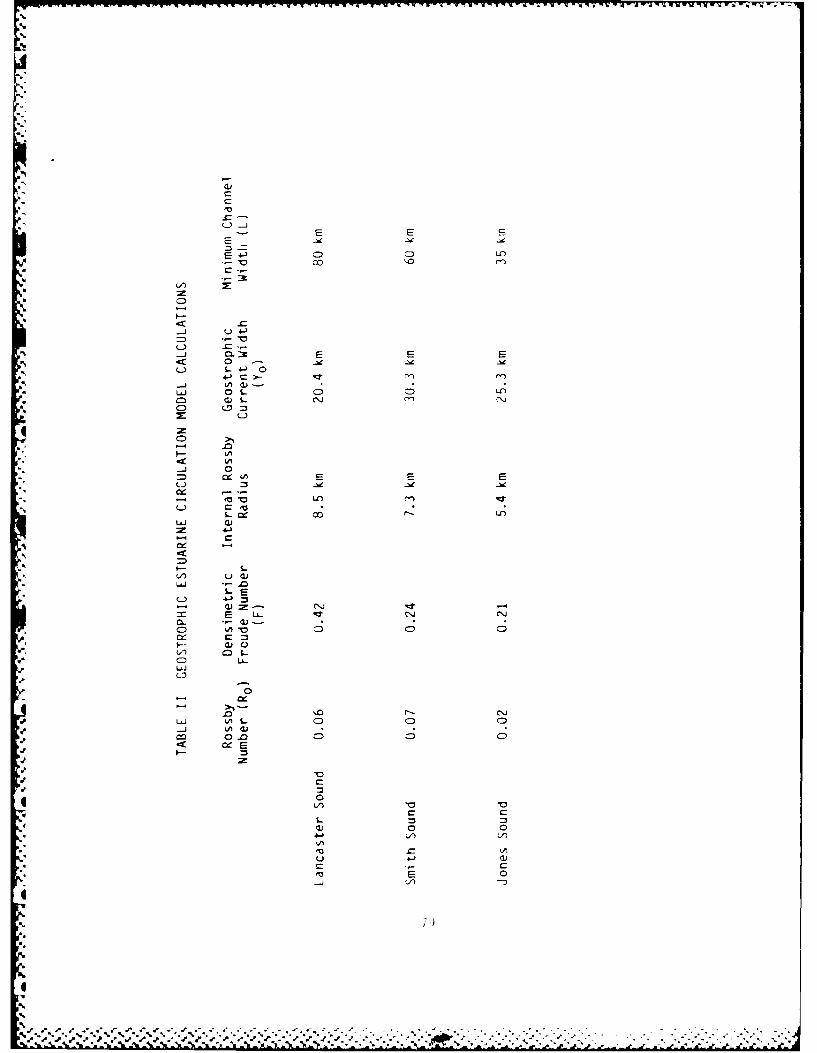
CD
E E
0--l(-4-1
LA (
u 0 L- -L -
L L
L
- 0I-h
to
L- Ce00)rLAJ a)
- C
L'I-
LA (V
03 0-az- CD.
o Q) 0 0
9 0
N.0
P LU AL 0SIl N.. tA7)t
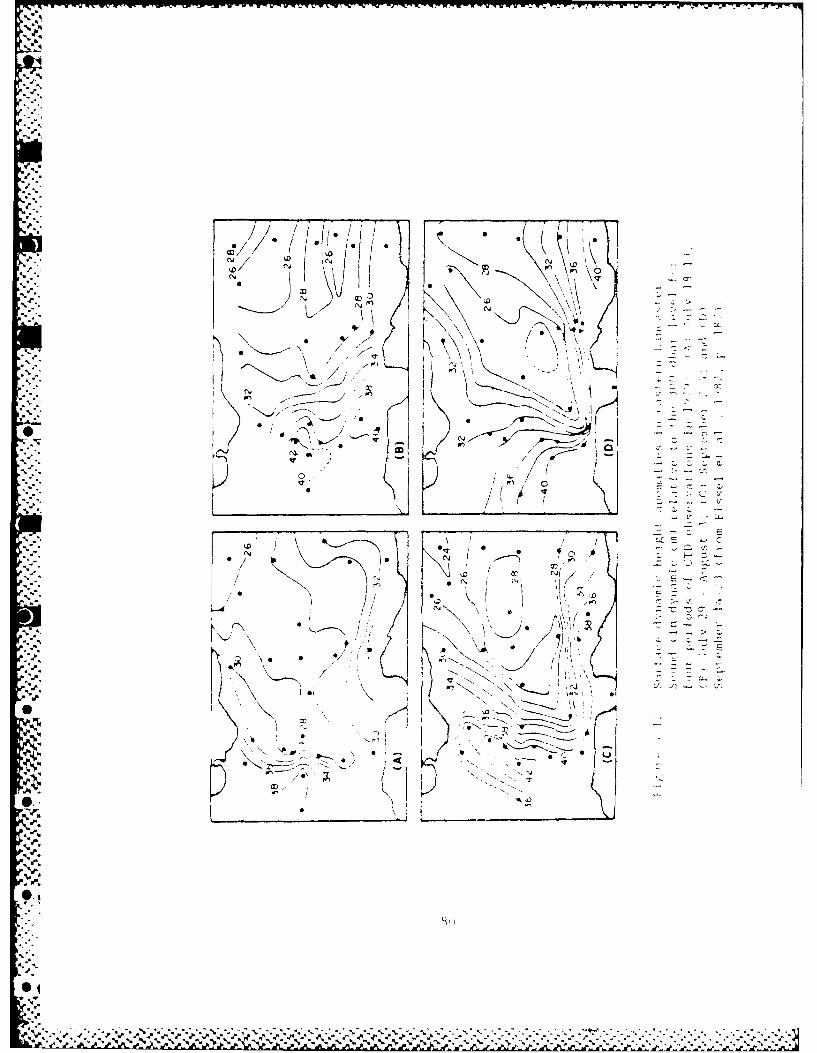
J. -t
COO (./ I0 0\
U/~ *~ '% % (X
Nn j
0
/0 L,
SL
2 - i
cc-vF

- - ~ ~ ~ ~ - --77- - - - -
&.
convergence of inflow ald outf low regimes creat es i local el evt in in
tile sea surface, g, nerat ing izeostrophic f Iow, to1 a to tile tlsu t ant
pressure gradient Wi t h sufficient eastw,,r.d ott f l(,w and the plesetin )f
. lateral boundaries, characteristic Cvc1oti C flow will resil t SiIIet'
convergence implies downwelling a reduct on in vert ical densi t
gradients may ecCUc I Iong this frontal Ife,, t ure, therebv enha nc i ng t Ie
t -nd encv ftor1 ixing.
In Lancaster Sound the eastward ,tt flow branch of the
circulation illustrates the increase in vuIume and velocity tvpicallv
associated with estuarine entrainment. In GEC, however, the entrains, nt
is go+ostrophicallv, not turbulently, driven.
The application of GEC to Smith Sound is influenced by both
geometric constraints and significant horizontal density gradients.
Referring to Table 11, it is apparent that L is approximately equal to
2 <(Y, ). Since this is considered a minimtum requirement, tile potential
for interference between the inflow and o,;tflow reFimes may be
significant. This interference may manifest itself in the form of
baroclinic instability and associated edd- genera-,J.n.
Within Smith Sourid the inflow and outflow regimes are not
appreciably influenced by coastal boundaries. The absence of a
_ characteristically wedge-shaped velocity structure in this region is
probably a cons,- uence of this fact. Geostrophy does influence the
direction of the i:iflow and outftlow branches,. howev+r. resulting in
O. cyclonic cross-channel flow As tatred pr-e'.'iosilv rerurvattore ni tHD
- remaining branch of th,. WGC occu- , t,, V v.. ,1 ul in ,:.ire
horizontal density gi+ lien t ,a i ' iCI . II' I i llilll it ,'t
81
0.:
**.w g C C I .'k%-
• - - . . " ." ." . ."-."". "" , " ,.','..''.'.'. , '. ', ,.,,' + f'..""..". "- ". . . #. ..'a. ;"
." ,%J .''.;N...- 4... \ '. '

i nf l Ow in1 Sm i 1) S olnd WI w i 1 ~ 1), d jl It el o I; '' e,
noone t leses Feos t r oph i ca 1 1 vha I :u)
The 1limit ations in qpplvinF, fW tn lonies SouiJ -,re
considerable. Siuce L - 2Y 1 e Yu i s w id (I ug fF to14
accommodate onilv cne geos, Imnldi -a Iv I I,. !n- crEnIt P-f ('I ri Il to' lti-
3 3.10 i soh a I mne inI F ig ur 1.- phe ni- in of d en .' ani!d. hencef,
however , a c o nipIe t e blo I rlnciI of 'Lr! ,i- 1 1 lvoL( l tcur nt Wee ( hta it ions1
and 15. Since these cuirreu t hi ;nc hvs c'A no(t o:is in. lones Sound. it
may !he possible for- comp! ete it -rol on of the wes tia~ d i ti owj branc hIo
oIC cur a t t ime s ,re sult ing in r:Eeesit .f -,he net ea'wadILow in Jones
Sound . Hi stor:icalI ev.i dence of -hi s Occit. 1-once has *.-I c d byv 'Mench
(1971) (Figure 4.13) In 11-02 , f Or exa mpl. p , f 1 li t i Iu reIy
% ~~~westward , while in 1140" bo th i n low a I d -!, I f~ I awiite nezI i
smlaneousi1v but withl eotl!m;dc a
The inac roscalIe circoulat ion patter-in in the NBS- NS r-egion c an
also be envisioned as conforming to the GFE model V iewed
s impl is ti calIlIv , the i nf lwTi n1 ' wa~er o-;f t 1 e '7(7 ar I:Reo st I oph icaI lv
en L entrained atr varui ous I i t 1 tude s , ; is Eqion(T Iv -e s, IIt, i I t he augmnenitred
' Soutf low whlich charictePrize Z t- he Bat f in Current [lhe pre'dictablv
cycI lniC cI ircul,- at) oni ON-f tP rP a ssoo ta te id w i th GFC is i dent i f i able a s a
mai joi maci-oscal e featur i- he 'gon
G . BAROCINIC lTP.A~P;PRT'
Baro-li nic r~ n It- deic ;I ni' 1- 1;o t
shf)ol Id he I O ed Ii j I i 1-. i
OfvL.e T i- -p ,, 1 i ,ii I V1
'*%
% %?
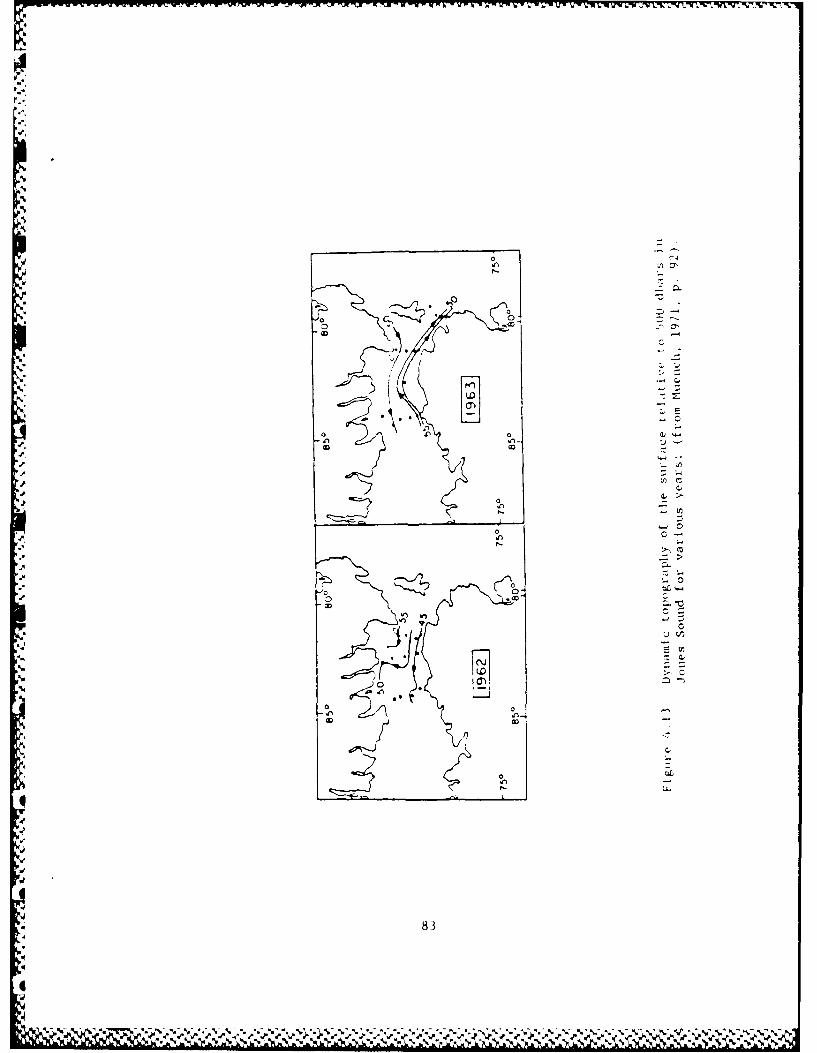
0
o0
go 0 3
83-
L',.
like the WGC, where the bat oclinici tv is known to be weak. Th( mial
purpose of this section, thee orfore, wil b. to qual itat ively compa I tit
baroclinic components of flow for ma joe cu orent s in the NBB-NS r-ej i(o,
Unless otherwise specified, subsequent ref -rences to t ransport a1
summarized in plan view IToi .as:sumed to} be baro 1 IlI t i 1 i 1 i , II
%.. (Figure 4.14).
,-r"'.. The WGC achieves ma Arium tansrort, iil Melville Ba . pri, 1 tO, its
previously described pa" ,emn of rec irvatute in nor thee Ba f i il Bav anId
Smith Sound. Transport of the W;C consequnt 1 v decreases from a
maximum of 0. 7 Sv in Melville Bay, to 0.4 Sv in the vicinity of the
Carey Islands, and 0.2 Sv in Smith Sound. The major portion of
Tbaroclinic transport is concentrated at the extreme inshore st;itions in
Melville Bay. further substantiating the a ,sumption that glacial runoff
is primarily responsible for this component of WGC flow.
The Baffin Current is partially deriv.d from the net southward flo4
of .ares Strait. Southward transport incrases from (.2 Sv in Robeson
Chat nel to 0. 7 Sv at the mouth of Kennedy Channel . This increase may be
atti ibuted to admixture of meltwater runoff. in particular from
Pete rmann's Glacier, located on the eastern shore of Robeson Channel.
Southward transport through Kane Basin is primarily associated with the
* western circulation branch (0.3 Sv), while southward transport in the
eas'ern circulation branch is limited (0.1 Sv. The swirl transport
witihin the Kane Basin (;vre is approxiimitelv () .4 S'. i ilicit i.e of its
Sr effect in recirculating meltwater Iroin the Htunboldt (.1licitc tlhio',bnl out
the basin. The cyclonic ice-edge jet it SImi 'II 5 11. ',i Ii .issori.ited
trarsport of 0.) S''. (all he collsid Io l ' I It 1 1 'i., 1 Sl tlil
o84'I-/
Sj.

%Ti
z
K{ L. INCOLN
SEA
z
z
"2 , o 0 ' ,"* ... ,
7>
.7 1I
° - ' /1 I > 7S
4
-' , ' J,..
z -awe-"
z 7 S ,I N' ,O -.
Figure 4.14 Major baroclinic transports in the NBB-NS
region.
85
V %
3, " "% '% """ "%"*, =""- " . % "- ",% , . " , . , 2 O -O " " , *, - - " - ,,6-

Net sou hwui I i t ' ' UIp1 t.
p lit (I I "e
i c [is, 1~ r 1t ii, t kI . 11t 1!
S~f j id . con v i I 1,r :' 1, l ' I~ '11 w IV I I- k.-
1
I ~~~i ll V 1 ~li 1 E,! , i ' ii' l 1 , 01 k!.r J I . 1 Iii n a I S
enter-, -ones Swhnch i m d, l,. ,s r, , : '' , ," ' J. : '; .. .-0 tIv)
Oitf Iow k). S,, resul t i in F1, , k, I s
s ut ie s t it rd f I ow. Ii a i "' 1) 1 o h flI I . t t 51)1) WO y
. 5,, si o bt ! ,"1 ',) .s. ub s. -t l n ieI, i Tl I t 'i .1') 11 ,~i : ii I/ 1! 0]* 1%t e ! 1-1 1
-The relativel lari t, transport S. id d c i e i sout hwe t r I Ill '
Ba-", ies actually ant alebraic s'ltionot i ton anspo ets obtained between
Stations 12 md 1 12 refk- to Fi 4uAi-t, W' 11a-> wrd I tidflspo. t of
sBaff in Current te 0 , S-.-i prohahl v: co, e d t -oin i a b in (1 '-f
- ~Lancaster Sound o'nit I ow whic c- rorai al 1%, steered eastward along
the 1000 in iso al irMue n - 1 Ii. -; appi l 't southwest of Sti 01il I W
Fl ow of t ;C water ,whicelhais riciuved ei 'l ir around lhe shallIow bank in
M MeIv i e Ba (0l Sv ) o-r och s-f e -io I sIands (:1)t v) ei iv
indic ated between S12 ta io refr 1h and o
-'' The mai ,i core of the Bt t ii 1 1 lit d ivmeit cr-o ; eatward iit f Iw -
f rom lones Sonid f I I now.s thle son' lie 'i f1lir-on i I I lisi or - l I I
into 1a ste r on S l 1 , 5: o , ' ;r itpi. iv st h, Iis -
tugme 0 i o o (-u enf , l5 . 1 , .i < i sions t o ; fti i i
Flo of ItCw tr w ih Ia r.uldemt.ta oud te salo a k
.
Sd.
I.
, or r
% %%

transport in Lancaster Sound, thei efore. is inferred1 to be 1. A Sv
eastward.
% %
% 1 "%-
O5 P
-_ --------- IL 1% IF , ' , - , ,:. . , , + , , . '+ ,. . + +. l .y -i.+ , . ,;. ,
V. ['HE N )RTH WATER PROCESS
The North Water Proc ss is characteri:ed by c,'nplix interact ion
between thermohaline and dvnami - effects. The net result of this
process is the demarcatioit of aoi 80,000 km2 arctic region which is
conspicuously devoid of first yoar ice from the on et of winter until
March (Steffen and Ohmura 1985). Following a bri f examination of some
relevant factors, a quali-ative description of the process wi!l be
presented.
In southern Baffin Bay freezing is generally accompanied bv the
formation of an isothermal isohaliue near-surface layer appro imatelv 75
m to 100 m in depth (Garrison et al., 1976). Sea-ice product ion in the
NBB-NS region is similarly associated with the formation of sich deep
mixed lavers (Muench, 1971). In the weakly stratified waters of Nares
Strait, convective processes are sufficient to form this homogenous
layer. The region south of Smith Sound, however, is characte-ized by
the ubiquitous occurrence of BBSW. The resultant presence of such a
strong pycnocline would ordinarily limit the depth of convective mixing
associated with surface freezing to much less than 75 m. A combination
of turbulent and convective processes must be required, therefore, to
overcome the inherent stability of this buoyant layer and proluce the
observed deep mixed layers.
Given a particular set of climatic conditions, the enthalpv present
in the near-surface laver determines the length of tiine r'eqiired to
initiate surface freezing. Assuming heat flitx on] tlhioch rho, s;urf a.--e
and neglecting thermal advection. it is p,,ssihl. ",l]uitt this tim,
del v as a functioii of he -it bud ;,.-t p I.01 , . ii i'- 'n 4 i'l
88
-C '
4%
w"

(1985) computed monthly and annual heat budgets for the North Water
region and concluded, assuming a reference temperature of -1.80C, thlt
the amount of oceanic heat flux required to prevent ic., formation is
337.4 MJM -2 in October and 445.1 MJM -2 in November, ['he enthalpv
contained in the 75-m deep, near-surface laver was cal-ulated.
referenced to -1.8°C, for all FRANKLIN 86 stations (Fi;ure 5.1). For 22
stations located southward of Smith Sound, between 76' N and 78* N, the
enthalpy in September averaged 475 MJ. Applying the aForementioned heat
budget at the onset of winter .October), implies that surface freezing
would be delayed by approximately five weeks in this region. In
contrast, the average enthalpy contained in the ice-covered, near-
surface layer north of 780 N (Nares Strait) was 120 MJ.
The presence of mechanical ice removal effects such as divergent
currents and winds will cause the rate of sea-ice production to greatly
.1'. exceed the rate of sea ice accumulation for a given area. This
phenomena is graphicielly illustrated in the vicinity of the Kane Basil
Gyre where cyclonic and, hence, divergent circulation results in an aiea
of reduced ice concentration. Ic, concentrations within the gyre werk
typically 3/10 or less, compared with surrounding concentrations of
greater than 5/10. The cyclonic macroscale circulition pattern
characteristic of northern Baffin Bay can be expected to provide a
similar mitigating influence on the accumulation of sea-ice. The
potential influence of persistent northerly winds on the reduction of
sea-ice concentLation in northern Baffin Bay has been disckr sed by
Muench (1971) and Dunbar (1973).
89
% %%
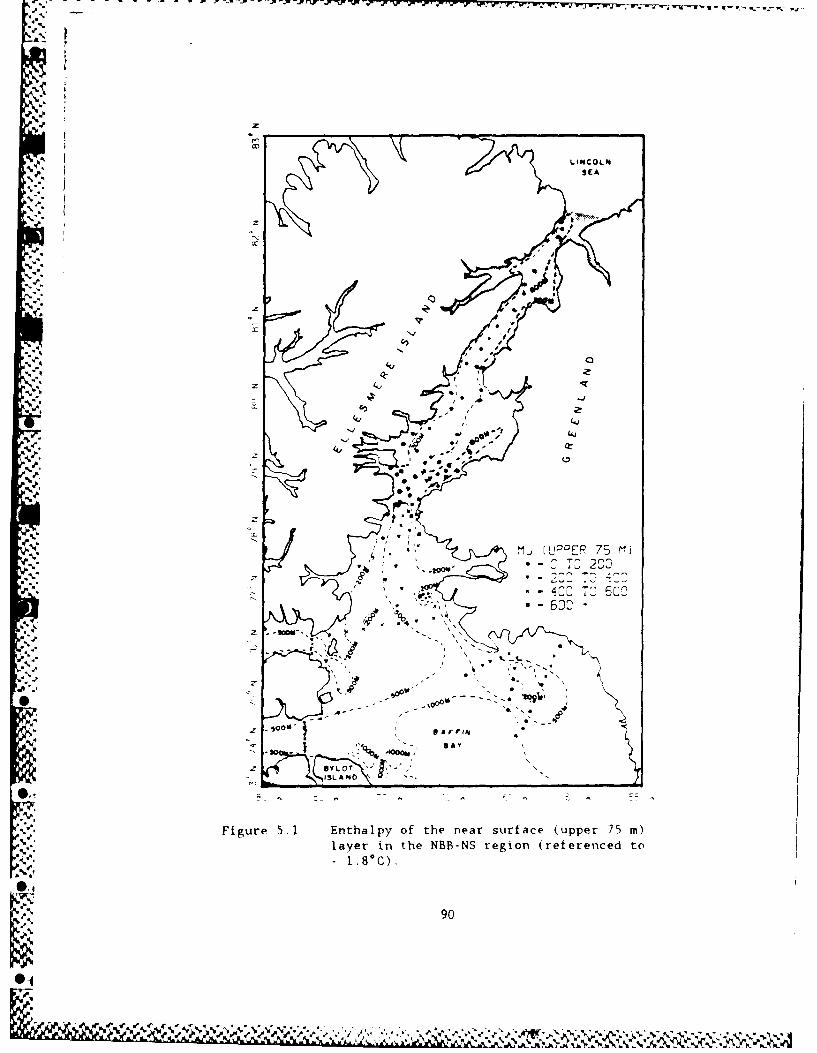
4/z
SEA
COLNCL
-:. ' I T C
'. -- "j ,,--, '
-..
,% 9
0 4j
4v.-
63 -
z t'
'00w
aa A F r I
% iue5 nhly ftena ufc (Lipper75 m)
%lye in th B-N reio (rfrncdt
.4.. ~tOO C - -C
-vu7 090OD
% V N'
4o e
-C -6

The North Water Process re sul ts from the combi ned i tif I oets of
near -surf ace laver tnthal pv and mechanical I ct rem va I. Si ice hti NorIt I
Water is characterized i. redu. ed ice coverage, tht associated de( rti,+;.
in albedo results iii the largesI annuaal net radiation for any region
within the Arctic Circle (Steff,,n and Ohmura, 1 85). Admixture of
glacial runoff creates a strong, shallow pycnocline which effectivelv
confines insolation effects to the near-surface laver. Such iTihe eit
stratification would normally restrict convective overturn associated
-with surface freezing to shallower depths. Mechanical ice removal.
however, results in a proportionally greater rate of brine formation
which increases the vertical extent of mixing. Complete
removal of the enthilpv in this near surface laver delays significant
sea-ice formation accordingly. Divergent cyclonic currents and
northerly winds then serve to reduce sea-ice accumulation for the
remainder of winter. It is the self-perpetuating nature of the North
Water Process which accounts for its persistence.
1 91% %%
?-
The comprehensive nature of this iaiv,.s mandates further
examination of certain relevant topics A Lombination of elaI(,ra ioni
'' . .and postulation will be emplo',ed in this re'.rd
The dilution of WC" water masses, relative t, those whicl tnl'tr tlt-
NBB-NS region through the Canadian Archipelago. is a consequence ,f tt,
more extensive shelf-driven modificationi effects inherent in the
former. The assertion by Muench (1971), that the major ploportion of
Arctic Ocean Water is less dense than Baffin Bay Water, was derived fr im
point data sources, under the assumption that there are significant
differences in watei structures between the ipper 250 m layers of the
Arctic Ocean and Baf fin Bay. Muench further concludes that these watec-
" structure differenc(,s create a proportionally higher surface elevatior
in the Arctic Ocean, resulting in net southward transport.
An examination of the dynamic topography of the NBB-NS region
reveals an obvious lack of north-south dynamic height gradients (refer
to Figure 4.2). This is due to the fact that ABPW and WGCPW have a
common origin in the Arctic Basin, and are quite similar in thermohaline
character, What is apparent, however, is a distinct dynamic height
gradient normal to the coastline. Although the increase in dynamic
heights in the onshore direction can be viewed as a consequence of the
influence of the Coriolis force on the prevailing baroclinic flow. it4-.
may alternately be considered as a dr ivini fni .e f ot the ohserved
circulation in the NBB-NS region
The ubiquitous glaciers in h . 'Kc:f rhn coastal
source of meltwater aim i Il I in I-, ' ff " .t
ib
O.4.

" geostrophicallv-balanced current with the horel i o t he 1ih, i
direction of flow. The implication of this hypothesis is that a
progressive winter weakening in near-surface curret'ts would he expet ,
throughout the NBB-NS region. Lemon and Fissel (182I provided cvideic,
of just such an occurrence in northwestern Baffin Bav..
On a larger scale, the concentration of glacial mt 1twater within
the NBB -NS region results in near - surface layer di Lut ion re lat ive to tI
saltier w-,aters of the North Atlantic. It is the difference in near-
surface ':ater structure between these regions that may drive the net
southward baroclinic transport. A progressive winter decrease in this
net southward transport would be expected accordingly.
493
.4..
t4
**% .. .
.%
1$
-93
-4-. . , : , . ., , . , , , ,,. . .. .. . . - , ,.. .,., - .. .. .

The phys ical1 oceanographN, of the northern Bat f in Bay Nat-e5 St i;
region has been investigated usingr i dense net work of CTD stat ions
occupied by the CCGS SIR JOHN FRANKI.IN inl September 1986. The tol lowi g
major conclusions can he drawn:
Five water masses can he dtviInea ted in the re ion. The VCis th
source of 4GCPW4 and WGCAB;. whi le ABMk and NSAI.4 are deriv.ed f row
the Arctic Basin via the Canadian Aichipelago. WCC(-AIW and NSAlt;
are prevented by shoal ing of the sea f lour from entering Smith
Sound and Kane Basin, respectively. BBSV% is found seasonally
throughout northern Baffin Br
*The .watlers, unique to the i~Care subtject to mor-e extensive
-. dilIut ion effec ts bv shelf. - dr i-en pioresse. s and air- compa rat ixe lv
l es s sa I i ne than thiir Ca nad ia n Ar 'h ipe lago derLi vkd c oun te rpartLs.
*Batl~I metiv i-rovides a s igni ficant inf luence on the flow of th-e
W4GC. which at ta ins a maxi mum bairoe i nic transport of 0. .7 Sv in
Melville Bay. Rectirvature of component branches ot the WGC occur-
pr imaci Iv in Mel vill Ba I2 Sr Bv S- of the Care-y I slIands (
Sw) and ul t ima teIy i n Smi th S tn .Sr
*The Baffin Curr-ent nriFinate- iiin i~*ie Slith Sn
susequently pioccedi nc ,.14iI.- CAI .
I~ Iland '1nd tIlwln ("ij( '. I
%1*0%

i- il 815 THE PH YSICAL OCEANOGRAPHY OF THE NORTHERWWF IU2/4io BRY-UARES STRAIT REGIOUA) NAYL POSTGRADUATE SCHOOLANONTEREY CA V C ADDISON DEC 87 NPS-68-87-8M
CLUNCLASSI F I ED F/G 8/3
IE
I,'
~ u~. ~ 221111' II
1lll~= 11111.81.25 111 11
: .: ll/IN IIII - llll
MCROCOPY RESOLUTION TEST CHA AR
1%%~%
.%
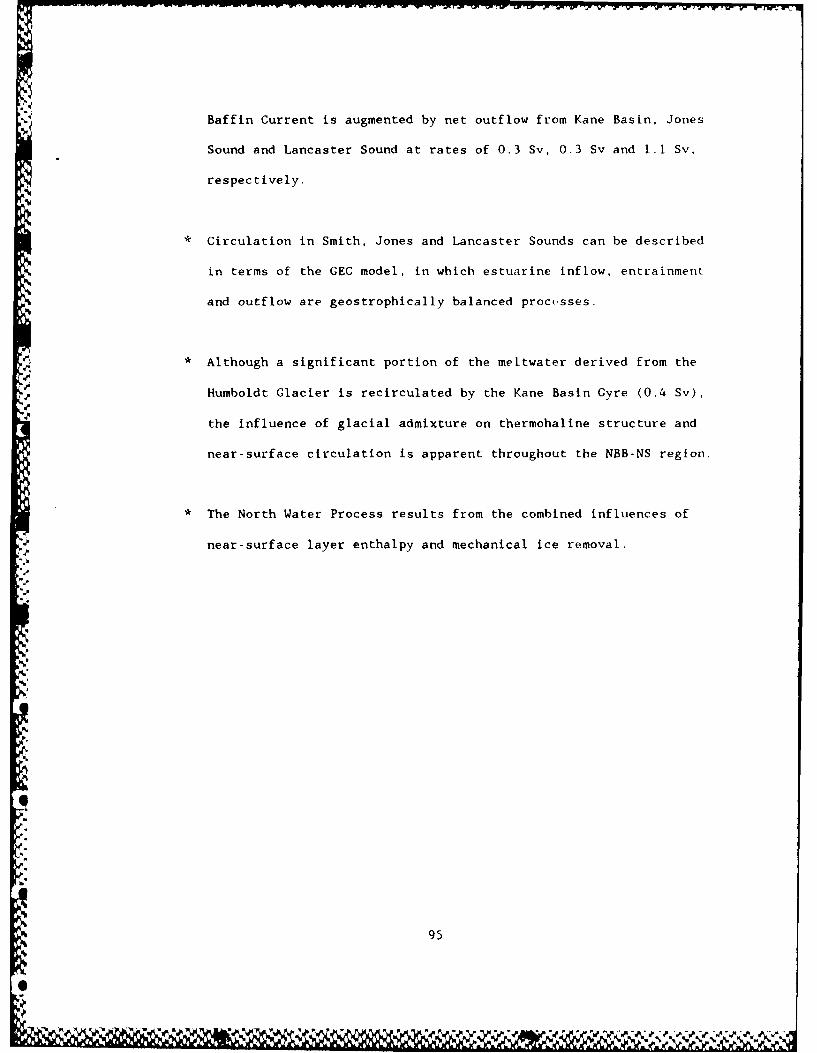
Baffin Current is augmented by net outflow from Kane Basin, Jones
Sound and Lancaster Sound at rates of 0.3 Sv, 0.3 Sv and 1.1 Sv,
respectively.
Circulation in Smith, Jones and Lancaster Sounds can be described
in terms of the GEC model, in which estuarine inflow, entrainment
and outflow are geostrophically balanced processes.
* Although a significant portion of the meltwater derived from the
Humboldt Clacier is recirculated by the Kane Basin Cyre (0.4 Sv),
the influence of glacial admixture on thermohaline structure and
near-surface circulation is apparent throughout the NBB-NS region.
The North Water Process results from the combined influences of
near-surface layer enthalpy and mechanical ice removal.
95
95i
it&1 1 %. %t %
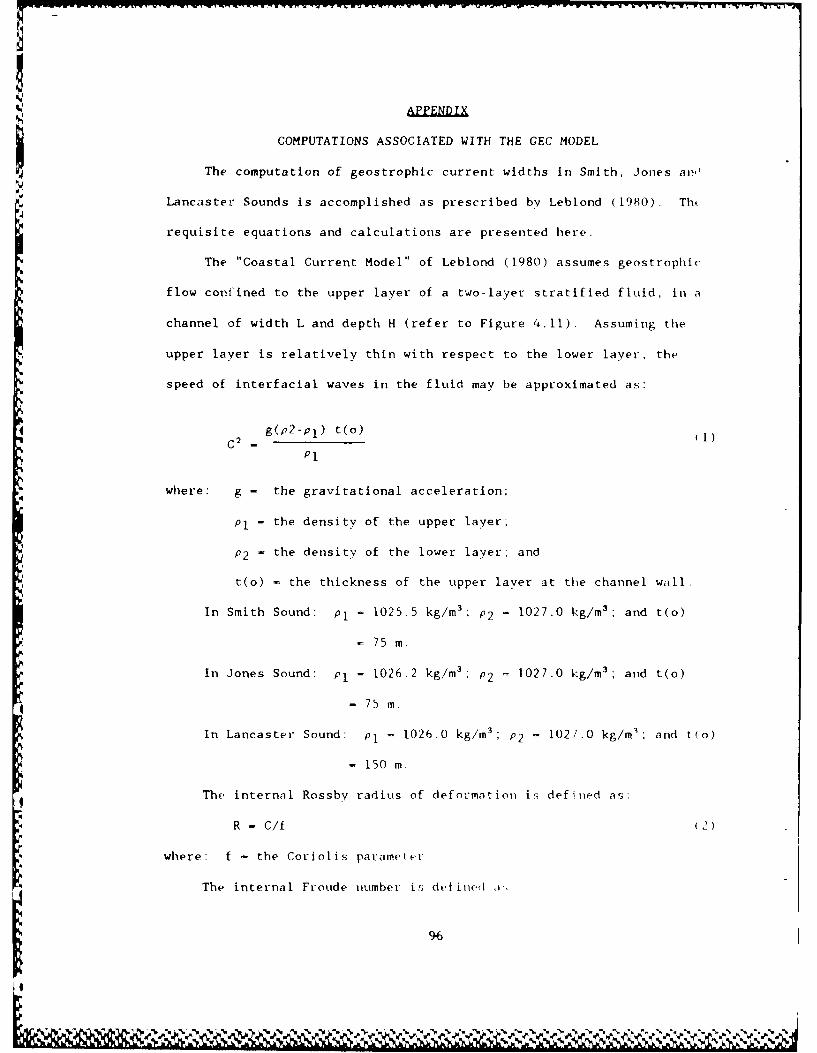
COMPUTATIONS ASSOCIATED WITH THE GEC MODEL
The computation of geostrophic current widths in Smith, Jones a,!
Lancaster Sounds is accomplished as prescribed by Leblond (1980). Tht
requisite equations and calculations are presented here.
The "Coastal Current Model" of Leblond (1980) assumes geostrophic
flow confined to the upper layer of a two-layer stratified fluid, in a
channel of width L and depth H (refer to Figure 4.11). Assuming the
upper layer is relatively thin with respect to the lower layer, the
speed of interfacial waves in the fluid may be approximated as:
c2 - g(p2-p 1 ) t(o)
-, Pl
where: g - the gravitational acceleration;
Pl - the density of the upper layer;
P2 - the density of the lower layer: and
t(o) - the thickness of the upper laver at the channel wall.
In Smith Sound: pl - 1025.5 kg/M3; P2 = 1027.0 kg/M 3; and t(o)
- 75 m.
In Jones Sound: pl - 1026.2 kg/m 3; P2 = 1027.0 kg/m 3; and t(o)
- 75 m.
In Lancaster Sound: pl - 1026.0 kg/m 3; P2 - 1027.0 kg/mn and tto)
- 150 m.
The internal Rossby radius of deformation is defined as:
R - C/f (2)
where: f - the Coriolis parameter
The internal Froude number is def ined ,
'96
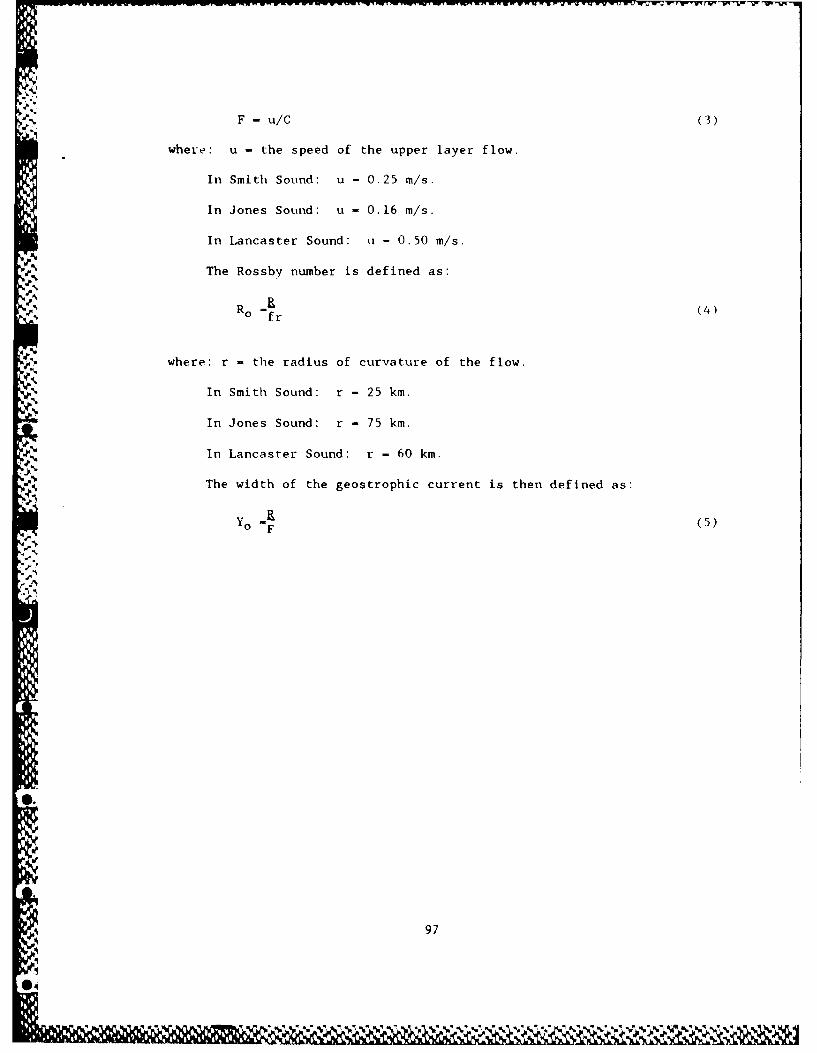
F - u/C (3)
where: u - the speed of the upper layer flow.
In Smith Sound: u - 0.25 m/s.
In Jones Sound: u - 0.16 m/s.
In Lancaster Sound: u - 0.50 m/s.
The Rossby number is defined as:
- (4)0fr
where: r - the radius of curvature of the flow.
In Smith Sound: r - 25 km.
In Jones Sound: r - 75 km.
In Lancaster Sound: r - 60 km.
pa The width of the geostrophic current is then defined as:
Y (5)0 F
97
RM
?Q0 MI V. -V 5h )

%F-
w ,V- - TV 4
- -
LIST OF REFERENCES
Aagaard, K., and L.K. Coachman, The East Greenland Current north of thDenmark Strait, Arctic, 21, 181-20() 1968.
Bourke, R.H., R.G. Paquette, and A.M. Weigel, MIZLANT 85 data report:
results of an oceanographic cruise to the Greenland Sea, Septembei.1985, Tech. Rep. NPS 68-86-007. Dept. of Oceanography. NavalPostgraduate School, Monterey, CalIfoinia. 1986
Coachman. L.K. and K. Aagaard, Physical oc, anographv of Arctic andsubarctic seas, in Arctic Ceoloy g and )vctanogravthy, edi ted hy 'iHerman, pp. 1-72, Springer-Verlag. Net. Yerk, 1974.
Dunbar, I.M., Winter regime of the North Water, Trans. R. Soc. Cal.,
4(9), 275-281, 1973.
Fissel, D.B., D.D. Lemon, and J.R. Birch, Major features of the simmernear-surface circulation of western Baffin Bay. IQ78 and 1),'".Arctic, 35, 180-200. 1982.
Garrison. G.R., H.R. Feldman and P Becker. Oceanographic measuementsin Baffin Bay, Unpublished manuscript. Applied Phs' sic,; La holator v
S University of Washington. February. 1(176
Leblond, P.H., On the surface circulation in som channels of theCanadian Arctic Archipelago, Arctic, 35. 189-1(. llgo
Lemon, D.D. and D.B. Fissel, Seasonal variations in currents and water
properties in northwestern Baffin Bay, 1978 and 1q79, A . 35.
211-218, 19.82.
Melling, H., R.A. Lake, D.R Topham. and D.B. Fissel. Oceanic thermal
structure in the western Canadian Arctic, Continental Shelf
Research, 3, 233-258, 1984.
Muench, R.D., The physical oceanography of the northern Baffin Bay
region. Baffin Bay-North Water Proj. Arct. Inst North Am. Sci.
Rep., 1-72, 1971.
Muench, R.D., and H.E. Sadler, Physical oceanographic observations inBaffin Bay and Davis Strait. A , 26, .73-76. 1973.
Sadler, H.E., Water, heat, and salt trallsports tlhrough Nares Strait,
Ellesmere Island, J. Fish. RKe. Board Cati. 19'0-.,5 .
Steffen, K. and A. Ohmura, Heat '1:dhatl and ''Irface f(ln(iitions ill th
North Water. northerin aftin , . \n K.laciologv,. .. l '8-18.
1985.
98
Tunnicliffe, M.D., An investigation of the waters of the East Greeniland
Current, Master's Thesis, Naval Postgraduate School, Montere/,
California, September 1985.
299
'
.m
" 99
6
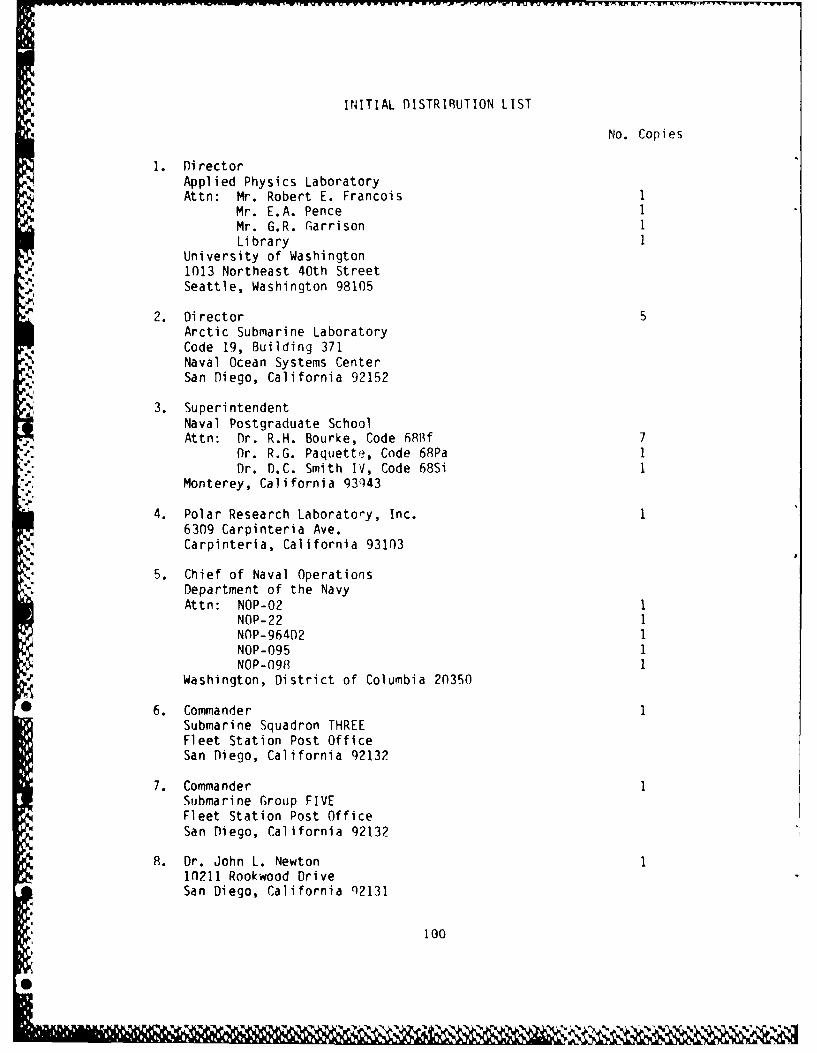
INITIAL DISTRIRUTION LIST
No. Copies
1. DirectorApplied Physics LaboratoryAttn: Mr. Robert E. Francois 1
Mr. E.A. Pence 1Mr. G.R. Garrison ILibrary I
University of Washington1013 Northeast 40th StreetSeattle, Washington 98105
2. Director 5Arctic Submarine LaboratoryCode 19, Building 371Naval Ocean Systems Center
C. San Diego, California 92152
3. SuperintendentNaval Postgraduate SchoolAttn: Dr. R.H. Bourke, Code 6RRf 7
Dr. R.G. Paquette, Code 68Pa IDr. D.C. Smith IV, Code 68Si I
Monterey, California 93,43
4. Polar Research Laboratory, Inc. 1
6309 Carpinteria Ave.Carpinteria, California 93103
N'5. Chief of Naval OperationsDepartment of the NavyAttn: NOP-02 1
NOP-22 1NOP-96402 1
NOP-095 1NOP-098 1
Washington, District of Columbia 20350
6. Commander 1Submarine Squadron THREEFleet Station Post OfficeSan Diego, California 92132
7. Commander 1Submarine Group FIVEFleet Station Post OfficeSan Diego, California 92132
8. Dr. John L. Newton 110211 Rookwood DriveSan Diego, California p2131
100
,IN
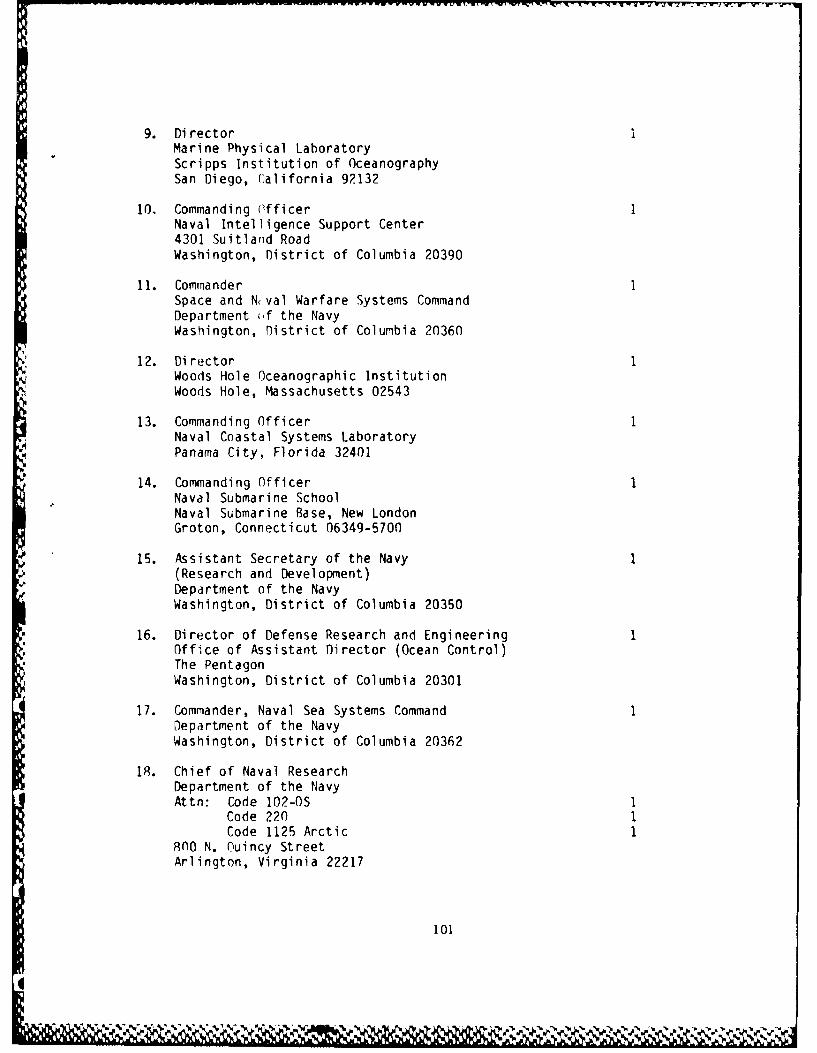
9. DirectorMarine Physical LaboratoryScripps Institution of OceanographySan Diego, California 92132
10. Commanding OfficerNaval Intelligence Support Center4301 Suitland RoadWashington, District of Columbia 20390
11. CommanderSpace and N val Warfare Systems CommandDepartment of the NavyWashington, District of Columbia 20360
12. DirectorWoods Hole Oceanographic InstitutionWoods Hole, Massachusetts 02543
13. Commanding OfficerNaval Coastal Systems LaboratoryPanama City, Florida 32401
14. Commanding OfficerNaval Submarine SchoolNaval Submarine Base, New LondonGroton, Connecticut 06349-5700
15. Assistant Secretary of the Navy(Research and Development)Department of the NavyWashington, District of Columbia 20350
16. Director of Defense Research and EngineeringOffice of Assistant Director (Ocean Control)The PentagonWashington, District of Columbia 20301
17. Commander, Naval Sea Systems CommandDepartment of the NavyWashington, District of Columbia 20362
18. Chief of Naval ResearchDepartment of the NavyAttn: Code 102-OS
Code 220Code 1125 Arctic
8nO N. Ouincy StreetArlington, Virginia 22217
101
. ..4',', *.% " ' % ' i" L)," ," . w " w w . - .

19. Project ManagerAnti-Submarine Warfare Systems ProjectOffice (PM4)Department of the NavyWashington, District of Columbia 20360
20. Commanding OfficerNaval Underwater Systems CenterNewport, Rhode Island 02840
21. CommanderNaval Air Systems CommandHeadquarters
Department of the NavyWashington, District of Columbia 20361
22. CommanderNaval Oceangraphic OfficeAttn: Library Code 3330Washington, District of Columbia 20373
23. Di rectorAdvanced Research Project Agency1400 Wilson BoulevardArlington, Virginia 22209
24. Commander SECOND FleetFleet Post OfficeNew York, New York 09501
25. Commander THIRD FleetFleet Post OfficeSan Francisco, California 96601
26. ConmanderNaval Surface Weapons CenterWhite OakAttn: Mr. M.M. Kleiner~nan 1
Library 1Silver Springs, Maryland 20910
27. Officer-in-ThargeNew London LaboratoryNaval Underqater Systems CenterNew London, Connecticut 06320
28. CommanderSubmarine Development Squadron TWELVENaval Submarine BaseNew LondonGroton, Connecticut 06349
102

29. CommanderNaval Weapons CenterAttn: LibraryChina Lake, California 93555
30. CommanderNaval Electronics Laboratory CenterAttn: Library27. Catalina BoulevardSan Diego, California 92152
31. DirectorNaval Research LaboratoryAttn: Technical Information DivisionWashington, District of Columbia 20375
32. DirectorOrdnance Research LaboratoryPennsylvania State UniversityState College, Pennsylvania 16801
33. Commander Submarine ForceU.S. Atlantic FleetNorfolk, Virginia 23511
34. Commander Submarine ForceU.S. Pacific FleetAttn: N-21Pearl Harbor, Hawaii 96860-6550
35. CommanderNaval Air Development CenterWarminster, Pennsylvania 18974
36. CommanderNaval Ship Research and Development CenterBethesda, Maryland 20084
37. CommandantU.S. Coast Guard Headquarters400 Seventh Street, S.W.Washington, District of Columbia 20590
38. CommanderPacific Area, U.S. Coast Guard620 Sansome StreetS,?n Francisco, California 94126
39. CcmmanderAtlantic Area, U.S. Coast Guard1Y9E, Navy Yard AnnexWashington, District of Columbia 20590
103
I
" " " *- " , .. ' "z . ' '
40. Commanding Officer 1U.S. Coast Guard Oceanographic UnitBuilding 159E, Navy Yard AnnexWashington, District of Columbia 20590
41. Scientific Liaison Office 1Office of Naval ResearchScripps Institute of OceanographyLa Jolla, California 92037
42. Scripps Institution of Oceanography 1Attn: LibraryP.O. Box 2367La Jolla, California 92037
43. School of OceanographyUniversity of WashingtonAttn: Dr. L.K. Coachman 1
Dr. S. Martin 1Mr. D. Tripp 1
Library 1o Seattle, Washington 98195
44. School of Oceanography 1Oregon State UniversityAttn: LibraryCorvallis, Oregon 97331
45. CRRELU.S. Army Corps of EngineersAttn: Library 1Hanover, New Hampshire 03755-1290
46. Commanding Officer 1Fleet Numerical Oceanography CenterMonterey, California 93943
47. Commanding Officer 1Naval Environmental Prediction Research FacilityMonterey, California 93943
48. Defense Technical Information Center 2Cameron StationAlexandria, Virginia 22304-6145
19. Commander INaval Oceanography CommandNSTL StationBay St. Louis, Mississippi 39529
104
A..
50. Commanding OfficerNaval Ocean Research and Development ActivityAttn: Technical OirectorNSTL StationBay St. Louis, Mississippi 39529
51. Commanding OfficerNaval Polar Oceanography Center, SuitlandWashington, District of Columbia 20373
52. DireactorNavil Oceanography DivisionNaval Observatory34tn and Massachussetts Ave. NWWashington, District of Columbia 20390
53. Comnanding OfficerNaval Oceanographic CommandNSTL StationBay St. Louis, Mississippi 39522
54. Scott Polar Research InstituteUniversity of CambridgeAttn: Library 1
Sea Ice Group 1Cambridge, ENGLANDCB2 lER
55. Chairman 2Depirtment of OceanographyU.S. Naval AcademyAnnapolis, Maryland 21402
56. Dr. James MorisonPolar Science Center4057 Roosevelt Way, NESeattle, Washington 98105
57. Dr. Kenneth HunkinsLamont-Doherty Geological ObservatoryPalisades, New York 10964
58. Dr. David Paskowsky, ChiefOceanography BranchU.S. Department of the Coast GuardResearch and Development CenterAvery Point, Connecticut 06340
59. Science Applications, Inc.Attn: Dr. Robin Muench13400B Northrup WaySuite 36Bellevue, Washington 98005
105
I
60. Institute of Polar StudiesAttn: Library103 Mendenhall125 South Oval MallColumbus, Ohio 43210
61. Institute of Marine ScienceUniversity of AlaskaAttn: LibraryFairbanks, Alaska 99701
62. Department of OceanographyUniversity of British ColumbiaAttn: LibraryVancouver, British ColumbiaCANADAV6T IW5
63. Institute of Marine ScienceUniversity of AlaskaAttn: Dr. H.J. NiebauerFairbanks, Alaska 99701
64. Bedford Institute of OceanographyAttn: Dr. P. Jones 1
Library 1P.I. Box 1006Da-tmouth, Nova ScotiaCAIADAB2 4A2
65. Carol PeasePacific Marine Environmental Lab/N0AA76)0 Sand Point Way N.E.Spittle, Washington 98119
66. Dtpartment of OceanographyDalhousie UniversityHalifax, Nova ScotiaCANADAB3H 4JI
67. Dr. Richard Armstrong 2MIZEX Data ManagerNational Snow and Ice Data CenterCooperative Institute for Researchin Environmental Sciences
Boulder, Colorado 80309
106
{~
68. Institute of Ocean SciencesAttn: Dr. Eddy Carmack
Dr. E. L. LewisDr. G. Holloway
P.O. Box 6000Sidney, British ColumbiaCANADAV8L 4B2
7C. Dr. Knut AagaardNOAA/PMELNOAA Bldg. #37600 Sand Point Way, N.E.Seattle, Washington 92115
71. Department of Ocean EngineeringAttn: LibraryMass. Institite of Technology
* Cambridge, Massachusetts 02139
72. Dr. Theodore D. FosterCenter for Coastal Marine StudiesUniversity of CaliforniaSanta Cruz, California 95064
73. Research AdministrationCode 012Naval Postgraduate SchoolMonterey, California 93943-5000
74. Dr. Hugh D. LivingstonWoods Hole Oceanographic InstitutionWoods Hole, Massachusetts 02543
75. Dr. T.O. ManleyLamont-Doherty Geological ObservatoryPalisades, New York 10964
76. Dr. A. FoldvikGeophysical InstituteUniversity of BergenBergen, NORWAY
77. Dr. Preben Gudmandsen
Electromagnetics InstituteTechnical University of DenmarkBuilding 349DK-2800 Lyngby, DENMARK
78. Dr. 0. HanzlickFlow Industries, Inc.Kent, Washington 98064
107
%
79. Dr. W.D. HiblerThayer School of Engineering
Dartmouth CollegeHanover, New Hamsphire 03755
80. Director General Fleet SystemsAttn: Ivan Cote'Canadian Coast GuardTower A, Place de VilleOttawa, OntarioCanada KIA flN7
81. Mr. Tom CockeOffice of Marine ScienceU.S. Department of StateWashington, D.C. 20525
82. Commanding OfficerCCGS SIR JOHN FRANKLINCanadian Coast Guard BaseP.O. Box 1300St. John's NewfoundlandCanada AIC 6H8
83. M. Kim 0. McCoySeaMetrics9320 Chesapeake Dr., #212San Diego, CA 92123
84. CDR Erik ThomsenDanish Liaison OfficeThule AFBThule, Greenland
85. LT V. G. Addison, Jr. 546 Division AvenueMat;sapequa, N.Y. 1175R
86. LT A.M. Weigel4332 Great Oak DriveCharleston, SC 29418
87. Research AdministrationCode 012Naval Postgraduate SchoolMonterey, CA 93943-5000
88. Superintendent 2Naval Postgraduate SchoolAttn: Library (Code 0142)Monterey, California 93943-5002
108
r'. ..l

ISV
V.
ISIS ThR1~
'p.
1%
"S
'p
'p
"S
,SVAp%~% ~

![SUNSET BEACH RSM INVESTIGATIONS€¦ · Sunset Beach Region: Cumulative Transect Volumes from 1949 to 2006 (by reach) Reach 1 Reach 2 t] Reach 3 SOEST Transect Number H NT NT D. co-sponsored](https://img.pdfslide.net/doc/110x75/5f54e5eeedbd9724e80c028e/sunset-beach-rsm-investigations-sunset-beach-region-cumulative-transect-volumes.jpg)