Embed Size (px)
Citation preview
Physical Interpretations of Nyquist Plots for EDLC Electrodes andDevicesBing-Ang Mei,† Obaidallah Munteshari,† Jonathan Lau,‡ Bruce Dunn,‡ and Laurent Pilon*,†
†Henry Samueli School of Engineering and Applied Science, Mechanical and Aerospace Engineering Department,University of California at Los Angeles, 420 Westwood Plaza, Los Angeles, California 90095, United States‡Henry Samueli School of Engineering and Applied Science, Materials Science and Engineering Department,University of California at Los Angeles, 410 Westwood Plaza, Los Angeles, California 90095, United States
*S Supporting Information
ABSTRACT: Electrochemical impedance spectroscopy (EIS) consists of plotting so-called Nyquist plots representing negative of the imaginary versus the real parts of thecomplex impedance of individual electrodes or electrochemical cells. To date, inter-pretations of Nyquist plots have been based on physical intuition and/or on the use ofequivalent RC circuits. However, the resulting interpretations are not unique and haveoften been inconsistent in the literature. This study aims to provide unequivocalphysical interpretations of electrochemical impedance spectroscopy (EIS) results forelectric double layer capacitor (EDLC) electrodes and devices. To do so, a physicochem-ical transport model was used for numerically reproducing Nyquist plots accountingfor (i) electric double layer (EDL) formation at the electrode/electrolyte interface,(ii) charge transport in the electrode, and (iii) ion electrodiffusion in binary and sym-metric electrolytes. Typical Nyquist plots of EDLC electrodes were reproduced num-erically for different electrode conductivity and thickness, electrolyte domain thickness, aswell as ion diameter, diffusion coefficient, and concentrations. The electrode resistance,electrolyte resistance, and the equilibrium differential capacitance were identified from Nyquist plots without relying on equivalentRC circuits. The internal resistance retrieved from the numerically generated Nyquist plots was comparable to that retrieved fromthe “IR drop” in numerically simulated galvanostatic cycling. Furthermore, EIS simulations were performed for EDLC devices, andsimilar interpretations of Nyquist plots were obtained. Finally, these results and interpretations were confirmed experimentally usingEDLC devices consisting of two identical activated-carbon electrodes in both aqueous and nonaqueous electrolytes.
■ INTRODUCTION
Electrochemical impedance spectroscopy (EIS) has been usedextensively to characterize the performance of electrical energystorage and conversion devices including electrochemical capaci-tors,1−10 batteries,11−14 and fuel cells.15,16 It has also been used tocharacterize individual electrodes used for electrochemicalcapacitors,17−19 corrosion tests,20,21 and capacitive deionization.22,23
It consists of imposing a time harmonic oscillating electric poten-tial ψs(t) of small oscillation amplitude (e.g., less than 10 mV)around a time-independent “DC potential” at the electrode sur-faces and measuring the resulting harmonic current densityjs(t).
7,8,16 Using complex notations, the imposed electric poten-tial ψs(t) and the resulting current density js(t) can be expressedas16,24−26
ψ ψ ψ= + = +π π ϕ−t j t j j( ) e and ( ) ei ft i ft fs dc 0
2s dc 0
[2 ( )]
(1)
where ψdc is the time-independent DC potential, ψ0 is theamplitude of the oscillating potential at frequency f, jdc is thetime-independent DC current density, j0 is the amplitude of theoscillating current density, and ϕ( f) is the frequency-dependentphase angle between the imposed potential ψs(t) and themeasured
current density js(t). Then, the electrochemical impedance Z canbe defined as16,24−26
ψ ψ ψ=
−−
= = +ϕZt
j t j jZ iZ
( )
( )eis dc
s dc
0
0re im
(2)
where Zre and Zim (expressed inΩm2) are the real and imaginaryparts of the complex impedance, respectively.Electric double layer capacitors (EDLC) consist of two porous
carbon electrodes separated by liquid electrolyte consisting of asalt dissolved in an aqueous or organic solvent. The electrodestypically consist of activated carbon particles with inner pores lessthan 2 nm in diameter. Figure 1 shows the schematic of a typicalNyquist plot presenting the imaginary part, −Zim, as a functionof the real part, Zre, of the complex impedance of an electricdouble layer capacitor (EDLC). It consists of a semicircle at highfrequencies between points A and B, a nonvertical line at inter-mediate frequencies between points B and C, and a nearlyvertical line at low frequencies beyond point C.
Received: October 26, 2017Revised: December 5, 2017Published: December 5, 2017
Article
pubs.acs.org/JPCCCite This: J. Phys. Chem. C 2018, 122, 194−206
© 2017 American Chemical Society 194 DOI: 10.1021/acs.jpcc.7b10582J. Phys. Chem. C 2018, 122, 194−206
Multiple and often contradictory physical interpretationsof experimental Nyquist plots of EDLCs have been proposedin the literature.2,27−40 For example, the resistance RA at point A(Figure 1) has been attributed to (i) the bulk electrolyte resis-tance27−33 or (ii) the equivalent series resistance (ESR) alsoknown as the internal resistance defined as the sum of theresistances of the bulk electrolyte, the electrode, and the contactresistance between the electrode and the current collector.2,34−37
The diameter of the semicircle RAB = RB− RA (Figure 1) has beenassigned to (i) the electrolyte resistance in the pores of theelectrodes,31,34,35 (ii) the contact resistance between electrodeand current collector,38 (iii) the sum of the electrode resistance
and contact resistance between the electrode and the currentcollector,32 or (iv) the so-called charge transfer resistance.27,30
For EDLC devices, the charge transfer resistance corresponds tothe sum of the electrolyte resistance in the porous structure of theelectrode, the electrode resistance, and the contact resistancebetween the electrode and the current collector.30 Based on thisinterpretation along with the previous interpretation of RA as thebulk electrolyte resistance,27−33 the resistance RB (Figure 1), i.e.,RB = RA + RAB, can be interpreted as the internal resistance, i.e.,the sum of bulk electrolyte resistance and the so-called chargetransfer resistance.27,30,32 Furthermore, the existence of the non-vertical line BC (Figure 1) at intermediate frequencies hasbeen assigned to (i) ion transport limitation in the electrolyte inporous electrode structures,27−29,32,34,37 (ii) ion transport limita-tion in the bulk electrolyte,33 or (iii) nonuniform pathway for iontransport from the bulk electrolyte to the porous electrodesurface caused by nonuniform electrode pore size and electroderoughness.2,36,38 Based on the latter interpretation, the resis-tance RBC (Figure 1) was called the “equivalent distributionresistance”.2 Finally, the vertical line at low frequencies beyondpoint C (Figure 1) was attributed to the dominant capacitivebehavior of the electric double layer formed at the electrode/electrolyte interface.31,32,34,35,38 The intersection between thevertical line and the Zre axis, corresponding to RC (Figure 1) hasbeen termed (i) the internal resistance,30 (ii) the equivalentseries resistance (ESR),33 or (iii) the overall resistance34 of theelectrode or the device. The multiple and contradictory interpre-tations of the Nyquist plots listed above for RA, RB, RC, RAB, andRBC are confusing and need clarification.
Figure 1. Schematic of typical Nyquist plots for EDLC electrodes ordevices.
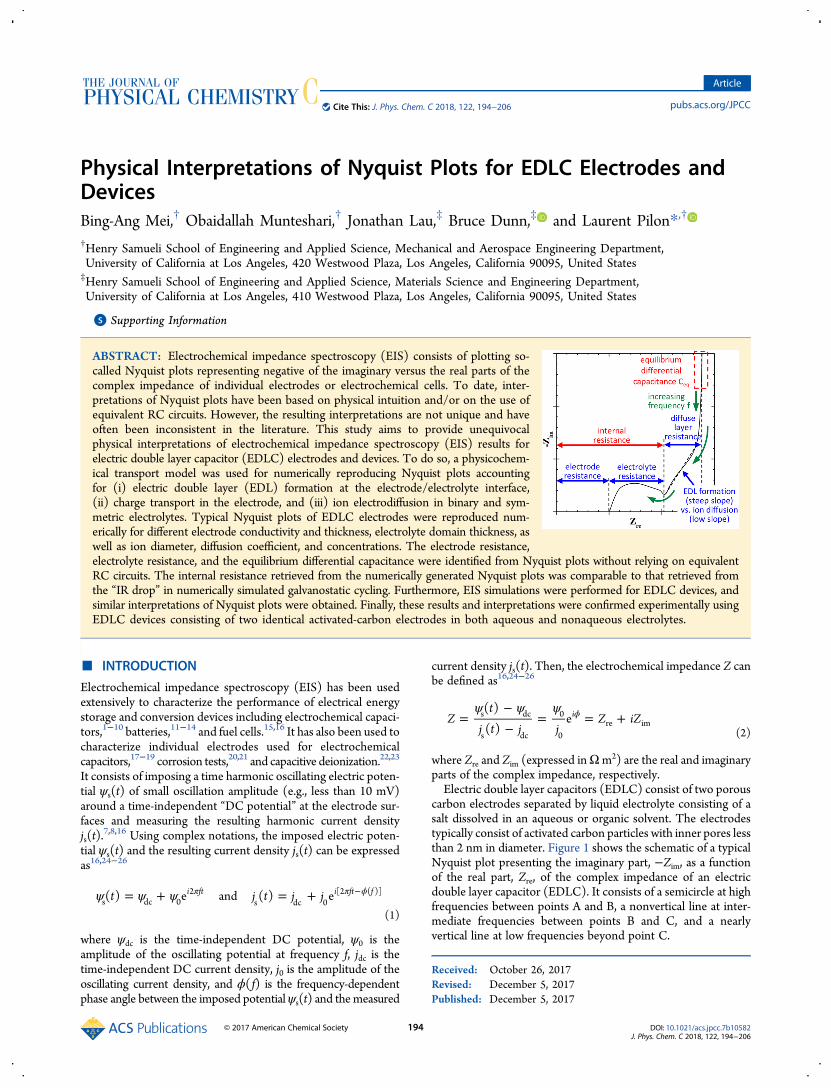
Figure 2. Schematics of (a) the simulated one-dimensional EDLC electrode in a three-electrode setup and (b) EDLC devices consisting of two identicalelectrodes. The dashed line encloses the computational domain simulated.
The Journal of Physical Chemistry C Article
DOI: 10.1021/acs.jpcc.7b10582J. Phys. Chem. C 2018, 122, 194−206
195
Moreover, equivalent RC circuit models have been commonlyused to fit and/or interpret Nyquist plots. They consist of repre-senting EDLC devices or electrodes by an equivalent electriccircuit consisting of an arbitrary number of ideal capacitors andresistors.41−49 Unfortunately, despite their widespread use, equiv-alent RC circuit models suffer from serious limitations includingthe facts that (i) they neglect ion diffusion and nonuniform ionconcentrations in the electrolyte47−49 and (ii) two different RCcircuit models can produce similarly acceptable impedanceresponse and/or fit experimental data equally well, as demon-strated in the literature.50,51
This study aims to provide unequivocal interpretation ofNyquist plots for individual EDLC electrodes and EDLC cellswithout relying on physical intuition or equivalent RC circuits.To do so, EIS measurements of (i) EDLC electrodes based onthree-electrode setup and (ii) two-electrode EDLC cells werenumerically reproduced for different electrode conductivity andthickness, different electrolyte domain thickness, as well as fordifferent ion diameter, diffusion coefficient, and concentration inthe electrolyte. The study also focuses on retrieving equilibriumdifferential capacitance and internal resistance from EIS simula-tions. Finally, the study aims to validate experimentally the phys-ical interpretations of EIS measurements developed numericallyusing EDLC cells consisting of two identical electrodes made ofactivated carbon and different aqueous and organic electrolytes.
■ ANALYSISSchematic and Assumptions. Figure 2 shows (a) a one-
dimensional (1D) simulated domain consisting of a planar cur-rent collector supporting a working electrode of thickness Leand an electrolyte domain of thickness L corresponding to athree-electrode setup and (b) an EDLC device consisting of twoidentical electrodes of thickness Le separated by an electrolytedomain of thickness 2L. The electrolyte near each electrodeconsisted of a Stern layer of thickness H and a diffuse layer ofmobile ions of thickness LD defined such that [ci(x = Le + H +LD,t) − c∞]/c∞ ≤ 5%, where ci(x = Le + H + LD,t) is the localconcentration of cations (i = 1) or anions (i = 2) and c∞ is thebulk ion concentration. To make the problem mathematicallytractable, the following assumptions were made: (1) the elec-trolyte was binary and symmetric, i.e., it consisted of two ionspecies of opposite valency ± z (z > 0).52 The two ion specieswere further assumed to have identical diameter a and diffusioncoefficient D. (2) The Stern layer contained no free charge andits thicknessHwas approximated as the radius of the ions, so thatH = a/2, as commonly assumed in continuum simulationsof electric double layer.24,53,54 (3) The transport properties ofthe electrode and electrolyte were taken as constant. (4) Bulkmotion of the electrolyte was negligible. (5) No redox reaction orion intercalation took place at the surface or within the electrode.(6) Heat generation was ignored and the temperature was uni-form and constant in the electrode and electrolyte. (7) Contactresistance between the electrode and the current collector andthe electrical resistance of the current collector were negligible.(8) Self-discharge of the electrode or the device was ignored.Simulations reported in this study were based on the modified
Poisson−Nernst−Planck (MPNP) model for binary and sym-metric electrolyte for EDLC electrodes or devices. The govern-ing equations, initial and boundary conditions, and method ofsolution were described in detail in refs 55 and 56 and need notbe repeated. The MPNP model governed the spatiotemporalevolution of the potential ψ(x, t) in the electrode and electrolyteas well as the ion concentrations c1(x, t) of cations and c2(x, t) of
anions in the electrolyte. In addition, the boundary conditionsvaried depending on whether EIS or galvanostatic cycling weresimulated. EIS simulations imposed potential ψs(t) at the currentcollector/electrode interface or across the cell as a harmonicfunction of time t [eq S.5a]. For galvanostatic cycling, the currentdensity js(t) imposed at the current collector/electrode interfaceor across the cell was a square wave of magnitude jGC with respectto the cycle period [eq S.6]. In single electrode simulations,the potential and the ion concentrations remained as theirinitial values at the centerline [Figure 2a]. In two-electrode sym-metric device simulations, the potential at one current collector/electrode interface was set to zero while the other was at ψs
c(t) =2ψs(t) [eq S.5b]. All governing equations along with the initialand boundary conditions, in the 1D coordinate system, shown inFigure 2, were reproduced in the Supporting Information for thesake of completeness.
Constitutive Relationships. In order to solve the coupledtransient 1D equations as well as the initial and boundary condi-tions, a total of 12 parameters were necessary including (i) theelectrode electrical conductivity σe; (ii) the electrolyte propertiesϵr, z, a,D, and c∞; (iii) the dimensions of the simulated electrodeand electrolyte domains Le and L; along with (iv) the operatingconditions ψdc, ψ0, and f for EIS simulations and ψmin, ψmax, andjGC for galvanostatic cycling, and (v) temperature T (in K).The electrical conductivity σe and thickness Le of the electrode;the electrolyte properties a,D, and c∞; and the length of the elec-trolyte domain L were treated as variables to achieve variousresistances and capacitances. On the other hand, the temperaturewas set to room temperature (T = 298 K), and the dielectricconstant was taken as that of propylene carbonate, a commonlyused organic solvent, i.e., ϵr = 64.4.57 The valency of the ionspecies was z = 1.58 Finally, in EIS simulations, the DC potentialwas set arbitrarily as ψdc = 0.3 V, the oscillating potential wasset as ψ0 = 5 mV, and the frequency f varied between 0.1 and5 × 106 Hz. In galvanostatic cycling, the magnitude of imposedcurrent density jGC ranged between 10
−3 and 1mA/cm2 while thepotential window was set as ψmin = 0 V and ψmax = 1 V. Table 1summarizes the values or ranges of these parameters.
Data Processing. Electrical Resistances.The electrical resis-tance Re (in Ω m2) per unit surface area of the planar electrodecan be expressed as
σ=R L /e e e (3)
To calculate the resistance of the electrolyte, current density dueto ion transport in the electrolyte needs to be considered and isgiven by1
= −j x t zF N x t N x t( , ) [ ( , ) ( , )]1 2 (4)
where z is the valency, F = eNA is the Faraday constant, andN1(x, t)and N2(x, t) are the mass fluxes of cations and anions in theelectrolyte (in mol/m2s) expressed in eq S.3. Note that the localelectric field E(x, t) =− ∂ψ/∂x. Thus, the local ionic conductivityσ(x) in the electrolyte, defined as j(x, t) = σ(x)E(x, t), can beexpressed as
σψ
ψ
= ∂∂
− ++
+−
− +∂
∂+
x zFD c cz F D c c
R T
DN a c cN a c c
c c
( ) ( )( )
( )1 ( )
( )
1 2
2 21 2
u
A3
1 2
A3
1 21 2
(5)
where D is the diffusion coefficient, c1(x, t) and c2(x, t) are theconcentrations of cations and anions at location x and time t in
The Journal of Physical Chemistry C Article
DOI: 10.1021/acs.jpcc.7b10582J. Phys. Chem. C 2018, 122, 194−206
196
the electrolyte, ψ(x, t) is the potential in the electrolyte, Ru =8.314 J /mol K is the universal gas constant, a is the effective iondiameter, and NA is Avogadro’s number. Here, the diffuse layercontained mobile ions with nonzero concentration gradientswhile the ion concentrations in the bulk electrolyte remainedconstant. Thus, the ionic conductivity σ(x) varied with locationin the diffuse layer andwas a harmonic function of time that couldbe represented using complex notations. However, it remainedconstant and real in the bulk electrolyte. The resistance, i.e., thereal part of the impedance, of the diffuse layer near one electrodecan be expressed as
∫ σ=
+⎡⎣⎢
⎤⎦⎥R Re
xx
d( )L
L L
De
e D
(6)
Note that the local ion concentrations c1(x, t) and c2(x, t) inthe diffuse layer as well as the diffuse layer thickness LD wereunknown and were determined numerically. Finally, the bulkelectrolyte resistance can be expressed as1
σ σ= − =∞ ∞ ∞ ∞R L L z F Dc R T( )/ with (2 )/( )D2 2
u(7)
where σ∞ is the electrical conductivity of the bulk elec-trolyte.Moreover, for EDLC cells (referred to by superscript “c”), the
resistances of the electrodes Rec, the diffuse layer RD
c , and the bulkelectrolyte R∞
c can be expressed as
=R R2ec
e (8)
Table 2. Simulation Parameters and Corresponding Resistances Re, R∞, and RD and Capacitance Cdiff,eq [eq 13] and Cdiff,eq,EISValues for 25 EIS Simulations for Single Electrodes (Cases 1−24) and an EDLC Cell (Case 25)
σe c∞ D L Le a τD/τRC Re R∞ RD Cdiff,eq Cdiff,eq,EIS
case no. (S/m) (mol/L) (m2/s) (nm) (nm) (nm) (Ω m2) (Ω m2) (Ω m2) (μF/cm2) (μF/cm2)
2 1 × 10⁻⁷ 0.001 2 × 10⁻¹³ 160 10 0.66 0.72 0.1 0.105 0.07 94.8 94.83 5 × 10⁻⁸ 0.001 2 × 10⁻¹³ 160 10 0.66 0.68 0.2 0.105 0.07 94.8 95.04 5 × 10⁻⁵ 0.01 2 × 10⁻¹³ 160 10 0.66 7.13 2 × 10⁻⁴ 0.0105 0.009 91.5 91.65 5 × 10⁻⁵ 0.001 2 × 10⁻¹³ 160 10 0.66 0.68 2 × 10⁻⁴ 0.105 0.07 94.8 94.66 5 × 10⁻⁵ 0.0005 2 × 10⁻¹³ 160 10 0.66 0.37 2 × 10⁻⁴ 0.20 0.14 92.7 94.47 5 × 10⁻⁵ 0.001 2 × 10⁻¹³ 80 10 0.66 0.38 2 × 10⁻⁴ 0.05 0.04 94.9 92.28 1 × 10⁻⁷ 0.002 2 × 10⁻¹³ 160 10 0.66 1.47 0.1 0.05 0.04 95.5 93.59 5 × 10⁻⁵ 0.002 5 × 10⁻¹⁴ 80 10 0.66 0.78 2 × 10⁻⁴ 0.105 0.09 95.6 93.710 5 × 10⁻⁵ 0.002 2 × 10⁻¹³ 160 10 0.33 0.62 2 × 10⁻⁴ 0.05 0.05 206.4 197.111 5 × 10⁻⁵ 0.0005 8 × 10⁻¹³ 320 10 0.66 0.66 2 × 10⁻⁴ 0.105 0.10 94.7 93.612 5 × 10⁻⁵ 0.0005 2 × 10⁻¹³ 160 10 1.32 0.91 2 × 10⁻⁴ 0.20 0.19 38.1 38.413 5 × 10⁻⁵ 0.001 2 × 10⁻¹³ 80 10 1.32 1.04 2 × 10⁻⁴ 0.05 0.04 37.1 36.614 5 × 10⁻⁵ 0.001 2 × 10⁻¹³ 320 10 0.33 0.66 2 × 10⁻⁴ 0.20 0.19 194.4 197.415 5 × 10⁻⁵ 0.001 2 × 10⁻¹³ 160 10 1.32 1.84 2 × 10⁻⁴ 0.105 0.10 37.1 37.116 5 × 10⁻⁵ 0.001 2 × 10⁻¹³ 160 10 0.33 0.33 2 × 10⁻⁴ 0.105 0.10 194.9 197.217 5 × 10⁻⁵ 0.001 1 × 10⁻¹³ 80 10 0.66 0.37 2 × 10⁻⁴ 0.105 0.09 94.9 93.018 5 × 10⁻⁵ 0.0005 1 × 10⁻¹³ 160 10 0.66 0.37 2 × 10⁻⁴ 0.41 0.40 92.7 88.319 5 × 10⁻⁵ 0.001 5 × 10⁻¹⁴ 80 10 0.66 0.37 2 × 10⁻⁴ 0.20 0.17 94.9 94.920 5 × 10⁻⁵ 0.001 1 × 10⁻¹³ 320 10 0.66 1.39 2 × 10⁻⁴ 0.05 0.05 92.7 94.421 1 × 10⁻⁷ 0.004 2 × 10⁻¹³ 160 10 0.66 3.04 0.1 0.03 0.02 95.2 93.422 1 × 10⁻⁷ 0.006 2 × 10⁻¹³ 160 10 0.66 4.34 0.1 0.02 0.02 94.7 93.023 5 × 10⁻⁵ 0.0075 2 × 10⁻¹³ 160 10 0.66 5.50 2 × 10⁻⁴ 0.01 0.01 92.3 92.224 5 × 10⁻⁵ 1 2 × 10⁻¹³ 1600 100 0.66 2.09 × 10⁴ 2 × 10⁻³ 1.06 × 10⁻³ 1.24 × 10⁻⁶ 66.5 62.025** 5 × 10⁻⁵ 1 2 × 10⁻¹³ 1600 100 0.66 4.18 × 10⁴ 4 × 10⁻³ 2.12 × 10⁻³ 2.48 × 10⁻⁶ 33.2 31.5
Table 1. Value or Range of Electrode and Electrolyte Properties and Dimensions Used in the Simulations Reported in This Study
parameter symbol value unit ref
electrode conductivity σe 5 × 10⁻⁸−5 × 10⁻⁵ S/mdielectric constant ϵr 64.4 57valency z 1 58ion diameter a 0.33−1.32 nmdiffusion coefficient D 5 × 10⁻¹⁴−8 × 10⁻¹³ m2/sbulk ion concentration c∞ 0.0005−1 mol/Lelectrode thickness Le 10−100 nmelectrolyte thickness L 40−1600 nmDC potential ψDC 0.3 Vamplitude of oscillating potential ψ0 5 mV 24−26frequency f 0.1−5 × 10⁴ Hz 2,27−40magnitude of imposed current density jGC 10−3−0.01 mA/cm2
potential window ψmin 0 V 59ψmax 1 V 59
temperature T 298 K
The Journal of Physical Chemistry C Article
DOI: 10.1021/acs.jpcc.7b10582J. Phys. Chem. C 2018, 122, 194−206
197
∫ ∫σ σ= +
+
+ −
+⎡⎣⎢
⎤⎦⎥R Re
xx
xx
d( )
d( )L
L L
L L L
L L
Dc
2
2
e
e D
e D
e
(9)
σ= −∞ ∞R L L2( )/cD (10)
Finally, the internal resistance RGC (in Ω m2) retrieved fromgalvanostatic cycling for both single-electrode and device simula-tions can be expressed as60,61
ψ= ΔR j
j( )
2GC GCGC (11)
where Δψ is the potential drop observed at the beginning ofdischarge under constant current density jGC.Equilibrium Differential Capacitance. The differential capac-
itance (in μF/cm2) is defined as1,24,62
ψ=C
qd
ddiffs
s (12)
where qs (in C/m2) is the surface charge density. For a givenEDLC electrode under equilibrium conditions, it is denoted byCdiff,eq and can be expressed as63,64
= +C C C
1 1 1
diff,eq diff,eqSt
diff,eqD
(13)
whereCdiff,eqSt andCdiff,eq
D are the equilibrium differential capacitancesof the Stern layer and diffuse layer near the electrode, respectively.They can be expressed as63,64
=ϵ ϵ
CHdiff,eq
St 0 r(14a)
and
ν ν
=
+ +
λψ
ψν
ψ
ϵ ϵ
⎡⎣⎢
⎤⎦⎥
⎡⎣⎢
⎤⎦⎥
( )( ) ( )
C
sinh
1 2 sinh log 1 2 sinh
zek T
zek T
zek T
diff,eqD
22
2 22
0 r
D
D
B
D
B
D
B
(14b)
where λD = [ϵ0ϵrkBT/(2e2z2NAc∞)]
1/2 is the Debye length, e is theelementary charge, and kB is the Boltzmann constant, respectively.The packing parameter ν is defined as ν = 2a3NAc∞. For planarelectrode under equilibrium conditions, the electric potential at theStern/diffuse layer interface, denoted by ψD, can be expressed as afunction of the potential ψs imposed at the electrode/currentcollector interface according to65
ψ ψ=
⎛⎝⎜
⎞⎠⎟k T ez k T ez/
0.37/
D
B
s
B
1.16
(15)
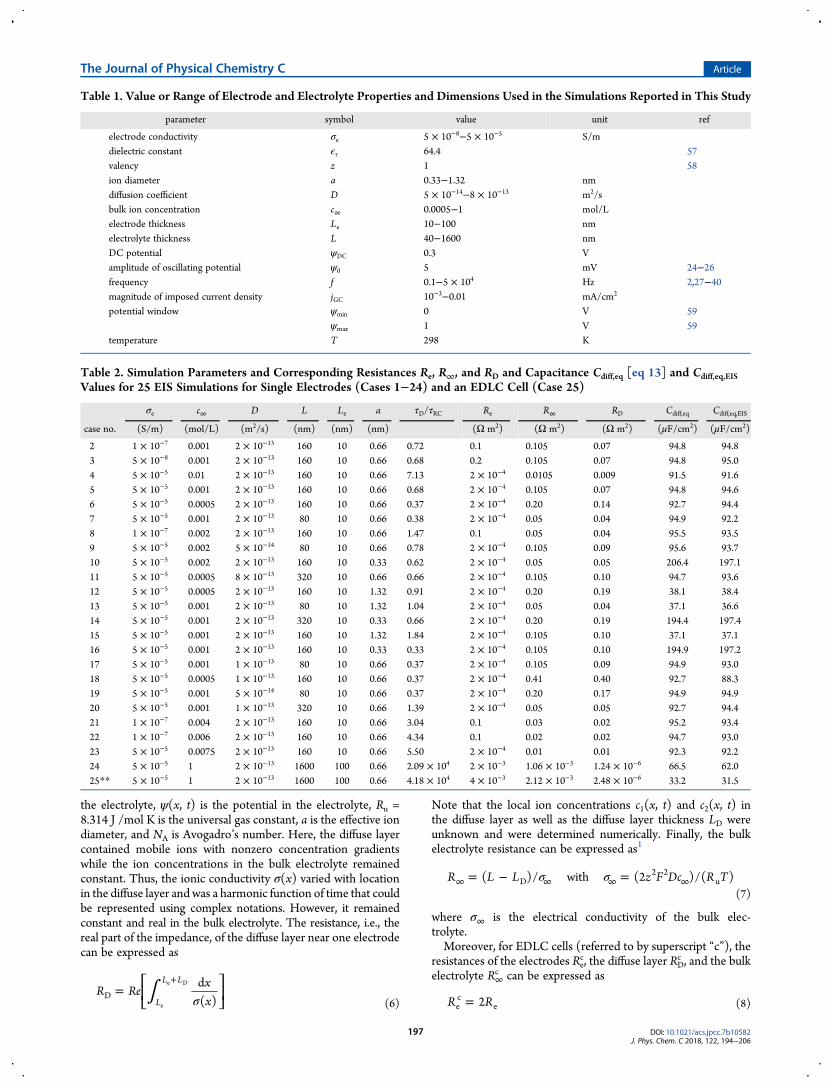
Figure 3. (a−c) Nyquist plots for EDLC electrode for cases 1−3 (Table 2) featuring electrode resistance Re of (a) 0.05, (b) 0.1, and (c) 0.2 Ω m2, aspredicted by eq 3. (d) Modified Nyquist plots −Zim versus Zre − Re for the three cases.
The Journal of Physical Chemistry C Article
DOI: 10.1021/acs.jpcc.7b10582J. Phys. Chem. C 2018, 122, 194−206
198
Note that for EIS simulations, ψs in eq 15 corresponds to the time-independent potential ψdc.Finally, an EDLC cell with two identical electrodes can be
treated as two capacitors in series. Thus, the equilibrium capac-itance of the EDLC cell can be expressed as Cdiff,eq
c = Cdiff,eq/2.
■ RESULTS AND DISCUSSION
Interpretation of the Nyquist Plot for EDLC Electrodes.Table 2 summarizes the different cases (cases 1−24) considered toassess the effects of electrode and electrolyte resistances and elec-trode capacitance on theNyquist plots of a single EDLC electrode.Electrode Resistance Re. Figure 3a−c shows the Nyquist plots
for EDLC electrodes of cases 1−3 featuring electrode electricalconductivity σe of (a) 2× 10⁻⁷, (b) 1× 10⁻⁷, and (c) 5× 10⁻⁸ S/m,corresponding to electrode resistance Re [eq 3] of (a) 0.05,(b) 0.1, and (c) 0.2 Ω m2, respectively. All other parametersremained the same in these three cases. First, Figure 3a−cresembles remarkably experimental EIS measurements on singleEDLC electrodes.17−19 In addition, they indicate that changingelectrode resistance led to a horizontal shift of the Nyquist plotalong the Zre axis. Moreover, the high-frequency intersection ofthe Nyquist plot with theZre axis (corresponding to RA in Figure 1)was systematically equal to the electrode resistance Re predictedby eq 3. Note that the present simulations ignored contact resis-tance between the electrode and the current collector. However,it can be accounted for as a resistance in series withRe, and its sole
effect on the Nyquist plot would also be to shift the plot alongthe Zre axis. Note that the so-called ”charge-transfer” resistance atthe electrode/electrolyte interface associated with redox reac-tions and sometimes used to interpret EIS measurements forEDLCs27,30 was absent in our simulations.Furthermore, Figure 3d shows −Zim as a function of Zre − Re
for the above three cases. It indicates that the Nyquist plots forcases 1−3 nearly collapsed on the same line regardless of changesin electrode conductivity σe. In other words, σe had no significanteffects on the Nyquist plots at low and medium frequencies.In addition, it is interesting to note that the diameter of the semi-circle in Figure 3 (corresponding to RAB = RB − RA in Figure 1)was equal to the bulk electrolyte resistance R∞ predicted by eq 7and equal to 0.105 Ω m2 in all three cases.
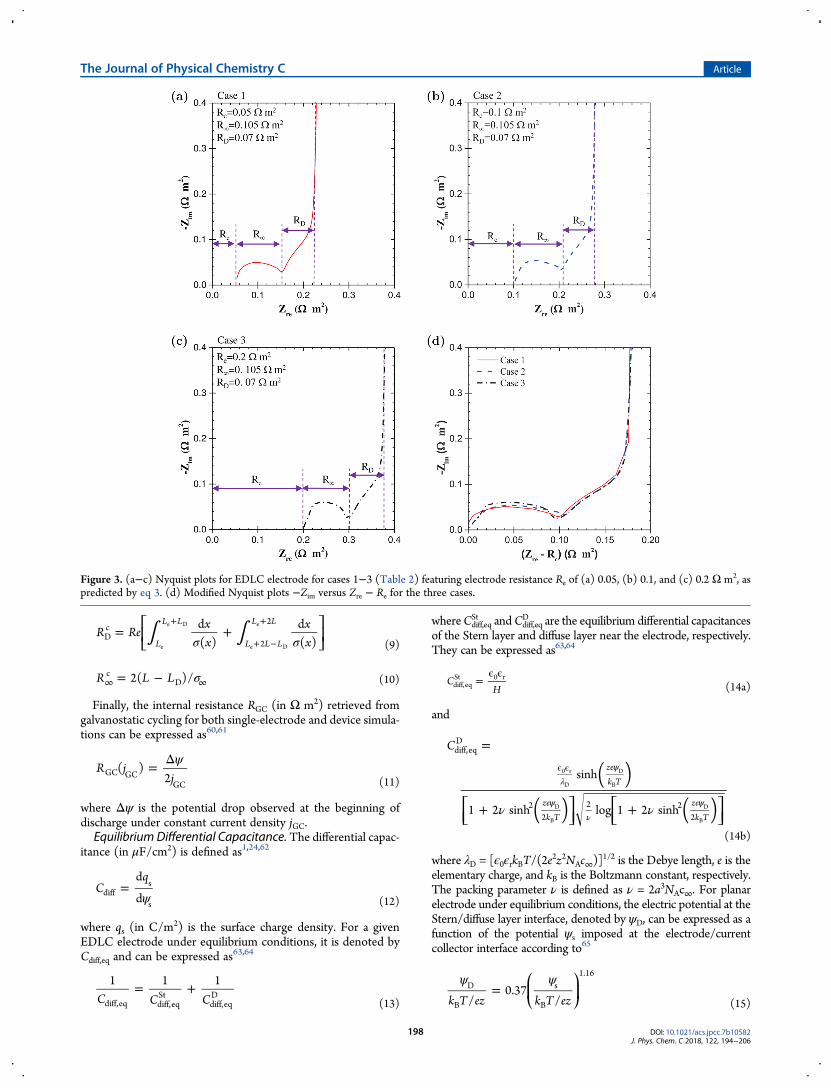
Electrolyte Resistances R∞ and RD. To further explore theeffect of electrolyte resistances R∞ and RD, Figure 4a−c shows theNyquist plots for EDLC electrodes for cases 4−6 featuring bulkion concentration c∞ of (a) 0.01, (b) 0.001, and (c) 0.0005mol/L,corresponding to bulk electrolyte resistance R∞ [eq 7] anddiffuse layer resistance RD [eq 6] of (a) 0.01 and 0.009, (b) 0.106and 0.07, and (c) 0.20 and 0.14 Ω m2, respectively. All otherparameters remained the same in these three cases. Figure 4a−cestablishs that the diameter of the semicircle RAB (Figure 1) wasequal to the bulk electrolyte resistance R∞ while the resistanceRBC corresponded to the diffuse layer resistance RD. In fact, thesame observations could be retrospectively made in Figure 3.
Figure 4. (a−c) Nyquist plots for EDLC electrodes for cases 4−6 (Table 2) featuring bulk electrolyte resistance R∞ of (a) 0.011, (b) 0.106, and(c) 0.212 Ω m2, as predicted by eq 7. (d) Dimensionless Nyquist plots −Zim/R∞ versus (Zre − Re)/R∞ for the three cases.
The Journal of Physical Chemistry C Article
DOI: 10.1021/acs.jpcc.7b10582J. Phys. Chem. C 2018, 122, 194−206
199
In addition, Figure 4d shows the dimensionless Nyquist plot−Zim/R∞ versus (Zre − Re)/R∞ for the three cases. It indicatesthat, unlike σe, the electrolyte concentration c∞ had a significantimpact on the slope kBC (Figure 1) corresponding to inter-mediate EIS frequencies.Moreover, Figure 5a shows the dimensionless Nyquist plot
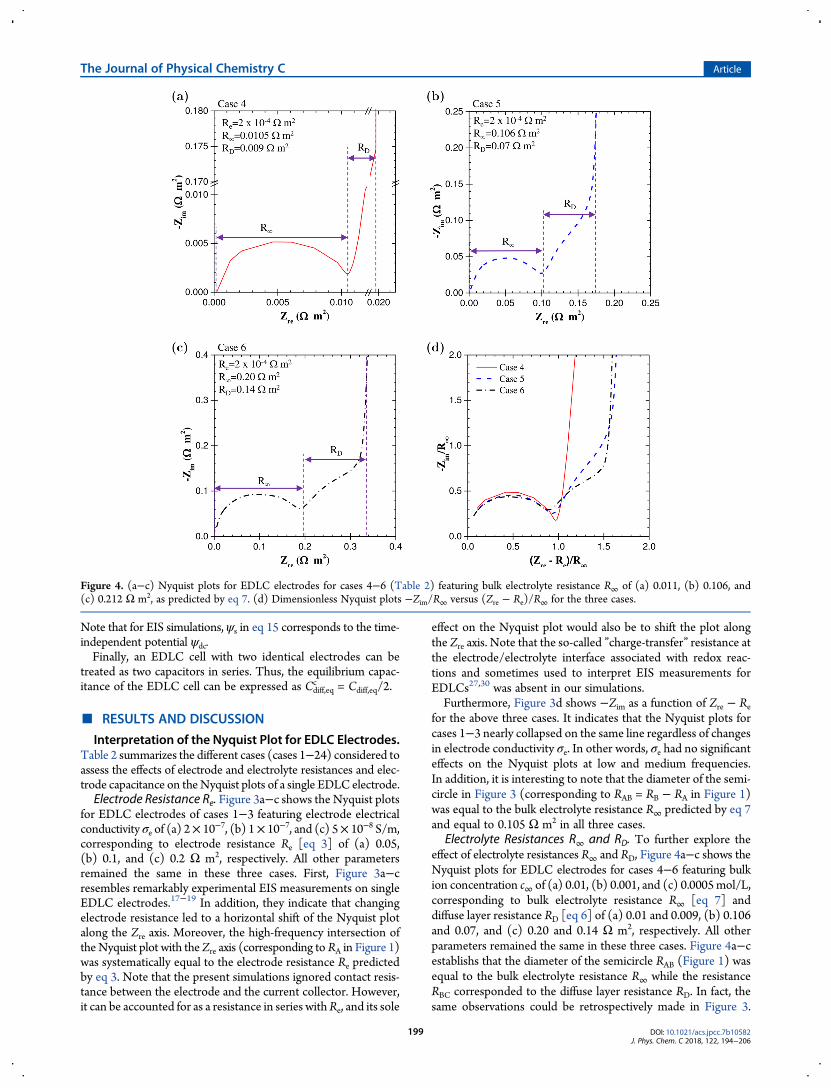
−Zim/R∞ as a function of (Zre− Re)/R∞ for intermediate frequen-cies ranging between f C and f B for cases 6, 9, and 21 in Table 2.
The frequency f B corresponded to the intersection between thesemicircle and the nonvertical line (point B in Figure 1) whilefrequency f C was such that f C ≈ f B/20 (point C in Figure 1).These three cases were chosen arbitrarily for illustration pur-poses. The slope kBC was retrieved by least-squares fittingbetween f B and f C for cases 1−23 of Table 2 with coefficient ofdetermination R2 systematically larger than 0.95. Figure 5b showsthe slope kBC as a function of the ratio τD/τRC, for the 23 cases
Figure 5. (a) Nonvertical line at intermediate frequencies for cases 6, 9, and 21 (Table 2) for illustration. (b) Slope of the nonvertical line as a function ofthe time scale ratio τD/τRC.
Figure 6. (a and b) Nyquist plots for (a) case 16 and (b) case 18 (Table 2) and (c and d) corresponding imaginary part of the impedance −Zim as afunction of 1/f for low frequencies. Similar results were obtained for all other cases.
The Journal of Physical Chemistry C Article
DOI: 10.1021/acs.jpcc.7b10582J. Phys. Chem. C 2018, 122, 194−206
200
considered. Here, τD = L2/D is the time scale for ion diffusion inthe electrolyte and τRC = (R∞ +RD)Cdiff,eq is the RC time constantfor the electrolyte domain. Here, only the electrolyte domain wasconsidered due to the fact that σe or Re did not affect the slopekBC (Figure 3). Figure 5b indicates that the slope kBC was onlya function of the ratio τD/τRC, regardless of the different param-eters considered. In addition, the slope kBC increased withincreasing characteristic time ratio τD/τRC. This can be attributedto the fact that the behavior of the electrolyte deviated from anideal equivalent RC circuit consisting of a resistor R∞ + RD in
series with a capacitorCdiff,eq represented by a vertical line startingfrom point C (Figure 1). Deviation from such ideal equivalentRC circuit was due to ion diffusion in the electrolyte featuringtime scale of τD = L2/D. In other words, the slope of the non-vertical line BC (Figure 1) can be used to indicate whether thecharging process was controlled by EDL formation (large slope)or limited by ion diffusion in the electrolyte (small slope)
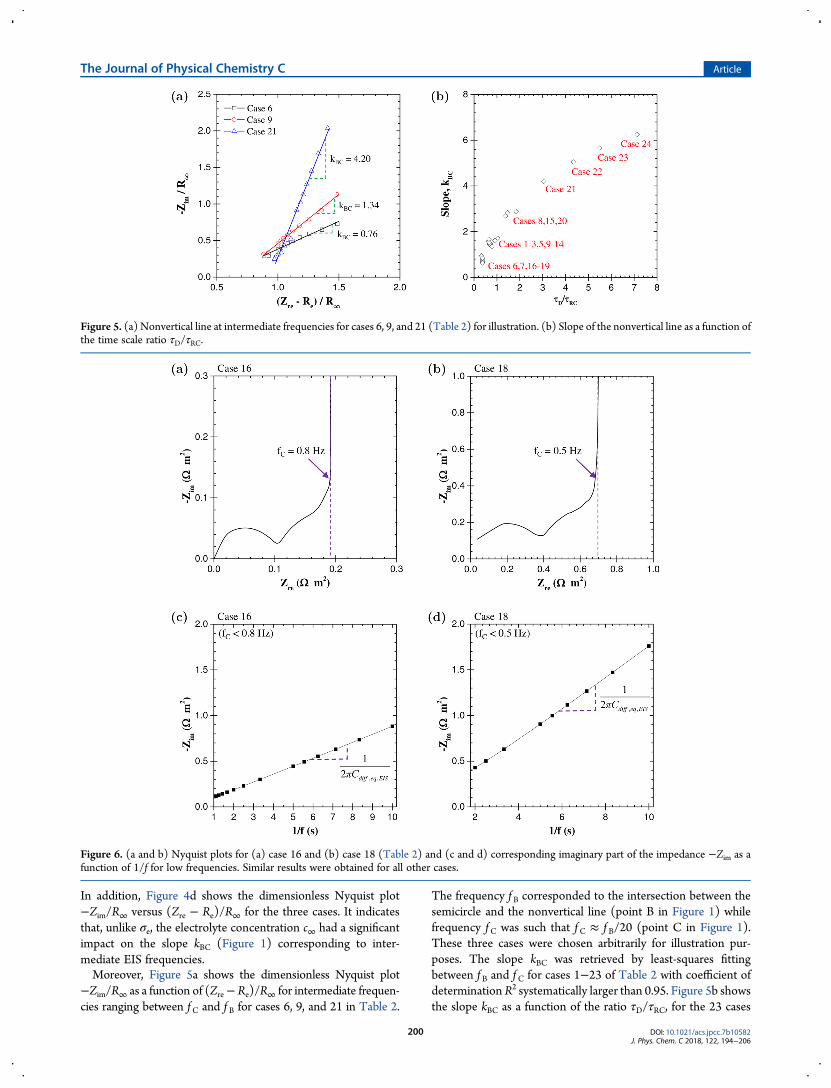
Differential Capacitance Cdiff,eq. To retrieve the equilibriumdifferential capacitance from EIS simulations, one needs to firstdetermine the low-frequency regime corresponding to the verti-
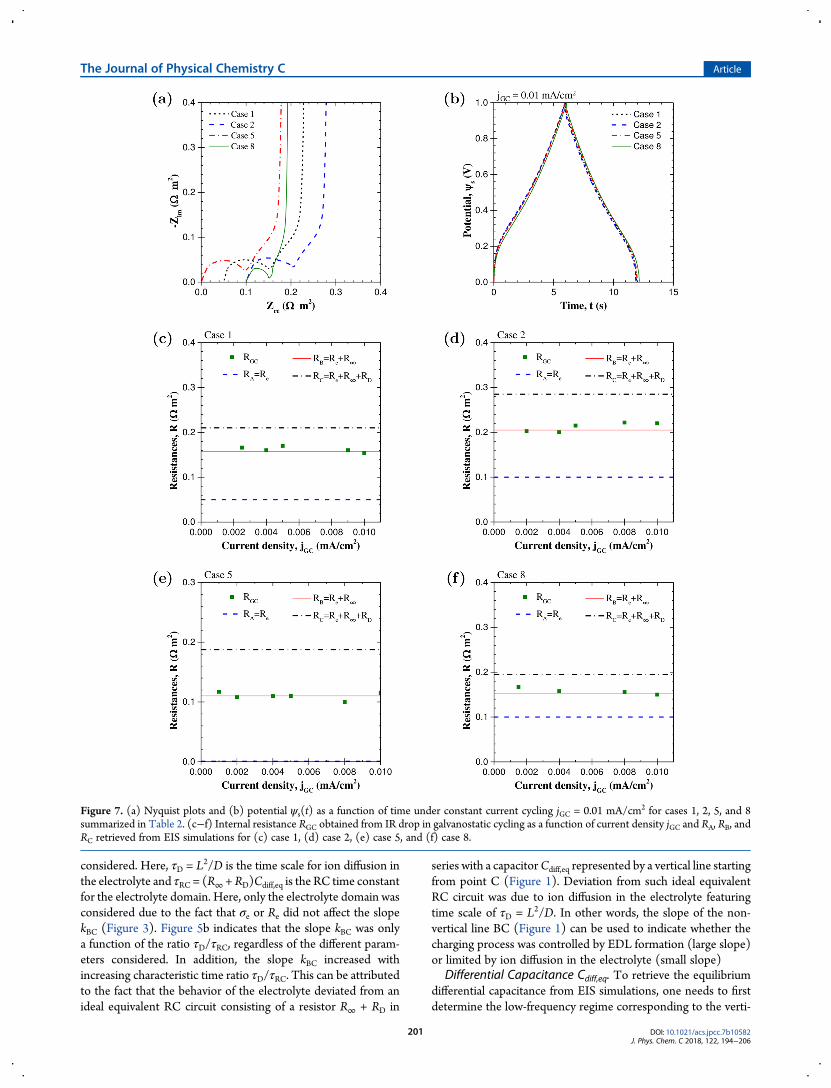
Figure 7. (a) Nyquist plots and (b) potential ψs(t) as a function of time under constant current cycling jGC = 0.01 mA/cm2 for cases 1, 2, 5, and 8summarized in Table 2. (c−f) Internal resistance RGC obtained from IR drop in galvanostatic cycling as a function of current density jGC and RA, RB, andRC retrieved from EIS simulations for (c) case 1, (d) case 2, (e) case 5, and (f) case 8.
The Journal of Physical Chemistry C Article
DOI: 10.1021/acs.jpcc.7b10582J. Phys. Chem. C 2018, 122, 194−206
201
cal line in the Nyquist plot. Figure 6a,b show the Nyquist plots of(a) case 16 and (b) case 18 (Table 2) for illustration purposes.Here, the vertical line indicates that the electrode can be approxi-mated by a simplified RC circuit with a resistor in series with acapacitor.16 Thus, the imaginary part Zim of the complex imped-ance Z can be expressed as Zim = − 1/(2πCdiff,eq,EIS f) whereCdiff,eq,EIS is the equilibrium differential capacitance retrieved fromEIS simulations. Figure 6c,d shows −Zim as a function of 1/f for(c) Case 16 and (d) Case 18, respectively. They confirm that−Zim was proportional to 1/f with the coefficient of propor-tionality corresponding to 1/2π Cdiff,eq,EIS. Similar results wereobtained for all 24 cases considered. In fact, Table 2 compares theequilibrium differential capacitance Cdiff,eq,EIS retrieved from lowfrequency EIS simulations, as illustrated in Figure 6c,d, andCdiff,eq
predicted by eq 13 for all 24 cases considered. The relativedifference between the two approaches e = |Cdiff,eq,EIS − Cdiff,eq|/Cdiff,eq was less than 5% for all cases considered, confirming thevalidity of the retrieval method.Comparison between Resistances from EIS and from
Galvanostatic Cycling. Furthermore, Figure 7a,b shows theNyquist plots and the potential ψs(t) as a function of time undergalvanostatic cycling for jGC = 0.01 mA/cm2 for cases 1, 2, 5, and8 (Table 2). These four cases were chosen to study the effect ofRe and R∞ on the internal resistance such that (i) cases 1, 2, and 5featured the same bulk electrolyte resistance R∞; (ii) cases 2 and
8 had the same electrode resistance Re; and (iii) the sum Re + R∞was the same for cases 1 and 8. Moreover, Figure 7c−f shows theinternal resistance RGC retrieved from the “IR drop” estimatedvisually in galvanostatic cycling [eq 11] as well as RA = Re, RB =Re + R∞, and RC = Re + R∞ + RD retrieved from the Nyquistplot (Figure 1) as functions of imposed current density jGC inthe range of 10−3−0.01 mA/cm2 for (c) case 1 and (d) case 2,(e) case 5, and (f) case 8. Figure 7 indicates that the internal resis-tance RGC was nearly independent of the imposed current densityjGC. Moreover, RGC agreed well with the sum of the electrodeand electrolyte resistances, i.e., RGC = Re + R∞, for all four cases.The same conclusion was drawn from all 24 cases considered.
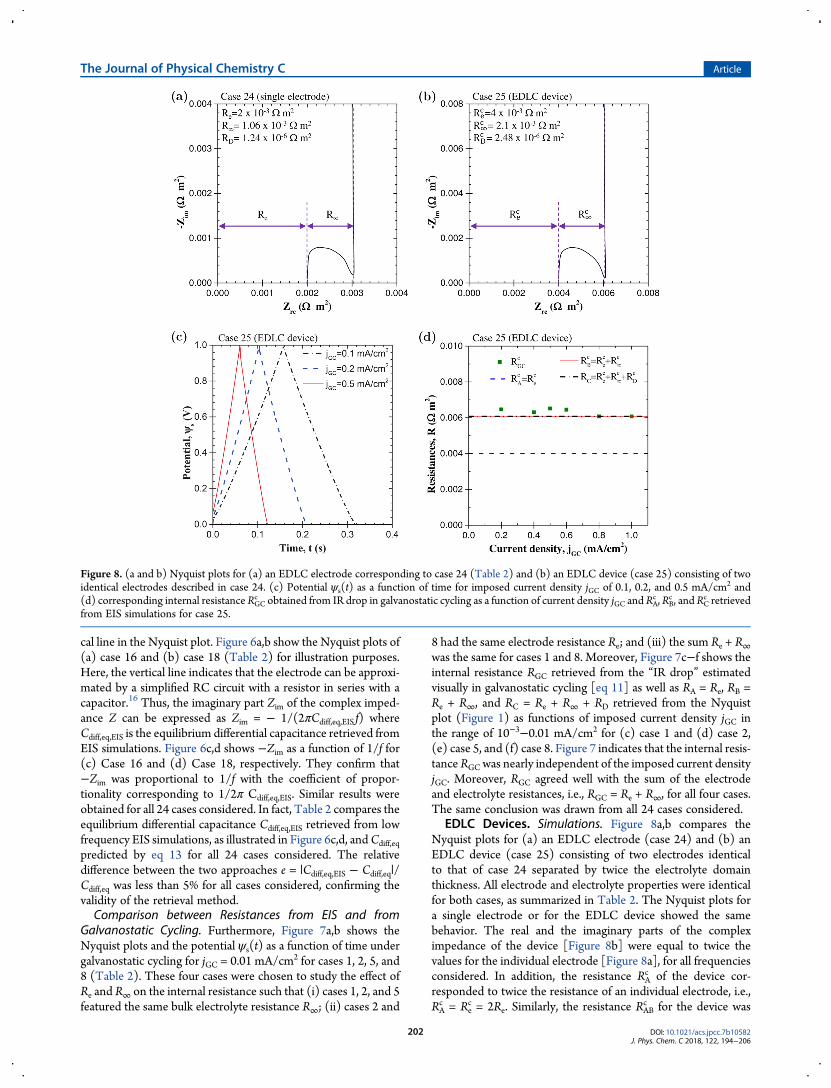
EDLC Devices. Simulations. Figure 8a,b compares theNyquist plots for (a) an EDLC electrode (case 24) and (b) anEDLC device (case 25) consisting of two electrodes identicalto that of case 24 separated by twice the electrolyte domainthickness. All electrode and electrolyte properties were identicalfor both cases, as summarized in Table 2. The Nyquist plots fora single electrode or for the EDLC device showed the samebehavior. The real and the imaginary parts of the compleximpedance of the device [Figure 8b] were equal to twice thevalues for the individual electrode [Figure 8a], for all frequenciesconsidered. In addition, the resistance RA
c of the device cor-responded to twice the resistance of an individual electrode, i.e.,RAc = Re
c = 2Re. Similarly, the resistance RABc for the device was
Figure 8. (a and b) Nyquist plots for (a) an EDLC electrode corresponding to case 24 (Table 2) and (b) an EDLC device (case 25) consisting of twoidentical electrodes described in case 24. (c) Potential ψs(t) as a function of time for imposed current density jGC of 0.1, 0.2, and 0.5 mA/cm2 and(d) corresponding internal resistance RGC
c obtained from IR drop in galvanostatic cycling as a function of current density jGC and RAc , RB
c , and RCc retrieved
from EIS simulations for case 25.
The Journal of Physical Chemistry C Article
DOI: 10.1021/acs.jpcc.7b10582J. Phys. Chem. C 2018, 122, 194−206
202
such that RABc = R∞
c = 2R∞. In addition, the overlap of points Band C in both cases 24 and 25 was due to the small diffuse layerresistance RD compared with R∞. Indeed, the diffuse layer wasthin compared with the relatively thick electrolyte domain due tothe large ion concentration (c∞ = 1 mol/L).Moreover, Figure 8 also shows (c) the potential ψs(t) as a
function of time under galvanostatic cycling for jGC = 0.01mA/cm2
and (d) the internal resistance RGC retrieved from the “IR drop”in galvanostatic cycling [Figure 8c] as well as RA, RB, and RC
retrieved from theNyquist plot [Figure 8b] as functions of imposedcurrent density jGC (0.1−1 mA/cm2) for case 25. Figure 8d indi-cates that, here also, RGC was in good agreement with resistanceRBc = Re
c + R∞c for simulations of two-electrode devices. Moreover,
Table 2 compares the equilibrium differential capacitancesCdiff,eq,EIS retrieved from EIS and Cdiff,eq predicted by eq 13.The relative difference e = |Cdiff,eq,EIS−Cdiff,eq|/Cdiff,eq was less than5% for both cases considered. Overall, this section confirmed thatall interpretations of the Nyquist plots for single electrodes alsoapply to EDLC devices. In addition, the interpretations discussedpreviously should also be valid for EDLC devices with asym-metric electrolyte and/or nonidentical electrodes. Then, the resis-tances RA, RAB, and RBC (Figure 1) would correspond to (i) thesum of the resistances of the positive and negative electrodes,(ii) the bulk electrolyte resistance, and (iii) the sum of theresistance of the two different diffuse layers near the positive andnegative electrodes, respectively.
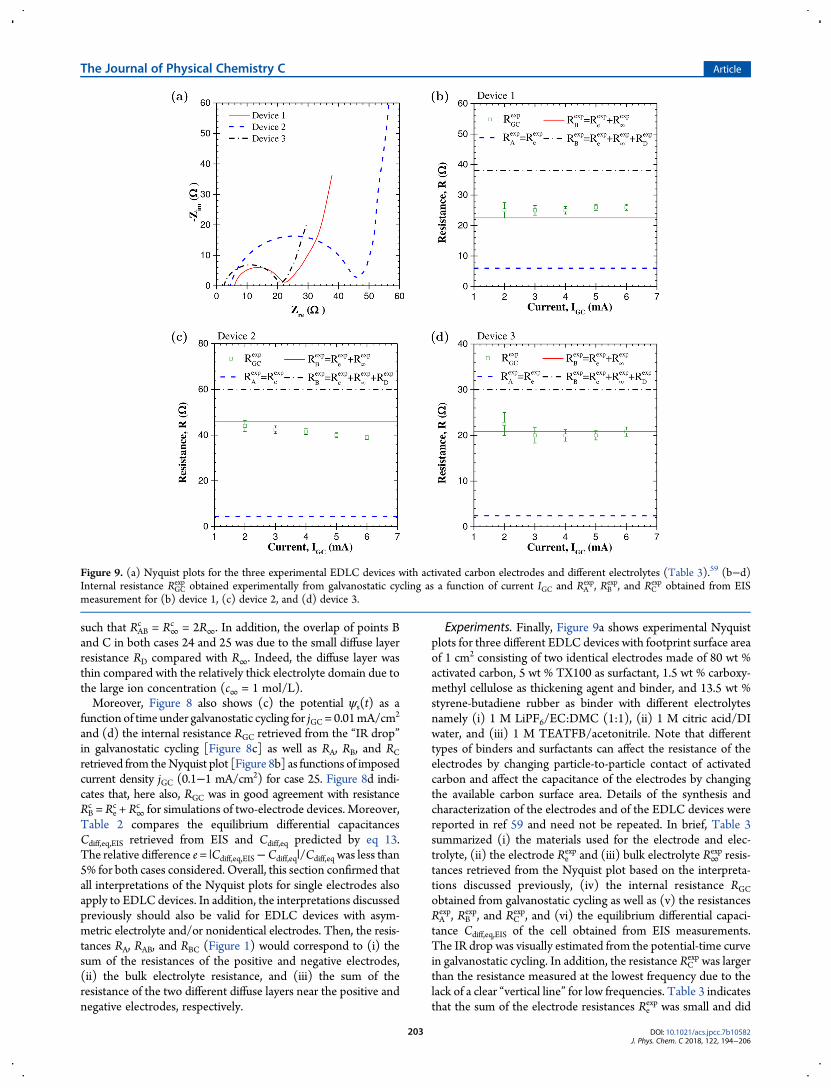
Experiments. Finally, Figure 9a shows experimental Nyquistplots for three different EDLC devices with footprint surface areaof 1 cm2 consisting of two identical electrodes made of 80 wt %activated carbon, 5 wt % TX100 as surfactant, 1.5 wt % carboxy-methyl cellulose as thickening agent and binder, and 13.5 wt %styrene-butadiene rubber as binder with different electrolytesnamely (i) 1 M LiPF6/EC:DMC (1:1), (ii) 1 M citric acid/DIwater, and (iii) 1 M TEATFB/acetonitrile. Note that differenttypes of binders and surfactants can affect the resistance of theelectrodes by changing particle-to-particle contact of activatedcarbon and affect the capacitance of the electrodes by changingthe available carbon surface area. Details of the synthesis andcharacterization of the electrodes and of the EDLC devices werereported in ref 59 and need not be repeated. In brief, Table 3summarized (i) the materials used for the electrode and elec-trolyte, (ii) the electrode Re
exp and (iii) bulk electrolyte R∞exp resis-
tances retrieved from the Nyquist plot based on the interpreta-tions discussed previously, (iv) the internal resistance RGC
obtained from galvanostatic cycling as well as (v) the resistancesRAexp, RB
exp, and RCexp, and (vi) the equilibrium differential capaci-
tance Cdiff,eq,EIS of the cell obtained from EIS measurements.The IR drop was visually estimated from the potential-time curvein galvanostatic cycling. In addition, the resistance RC
exp was largerthan the resistance measured at the lowest frequency due to thelack of a clear “vertical line” for low frequencies. Table 3 indicatesthat the sum of the electrode resistances Re
exp was small and did
Figure 9. (a) Nyquist plots for the three experimental EDLC devices with activated carbon electrodes and different electrolytes (Table 3).59 (b−d)Internal resistance RGC
exp obtained experimentally from galvanostatic cycling as a function of current IGC and RAexp, RB
exp, and RCexp obtained from EIS
measurement for (b) device 1, (c) device 2, and (d) device 3.
The Journal of Physical Chemistry C Article
DOI: 10.1021/acs.jpcc.7b10582J. Phys. Chem. C 2018, 122, 194−206
203
not vary significantly among the three devices. This is consistentwith the fact that the electrodes of all three devices were nearlyidentical and made of activated carbon with a CMC binder.59
In addition, the electrode resistance Reexp was small compared
with that of the bulk electrolyte resistance R∞exp, which con-
tributed the most to the internal resistance. Moreover, the bulkelectrolyte resistance R∞
exp for device 2 was much larger than thatfor devices 1 and 3. This can be attributed to the fact that citricacid is a weak electrolyte featuring low ionic conductivity.59
Furthermore, Figure 9b−d shows the internal resistance RGCretrieved from “IR drop” in galvanostatic cycling [eq 11] as afunction of the imposed current IGC (2−6 mA) as well as RA
exp,RBexp, and RC
exp retrieved from Nyquist plots for (b) device 1,(c) device 2, and (d) device 3. Figure 9 indicates that here also,RGC was nearly independent of the imposed current IGC and ingood agreement with RB
exp = Reexp + R∞
exp. These results were con-sistent with numerical simulations discussed previously.Note that the present study considered only planar electrodes
while practical EDLCs consist of porous electrodes. First, oursimulations for planar electrodes could qualitatively reproduceexperimental Nyquist plots for EDLCs with porous electrodes.This indicates that the model accounts for the key physicalphenomena in EDLCs. However, accounting for porous elec-trodes is beneficial (i) to quantitatively reproduce experimentalresults and (ii) to investigate the effects of electrode architec-ture. The physical model discussed in the present study can beextended to porous electrodes in three-dimensional simulationsbut at significant computational cost.66 Alternatively, the presentstudy could be used to develop volume-averaged continuummodels for porous electrodes accounting for the effects of EDLformation. Such models could identify the optimum operatingconditions that maximize the capacitance and minimize theresistance of existing EDLC devices with porous electrodes. Notethat for all cases, the continuummodel is valid for pore or particlesize larger than 5 nm, where the electrical and transport prop-erties can be defined based on continuum theory. For pores lessthan 5 nm in diameter, the continuum model needs to be couplewith (i) quantum mechanical models, such as density functionaltheory (DFT), and/or (ii) atomistic models, such as MD simula-tions for quantitative predictions. However, this falls outside thescope of the present study.
■ CONCLUSIONThis study presented unequivocal physical interpretations ofNyquist plots from electrochemical impedance spectroscopy(EIS) for EDLC electrodes and devices without using an equiv-alent RC circuit. The Nyquist plots presenting the imaginary andreal parts of the complex impedance of individual EDLC elec-trodes and devices were numerically reproduced based on themodified Poisson−Nernst−Planck model and closely resembledexperimental measurements. This study established that the elec-trode resistance, bulk electrolyte resistance, diffuse layer resis-
tance, and equilibrium differential capacitance can be retrieveddirectly from Nyquist plots. In addition, the internal resistanceretrieved from the sum of electrode and bulk electrolyte resis-tances in EIS simulations showed good agreement with theinternal resistance retrieved from the so-called “IR drop” in gal-vanostatic cycling. Finally, the above results and interpretationswere confirmed experimentally for EDLC devices with electro-des made of activated carbon and various electrolytes.
■ ASSOCIATED CONTENT*S Supporting InformationThe Supporting Information is available free of charge on theACS Publications website at DOI: 10.1021/acs.jpcc.7b10582.
Nomenclature of the variables used, governing equations,and initial and boundary conditions of the model. (ZIP)
■ AUTHOR INFORMATIONCorresponding Author*E-mail: [email protected]. Phone: +1 (310) 206-5598. Fax:+1 (310) 206-2302.ORCIDBruce Dunn: 0000-0001-5669-4740Laurent Pilon: 0000-0001-9459-8207NotesThe authors declare no competing financial interest.
■ ACKNOWLEDGMENTSThe computation for this study was performed on the Hoffman2cluster hosted by the Academic Technology Services (ATS) atthe University of California, Los Angeles, U.S.A. This material isalso based upon work supported, in part, by the ChinaScholarship Council (CSC). J.L. and B.D. greatly appreciatethe support of this work by the Office of Naval Research.
■ REFERENCES(1) Conway, B. E. Electrochemical Supercapacitors: Scientific Funda-mentals and Technological Applications; Kluwer Academic/PlenumPublishers: New York, 1999.(2) Kotz, R.; Carlen, M. Principles and Applications of ElectrochemicalCapacitors. Electrochim. Acta 2000, 45, 2483−2498.(3) Taberna, P. L.; Simon, P.; Fauvarque, J. F. ElectrochemicalCharacteristics and Impedance Spectroscopy Studies of Carbon-CarbonSupercapacitors. J. Electrochem. Soc. 2003, 150, 292−300.(4) Segalini, J.; Daffos, B.; Taberna, P. L.; Gogotsi, Y.; Simon, P.Qualitative Electrochemical Impedance Spectroscopy Study of IonTransport into Sub-nanometer Carbon Pores in ElectrochemicalDouble Layer Capacitor Electrodes. Electrochim. Acta 2010, 55,7489−7494.(5) Miller, J. R.; Outlaw, R. A.; Holloway, B. C. Graphene Double-Layer Capacitor with AC Line-Filtering Performance. Science 2010, 329,1637−1639.
Table 3. Electrode Materials and Electrolyte Species, Operating Conditions, Resistance, and Capacitance Values of Devices inExperiments59
potentialwindow current resistances capacitance
ψmin ψmax IGC Reexp R∞
exp RGCexp RA
exp RBexp RC
exp Cdiff,eq,EIS
device electrode electrolyte (V) (V) (mA) (Ω) (Ω) (Ω) (Ω) (Ω) (Ω) (mF)
1 activated carbon 1 M LiPF6 in EC:DMC (1:1) 0 1 2−6 6.0 16.5 22.5−27.5 6.0 22.5 >38.0 102.22 activated carbon 1 M citric acid in DI water 0 0.8 2−6 4.3 41.5 38.0−46.5 4.3 45.8 >60.0 117.73 activated carbon 1 M TEATFB in acetonitrile 0 1 2−6 2.4 18.4 18.3−25.0 2.4 20.8 >30.0 91.4
The Journal of Physical Chemistry C Article
DOI: 10.1021/acs.jpcc.7b10582J. Phys. Chem. C 2018, 122, 194−206
204
(6) Zhu, Y.; et al. Carbon-Based Supercapacitors Produced byActivation of Graphene. Science 2011, 332, 1537−1541.(7) Pech, M.; Brunet, D.; Durou, P.; Huang, H.; Mochalin, V.; Gogotsi,Y.; Taberna, P.; Simon, P. Ultrahigh-Power Micrometre-Sized Super-capacitors Based on Onion-like Carbon. Nat. Nanotechnol. 2010, 5,651−654.(8) Itoi, H.; Nishihara, H.; Kogure, T.; Kyotani, T. Three-Dimensionally Arrayed and Mutually Connected 1.2-nm Nanoporesfor High-performance Electric Double Layer. J. Am. Chem. Soc. 2011,133, 1165−1167.(9) Nilson, R. H.; Brumbach, M. T.; Bunker, B. C. Modeling theElectrochemical Impedance Spectra of Electroactive PseudocapacitorMaterials. J. Electrochem. Soc. 2011, 158, 678−688.(10) Zhi, M.; Yang, F.; Meng, F.; Li, M.; Manivannan, A.; Wu, N.Effects of Pore Structure on Performance of an Activated-carbonSupercapacitor Electrode Recycled from Scrap Waste Tires. ACSSustainable Chem. Eng. 2014, 2, 1592−1598.(11) Levi, M. D.; Aurbach, D. Simultaneous Measurements andModeling of the Electrochemical Impedance and the CyclicVoltammetric Characteristics of Graphite Electrodes Doped withLithium. J. Phys. Chem. B 1997, 101, 4630−4640.(12) Mantia, F. L.; Vetter, J.; Novak, P. Impedance Spectroscopy onPorous Materials: A General Model and Application to GraphiteElectrodes of Lithium-Ion Batteries. Electrochim. Acta 2008, 53, 4109−4121.(13) Atebamba, J. M.; Moskon, J.; Pejovnik, S.; Gaberscek, M. On theinterpretation ofMeasured Impedance Spectra of insertion Cathodes forLithium-Ion Batteries. J. Electrochem. Soc. 2010, 157, 1218−1228.(14) Murbach, M. D.; Schwartz, D. T. Extending Newman’s Pseudo-Two-Dimensional Lithium-Ion Battery Impedance Simulation Ap-proach to include the Nonlinear Harmonic Response. J. Electrochem. Soc.2017, 164, E3311−E3320.(15) He, Z.; Mansfeld, F. Exploring the Use of ElectrochemicalImpedance Spectroscopy (EIS) in Microbial Fuel Cell Studies. EnergyEnviron. Sci. 2009, 2, 215−219.(16) Yuan, X. Z.; Song, C.; Wang, H.; Zhang, J. ElectrochemicalImpedance Spectroscopy in PEM Fuel Cells: Fundamentals andApplications; Springer-Verlag: London, 2010.(17) Wang, Q.; Yan, J.; Wang, Y.; Wei, t.; Zhang, M.; Jing, X.; Fan, Z.Three-Dimensional Flower-like and Hierarchical Porous CarbonMaterials as High-Rate Performance Electrodes for Supercapacitors.Carbon 2014, 67, 119−127.(18) Farma, R.; Deraman, M.; Awitdrus, A.; Talib, I.; Taer, E.; Basri, N.;Manjunatha, J.; Ishak, M.; Dollah, B.; Hashmi, S. Preparation of HighlyPorous Binderless Activated Carbon Electrodes from Fibres of Oil PalmEmpty Fruit Bunches for Application in Supercapacitors. Bioresour.Technol. 2013, 132, 254−261.(19) inal, I. I. G.; Holmes, S. M.; Banford, A.; Aktas, Z. the Performanceof Supercapacitor Electrodes Developed from Chemically ActivatedCarbon Produced from Waste Tea. Appl. Surf. Sci. 2015, 357, 696−703.(20) Li, W.; He, Q.; Pei, C.; Hou, B. Experimental and TheoreticalInvestigation of the Adsorption Behaviour of New Triazole DerivativesAs Inhibitors for Mild Steel Corrosion in Acid Media. Electrochim. Acta2007, 52, 6386−6394.(21) Maocheng, Y.; Jin, X.; Libao, Y.; Tangqing, W.; Cheng, S.; Wei, K.EIS Analysis on Stress Corrosion Initiation of Pipeline Steel UnderDisbonded Coating in Near-neutral pH Simulated Soil Electrolyte.Corros. Sci. 2016, 110, 23−34.(22)Wang, H.; Shi, L.; Yan, T.; Zhang, J.; Zhong, Q.; Zhang, D. Designof Graphene-Coated Hollow Mesoporous Carbon Spheres as HighPerformance Electrodes for Capacitive Deionization. J. Mater. Chem. A2014, 2, 4739−4750.(23) Wang, H.; Zhang, D.; Yan, T.; Wen, X.; Zhang, J.; Shi, L.; Zhong,Q. Three-Dimensional Macroporous Graphene Architectures as HighPerformance Electrodes for Capacitive Deionization. J. Mater. Chem. A2013, 1, 11778−11789.(24) Bard, A. J.; Faulkner, L. R.; Leddy, J.; Zoski, C. G. ElectrochemicalMethods: Fundamentals and Applications; John Wiley & Sons: Hoboken,NJ, 1980; Vol. 2.
(25) Lasia, A. InModern Aspects of Electrochemistry, No. 32; Conway, B.E., Bockris, J. O. M., White, R. E., Eds.; Kluwer Academic Publishers:New York, 2002; Chapter 2, pp 143−248.(26) Orazem, M. E.; Tribollet, B. Electrochemical Impedance Spectros-copy; John Wiley & Sons: Hoboken, NJ, 2008.(27) Yang, i.; Kim, S.-G.; Kwon, S. H.; Kim, M.-S.; Jung, J. C.Relationships Between Pore Size and Charge Transfer Resistance ofCarbon Aerogels for Organic Electric Double-layer Capacitor Electro-des. Electrochim. Acta 2017, 223, 21−30.(28) Coromina, H. M.; Adeniran, B.; Mokaya, R.; Walsh, D. A.Bridging the Performance Gap between Electric Double-LayerCapacitors and Batteries with High-Energy/High-Power CarbonNanotube-Based Electrodes. J. Mater. Chem. A 2016, 4, 14586−14594.(29) Yoo, H. D.; Jang, J. H.; Ryu, J. H.; Park, Y.; Oh, S. M. ImpedanceAnalysis of Porous Carbon Electrodes to Predict Rate Capability ofElectric Double-Layer Capacitors. J. Power Sources 2014, 267, 411−420.(30) Lei, C.; Markoulidis, F.; Ashitaka, Z.; Lekakou, C. Reduction ofPorous Carbon/Al Contact Resistance for an Electric Double-LayerCapacitor (EDLC). Electrochim. Acta 2013, 92, 183−187.(31) Fang, B.; Binder, L. A Modified Activated Carbon Aerogel forHigh-Energy Storage in Electric Double Layers. J. Power Sources 2006,163, 616−622.(32) An, K. H.; Kim, W. S.; Park, Y. S.; Moon, J.-M.; Bae, D. J.; Lim, S.C.; Lee, Y. S.; Lee, Y. H. Electrochemical Properties of High-PowerSupercapacitors Using Single-Walled Carbon Nanotube Electrodes.Adv. Funct. Mater. 2001, 11, 387−392.(33) Arulepp, M.; Permann, L.; LEIS, J.; Perkson, A.; Rumma, K.;Janes, A.; Lust, E. influence of the Solvent Properties on theCharacteristics of a Double Layer Capacitor. J. Power Sources 2004,133, 320−328.(34) Liu, C.-L.; Dong, W.-S.; Cao, G.-P.; Song, J.-R.; Liu, L.; Yang, Y.-S.Influence of KOH Followed By Oxidation Pretreatment on theElectrochemical Performance of Phenolic Based Activated CarbonFibers. J. Electroanal. Chem. 2007, 611, 225−231.(35) Gamby, J.; Taberna, P.; Simon, P.; Fauvarque, J.; Chesneau, M.Studies and Characterisations of Various Activated Carbons used forCarbon/Carbon Supercapacitors. J. Power Sources 2001, 101, 109−116.(36) Portet, C.; Yushin, G.; Gogotsi, Y. Electrochemical Performanceof Carbon Onions, Nanodiamonds, Carbon Black and MultiwalledNanotubes in Electrical Double Layer Capacitors. Carbon 2007, 45,2511−2518.(37) Lufrano, F.; Staiti, P.; Minutoli, M. Evaluation of Nafion BasedDouble Layer Capacitors By Electrochemical Impedance Spectroscopy.J. Power Sources 2003, 124, 314−320.(38) Nian, Y.-R.; Teng, H. Influence of Surface Oxides on theImpedance Behavior of Carbon-based Electrochemical Capacitors. J.Electroanal. Chem. 2003, 540, 119−127.(39) Kang, J.; Jayaram, S. H.; Rawlins, J.; Wen, J. Characterization ofThermal Behaviors of Electrochemical Double Layer Capacitors(EDLCs) with Aqueous and Organic Electrolytes. Electrochim. Acta2014, 144, 200−210.(40) Kang, J.; Atashin, S.; Jayaram, S. H.; Wen, J. Z. Frequency andTemperature Dependent Electrochemical Characteristics of Carbon-based ElectrodesMade of Commercialized Activated Carbon, Grapheneand Single-Walled Carbon Nanotube. Carbon 2017, 111, 338−349.(41) Conway, B. E.; Pell, W. G. Power Limitations of SupercapacitorOperation Associated with Resistance and Capacitance Distribution inPorous Electrode Devices. J. Power Sources 2002, 105, 169−181.(42) Yoon, S.; Jang, J. H.; Ka, B. H.; Oh, S. M. Complex CapacitanceAnalysis on Rate Capability of Electric-Double Layer Capacitor (EDLC)Electrodes of Different Thickness. Electrochim. Acta 2005, 50, 2255−2262.(43) Bohlen, O.; Kowal, J.; Sauer, D. Ageing Behaviour ofElectrochemical Double Layer Capacitors: Part I. Experimental Studyand Ageing Model. J. Power Sources 2007, 172, 468−475.(44) Yoon, S.; Lee, C. W.; Oh, S. M. Characterization of EquivalentSeries Resistance of Electric Double-Layer Capacitor Electrodes UsingTransient Analysis. J. Power Sources 2010, 195, 4391−4399.
The Journal of Physical Chemistry C Article
DOI: 10.1021/acs.jpcc.7b10582J. Phys. Chem. C 2018, 122, 194−206
205
(45) Kaus, M.; Kowal, J.; Sauer, D. U. Modelling the Effects of ChargeRedistribution During Self-Discharge of Supercapacitors. Electrochim.Acta 2010, 55, 7516−7523.(46) Spyker, R.; Nelms, R. Classical Equivalent Circuit Parameters for aDouble-layer Capacitor. IEEE Trans. Aerosp. Electron. Syst. 2000, 36,829−836.(47) Bazant, M. Z.; Thornton, K.; Ajdari, A. Diffuse-Charge Dynamicsin Electrochemical Systems. Phys. Rev. E 2004, 70, 021506.(48) Olesen, L. H.; Bazant, M. Z.; Bruus, H. Strongly NonlinearDynamics of Electrolytes in Large AC Voltages. Phys. Rev. E 2010, 82,011501.(49) Chu, K. T.; Bazant, M. Z. Nonlinear Electrochemical Relaxationaround Conductors. Phys. Rev. E 2006, 74, 011501.(50) Cahan, B. D.; Chen, C.-T. the Nature of the Passive Film on IronII. A-C Impedance Studies. J. Electrochem. Soc. 1982, 129, 474−480.(51) Shi, L.; Crow, M. Comparison of ultracapacitor electric circuitmodels. Power and Energy Society General Meeting-Conversion andDelivery of Electrical Energy in the 21st Century, 2008 IEEE. 2008; pp1−6.(52) Barthel, J. M.; Krienke, H.; Kunz, W. Physical Chemistry ofElectrolyte Solutions: Modern Aspects; Springer Science & BusinessMedia: Berlin, 1998; Vol. 5.(53)Wang, H.; Thiele, A.; Pilon, L. Simulations of Cyclic Voltammetryfor Electric Double Layers in Asymmetric Electrolytes: A GeneralizedModified Poisson-Nernst-Planck Model. J. Phys. Chem. C 2013, 117,18286−18297.(54) Masliyah, J. H.; Bhattacharjee, S. Electrokinetic and ColloidTransport Phenomena; John Wiley & Sons: Hoboken, NJ, 2006.(55) Wang, H.; Pilon, L. Intrinsic Limitations of ImpedanceMeasurements in Determining Electric Double Layer Capacitances.Electrochim. Acta 2012, 63, 55−63.(56) Wang, H.; Pilon, L. Mesoscale Modeling of Electric DoubleLayers with Three-Dimensional Ordered Structures. J. Power Sources2013, 221, 252−260.(57) Janz, G. J.; Tomkins, R. P. T. Nonaqueous Electrolytes Handbook;Academic Press: New York, 1972; Vol. I.(58) Woo, S. W.; Dokko, K.; Nakano, H.; Kanamura, K. Preparation ofThree Dimensionally Ordered Macroporous Carbon with MesoporousWalls for Electric Double-Layer Capacitors. J. Mater. Chem. 2008, 18,1674−1680.(59) Munteshari, O.; Lau, J.; Krishnan, A.; Dunn, B.; Pilon, L.Isothermal Calorimeter for Measurements of Time-Dependent HeatGeneration Rate in Individual Supercapacitor Electrodes. J. PowerSources 2018, 374, 257−268.(60) Burke, a.; Miller, M. Testing of Electrochemical Capacitors:Capacitance, Resistance, Energy Density, and Power Capability.Electrochim. Acta 2010, 55, 7538−7548.(61) Zhao, S.; Wu, F.; Yang, L.; Gao, L.; Burke, a. F. A MeasurementMethod for Determination of DC Internal Resistance of Batteries andSupercapacitors. Electrochem. Commun. 2010, 12, 242−245.(62) Bagotsky, V. S. Fundamentals of Electrochemistry, 2nd ed.; JohnWiley & Sons: Hoboken, NJ, 2006.(63) Kilic, M. S.; Bazant, M. Z.; Ajdari, A. Steric Effects in the Dynamicsof Electrolytes At Large Applied Voltages. II. Modified Poisson-Nernst-Planck Equations. Phys. Rev. E 2007, 75, 021503.(64) Kornyshev, A. A. Double-Layer in Ionic Liquids: ParadigmChange? J. Phys. Chem. B 2007, 111 (20), 5545−5557, DOI: 10.1021/jp067857o.(65) Wang, H.; Fang, J.; Pilon, L. Scaling Laws for Carbon-BasedElectric Double Layers. Electrochim. Acta 2013, 109, 316−321.(66) Mei, B.-A.; Pilon, L. Three-Dimensional Cyclic VoltammetrySimulations of EDLC Electrodes Made of Ordered Carbon Spheres.Electrochim. Acta 2017, 255, 168−178.
The Journal of Physical Chemistry C Article
DOI: 10.1021/acs.jpcc.7b10582J. Phys. Chem. C 2018, 122, 194−206
206