Embed Size (px)
Citation preview

HAL Id: hal-00781154https://hal.archives-ouvertes.fr/hal-00781154
Submitted on 25 Jan 2013
HAL is a multi-disciplinary open accessarchive for the deposit and dissemination of sci-entific research documents, whether they are pub-lished or not. The documents may come fromteaching and research institutions in France orabroad, or from public or private research centers.
L’archive ouverte pluridisciplinaire HAL, estdestinée au dépôt et à la diffusion de documentsscientifiques de niveau recherche, publiés ou non,émanant des établissements d’enseignement et derecherche français ou étrangers, des laboratoirespublics ou privés.
Physical layer DVB-SH performance prediction based onmutual information
Wilfried Chauvet, Jérôme Lacan, Caroline Amiot-Bazile, Frederic Lacoste,Benjamin Ros
To cite this version:Wilfried Chauvet, Jérôme Lacan, Caroline Amiot-Bazile, Frederic Lacoste, Benjamin Ros. Physicallayer DVB-SH performance prediction based on mutual information. International Journal of SatelliteCommunications and Networking, Wiley, 2012, vol. 30, pp. 193-211. <10.1002/sat.1011>. <hal-00781154>

This is an author-deposited version published in: http://oatao.univ-toulouse.fr/
Eprints ID: 8073
To link to this article: DOI: 10.1002/sat.1011
URL: http://dx.doi.org/10.1002/sat.1011
To cite this version: Chauvet, Wilfried and Lacan, Jérôme and Amiot-
Bazile, Caroline and Lacoste , Frédéric and Ros, Benjamin Physical layer
DVB-SH performance prediction based on mutual information. (2012)
International Journal of Satellite Communications and Networking, vol. 30
(n° 5). pp. 193-211. ISSN 1542-0973
Open Archive Toulouse Archive Ouverte (OATAO) OATAO is an open access repository that collects the work of Toulouse researchers and
makes it freely available over the web where possible.
Any correspondence concerning this service should be sent to the repository
administrator: [email protected]

Physical layer DVB-SH Performance Prediction Based on MutualInformation
W. Chauvet1, J. Lacan1,2∗, C. Amiot-Bazile3, F. Lacoste3 and B. Ros3
1TeSA,14-16, Port Saint-Etienne 31000 Toulouse (France) ,2ISAE, University of Toulouse, 10, avenue E. Belin, BP 54032 31055 Toulouse cedex 4
3CNES, 18 avenue E. Belin, 31401 Toulouse Cedex 9
SUMMARY
DVB-SH (Digital Video Broadcasting- Satellite Handled) is a hybrid satellite terrestrial broadcastingstandard dedicated to provide video or audio services for handheld terminals. On the satellite part, thisstandard can make use of interleaving mechanisms to mitigate the effects of the Land Mobile Satellite(LMS) channel. As result, these mechanisms enables the in-time distribution of a codeword over a durationranging from 100 ms to about 30 s, depending of their parameters. This mechanism significantly improvesthe error recovery performance of the code however, in the literature, a theoretical evaluation at systemlevel of this improvement is missing. Moreover, carrying out Monte-Carlo simulations implementing realdecoding processes on significant traveled distances is time prohibitive.We propose hereafter a prediction method compatible with fast simulations to quantitatively evaluate thesystem performance in function the Packet Error Rate (PER), Erroneous Second Ratio (ESR) and zappingtime. This method is based on the computation of the mutual information between emitted and receivedsymbols for QPSK modulation and turbo coding.We demonstrate that our method reaches a prediction precision of the order of 0.1 dB, which is significantlybetter than two classical prediction methods. Moreover, our solution reduces the simulation time by a factorof 500 compared to Monte-Carlo. Beyond DVB-SH application, the presented approach can be applied ina large panel of satellite mobile systems and is completely new for the satellite community. Copyright c©2010 John Wiley & Sons, Ltd.
Received . . .
KEY WORDS: DVB-SH, mutual information, prediction
1. INTRODUCTION
DVB-SH [1][2] (Digital Video Broadcasting Satellite Handled) is a standard dedicated to hybridbroadcasting systems combining satellite and terrestrial parts. This system operates in S band at2 GHz and provides high quality video or audio services for light terminal with limited battery
capacities. We focus in this paper on the satellite component of this hybrid system, and on itsperformance evaluation.
The propagation channel LMS (Land Mobile Satellite) has been widely studied ([3], [4], [5], [6]).This channel is time varying which induces very dispersive values of received power, with severaldistance scales (fading effect at short scale, shadowing effect at medium scale). In order to mitigatethe effects of such propagation channel, DVB-SH provides a time slicing process that relies onconvolutional interleavers that can distribute the symbols of a single codeword (of the turbo code)over up to 30 seconds. This mechanism can be seen as a fade averaging and results in a significantimprovement in terms of error recovery.
A major difficulty associated to this mechanism resides in its performance evaluation onsufficiently long distances in order to be able to tune its parameters. Indeed, the use of time slicingleads to a non stationary distribution of the Signal to Noise Ratio (SNR) inside a codeword of theturbo code. Nevertheless, there is no theoretical expression for the performance of a turbo code forsuch a complex non stationary distribution, and therefore, the performance evaluations can only beaccomplished through simulations. Nevertheless, in order to gain access to statistical values like thevariations of the Packet Error Rate (PER) in time, Erroneous Second Ratio (ESR) and zapping time,simulations based on Monte-Carlo methods become time-prohibitive. Thus, a modeling step turnsout to be necessary.
In this context, the modeling task can be divided into two parts: modeling the channel andmodeling the performance of the DVB-SH physical layer, more precisely the coding/decodingprocess on interleaved channel samples. Concerning the LMS channel, models [5] and [3]respectively based on a Markov Chain with three states and a semi-Markov Chain with two stateshave been proved to be accurate. With regard to the coding/interleaving performance on this channel,the issue to be addressed is as follows: given a perfect Channel State Information (CSI), whichmetric allows to obtain the best prediction of performance? Several methods can be found to answerthis question, which differ on the measure retained, denoted as the Link Quality Metric (LQM).
The most intuitive approach consists in choosing the mean Signal to Noise Ratio (SNR) insidea codeword [7] [8] p.70. However, the larger the SNR dispersion inside a codeword is the largerthe prediction error will be. In particular, the PER prediction error of this kind of approach isdemonstrated in [9]. Reference [10] points out the necessity of using a convex function of theSNR to take this result into account. Among the propositions of convex functions, we can cite theQ function (gaussian complementary cumulative distribution function), the exponential function,or more complex functions [11]. More recently, a new LQM which consists in considering theMutual Information (MI) between the coded bits and the Log Likelihood Ratio (LLR) at the inputof the decoder, was studied for terrestrial MIMO transmissions [12], [13], [14], [10] [15]. The mainobjective of this paper is to explore the potentialities of this latter method for our specific context.
After having evaluated several LQM metrics and demonstrated the very good precision of themethod retained, we carried out an evaluation of ESR performances on representative traveledchannel distances as a function of the system margin conjointly with an evaluation of the statisticalzapping time, which represents a key and a new entry for future DVB-SH systems dimensioning.
Beyond DVB-SH application, the presented approach can be applied to a large panel ofsatellite mobile systems and is completely new for the satellite community, as demonstrated by

the long monte-carlo simulation driven for DVB-SH performance characterization in DVB-SSPstandardization group [8].
In the following section, we present the prediction issue by highlighting the LMS channel andthe time slicing mechanism for the DVB-SH system. Then, in Section 3, we present three differentLQMs for PER prediction. We comparatively evaluate the three selected prediction methods in termsof BER and PER in Section 4. Section 5 presents a validation of the PER and ESR prediction ofthe DVB-SH physical layer on a LMS channel. In Section 6, we present results in terms of ESRand statistical zapping time for a wide range of interleaver parameters considered in the standard.Finally, we present in Section 7 a comparison of complexity and execution time with the traditionalMonte-Carlo approach.
2. PERFORMANCE EVALUATION ISSUE IN DVB-SH SYSTEMS
2.1. LMS channel modeling
In DVB-SH systems, coverage is mostly ensured by satellite in rural and suburban areas. At S-band, the Land Mobile Satellite (LMS) propagation channel can generally be considered as nonfrequency selective. Several propagation channel models have been developed in the past. All thesemodels rely on a representation of the LMS channel by a first order Markov chain correspondingto the large scale (several meters) level changes affecting the transmitted signal. Some of theseMarkov chains take into account two states (Line Of Sight (LOS) and Shadow) [4], three states(LOS, Shadow, Heavy Shadow/Blockage) [5] or even recently a two states semi Markov model [3].In the following, the three-state model [5] is retained according to ITU-R recommendation [6] forperformance evaluations.
The model makes the assumption that the received signal is composed of the sum of twocomponents : the direct signal and the multipath component.The direct signal is assumed to be Log-Normally distributed with a mean (relative to LOS) and a standard deviation, while the multipathcomponent is considered as random and characterized by its average power (dB relative to LOS).The model is based on the assumption of the existence of three distance scales (very slow, slow andfast) in the received signal corresponding to different phenomena.
Statistical parameters of this model depend on the environment and the elevation angle. Based onmeasurements, reference [5] has defined matrices for four environments : Open, Intermediate treeshadowed, Heavy tree shadowed, Suburban and Urban and for elevation angles above 40◦.
2.2. Key issues in DVB-SH systems
DVB-SH systems aim at providing TV and audio broadcasting services for handheld terminals. Inthe context of a constrained satellite budget link, two main performance issues have to be handled:the first one is the availability and QoS of the system often characterized by means of the ESR5criterion and the second one is to ensure an acceptable zapping time for the end user. The use oflong traditional interleavers enhances the availability and QoS of the system but highly degradesthe zapping time. For this reason, DVB-SH introduces advanced interleaving solutions designed

to enhance statistical zapping times, allowing fast zapping times in good reception conditions andlonger zapping times when reception conditions are bad.
2.3. Description of DVB-SH interleavers
DVB-SH standardizes convolutional interleavers acting on Interleaver Unit (IU) made of126 bits. Each interleaver is characterized by five parameters given in [8]: (Nof late taps,Common multiplier, Nof slices, Slice distance, Non late increment). Three classes of interleavingparameters setting proposed in [8] are considered
• short uniform interleaver (5,48,1,0,0): spreading between 100 and 240 ms,• long uniform interleaver (40,0,12,4,2): spreading between on 6.4 s and 15.6 s,• long uniform late interleaver (10,24,9,5,12): spreading between 12.8 s and 31.2 s.
2.4. Propagation channel variation in a codeword
Depending on the physical layer parameters and the interleaver choice, a given codeword willbe spread from 100 ms to 31.2 s. Because of the LMS channel, several output IU bits of a samecodeword will be affected by different attenuations as illustrated in Figure 1. This Figure illustrateshow an input codeword is spread on the LMS channel. The realizations of this channel were obtainedwith the Perez Fontan Model for elevation of 40◦ in a suburban environment and for a mobile speedof 60 km/h.
Figure 1. Illustration of the interleaving/slice effect on the LMS channel
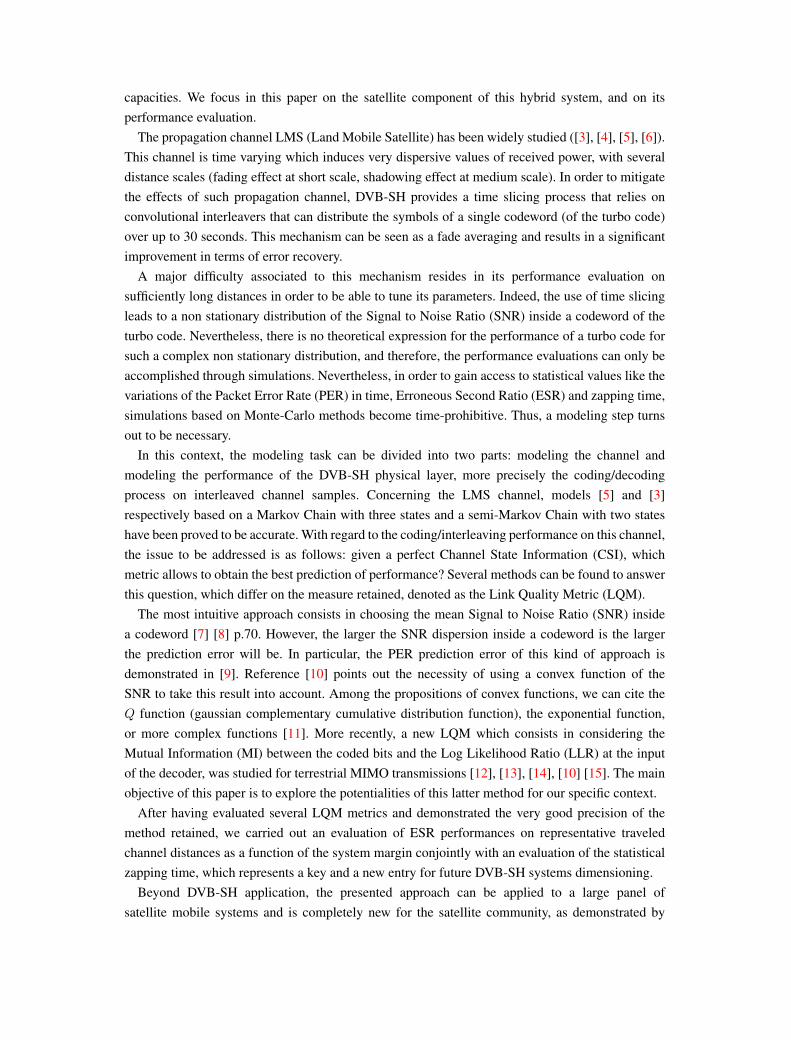
The consequence of the use of the previous interleavers with the LMS channel is that predictingperformance of DVB-SH system can equivalently be modeled by predicting the performance ofcodewords with time varying channel SNR according to Figure 2.
2.5. Performance criteria retained: PER, ESR5 and zapping time
2.5.1. PER estimation Time varying values inside a codeword are caused by varying attenuations.The main issue is to assess whether we are able to predict PER performance of such a codeword. Theanswer depends on the distribution of the fading. When this distribution is stationary according toa simple law (constant distribution, Rayleigh distribution..), it is possible to derive a theoretical
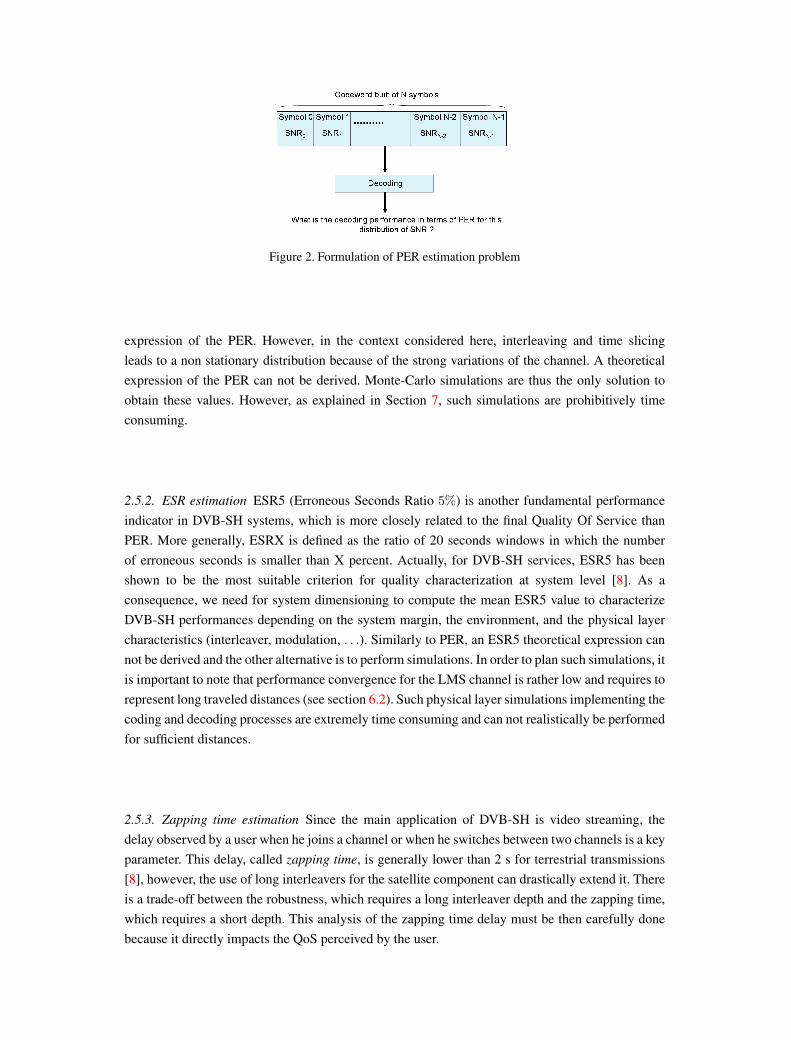
Figure 2. Formulation of PER estimation problem
expression of the PER. However, in the context considered here, interleaving and time slicingleads to a non stationary distribution because of the strong variations of the channel. A theoreticalexpression of the PER can not be derived. Monte-Carlo simulations are thus the only solution toobtain these values. However, as explained in Section 7, such simulations are prohibitively timeconsuming.
2.5.2. ESR estimation ESR5 (Erroneous Seconds Ratio 5%) is another fundamental performanceindicator in DVB-SH systems, which is more closely related to the final Quality Of Service thanPER. More generally, ESRX is defined as the ratio of 20 seconds windows in which the numberof erroneous seconds is smaller than X percent. Actually, for DVB-SH services, ESR5 has beenshown to be the most suitable criterion for quality characterization at system level [8]. As aconsequence, we need for system dimensioning to compute the mean ESR5 value to characterizeDVB-SH performances depending on the system margin, the environment, and the physical layercharacteristics (interleaver, modulation, . . .). Similarly to PER, an ESR5 theoretical expression cannot be derived and the other alternative is to perform simulations. In order to plan such simulations, itis important to note that performance convergence for the LMS channel is rather low and requires torepresent long traveled distances (see section 6.2). Such physical layer simulations implementing thecoding and decoding processes are extremely time consuming and can not realistically be performedfor sufficient distances.
2.5.3. Zapping time estimation Since the main application of DVB-SH is video streaming, thedelay observed by a user when he joins a channel or when he switches between two channels is a keyparameter. This delay, called zapping time, is generally lower than 2 s for terrestrial transmissions[8], however, the use of long interleavers for the satellite component can drastically extend it. Thereis a trade-off between the robustness, which requires a long interleaver depth and the zapping time,which requires a short depth. This analysis of the zapping time delay must be then carefully donebecause it directly impacts the QoS perceived by the user.

3. PREDICTION METHODS PRESENTATION
This Section aims to address the performance of the system when a codeword is affected by differentlevels of SNR. In this section, after proposing the general framework of the prediction methods, weexpose two standard methods for performance prediction. We then present the innovative mutualinformation method, previously confined to the context of terrestrial MIMO system, which appearsto be very relevant in our mobile satellite context. Finally, a theoretical comparison of the threemethods in the case of a QPSK modulation is provided.
3.1. Generic formulation of the prediction methods
All the bibliographic methods for PER performance analysis share a common approach based onthe notion of equivalent constant SNR denoted in the following as SNRgauss. They assume that theperformance of a codeword subjected to different levels of SNRi (for each symbol 0 ≤ i ≤ N − 1)is given by the performance for a Gaussian Channel with equivalent constant SNR denoted asSNRgauss. SNRgauss can be expressed in a generic way as a function of the successive levelsof SNR as follows
SNRgauss = F−1(1
N
N−1∑i=0
F (SNRi)) (1)
where F is the Link Quality metric (LQM) function. This approach has the advantage to be ableto compute, for example, the PER on a varying channel using the performance curves PER =
G(SNR) for a Gaussian channel.
3.2. Standard link quality metrics
We consider in the following that received complex symbol yk (k-th symbol in the consideredcodeword) is obtained at the output of the channel according to
yk = ρkxk + nk (2)
where xk is the complex emitted symbol (k-th symbol of the codeword), ρk is the real and positiveattenuation of the channel (we make the assumption that phase rotation is perfectly corrected atreception) that affects xk and nk is the additive Gaussian Noise with Power Spectral Density (PSD)N0
2 on the independent imaginary and real parts that affects xk.
3.2.1. Mean SNR as LQM The most intuitive method involves considering the mean SNR [7] overthe codeword. In the definition, Eq. (1), this method leads to consider F as the identity function andthe equivalent SNRgauss is given by
SNRgauss = (1
N
N−1∑k=0
SNRk) (3)
where SNRk is the SNR of the k-th symbol of the considered codeword.

3.2.2. BER as LQM A second method involves considering the BER on each coded symbol beforedecoding. For a given modulation and coding scheme, the BER is a function of the SNR throughthe use of the function Q. If we denote BER(SNR) as the general BER function of the channel,the equivalent SNRgauss is given by
SNRgauss = BER−1
(1
N
N−1∑k=0
BER(SNRk)
)(4)
where SNRk is the SNR of the k-th symbol of the codeword.
3.3. Mutual Information approach
The mutual information is used to predict physical layer performance in some wireless terrestrialnetworks [15]. These scenarii are very different from those in the satellite mobile DVB-SH contextwhere the codewords are distributed over a large time period on a highly varying channel. Ourproposal in this paper is to evaluate and adapt this method to the LMS context.
If we consider the mutual information between emitted and received symbols, the equivalentSNRgauss of the codeword is given by:
SNRgauss = I−1(1
N
N−1∑k=0
I(SNRk)) (5)
where I is the mutual information between emitted symbol X and received symbol Y computedaccording to the general formula
I(X,Y ) = H(Y )−H(Y/X) (6)
where H(U) is the entropy of random variable U defined by:
H(U) = −∫f(u) log2(f(u))du (7)
where f(u) is the probability density of the random continuous variable U. The derivation methodof the mutual information is detailed in the appendix for QPSK modulation.
3.4. Theoretical comparison between the three methods for QPSK
Here we propose to theoretically derive the previous expressions in case of QPSK modulation. AsSNR indicator, we choose Ec
b
N0the ratio between the energy per coded bit and the noise PSD. We
assume that simulations provide us with performance curve PER = G(Ec
b
N0) for a AWGN channel,
for QPSK modulation and a code of rate R.
3.4.1. Expression of the theoretical Ecb
N0
⌋Gauss
mean SNR method:In this method, function F is explicit since it is the identity function and the PER of the considered
codeword is given by
PERmean = G
(EcbN0
]meanGauss
)(8)
withEcbN0
]meanGauss
= F−1mean
(1
NFmean
(N−1∑k=0
(ρk)2 EbN0
]))(9)
and Fmean(x) is the identity function, i. e. Fmean(x) = x.BER channel method:In case of QPSK, BER is given by Q
(√2Ec
b
N0
)with Q(x) = 1√
2π
∫∞xe−
t2
2 dt. Therefore, the
PERBER of the codeword is given by
PERBER = G
(EcbN0
]BERGauss
)(10)
whereEcbN0
]BERGauss
= F−1BER
(1
NFBER
(N−1∑k=0
(ρk)2 EbN0
]))(11)
andFBER(x) = Q(
√2x). (12)
Mutual Information method:A derivation of the theoretical expression of the Mutual Information I(E
cb
N0) between emitted and
received symbols in case of a QPSK modulation is found in the appendix. The PERMI of thecodeword is therefore given by
PERMI = G
(EcbN0
]MI
Gauss
)(13)
whereEcbN0
]MI
Gauss
= F−1MI
(1
NFMI
(N−1∑k=0
(ρk)2 EbN0
]))(14)
and FMI(x) is the mutual information curve, i. e. FMI(x) = I(x).Figure 3 illustrates functions Fmean(Eb
N0), FBER(Eb
N0) and FMI(
Eb
N0) for Eb
N0in a logarithmic scale.
Figure 3. Functions F for mean SNR method, BER method and Mutual Information method

3.4.2. Convexity consideration of the inverse functions A function f is convex if it fulfills, for anyset of P positive real αk and real xk for 0≤ k ≤ P − 1 such that
∑P−1k=0 αk = 1,
f
(N−1∑k=0
αkxk
)≤N−1∑k=0
αkf(xk) (15)
Functions F−1MI and F−1BER are shown to be convex. This convexity property is graphically illustratedby Figure 4, even if not demonstrated through a theoretical approach. Using convexity inequality
Figure 4. Illustration of the convexity of F−1MI and F−1BER
(15) for function F−1MI in equation (14) leads to
EcbN0
]MI
Gauss
≤ 1
N
(N−1∑k=0
(ρk)2 EbN0
]). (16)
But 1N
(∑N−1k=0 (ρk)
2 Ecb
N0
])is exactly Ec
b
N0
]meanGauss
. For the same reasons, we get
EcbN0
]BERGauss
≤ 1
N
(N−1∑k=0
(ρk)2 EbN0
]). (17)
A theoretical expression of F−1MI is not available, but graphical considerations seem to show thatconvexity is uniformly stronger for F−1BER than for F−1MI . This remark leads to the following set ofinequalities for the three methods:
EcbN0
]BERGauss
≤ EcbN0
]MI
Gaus
≤ EcbN0
]meanGauss
. (18)
4. PERFORMANCE COMPARISON OF THE DIFFERENT PREDICTION METHODS
We propose now to evaluate prediction performance for the three previous methods on arbitraryfading sequences of one codeword length in the case of a QPSK 1/3 turbocoded DVB-SHtransmission [2].

The mean BER and mean PER are simulated for the different channels considered through Monte-Carlo simulations performed by repeating the attenuation sequence on the successive codewords andcalculating the mean BER or the mean PER. These reference BER or PER performances are thencompared to prediction results obtained relying on the three previous methods and using as referencethe BER and PER turbocode Gaussian performance curves.
4.1. Fading sequences applied
For a varying channel, the receiver observes a varying SNR (respectively Eb
N0and Es
N0) that can be
decomposed into an attenuation (i.e. a fading) term, and a fixed contribution that we call in thefollowing nominal SNR (respectively, nominal Eb
N0and nominal Es
N0) and which we denote SNRn
(respectively, Eb
N0
]n
and Es
N0
]n
).
When the attenuation is equal to zero, Eb
N0is equal to Eb
N0
]n
. The value of Eb
N0
]n
is representedon the abscissa axis on the performance curves whereas the successive attenuation values areconsidered fixed for a given simulation channel. The three different sequences of attenuation arepresented in Figure 5.
Figure 5. The 3 channel realizations for the coding rate 1/3
4.2. Evaluation of the BER prediction methods
Figure 6 represents the BER predictions using the different methods in terms of Eb
N0
]n
. It showshow mutual information method provides an excellent BER estimation for both coding rates for thedifferent channels. In addition, the relative position of the BER curves is coherent with inequality(18).
4.3. Evaluation of the PER prediction methods
Figure 7 represents the PER predictions using the different methods in terms of Eb
N0
]n
for the threechannels.
It shows how mutual information method provides an excellent estimation of the PER estimationsfor the three channels for the coding rate 1/3. A slight shift of about 0.1 dB appears in the PERestimation with the mutual information method. Complementary simulations (not presented here)tend to show that this offset only depends on the modulation and coding scheme, and could then be

Figure 6. BER predictions for coding rate 1/3
corrected independently of the propagation channel. We have compensated the residual offset in thefollowing simulations using an offset equal to 0.09 dB for QPSK 1/3.
Figure 7. PER predictions for coding rate 1/3
4.4. Conclusion on the comparison of prediction methods
Based on these results it appears clearly for QPSK turbo-coded transmission following the DVB-SH standard that the prediction method proposed in this paper based on the mutual informationparameter provides predictions better than 0.1 dB for both the mean BER and mean PERperformance calculation. It also appears that more traditional methods like those based on meanSNR or the mean channel BER are less accurate and represent respectively lower and upperperformance bounds. All these results were confirmed by complementary simulations carried outfor 1/2 coding rate (not presented here).

We propose then to focus in the following on the mutual information prediction method and to godeeper into its validation.
5. MUTUAL INFORMATION METHOD VALIDATION FOR A LMS CHANNEL
We propose in this section to complete the evaluation and validation of the mutual informationmethod for a more realistic DVB-SH transmission through the LMS channel.
5.1. Physical layer parameters and propagation channel
We consider the parameters in Table I (from [8]), corresponding to a QPSK modulation with a 1/3
rate turbo code. A realization of this LMS Intermediate Tree Shadowing (ITS) [5] channel will be
Waveform QPSK1o3 UChannel configuration LMS-ITS
Speed (km/h) 50Common multiplier 40
Nof late taps 0Nof slice 12
Slice distance 4Non late increment 2
Coding rate 1/3nominal C N 5
Table I. Value of physical parameters
used in the following simulations.
5.2. PER simulations
We propose here to compare the estimated PER using Monte-Carlo method, and the predicted PERobtained using the mutual information prediction method.
The estimated PER corresponds to an averaging of 10 Monte-Carlo simulations performed onthe same channel. This channel corresponds to 16283 codewords. The codewords are subjected to afixed attenuation sequence whereas each of the ten simulations is done with a different random seednoise. The PERest(i) of the i− th codeword is estimated using
PERest(i) =1
10
10∑j=1
Xji (19)
where Xji is the random variable that equals to 1 if the j − th realization of the i− th codeword is
wrong (the packet is not perfectly decoded) and equals to 0 if the decoded packet is correct.The predicted PER PERpred(i) on the i− th codeword relies on mutual information and is
computed for the same channel.Figure 8 presents the evolution of the estimated PER, the predicted PER and the error between
them, considering a sliding window of 3 successive PER values. Zooming in an interesting sectionof the plot (Figure 8), we see on these two figures that the mutual information method leads to avery efficient prediction for packet error rate evolution. Figure .

Figure 8. Estimated and predicted averaged PER
Figure 9. Zoom for estimated and predicted averaged PER
5.3. ESR5 simulations
To perform an ESR5 estimation, an additional step is necessary using PER predictions. Traditionally,ESR5 was computed from traces provided by physical layer simulations. We describe hereafter howto compute ESR5 directly from PER predictions.
We denote by PERi,j the predicted PER of the j − th codeword of the i− th second. Makingthe assumption that the PERs of two consecutive seconds are independent and that L is the numberof codewords per second, we compute first the probability that the i− th second is errorless , Pi, by
Pi =
L∏j=1
(1− PERi,j). (20)
Based on this error-free second probability, we calculate the number of error-free seconds on thek − th window with duration 20 s (time between k and k + 19). This value is represented by therandom variable Yk given by
Yk =
k+19∑m=k
Am (21)

where Am is a Bernoulli random variable that equals 1 if the m− th second is error-free (withprobability Pm defined in (20)) and Am equals 0 if the the m− th second is false (with probability1− Pm). Making the assumption that the Am variables are independent, we can consider that theirsum is distributed according to the convolution of Bernoulli distributions. If we denote Fk as thecumulative distribution function of the random variable Yk, we obtain the theoretical expression ofESRX as
(ESRX)k = P (Yk > 20X) = 1− Fk(20X). (22)
Figure 10 presents the evolution of ESR5 computed from estimated PER and predicted PER. We
Figure 10. ESR prediction and estimation
can see on this figure that for this channel, ESR5 computed from estimated PER and predicted PERare identical.
5.4. Conclusion
This completes the validation results obtained by analyzing the evolution of PER and ESR5 fora realistic LMS propagation channel. The results show an excellent convergence between Monte-Carlo simulations and the mutual information prediction method. The proposed method has beenvalidated for the purpose exposed in the beginning of the paper, that is, a large scale performanceevaluation in terms of QoS for DVB-SH transmissions using long interleavers for realistic LMSpropagation channels.
6. EXPLOITATION OF THE METHOD FOR DVB-SH AIR INTERFACE TRADE-OFF
We propose now to exploit the above validated prediction method to compute ESR and zapping timeperformance in terms of the system margin for three kinds of interleavers.
6.1. Description of the parameters
We use the following parameters for the simulation. We propose to use the short uniform, longuniform and long uniform late interleavers whose parameters are given in Section 2.3.

Channel Physical layerMode Suburban Mode OFDM/2K
Elevation 40◦ Modulation QPSKSpeed 50 km/h Band 5MHz
Coding rate 1/3
Table II. Parameters of the scenario
6.2. Simulation results for ESR performance
6.2.1. ESR5 computation according to system margin For each value of CN
]n
, we simulated a 100km channel run and performed the PER prediction. Using this prediction of PER, we computedthe ESR5 for the three considered interleavers, as illustrated in Figure 11. These curves are of
(a) short uniform interleaver (b) long uniform interleaver (c) long uniform late interleaver
Figure 11. ESRX according to the CN ]n for the three interleavers
paramount interest for DVB-SH system dimensioning to establish the necessary system margin fora given service availability. The simulation durations with traditional Monte-Carlo simulations (seeSection 7) made them very difficult to obtain in the past and explain the lack of similar extensiveresults to the knowledge of the authors.
Besides, the curves give interesting elements to position the different interleavers in terms ofperformance. In Figure 11a, we see how the short interleaver is able to overcome very fast fades(strong slope of the curve between 3 and 5 dB) but does not overcome the fast and slow fades (weakslope of the curves between 5 and 10 dB) because it is too short. Only a strong value of C
N
]n
enablesto get a satisfying value of ESR5. In Figure 11b, we see how the long uniform interleaver mitigatesall fades (uniform slope between 3 and 5 dB). Finally, Figure 11c shows that the behavior of uniformlate interleaver is a mix of the two previous behaviors.
Finally we can see that for an ESR5 target of 90% (coherent with the expected system availabilityin ITS environments), the required C
N
]n
in LOS conditions is 13 dB for the short uniform interleaver,3.8 dB for the long uniform interleaver, and 6.1 dB for the long uniform late interleaver showinga very good efficiency in the case of long interleavers at 50 km/h. These results show typicaloutputs that can be obtained with the proposed prediction approach, and represent new and importantentries for system performance evaluation and system design. Clearly, these results, which concerna particular case of environment and speed, can be obtained for complementary scenarios.

6.2.2. ESR5 convergence results Figure 12 presents convergence results obtained for the threedifferent interleavers with C
N
]n= 8.6 dB. We can underline that these convergence figures confirm
(a) short uniform interleaver (b) long uniform interleaver (c) long uniform late interleaver
Figure 12. Convergence of ESRX for the three interleavers
that a minimum distance simulation of about 15 km is required in order to ensure the convergenceof the ESR as it was assumed in Section 2.5.2.
6.3. Results of simulation for zapping time performance
As explained in Section 2.5.3, zapping time is one of the key issues of the DVB-SH standard [2].Practically, when a user joins a channel at a given time, if a long interleaver is being used, he willreceive the final part of codewords whose first parts were sent before his arrival time. The receiverthen tries to decode codewords with only this final part. For each new data burst, it receives anincreasing part of the codewords and, after a time equal to the interleaving depth, the consideredcodewords are complete. To have a short zapping time, the user must be able to decode incompletecodewords. It follows that the global performance in terms of zapping time depends directly onthe decoding probabilities of incomplete codewords. The correspondence between the zapping timeand the decoding of incomplete codewords is illustrated in Figure 13. In this figure, we assumethat a user joins the channel t seconds before the end of the transmission of a codeword (sentwith a uniform late interleaver). We consider that the zapping time is equal to the minimum t
allowing a successful decoding. To evaluate the decoding probabilities of incomplete codewords,
Figure 13. Zapping time and decoding of incomplete codeword
we considered a transmission on a suburban channel with long interleavers described in section6.1 with C
N ]n = 4 dB, and for each codeword, we estimate the decoding probability. Note that thescenario using short interleaver was not studied here because zapping time is not an issue in thiscase.

This estimation can also be done with the mutual information method. Indeed, the non-receivedparts of a codeword brings a mutual information equal to zero, the decoding is possible if thereceived parts of the codeword bring sufficient mutual information for the whole codeword. Anillustration is shown in Table III. The first two rows extracted from Table 7.8 of [8] give the requiredCN ]n for received data to be decoded successfully when a part of the data is erased. The third rowindicates the corresponding required mutual information per received bit and the fourth row givesthe corresponding required mutual information per transmitted bit (i. e. the global received mutualinformation averaged over all bits -received or erased- of a codeword). It is noteworthy that thisglobal mutual information is quasi-constant whatever the proportion of erased data. The results are
IU received 288 264 240 216 192 168 144req. C/N -0.9 0.0 0.6 1.4 1.8 3.0 4.4req. MI
per rec. bit 0.4 0.46 0.50 0.57 0.60 0.69 0.8req. MI
per transm. bit 0.39 0.41 0.41 0.42 0.39 0.40 0.39Table III. Required mutual information per codeword bit
presented in Figures 14a and 14b for, respectively, long uniform and long uniform late interleavers.In these figures, the interleaver depth is split into time ranges corresponding to 1 second. Foreach second, we give the proportion of codewords that can be decoded with a given probability.Figure 14a shows that the long uniform interleaver can only decode the first codewords after 6
(a) long uniform interleaver (b) long uniform late interleaver
Figure 14. Decoding probability for incomplete codeword with long interleavers on suburban channel witha nominal CN ]n = 4dB
seconds. Ideally, on a noiseless channel, since the code rate is 1/3, a codeword could be decodedas soon 1/3 of its coded bits are received. Since the long uniform interleaver uniformly spreads thecodeword over 12 seconds, a codeword can be decoded after 4 seconds. The result obtained hereis not surprising because the codewords transmitted under low noise conditions are decoded whenhalf of the codeword is received, i. e. after 6 seconds. The very good property of the long uniformlate interleaver is that it provides full reliability after 10 seconds. The uniform distribution of thecodeword over time is indeed optimal in terms of correction capability. The behavior of the long

uniform late interleaver (Figure 14b) is very different. Since half of the codeword is sent on thesame second, some codewords can be decoded at the first second. After 5 seconds, more than 80%
of the codewords are decoded. The counterpart of this good zapping time is that, in the studiedcase (CN ]n = 4 dB), this interleaver does not reach the full reliability (100% of decoded codeword).However, if we consider the trade-off between reliability and zapping time in the global case, thelong uniform late interleaver appears to be the best solution between the two long interleavers.
7. COMPLEXITY ANALYSIS
7.1. Complexities of parameter estimation
7.1.1. PER estimation An alternative solution to obtain a PER estimation of the DVB-SH codingand interleaving performance for a given channel is to carry out simulations of the physicallayer. Given a realization of the channel of duration d, let us assume that we want to get anestimation of the PER of each codeword of the DVB-SH system for this channel. Since PERis a statistical value, Monte-Carlo methods are suitable for obtaining this value. This methodconsists in generating a large number of realizations of the same codeword and after decodingthese realizations, PER estimation is obtained by computing the ratio of wrong decoded codewords.Generation of the codeword is continued until the estimation of the PER converges. Classically, thenumber of generations of the same codeword is chosen to be greater than 100/PERtheoretical wherePERtheoretical is the theoretical value of PER.
As an example, for the particular case of a QPSK with 1/3 coding rate and OFDM modulation in8k mode with 1/4 guard interval, the duration of a SH frame is about 150 ms and the duration of acodeword is about 3.3 ms. As a consequence, for a channel with duration d seconds, the number ofcodewords is about d/3.3 ∗ 103. Assuming that we aim at estimating PER performance on a channelwith duration 60 s, this leads to about 18000 codewords. With the Monte-Carlo method for everycodeword, it leads to a minimal number of 1800000 codewords to be simulated.
7.1.2. ESR estimation ESR5 can be computed from the PER estimation as explained in Section 5.3.The necessary length of simulated channel to ensure convergence of the ESR5 value depends on theparameters of margin, environment, and physical layer as illustrated in Section 6.2.2, but it appearsthat 15 km is a good order of magnitude. As a consequence, with the same numerical values as in theprevious example, if we denote by v the mobile speed (in km/h), the number of codewords duringthis time equals 15/v ∗ 3600 ∗ 103/3.3. Numerical examples for v = 50km/h and v = 3km/h leadto a number of transmitted codewords of 330 000 and 5 450 000. With the Monte-Carlo method,it leads to a minimum number of 3.3 ∗ 107 and 5.45 ∗ 108 codewords to be simulated. It is obviousthat these simulations require prohibitive computation time. In addition, all these operations onlyprovide a single value of ESR5. But, the output we are interested in is the value of ESR5 in terms ofthe system margin. As a consequence this process has to be reiterated a large number of times forevery value of system margin of interest.
7.1.3. Zapping time estimation As explained in Section 2.5.3, zapping time is evaluated through thedecoding probabilities of incomplete codewords. The number of codewords that must be evaluated

is thus similar than that for PER estimation, but for each codeword, several decoding attempts aredone. For example, in the results presented previously, a decoding is attempted each time a newpart of the codeword is received, i. e. each second. Like for PER, performing Monte-Carlo-basedestimations is not realistic.
7.2. Comparison of simulation times
Two physical layer DVB-SH receiver simulators were developed. The input of the two simulatorsis a sequence of fading values generated with a propagation channel simulator developed at CNES(and adopted by the DVB-SSP group for the definition of the DVB-SH standard [2]).
The first simulator, called “full simulator”, implements deinterleaving, demodulation and turbodecoding operations. The second one, called “simplified simulator”, implements de-interleavingoperations and replace the demodulation/turbo decoding operations by the decoding predictionmethod based on mutual information. As shown in Sections 3 and 5, simulation results providedby the two simulators in terms of PER are extremely similar.
On the contrary, if we consider the execution times, the results are extremely different. Forexample, for the scenario corresponding to Table I with a short interleaver, the full simulator needs239 minutes to simulate a distance of 3000 meters on a Penthium D 2.8 GHz with 1 GB of RAM.For the same scenario, the simplified simulator only needs 16 seconds on the same computer. Thegain factor is about 800. Even if the full simulator can be optimized, we can considered that a factorof about 500 is a good approximation of the gain. In light of this comparison, it is clear that theresults presented in Figures 11 or 14 could not be obtained without this gain. Note that, despitethe interest of these results, to the knowledge of the authors, this kind of results have not yet beenpublished or available in any public documents.
8. CONCLUSION
The purpose of this paper is to evaluate a new method for performance assessment of the DVB-SHstandard. We point out that a theoretical evaluation of performance is not achievable because ofthe non stationary distributions of the SNR within a codeword. Moreover, Monte-Carlo simulationsproved to be time prohibitive, especially for ESR evaluation. The proposed prediction method relieson the computation of mutual information between emitted and received symbols. Reliability ofthis method is first evaluated on arbitrary channels with non stationary distribution of noise varianceand compared to two other methods, namely the mean SNR method and the mean BER method.These simulations show that the mutual information method exhibits accuracy better than 0.1 dB.Then, a more complete validation is proposed by simulating the DVB-SH physical layer for theLMS channel. Results confirmed the very good precision of this prediction method. Finally, wepresent possible outputs of a simulator based on this method that was shown to be a key tool forfuture mobile satellite system dimensioning by providing ESR5 and zapping time precise statisticestimations for representative mobile route lengths.

ACKNOWLEDGMENTS
The authors would like to thank Emmanuel Lochin, Guillaume Jourjon and the reviewers for theircareful reading and their helpful comments.
9. APPENDIX
9.1. Derivation of the mutual information for QPSK modulation
We first consider a BPSK modulation. Given a realization of the emitted BPSK symbol randombinary variable x and a realization of the noise n, assuming perfect knowledge of the channelattenuation ρ, the continuous random variable y of output symbol is given by
y = ρ√Ebx+ n. (23)
The values that the random variable x can take are −1 and 1 and the noise variable n has anindependent Gaussian distribution with variance N0
2 .For convenience, we consider y′ given by
y′ =ρ√Eb
N0y = ρ2
EbN0
x+ nρ√Eb
N0. (24)
Variable y′ has a bimodal Gaussian distribution whose continuous probability density is given by
f(y′) = f(y′/x = −1)P (x = −1) + f(y′/x = 1)P (x = 1) (25)
→ 1
2N(−ρ2 Eb
N0, ρ2
Eb2N0
) +1
2N(ρ2
EbN0
, ρ2Eb2N0
) (26)
where N(m,σ2) is a Gaussian distribution with mean m and variance σ2. In the following wedenote ρ2 Eb
N0as α and ρ2 Eb
2N0as β2.
Since y′ has the same information as y (they only differ by a multiplication by a constant),the mutual information between random variable x and y equals the mutual information betweenrandom variables x and y′ and it is given by
I(x, y′) = H(y′)−H(y′/x) (27)
where H(U) is the entropy of the continuous random variable U defined by
H(U) = −∫ ∞−∞
f(u) log(f(u)) (28)
where f(u) is the probability density of U .

In (27), y′/x is a Gaussian random variable with variance β2. It is well known that the entropy ofsuch a random variable only depends on the variance and is given by:
H(y′/x) =1
2log2
(2eπβ2
). (29)
In addition, using (26) and (28), we have for H(y′)
H(y′) = −∫ ∞−∞
G(u) log(g(u))du (30)
where G(u) is defined by
G(u) =1
2√
2πβ2
(exp
(− (u− α)
2β2
)+ exp
(− (u+ α)
2β2
)). (31)
Expression (30) can not be expressed into a closer form and requires using numerical integration tocalculate it.
As a consequence, I(x, y′) only depends on α = ρ2 Eb
N0and β2 = ρ2 Eb
2N0and it is therefore only
a function of ρ2 Eb
N0. Figure 15 plots this function in terms of ρ2 Eb
N0for a BPSK. In case of QPSK
modulation, because of the independence of the imaginary and real parts, the function is the same.
Figure 15. Mutual information for QPSK/BPSK modulation
REFERENCES
1. ETSI. System Specifications for Satellite services to Handheld devices (SH) below 3 GHz, TS 102 585.2. ETSI. Framing Structure, channel coding and modulation for Satellite Services to Handheld devices (SH) below 3
GHz, EN 302 583.3. Burzigotti P, Prieto-Cerdeira R, Bolea-Alamanac A, Perez-Fontan F, Sanchez-Lago I. DVB-SH analysis using a
multi-state land mobile satellite channel model. Advanced Satellite Mobile Systems, 2008. ASMS 2008. 4th, 2008;149–155.
4. Lutz E, Cygan D, Dippold M, Dolainsky F, Papke W. The land mobile satellite communication channel-recording, statistics, and channel model. IEEE Transactions on Vehicular Technology 1991; 40(2):375–386, doi:10.1109/25.289418.
5. Perez-Fontan F, Vazquez-Castro MA, Buonomo S, Poiares-Baptista JP, Arbesser-Rastburg B. S-band LMSpropagation channel behaviour for different environments, degrees of shadowing and elevation angles. IEEETransactions on Broadcasting 1998; 44(1):40–76.

6. ITU. Rec. ITU-R P.681-6, Propagation data required for the design of Earth-space land mobile telecommunicationsystems 2003.
7. Simoens S, Bartolome D. Optimum performance of link adaptation in HIPERLAN/2 networks. IEEE VehicularTechnology Conference, 2001. VTC 2001 Spring, vol. 2, 2001; 1129 –1133 vol.2.
8. ETSI. Digital Video Broadcasting (DVB) DVB-SH Implementation Guidelines, TS 102 584.9. Lampe M, Rohling H, Zirwas W. Misunderstandings about link adaptation for frequency selective fading channels.
IEEE International Symposium on Personal, Indoor and Mobile Radio Communications, PIMRC, vol. 2, 2002; 710– 714.
10. Kim J, Ashikhmin A, de Lind van Wijngaarden A, Soljanin E, Gopalakrishbab N. Reverse Link Hybrid ARQ: LinkError Prediction Methodology Based on Convex Metric”, 3 GPP2 TSG-C WG3. Technical Report April 2003.
11. Strinati E, Simoens S, Boutros J. New error prediction techniques for turbo-coded OFDM systems and impacton adaptive modulation and coding. IEEE International Symposium on Personal, Indoor and Mobile RadioCommunications, PIMRC, vol. 2, 2005; 1116 –1119.
12. Brueninghaus K, Astely D, Salzer T, Visuri S, Alexiou A, Karger S, Seraji GA. Link performance models forsystem level simulations of broadband radio access systems. IEEE International Symposium on Personal, Indoorand Mobile Radio Communications, PIMRC, vol. 4, 2005; 2306 –2311.
13. Jensen TL, Kant S, Wehinger J, Fleury BH. Mutual information metrics for fast link adaptation in IEEE 802.11n.IEEE International Conference on Communications, 2008. ICC ’08, 2008; 4910 –4915.
14. Sayana K, Zhuang J, Stewart K. Short term link performance modeling for ML receivers with mutual informationper bit metrics. Global Telecommunications Conference, 2008. IEEE GLOBECOM 2008., 2008; 1 –6.
15. IEEE 80216 Broadband Wireless Access Working Group. IEEE 802.16m Evaluation Methodology Document(EMD), IEEE 802.16m-08/004r2 July 2008.


![Radio Propagation Channel Measurements for Multi-Antenna … · 2018-09-06 · fi nalized DVB - Satellite to Handheld (DVB-SH) standard [7, 8], and the prospective DVB – Next Generation](https://img.pdfslide.net/doc/110x75/5fb09d783960e72b3c7b69b0/radio-propagation-channel-measurements-for-multi-antenna-2018-09-06-fi-nalized.jpg)


![[5] DVB-SH and DVB-T2, Why These Two New Standards (DiBcom, Sep. 2009)](https://img.pdfslide.net/doc/110x75/55cf9b96550346d033a6a39d/5-dvb-sh-and-dvb-t2-why-these-two-new-standards-dibcom-sep-2009.jpg)